MASTER'S THESIS - DiVA portalltu.diva-portal.org/smash/get/diva2:1017566/FULLTEXT02.pdfMASTER'S...
59
MASTER'S THESIS Autonomous Takeoff and Landing for Quadcopters Robert Lindberg 2015 Master of Science in Engineering Technology Space Engineering Luleå University of Technology Department of Computer Science, Electrical and Space Engineering
Transcript of MASTER'S THESIS - DiVA portalltu.diva-portal.org/smash/get/diva2:1017566/FULLTEXT02.pdfMASTER'S...
MASTER'S THESIS
Autonomous Takeoff and Landing forQuadcopters
Robert Lindberg2015
Master of Science in Engineering TechnologySpace Engineering
Luleå University of TechnologyDepartment of Computer Science, Electrical and Space Engineering
Abstract
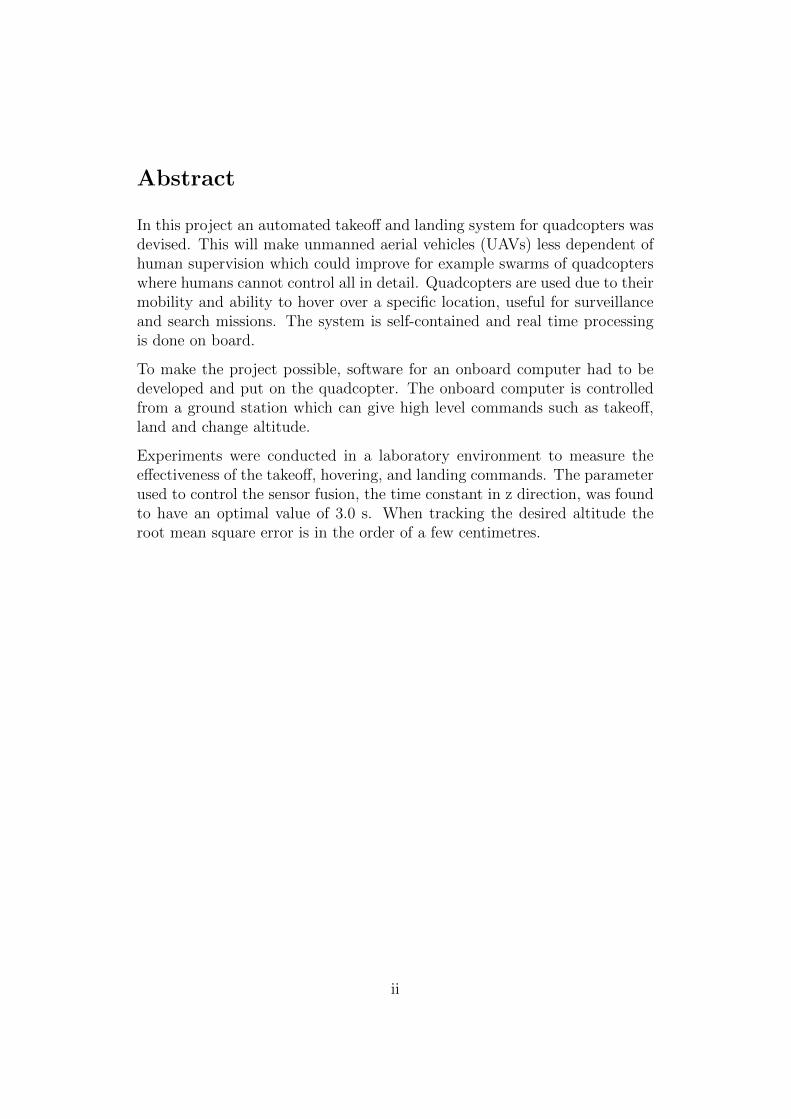
In this project an automated takeoff and landing system for quadcopters wasdevised. This will make unmanned aerial vehicles (UAVs) less dependent ofhuman supervision which could improve for example swarms of quadcopterswhere humans cannot control all in detail. Quadcopters are used due to theirmobility and ability to hover over a specific location, useful for surveillanceand search missions. The system is self-contained and real time processingis done on board.
To make the project possible, software for an onboard computer had to bedeveloped and put on the quadcopter. The onboard computer is controlledfrom a ground station which can give high level commands such as takeoff,land and change altitude.
Experiments were conducted in a laboratory environment to measure theeffectiveness of the takeoff, hovering, and landing commands. The parameterused to control the sensor fusion, the time constant in z direction, was foundto have an optimal value of 3.0 s. When tracking the desired altitude theroot mean square error is in the order of a few centimetres.
ii
Acknowledgements
I would like to thank my supervisor Dr. Jan Carlo Barca at Swarm RoboticsLaboratory and Monash University for giving me the opportunity to doingan interesting research project while also experiencing a new country. Dr.Hoam Chung for the expertise and help you have given me throughout theproject. Senthooran Ilankaikone for the all the time you spent helping mewhen I needed an extra hand and for all the ideas to make this projectpossible, even though we did not get a dancing pole in the lab.
I would also like to thank Stiftelsen Bjorn Wahlstroms fond and Angpan-neforeningens Forskningsstiftelse for the financial support in forms of schol-arships during my time in Australia.
Also to my parents who have supported me during my studies as well as andhelping to move and carry my stuff around. Everything from clearing outmy apartment in Kiruna at -40 ◦C to carrying sofas in Melbourne at +30◦C.
Finally to my friends, both new and old, that made the trip to Australia amemory for life.
iii
Contents
Abstract ii
Acknowledgements iii
1 Introduction 11.1 Background . . . . . . . . . . . . . . . . . . . . . . . . . . . . 11.2 Research Questions . . . . . . . . . . . . . . . . . . . . . . . . 11.3 Thesis Structure . . . . . . . . . . . . . . . . . . . . . . . . . . 2
2 Methodology 32.1 Construct a Conceptual Framework . . . . . . . . . . . . . . . 32.2 Develop a System Architecture . . . . . . . . . . . . . . . . . 32.3 Analyze and Design the System . . . . . . . . . . . . . . . . . 42.4 Build the (Prototype) System . . . . . . . . . . . . . . . . . . 52.5 Experiment, observe, and evaluate the system . . . . . . . . . 5
3 Literature Review 6
4 Initial System Overview 84.1 Connections . . . . . . . . . . . . . . . . . . . . . . . . . . . . 84.2 Mission Planner . . . . . . . . . . . . . . . . . . . . . . . . . . 104.3 MAVLink . . . . . . . . . . . . . . . . . . . . . . . . . . . . . 104.4 PuTTY . . . . . . . . . . . . . . . . . . . . . . . . . . . . . . 10
5 Design and Development 115.1 Overview and Connections . . . . . . . . . . . . . . . . . . . . 115.2 Sonar . . . . . . . . . . . . . . . . . . . . . . . . . . . . . . . . 13
5.2.1 Mounting . . . . . . . . . . . . . . . . . . . . . . . . . 135.2.2 Calibration . . . . . . . . . . . . . . . . . . . . . . . . 13
5.3 ArduPilot Mega . . . . . . . . . . . . . . . . . . . . . . . . . . 145.3.1 Setup . . . . . . . . . . . . . . . . . . . . . . . . . . . 165.3.2 APM Software . . . . . . . . . . . . . . . . . . . . . . 17
5.3.2.1 Sonar . . . . . . . . . . . . . . . . . . . . . . 175.3.2.2 Sensor fusion . . . . . . . . . . . . . . . . . . 185.3.2.3 Custom mode . . . . . . . . . . . . . . . . . . 19
5.4 BeagleBone Black . . . . . . . . . . . . . . . . . . . . . . . . . 215.4.1 Mounting . . . . . . . . . . . . . . . . . . . . . . . . . 215.4.2 Setup . . . . . . . . . . . . . . . . . . . . . . . . . . . 215.4.3 BBB Software . . . . . . . . . . . . . . . . . . . . . . . 22
iv
6 Experiment Design and Results 276.1 Optimal Time Constant for Frame Setup . . . . . . . . . . . . 286.2 Optimal Time Constant for Free Flying . . . . . . . . . . . . . 346.3 Target Altitude for Free Flying . . . . . . . . . . . . . . . . . 38
7 Conclusions 42
8 Future Research 43
Appendix 48
v
List of Figures
1 The Xaricraft x650v8 quadcopter. . . . . . . . . . . . . . . . 82 The initial system as it was before any modifications. . . . . 93 Overview of the software and protocols. . . . . . . . . . . . . 94 Overview of the autonomous system. . . . . . . . . . . . . . . 125 Mounting of the sonar on the back of the quadcopter. . . . . 136 Plotted calibration results for sonar. . . . . . . . . . . . . . . 147 Custom mode flow chart. . . . . . . . . . . . . . . . . . . . . 208 Mounting of the BBB on top of the quadcopter. . . . . . . . 229 pc flow chart. . . . . . . . . . . . . . . . . . . . . . . . . . . . 2410 apm flow chart. . . . . . . . . . . . . . . . . . . . . . . . . . 2411 input flow chart. . . . . . . . . . . . . . . . . . . . . . . . . . 2512 cmd flow chart. . . . . . . . . . . . . . . . . . . . . . . . . . 2613 The frame used for the experiments. . . . . . . . . . . . . . . 2914 RMS distance average between sonar altitude and target al-
titude according to which the optimal value for TC Z shouldbe about 3 s. . . . . . . . . . . . . . . . . . . . . . . . . . . . 32
15 RMS distance average between filtered altitude and target al-titude according to which the optimal value should be some-where between 3 s and 7 s. . . . . . . . . . . . . . . . . . . . 32
16 Average number of oscillations per minute. Higher value ofTC Z results in less oscillations. . . . . . . . . . . . . . . . . 33
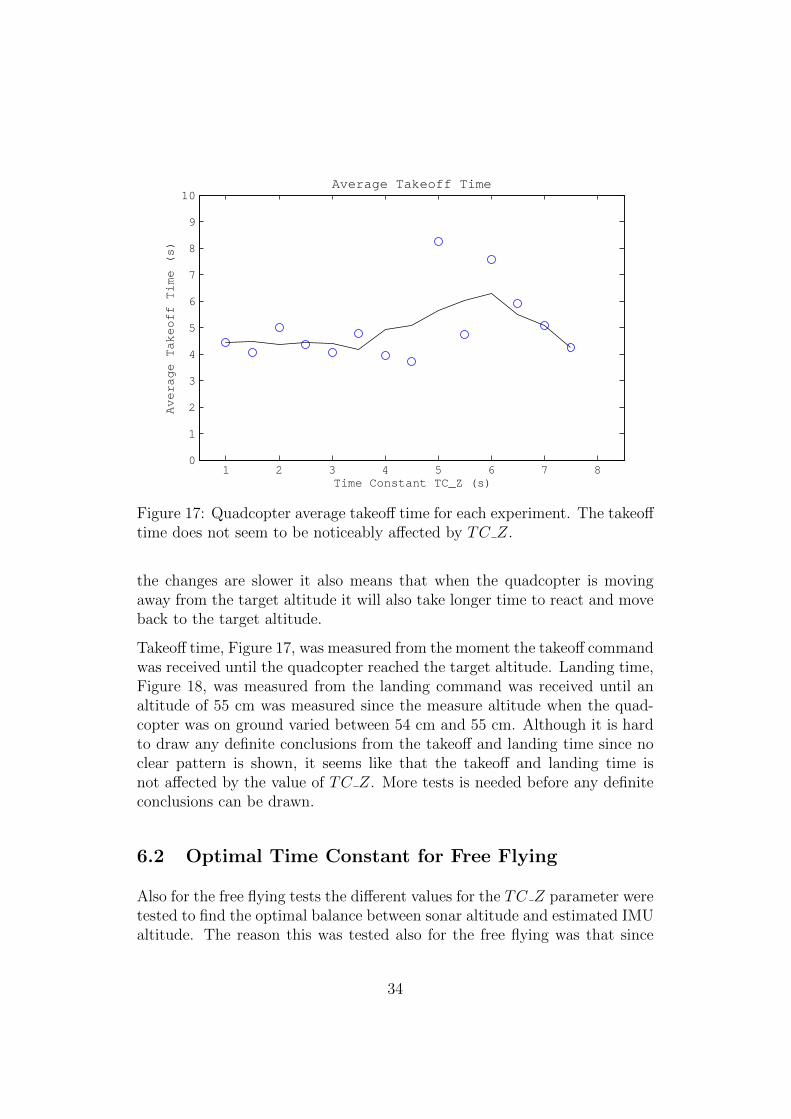
17 Quadcopter average takeoff time for each experiment. Thetakeoff time does not seem to be noticeably affected by TC Z. 34
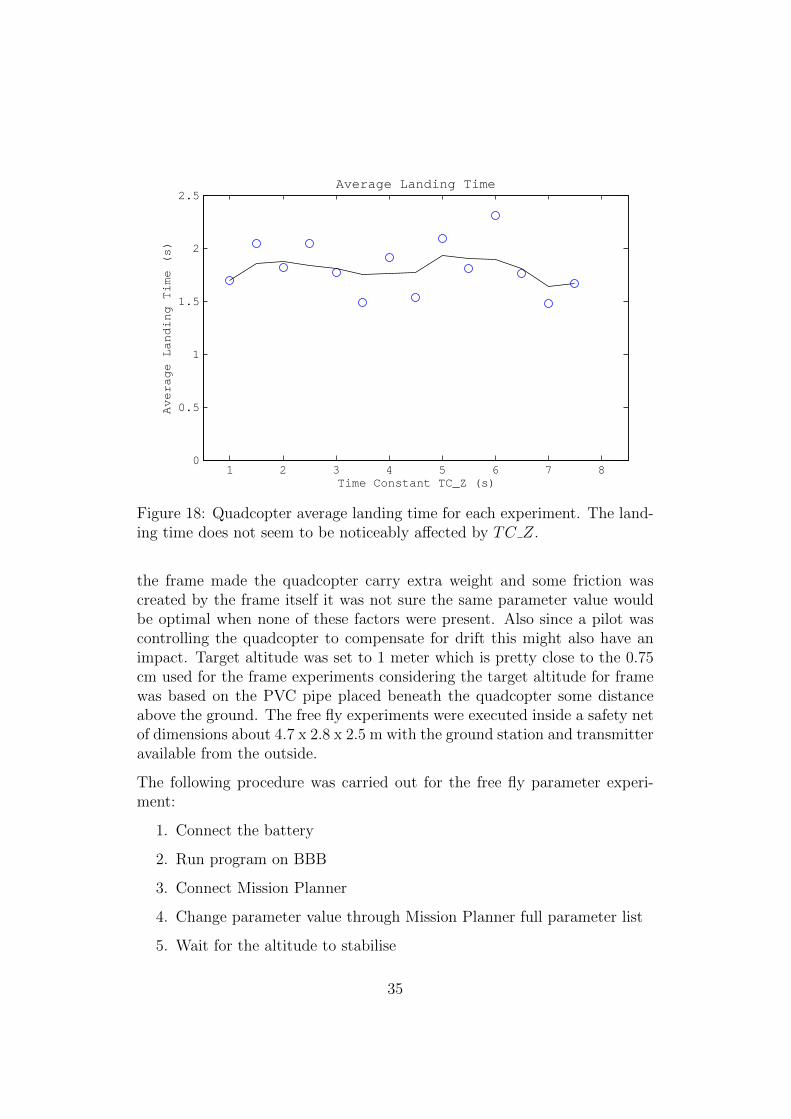
18 Quadcopter average landing time for each experiment. Thelanding time does not seem to be noticeably affected by TC Z. 35
19 The setup for the free fly experiments. . . . . . . . . . . . . . 3620 RMS distance average between sonar altitude and target al-
titude for different target altitudes. Higher target altitudeincreases the average distance between the quadcopter andtarget altitude during the flight. . . . . . . . . . . . . . . . . 39
21 Average takeoff time for different target altitudes. Increasedtarget altitude results in decreased takeoff time. . . . . . . . 40
22 Average landing time for different target altitudes. Increasedtarget altitude results in increased landing time. . . . . . . . 41
23 Average number of oscillations per minute for different targetaltitudes. . . . . . . . . . . . . . . . . . . . . . . . . . . . . . 41
vi

List of Tables
1 Calibration results for sonar. Bold values are above the mini-mum distance and are the ones used for the calibration. . . . 15
2 Results from sonar measurements. Bold values are the lowestvalue for each column. . . . . . . . . . . . . . . . . . . . . . . 31
3 Results from filter measurements. Bold values are the lowestvalue for each column. . . . . . . . . . . . . . . . . . . . . . . 31
4 Results from sonar measurements for different TC Z values.Bold values are the lowest value for each column. . . . . . . . 37
5 Results from filter measurements for different TC Z values.Bold values are the lowest value for each column. . . . . . . . 37
6 Results from sonar measurements for different target altitudes.Bold values are the lowest value for each column. . . . . . . . 38
7 Results from filter measurements for different target altitudes.Bold values are the lowest value for each column. . . . . . . . 39
vii
List of Equations
1 Sonar distance-voltage dependency . . . . . . . . . . . . . . . 142 Complementary filter . . . . . . . . . . . . . . . . . . . . . . . 183 Position error . . . . . . . . . . . . . . . . . . . . . . . . . . . 19
viii
List of Acronyms
AN AnalogueAPM Ardupilot Mega 2.5BBB BeagleBone BlackESC Electronic Speed ControlGND GroundIR InfraredIMU Inertial Measurement UnitMP Mission PlannerMAVLink Micro Air Vehicle Communication ProtocolRMS Root Mean SquareSLAM Simultaneous Localization And Mapping
ix
1 Introduction
This research is about devising an autonomous takeoff and landing systemfor quadcopters. An autonomous system would reduce the need of humansupervision and would therefore increase the possible fields of use. This is afirst step to develop a fully autonomous system that could be used for e.g.surveillance or search and rescue missions. No human supervision means thesystem can be active on a constant basis and also reducing the risk of humanmistakes. This is also essential for swarm robotics where it is not possible tocontrol every unit in detail.
The system is required to work in an indoor environment and therefore noGPS or barometer can be used. The reason a barometer cannot be usedis because it measures air pressure and the turbulence from the quadcoptermay give unreliable results. The system is also a first step to implement acustom mode that can be modified further in the future to implement morefunctions. The final goal for the quadcopters are to be able to land andtakeoff to a specific height in unknown terrain, so no help such as markersor maps have been used.
1.1 Background
For the firmware used on the autopilot there are already autonomous takeoffand landing functions available when using waypoint navigation. The prob-lem with this is that it requires an active GPS connection to work and sincethat is not an option for this project new functions had to be devised.
1.2 Research Questions
Three research questions were devised to guide the course of the project.
• How to set and reach a target altitude with the quadcopter?
• How to make the quadcopter hold the altitude until further notice?
• How to make the quadcopter perform a safe landing?
1
1.3 Thesis Structure
Chapter 1 is this short introduction to the problem and which research ques-tions that is expected to be answered during the course of the research.
Chapter 2 is about the research methodology used to make sure the researchresults are valid.
Chapter 3 offers a literature review where previous work are presented. Alsowhy this research is important and what problems there are.
Chapter 4 provides a short explanation of the functions of the system be-fore the modifications. It also explains the software used to help in thisproject.
Chapter 5 describes the design process and final design of all the modifiedparts of the system. This also includes both the development and how ev-erything was calibrated and set up to work properly.
Chapter 6 presents the experiments made to verify the research questions.
2
2 Methodology
A research methodology was adapted to increase the chance of success byfollowing a guideline on how to proceed with the research. A System De-velopment Research Methodology [1] was selected as it has been proven towork in earlier research made by people in the Swarm Robotics Laboratorywhich therefore also have experience working with it. It provides five stepsto follow during the research.
1. Construct a Conceptual Framework
2. Develop a System Architecture
3. Analyze and Design the System
4. Build the (Prototype) System
5. Observe and Evaluate the System
2.1 Construct a Conceptual Framework
The first step of the methodology is to explore the field and identify relevantresearch questions [1]. This should be done by reviewing relevant literature,but since much in the field is done by hobbyists it is also important to studyand learn from the work they present. After the significance of the questionshas been justified they should be in focus for the rest of the research.
For this case the important difference compared to previous work done withautonomous takeoff, hovering and landing is that previous both GPS andbarometer had been used. For this research only a sonar sensor was used inaddition to the inertial measurement unit (IMU) to fulfil the requirements.The research was also aimed to modify an existing firmware to make it aplatform for further research, something that might have been hard to dowithout a modified firmware.
2.2 Develop a System Architecture
In the second step the system requirements and constraints should be spec-ified. The requirements were described as follows for the system on thequadcopter:
• Takeoff
3

– A command to make the quadcopter reach a specified height andkeep it there until further notice.
– The height should be possible to verify.
• Landing
– A command to make the quadcopter land safely.
– Verify landing
• The system should work in real time
• No markers or motion capture system should be used
• Only onboard sensors should be used
• All processing should be real time and on board
• The system should be able to be calibrated
2.3 Analyze and Design the System
The third step is about analysing and designing the system in relation toscientific and technical knowledge in the studied domain. Various alternativesshould be evaluated which for this research meant different alternatives foraltitude measurements were considered. A sonar and an IR sensor were testedand compared.
Much of the hardware of the design was already decided since the quad-copter were already built such that the autopilot should be an ArduPilotMega 2.5 (APM) and that the on board computer should be a BeagleBoneBlack (BBB), although the communication between the APM and BBB wasnot finalised. That is also the case for the communication between the quad-copter and the ground station as well as which ground station that shouldbe used.
In terms of software development this step was used to decide which functionsthat were needed and what parts that should be on the BBB and on the APMrespectively.
4
2.4 Build the (Prototype) System
As the fourth step a prototype system should be built to test the system in areal-world setting. This makes it possible to demonstrate the functions andcan provide advantages and disadvantages of the system [1].
The building phase included several steps to make sure each component wasworking before putting everything together. First the BBB and APM inte-gration was made using a USB cable to make it as simple as possible. AnotherUSB cable was connected to the BBB from a PC for direct communicationfrom the ground station. When both communication lines were confirmed towork, the development of functions for both BBB and APM could proceedsimultaneously.
When the components were working as intended, both USB cables were re-moved to finalise the design. For the connection between the BBB and theAPM it was replaced by a serial connection that utilised the UART portson both components. The communication link between the BBB and theground station was replaced with a wireless connection to ensure the quad-copter could fly without constraints.
2.5 Experiment, observe, and evaluate the system
The final step was to test and evaluate the system in relation to the require-ments specified earlier. This was made by building a frame that could testthe ability to hold the altitude and measure the oscillations without riskingthe quadcopter to crash before it had been tested enough. The second partof the experiment phase was a free fly test where an operator would controlthe quadcopter in terms of roll and pitch while the altitude was fully moni-tored and controlled by the autonomous system. Both experiments resultedin data that were analysed to find the optimal parameter values. Some freefly tests for optical observations were also made.
5

3 Literature Review
There are two main types of UAV control today, piloted and autonomous. Pi-loted UAVs are controlled by a human operator in real time while autonomousUAVs generate low-level flight commands in response to high level goals [2].No matter what type is used there are cases where a partly autonomoussystem is necessary to ensure the safety of the UAV and the surroundings.Three examples are loss of communication link, hardware/software errors,and GPS failure [2]. In any of these three cases a pilot could lose control ofthe UAV and an autonomous system could save the UAV.
The next step is to include the UAVs in a swarm to faster be able to covera larger area. Today the most advanced UAVS is often controlled by oneor more ground operators, but as they become cheaper and more capable itis not possible to have multiple operators for each UAV. By improving theautonomous capabilities the ground operators can focus on controlling theswarm instead of each individual unit [3]
Similar research has already been done in the field, e.g. where the IMU forthe APM 2.5 is tested together with a sonar [4]. The APM integrate IMU wascompared against an external YEI 3 Space Sensor with the conclusion thatthe integrated one was superior. According to the conclusions the root meansquare (RMS) error for the integrated IMU was less than 1◦which should beenough for the course of this research.
Since something need to be able to measure the distance to the ground sev-eral options were investigated. Two of the most popular systems due to beingrelatively cheap is sonar and infrared (IR) sensor. The advantages and dis-advantages for each of the sensors are discussed by Prattico et al [5]. SinceIR sensors are using a narrow beam that is reflected and then observed itmeans it can have great resolution when observing the surroundings. Sonarson the other hand have a beam width that is varying with distance and istherefore difficult to know exactly where the object is relative to the sonar[5]. A disadvantage for the IR sensor is that certain surfaces such as mirrorsand glass are impossible to intercept [5].
Vision based landing using different types of cameras has also been used inseveral cases [6], [7], [8], [9], [10]. Although vision based systems opens up formore possibilities of more accurate surface mapping, they also comes withsome disadvantages. Many are dependant on landmarks or markers and thesystems are often heavy, expensive and some also requires high computationalcost. All this should be avoided in this project which means it should be a
6

self contained, real time system. This means another onboard computer hasto be used in addition to the APM, something that has not be overly exploredin past research.
7
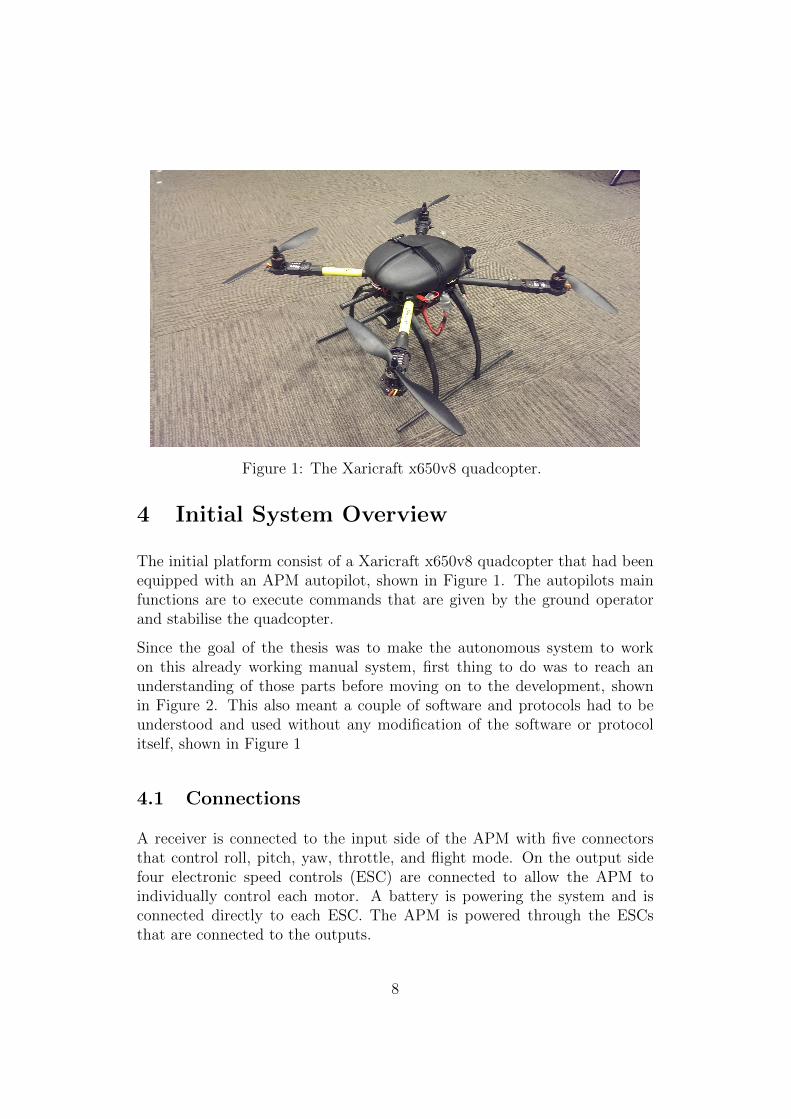
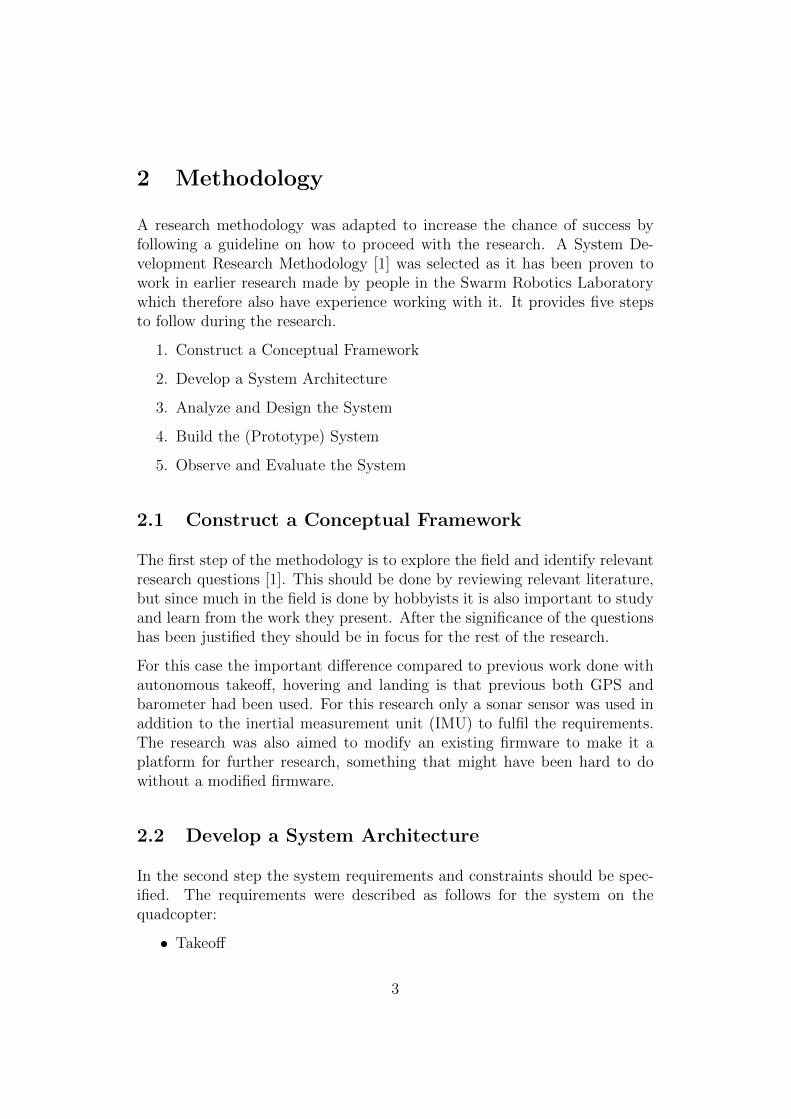
Figure 1: The Xaricraft x650v8 quadcopter.
4 Initial System Overview
The initial platform consist of a Xaricraft x650v8 quadcopter that had beenequipped with an APM autopilot, shown in Figure 1. The autopilots mainfunctions are to execute commands that are given by the ground operatorand stabilise the quadcopter.
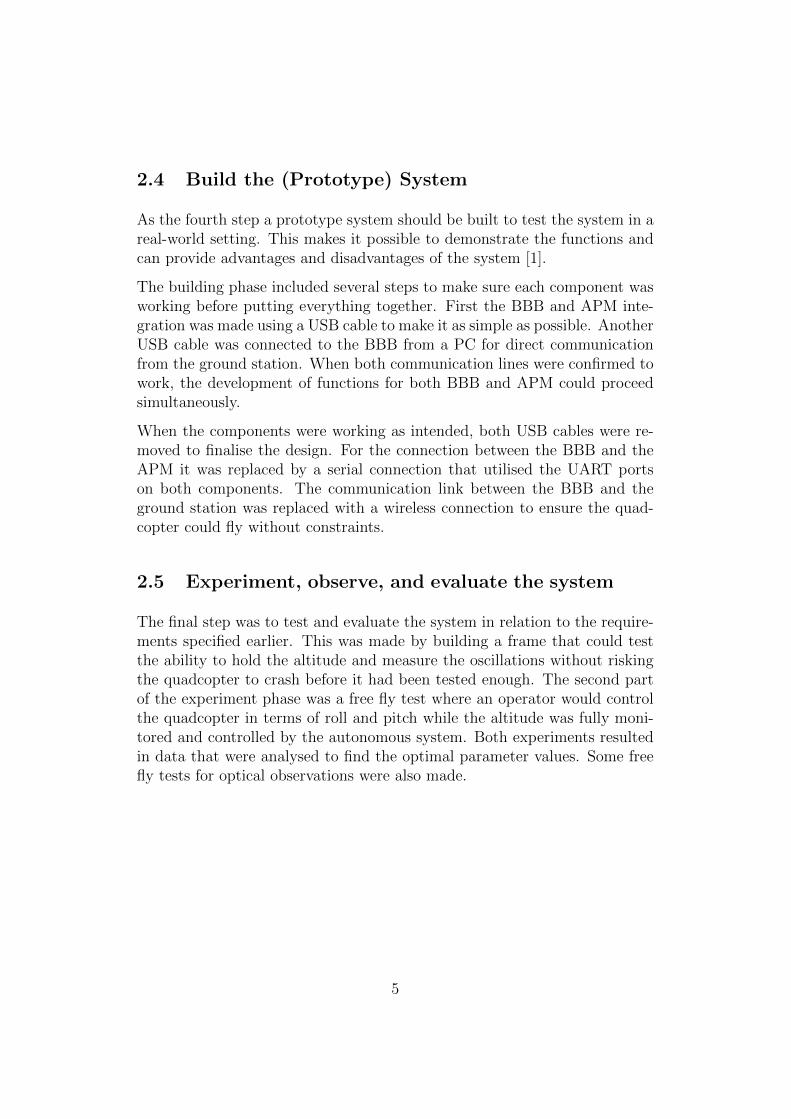
Since the goal of the thesis was to make the autonomous system to workon this already working manual system, first thing to do was to reach anunderstanding of those parts before moving on to the development, shownin Figure 2. This also meant a couple of software and protocols had to beunderstood and used without any modification of the software or protocolitself, shown in Figure 1
4.1 Connections
A receiver is connected to the input side of the APM with five connectorsthat control roll, pitch, yaw, throttle, and flight mode. On the output sidefour electronic speed controls (ESC) are connected to allow the APM toindividually control each motor. A battery is powering the system and isconnected directly to each ESC. The APM is powered through the ESCsthat are connected to the outputs.
8
Figure 2: The initial system as it was before any modifications.
Figure 3: Overview of the software and protocols.
9
4.2 Mission Planner
Mission Planner (MP) version 1.3.9 is a Windows based ground station soft-ware for APM which was used for the main part of the research [11]. It wasused to calibrate the APM, giving ARM/DISARM commands, and downloadlog files from it. It is also collecting live data from the APM which could beused during debug. The live data was also stored in a log file that could beanalysed after flight.
4.3 MAVLink
Micro Air Vehicle Communication Protocol (MAVLink) is the protocol usedby the APM for communication with the ground station [12]. It is a header-only library developed for use of micro air vehicles. Messages are sent over aserial link after they have been packed as C-structures.
The message structure of the MAVLink message can be summarised as doneby Balasubramanian [13].
1. Message header
2. Message length
3. Sequence number
4. System ID - The system sending the message
5. Component ID - The component sending the message
6. Message ID - Type of message
7. Payload - The message information or command
8. Checksum
Important to note is that system ID can be used to identify individual systemswhich means the system is scalable and can work within a swarm.
4.4 PuTTY
PuTTY is a client program used to connect and communicate with the BBBfrom a separate PC [14]. After connection has been established via SSH, itis possible to use the Ubuntu terminal on the BBB.
10

5 Design and Development
When familiarised with the existing system and software tools the develop-ment and modifications of the system could start. This section describeswhat have been done to make a working system, both in terms of setup anddevelopment. It starts with a short overview before going into details foreach component.
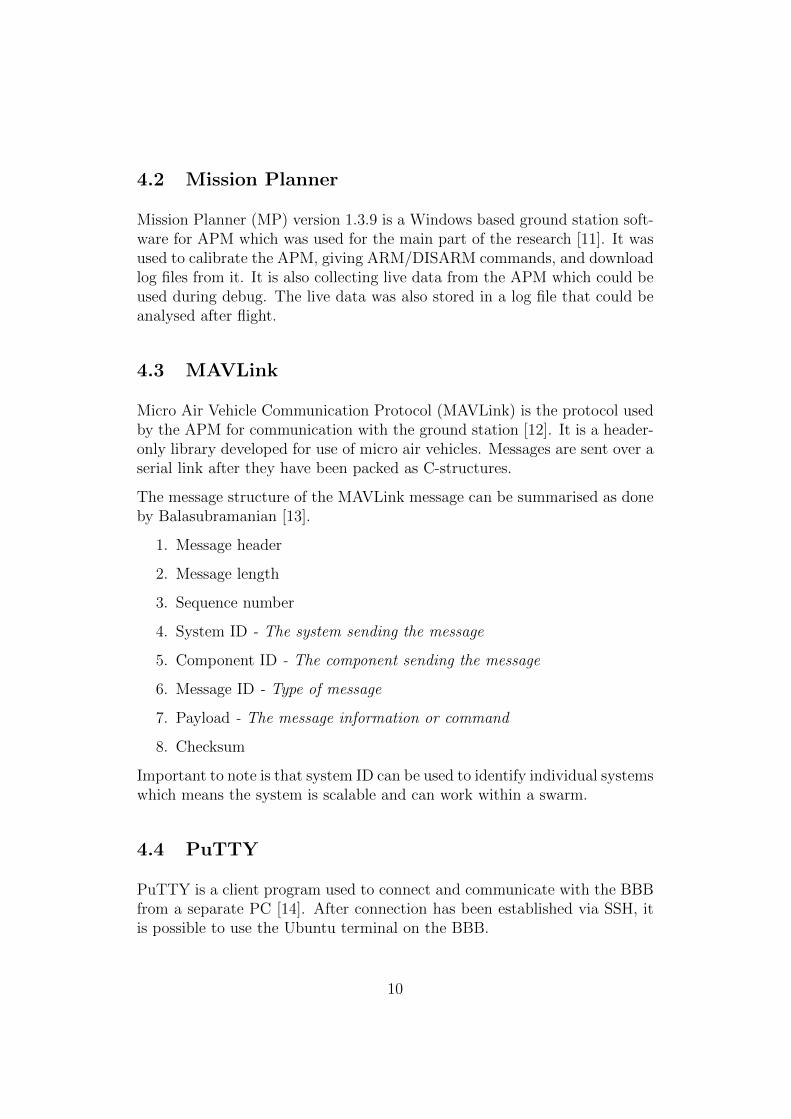
5.1 Overview and Connections
Refer to Figure 4 for how everything is connected in the modified system.Note that everything in Figure 2 are still connected but not presented againin Figure 4. The core of the autonomous system is the BBB that supple-ments and instructs the APM via a serial communication. This is done byconnecting the pins of UART 4 on the BBB to the telemetry port of theAPM. Since BBB is using 3.3 V while APM is using 5 V a level converterhad to be used in between. The baud rate is initially set to 57600 as this isthe default setting for the APM when using the telemetry port.
A sonar for altitude measurements was connected to the A0 port of the APMwhich consists of a 5 V output, ground, and signal in. This was connectedto +5, GND (ground), and AN (analogue) respectively on the sonar whichmeans the sonar output is 5 V analogue.
Two separate wireless connections was used to communicate with the groundstation. All automatic MAVLink communication was done via a XBee net-work. The Xbee router was connected to UART 1 on the BBB and the XBeecommunicator was connected to the USB port of the PC running the groundstation. The baud rate was set to 57600 here as well.
In addition to the wireless XBee connection an ad hoc wireless connectionwas also used between the ground station PC and the BBB. This was usedfor sending manual input commands to the BBB while flying e.g. to takeoff, change altitude and land. It also made it easier to access and uploadnew firmware to the BBB since it could be used instead of the USB cableotherwise needed. A USB dongle was connected to a USB hub which wasconnected to the USB port of the BBB. Another USB dongle was connectedto the PC.
11
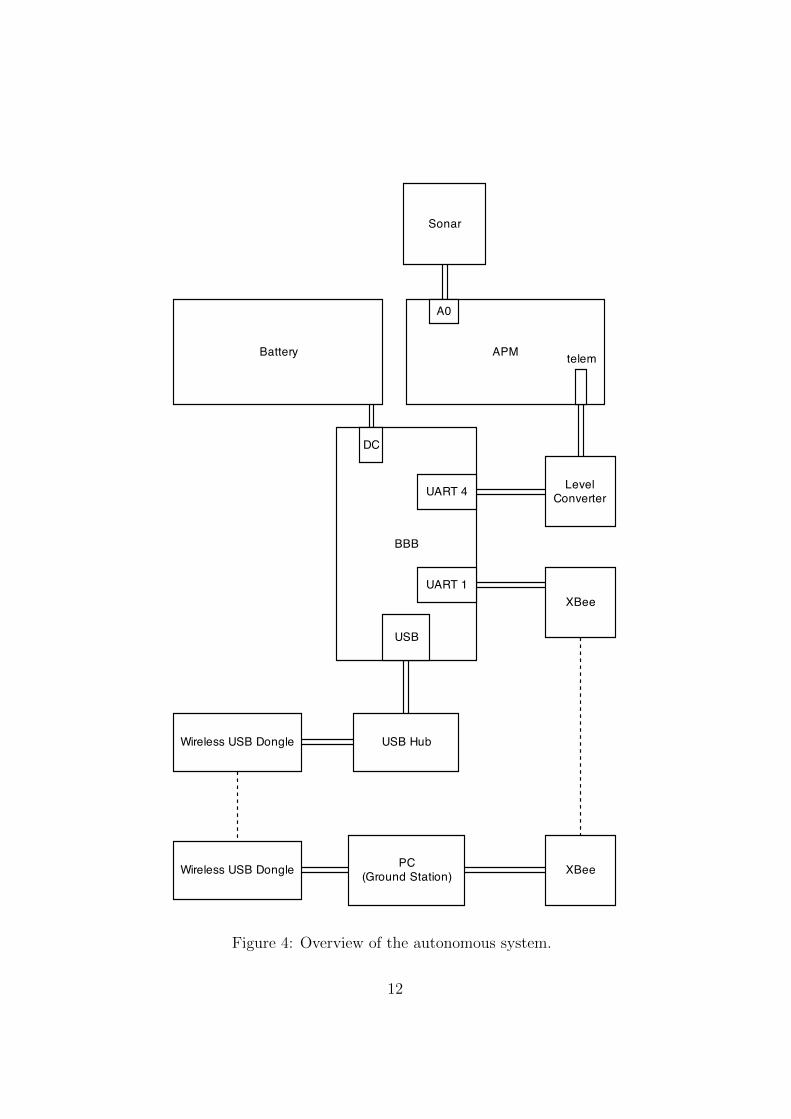
Figure 4: Overview of the autonomous system.
12
Figure 5: Mounting of the sonar on the back of the quadcopter.
5.2 Sonar
The sonar used is a LV-MaxSonar-EZ1 High Performance Sonar Range Finder.It provides distance with 2.54 cm resolution from 15 cm to 645 cm. A 5 Vinput was used together with an analogue output which yielded about 9.8mV per resolution step [15].
5.2.1 Mounting
The sonar was mounted on the quad, 19 cm above the ground, 16.5 cmbehind the centre of the quadcopter and aligned with the centre in the pitchaxis direction, see Figure 5. The sonar was attached on a plate using foursmall double-coated adhesive soft pads that except for holding it in place alsoworked as vibration dampeners to further reduce noise induced by vibrations.The reason for the positioning was to put it as far away as possible from themotors and the rest of the electronics to avoid interference. This includesboth sounds from the motors as well as electrical interference.
5.2.2 Calibration
The sonar was calibrated by using a laser distance measurer to measure theexact distance while recording the sonar voltage level for the same distance.
13

0 0.5 1 1.5 2 2.5 30
0.5
1
1.5
2
2.5
3
3.5
4Sonar Calibration
Distance (m)
Voltage (V)
Figure 6: Plotted calibration results for sonar.
The results are presented in Table 1. Main focus for the calibration wasdistances less than 2 meters since the quadcopter was constrained to flylower than that during the tests due to the distance from the floor to theceiling. Some of the measurements were made for distances shorter thanthe minimum distance of 15 cm and it can be seen how the voltage levelis changing unexpectedly for those values in Table 1. Therefore only valuesabove 15 cm was used for the calibration.
After the values had been plotted in Figure 6, a linear dependency could beassumed and an equation was derived by using a first order polynomial curvefit resulting in
f(x) = 1.27x+ 0.05 (1)
where f(x) is the distance in meters and x is the voltage level of the sonaroutput.
5.3 ArduPilot Mega
The auto pilot is responsible for all low level commands when flying and forthis project the ArduPilot Mega 2.5 was used. The base firmware installed
14
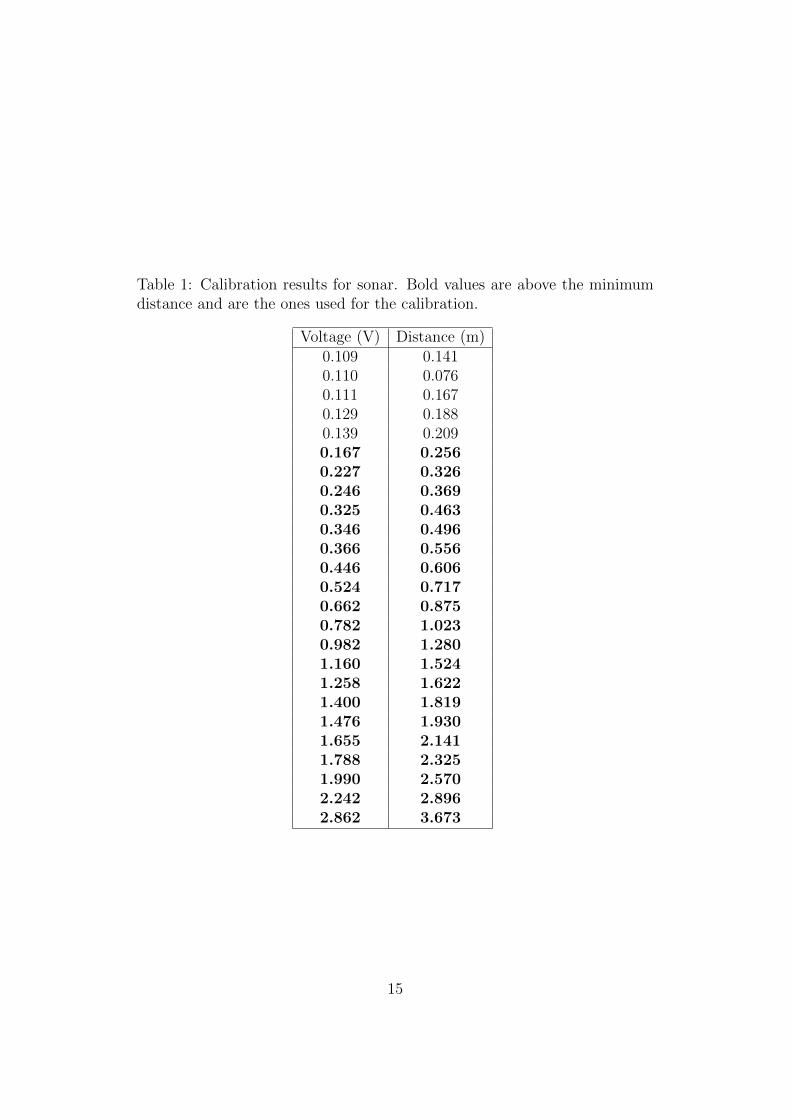
Table 1: Calibration results for sonar. Bold values are above the minimumdistance and are the ones used for the calibration.
Voltage (V) Distance (m)0.109 0.1410.110 0.0760.111 0.1670.129 0.1880.139 0.2090.167 0.2560.227 0.3260.246 0.3690.325 0.4630.346 0.4960.366 0.5560.446 0.6060.524 0.7170.662 0.8750.782 1.0230.982 1.2801.160 1.5241.258 1.6221.400 1.8191.476 1.9301.655 2.1411.788 2.3251.990 2.5702.242 2.8962.862 3.673
15
is the ArduCopter 3.15 and all modifications during the project were madeand based on this firmware.
5.3.1 Setup
Before the APM could be used the following had to be calibrated [16].
• Frame type
• Compass Calibration
• Accelerometer Calibration
• Radio Calibration
• Flight Modes
All of the calibrations were made using the Mission Planner software withthe APM mounted on the quadcopter. Even though not all parts will be usedby the system, everything were calibrated. This is done to avoid problemswhen arming the quadcopter since Mission Planner has a pre-arm check thatprevents arming if anything is not calibrated.
Frame Type
The frame type should be set to reflect the arm configuration of the quad-copter, which in this case is the “X”-type.
Compass Calibration
The compass was not used in this project but was still calibrated for rea-sons mentioned above and also in case it will be needed in the future. Thecalibration was done by using “Live calibration” which means the correctorientation will automatically be found by slowly rotating the APM so eachside points down towards the ground for a few seconds each.
Accelerometer Calibration
The calibration of the accelerometers was done by putting the quadcopteron all six sides in order (standing, left, right, front, back and top) and let itregister each direction. This will compensate for if the APM is not mountedperfectly aligned with the rest of quadcopter.
16
Radio Calibration
Radio calibration is to let the APM learn maximum, minimum and centreposition of the sticks on the transmitter. This is done by moving all thesticks to their maximum positions and before finishing leaving them in thecentre position.
Flight Modes
It is possible to change the flight mode with sticks and buttons on the trans-mitter and this is set up in the flight modes menu. This was used as a safetyprecaution to make it possible to switch to a standard flight mode in casethe modified one did not perform as expected.
5.3.2 APM Software
ArduCopter 3.15 is a fully functional firmware that can be used when flyingthe quadcopter by manual control or by GPS based waypoint navigation.However, to implement an autonomous takeoff and landing function somemodifications had to be made for different parts of the firmware.
5.3.2.1 Sonar
By default in the firmware version used, the sonar data was sampled but onlyused on board without being sent to the ground station. MAVLink has onemessage type intended for this type of data named rangefinder that could beused, but since this message lack any type of time stamp for the data it hadto be modified slightly to include that. The time is taken from the internalclock of the APM. The new message that includes time stamp was generatedby using the MAVLink Generator [17]. The rangefinder message was thenadded to the data stream already transmitting the attitude data from theAPM.
One of the main changes to the firmware was that previously most of thealtitude data had been based on the internal barometer. Since all of the flyingduring this project was to be carried out indoors the barometer will not giveaccurate values due to turbulence created by the quadcopter itself when flyingin contained areas. Therefore everything relying on barometer measurementshad to be changed to rely on sonar measurements instead.
17
To make this possible, the function that handles the sampling located in theRangefinder.cpp library had to be rewritten. Previously the sampling washandled by a scheduler that updated the rangefinder with a preset frequency.The sampled value was then only available in the main code and not for theexternal libraries that previously had been using barometer altitude data.To solve this the latest value is now stored as a variable in Rangefinder.cppas well as a variable in the main code like before. This makes it possibleto retrieve the latest value by reading the variable in Rangefinder.cpp fromanywhere, including external libraries, while still maintaining the functionsin the main code that are using the old variable.
Since the sonar measures the absolute distance and therefore will be affectedby change in attitude by the quadcopter (in contrast to a barometer) compen-sation for this was implemented and briefly tested. It was however decidedto not use it during this project since the sonar will not measure in a straightline due to the beam width. This means that for low altitudes, compensatingfor attitude changes actually made the results worse.
5.3.2.2 Sensor fusion
The APM is continuously receiving a target altitude from the BBB and thisvalue is compared to the latest estimated altitude and then compensated forby changing the throttle effect. A complementary filter is used for altitudeestimation. This filter was already implemented for fusion of barometer andIMU data, but has been changed to use sonar altitude instead of barometeraltitude.
The complementary filter combines a low pass filter with a high pass filterto generate an accurate estimate [18]. For this application it is used to fusethe distance data from the sonar with the IMU accelerometer data. The lowpass filter is applied to the accelerometer data to reduce the high frequencynoise that is induced by vibrations. The high pass filter is at the same timeused to always use the latest sonar altitude measurement. This can be seenin the equation
p(t) = pb(t− 1) +1
2(a(t)− g) ∗ 100dt2
+1
2
1
τ 3pe(t)dt
3 +3
τ 2pe(t)dt
2 +3
τpe(t)dt (2)
where p(t) is the estimated position and pb(t) is the estimated position beforeposition correction which is derived from the last position before positioncorrection together with the velocity of the quadcopter. a(t) is the measured
18
acceleration and τ is the time constant that is used to calibrate the fusion.The position error
pe(t) = s(t)− p(t− 1) (3)
is the error in position compared to sonar measurements which used for theposition correction and s(t) is the measured sonar altitude. Equation 2 and3 are only applicable for positions in z direction.
It can be seen in equations 2 and 3 that a low τ value should give thesonar measurements more impact, and a high τ value should increase theaccelerometer impact on the estimated altitude and will also result in slowerchanges.
5.3.2.3 Custom mode
A custom mode was implemented on the APM and it is only when the APMis in this mode it is listening to commands from the BBB. To make it possi-ble to activate this mode from the ground station without having to modifythe source code, the already existing guided mode was changed into the cus-tom mode. This means whenever guided mode is activated by any sourcethe APM will go into the custom mode. Each mode consists of four submodes that control roll-pitch, yaw, thrust and navigation. This means al-ready available sub modes could be used for everything except the throttlesub mode.
Figure 7 shows the software flow of the custom mode. In this mode it is firstchecked that the latest target altitude command received from the BBB isno older than 200 ms or otherwise the quadcopter will immediately land as asafety precaution. This means that if the APM and the BBB for any reasonlose contact the quadcopter will initiate landing within 200 ms.
The firmware already has a function to detect when the quadcopter is stand-ing on the ground by measuring the altitude change compared to the throttleoutput. If no altitude change is seen when the throttle output has reachedminimum it is assumed the quadcopter has landed. If that is the case, slowstart will slew the motors from current speed to maximum when the quad-copter is taking off. There is a safety function that requires the throttle onthe transmitter to be raised to a certain level before the takeoff is initiated.This has been removed to make it possible to control the altitude for thequadcopter from the ground station only.
The last step is to check for a target altitude of 0 which is defined as landingcommand. If it is 0 the quadcopter will land by holding a fixed landing speed
19
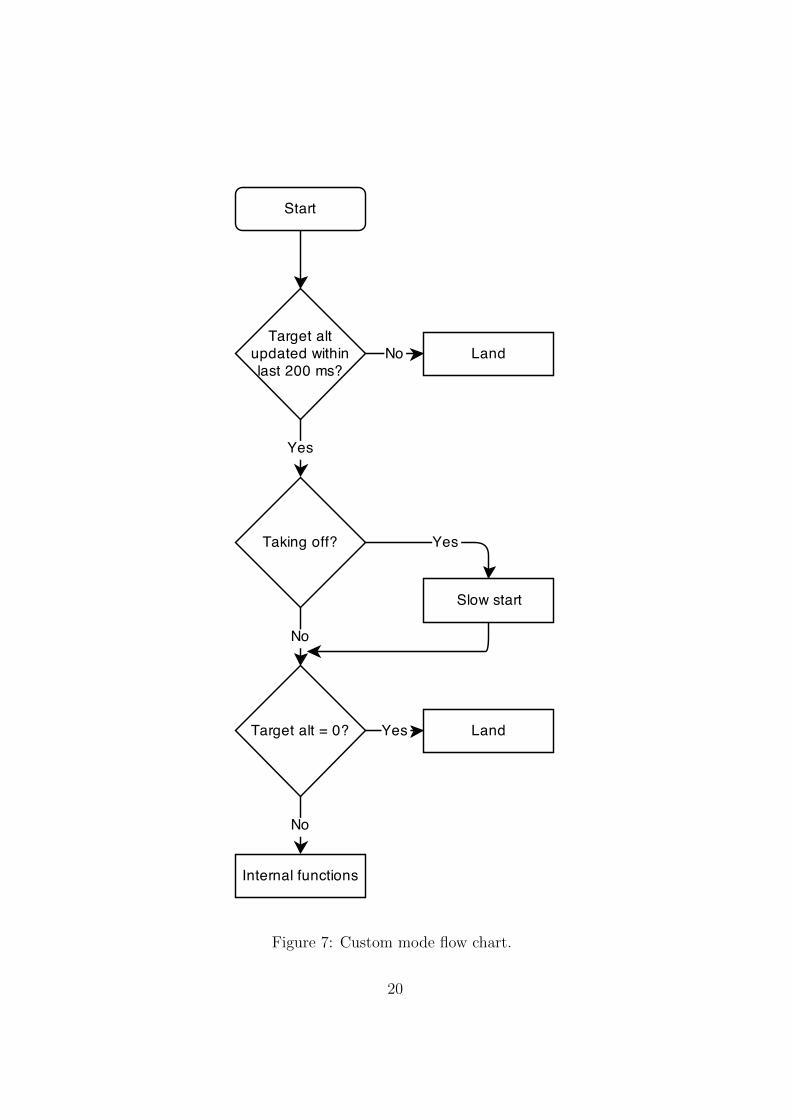
Figure 7: Custom mode flow chart.
20
until it reaches the ground and then wait for further commands. If the targetaltitude is anything else except 0 internal altitude hold functions are used toreach and hold the target altitude.
While the custom mode is active the altitude is fully controlled by the targetaltitude received by BBB and the pilot is not able to change the altitudewith the transmitter. The pilot will however be able to control the pitchand roll of the quadcopter. Since it is flown indoors, turbulence amongstother factors will create drift that needs to be compensated for manually.This is because x and y position cannot be acquired without GPS which isnot accessible indoors and the IMU is not accurate enough to use for thispurpose.
5.4 BeagleBone Black
BBB is a low-cost development platform and was running Ubuntu 13.10during this project [19]. It is used as the onboard computer and works as alink between the APM and ground station as well as controlling the APM innear real time.
5.4.1 Mounting
The BBB was at the center of the quadcopter, above the APM, where mostroom was available while still being protected by the top cover, see Figure8. It was screwed onto a carbon fibre plate with extenders to avoid anyrisks of short circuits. It requires a 5 V input and can be powered eitherwith a USB cable connected to the micro USB port, or by a 2.1 mm barrelconnector [20]. For the final build BBB was powered via the battery througha barrel connector, although the USB connector had been used during thedesign process.
5.4.2 Setup
Before the BBB could be used it had to be setup accordingly. The BBBcomes delivered with the Angstrom Distribution OS, so first things that hadto be done was to install Ubuntu. That was done by flashing Ubuntu to theeMMC from a micro SD card. After this had been done once, the SD cardis no longer needed so the SD card reader could be used for other things inthe future. The entire setup procedure is described in Appendix.
21
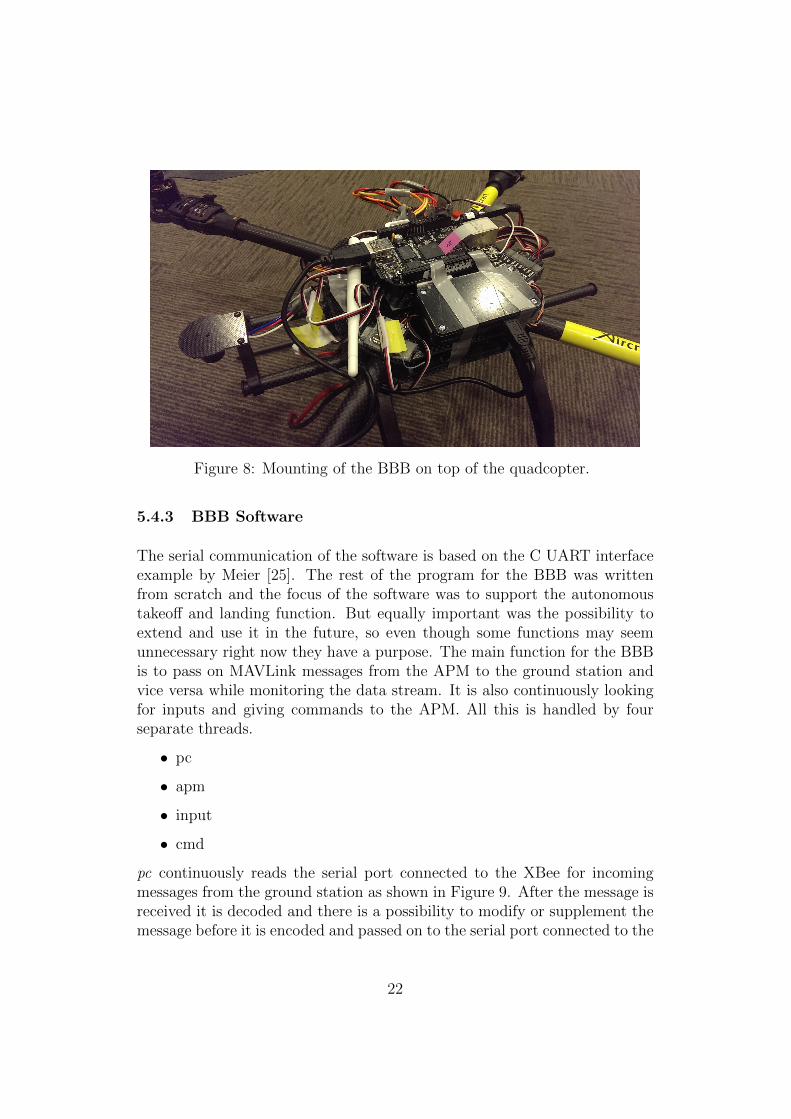
Figure 8: Mounting of the BBB on top of the quadcopter.
5.4.3 BBB Software
The serial communication of the software is based on the C UART interfaceexample by Meier [25]. The rest of the program for the BBB was writtenfrom scratch and the focus of the software was to support the autonomoustakeoff and landing function. But equally important was the possibility toextend and use it in the future, so even though some functions may seemunnecessary right now they have a purpose. The main function for the BBBis to pass on MAVLink messages from the APM to the ground station andvice versa while monitoring the data stream. It is also continuously lookingfor inputs and giving commands to the APM. All this is handled by fourseparate threads.
• pc
• apm
• input
• cmd
pc continuously reads the serial port connected to the XBee for incomingmessages from the ground station as shown in Figure 9. After the message isreceived it is decoded and there is a possibility to modify or supplement themessage before it is encoded and passed on to the serial port connected to the
22
APM. It is transparent meaning from the APM point of view the messagesare received directly from the ground station and from the ground stationpoint of view it is sending the messages directly to the APM.
apm continuously reads the serial port connected to the APM for incomingmessages as shown in Figure 10. After the message is received it is decodedand there is a possibility to modify or supplement the message before itis encoded and passed on to the serial port connected to the XBee andtransmitted to the ground station. It is transparent meaning from the APMpoint of view the messages are sent directly to the ground station and fromthe ground station point of view the messages are received directly from theAPM.
It is in apm the rangefinder data is decoded and monitored before it is de-coded into a rangefinder message without timestamps. This is to make itpossible for the ground station, which is expecting the MAVLink messageto arrive without timestamp, to still be able to read and show the altitudewithout altering the ground station software.
input monitors the inputs given in PuTTY directly to the BBB over the adhoc network and depending on the command it will change the local modeon the BBB.
• “help” will show available commands.
• “t” will set TAKEOFF mode and take off to a preset altitude.
• “l” will set LAND mode and set target altitude to 0.0 m.
• “s X” will set FLY mode and set target altitude to X, where X is thealtitude in meters.
This is visualised in Figure 11.
cmd updates the target altitude to the APM each time new sonar or attitudevalues are received from the APM as shown in Figure 12. This is monitoredin the apm thread which will give a signal as soon as any of these two valueshave changed. In the cmd thread it will be controlled so that the sonar andattitude values are synced in time, and if they are the target altitude will beupdated. The new altitude will be sent to the serial port connected to theAPM as a MAVLink message.
23
Figure 9: pc flow chart. Figure 10: apm flow chart.
24
Figure 11: input flow chart.
25
Figure 12: cmd flow chart.
26
6 Experiment Design and Results
The experiments were conducted as two separate parts. In the first part thequadcopter was mounted to a frame that prevented it from moving in anydirection except the z direction and to only be able to tilt in roll angle. Themeaning with this part was to find the optimal value of the time constant inz direction, named TC Z in the APM software. The value of TC Z sets theimpact sonar measurements and IMU estimations will have on the filteredaltitude as described in section 5.3.2.2 where TC Z is interchangeable withτ in equation 2. A good value is essential to be able to hover steadily at thespecified altitude.
For the second part of the experiments the quadcopter could fly freely but apilot controlled the roll and pitch with a transmitter. Also here the optimalparameter value of TC Z was analysed to find any differences between theframe test and free fly test since some of the conditions had changed. Afterthe optimal value had been found it was tested for different altitudes tosee how the behaviour changed. Since the measured distances and timesprobably could be improved with more fine tuning and by changing to betterhardware it is the difference between each test that is more interesting thanthe actual values.
For all the experiments the quadcopter was starting on the ground and beganwith a takeoff to the target altitude set. There it was kept for about oneminute before the land command was given and when it landed it markedthe end of that specific experiment run. Each experiment was conductedthree times with exactly the same conditions to get a good average withoutspending too much time. Both raw sonar data as well as filtered data wasused and main measurements were:
• RMS difference between the target altitude and the measured altitude.This is the main part to minimise since a good value means the quad-copter is at average closer to the target altitude.
• Takeoff time. This parameter is used to find out how fast the systemis changing altitude.
• Landing time. Similar to the takeoff time this parameter is used to findout how fast the system is changing altitude.
• Number of oscillations. This value is used to see how stable the quad-copter is when holding the target altitude.
The results are presented as tables and graphs where a moving average filter
27
with a span of 5 is used to make a curve fit showing the trend line for eachgraph.
6.1 Optimal Time Constant for Frame Setup
The frame was created from two tripods that had a PVC pipe mountedbetween them that was fixed to the quadcopter, see Figure 13. To make itpossible for the quadcopter to move freely in the z direction the pipe wasmounted to the tripods with a T joint. This resulted in a weight increaseof 400 g and after the landing gear had been removed a net increase of 300g. At the very top of the tripods another PVC pipe was fixed to increasestability as well as preventing the tripods to flex in relative to each other.For each of the tripod legs sand bags weighing about 3 kg each were fixed toprevent the entire frame to fall over due to horizontal forces.
Underneath the quadcopter a third PVC pipe was mounted that only acted asa reference point for the altitude measurements. The reasons for this was thatwhen the quadcopter reached the maximum altitude the sonar beam wouldsee the tripod legs, since the beam is wider further away from the sonar, andtherefore the result would be incorrect. A PVC pipe was chosen to affect theturbulence created by the quadcopter as little as possible. When everythingwas set up the quadcopter could move about 40 cm in the z direction.
To find the optimal balance between measured sonar altitude and estimatedIMU altitude, different parameters for the sensor fusion were tested. This wasdone by changing the parameter value of TC Z. This could be done either bychanging the initial value in the code before uploading it on the APM, or itcould be changed via the full parameter list in the Mission Planner interface.It is possible to set to any decimal number between 0 and 30. A low valuemeans sonar measurements have more effect on the estimated altitude and ahigher value means the IMU is more important. All data was transferred tothe PC by USB cable for these experiments.
The following procedure was carried out for the frame parameter experi-ment:
1. Connect USB cable from PC to APM
2. Change and upload the value of parameter TC Z
3. Remove the USB cable from PC to APM
4. Connect the battery
28

Figure 13: The frame used for the experiments.
29

5. Run program on BBB
6. Connect Mission Planner
7. Wait for the altitude to stabilise
8. ARM command
9. Change mode to custom mode (guided mode in Mission Planner)
10. Takeoff command
11. Fly for about 60 seconds
12. Land command
13. DISARM command
14. Disconnect Mission Planner
15. Shut down program on BBB
16. Disconnect the battery
17. Connect to the APM via USB and download all logs (APM, MissionPlanner and BBB)
First each integer value between 1 s and 7 s were tested and it could beconcluded that the best value should be somewhere there in between. Theresolution was then improved to 0.5, so in the end all values between 1 s and7.5 s with a 0.5 s resolution were tested. The optimal value was decided tobe the one that showed the least RMS difference between the target altitudeand the actual altitude after the quadcopter had reached the target altitude.A smaller RMS value means the distance and time spent away from thetarget altitude is minimised. Since no external altitude measurements wereused it had to be assumed that the sonar would give good enough altitudemeasurements or that the filtered altitude estimate would be good enough.The results are shown in Table 2 and Table 3.
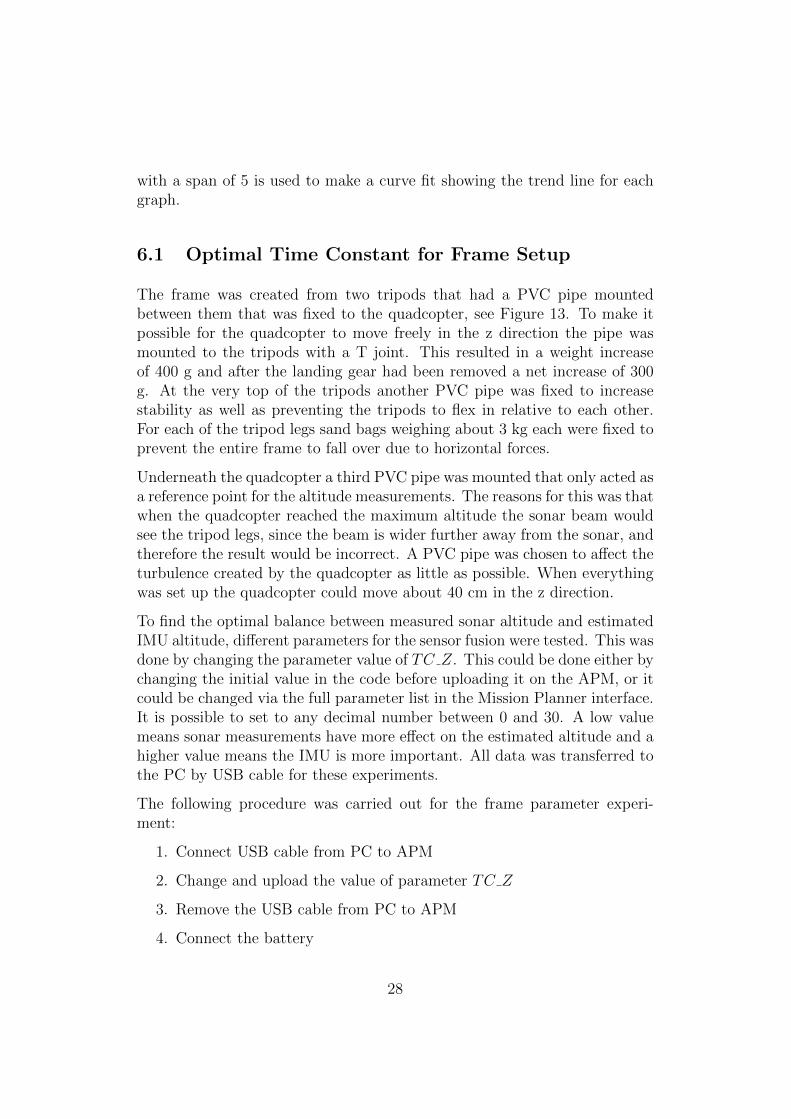
The RMS value was calculated from the point the quadcopter had reachedthe target altitude until the land command was received. Removing theascend phase negates the effect the time to reach target altitude otherwisewould have. When looking at the RMS difference between the sonar altitudeand the target altitude in Figure 14 it is clear that an optimal value ofTC Z is about 3 s. If the value is too low or too high the square erroris increasing meaning the quadcopter is spending more time away from thetarget altitude.
30
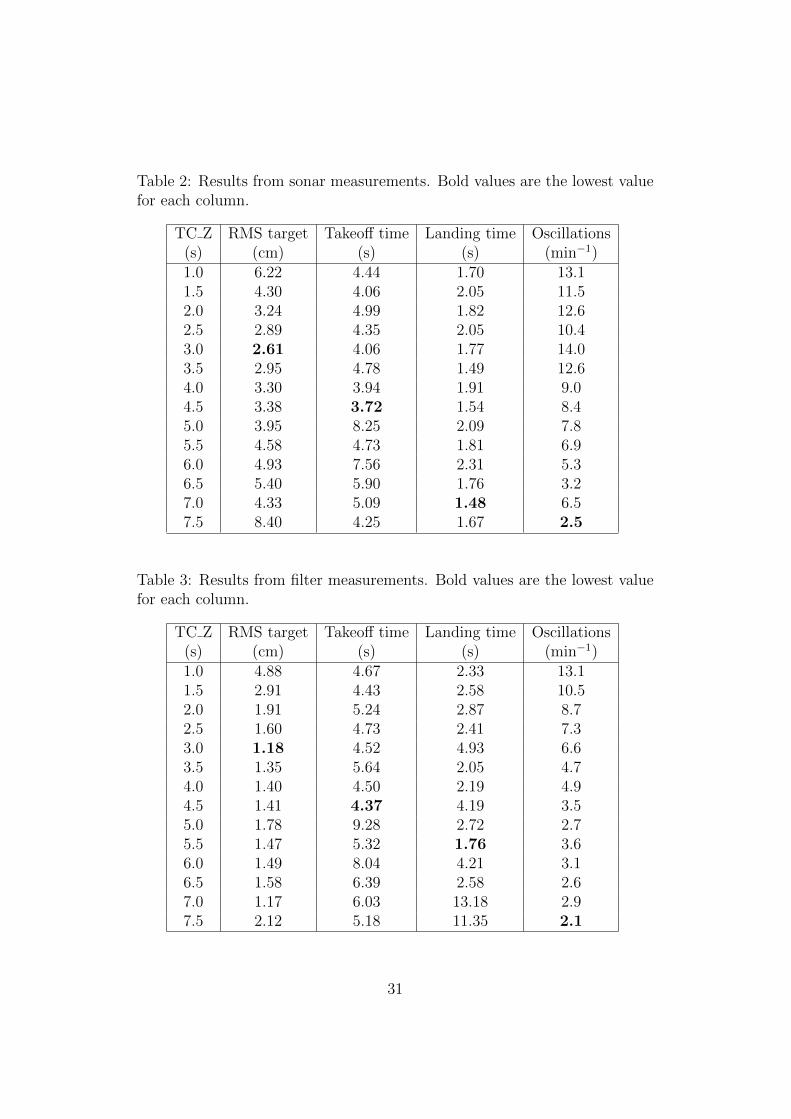
Table 2: Results from sonar measurements. Bold values are the lowest valuefor each column.
TC Z RMS target Takeoff time Landing time Oscillations(s) (cm) (s) (s) (min−1)1.0 6.22 4.44 1.70 13.11.5 4.30 4.06 2.05 11.52.0 3.24 4.99 1.82 12.62.5 2.89 4.35 2.05 10.43.0 2.61 4.06 1.77 14.03.5 2.95 4.78 1.49 12.64.0 3.30 3.94 1.91 9.04.5 3.38 3.72 1.54 8.45.0 3.95 8.25 2.09 7.85.5 4.58 4.73 1.81 6.96.0 4.93 7.56 2.31 5.36.5 5.40 5.90 1.76 3.27.0 4.33 5.09 1.48 6.57.5 8.40 4.25 1.67 2.5
Table 3: Results from filter measurements. Bold values are the lowest valuefor each column.
TC Z RMS target Takeoff time Landing time Oscillations(s) (cm) (s) (s) (min−1)1.0 4.88 4.67 2.33 13.11.5 2.91 4.43 2.58 10.52.0 1.91 5.24 2.87 8.72.5 1.60 4.73 2.41 7.33.0 1.18 4.52 4.93 6.63.5 1.35 5.64 2.05 4.74.0 1.40 4.50 2.19 4.94.5 1.41 4.37 4.19 3.55.0 1.78 9.28 2.72 2.75.5 1.47 5.32 1.76 3.66.0 1.49 8.04 4.21 3.16.5 1.58 6.39 2.58 2.67.0 1.17 6.03 13.18 2.97.5 2.12 5.18 11.35 2.1
31
1 2 3 4 5 6 7 80
0.01
0.02
0.03
0.04
0.05
0.06
0.07
0.08
0.09
0.1RMS Sonar−Target Altitude
Dis
tan
ce to
ta
rge
t a
ltitu
de
(m
)
Time Constant TC_Z (s)
Figure 14: RMS distance average between sonar altitude and target altitudeaccording to which the optimal value for TC Z should be about 3 s.
1 2 3 4 5 6 7 80
0.01
0.02
0.03
0.04
0.05
0.06
0.07
0.08
0.09
0.1RMS Difference Filtered−Target Altitude
Dis
tan
ce to
ta
rge
t a
ltitu
de
(m
)
Time Constant TC_Z (s)
Figure 15: RMS distance average between filtered altitude and target altitudeaccording to which the optimal value should be somewhere between 3 s and7 s.
32
1 2 3 4 5 6 7 80
1
2
3
4
5
6
7
8
9
10
11
12
13
14
15Average Number of Oscillations per Minute
Oscillations
Time Constant TC_Z (s)
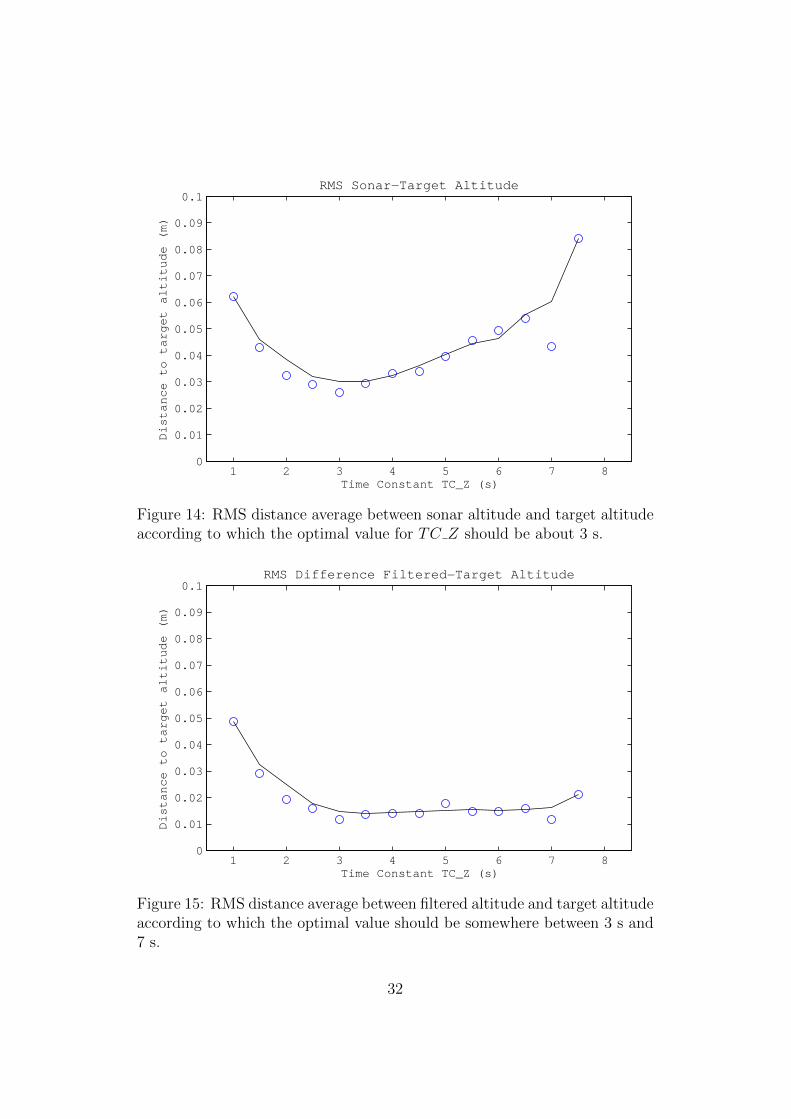
Figure 16: Average number of oscillations per minute. Higher value of TC Zresults in less oscillations.
Looking at the RMS difference between the filtered altitude and the targetaltitude in Figure 15 similar patterns can be seen but not as obvious. It isclear that a too low value is bad, but between 3 s and 7 s the value seemsto be about the same. The reason for this is probably once again due tohigher values mean the filtered altitude is changing slower. Since the filteredaltitude is depending on the parameter value this means the computationsfor estimated value will differ for each experiment. Therefore it has to beassumed that the sonar is giving most consistent values over the course ofthe experiments.
Another conclusion can be drawn from the average number of oscillationsper minute graph in Figure 16. The oscillations were calculated by adding0.5 oscillations each time the altitude change from below to above the targetaltitude or vice versa. This should reduce the impact of noise since thismeans the measured altitude had to change two resolution steps to count asan oscillation. The graph shows that lower value will increase the oscillationsrate of the quad, and this could be expected since lower values are moredependant on sonar altitude which is changing more rapidly. Higher valuesmeans less emphasis is put on the sonar measurements which will counteractfast changes. So for high values the quadcopter is oscillating less but since
33
1 2 3 4 5 6 7 80
1
2
3
4
5
6
7
8
9
10Average Takeoff Time
Average Takeoff Time (s)
Time Constant TC_Z (s)
Figure 17: Quadcopter average takeoff time for each experiment. The takeofftime does not seem to be noticeably affected by TC Z.
the changes are slower it also means that when the quadcopter is movingaway from the target altitude it will also take longer time to react and moveback to the target altitude.
Takeoff time, Figure 17, was measured from the moment the takeoff commandwas received until the quadcopter reached the target altitude. Landing time,Figure 18, was measured from the landing command was received until analtitude of 55 cm was measured since the measure altitude when the quad-copter was on ground varied between 54 cm and 55 cm. Although it is hardto draw any definite conclusions from the takeoff and landing time since noclear pattern is shown, it seems like that the takeoff and landing time isnot affected by the value of TC Z. More tests is needed before any definiteconclusions can be drawn.
6.2 Optimal Time Constant for Free Flying
Also for the free flying tests the different values for the TC Z parameter weretested to find the optimal balance between sonar altitude and estimated IMUaltitude. The reason this was tested also for the free flying was that since
34
1 2 3 4 5 6 7 80
0.5
1
1.5
2
2.5Average Landing Time
Average Landing Time (s)
Time Constant TC_Z (s)
Figure 18: Quadcopter average landing time for each experiment. The land-ing time does not seem to be noticeably affected by TC Z.
the frame made the quadcopter carry extra weight and some friction wascreated by the frame itself it was not sure the same parameter value wouldbe optimal when none of these factors were present. Also since a pilot wascontrolling the quadcopter to compensate for drift this might also have animpact. Target altitude was set to 1 meter which is pretty close to the 0.75cm used for the frame experiments considering the target altitude for framewas based on the PVC pipe placed beneath the quadcopter some distanceabove the ground. The free fly experiments were executed inside a safety netof dimensions about 4.7 x 2.8 x 2.5 m with the ground station and transmitteravailable from the outside.
The following procedure was carried out for the free fly parameter experi-ment:
1. Connect the battery
2. Run program on BBB
3. Connect Mission Planner
4. Change parameter value through Mission Planner full parameter list
5. Wait for the altitude to stabilise
35
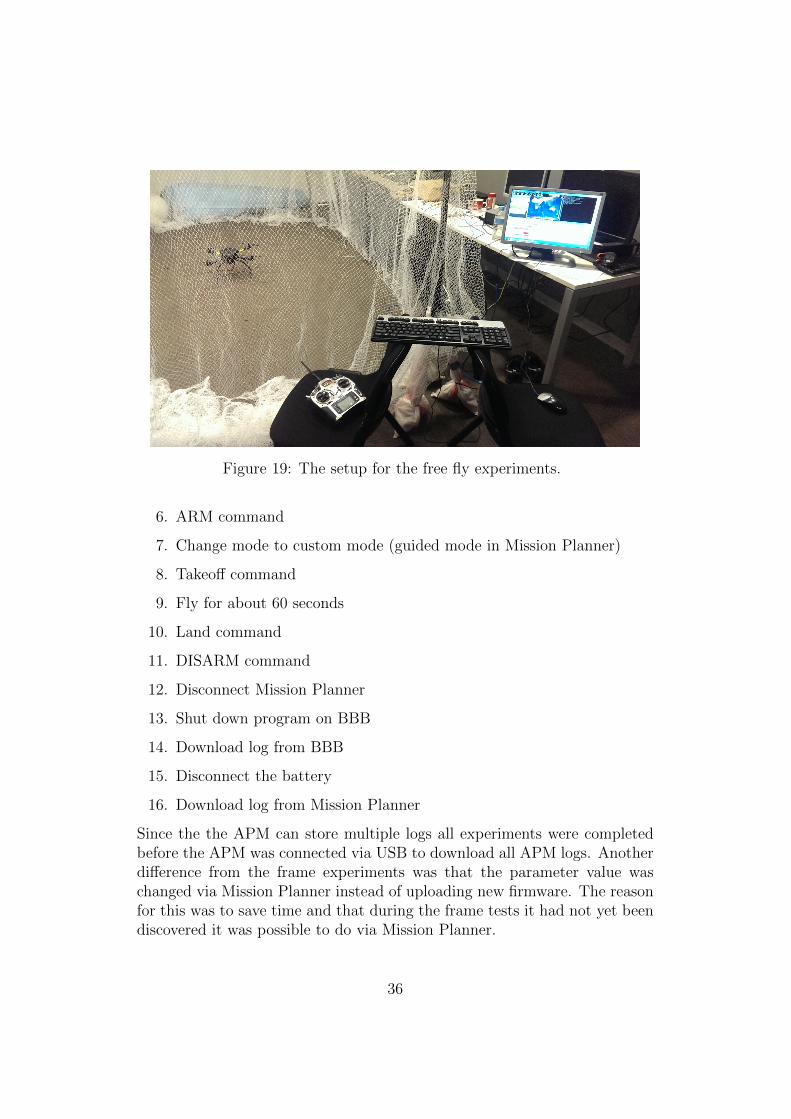
Figure 19: The setup for the free fly experiments.
6. ARM command
7. Change mode to custom mode (guided mode in Mission Planner)
8. Takeoff command
9. Fly for about 60 seconds
10. Land command
11. DISARM command
12. Disconnect Mission Planner
13. Shut down program on BBB
14. Download log from BBB
15. Disconnect the battery
16. Download log from Mission Planner
Since the the APM can store multiple logs all experiments were completedbefore the APM was connected via USB to download all APM logs. Anotherdifference from the frame experiments was that the parameter value waschanged via Mission Planner instead of uploading new firmware. The reasonfor this was to save time and that during the frame tests it had not yet beendiscovered it was possible to do via Mission Planner.
36
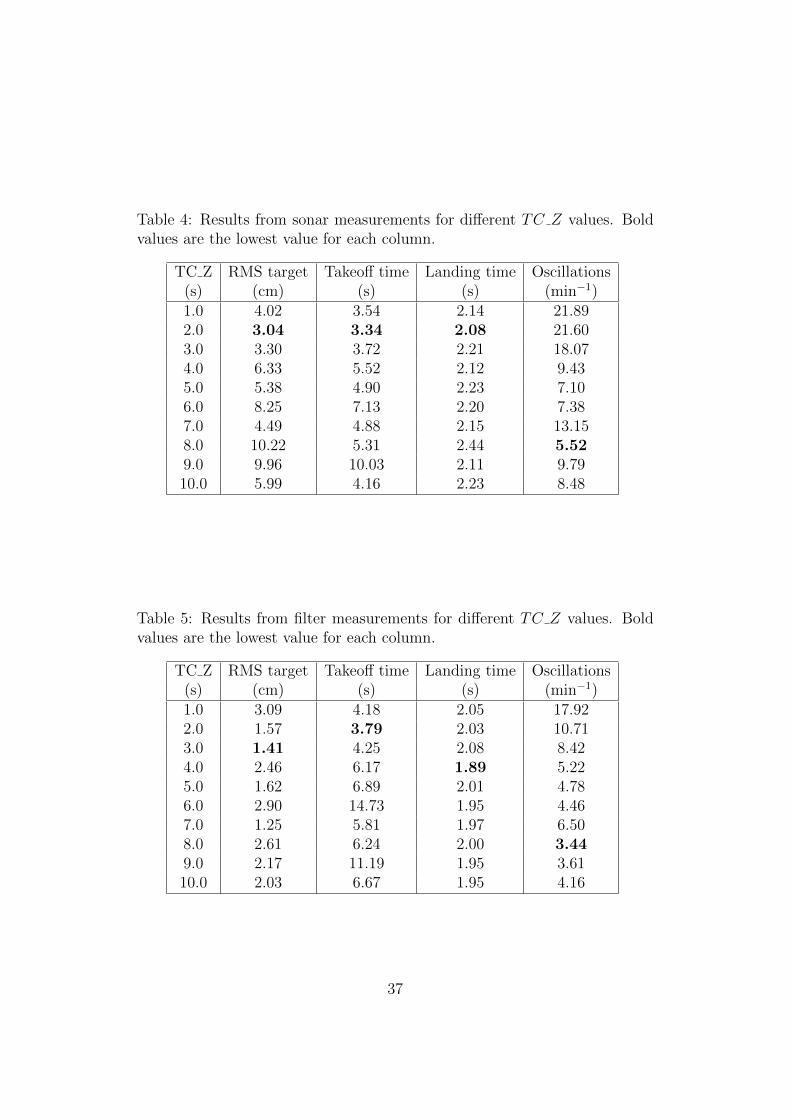
Table 4: Results from sonar measurements for different TC Z values. Boldvalues are the lowest value for each column.
TC Z RMS target Takeoff time Landing time Oscillations(s) (cm) (s) (s) (min−1)1.0 4.02 3.54 2.14 21.892.0 3.04 3.34 2.08 21.603.0 3.30 3.72 2.21 18.074.0 6.33 5.52 2.12 9.435.0 5.38 4.90 2.23 7.106.0 8.25 7.13 2.20 7.387.0 4.49 4.88 2.15 13.158.0 10.22 5.31 2.44 5.529.0 9.96 10.03 2.11 9.7910.0 5.99 4.16 2.23 8.48
Table 5: Results from filter measurements for different TC Z values. Boldvalues are the lowest value for each column.
TC Z RMS target Takeoff time Landing time Oscillations(s) (cm) (s) (s) (min−1)1.0 3.09 4.18 2.05 17.922.0 1.57 3.79 2.03 10.713.0 1.41 4.25 2.08 8.424.0 2.46 6.17 1.89 5.225.0 1.62 6.89 2.01 4.786.0 2.90 14.73 1.95 4.467.0 1.25 5.81 1.97 6.508.0 2.61 6.24 2.00 3.449.0 2.17 11.19 1.95 3.6110.0 2.03 6.67 1.95 4.16
37
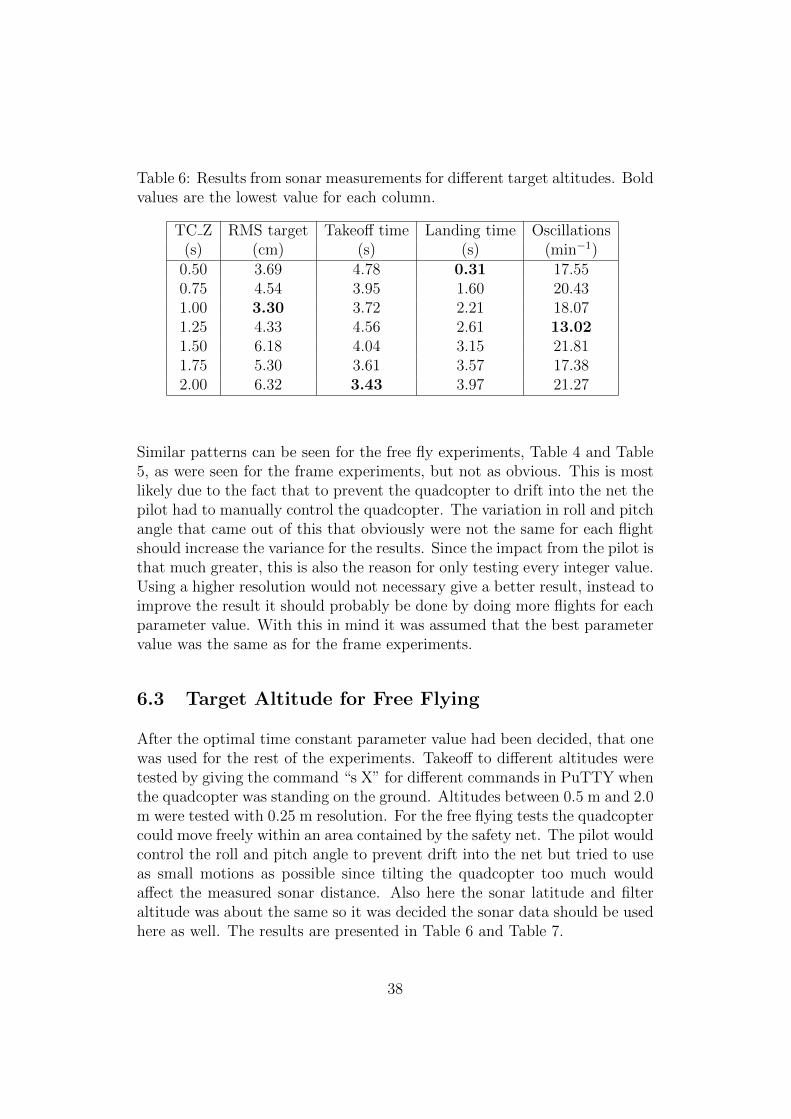
Table 6: Results from sonar measurements for different target altitudes. Boldvalues are the lowest value for each column.
TC Z RMS target Takeoff time Landing time Oscillations(s) (cm) (s) (s) (min−1)
0.50 3.69 4.78 0.31 17.550.75 4.54 3.95 1.60 20.431.00 3.30 3.72 2.21 18.071.25 4.33 4.56 2.61 13.021.50 6.18 4.04 3.15 21.811.75 5.30 3.61 3.57 17.382.00 6.32 3.43 3.97 21.27
Similar patterns can be seen for the free fly experiments, Table 4 and Table5, as were seen for the frame experiments, but not as obvious. This is mostlikely due to the fact that to prevent the quadcopter to drift into the net thepilot had to manually control the quadcopter. The variation in roll and pitchangle that came out of this that obviously were not the same for each flightshould increase the variance for the results. Since the impact from the pilot isthat much greater, this is also the reason for only testing every integer value.Using a higher resolution would not necessary give a better result, instead toimprove the result it should probably be done by doing more flights for eachparameter value. With this in mind it was assumed that the best parametervalue was the same as for the frame experiments.
6.3 Target Altitude for Free Flying
After the optimal time constant parameter value had been decided, that onewas used for the rest of the experiments. Takeoff to different altitudes weretested by giving the command “s X” for different commands in PuTTY whenthe quadcopter was standing on the ground. Altitudes between 0.5 m and 2.0m were tested with 0.25 m resolution. For the free flying tests the quadcoptercould move freely within an area contained by the safety net. The pilot wouldcontrol the roll and pitch angle to prevent drift into the net but tried to useas small motions as possible since tilting the quadcopter too much wouldaffect the measured sonar distance. Also here the sonar latitude and filteraltitude was about the same so it was decided the sonar data should be usedhere as well. The results are presented in Table 6 and Table 7.
38
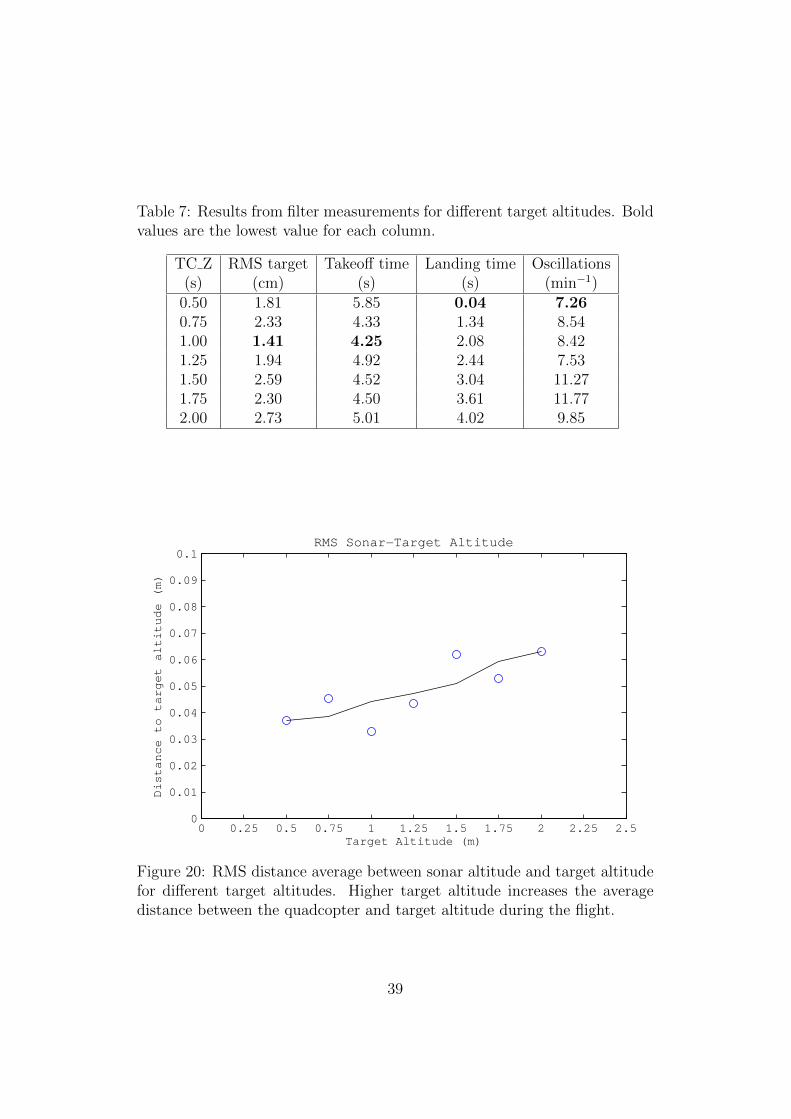
Table 7: Results from filter measurements for different target altitudes. Boldvalues are the lowest value for each column.
TC Z RMS target Takeoff time Landing time Oscillations(s) (cm) (s) (s) (min−1)
0.50 1.81 5.85 0.04 7.260.75 2.33 4.33 1.34 8.541.00 1.41 4.25 2.08 8.421.25 1.94 4.92 2.44 7.531.50 2.59 4.52 3.04 11.271.75 2.30 4.50 3.61 11.772.00 2.73 5.01 4.02 9.85
0 0.25 0.5 0.75 1 1.25 1.5 1.75 2 2.25 2.50
0.01
0.02
0.03
0.04
0.05
0.06
0.07
0.08
0.09
0.1RMS Sonar−Target Altitude
Dis
tan
ce to
ta
rge
t a
ltitu
de
(m
)
Target Altitude (m)
Figure 20: RMS distance average between sonar altitude and target altitudefor different target altitudes. Higher target altitude increases the averagedistance between the quadcopter and target altitude during the flight.
39
0 0.25 0.5 0.75 1 1.25 1.5 1.75 2 2.25 2.50
1
2
3
4
5
6Average Takeoff Time
Time (s)
Target Altitude (m)
Figure 21: Average takeoff time for different target altitudes. Increasedtarget altitude results in decreased takeoff time.
The general impression from Figure 20 is that the RMS between the sonaraltitude and target altitude increases slightly as the target altitude increases.It is possible that this is an effect from not compensating the altitude mea-surement when the quadcopter is tilting since the effect will increase at higheraltitudes. The best value seems to be at about 1 m which could be explainedby that this is about in the middle of the room and therefore less self inducedturbulence is affecting the quadcopter.
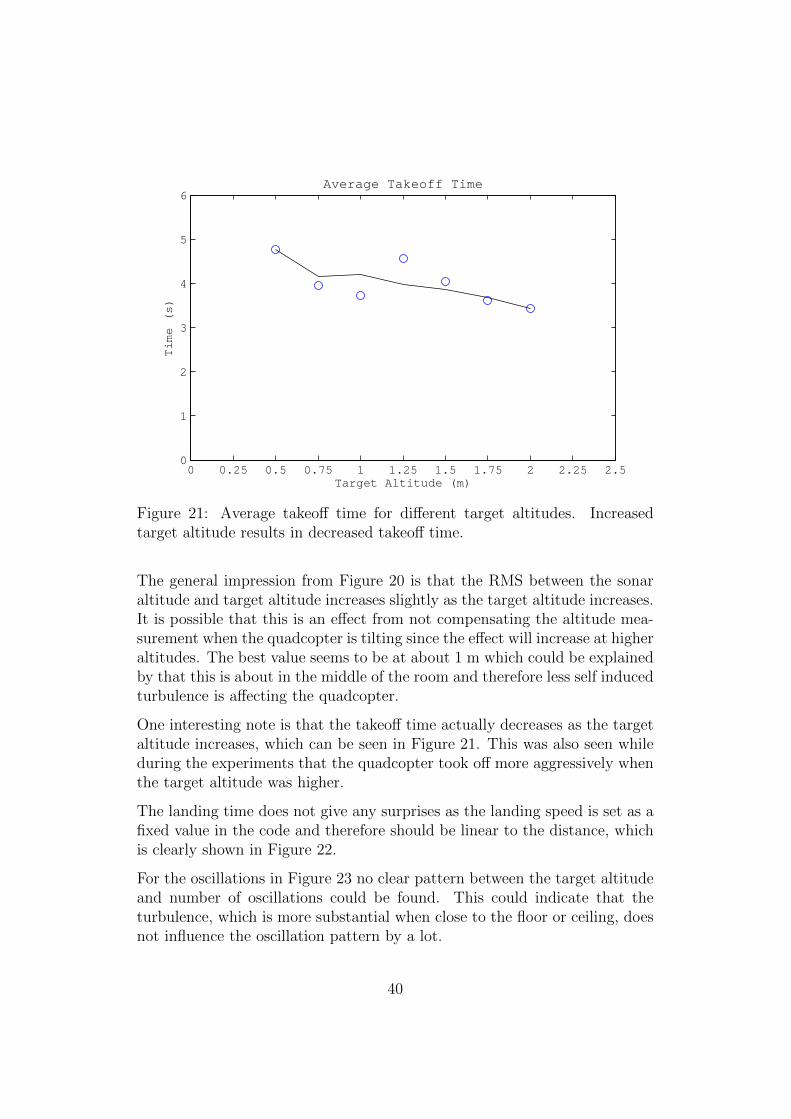
One interesting note is that the takeoff time actually decreases as the targetaltitude increases, which can be seen in Figure 21. This was also seen whileduring the experiments that the quadcopter took off more aggressively whenthe target altitude was higher.
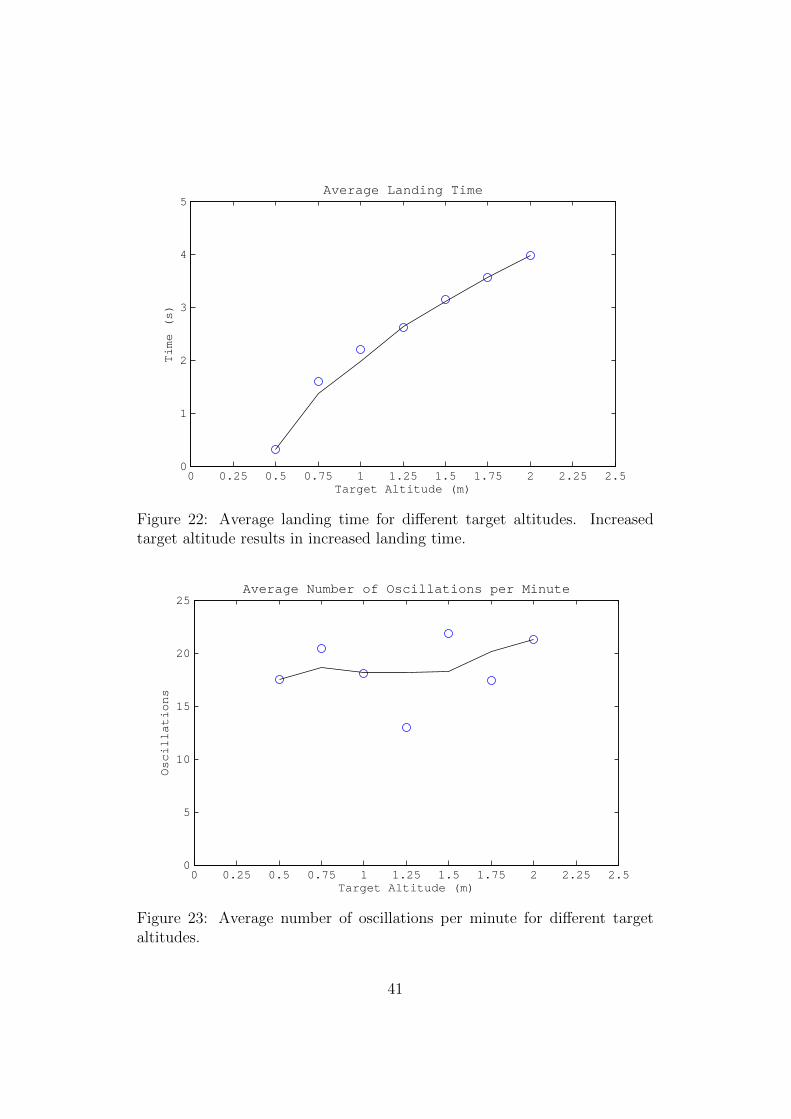
The landing time does not give any surprises as the landing speed is set as afixed value in the code and therefore should be linear to the distance, whichis clearly shown in Figure 22.
For the oscillations in Figure 23 no clear pattern between the target altitudeand number of oscillations could be found. This could indicate that theturbulence, which is more substantial when close to the floor or ceiling, doesnot influence the oscillation pattern by a lot.
40
0 0.25 0.5 0.75 1 1.25 1.5 1.75 2 2.25 2.50
1
2
3
4
5Average Landing Time
Time (s)
Target Altitude (m)
Figure 22: Average landing time for different target altitudes. Increasedtarget altitude results in increased landing time.
0 0.25 0.5 0.75 1 1.25 1.5 1.75 2 2.25 2.50
5
10
15
20
25Average Number of Oscillations per Minute
Oscillations
Target Altitude (m)
Figure 23: Average number of oscillations per minute for different targetaltitudes.
41
7 Conclusions
After the end of the project it can be concluded that all three research ques-tions have been answered. Most time was spent on how to set and reach atarget altitude since it was not clear from the beginning if this should bemainly controlled from the APM or the BBB. In the end most of the com-putation was put on the APM to let the BBB only control and instruct theAPM. This made it possible to use many of the functions already available onthe APM while the BBB could perform some of the ground operator’s tasks.The system can be used to takeoff, hold, and landing by setting the targetaltitude from the BBB and let the APM autonomously track that altitude.The solution to let the BBB control the altitude but let the APM calculatecurrent altitude and compensate for that is something that is new, althoughsimilar solutions surely have been made with different hardware.
Before the work with the takeoff and landing system even could start somework on the hardware had to be done so all connections were correct andworking. Also the development of the BBB is in many cases not directlyrelated to the takeoff and landing system so this meant less time could ac-tually be spent on the system. Still it was necessary for the system to workand the development of the BBB as an onboard computer is something thatwill continue in the future as more functions are added. Now when the basehas been established it should be easier for developers to focus more in theirspecific implementation.
A lot of modifications had to be done on the APM to make indoor flightpossible since much previously relied on the barometer and GPS system.This does not mean however that all these functions have been removed. Asmuch as possible these were kept to be possible to use as a supplement tothe new takeoff and landing function for flights outdoor.
No external dependencies except the ground station is needed for the systemto work. The ground system is only required to give high level commands sothe system is self contained and could be disconnected as soon as the instruc-tions have been given and the quadcopter system would still work.
42
8 Future Research
Since this was the first step of creating a fully autonomous system for quad-copters there is quite a lot to be done in the future. Many of the functionsimplemented are only in some sort of simple first version state and could beboth improved and optimised. A dynamic change of vertical speed shouldimprove the altitude hold function to fine tune when approaching the targetaltitude. It should also improve the takeoff and landing time by reducing thespeed only when close to the target altitude or ground.
The current filter used for sensor fusion of sonar and IMU data is proven towork but there are theories that a Kalman filter could improve the fusion witha better estimation. One problem with that is the APM is about to reachits maximum potential and such a filter probably then have to be moved tothe BBB. This would introduce other problems such that real time and syncissues could become a factor when evaluating which filter is best. By settingup a model of the system that is compared to the experiments could thenhelp to simulate future algorithms.
Since the MAVLink message for rangefinder data was modified to includetimestamps it is possible to compare so the latest IMU data is in sync withthe latest rangefinder data when it is received at the BBB (IMU data isalready including a time stamp). Although this does not have any immediateimpact on the system for now since all of the computations are made on theAPM, it will make it possible to move heavy computations from the APMto the BBB in the future, e.g. a Kalman filter.
One problem with the current design is that the WiFi channel used are sharedwith many other devices such as mobile phones. When the quadcoptersoperate in crowded areas the channel easily becomes saturated and can affectthe communication ability. To prevent this other wireless communicationalternatives must be explored.
When the quadcopter is able to takeoff, fly and land autonomously it meansthat it can by itself take the decision when it is time to land by monitor thebattery level and take action accordingly. Combine this with a system forrecharge, such as using solar panels, and the quadcopter then do not have toreturn to a recharge station for each charge cycle. It can just land, recharge,takeoff and continue where it was before.
A long term goal with the system is that it should be able to by itself deter-mine where it is possible to land without the risk of not being able to takeoffagain. This means to both avoid to steep slopes as well as objects lying on
43
the ground. Ideas of using cameras for this was discussed during the projectbut not further investigated due to lack of time. When landing on unevenground it is also possible that the sonar will be closer to the ground than itsminimum distance. This has to be taken into account since strange valuesotherwise may prevent the quadcopter to take off again.
Another big step that is currently already in development is to implementsimultaneous localization and mapping (SLAM) to work together with thesystem. This would make it possible for the quadcopter to localise its currentposition in x and y directions in addition to z and then full informationof its current position. This opens up for fully autonomous flight indoorwithout any external systems. In general the system would benefit from anyadditional sensor, camera or something else. This could be used both forredundancy and to calibrate the system. As it is now the sonar has to sort ofcontrol itself since it is the only direct contact with the outside world.
When the system is working on one unit it should also be scalable to aswarm of multiple units to use its full potential. This could give rise to otherproblems such as interference between the quad copters and more that haveto be taken into account. Solving all these problems is the ultimate goalthat would make it possible for quadcopters to without human supervisionexplore, search, or surveillance areas without being affected by exhaustion orhuman errors.
44
References
[1] Nunamaker JF Jr, Chen M, Purdin TDM. System Development in Infor-mation System Research. J Manage Inform Syst. 1991; 7(3):89-106
[2] Patterson T, McClean S, Morrow P, Parr G, Luo C. Timely autonomousidentification of UAV safe landing zones. Image Vis Comput. 2014 Jul 3;32(2014):568–578
[3] Wei Y, Blake MB, Madey GR. An Operation-time Simulation Frameworkfor UAV Swarm Configuration and Mission Planning. In: Alexandrov V,Lees M, Krzhizhanovskaya V, Dongarra J, Sloot PMA, editors. 2013 Inter-national Conference on Computational Science; 2013 Jun 5-7; Barcelona,Spain. Amsterdam: Elsevier; 2013. p. 1949-1958
[4] Pradana A, Dikairono R, Purwanto D, Design of Quadrotor HoveringSystem Based on Inertial Measurement Unit Sensor. Surabaya, Indone-sia: Electrical Engineering Department, Faculty of Industrial Technology,Sepuluh Nopember Institute of Technology
[5] Prattico F, Cera C, Petroni F. A new hybrid infrared-ultrasonic elec-tronic travel aids for blind people. Sens Actuators A Phys. 2013 Oct 15;201(2013):363-370
[6] Templeton T, Shim DH, Geyer C, Sastry SS. Autonomous Vision-basedLanding and Terrain Mapping Using an MPC-controlled Unmanned Ro-torcraft. In: Hutchinson S, editor. 2007 IEEE International Conferenceon Robotics and Automation; 2007 Apr 10-14; Roma, Italy. IEEE; 2007.p. 1349-1356
[7] Yang S, Scherer SA, Zell A. An Onboard Monocular Vision System forAutonomous Takeoff, Hovering and Landing of a Micro Aerial Vehicle. JIntell Robot Syst. 2012 Sep 13; 69(1-4):499-515
[8] Herisse B, Russotto FX, Hamel T, Mahony R. Hovering flight and ver-tical landing control of a VTOL Unmanned Aerial Vehicle using OpticalFlow. 2008 IEEE/RSJ International Conference on Intelligent Robots andSystems; 2008 Sep 22-26; Nice, France. IEEE; 2008. p. 801-806
[9] Cesetti A, Frontoni E, Mancini A, Zingaretti P, Longhi S. A Vision-BasedGuidance System for UAV Navigationand Safe Landing using NaturalLandmarks. J Intell Robot Syst. 2009 Oct 21; 57(1-4):233-257
45
[10] Yang A, Scherer SA, Schauwecker K, Zell A. Onboard Monocular Visionfor Landing of an MAV on a Landing Site Specified by a Single ReferenceImage. 2013 International Conference on Unmanned Aircraft Systems(ICUAS); 2013 May 28-31; Atlanta, GA, USA. IEEE; 2013. p. 318-325
[11] Mission Planner Overview [Internet]. [cited 2014 Sep 22]. Available from:http://planner.ardupilot.com/wiki/mission-planner-overview/
[12] MAVLink [Internet]. [cited 2014 Sep 2]. Available from:http://qgroundcontrol.org/mavlink/start
[13] Balasubramanian S. MavLink Tutorial for Absolute Dummies (Part –I)[Internet]. [Cited 2014 Oct 9]. Available fromhttp://api.ning.com/files/i*tFWQTF2R*7Mmw7hksAU-u9IABKNDO9apguOiSOCfvi2znk1tXhur0Bt00jTOldFvob-Sczg3*lDcgChG26QaHZpzEcISM5/MAVLINK FOR DUMMIESPart1 v.1.1.pdf
[14] PuTTY [Internet]. [Cited 2014 Sep 5] Available from:http://www.chiark.greenend.org.uk/ sgtatham/putty/
[15] LV-MaxSonar R©-EZ1TM High Performance Sonar Range Finder [Inter-net]. [cited 2014 Sep 4]. Available from:http://www.maxbotix.com/documents/MB1010 Datasheet.pdf
[16] Mandatory Hardware Configuration [Internet]. [cited 2014 Sep 1]. Avail-able from:http://copter.ardupilot.com/wiki/initial-setup/configuring-hardware/
[17] MAVLink Generator (C/C++, Python) [Internet]. [cited 2014 Oct 2].Available from:http://qgroundcontrol.org/mavlink/generator
[18] Higgins WT Jr. A Comparison of Complementary and Kalman Filtering.IEEE Trans Aerosp Electron Syst. 1975 May; AES-11(3):321-325
[19] BeagleBone Black [Internet]. [updated 2014 Aug 22;cited 2014 Sep 2].Available from:http://beagleboard.org/black
[20] Frequently Asked Questions [Internet]. [updated 2014 May 8;cited 2014Sep 22] Available from: http://beagleboard.org/Support/FAQ
46
[21] Schaenzle J. Wireless Communication Between Raspberry Pi and YourComputer. 2013 Apr 22 [cited 2014 Oct 9]. Atomic Spin [Internet].Available from:http://spin.atomicobject.com/2013/04/22/raspberry-pi-wireless-communication/
[22] Molloy D. Getting Started – USB Network Adapter on the Beaglebone[Internet]. [cited 2014 Sep 5]. Available from:http://derekmolloy.ie/beaglebone/getting-started-usb-network-adapter-on-the-beaglebone/
[23] Molloy D. Automatically Setting the Beaglebone Black Time UsingNTP [Internet]. 2013 May 18 [cited 2014 Sep 5]. Available from:http://derekmolloy.ie/automatically-setting-the-beaglebone-black-time-using-ntp/
[24] Clark J. BeagleBone Black Serial UART Device Tree Overlays forUbuntu and Debian Wheezy (tty01, tty02, tty04, tty05 .dtbo files)[Internet]. 2013 June 17 [cited 2014 Sep 5] Available from:http://www.armhf.com/beaglebone-black-serial-uart-device-tree-overlays-for-ubuntu-and-debian-wheezy-tty01-tty02-tty04-tty05-dtbo-files/
[25] Meier L. C Uart Interface Example [Internet]. Available from:https://github.com/mavlink/c uart interface example
47
Appendix
Setup of BBB
Following setup steps had to be done after each power reset of the BBB, butfor convenience everything was put together in a script that was run on startup.
Connection
PuTTY was used to connect to the IP address of the BBB, which by defaultfor an ethernet connection is 192.168.7.2. For wireless connection, the addressis set manually when setting up the wireless connection on the BBB.
To set up an ad hoc wireless connection on the BBB the network interface filehas to be modified slightly. Since this means the BBB will work as the routerit is also needs to be configured as a DHCP server to be able to assign an IPaddress to the ground station PC. When this is done the network should bevisible and possible to connect from the PC [21].
Some issues were found when trying to set up the ad hoc network. Firstly theBBB was not able to recognise the USB dongle if it was connected directlyto the USB port. But when connecting it through the USB hub it wasrecognised and since this solution also solved some other problems no furtherinvestigation was made. Other problems were such as more than one USBport will be needed in the future and that the USB dongle connected directlyto the USB port was not going to fit underneath the top cover and thereforerisked to get damaged.
Internet
To make things easier when updating software an internet connection wasestablished directly to the BBB following the steps below [22]. Both con-nection with USB cable as well as wireless connection was used during theproject.
1. Power the BBB with a USB cable connected to the computer thatshould share the internet connection.
• For wireless connection the BBB needs to be powered by eitherUSB cable or 2.1 mm barrel connector. Both the BBB and the
48

host computer should have a USB dongle connected.
2. In Control Panel → Network and Sharing Centre → Change adaptersettings enter the properties for network of the computer connected tothe internet. In the Sharing tab enable Allow other network users toconnect through this computer’s Internet connection.
3. In the properties for the LINUX USB Ethernet → Internet ProtocolVersion 4 (TCP/IPv4) all settings should be changed to obtain auto-matically.
• For wireless connection the properties for equivalent wireless con-nection should be changed in the same way.
4. Connect to the BBB using PuTTY and enter following
• sudo /sbin/route add default gw 192.168.7.1
• echo “nameserver 8.8.8.8” | sudo tee –a /etc/resolv.conf
Set date
When compiling a file on the BBB that has been edited on the outsideit is important the time for both systems are in sync. Since an internetconnection was established the easiest way to update the clock on the BBBwas by automatically update it from the internet using ntpdate [23]. Firstthe correct time zone was set.
1. Remove the current local time zone
• sudo rm /etc/localtime
2. Link to the correct local time zone, in this case Melbourne
• sudo ln -s /usr/share/zoneinfo/Australia/Melbourne /etc/localtime
Then ntpdate was installed.
Each time the BBB is restarted following command has to be executed toupdate the time.
• sudo /usr/bin/ntpdate –b –s –u au.pool.ntp.org
UART
To setup the serial ports so UART could be used the following procedure wasexecuted.
49

1. Download the four *.dtbo files from [24].
2. Add the user that will be using the ports to the dialout group.
Each time the BBB is restarted, enter the following
1. cd /sys/devices/bone capemgr.*
2. sudo bash –c “echo portname > slots” where portname is the filenamefor the port that should be used as UART without the –00A0 part.
50