Masters in Education by Research Thesis
215
Masters in Education by Research Thesis There is More Than One Way to Skin a Cat: An Exploration of Flexible Mental Multiplication Strategies with Pre-Service Teachers Peter Hall B.Sc., Dip. Ed., Dip. TAA., S/N: 9163559 Faculty of Education University of New England February, 2019. Supervisors: Dr Robert Whannell Assoc Prof Pep Serow
Transcript of Masters in Education by Research Thesis

Masters in Education by Research Thesis
There is More Than One Way to Skin a Cat:
An Exploration of Flexible Mental Multiplication
Strategies with Pre-Service Teachers
Peter Hall B.Sc., Dip. Ed., Dip. TAA., S/N: 9163559
Faculty of Education
University of New England
February, 2019.
Supervisors:
Dr Robert Whannell
Assoc Prof Pep Serow

2
Abstract
This research project investigates possible strategies that satisfy Australian and NSW
curriculum outcomes for the Year 5 topic of mental multiplication and teaching strategies
that use a flexible approach to mental multiplication that have the potential to enhance
student number sense. Two cohorts of pre-service teachers (n=36) at the University of New
England participated in the three phases of the project. The initial phase involved timed
testing of their mental multiplication skills and untimed reflection on strategy use for the
test questions. A questionnaire explored their attitudes towards, and knowledge of, mental
computation in this context. Participants were introduced to a range of possible mental
multiplication strategies and a teaching approach emphasising flexibility, adaptivity and
multiplicative thinking. The final phase of the project sought to measure changes in the
performance and attitudes of the participants who had taken part in the intervention. This
was contrasted with the results and opinions of those who had only been involved in the
testing and questionnaire components and not the intervention. The project uses a case study
design with a mixed methods approach.
The participants demonstrated a poor knowledge of, and performance in, mental
multiplication at the level required of Year 5 students. Considering that the majority had
experienced schooling in the last 20 years when curriculum planners had emphasised the
importance of mental computation skills, there was a distinct lack of knowledge of
appropriate strategies for this topic. The use of Hill, Ball and Schilling’s (2008)
Mathematical Knowledge for Teaching (MKT) framework identified deficits in the
participants’ knowledge of the topic and their preparedness to teach it. Whilst the
intervention was well received, its short duration meant that significant gains could not be
made in the participants’ own SCK. The data did show an increase in the range and
flexibility of the strategies used to solve mental multiplication problems and an
improvement in timed testing results. There was an attitudinal shift of the participants away
from a traditional algorithmic approach to the topic towards more flexible, number sensible
approaches.
The research is significant as it adds to the literature concerning mental multiplication
strategies and possible teaching programs in the later primary years. Whilst there is
considerable research concerning mental computation, it has focussed largely on the early

3
years of primary and, in particular, addition and subtraction. Studies of mental
multiplication with pre-service and practising teachers are less common as are specific
recommendations for appropriate strategies to include in teaching programs (Hartnett,
2007). Both the Australian and NESA outcomes and support documents are vague in this
area with few examples of actual strategy use for mental multiplication. It is hoped that this
study promotes further discussion of this topic leading to improved curriculum guidelines
and flexible teaching approaches.

4
Style
The style and format adopted in this thesis is that employed by the American Psychological
Association as recommended in their Publication Manual (American Psychological
Association, 2010). To assist with readability the font size of a number of the larger tables
and figures has been reduced. Table Captions are listed on one line to allow a list of tables
to be compiled.

5
Certification of Dissertation
I certify that the ideas, experimental work, results, analyses, software and conclusions
reported in this dissertation are entirely my own effort, except where otherwise
acknowledged. I also certify that the work is original and has not been previously submitted
for any other award, except where otherwise acknowledged.
19/2/2019
Signature of Candidate Date
ENDORSEMENT
19/2/2019
Signature of Supervisor Date
19/2/2019
Signature of Supervisor Date

6
Acknowledgements
This thesis could not have been completed without the help and support of my supervisors,
Dr Robert Whannell and Assoc Prof Pep Serow of the School of Education, University of
New England. I would particularly thank Dr Whannell for his attention to detail and for
enlightening me in the nuances of statistical significance. I am also grateful to Dr Schmude
and Dr Wodolko for allowing me to usurp some of their valuable lecture time for this
research. I would particularly thank the students from EDME145 and EDME369 for
agreeing to take part in this project.
As a visually impaired student, I acknowledge that assistance of the Disabilities Office of
UNE and the help given me by the staff of IT and the Library. I was also supported in this
endeavour through a grant from the Australian Commonwealth Government through the
award of an RTP Fee Offset Scholarship and through NDIA who funded assistive software
and hardware to assist in my studies.
I would also acknowledge the support of my family and, in particular, my wife Allison.
Without her unequivocal love, companionship and wise counsel, I could not have completed
this project.

7
Contents Abstract .................................................................................................................................... 2
Style ......................................................................................................................................... 4
Certification of Dissertation .................................................................................................... 5
Acknowledgements ................................................................................................................. 6
List of Figures ........................................................................................................................ 10
List of Tables ......................................................................................................................... 11
Glossary of Terms ................................................................................................................. 13
Chapter 1 – Introduction to Research .................................................................................... 17
1.1 Introduction .............................................................................................................. 17
1.2 Reasons for Research ................................................................................................ 17
1.3 The Research Problem .............................................................................................. 18
1.4 The Research Questions ........................................................................................... 19
1.5 The Significance and Innovation of the Research .................................................... 19
1.6 The Aims and Objectives of the Research ................................................................ 20
1.7 The Thesis Structure ................................................................................................. 20
1.8 Chapter Conclusion .................................................................................................. 22
Chapter 2 - Literature Review ............................................................................................... 23
2.1 Introduction .............................................................................................................. 23
2.2 National and international support for mental computation .................................... 23
2.3 Mental arithmetic, mental calculation and number sense ......................................... 26
2.4 The teaching of mental computation ....................................................................... 28
2.5 The Knowledge Required to Teach Mental Computation ....................................... 33
2.6 Mental Computation Strategies ................................................................................ 37
2.7 Pre-service Teachers’ Knowledge of Mental Computation and Number Sense ..... 42
2.8 Chapter Conclusions ................................................................................................. 45
Chapter 3 - The Research Project Methodology ................................................................... 47
3.1 Introduction .............................................................................................................. 47
3.2 Theoretical Framework ............................................................................................. 47
3.3 Research Paradigm ................................................................................................... 49
3.4 Research Design ....................................................................................................... 50

8
3.5 Research Methods ..................................................................................................... 51
3.6 Data Collection ......................................................................................................... 52
3.6.1 Participants ........................................................................................................ 52
3.6.2 Three Phase Model ............................................................................................ 52
3.6.3 Data Collection Instruments – Questionnaire 1 and 2 ....................................... 54
3.6.4 Data Collection Instruments – Tests 1 and 2 ..................................................... 56
3.6.5 Data Collection Instruments – Coding Sheets 1 and 2 ...................................... 58
3.6.6 The Intervention ................................................................................................ 60
3.7 Data Analysis ........................................................................................................... 60
3.7.1 Questionnaire 1 Analysis .................................................................................. 61
3.7.2 Mental Multiplication Assessment 1 ................................................................. 61
3.7.3 Coding Sheet 1 and Free Response Items (Questionnaire 1) ............................ 62
3.7.4 Questionnaire 2 Analysis .................................................................................. 64
3.7.5 Mental Multiplication Assessment 2 ................................................................. 64
3.7.6 Coding Sheet 2 and Free Response Items (Questionnaire 2) ............................ 64
3.8 Ethical Considerations .............................................................................................. 65
Chapter 4 - Data Collection and Analysis – Phase One ........................................................ 67
4.1 Introduction .............................................................................................................. 67
4.2 Data Collection ......................................................................................................... 67
4.3 Participant Demographics ........................................................................................ 68
4.4 Initial Test Results ................................................................................................... 72
4.5 Participant Confidence in the Use of Mental Multiplication Strategies ................... 76
4.6 Participant Competence in the Use of Mental Multiplication Strategies ................. 79
4.7 Knowledge of the Place of Mental Computation in the Curriculum ....................... 86
4.8 Knowledge of Content and Teaching ...................................................................... 87
4.9 Knowledge at the Mathematical Horizon ................................................................ 90
4.10 Common Content Knowledge ............................................................................... 92
4.11 Chapter Conclusions .............................................................................................. 93
Chapter 5 Phase 2 and 3: The Intervention and its Effect .................................................. 97
5.1 Introduction .............................................................................................................. 97
5.2 Participant Evaluation and Recommendations from Phase 2 .................................. 98
5.3 Comparisons of Participant Test Performance ...................................................... 103
5.4 Comparison of Strategy Use by Participants Completing Both Tests ................... 108
5.5 Changes in Participant Knowledge of Mental Computation ................................. 113

9
5.5.1 Introduction ..................................................................................................... 113
5.5.2 Changes in Participants’ Perceived SCK ........................................................ 113
5.5.3 Changes in Participants’ Perceived KCC ....................................................... 113
5.5.4 Changes in Participants’ Perceived KCT ....................................................... 114
5.5.5 Changes in Participants’ Perceived KMH ...................................................... 116
5.5.6 Changes in Participants’ Perceived CCK ....................................................... 117
5.6 Chapter Conclusions ............................................................................................... 117
Chapter 6 Thesis Summary, Conclusions and Implications for Practice ......................... 125
6.1 Introduction ............................................................................................................ 125
6.2 Conclusions ............................................................................................................ 126
6.2.1 Conclusion 1 .................................................................................................... 126
6.2.2 Conclusion 2 .................................................................................................... 129
6.2.3 Conclusion 3 .................................................................................................... 130
6.2.4 Conclusion 4 .................................................................................................... 132
6.2.5 Conclusion 5 .................................................................................................... 135
6.2.6 Conclusion 6 .................................................................................................... 135
6.2.7 Conclusion 7 .................................................................................................... 136
6.3 Implications for Practice ......................................................................................... 137
6.3.1 Implication 1 .................................................................................................... 137
6.3.2 Implication 2 .................................................................................................... 138
6.4 Limitations of the Research Project ........................................................................ 138
6.5 Recommendations for Future Studies ..................................................................... 140
6.6 Chapter Conclusion ................................................................................................ 141
References ........................................................................................................................... 143
Appendix 1 – Participant Information Sheet and Consent Form ......................................... 155
Appendix 2 - Test and Retest .............................................................................................. 160
Appendix 3 - Taxonomy of Mental Multiplication Strategies and Coding Sheets ............. 162
Appendix 4 - Questionaire 1 and 2 ...................................................................................... 165
Appendix 5 – Lecture Notes ................................................................................................ 176
Appendix 6 - Ethics Approval ............................................................................................. 199
Appendix 7 Excerpts From Relevant Curriculum Documents ............................................ 200

10
List of Figures Figure2.1Shulman’s(1986)DomainsofPedagogicalContentKnowledge.............................................................34Figure2.2MathematicalKnowledgeforTeaching(Hilletal.,2008p.377).............................................................35Figure2.3TheUseofArraystoIllustrateaCompensationStrategyfor45x24...................................................40Figure2.4MultiplicationStrategyUseinWhitacre’sStudy(2007,p.14).................................................................44Figure3.1.Mathematicalknowledgeforteaching.................................................................................................................47Figure4.1Participants’PerceivedAptitudeandEnjoymentofMathematicsatSchool(n=33)..................70Figure4.2DistributionofScores(outof15)inTest1(n=36)......................................................................................73Figure4.3Distributionofscores(outof15)inTest1byCourse..................................................................................74Figure4.4StrategiesSuggestedforTest1Questions..........................................................................................................79Figure4.5CorrectTestResponsestoQuestionsInvolvingTwo-digitxTwo-digitProblemsfromTimed
Test1(Q9–15),(n=36)....................................................................................................................................................................82Figure4.6ResponsestoKCCItems(n=33)...............................................................................................................................86Figure4.7ResponsestoKCTItemsfromQuestionnaire(n=33).................................................................................87Figure4.8ScatterPlotofResponsestoItems11and13(n=33)...................................................................................89Figure4.9ResponsestoItems20and21oftheQuestionnaire(n=33).....................................................................91Figure4.10CommonContentKnowledgeResponses.........................................................................................................92Figure5.1DistributionofTestScoresbyClassExpressedas%..................................................................................104Figure5.2StrategyUseofGroup3ParticipantsinthisStudy(n=7)..........................................................................121Figure5.3StrategyUseofParticipantsinWhitacre;s(2007)Study(n=13)..........................................................122Figure5.4StrategyUseofGroup2ParticipantsinthisStudy(n=15).......................................................................123Figure6.1StrategiesSuggestedforTest1Questions........................................................................................................127Figure6.2StrategyUseofGroup2ParticipantsinthisStudybyPercentage(n=15).......................................133Figure6.3StrategyUseofGroup3ParticipantsinthisStudybyPercentage(n=7)..........................................134

11
List of Tables Table2.1TaxonomyofMentalMultiplicationStrategiesforYear5...............................................................................41Table2.2MarkovitsandSowder’sTaxonomyComparedtoTable2.1...........................................................................42Table3.1ClassificationofQuestions8to21basedontheMKTFramework..............................................................55Table3.2DistributionofTestQuestionsbyCategory............................................................................................................57Table3.3CodingTaxonomywithExamples...............................................................................................................................59Table3.4ComparisonofWhitacre’sTaxonomyforMultiplicationStrategiesandtheTaxonomyUsedinThis
Study.............................................................................................................................................................................................................62Table4.1ParticipationintheVariousPhasesofDataCollection.....................................................................................68Table4.2HighestLevelofMathematicsStudiedatHighSchoolbyParticipants(n=33)......................................69Table4.3SpecialtyAreasofPre-ServiceTeachersEenrolledinEDME145andEDME369(n=36)...................69Table4.4ResponsestoItems6and7bycourse(n=33)......................................................................................................71Table4.5HSCCoursesStudiedatHighSchoolsplitbycohort(EDME145/EDME369)..........................................72Table4.6MeansandStandardDeviationsofTest1bycohort..........................................................................................74Table4.7Test1MeansBasedonCourseStudiedatHighSchool......................................................................................75Table4.8ResponsestoQuestions8to11(𝑛 = 33)...............................................................................................................76Table4.9GroupedPercentagesShowingDegreeofAgreementwithQuestions8to11Prompts.....................77Table4.10CorrelationMatrixforTest1andResponsestoItems8to11oftheQuestionnaire(n=33T1,
n=34Q’s8,9,10,11).............................................................................................................................................................................78Table4.11VarietyofStrategiesUsedbyEachParticipantinthe15TestQuestions...............................................81Table4.12CorrelationCoefficientMatrixforItems9to11ofQuestionnaire............................................................85Table4.13ResponsestoKCCItemsbyPercentage..................................................................................................................86Table4.14ResponsestoKCTGroupedbyPercentage(n=33)............................................................................................88Table4.15ComparisonBetweenKCTandSCKResponsestoQ11andQ13..................................................................88Table4.16ResponsestoKMHItemsExpressedasPercentages(n=33).........................................................................91Table4.17PercentageComparisonofItem15Responses...................................................................................................92Table5.1CombinedRatingsofTutorialandNotes(n=6)..................................................................................................99Table5.2ChoiceofStrategiesforaYear5Class(n=6).........................................................................................................99Table5.3ParticipantRatingsofIndividualStrategiesfromtheIntervention(n=6).............................................100Table5.4ParticipantRatingsofStrategiesinOrder............................................................................................................100Table5.5StrategiesParticipantsWouldUseasExtensionstoTheirProgram(n=7)............................................101Table5.6SuggestedDurationofInstructionforYear5(n=7).........................................................................................101Table5.7DistributionofTestQuestionsbyCategory..........................................................................................................105Table5.8TestStatisticsBasedonPhaseGroupings.............................................................................................................107Table5.9StrategySuggestionsofGroup2(n=15)................................................................................................................108Table5.10StrategySuggestionsofGroup2byCategory(n=15)...................................................................................109Table5.11StrategySuggestionsGroup3(n=8).....................................................................................................................109Table5.12StrategySuggestionsofGroup3byCategory(n=8)......................................................................................110

12
Table5.13VarietyofStrategiesUsedbyEachParticipantinthe15TestQuestions.............................................110Table5.14ComparisonofAlternateStrategySuggestionsBetweenTestsandGroups........................................111Table5.15ResponsestoItems10and11forBothQuestionnaires(𝑛 = 7)............................................................113Table5.16ResponsestoKCCItemsinBothQuestionnaires(n=7).................................................................................114Table5.17FrequencyofResponsestoKCTItemsinBothQuestionnaires(n=7).....................................................115Table5.18ComparisonBetweenKCTandSCKResponsestoItems10,11and13fromQuestionnaire2(n=7)
......................................................................................................................................................................................................................116Table5.19ResponsestoKMHItemsinBothQuestionnaires(n=7)...............................................................................116Table5.20ComparisonofItem15ResponsesBetweenQuestionnaires(n=7)..........................................................117Table5.21TestStatisticsBasedonPhaseGroupings...........................................................................................................119Table5.22ComparisonofWhitacre’sTaxonomyforMultiplicationStrategiesandtheTaxonomyUsedin
ThisStudy.................................................................................................................................................................................................121Table6.1MeansandStandardDeviationsofTest1bycohort........................................................................................126Table6.2StrategySuggestionsforTest1QuestionsbyCategory(n=36)...................................................................128Table6.3TestStatisticsBasedonPhaseGroupings.............................................................................................................132Table6.4ChoiceofStrategiesforanUngradedYear5(n=6)..........................................................................................136Table6.5ParticipantRatingsofStrategiesinOrder............................................................................................................136Table6.6SuggestedDurationofInstruction(n=7)...............................................................................................................137

13
Glossary of Terms General
ACARA Australian Curriculum, Assessment and Reporting Authority
ACMNA Australian Curriculum: Mathematics Number and Algebra`
AEC Australian Education Council
DfES Department for Education and Skills, UK
NDIA National Disability Insurance Agency
NESA NSW Education Standards Authority
PST Pre-service Teacher
Mental Multiplication Strategies
Code Descriptor Examples
BDF Basic or Derived Fact
5 x 8 = 40, 50 x 8 = 400, 50 x 80 = 4000
COU Counting – skip counting, doubling +/- 3 x 24 = 24+24+24 = 48+24 =72
3x24=2x24+24 = 48+24 = 72
BFS Basic Fact Shortcuts – shortcuts for
multipliers from 2 to 12, 15 and 20
x5 = ½ x 10
x8 = double, double, double
x9 = x10 – x1
x11 = x10 + x1
x12 = x10 + double
x15 = x10 + x5
LRS Left to Right Separated – using the
Distributive Law
7x23: 7x20=140, 7x3=21,
140+21=161
RLS Right to Left Separated – visualising the
formal algorithm
7x23: 7x3=21write 1 and carry 2,
7x2=14, 14+2=16. Answer=161
FAC Factors 6x32: 6=2x3, 32x3=96, 96x2=192
PAR Partitioning (Non-standard) 8 x 21 = 8x10+8x11 = 80 + 88 = 168
19x34 = 20x34 – 1x34 = 680 – 34 =
646
CMP Compensation 17x25 = 17x100 ÷ 4 = 425
15x24 = 30x12 = 360
CMB A Combination of the above strategies 21 x 23 = 11 x 23 + 10 x 23 (PAR)
= 253 (BFS) + 230 = 483

14
Strategies used in Whitacre’s (2007) Study
Code Descriptor Examples
AD Additive Distributive
8 x 21 = 8x10+8x11 = 80 + 88 = 168
AP Aliquot Parts 17x25 = 17x100 ÷ 4 = 425
DER Derived 21x23 = 21x22 + 1x21 = 21x2x11 + 21 =
462 + 21 = 483
FAC Factors 6x32: 6=2x3, 32x3=96, 96x2=192
MASA Mental Analogue of a
Standard Algorithm
7x23: 7x3=21write 1 and carry 2, 7x2=14,
14+2=16. Answer=161
PP Partial Products 21x23 = 20x20 + 20x3 + 1 x 20 + 1x3
SD Subtrcative Distributive 19x34 = 20x34 – 1x34 = 680 – 34 = 646
Addition and Subtraction Strategies
Code Descriptor Examples
1010 Splitting both numbers into tens and ones
and dealing with the parts separately
19 + 23 = 10 + 20 + 9 + 3
N10 Splitting one number into tens and ones and
adding to the other number
19 + 23 = 19 + 20 + 3
A10 One number is split to bridge to a multiple
of ten and then the remainder is added
23 + 12 = 23 + 7 + 5 = 30
+ 5
N10C One number is rounded up or down to a
multiple of ten then added. An adjustment
for the rounding is then made
19 + 23 = 20 + 23 - 1
Acronyms for Hill, Ball and Schilling’s (2008) Framework
MKT Mathematical Knowledge for Teaching
SMK Subject Matter Knowledge, which is subdivided into:
CCK Common Content Knowledge – knowledge in common with other
professions

15
SCK Specialised Content Knowledge – knowledge particular to mathematics,
solutions, rules and procedures
KMH Knowledge at the Mathematical Horizon – how that topic fits with other
topics, strands and the program of learning
PCK Pedagogical Content Knowledge, which is subdivided into:
KCS Knowledge of Content and Students – what motivates students, conceptions
and misconceptions, where their ideas fit in a topic, what is difficult or easy
KCT Knowledge of Content and Teaching – the sequencing, examples and
explanations used to teach a topic
KCC Knowledge of Content and Curriculum – the strands, outcomes and
recommendations of the curriculum.
Definitions of Terms
Adaptivity the selection of the most appropriate strategy for a particular problem
Algorithm a process or set of rules to be followed to complete a calculation. Algorithms
may be formal – a common recognition of a procedure for completing a
calculation; or informal – one of many procedures that complete a
calculation.
Aliquot parts a quantity which can be divided into another a whole number of times e.g. 25
is an aliquot part of 100.
Approximation a value or quantity than is nearly but not exactly correct
Automaticity an ability to recall facts accurately without occupying working memory with
the required calculation
Distributive Law the law relating the operations of multiplication and addition, stated
symbolically, a(b + c) = ab + ac; that is, the monomial factor a is distributed,
or separately applied, to each term of the binomial factor b + c, resulting in
the product ab + ac.
Estimation an approximate calculation of the value of a numerical operation
Fluency the ability to choose appropriate procedures; carry out procedures flexibly,
accurately, efficiently and appropriately; and recall factual knowledge and
concepts readily.
Flexibility the use of a variety of strategies
Mental arithmetic the recall of basic number facts learnt through drill and practice

16
Mental computation the ability to calculate exact numerical answers without the aid of
external devices
Multiplicative thinking: an awareness of the relationship between multiplying and
dividing, factors and multiples, times bigger and smaller, the use of materials
and arrays for modeling products and the effect of multiplying and dividing
by powers of ten
Number sense general understanding of number and operations along with the ability and
inclination to use this understanding in flexible ways to make mathematical
judgments and to develop useful and efficient strategies for managing
numerical situations

17
Chapter 1 – Introduction to Research
1.1 Introduction
Mark Twain used the phrase: ‘there’s more than one way to skin a cat’ in his 1889 novel, ‘A
Connecticut Yankee in King Arthur’s Court’. The phrase was in common use, at that time,
in the southern states of the US and suggested that there was more than one way to solve a
particular problem. The ‘cat’ referred to the local catfish that had to be skinned prior to
cooking and not some bizarre southern ritual with felines. The premise of looking for
alternate methods of solution is at the very heart of this research project. All too often,
educators see Mathematics as a lock-step discipline with only one correct method leading to
one correct answer. Students are done a great disservice if they are not given the necessary
skills to explore alternate pathways to solutions and evaluate the effectiveness of these
alternatives. The twin concepts of flexibility and adaptivity in strategy choice (Verschaffel,
Luwel, Torbeyns & Van Doren, 2009) are at the very heart of this project.
This research project takes the concept of mental multiplication by one- and two-digit
numbers and explores it in depth to show that there may be alternative strategies that
warrant inclusion in current primary school mathematics curricula. Initial research
demonstrated that the methods recommended for mental multiplication in the Australian and
complementary NSW Education Standards Authority (NESA, 2015) curriculum documents
may not always be the best pathway to a solution and there may be other strategies and
algorithms that warrant inclusion in curriculum planning.
1.2 Reasons for Research
An interest in this topic stems from the candidate’s extensive experience with teaching
Mathematics to primary and secondary students in NSW schools and a particular interest in
mental multiplication. Experience with the delivery of professional development activities
for primary school and pre-service teachers has also led to concerns relating to the specific
content knowledge of both groups in relation to mental multiplication and their attitudes
towards its importance in the curriculum.

18
These reflections, coupled with anecdotal evidence from the classroom, resulted in the
candidate researching alternate ways of teaching mental multiplication with a problem
solving emphasis that builds on student-developed strategies and enhances number sense.
There also appears to be a significant deficit in the range of mental multiplication strategies
that are mentioned in either the Australian (2012) or NSW (NESA, 2015) curriculum
documents for this Year 5 outcome The mental multiplication strategies mentioned are
limited to left-to-right multiplication (highest powers of ten first), use of the Distributive
Law, partitioning and factors. Although the formal algorithm is mentioned, it would not be
regarded by researchers as a strategy appropriate for mental multiplication (Clark, 2005).
Examples of how these strategies may be applied are also limited as is any guidance in the
order of teaching the varied written, mental and digital competencies required by the
outcome.
These initial observations have resulted in the formulation of the research problem.
1.3 The Research Problem
There is a need for teachers and pre-service teachers to understand the relevance of mental
computation to students’ number sense as well as strategies for teaching mental
multiplication as a problem solving exercise. As Hartnett (2007) points out, the present
generation of primary teachers, usually experienced traditional algorithmic procedures in
their own education and have little knowledge of mental computation strategies. Although
many can see the benefits of including mental computation strategies in their programs they
lack the confidence, ideas and knowledge to proceed.
Hence the decision to conduct pilot research in the specific area of Year 5 (NESA, 2015)
mental multiplication with two cohorts of pre-service teachers at the University of New
England. This involved an initial assessment of their prior knowledge of the topic using
Hill, Ball and Schilling’s (2008) framework of Mathematical Knowledge for Teaching
(MKT). This was followed by intervention and analysis of changes in participants’
knowledge through testing and questionnaire.

19
As the research literature suggests, the project includes opportunities to enhance
participants’ flexible and adaptive solutions to mental multiplication problems. The
extensive use of the Distributive Law in non-standard partitioning also focuses on
developing participants’ multiplicative thinking. A taxonomy of mental multiplication
strategies was developed by the researcher from strategies suggested by the research
literature. This was trialled with the pre-service teachers resulting in their recommendations
for a teaching program for the Year 5 topic of mental multiplication. The final outcome of
the project is a set of recommendations for future curriculum planning in the area of mental
multiplication.
1.4 The Research Questions
The following research questions were formulated for investigation within a pre-service
teaching program:
1. What was the prior knowledge of mental multiplication displayed by pre-service
teachers?
2. How did this change following exposure to strategies suggested in the research
literature and presented through the intervention?
3. What strategies do pre-service teachers propose for a teaching program that
addresses the mental multiplication component of the Year 5 Australian Curriculum
outcome ACMNA100 and its NSW counterpart?
4. What implications for practice are suggested by the study for possible inclusion in
curriculum documentation?
1.5 The Significance and Innovation of the Research
The project will be significant as it will allow for the publication of this thesis and
subsequent journal articles addressing gaps in the academic literature relating to:
• the content knowledge of mental multiplication that a particular cohort of pre-
service teachers exhibit prior to intervention;
• changes in pedagogical content knowledge post intervention; and
20
• what pre-service teachers consequently value as mental multiplication strategies in
their own teaching program for this topic.
In addition, it will provide a valuable resource for primary school teachers by presenting a
teaching approach to mental multiplication that focuses on flexibility and adaptivity in a
way that changes simple calculations into problem solving activities (Trafton & Thiessen,
2004). The extensive use of the Distributive Law through partitioning also enhances
multiplicative thinking in students and encourages number sensible solutions to problems.
The project will identify mental multiplication strategies not currently included in
curriculum documents and make recommendations concerning the accompanying notes and
examples in curriculum documentation.
1.6 The Aims and Objectives of the Research
The primary aim of the research is to investigate strategies for mental multiplication,
particularly by one- and two-digit numbers and trial these with a group of pre-service
teachers. As mentioned, the approach chosen should also have the capacity to enhance
students’ flexible and adaptive use of number sensible strategies to solve mental
multiplication problems.
The objectives of the research are to provide an insight into the prior knowledge of pre-
service teachers in relation to mental multiplication and determine their acceptance of a
suggested teaching strategy for this topic. The resultant thesis should also inspire further
journal articles and conference presentations. The project may also result in
recommendations to curriculum planners in the form of specific strategies to include,
examples to clarify existing strategies and notes on the order of teaching this Year 5 topic.
1.7 The Thesis Structure
This research is reported over six chapters. This chapter has outlined the context of the
study and described the research problem and related research questions that will be
addressed by the study. Its significance to educational practice in the area of mental
computation has been described, as have the overall aims and objectives of the project.
Chapter 2 will provide a summary of the research literature concerning mental computation

21
and number sense and some of the “big ideas” (Hurst, 2015) that relate to these topics. It
begins with an outline of the importance of mental computation in curriculum planning
documents with particular reference to the current Australian curriculum (ACARA, 2012)
and its NSW counterpart (NESA, 2015). The relationships between mental computation,
mental arithmetic and number sense are examined and definitions provided in the research
literature will be described. The development of teaching approaches to the topic in the last
three decades is considered as are the current trends in research that include multiplicative
thinking, flexibility and adaptivity and number sensible strategies for mental computation.
The specific knowledge required to teach the topic is related to established frameworks for
the mathematical knowledge required for teaching. Particular reference is made to studies
involving pre-service teachers and their knowledge of number sense, mental computation
techniques and their beliefs and attitude towards mathematics. The chapter also includes a
summary of mental computation strategies proposed by various researchers and a proposed
taxonomy for mental multiplication strategies.
Chapter 3 outlines the research paradigm, theoretical framework, research design and
methodology. This study is an explanatory case study (Yin, 2015) using a mixed methods
approach involving predominately quantitative data supported by qualitative, free response
questions. Data collection instruments and data analysis are also outlined in this chapter.
Finally, ethical considerations are mentioned.
Chapter 4 involves analysis of the data collected during Phase 1 of the project. The data
collection instruments used include a timed test of 15 mental multiplication questions, an
untimed test coding sheet where the participants suggest possible strategies for the test
questions and a questionnaire. One section of the questionnaire allows them to expand on
their knowledge of mental multiplication strategies through four questions repeated from the
initial test. The questionnaire is designed to provide information concerning the
participants’ knowledge of mental multiplication using five of the six strands of the MKT
framework. Test results are analysed and compared by cohort and correlated with items
from the questionnaire when significant.
Chapter 5 continues the data analysis, looking at the Test 2 results in relation to Test 1
results and the two groupings resulting from attendance at the intervention. Strategy use is
compared between tests and between the same two groups. This is also related to Whitacre’s

22
(2007) study of mental multiplication strategy use with PSTs. The questionnaire is used to
identify any changes to the knowledge and attitudes of participants who were involved in all
three phases of the project.
Chapter 6 relates the data analysis of the two previous chapters to the research problem and
questions. Specific conclusions and implications for practice are made in relation to the
research questions. The chapter also considers the limitations of the project and makes
recommendations for possible changes for future researchers in this area. Opportunities for
future research are also considered.
1.8 Chapter Conclusion
This project investigates possible strategies that satisfy Australian and NSW curriculum
documents for Year 5 mental multiplication and teaching strategies that use mental
multiplication as a problem solving exercise that has the potential to enhance students’
number sense, multiplicative thinking and knowledge of flexible and adaptive approaches to
mental multiplication. The research problem and associated questions outline a focus for the
research that is pursued through the remaining five chapters of this study.
It is expected that recommendations will be made for the possible inclusion of some of these
mental multiplication strategies in the present Australian curriculum based upon the trial
with two cohorts of pre-service teachers at the University of New England. The results of
this trial will be analysed and reported through conference papers and peer referenced
journal articles and suggestions for future research will be outlined.

23
Chapter 2 - Literature Review 2.1 Introduction
This chapter presents a review of literature concerning mental computation, its strategies
and algorithms and studies concerning the teaching of mental calculation skills and number
sense. Studies of various mental computation strategies and algorithms lead naturally
towards a taxonomy of these, followed by research involving the best ways to introduce
these strategies to students and the benefits derived from them developing skills in mental
calculation. There is also discussion of teacher and pre-service teacher conceptions and
knowledge of mental computation and number sense. Recent research foci of flexible and
adaptive use of number sensible strategies that enhance multiplicative thinking in students
are also reported.
Mental computation is viewed as an important life skill for adults. Northcote and McIntosh
(1999) found that adults used mental computation for over three quarters of calculations
involved in their everyday lives. Written calculations and calculator use was responsible for
less than 15% of these calculations. This was reinforced in a more recent Australian study
by Northcote and Marshall (2016) who found that the adults in their survey predominantly
used mental calculations in 86% of daily calculations reported. Written methods only
featured in 10% of calculations and calculator and phone use were rarely reported.
One consequence of this research is the realisation that mental calculation involves much
more than the basic recall of number facts. Adults regularly complete accurate mental
calculations and estimations that involve two and three-digit numbers, fractions, decimals
and percentages. As a result, a number of local and overseas curriculum documents have
shown increasing support for mental computation because of its perceived value as a future
life skill for adults and for its contribution to number sense.
2.2 National and international support for mental computation
Those national and international documents that have shown increased support for mental
computation to have a higher profile in their mathematics curricula, include the Netherlands

24
(Treffers & DeMoor, 1990), the United States Principles and Standards for School
Mathematics (National Council of Teachers of Mathematics, 2000), the United Kingdom
Primary Framework for Literacy and Mathematics (DfES, 2007), and the National
Statement on Mathematics for Australian Schools (Australian Education Council, 1991).
The AEC suggested that students
should regard mental arithmetic as a first resort in many situations where a calculation
is needed. Strategies associated with mental computation should be developed
explicitly throughout the schooling years, and should not be restricted to the recall of
basic facts (p. 109).
This was supported strongly in the current Australian Curriculum (ACARA, 2012) with
many references to mental computation. For example, the outcome ACMNA100 (v8.3 F-10
Mathematics) is a Year 5 Mathematics outcome that asks students to:
Solve problems involving multiplication of large numbers by one- or two-digit
numbers using efficient mental, written strategies and appropriate digital technologies.
The wording of this outcome and its accompanying notes, like all elements of the Australian
Curriculum, gives State bodies and teachers the freedom to choose the combination of
strategies that they feel best achieve the outcome. Of those mentioned, partitioning and the
use of the Distributive Law are the only ones that relate to mental multiplication (see
Appendix 7).
The NESA K-10 Mathematics Curriculum (2015) interprets this outcome through its
omnibus outcome MA 3-6 NA. It suggests that to achieve the outcome the student:
Selects and applies appropriate strategies for multiplication and division, and applies
the order of operation to calculations involving more than one operation.
This is further delineated in the Content section of Multiplication and Division 1 (see
Appendix 7), which suggests the use of standard partitioning (working left to right), the
formal algorithm for single digit multipliers (working right to left) and factorization for
mental multiplications.

25
Background Information to this outcome (see Appendix 7) adds one new strategy of basic
fact shortcuts to the mental multiplication repertoire, although the suggestion to “memorise
multiples of 11, 12, 15, 20 and 25” is contrary to research literature (Menon, 2003, Whitacre,
2007) which suggests techniques for calculating these multiples based the Distributive Law
and Aliquot parts.
The National Numeracy Learning Progression (NESA, 2018) through its sub-element,
Multiplicative Strategies (see Appendix 7) suggests using the strategies of factorization,
standard partitioning (left to right) and basic fact shortcuts (x8 is double x4) for mental
multiplication. A later section of this chapter relates these suggestions to others suggested in
the research literature.
Analysis of both the ACARA and NESA documents mentioned above suggests that teachers
in NSW schools would be expected to place a greater emphasis on the formal algorithm
than originally implied in the ACARA outcomes and supporting information. There is also
little reference in the NESA syllabus concerning the use of partitioning and the Distributive
Law other than standard partitioning from left to right or right to left through the short form
of the formal algorithm. Both ACARA and NESA documents provide little guidance
relating to the order and sequence of teaching this outcome and do not explicitly
discriminate between mental and written strategies.
The Australian Curriculum: Mathematics (ACARA, 2012) also suggests, through its
Proficiency Strands (see Appendix 7), that there should be a focus on developing
increasingly sophisticated and refined skills of mathematical understanding, fluency,
reasoning and problem solving. Fluency is not defined solely as the recall of basic facts and
procedures but extends to the choice of appropriate strategies that are then applied flexibly,
accurately and efficiently to arrive at robust solutions to problems and computations. This
fits well with the concepts of flexibility and adaptivity mentioned later in this chapter.
The NESA Mathematics syllabus also has a central theme of Working Mathematically (see
Appendix 7) that translates into specific outcomes for each Stage. Like the ACARA
proficiencies, these outcomes relate to the progressive development of mathematical
understanding and fluency through inquiry, exploring and connecting mathematical
concepts, choosing and applying problem-solving skills and mathematical techniques,

26
communication and reasoning. The definition of fluency uses identical language to that used
in the ACARA proficiencies.
2.3 Mental arithmetic, mental calculation and number sense
The historical development of concepts in this area initially defined mental computation as
the ability to calculate exact numerical answers without the aid of external devices (Reys,
Reys & Hope, 1993; Sowder, 1988). Exact answers refer to the difference between mental
calculation and estimation and approximation, both of which are facilitated by strong mental
calculation skills (Reys, 1984). Trafton (1978) further suggests that mental calculation may
involve the use of non-traditional algorithms and strategies, thus implying that there are
specific strategies for mental computation that are different from traditional pen and paper
algorithms.
Threlfall (2002) states that these strategies occur “where students can be correct by
constructing a sequence of transformations of a number problem to arrive at a solution as
opposed to just knowing, simply counting or making a mental representation of a ‘paper and
pencil’ method” (p. 30). The concept of ‘ a sequence of transformations’ used to arrive at a
solution suggests that mental computation is much more than familiarity with basic number
facts. It implies a higher order thinking skill (Reys & Nohda, 1994) involving choices for
the student between viable pathways, all of which lead to an exact solution of the problem
being investigated. Similarly, Reys, Reys and Barger (1994) describe mental computation as
a “vehicle for promoting thinking, conjecturing, and generalizing based on conceptual
understanding rather than as a set of skills that serve as an end of instruction” (p. 31). This
mirrors the concept of fluency as defined in the Australian Curriculum Proficiency Strands
and outlined in the previous section.
This is far removed from the behaviourist conception of mental arithmetic as the drill and
practice of basic number facts until recall is automatic (Shoenfeld, 2011). This concept of
‘errorless learning’ (Resnick, 1983, p. 7) still persists today in the form of programmed
instruction and is best evidenced through Kumon Maths (Russell, 1996) and similar
commercial and electronic tutoring packages. McIntosh (1995) reported a study by Biggs
(1967) involving 5000 UK students who experienced regular practice of basic facts. Biggs
found that their proficiency in mental arithmetic bore no relationship to the extent of regular

27
practice. In fact, practising basic facts under time constraints tended to increase number
anxiety in students.
The recall of basic number facts does, however, have an important part to play in mental
calculation. Automaticity with basic number facts, particularly using varied formats of
presentation, is still a valued goal for students. Cowan, Donlan, Shepherd, Cole-Fletcher,
Saxton, and Hurry (2011) comment that research shows that competence with basic number
facts covaries with achievement in mathematics. They explain that having basic fact
solutions stored in long term memory frees working memory for more sophisticated
calculations, particularly involving larger numbers. Wong and Evans (2007) also make the
point that the absence of automaticity may cause learning to stall while the student searches
for the required fact. Rote recall of basic facts, however, should not be confused with mental
computation.
Heirdsfield and Cooper (2002) showed that efficient mental computation involved much
more than the recall of basic number facts. Students proficient in mental computation had
integrated understanding of number facts that allowed them to select between appropriate
strategies depending on the number combinations in problems. “These proficient students
also exhibited some metacognitive strategies and beliefs, and affects (e.g., beliefs about self
and teaching) that supported their mental computation.” (p. 45) Similarly, Barody (2006)
argued that proficiency in mental calculation involved the use of efficient strategies to
accurately solve problems rather than simple recall of basic facts. He found that this was
dependent on students’ number sense involving an understanding of number operations,
patterns and principles. Heirdsfield, Cooper, Mulligan and Irons (1999) recommended that
the teaching of mental computation should focus on number understanding, principles of
numbers and operations, and effects of operations on numbers; and encourage variety in the
use of number sensible strategies (p. 92)
Number sense is described by McIntosh, Reys, Reys, Bana, and Farrell (1997, p. 324) as a
student’s “general understanding of number and operations along with the ability and
inclination to use this understanding in flexible ways to make mathematical judgments and
to develop useful and efficient strategies for managing numerical situations”. McIntosh,
Reys and Reys (1992) developed a number sense framework based on six strands, one of
which was computing and counting strategies. Hence, mental computation is an important
subset of number sense. Research suggests that it not only relies on number sense, but, that

28
it can also make an important contribution to the development of number sense, As Hartnett
(2007) points out, “needing number sense for efficient use of computation strategies, and
the development of number sense by using such strategies, are very closely interrelated” (p.
346). This is also supported by the National Numeracy Learning Progression (NESA, 2018)
that sees Multiplicative Strategies as a sub-element of Number Sense and Algebra.
To achieve this contribution to number sense, research suggests that it is necessary to
develop proficiency in mental computation through the acquisition of self-developed or
spontaneous strategies rather than memorisation of number facts and procedures associated
with mental arithmetic (Kamii, Lewis, & Livingston, 1993; McIntosh, De Nardi & Swan,
1994; Reys & Barger, 1994). This implies a reduction of emphasis on written algorithms, a
growth in instruction time spent on arithmetical properties and alternative computational
strategies, and a change to more child-centred and flexible approaches to teaching
operations. Hence, much of the research in the last 30 years has focused on these twin
concepts of mental computation and number sense with a strong recommendation for
constructivist approaches in the classroom that utilize more effective and creative
approaches (McIntosh, 1995).
2.4 The teaching of mental computation
Early research into the teaching of mental computation strongly supported the transition to
student-developed strategies and student-centred teaching. The initial problem, however,
was a lack of research data on general levels of competency in mental computation, the
types of problems that students would attempt mentally and the nature of strategies used.
Reys, Reys and Hope (1993) conducted a longitudinal study of three school grades across
two school districts (Texas, USA and Saskatchewan, Canada) testing twice in the year with
timed items delivered with a mix of verbal and visual presentation. The results indicated a
‘dismal’ level of performance and prompted the comment that progress in mental
computation performance was dependent both on teachers recognising its importance and
allocating time for students to develop their own computational alternatives based on their
own mathematical knowledge. (p.314)
Their recommendations for flexible thinking that results from learner-centred techniques led
to follow-up studies by Bell, Balfanz, Carroll, Hartfield, McBride and Saecker (1999) and
Carroll (1996) that compared the performance of students experiencing the US Reform

29
curriculum, ‘Everyday Maths’, with Reys’ sample. Students doing the Reform Curriculum
had been encouraged to invent and discuss their own solutions to mental problems in a
constructivist classroom atmosphere. They also experienced traditional algorithms as per
curriculum requirements. Both studies showed a marked improvement in performance of
mental computation without any drop in competency for pen and paper algorithms.
Given evidence of poor performance in mental computation by cohorts experiencing
traditional teaching methods and formal algorithms, the historical research took two
directions. The first involved a focus on student-developed, intuitive strategies involving
the use of concrete materials and concepts and teacher facilitation (Carroll, 1997;
Heirdsfield, 2002, 2003), while the second considered teacher-led introduction of efficient
strategies that supported and streamlined student efforts and still involved classroom
discussion (Belshuizen, 2001; Threlfall, 2002).
Carroll (1997) supported the first approach and reported on the types and the range of
student-developed strategies in the younger years, particularly in addition and subtraction.
He commented that “whilst students did not always use the most efficient strategy the
strength of their number sense seems to have been enhanced by allowing them to use their
own strategies” (p. 96). Belshuizen (2001), however, was concerned that an incomplete set
of strategies may lead to efficient strategies not being available for use because they had not
been taught. Anghileri (1989) and Mulligan and Mitchelmore (1997) produced evidence that,
even though multiplication and division were harder concepts, students were still able to
produce their own strategies for one- and two-digit multiplication and division problems.
Clarke (2001) commented that “occasionally, teachers claim that, ‘only the brighter children
can create their own algorithms’. Those involved in projects that encourage children to
create their own algorithms dispute this, but even if it were true, the encouragement for
children to do so will likely yield a range of algorithms. These can be shared publicly and
discussed, and children who are unable to create a written method of their own will at least
have a range of options from which to choose for their own use” (p. 96).
Heirdsfield, Cooper, Mulligan and Irons (1999) summarised the early research in this area,
identifying the following points:

30
• Children should be encouraged to invent their own computational procedures, as
they develop better understanding of the effects of operations on number, and place
value.
• If computational strategies are introduced by teachers, they should build on student-
developed strategies.
• Children can better take responsibility for their own learning through being allowed
to investigate their own solution strategies to problems.
• Number sense is enhanced by students developing their own computation strategies.
• Whatever the teaching approach, time should be spent on students describing and
discussing various solution strategies for problems.
• Student-developed strategies should be valued equally for the understanding
displayed as well as the misconceptions. (p. 96)
Another common theme in research documents has been the conviction that formal pen and
paper algorithms should not be taught until students had thoroughly experienced developing
their own solution strategies. Narode, Board and Davenport (1993) summarised their
findings:
We believe that by encouraging students to use only one method (algorithmic) to solve
problems, they lose some of their capacity for flexible and creative thought. They
become less willing to attempt problems in alternative ways, and they become afraid to
take risks. Furthermore, there is a high probability that the students will lose conceptual
knowledge in the process of gaining procedural knowledge (p. 260).
Similarly, Carpenter and Moser (1982) found that once children learned formal arithmetic
procedures they stopped analysing the addition and subtraction problems they had
previously been able to solve. Clark (2001) believes “that there is no place for formally
introducing conventional algorithms to children in the first five years of school” (p. 96). The
2002 NSW Board of Studies Curriculum Notes seemed to support this opinion when it
stated that “formal written algorithms are introduced after students have gained a firm
understanding of basic concepts including place value, and have developed mental strategies
for computing with two-digit and three- digit numbers”. (BOS, 2002, p. 9)
Despite this, and similar warnings from curriculum planners, Verschaffel, Greer and De
Corte ( (2007) found that while most researchers advocated for students in later years of

31
primary to be exposed to both mental and written strategies, an inordinate amount of time
was still spent practising traditional algorithms. Gravemeijer, van Galen, Boswinkel and van
den Heuvel-Panhuizen (2011) went further by suggesting that formal algorithms could be
replaced by student-developed semi-informal routines “provided they are grounded in well-
developed number sense” (p. 126). They argued that if appropriate problem models are used
that suit informal routines then students can develop flexible pathways to the solution.
These informal routines can later be developed into conventional algorithms if needed. This
would seem to be supported in the current Curriculum Notes from the NESA (2015) K – 10
syllabus which states that “students may find recording (writing out) informal mental
strategies to be more efficient than using formal written algorithms, particularly in the case
of multiplication” (NESAm 2015 Background Information to Mathematics and Division 1,
para 2)
An example of an informal routine, provided by Gravemeijer et al. (2011, p133), is a ratio
table that can then be linked to the formal algorithm.
Example: Consider 152 x 242. This results in the ratio table below.
1 2 50 100 152
242 484 12100 24200 36784
This can then be used to model the formal algorithm as shown below.
242 x
152
484
12100
24200
36784
Trafton and Thiessen (2004) argue that rather than seeing computation as a set of rules and
procedures to be learnt and remembered, it needs to be approached as a problem solving
activity. If students are encouraged to make decisions about a problem and choose from a
diverse range of alternate strategies, then simple calculations can become problems.

32
Threlfall (2002) advocated the need for teaching that fostered flexibility and choice. He
maintained that, for flexibility in mental calculation, a deep understanding of number and
operation relationships and knowledge of basic facts and fact families was required. This
concept is central to this research project as are the associated concepts of flexibility and
adaptivity – a focus of recent research in this field.
Verschaffel, Luwel, Torbeyns and Van Doren (2009) distinguish between these terms,
defining flexibility as the use of a variety of strategies and adaptivity as the selection of the
most appropriate strategy for a particular problem. Flexibility is encouraged by the
establishment of inquiry-based classroom cultures wherein students discuss whether a
strategy is reasonable, identify its weaknesses and then further strengthen their arguments
by considering input from others. Boaler (2015) reinforces this view by stating, “the core of
mathematics is reasoning - thinking through why methods make sense and talking about
reasons for the use of different methods” (p. 4).
In the particular area of multiplication and division, recent research has focused on the
concept of multiplicative thinking. Hurst and Hurrell (2015, 2016) see the component parts
of multiplicative thinking as an awareness of the relationship between multiplying and
dividing, factors and multiples, times bigger and smaller, the use of materials for modeling
problems and the effect of multiplying and dividing by powers of ten. Siemon, Bleckley and
Neal (2012) maintain that multiplicative thinking underpins important concepts of ratio and
proportion, fractions and algebraic thinking and is one of the ‘big ideas’ in mathematics
education. This has bearing on this project as multiplicative thinking deals with working
flexibly with a wide range of numbers and solving multiplication (and/or division) problems
then reporting the solutions in different ways. The intervention in this project sought ways
that students could be flexible in their solution strategies and find alternate ways to
represent their solutions. Proponents of multiplicative thinking have also suggested the
importance of students’ understanding and use of the Distributive Law and this was central
to the strategies used in this project. Hurst and Hurrell (2017) described the distributive
property as “a critically important understanding that numbers can be partitioned to make
operating with them easier” (p. 28).
Whilst the focus on flexibility, adaptivity and multiplicative thinking has been applauded,
progress has been dependent on teachers’ beliefs and their specific content and pedagogical

33
knowledge of computation. The next section deals with the knowledge required for teaching
with particular reference to primary mathematics.
2.5 The Knowledge Required to Teach Mental Computation
As Hartnett (2007) points out, the present generation of primary teachers usually
experienced traditional algorithmic procedures in their own education and have little
knowledge of mental computation strategies. Although many can see the benefits of
including mental computation strategies in their programs they lack the confidence, ideas
and knowledge to proceed. This is particularly true when faced with harder computations
involving multi-digit numbers (Verschaffel, Greer & De Corte, 2007).
Menon (2009) speaks of the three phases of mathematical subject knowledge: traditional,
pedagogical and reflective. Teachers in the traditional phase rely on subject knowledge
encountered when they were students and pre-service teachers. This is modified by
experience with learners into the pedagogical phase where teaching approaches are
modified by individual learner needs. The final phase of reflective subject knowledge sees
teachers reflect on the actual subject matter through experiences of different teaching
approaches. These three phases fit well with Hartnett’s (2007) work with practicing teachers.
She found that when working with teachers who acknowledged the need for a change of
emphasis to mental computation there was a range of questions that needed answering.
Questions such as the sequence of teaching, best teaching approaches, a taxonomy of
strategies with clear examples, and appropriate resources were vital before progress in the
classroom could occur and teachers could move from a traditional to a pedagogical phase.
Hill, Rowan and Ball (2005) demonstrated through parallel testing of teacher knowledge
and student achievement in standardized tests that “teachers’ performance on (our)
knowledge for teaching questions—including both common and specialized content
knowledge—significantly predicted the size of student gain scores [in their testing]” (p. 44).
The authors argued that teachers needed a greater depth of understanding that went beyond
the pedagogical questions of Hartnett’s sample. They illustrated this through the formal
algorithm for multiplication showing that mere knowledge of the strategy was not enough
for teaching. Teachers needed to be able to explain it in a number of ways (partial products
and arrays) suited to individual learner needs and questions and then needed to understand

34
students’ incorrect attempts at using the algorithm. These conclusions reinforced similar
statements from the US Conference Board of the Mathematical Sciences (2001):
Although almost all teachers remember traditional computation algorithms, their
mathematical knowledge in this domain generally does not extend much
further. ... In fact, in order to interpret and assess the reasoning of children
learning to perform arithmetic operations, teachers must be able to call upon a
richly integrated understanding of operations, place value, and computation in
the domains of whole numbers, integers, and rationals. (p. 58)
As Sullivan (2008) has pointed out, it is not just a question of knowledge of mathematics,
but also one of knowledge for teaching mathematics and knowledge of pedagogy. This is
not a new area of research. In his seminal work of 1986, Shulman proposed that there was a
“special amalgam of content and pedagogy that is uniquely the province of teachers, their
own special form of professional understanding” (Shulman, 1986, p. 8). He saw this as an
intersection of Content Knowledge, Pedagogical Knowledge and Contextual Knowledge
combining knowledge of subject matter, ways of teaching that topic and knowledge of the
conceptions, preconceptions and misconceptions that learners of different ages bring to the
classroom (Shulman, 1986, p. 9). Figure 2.1 models these three domains of teacher
knowledge.
Figure 2.1 Shulman’s (1986) Domains of Pedagogical Content Knowledge
Shulman (1987, p. 8) expanded his initial model of teacher knowledge to include seven
categories:

35
• Content knowledge
• General pedagogical knowledge – strategies of classroom management and
organization
• Curriculum knowledge – materials and programs that serve as tools of the trade
• Pedagogical content knowledge
• Knowledge of learners and their characteristics
• Knowledge of educational contexts from the classroom, to the governance of school
districts, of communities and cultures
• Knowledge of educational ends, purposes and values and their philosophical and
historical grounds
Shulman’s model was modified by Hill, Ball and Schilling (2008) into a framework for
Mathematical Knowledge for Teaching (MKT) shown below in Figure 2.2.
Figure 2.2 Mathematical Knowledge for Teaching (Hill et al., 2008 p. 377)
Divided into Subject Matter Knowledge (SMK) and Pedagogical Content Knowledge
(PCK), the authors identified six areas of knowledge. Subject Matter Knowledge is
subdivided into:
• Common Content Knowledge (CCK) – knowledge in common with other
professions
• Specialised Content Knowledge (SCK) – knowledge particular to mathematics,
solutions, rules and procedures
• Knowledge at the Mathematical Horizon (KMH) – how that topic fits with other
topics, strands and the program of learning

36
PCK keeps faith with Shulman’s concept and is divided into:
• Knowledge of Content and Students (KCS) – what motivates students, conceptions
and misconceptions, where their ideas fit in a topic, what is difficult or easy
• Knowledge of Content and Teaching (KCT) – the sequencing, examples and
explanations used to teach a topic
• Knowledge of Content and Curriculum (KCC) – the strands, outcomes and
recommendations of the curriculum. (pp. 377-8)
Shulman’s framework is particularly suited to Mathematics and to teacher assessment and
professional development and pre-service teacher training. It has been used by researchers
in the field of number sense (Heirdsfield & Lamb, 2005), PCK of teachers (An, Kulm & Wu
2004; Baker & Chick 2006; Huckstep, Rowland & Thwaites 2003; Yang, Reys & Reys
2009) and pre-service teacher training (Cochran, DeRuiter & King 1993); Turnuklu &
Yesildere 2007; Whitacre 2007). In this research, the Mathematical Knowledge for
Teaching (MKT) framework (Hill et al., 2008) will guide the types of data collected, data
collection methods and the analysis of that data as outlined in Chapter 3.
Askew (2008) adds another dimension to the debate on teacher knowledge through his
concept of mathematical sensibilities. Like Davis and Summit (2006), he suggests that “the
question is not one of whether or not classrooms are learner- centred or teacher-centred but
whether or not they are mathematics centred” (p. 29). To foster in-depth discussions of
mathematical sensibilities, he suggests that schools need to develop learning communities
within their staff, thus avoiding a reliance on textbooks as “surrogate classroom partners” (p.
31). The sensibilities that he proposes underpin the science of mathematics and include
concepts such as precision in working through a problem, being able to move from the
specific to general, a curiosity about how things work and a care for the discipline that
recognizes the “beauty and romance” (p. 25) that others see in it. Hurst (2014, p. 288)
comments that “teachers who have such ‘sensibility’ are likely to be better able to make
mathematical connections explicit for their students”.
The concept of a set of mathematical sensibilities unique to the discipline is not unlike Ma’s
(1999) idea of profound mathematical knowledge. In her study comparing the knowledge of
Chinese and US teachers of Mathematics, she related the profound knowledge of
fundamental mathematics (PUFM) exhibited by Chinese teachers with their ability to see

37
connections within the discipline and understand the conceptual underpinnings of the
subject. Ma concluded that no amount of general pedagogical knowledge could make up for
ignorance of particular mathematical concepts. One of Ma’s examples of PUFM was being
able to explain the formal algorithm for long multiplication through the distributive
property.
Similarly, Hurst (2014) suggests that a focus on the “big ideas” (p. 287) of mathematics is
needed to promote a more connected view of mathematics. He advocates that mathematical
knowledge be re-conceptualised “in terms of the myriad connections and links that exist
within and between mathematical ideas” (p.288). A focus on these ‘big ideas” will them
allow teachers to see the links between ideas and plan instruction to highlight these
important connections. This project seeks to incorporate the big ideas of multiplicative
thinking, flexibility and adaptivity and number sensible use of strategies into its design as
outlined in Chapter 3.
The discussion of knowledge now returns to the specifics of Harnett’s (2007) study relating
to the need for a taxonomy of strategies with clear examples to aid teachers to engage fully
with the topic of mental computation.
2.6 Mental Computation Strategies
The research into student-developed mental strategies has largely focussed on the younger
years and, in particular, addition and subtraction (Caney, 2008). Beishuizen and others have
been prominent in categorising four distinct strategies for addition and subtraction of
numbers to 100 (Beishuizen 1985; Beishuizen, van Putten & van Mulken 1997; Klein,
Beishuizen & Treffors 1998):
• Splitting both numbers into tens and ones and dealing with the parts separately
(1010).
• Splitting one number into tens and ones and adding to the other number (N10).
• One number is split to bridge to a multiple of ten and then the remainder is added
(A10).
• One number is rounded up or down to a multiple of ten then added. An adjustment
for the rounding is then made (N10C).

38
In Australian research, Cooper, Heirdsfield and Irons (1996) also developed a five-point
categorisation of addition and subtraction strategies:
• Counting.
• Separation (1010) but split into left to right and right to left.
• Aggregation (N10) also split into left to right and right to left.
• Wholistic which included N10C and similar variations where both numbers were
adjusted and then the answer readjusted.
• Visualisation of the formal algorithm.
Student–developed multiplication and division strategies have been reported by Hierdsfield,
Cooper, Mulligan and Irons (1999):
Multiplication
• Counting (CO) including repeated addition, skip counting, doubling (x2).
• Basic fact (BF) and derived fact (BDF) such as 5x9 or 50x9.
• Right to left separated into place values (RLS) 45x6 = 5x6 + 40x6.
• Left to right separated into place values (LRS) 45x6 = 40x6 + 5x6.
• Wholistic (WH). Numbers are treated as wholes 5x19 = 5x20 -5.
Division
• Counting (CO) including repeated subtraction, skip counting, halving (÷2).
• Basic fact and derived fact (BF) such as 45÷9 or 450÷9.
• R/L separated into place values (RLS) 100÷5: 0÷5 = 0, 10÷5 =2, hence 20.
• L/R separated into place values (LRS) 100÷5: 10÷5 = 2, 0÷5 =0, hence 20.
• Wholistic (WH). Numbers are treated as wholes 100÷5: 100÷10=10. 10x2=20
Additional multiplication strategies mentioned in research include:
• Aliquot parts (multiplication by factors) 17x25 = 17÷4x100 = 425 (Whitacre, 2007).
• Partitioning (non-standard separation) 21x23 = 11x23 + 10x23 (Cooper et al., 1996).
• Subtractive Distributive 19 x 23 = 20 x 23 – 23 (Hierdsfield et al.,1999; Whitacre,
2007).
• Repeated doubling (x4 and x8) (Wigley, 1996).

39
• Near doubles (x2 – 1, x2 +1) (McIntosh & Dole, 2005).
• Commutative Law (3x4 = 4x3) (Anghilieri, 1999).
• Compensation (Askew, 2008).
In discussing mental computation strategies, Cooper et al. (1996) comment that
There appears to be a need, in multiplication and division mental computation as
well as estimation, for assistance to be given to children to use strategies
different from those associated with traditional computation (e.g., trial and error
and wholistic, and, maybe, some forms of non-standard separation). (p. 96)
Menon (2003) contributed work on students’ use of basic fact shortcuts in mental
multiplication. He stated that some might argue that these shortcuts encourage rote learning
and therefore detract from conceptual understanding, however, in his experience he found
that the shortcuts motivated students and that these shortcuts could be taught using number
relationships in such a way as to enhance number sense and conceptual understanding (p.
476). Both concepts of non-standard separation and basic fact shortcuts are important facets
of the teaching strategy proposed in this research.
Askew (2008) suggests the use of arrays to illustrate how the strategies work and to
introduce them to students thus building on existing knowledge. For example, a
compensation strategy transforms the calculation 45 x 24 into a more manageable 90 x 12.
Using arrays, as shown in Figure 2.3, it is easy to see how the strategy works.

40
Figure 2.3 The Use of Arrays to Illustrate a Compensation Strategy for 45 x 24
Arrays are also recommended by Hurst and Hurrell (2017) for explanations of the
Distributive Law, leading to strategies such as left right separated and partitioning. In a
separate paper (Hurst & Hurrell, 2016), they also argue for a more appropriate explanation
of multiplying by powers and multiples of ten (BDF) that references a shift in place value
and the use of zero as a place holder when needed. They strongly recommend not using
phrases such as “add a zero” when multiplying by powers of ten or doing basic derived fact
questions. The latter suggestions have been incorporated in the notes of the intervention
phase of this research.
As can be seen above, mental computation is largely strategy based as opposed to the use of
defined algorithmic approaches to a particular operation. Whilst the formal algorithm for
short multiplication is included, it is viewed rather as a strategy using left to right
multiplication. Menon (2003) suggests that there may be place for informal algorithmic
approaches in basic fact shortcuts to improve calculation efficiency, however, it is still
possible to allow students to invent and choose between alternate strategies for all basic fact
shortcuts. The important point is that mental computation involves a unique set of strategies
as opposed to a single algorithmic process. Similarly, it cannot be viewed simply as a
mental analogue of a pen and paper algorithm (Markovits and Sowder (1994).
Table 2.1 suggests a composite taxonomy of alternate strategies appropriate to the
curriculum outcomes for mental multiplication at a Year 5 level that seeks to summarise the
above research with references to sources.

41
Table 2.1 Taxonomy of Mental Multiplication Strategies for Year 5
Strategy Examples
Basic or
Derived Fact
5 x 8 = 40, 50 x 8 = 400, 50 x
80 = 4000 Heirdsfield, Cooper, Mulligan and Irons
(1999).
Counting – skip
counting,
doubling +/-
3 x 24 = 24+24+24 = 48+24
=72
3x24=2x24+24 = 48+24 = 72
Heirdsfield et al. (1999); McIntosh & Dole
(2005); Wigley (1996).
Basic Fact
Shortcuts
x3 = x2 + 1
x4 = double, double
x5 = ½ x 10
x6 = x2 then x3
x8 = double, double, double
x9 = x10 – x1
x11 = x10 + x1
Trachtenberg shortcuts
Belscuizen, van Putten & van Mulken (1997);
Cutler and McShane (1962); McIntosh and
Dole (2005); Menon (2003); Wigley (1996).
Right Left
Separated
7x23: 7x3=21write 1 and carry
2, 7x2=14, 14+2=16.
Answer=161
Heirdsfield et al.(1999) McIntosh & Dole
(2005).
Left Right
Separated
7x23: 7x20=140, 7x3=21,
140+21=161 Heirdsfield et al. (1999).
Belscuizen et al. (1997) McIntosh & Dole
(2005). Factors
6x32: 6=2x3, 32x3=96,
96x2=192 Belscuizen et al. (1997).
Partitioning
(non standard)
8 x 21 = 8x10+8x11 = 80 + 88 =
168
19x34 = 20x34 – 1x34 = 680 –
34 = 646
Belscuizen et al. (1997); Heirdsfield et al.
(1999); McIntosh & Dole (2005); Verschaffel,
Greer, and De Corte (2007).
Compensation
17x25 = 17x100 ÷ 4 = 425
15x24 = 30x12 = 360
Askew (2008); Belscuizen et al. (1997);
Heirdsfield et al. (1999); Verschaffel et al.
(2007).
Markovits and Sowder (1994) propose an alternate approach to a taxonomy of strategies for
mental computation that uses broad headings and can be applied to each of the basic
operations.

42
Their taxonomy has only four categories:
1. Standard: The student used a mental analogue of a standard paper-and-pencil algorithm (MASA).
2. Transition: The student continued to be somewhat bound to the standard algorithm. However, more attention was given to the numbers being computed and less to algorithmic procedures.
3. Nonstandard with no reformulation: A left-to-right process was used. 4. Nonstandard with reformulation: The numbers were reformulated to make the
computation easier. (p. 14)
The relationship between the two taxonomies is shown in Table 2.2.
Table 2.2 Markovits and Sowder’s Taxonomy Compared to Table 2.1
Markovits
and Sowder
MASA Transition Nonstandard Nonstandard with
reformation
Table 2.1 Right to
Left
Partial
Products using
LRS or RLS
Left to Right,
Basic Fact
Shortcuts
Non-standard Partitioning,
Factors, Compensation and
combinations of strategies
The advantage of Markovits and Sowder’s (1994) taxonomy is that it shows a progression
from less flexible to more flexible strategies or as Whitacre (2007) describes it, a
progression in number sensible strategies. This taxonomy is mentioned further in Whitacre’s
study with PSTs (Section 2.7) and comparisons made between that study and this research
project in Chapter 5.
2.7 Pre-service Teachers’ Knowledge of Mental Computation and Number Sense
Research on number sense exhibited by pre-service primary teachers in a number of
countries (Alajmi & Reys, 2007; Ghazali, Othman, Alias & Saleh, 2010; Tsao, 2004; Veloo,
2010; Yang, Reys & Reys, 2009), has shown that their knowledge on this topic is generally
poor and close to a secondary level student. The use of standard algorithms is a predominant
feature of their calculations and mental computation is generally weaker than written.
Handal (2003) comments that “pre-service teachers bring into their education program
mental structures overvaluing the role of memorization of rules and procedures in the
learning and teaching of school mathematics” (p. 49). Menon (2009) speaks of pre-service

43
teachers being in the “traditional” phase where their knowledge is a product of their past
experience as students. He cites a particular example of the calculation 456 x 78 where 95%
of participants in his study could answer the question correctly but only 25% could present a
valid word problem to illustrate it. Further, only 18% could explain how they would
introduce the algorithm used to students through manipulatives or other means. He
concluded that “they could not transform the knowledge they had as students …. to
teachers, who had to have a much deeper knowledge, to teach math” (p. 3).
Yang, Reys and Reys (2009), in a study of 280 Taiwanese PSTs found that only one-fifth
applied number sense based strategies to computational problems as opposed to some
algorithmic procedure. A comparison study by Almeida, Bruno and Perdomo-Díaz (2016)
of 67 Spanish pre-service secondary students (studying a Mathematics degree) showed a
better use of number sense strategies but still a large dependence on algorithmic procedures.
Both studies argued for increased emphasis on number sense in pre-service teacher training.
A study by Ineson (2008) of 170 trainee teachers in a post-graduate certificate program in
the UK similarly looked at the incidence of informal procedures as opposed to algorithmic
strategies and whether students could justify results. Again the results showed little
evidence of ‘connectedness’ (Ma, 1999) with the trainee teachers largely viewing
computational mathematics as a set of disparate rules and processes. This echoes Benbow’s
(1993) findings that PSTs thought of mathematics as a discipline based on the memorisation
of rules and procedures that are “applied in exactly one correct way to arrive at the only
correct answer to a problem” (p 9).
A South African study (Courtney-Clarke & Wessels, 2014) of 47 PSTs showed a lack of
number sense-based strategies coupled with a lack of conceptual understanding and basic
facts fluency both of which are essential for mental computation. There was a strong
correlation between the results of the number sense test and mental computation test.
Testing of the four operations found that the PSTs were more competent in addition and
subtraction compared to multiplication and division. Performance of this sample in written
multiplication was poor with a mean of 37.6% while the mean for mental multiplication
questions was only 15.2%. The study also reinforced earlier contentions that without
appropriate intervention, PSTs would replicate their experiences as students in their
teaching. However, Jordan (2007) remarks that, if provided with appropriate intervention at

44
tertiary level that includes number sense activities with a focus on mental computation and
estimation, PSTs are capable of a marked improvement in computational performance.
An example of an effective intervention was reported by Whitacre (2007) after working
with 50 PSTs in the US over a semester in number sense and mental computation involving
all four basic operations. The participants showed a marked decrease in reliance on
traditional algorithms and a consequent increase in alternative strategies. The students also
exhibited greater flexibility in the range of strategies used and those used were more number
sensible. Using Markovits and Sowder’s (1994) taxonomy of mental calculation strategies,
he reported significant gains in the flexible use of multiplication strategies as shown in
Figure 2.4.
Figure 2.4 Multiplication Strategy Use in Whitacre’s Study (2007, p. 14)
Note: MASA stands for a mental analogue of a standard algorithm, PP – Partial Products,
NAD – nonstandard additive distribution, SD – subtractive distribution, AP – Aliquot parts,
GF = general factors, D – derived.
There was a marked decline in the use of the standard algorithm and a consequent increase
in the use of more flexible strategies of subtractive distribution, Aliquot parts, factors and
combinations of strategies (derived). In follow-up studies with a second cohort of 37 PSTs,
Whitacre (2016) extended the program to include rational numbers and again found that
“the participants made more correct comparisons, reasoned more flexibly, and came to favor
less conventional and more sophisticated strategies after the semester long course” (p. 57).

45
In recent years, there has been a growing emphasis on using Mathematical Knowledge for
Teaching (MKT) as a framework for teaching both procedural understanding and
mathematical fluency to pre-service teachers (Delaney, Ball, Hill, Schilling & Zopf, 2008;
Hine, 2015). In relation to number sense, this means showing PSTs how to adapt mental
computation into meaningful problem solving activities in a classroom atmosphere that
supports reflection and communication as a shared activity (Trafton & Thiessen, 2004).
Wigley (1996) suggests that the correct approach to teaching mental computation recognises
that there are a few big ideas that should be taught to everyone. The aim of this research
project is to identify those big ideas with specific regard to mental multiplication and
provide pre-service teachers with the opportunity to evaluate them for use in their own
future teaching programs. It hopes to move one cohort of pre-service teachers from Menon’s
(2009) traditional phase to, at least, awareness of the pedagogical phase.
2.8 Chapter Conclusions
National and international curriculum papers have supported the increase in emphasis of
mental computation because of its benefits to students’ number sense, as a higher order
thinking skill, and for its importance in facilitating everyday life skills such as estimation
and approximation. Research shows that, to achieve these benefits, students must be
allowed to develop and discuss their own solutions to computation problems well in
advance of the introduction of any formal algorithms.
There is consensus that a constructivist approach to teaching mental computation in the
early years of schooling will allow students to gain confidence with number operations and
eventually lead to a more meaningful introduction of formal algorithms in the latter years of
primary education. Taxonomies of student-developed solution strategies for all four
operations with number have been developed but, individually, they fall short in addressing
the full scope of curriculum outcomes, particularly for mental multiplication.
Research has also shown a serious lack of subject knowledge and pedagogical knowledge of
teachers and pre-service teachers in the areas of number sense and mental computation.
Thus, research is needed to identify appropriate strategies and specific mental computation
algorithms that support and build upon student-developed strategies thus allowing students
to address the full range of problems outlined in the syllabus documents. To that end, this

46
research project looks at a possible program of instruction for mental multiplication in Year
5, trialling this with a cohort of pre-service teachers. The methodology of this project is
outlined in detail in the following chapter.

47
Chapter 3 - The Research Project Methodology
3.1 Introduction
This project investigated pre-service teachers’ knowledge of mental multiplication. A range
of strategies displaying varying degrees of flexibility were introduced to two cohorts of pre-
service teachers at the University of New England resulting in suggestions from the
participants for teaching programs that address this Year 5 outcome. Following the
intervention, tests and questionnaires elicited information concerning any changes in
participants’ knowledge of mental multiplication. The research paradigm, theoretical
framework and the research design and methodology to support this research process are
described below. Data collection instruments and data analysis are also outlined in this
chapter. Finally, ethical considerations are mentioned.
3.2 Theoretical Framework
The theoretical framework for this project is Hill, Ball and Schilling’s (2008, p. 377)
framework for Mathematical Knowledge for Teaching (MKT) as shown in Figure 3.1. This
is a modified version of Shulman’s (1987) heuristic for Pedagogical Content Knowledge
(PCK) as outlined in Chapter 2.
Figure 3.1. Mathematical knowledge for teaching

48
Divided into Subject Matter Knowledge (SMK) and Pedagogical Content Knowledge
(PCK), the Hill, Ball and Schilling model identified six areas of knowledge. Each category
has been annotated with examples particular to this research project.
Subject Matter Knowledge was subdivided into:
• Common Content Knowledge (CCK) – knowledge in common with other
professions e.g. the use of mental computation in estimation and approximation,
particularly by adults in work situations.
• Specialised Content Knowledge (SCK) – knowledge particular to mathematics,
solutions, rules and procedures e.g. strategies and algorithms specific to mental
computation.
• Knowledge at the mathematical horizon (KMH) – how that topic fits with other
topics, strands and the program of learning e.g. how mental multiplication fits with
other areas of mental and written computation and how it relates to number sense
and multiplicative thinking.
The definition of PCK kept faith with Shulman’s (1987) concept and was divided into:
• Knowledge of Content and Students (KCS) – what motivates students, conceptions
and misconceptions, where their ideas fit in a topic, what is difficult or easy e.g. how
students develop mental computation strategies, their nature, taxonomy and common
errors. What elements of multiplicative thinking are important in this topic? Which
multipliers and products cause difficulties for students?
• Knowledge of Content and Teaching (KCT) – the sequencing, examples and
explanations used to teach a topic e.g. how to best facilitate student-developed
mental computation strategies and how to build on those strategies.
• Knowledge of Content and Curriculum (KCC) – the strands, outcomes and
recommendations of the curriculum e.g. the importance of mental computation in
curriculum documents, outcomes mentioning it and its place in the K-10 continuum.
The MKT framework is particularly suited to teacher assessment and professional
development and pre-service teacher training. It guided the types of data collected, data
collection methods and the analysis of that data.

49
3.3 Research Paradigm
This research is firmly located in the constructivist paradigm (Creswell, 2014) because of
the consistent references in the research literature to constructivist approaches in the
classroom and the role of the participants in constructing their own understanding of the
topic. This is reinforced by the subjective stance of the researcher in relation to mental
computation and the researcher’s involvement in the study (Cohen et al., 2007). The use of
qualitative data methods (in a concurrent mixed methods approach) that attempted to elicit
participants’ individual and collective conceptions concerning mental computation
strategies and programs of instruction (Benzies & Allen, 2001) and the participants’
conceptions of mental multiplication strategies based on age, culture and experiences as
learners and then later, as adults (Mack, 2010) support the use of this paradigm.
In this study, the researcher has adopted symbolic interactionism as the philosophical
perspective (Mack, 2010). Students learn by constructing knowledge based on their social
interactions with the teacher and their peers. The value they give to what they learn,
including the strategies of mental multiplication that are appropriate in a given situation, are
taken from that social interaction. That is, if the teacher says this is the way to do it, or
validates other students’ methods, then that is what they accept. The teacher occupies an
important symbolic role and the students’ interaction with that important symbolic person is
what influences them to learn as they do.
Epistemology is concerned with “the nature and forms of knowledge” (Cohen et al., 2007, p.
7). Symbolic interactionism sees meaning or knowledge from three related perspectives
(Blumer, 1969):
• Individuals attach meaning to things and act on the basis of that meaning.
• Meaning is arrived at through a process of symbolic interaction or the use of
language to interact with others and derive meaning.
• That meaning is fluid and changes through interaction with the environment and
others.
From an ontological perspective, the world exists apart from the individual’s perception of it
but it is this subjective perception that guides the actions, beliefs and behavior of the

50
individual (Blumer, 1969). Symbolic interactionism links the individual to the context of
environment (Benzies & Allen, 2001). Hence, there will be “multiple and different
perspectives of the participants in the research” (Mack, 2010, p. 8).
3.4 Research Design
The research design is a case study – the case involved two cohorts of pre-service
teachers encountering mental computation through face-to-face lectures at UNE.
Creswell et al. (2007) define a case study as a methodology in which “the investigator
explores a bounded system (a case) or multiple bounded systems (cases) over time
through detailed, in-depth data collection involving multiple sources of information and
reports a case description and case-based themes” (p. 253).
Firstly, this study qualifies as a bounded study in that the participants all come from two
cohorts of pre-service teachers studying by attendance, rather than distance education mode.
The study occurred at a time in their course when this Year 5 Mathematics topic was of
relevance but had not been previously encountered (other than as students themselves or as
written or graphical algorithms for multiplication). It was also bounded by time, and content
– mental multiplication strategies and algorithms – which are a subset of the unit on mental
computation strategies.
The particular case under study considered how these two cohorts of pre-service teachers
interacted, both individually and collectively, with the six types of knowledge in the MKT
theoretical framework to develop a teaching program for mental multiplication at a Year 5
level. It is an in-depth study as it uses a mix of quantitative and qualitative research methods
to collect rich data relating to the six types of knowledge that the MKT framework suggests
are necessary to successfully support learning and understanding of this topic. It is a
concurrent design using multiple units of analysis with a mix of quantitative and qualitative
methods (Yin, 2015).
Yin (2015) would further describe it as an explanatory case study (as opposed to exploratory
or descriptive) in that it sought to explain the causal links between the decisions made by
the cohort of pre-service teachers prior to and following intervention. Stake (1995) would
see it as an instrumental case study (as opposed to intrinsic or collective) as it provides

51
insight into the issue (strategies used for mental multiplication) rather than the particular
case being studied. Although the case plays a supportive role and is still looked at in depth,
it will not be seen as representative of other case studies of strategy choice for mental
multiplication – for example, teachers and students.
3.5 Research Methods
A concurrent mixed methods approach was used where quantitative data was enriched by
qualitative methods. Harrison et al. (2017, para 30) state that:
the use of multiple methods to collect and analyze data are encouraged and found
to be mutually informative in case study research where together they provide a
more synergistic and comprehensive view of the issue being studied.
The research literature shows that this is a ‘signature’ design for research in mathematics
education, and particularly teacher and pre-service teacher assessment of MKT, with
numerous researchers using the approach of testing, questionnaires, intervention, retesting
and further questionnaires (Callingham, 2005; Caney, 2008; McIntosh & Dole, 2005;
Whitacre, 2007; Yang, Reys & Reys, 2009). As such, it may be described as an iterative and
cyclic approach (Teddlie & Tashakkori, 2012).
Using Cresswell’s (2014) categorization of mixed methods designs, this matches the criteria
for a Concurrent Triangulation design in that data collection is concurrent and the various
forms of data collection support and cross-validate the findings of the study. It also has the
advantage of using qualitative data to overcome a possible weakness in the quantitative data.
An example of this may be the open-ended questions in the questionnaire supporting data
obtained from the timed testing.
Examples of quantitative data methods used in this study are tests and closed questions such
as sex, age, level of mathematics education. Qualitative data is supplied through participant
observation and open-ended questions. These are discussed in Section 3.7

52
3.6 Data Collection
3.6.1 Participants
The study participants came from two cohorts (n=56) of pre-service teachers studying on-
campus at UNE. The participants were enrolled in the units EDME145 and EDME 369.
The study occurred at a time in their course when this Year 5 mathematics topic was of
relevance but had not been previously encountered, although the students had studied
written algorithms and graphical solutions to multiplication problems.
Initially, 36 students agreed to participate in the project and completed consent forms,
however, the participation rate declined through the three phases of the project as the
students experienced competing demands on their time from assignments and exams. Each
participant was asked to devise his or her own identifier made up of digits and numbers to
be used in all three phases of the study. It was suggested that they use the initials of their
mother’s maiden name and the two-digit year of their mother’s birth.
3.6.2 Three Phase Model
The three phases of the research design were completed in consecutive weeks in the
allocated timeslots for lectures for each group. However, the intervention occurred in the
second week when lectures did not normally occur as the two courses had a scheduled one-
week break from lectures for this week. All three phase were facilitated by the researcher
who was not the normal course presenter. Strudents not participating in the research moved
to a secondary location with their normal lecturer and began work on that week’s course
content.
Phase 1 (September 17/18)
In the week prior to the first phase, participants received a Participant Information Sheet, via
their class Moodle sites, outlining the nature and structure of the research project and ethical
considerations (Appendix 1). The project was outlined to each group of pre-service teachers
by the researcher and those who agreed to participate then completed a voluntary consent
form administered by the Unit Co-ordinators, Dr Schmude and Dr Wodolko. Those students
not wishing to be involved left with Dr Schmude or Dr Wodolko to complete class activities

53
at another venue. A total of 36 students agreed to participate, and completed the necessary
Consent Form (Appendix 1) in the presence of the two Unit Co-ordinators. Sixteen of these
came from EDME 145 and a further 20 from EDME 369.
A pre-test (Appendix 2) was then given to participants, in each group timeslot, via a timed
PowerPoint presentation totalling 15 questions. As is common with this type of test, the
questions were delivered both visually and verbally with a fifteen second delay between
questions (Caney, 2008; McIntosh, 2006). After completing the test, participants were then
asked to summarise the strategy they could have used for each question. This was
completed on a separate sheet with questions listed (Appendix 3). This activity was
untimed.
An online questionnaire (Appendix 4) was then completed to gauge each participant’s
background knowledge and pre-conceptions of mental computation. Items were multiple
choice or multi-part Likert-type items with open-ended questions providing participants
with the opportunity to clarify or elaborate on their responses. There was also an untimed
set of four mental multiplication questions (from the original test) where alternate strategies
were canvassed.
Phase 1 was completed in 30 minutes and participants then rejoined the class with time to
complete the scheduled coursework for that lecture.
Phase 2 (September 25/26)
The tests in Phase 1 were marked and coded and a program of instruction developed that
elaborated on strategies recorded by the participants and used examples from these to
highlight new concepts and directions. The coding taxonomy (with examples) used to
discriminate between strategies is shown in Appendix 3 and was developed in Chapter 2. In
particular, basic number fact shortcuts (BFS), standard partitioning (LRS), non-standard
partitioning (PAR) and compensation (CMP) methods were the focus of the intervention.
There was also discussion of combinations of methods, listed as CMB in the test coding.
Lecture notes (Appendix 5) and the PowerPoint presentation were both posted on the two
course Moodle sites after the lectures had been completed (see Chapter 5). The intervention
was delivered by the researcher as an interactive workshop and varied for each group

54
depending on their responses to exercises in the presentation slides and their questions and
comments. Each workshop was completed within the allocated two-hour timeslot.
Phase 3 (October 2/3)
Those not participating from each cohort left with Dr Schmude. Participants then completed
a retest of similar structure and question type to the first test (Appendix 2). They were again
asked to record a strategy they would have used to answer each question if time had
permitted; this was untimed (Appendix 3). Finally, a second online questionnaire completed
the cycle of data collection (Appendix 4). This session was completed in 30 minutes and
participants were able to rejoin the class and complete the course work assigned.
Because of the placement of the data collection and intervention (towards the end of the
Trimester), attendance varied greatly from session to session. Also the optional nature of the
lectures in the intervention week resulted in a substantial drop in attendance. The final week
of data collection, just prior to exams and final assignment deadlines also saw a reduced
attendance of all three groups. While this posed some problems for data analysis, the
number of those participating in Phase 1 provided a rich data source.
The test-retest design also allowed for a measure of practice effect through unsystematic
variation of one group compared to systematic variation of a second group that experienced
the intervention. This design increased the reliability of the results (Field, 2009).
3.6.3 Data Collection Instruments – Questionnaire 1 and 2
Both questionnaires used multiple choice items, multi-part Likert-type items or general
response questions. Likert-type items were mostly based on a 5-point scale, with responses
varying from 1. Strongly disagree to 5. Strongly agree. This style is common in
questionnaire design when data regarding the attitudes of participants are sought (Cohen,
Manion & Morrison, 2007).
Questionnaire 1 began with nine background questions related to participant demographics
and experience with mental multiplication. They were asked their age (in age bands), sex
and highest level of mathematics studied at school. They were also asked for their major

55
teaching area and a second specialisation (if one existed). Two Likert-type questions then
asked about their enjoyment of mathematics at school and their perceived ability in the
subject. Two questions asked about their experience with mental computation at school and
as an adult (SCK). Items 10 to 21 were common to both questionnaires and examined five
of the six framework subheadings as shown in Table 3.1.
Table 3.1 Classification of Questions 8 to 21 based on the MKT Framework.
Question Prompt Relation to Framework
8 I learned a number of mental computation strategies at school SCK 9 As an adult I use mental computation regularly SCK 10 I am aware of a range of strategies for mental computation SCK 11 I am confident in using a range of strategies for mental
computation SCK
12 I am aware of the place of mental multiplication in the curriculum
KCC
13 I feel confident about teaching mental computation to Year 5 KCT 14 I think mental computation is an essential skill for school
students KCC
15 I think mental computation is an essential skill for adults CCK 16 Mental computation is best learned in primary school KCC 17 Mental computation should be taught before formal methods of
written computation KCC
18 All students have the potential to be good at mental computation
KCT
19 It is important for students to have as wide a range of mental multiplication strategies as possible to allow them to solve different problems efficiently
KCT
20 Mental multiplication promotes critical thinking and problem solving
KMH
21 Mental multiplication promotes number sense KMH
Items 8 to 21 were chosen specifically for their relationship to sub-elements of the MKT
framework but were also guided by previous studies with practising teachers (Caney, 2008;
Reys, Reys, Nohda and Emori, 1995). The survey concluded with five open-ended questions
that asked participants to list as many alternate strategies for each multiplication problem
posed as possible. Four of those questions were the same as the test questions. This was
untimed and designed to provide further evidence relating to the participants’ SCK. Finally,
two free response questions allowed participants to comment on what they hoped would be

56
achieved through their involvement in the study and any observations that they cared to
make.
Both questionnaires were administered electronically and participants could access them
through a website address. Laptops were provided if necessary.
The final questionnaire started with items 10 to 21 from the first questionnaire and a similar
set of five free response questions asking for alternate solutions to problems, four of which
were from the second test. In Section 3, there were four questions relating to their
attendance at the intervention and their evaluation of it and whether they had read the notes
and a similar evaluation on a five-point Likert scale. The final section dealt with evaluations
of the strategies presented and what they would include in a teaching program and its
duration. The questionnaire finished with a free response question inviting further
comments about the project.
Whilst both questionnaires were untimed, there was some pressure from the course co-
ordinators to complete it within 30 minutes so they could resume their normal program. As
a consequence, three participants in Phase 1 started the questionnaire but did not complete it
before the non-participants had rejoined the group and the lecture had begun. This similarly
occurred in the Phase 3 questionnaire with five participants not completing the
questionnaire. The website used did not record partial data for all those participants.
3.6.4 Data Collection Instruments – Tests 1 and 2
The selection of questions was based on the syllabus requirements of the NESA (2015)
curriculum for K-10 Mathematics expressed as outcomes for this Year 5 topic. Sources from
the literature review, particularly McIntosh (1995, 2006), provided examples of questions
used in testing with Australian student cohorts from Years 3 to 10. Whitacre’s (2007)
assessments with pre-service teachers were also consulted. Table 3.2 details the questions
and related NESA outcomes.

57
Table 3.2 Distribution of Test Questions by Category
Test Retest
No. Question NESA Outcome No. Question
1 40 x 90 2 x 2 digit 1 50 x 90
2 5 x 8000 1 x 4 digit 2 6 x 7000
3 18 x 6 1 x 2 digit 3 22 x 6
4 5 x 19 1 x 2 digit 4 5 x 23
5 126 x 4 1 x 3 digit 5 217 x 4
6 9 x 45 1 x 2 digit 6 9 x 37
7 3 x 195 1 x 3 digit 7 3 x 295
8 143 x 7 1 x 3 digit 8 321 x 8
9 19 x 25 2 x 2 digit 9 23 x 25
10 23 x 12 2 x 2 digit 10 32 x 12
11 15 x 18 2 x 2 digit 11 14 x 17
12 21 x 23 2 x 2 digit 12 32 x 31
13 123 x 11 3 x 2 digit 13 432 x 11
14 45 x 24 2 x 2 digit 14 24 x 35
15 34 x 35 2 x 2 digit 15 46 x 45
Whilst the questions tested similar outcomes, it could be argued that Test 2 was slightly
more difficult than Test 1. Ten of the questions had the same multipliers but the digits of the
multiplicand were generally greater in Test 2. Experience would suggest that the higher the
number the more difficult the multiplication. For example, consider Question 12, Test 1
21 x 23 = 20 x 23 + 1 x 23 = 460 + 23 = 483
This uses LRS. The same strategy applied to Question 12, Test 2 produces:
32 x 31 = 30 x 32 + 1 x 32 = 960 + 32 = 992
Tripling would normally be seen as more difficult than doubling so the second question
would be considered slightly more difficult.

58
The two tests were administered in the same time slot using PowerPoint slides with a 15
second delay between slides. The questions were bold, Calibri 96 point in a horizontal
format. Each question was read as it appeared on the screen. Test answers were recorded on
a blank answer sheet with limited space for each question that discouraged any working.
The delay between questions matched that used by McIntosh (2006) for ‘long’ questions
and was slightly longer than that used by Caney (2006) with Middle School students.
3.6.5 Data Collection Instruments – Coding Sheets 1 and 2
Following each test, the participants were asked to record the strategy that they used, or
would have used if time permitted, for each question. They were asked just to record their
working and that the answer was not required. This section was untimed and the participants
individually moved on to the questionnaire when they were finished. All test participants
completed their coding sheets for both tests. The original plan called for the participants to
form small focus groups and code each other’s sheet using the taxonomy shown in Table
3.3.

59
Table 3.3 Coding Taxonomy with Examples
Code Descriptor Examples
BDF Basic or Derived Fact
5 x 8 = 40, 50 x 8 = 400, 50 x 80 = 4000
COU Counting – skip counting, doubling +/- 3 x 24 = 24+24+24 = 48+24 =72
3x24=2x24+24 = 48+24 = 72
BFS Basic Fact Shortcuts – shortcuts for
multipliers from 2 to 12, 15 and 20
x5 = ½ x 10
x8 = double, double, double
x9 = x10 – x1
x11 = x10 + x1
x12 = x10 + double
x15 = x10 + x5
Trachtenberg and Hall shortcuts (see
Appendix 5)
LRS Left to Right Separated – using the
Distributive Law
7x23: 7x20=140, 7x3=21,
140+21=161
RLS Right to Left Separated – visualising the
formal algorithm
7x23: 7x3=21write 1 and carry 2,
7x2=14, 14+2=16. Answer=161
FAC Factors 6x32: 6=2x3, 32x3=96, 96x2=192
PAR Partitioning (Non-standard) 8 x 21 = 8x10+8x11 = 80 + 88 = 168
19x34 = 20x34 – 1x34 = 680 – 34 =
646
CMP Compensation 17x25 = 17x100 ÷ 4 = 425
15x24 = 30x12 = 360
CMB A Combination of the above strategies 21 x 23 = 11 x 23 + 10 x 23 (PAR)
= 253 (BFS) + 230 = 483
Unfortunately, time restraints on the data collection phases meant that the focus groups were
not able to be used and the researcher coded all the test responses. All test responses were
able to be coded using the taxonomy.

60
3.6.6 The Intervention
A two-hour time slot was allocated for the intervention workshop with each of the cohorts.
This occurred in the week following Phase 1 when there were no scheduled lectures for
either EDME145 or EDME369. That meant that attendance was voluntary and resulted in
reduced numbers for this phase, as outlined in Chapter 5.
In designing the intervention, there were a number of specific objectives that dictated
content. Firstly, a broad range of strategies needed to be included that were flexible enough
to solve the full spectrum of problems outlined in the syllabus. These had to be conceptual
in nature rather than procedural and be based around a strong understanding of the
Distribution Law (multiplicative thinking). Rather than limit partitioning to LRS, non
standard partitioning, including additive and subtractive distributions, was seen as the
vehicle for increased flexibility along with Basic Fact Shortcuts to speed calculation.
These objectives resulted in the inclusion of the following strategies: LRS, BFS, PAR, FAC,
CMP and CMB. It was assumed that BDF and COU strategies would be taught in Year 4.
The focus on flexibility and adaptivity, required that participants be shown multiple
pathways to each problem solution. A review of Test 1 questions was used to highlight
adaptivity with optimal pathways discussed. Multiplicative thinking was mentioned in
relation to the PAR strategy which uses the Distributive Law to create multiple solution
pathways and also in relation to multiplying by powers and multiples of ten (see Chapter 2).
The Commutative law was related to the use of factors in examples. To better understand
this focus, the notes from the intervention have been reproduced in Appendix 5 with the
addition of multiple solutions to the questions from Test 1 that were discussed at the end of
the tutorial.
3.7 Data Analysis
The variables in this study were the knowledge strands associated with the MKT model and,
in particular, the multiplication strategies identified in the SCK strand. All questions were
related to these knowledge strands and coded strategies with the exception of some

61
biographical data that added to the narrative of the case study. The wide range of data
collection instruments allowed for triangulation to occur between data sets.
3.7.1 Questionnaire 1 Analysis
Questions were multiple choice, multi-part Likert-type items or general response questions.
Likert-type questions produced data that was ordinal in nature resulting in analysis that
precluded most statistical measures of centre and dispersion. As Cohen et al (2007) state,
the distance between categories of ‘strongly disagree’ and ‘disagree’ may be completely
different from any two other adjacent points on the scale. The questionnaire was analysed
through frequency distribution and items compared with non-parametric correlation.
Multiple choice items used in personal profile questions are forms of nominal data. As such,
data analysis of frequency distribution was used. With age related questions, a form of
ordinal data, frequency distribution was used along with median and modal class. Similarly,
a frequency distribution compared levels of mathematics studied at school as a group and by
cohort. Enjoyment of mathematics at school and perceived ability were compared by cohort
and correlated. Mann-Whitney U tests gauged significance.
Items 8 to 21 were grouped by framework categories and compared by frequency
distribution with Spearman’s correlations. A cross-category correlation between items 11
and 13 was explored as both questions related to confidence with mental multiplication
strategies, one as a teacher, the other as an adult.
Open-ended questions included in the questionnaire were analysed using a clustering
procedure (Miles & Huberman, 1994). This helped to identify emergent themes related to
the areas of knowledge in the MKT framework.
3.7.2 Mental Multiplication Assessment 1
Participant scores on both tests involved ratio (or numerical) data and hence had an absolute
zero, and meaning attached to differences and the ratio of scores. A full range of statistical
tools was available including measures of central tendency (e.g. mean, mode, median) and
measures of dispersion (e.g. range, standard deviation). Number of correct responses, mean
and standard deviation were calculated for the first test as an entire group and also for each

62
of the cohorts (EDME145 and EDME369). The difference in test means for the two cohorts
was explored in relation to the level of mathematics studied at school, enjoyment and
perceived ability in the subject, use and confidence with mental computation strategies as an
adult. These measures were correlated with the test results to determine significance.
Questions 9 to 15 of the test were analysed separately as they involved two-digit x two digit
multiplications. These had proved to be the most difficult section of the test. The analysis
was by frequency distribution and strategy use.
3.7.3 Coding Sheet 1 and Free Response Items (Questionnaire 1)
Coding of the untimed section where working was shown for the test questions is nominal
data and was recorded by frequency distribution and column graph. There were added
variables of the number of incorrect uses of each strategy and blank entries to consider in
the display of data. The use of strategies and their distribution were analysed for the whole
group and by cohort. Additionally, comparisons were made with strategy use for the two-
digit x two-digit questions. The alternate strategies canvassed in the free response section of
the questionnaire were also coded and compared by cohort.
Strategy use was then categorised according to its potential to answer a range of test
questions i.e. its flexibility. This was loosely based on Markovits and Sowder’s (1994)
taxonomy as reported in Whitacre’s (2007) study of mental computation with pre-service
teachers. Whitacre’s taxonomy is compared with the taxonomy used in this study in Table
3.4.
Table 3.4 Comparison of Whitacre’s Taxonomy for Multiplication Strategies and the
Taxonomy Used in This Study
Categorisation Standard Transition Non Standard Non Standard
with Reduction Specific coding (Whitacre)
MASA Partial Products
Additive Distributive
Non-standard Partitioning (SD and AD), Aliquot Parts, Derived, Factors
Specific Coding (Hall)
RLS Partial Products
LRS, BFS PAR, FAC, CMP, CMB

63
MASA stands for Mental Analogue of a Standard Algorithm that is classified as RLS in this
study. Partial Products is consistent with LRS for single-digit multipliers. Subtractive
Distributive has been grouped with Additive Distributive under a single classification of
Non-Standard Partitioning (PAR). Factors are the same, CMP includes Aliquot Parts and
Derived and is similar to CMB. The classifications in this study were chosen to be
consistent with Australian syllabus terminology. The strategies of BDF and COU were not
used in Whtiacre’s study.
As Whitacre (2007) points out, the taxonomy
suggests a progression from one end of a spectrum to the other. Students who
rely heavily on Standard methods evidence poor number sense. Their
understanding of an operation seems to be tied to symbol manipulation, so that
they lack flexibility. At the other end of the spectrum, students who readily
employ Non-standard methods, especially Non-standard with reformulation,
exhibit good number sense. Their understanding of the operations is independent
from any particular algorithm, so that they have good flexibility. Those
primarily using Transition strategies can, indeed, be seen as in transition from
Standard to Nonstandard, from tied to the algorithms to independent, from
inflexible to flexible. (p. 7)
This results in two categorisations of strategies based on flexibility:
• inflexible and appropriate for a limited range of questions (BDF, COU and RLS for
one-digit multipliers)
• flexible and appropriate for a wider range of questions (LRS, PAR, FAC, CMP,
CMB)
Strategy use was compared using these two categories with a separate category for blank
and incorrect entries that was not relevant in Whitacre’s study but is in this project. Strategy
use was also compared with the findings from Whitacre’s (2007) study. It was also
compared by the range of strategies used by each participant although the degree of
flexibility of the strategies was not taken into account.

64
3.7.4 Questionnaire 2 Analysis
Initially, items relating to the efficacy of the intervention and its notes were analysed by
frequency distribution using a five-point Likert scale. Strategies were assessed by each
participant for inclusion in a teaching program and these results were also displayed by
frequency distribution. Recommendations for the length of a teaching program were
similarly displayed.
Analysis then moved on to items 10 to 21 of the questionnaire and these were again grouped
under the same framework headings and displayed by frequency distribution. Comparisons
between the participants’ responses to the first questionnaire and these responses were made
for the group that attended the intervention. Again, correlations were used as appropriate
and when significant. Paired t-test and Wilcoxon test were used due to the small sample size
(de Winter, 2013). Free response questions were grouped by theme.
3.7.5 Mental Multiplication Assessment 2
Test 2 results were reported by frequency distribution, mean and standard deviation. They
were compared and correlated with Test 1 results. The participants were then split into two
groups, those who had attended the intervention and those who had not. These results were
again compared by mean and standard deviation and correlated with each group’s Test 1
results and tested for significance. The difference between the results of the two groups was
also tested for significance.
Improvement in results of the group not attending the intervention were analysed in terms of
the change in candidature, possible variation in the difficulty of the second test and practice
effect.
3.7.6 Coding Sheet 2 and Free Response Items (Questionnaire 2)
The use of strategies and their distribution were analysed for the whole group and by
attendance at the intervention. Additionally, comparisons were made with strategy use for
the two-digit x two-digit questions. The alternate strategies canvassed in the free response
section of the questionnaire were also coded and compared by group. All of these
distributions were compared by groups.

65
Strategy flexibility and the range of strategies used were compared by group based on
attendance at the intervention. The free response questions were coded and compared with
Phase 1 results and by group. Comparisons were made with the findings from Whitacre’s
(2007) study.
3.8 Ethical Considerations
Walliman (2010, p. 43) cites two aspects of ethical issues in research:
1. The individual values of the researcher relating to honesty, frankness and personal
integrity. In relation to this:
• The candidate has completed the Academic Integrity Module as required.
• This document will be subject to the Turnitin self check and final check before
submission.
• All quotes and sources of information have been properly cited in this document
using APA guidelines (Sites, A. W. APA STYLE GUIDE 2009; VandenBos, G.
R. (Ed), 2010).
• Ethics application has been approved with no conditions. Approval number
HE18-135 valid from June 26, 2018 to June 26, 2019 (See Appendix 6).
2. The researcher’s treatment of other people involved in the research, relating to
informed consent, confidentiality, anonymity and courtesy.
To this extent, the researcher produced a document for potential participants (Appendix 1),
outlining:
• the purposes, contents and procedures of the research.
• any foreseeable risks and negative outcomes, discomfort or consequences and how
they will be handled; benefits that might derive from the research and incentives to
participate.
• the right of voluntary non-participation, withdrawal and rejoining the project, rights
and obligations to confidentiality and non-disclosure of the participants’ identities
and research outcomes.

66
• informed consent form for participation.
• the benefits of participating in the research.
(Cohen et. al. 2013, p. 55)
Participant identities were not known to the researcher. Each participant was asked to select
an identifier, unique to each individual, that was used for all tie data collection instruments
allowing responses to be analysed across phases. Their participation and performance had
no bearing on assessment of the units in which they were enrolled.

67
Chapter 4 - Data Collection and Analysis – Phase One
4.1 Introduction
This chapter provides an outline of the first phase of data collection with particular
reference to the participants and the background information supplied by items in the first
Questionnaire (Appendix 4). Initial test data are presented to provide an overview of the
participants’ ability in timed mental multiplication, their school experience of mental
computation and their mathematical background at HSC level. Analysis of items eight to
twenty-one of the first questionnaire are related to five of the six elements of Hill, Ball and
Schilling’s Mathematical Knowledge for Teaching framework (2008), outlined in Chapter
3.
This is followed by extensive analysis of the participants’ untimed responses to the test
questions and coding of the strategies they listed for these questions. Coding of strategies
used the coding taxonomy developed in the literature review and outlined in the research
design. Each participant’s coded strategies are further supplemented by four free response
items in the questionnaire that canvassed alternate strategies to a selection of test problems.
The combination of the two, leads to conclusions about the participants’ knowledge of
mental multiplication (SCK) and their preparedness to teach the topic to a Year 5 cohort
(KCT) using the guidelines set out in the Australian and NSW curriculum documents
(KCC).
4.2 Data Collection
Three groups were involved in data collection: one cohort of EDME 369 attending lectures
on Tuesdays between 2pm and 5pm and two classes of EDME 145 attending lectures on
Tuesdays between 11am and 1pm and Wednesdays between 9am and 11am. The data
collection occurred in the last three weeks of Trimester 2 from September 18 to October 3,
2018 inclusive.
The number of participants in each data collection phase is detailed below in Table 4.1.

68
Table 4.1 Participation in the Various Phases of Data Collection
Phase 1 Phase 2 Phase 3 Task Number of
participants Task Number of
participants Task Number of
participants Test 1 36 Attended
Tutorial 11 Test 2 23
Coding Sheet 36 Accessed Tutorial Notes
8
Coding Sheet 23
Questionnaire 1
33 Attended and Accessed
Notes
7 Questionnaire 2
18
Of the 36 possible participants, 23 attempted both tests, while 13 attempted Test 1 only.
Only eight participants were involved in all three Phases of data collection and one of those
accessed the tutorial notes but did not attend the tutorial.
4.3 Participant Demographics
Of those participating in Phase 1 (𝑛 = 36), 16 were studying EDME145 and 20 were
studying EDME369. All students were progressing towards a BEd majoring in K-6 Primary.
Although the students in EDME369 had experienced a greater number of courses in primary
mathematics methods, neither group had experienced specific tuition in mental computation
strategies. Both groups had received instruction in written and graphical methods of
multiplication by one- and two-digit numbers.
Of those completing Questionnaire 1 (𝑛 = 33), 7 were male (21%) and 26 were female
(79%). The percentage of males participating was slightly higher than the national average
for male primary school teachers of 16.5% (ABS, 2017)
The median and modal ages for participants were contained in the 18 to 25 years class with
only three students outside that class; two in the 26 – 35 year range and one in the 36 – 45
year range. This is consistent with previous on-campus candidatures for this course.
The highest level of mathematics attained at High School is detailed in Table 4.2 with
percentages shown in brackets. Given the age of participants, it is unlikely that they have
encountered any further mathematics education other than their present course work.

69
Table 4.2 Highest Level of Mathematics Studied at High School by Participants (n=33)
Course Year 10 (%) Year 11
(%)
Maths General
(%)
Mathematics
2U (%)
Ext 1 or
better (%)
Number 2 (6%) 1 (3%) 19 (58%) 6 (18%) 5 (15%)
In NSW, HSC mathematics courses offered include Mathematics General, Mathematics
(2U), Extension 1 and Extension 2. Those studying Mathematics (2U) or higher encounter a
stronger emphasis on algebra, calculus, deductive geometry and trigonometry. They have
also been involved in a selection process that began in Year 8. Students in the top sets of
Year 8 are chosen to study the 5.3 course in Years 9 and 10. From there, it is possible to
choose any mathematics course for the HSC but those choosing Mathematics (2U) or higher
are expected to have completed the Stage 5.3 course successfully. This creates a distinct
division in terms of mathematical exposure between those studying Mathematics 2U or
higher and those opting for Mathematics General in Years 11 and 12.
Of those nominating a specialty area(s) within the Primary Methods Bachelor of Education
program, the following distribution (Table 4.3) was observed.
Table 4.3 Specialty Areas of Pre-Service TeachersEenrolled in EDME 145 and EDME 369
(n=36)
Specialty English (%) Maths (%) HSIE (%) STEM (%) PDHPE (%) Creative
Arts (%)
Number 13 (36%) 6 (17%) 6 (17%) 5 (14%) 1 (3%) 5 (14%)
It was interesting to note that only one of the 11 studying HSC mathematics at Mathematics
(2U) or higher, nominated mathematics as a specialty area. Four more nominated Science or
STEM as their area of specialisation. The other five nominating mathematics as a specialty
area all studied Mathematics General which would have been considered as appropriate for
primary teaching. The predominance of English/HSIE majors matches that of teachers
currently in Primary Schools where, in 2014, 46.6% nominated English as their specialty
area and a further 16.8% saw themselves as HSIE specialists (National Teaching Workforce
Dataset, 2014).

70
The two items in the first questionnaire related to perceived aptitude in mathematics and
enjoyment of mathematics at school were:
Q6 At school I was good at maths
Q7 I enjoyed doing maths at school
These elicited the full range of responses as shown in Figure 4.1.
Figure 4.1 Participants’ Perceived Aptitude and Enjoyment of Mathematics at School (n =
33)
The data indicates that 12 of the participants (36%) did not enjoy mathematics at school and
10 participants (30%) felt that they did not do well in the subject. Surprisingly, one of the
six students nominating mathematics as a specialty area disagreed with both statements and
a second was unsure in both cases. The Spearman’s correlation between these items
(𝜌 = 0.889,𝑝 < 0.01) demonstrates a strong association between their enjoyment of
mathematics at school and their perception of aptitude. Also, as the literature points out
(Hill, Rowan & Ball, 2005; Hill & Rowe, 1998) there is a significant correlation between
teachers’ ability in mathematics and their students’ performance in the subject. To have
such a large percentage suggesting that they did not do well in mathematics at school and
that they did not enjoy the subject is of concern and raises questions about the capacity of a
4
6
9
11
3
6 6
89
4
StronglyDisagree
Disagree NotSure Agree StronglyAgree
ComparisonBetweenParticipants'Perceived'AptitudeandEnjomentof
MathematicsatSchool
GoodatMaths EnjoyedMaths

71
substantial number of the participants in creating a classroom environment that would result
in high quality achievement in mathematics.
This data suggests that a substantial number of the participants would possess limited
mental computation skills, which would be associated with low levels of KCT and SCK
(Hill et al., 2008) in this area. It also suggests that many may have a negative or ambivalent
attitude towards instruction in this area (Askew, 2008; Handel, 2003; Sullivan, 2008).
Table 4.4 shows responses separated by course for Items 6 and 7 of the Questionnaire and
includes the results of a Mann-Whitney U test to identify an significant differences based on
course enrolment.
Table 4.4 Responses to Items 6 and 7 by course (n = 33)
Item Course Strongly
disagree
Disagree
Not
Sure
Agree
Strongly
agree
Mean
rank
U p n
6 EDME145 2 4 6 2 2 15.44 129.5 0.382 16
EDME369 2 2 3 9 1 18.47 17
7 EDME145 3 3 5 3 2 15.00 104.0 0.238 16
EDME369 3 3 3 6 2 18.88 17
A comparison of the mean ranks indicates that, for these participants, those in EDME369
responded with a higher level of agreement on both items, but this difference was not
statistically significant.
Table 4.5 illustrates the highest level of mathematics studied by participants at High School
(Item 3), separated by cohort (EDME145 and EDME369)

72
Table 4.5 HSC Courses Studied at High School split by cohort (EDME145/EDME369)
Item Prompt Course Year
10
Year
11
Maths
General
Mathematics
2U
Ext 1 or
higher
n
3 What level of
mathematics did you
complete in High
School?
EDME145 1 0 12 1 2 16
EDME369 1 1 7 5 3 17
A greater number of participants from EDME369 studied more difficult mathematics
courses at High School than did those from EDME145. Forty seven percent of EDME369
participants studied 2U or higher compared to 19% of EDME145 participants. While
comparison of the two data sets does not show a statistically significant difference
(𝑈 = 129.5,𝑝 = 0.794) it is worth considering the performance of those studying higher
levels of mathematics in relation to their mental multiplication test scores.
4.4 Initial Test Results
As mentioned in Chapter 3, the first test involved 15 mental multiplication questions
satisfying the requirements of the Year 5 curriculum outcome ACMNA 100 (ACARA,
2012). The questions were delivered both visually and verbally with a 15-second delay
between questions. The participants were asked simply to record their answer and the
answer sheet left little room for working.
The results for Test 1 are summarised in Figure 4.2.

73
Figure 4.2 Distribution of Scores (out of 15) in Test 1 (n = 36).
Considering that this was designed as an exit test for a Year 5 cohort after experiencing
tuition in mental multiplication techniques, it was expected that the performance of the pre-
service teachers would be substantially better than a mere pass. The test scores ranged from
0 to 11 with only eight students (22%) scoring 8/15 or better. The participant with the
highest score of 11/15 was the oldest of the group, had studied General Mathematics at the
HSC and felt she had done well at school though not sure if she enjoyed the subject. There
was agreement with the statements suggesting that she used mental multiplication as an
adult and was aware and confident with a range of strategies.
The mean and standard deviation of the test (all participants) were, respectively 𝜇 = 4.3,
𝜎 = 2.8 and showed a distinct lack of SCK in a timed situation. If split into the two courses,
EDME145 and EDME369, the frequency distribution, test means and standard deviations
were as follows in Figure 4.3 and Table 4.6
024681012141618
0to3 4to7 8to11 12to15
Test1Scoresgroupedinclasses
n

74
Figure 4.3 Distribution of scores (out of 15) in Test 1 by Course
Table 4.6 Means and Standard Deviations of Test 1 by cohort.
Statistic All Participants
𝑛 = 36
EDME 145
𝑛 = 16
EDME 369
𝑛 = 20
Mean 4.3 3.6 4.9
Std Dev 2.8 2.4 3.0
The comparison between the two cohorts shows a better performance by the third-year
group, however the difference was not statistically significant (𝑡 = −1.44,𝑑𝑓 = 34,𝑝 =
0.160). While it could be argued that the improved results on the test for participants in
EDME369 were better due to increased exposure to Primary Mathematics Methods courses,
caution would need to be exercised in reaching this conclusion without further research,
perhaps with a larger dataset. It should also be noted that the third year cohort reported a
higher, although non-statistical significant, perception of their ability in, and enjoyment of,
mathematics at high school.
In relation to the level of mathematics studied at High School, those opting for the higher
levels of mathematics seemed to perform better in the test. If split into groups of
Mathematics (2U) and above, General Mathematics and no HSC mathematics, the means of
each group increased with the difficulty of the course studied as shown in Table 4.7
10
4
2
0
7 76
0
0to3 4to7 8to11 12to15
DistributionofTest1ScoresbyCourse
EDME145 EDME369

75
Table 4.7 Test 1 Means Based on Course Studied at High School
Item Prompt Year 10 Year 11 Maths General Mathematics 2U Ext 1 or higher
𝑋 𝜎 𝑛 𝑋 𝜎 𝑛 𝑋 𝜎 𝑛 𝑋 𝜎 𝑛 𝑋 𝜎 𝑛
3 Level of
Mathematics
in High
School
1 0 2 4 na 1 4.32 2.75 19 5.33 3.08 6 5.4 3.58 5
Having said that, the choice of course at the HSC was not strongly associated with
performance in the mental multiplication test. The correlation between the two factors was
relatively low, but close to statistical significance (𝜌 = 0.314,𝑝 = 0.075). It was interesting
to note that students in the 2U and above group scored both the second highest score of 9/15
and the lowest score of 0/15. General Mathematics, although devoid of calculus and higher-
level algebra, trigonometry and abstract geometry, would still be viewed as highly
appropriate for the needs of Primary pre-service teachers, particularly in relation to basic
computations. This is supported by previous research by Askew (2006) that suggests that
the procedural knowledge needed to pass higher level mathematics courses has little
relationship to the conceptual knowledge needed to teach and understand number sense
based activities such as mental computation.
Similarly, subject specialisation was not a strong predictor of success in timed testing,
Those choosing mathematics or STEM as a subject specialisation (n=11) had a test mean
and standard deviation of 𝜇 = 4.9, 𝜎 = 3.2. The larger standard deviation resulted from a
bi-modal distribution of scores with six of this group scoring between 0 and 4 and the
remaining five scoring between 7 and 9.
In terms of performance in the mental multiplication timed test, results did, to differing
extents, model the level of mathematics studied at school, perceived ability in mathematics
and enjoyment of the subject, with the best predictor being the candidates’ enjoyment of the
subject at school although none of these comparisons were statistically significant. It would
seem that these three elements were certainly factors in the higher level of performance of
the third year group in the timed test, although their results would still be considered as poor
in terms of their overall SCK.

76
One question not asked of participants that could have proved useful was a self-assessment
of their confidence with times table facts from 2 to 10. Responses in the coding sheets and
open-ended comments showed a weakness for some in this area. For example, two
responses to Question 16 (optional comments) were:
“I'm very horrible at anything above 5 time tables other then 10”
“These mathematical questions are extremely difficult to do in someone’s head, after a
long period of time not doing time tables (especially larger digits)”
If this research were to continue into primary school classrooms, initial testing of times
table facts would be an element of the research design to consider.
4.5 Participant Confidence in the Use of Mental Multiplication Strategies
Items 8 to 11 of the first questionnaire dealt with the participants’ personal knowledge of
mental computation strategies and their confidence in using these strategies (SCK). Table
4.8 details their responses to the three questions.
Table 4.8 Responses to Questions 8 to 11 (𝑛 = 33).
Item
No Text Strongly
Disagree
Disagree Not
Sure
Agree Strongly
Agree
8 I learned a number of mental
computation strategies at school
5 7 8 10 3
9 As an adult I use mental
computation regularly
4 6 7 11 5
10 I am aware of a range of strategies
for mental computation
4 3 11 13 2
11 I am confident in using a range of
strategies for mental computation
4 12 9 6 2
These responses are presented in an alternate tabulation such as Table 4.9, where responses
indicating agreement and disagreement have been amalgamated.

77
Table 4.9 Grouped Percentages Showing Degree of Agreement with Questions 8 to 11
Prompts.
Question Prompt Disagree % Not Sure
%
Agree %
8 I learned a number of mental computation strategies at
school
36% 24% 39%
9 As an adult I use mental computation regularly 30% 21% 48%
10 I am aware of a range of strategies for mental
computation
21% 33% 45%
11 I am confident in using a range of strategies for mental
computation
48% 27% 24%
Responses to Question 8 suggest that the minority (39%) recall specific teaching of mental
computation at school with 36% disagreeing with the prompt to some extent. Considering
the focus placed on mental computation since the early 1990’s in curriculum planning
documents (Australian Education Council, 1991) and in current curriculum documents
(ACARA, 2012), this suggests that there is still considerable work to be done in schools in
this important area of numeracy and number sense. This sample of pre-service teachers had
a median age in the 18 to 25 years bracket and should all have encountered mental
computation as part of their schooling.
Nearly half of the respondents (48%) agreed that they used mental computation as adults
regularly and a similar percentage were aware of a range of strategies for mental
computation (45%). However, a low 24% felt confident about using these with almost half
(48%) lacking confidence in this area.
Correlations between Test 1 results and these four questions are shown in Table 4.10.

78
Table 4.10 Correlation Matrix for Test 1 and Responses to Items 8 to 11 of the
Questionnaire (n=33 T1, n=34 Q’s 8, 9, 10, 11)
Spearman’s Correlations Test 1 Q8 Q9 Q10 Q11
Test 1 1.000 .333 .632** .639** .634**
Sig (2-tailed) .058 .000 .000 .000
Q8
1.000 .326 .437** .592**
Sig (2-tailed) .060 .010 .000
Q9
1.000 .776** .646**
Sig (2-tailed) .000 .000
Q10 1.000 .659**
Sig (2-tailed) .000
Q11 1.000
Sig (2-tailed)
** Correlation is significant at the 0.01 level (2-tailed)
This table shows that the prompt concerning strategies learned at school (Q8) correlates
poorly with the test results and has no statistical significance. The other three prompts (Q9
to 11) all correlate in the moderate to strong range with the test results. This may suggest
that participant’s awareness and perceived confidence as adults with mental multiplication
is a better predictor of test results than those previously mentioned i.e. participant’s
experience with mental computation strategies at school, the level of mathematics studied at
school and their subject specialisations and their enjoyment and perceived ability in
mathematics at school. One interpretation of these findings is that schooling has had limited
effect on pre-service teachers’ capacities with mental computation. Experience as adults,
seems to be the better predictor of results in this area although the low test scores would
suggest that this experience has been superficial to date.
Whilst test results provided some initial insight into the question of participants’ knowledge
of mental computation strategies, their untimed record of possible strategies that they would
use for each test question provided additional data for this question. The next section
considers that data.

79
4.6 Participant Competence in the Use of Mental Multiplication Strategies
Analysis now turns to untimed coding from the first test and the resultant use of strategies is
shown in Figure 4.4.
Figure 4.4 Strategies Suggested for Test 1 Questions
Figure 4.4 illustrates a data set of 540 entries resulting from 36 participants coding 15
questions each. A number of participants could suggest strategies for the single-digit
multipliers but were unable to suggest any for double-digit multipliers. This resulted in 122
(22.6%) blank entries. The remaining 418 strategies suggested were coded using the
taxonomy that was outlined in Chapters 2 and 3 (Appendix 4). All strategies could be coded
using the taxonomy.
If the strategy suggested could have led to a correct solution of the problem, it was coded as
correct regardless of any concerns about the complexity of the calculation. For example, a
possible Right Left Separated strategy for 45 x 24 is simply to list it as a vertical
multiplication using the formal algorithm. The participants were not asked to show that they
could have correctly done this multiplication.
Eighty-five entries (15.7%) suggested strategies that could be coded, but would have led to
an incorrect answer. A common example of this was to suggest a Left Right Separated
strategy for 21 x 23 as 20 x 20 + 1 x 3. This can be coded as LRS because it suggests
BDF COU BFS RLS LRS FAC PAR CMP CMB BlankIncorrect 5 0 0 27 39 0 6 7 1Correct 50 11 0 94 111 6 55 0 6 122
0
20
40
60
80
100
120
140
160
Frequency
StrategyUseforTest1

80
working from the highest power of ten to the units digits; however it would not lead to a
correct answer as two of the partial products have been left out. An incorrect partitioning
strategy for 40 x 90 was 40 x 100 – 90 and an incorrect Basic Derived Fact strategy for the
same question was ‘4 x 9 = 45 add 2 zeroes’. One student offered seven Compensation
strategies for double-digit multipliers. All would have led to approximations but not the
correct answer. For example ‘21 x 23 = 20 x 24’ is a Compensation strategy that produces a
reasonable approximation but not the exact answer to the multiplication.
Generally errors made in calculations were conceptual rather than procedural. McIntosh
(2006) distinguishes between these types of errors in his testing of students from grades 3 to
10 in Tasmanian and ACT schools between 2001 and 2003. Procedural errors occur when
the student can demonstrate a strategic understanding of the concept involved but makes
careless numerical errors in applying the correct strategy (e.g. 40x90: 4x9=45 add two
zertoes). Conceptual errors involve a more fundamental lack of knowledge concerning the
concept needed to complete the calculation, for example, the Distributive Law. As the
students in this study were not asked to complete the calculations provided in their untimed
strategy analysis section, less procedural errors were evident.
For double-digit multiplication questions (Q 9-15), 29 entries (5.4%) suggested using the
formal algorithm (RLS). This could not have been achieved in the time or without using pen
and paper for working - it is not an appropriate mental multiplication strategy for two-digit
multipliers (Clark, 2005).
This meant that 43.7% of possible entries were blank, obviously incorrect or not viable for
that problem. That does not imply that the remaining 56.3% of suggested strategies would
have definitely led to a correct answer (as mentioned above); they simply had the potential
to do so. The predominant strategy suggestion in this category was Left Right Separated
(LRS) with 111 instances or 20.6% of all strategy suggestions. A further 39 instances
suggested LRS but applied it incorrectly.
The strategies that were used appropriately (56.3%), could be split into two categories:
• inflexible and appropriate to a limited range of problems (BDF, COU and RLS for
one-digit multipliers)

81
• flexible and appropriate for a wider range of questions (LRS, PAR, FAC, CMP,
CMB)
The former totalled 126 entries or 23.3%. The latter totalled 178 entries or 33.0%. This
means that only one third of the strategies proposed by the participants had the potential to
answer the majority of questions involving one- and two-digit multipliers as required by the
Australian curriculum.
The next useful comparison is the range of strategies used, remembering that the Question
10 prompt was ‘I am aware of a range of strategies for mental computation’. Table 4.11
summarises the range of strategies used by each individual participant for the 15 test
questions.
Table 4.11 Variety of Strategies Used by Each Participant in the 15 Test Questions
Number of Strategies Used 1 2 3 4 5
Number of Participants 6 12 7 8 3
% of Participants 17% 33% 19% 22% 8%
The number of strategies use by participants correlated significantly with the result on the
first test (𝜌 = 0.402,𝑝 = 0.020), but the correlation was only moderate, perhaps because
some participants using three or four strategies may have chosen from the simplest
strategies of Counting (COU), Basic Derived Fact (BDF) and Right Left Separated (RLS)
and still not scored well because of the limited application of these strategies.
However, those students who scored 8 or better in the test, all used three or four strategies
correctly and these were generally the more flexible of the options. This included
Partitioning (PAR), but mostly subtractive partitioning such as 19 x 25 = 20 x 25 – 25. Also
evident were six examples of combination strategies such as 15×18 = 15! + 3×15 (BFS +
PAR), 19 x 25 = 16 x 25 + 3 x 25 = 400 +75 (PAR + BFS) and 15 x 18 = 15 x 10 + 15 x 8 =
15 x 10 + 30 x 4 (CMP + LRS). There was limited use of Basic Fact Shortcuts, Factors,
Compensation or Non-Standard Additive Partitioning. One example of Non-Standard
Additive Partitioning was 126 x 4 = 125 x 4 + 4.

82
Half of the participants were only aware of one or two strategies and these were often the
simpler ones. This supports the design of the intervention that introduces a broad range of
strategies to the participants that include those mentioned in both the Australian (ACARA,
2012) and NSW (NESA, 2015) curriculum documents as well as others suggested in the
literature (Caney, 2008; Heirdsfield, Cooper, Mulligan & Irons, 1999; Markovits & Sowder,
1994; Menon, 2003; Whitacre, 2007).
When Questions 9 to 15 of the timed test (two-digit x two-digit) were analysed separately,
the disparity between knowledge of appropriate mental multiplication strategies and their
use in a timed test became greater. Figure 4.5 shows the frequency of correct responses to
these seven questions.
Figure 4.5 Correct Test Responses to Questions Involving Two-digit x Two-digit Problems
from Timed Test 1 (Q 9 – 15), (n=36)
Of those attempting questions with two-digit multipliers, the highest score was 4/7 by one
student with no other student scoring more than 2/7. Sixty-four percent of participants were
unable to answer any of these questions correctly. In terms of appropriate strategies
suggested in the coding sheets, there were only 73 suggested of a possible 252 (29%). The
remainder (71%) were left blank (38%), incorrect (21%) or inappropriate for two-digit
multipliers (12%). Of the 73 appropriate strategies, the majority were LRS (48 occurrences),
non-standard partitioning (18 occurrences), FAC (1 occurrence) and CMB (6 occurrences).
This suggests a lack of appropriate strategies that specifically handle two-digit multipliers
and a strong reliance on the LRS strategy for these problems.

83
Four items of the questionnaire sought to elicit further information about the participants’
knowledge of a wide range of strategies. They reiterated four of the two-digit x two-digit
questions and asked for as many alternate ways of doing the problem as possible.
Consider, for example, 45 x 24. Possible strategies that could be suggested to solve it are as
follows:
LRS 45 x 20 + 45 x 4 = 900 + 180 = 1080
LRS 40 x 24 + 5 x 24 = 960 + 120 = 1080
CMP 90 x 12 = 1080 (double the first and half the second)
CMP 120 x 9 = 1080 (5 x 24 and one fifth of 45)
PAR 20 x 24 + 25 x 24 = 480 + 600 = 1080
PAR 50 x 24 – 5 x 24 = 1200 – 120 = 1080
FAC 24 x 5 x 9 = 120 x 9 = 1080
FAC 45 x 4 x 3 x 2 = 180 x 3 x 2 = 540 x 2 = 1080
CMB 45 x 12 x 2 = (45 x 10 + 90) x 2 = 540 x 2 = 1080 (LRS + FAC)
CMB 90 x 3 x 4 = 270 then double double (CMP + FAC + BFS)
There are many more ways to solve the problem; and the four items in the questionnaire sort
similar responses from the participants. This section was untimed and there was ample room
to include a range of strategies. Participants were asked to outline each strategy without
having to complete the solution. Again, there was a considerable difference between the
responses of the third year group (EDME369) and the first year group (EDME145). Of the
16 participants from EDME145, only five could suggest alternative strategies to any of the
four problems and only seven strategies were suggested. Of these, three were inappropriate
to the question, suggesting the formal algorithm be used. Of the other four, all were LRS.
The EDME369 cohort had 15 of the 17 participants suggesting a total of 50 alternative
strategies. Again, the bulk were RLS (21 responses) or LRS (7 responses). There were also
18 non-standard partitioning (PAR) strategies suggested with the majority being an
expanded LRS strategy with four partial products starting with the highest power of ten.
There were also three strategies using factors (FAC). Six participants who had not been able
to list a possible strategy for the problem on their initial coding sheets now managed to find
one. However, 16 of these alternatives were the formal algorithm (RLS).
Some of the alternate suggestions from both groups, and their codings, were as follows:

84
19 x 25
= 16 x 25 + 3 x 25 (PAR)
= 20 x 25 – 25 (PAR)
= 10 x 25 + 9 x 25 (LRS)
= 10 x 20 +10 x 5 + 9 x 20 + 9 x 5 (PAR)
23 x 12
= 25 x 12 – 2 x 12 (PAR)
= 20 x 12 + 3 x 12 (LRS)
= 10 x 23 + 2 x 23 (LRS)
= 20 x 10 + 20 x 2 + 3 x 10 + 3x 2 (PAR)
21 x 23
= 20 x 23 + 1 x 23 (LRS)
= 20 x 20 + 20 x 3 + 1 x 23 (PAR)
= 20 x 20 + 20 x 3 + 1 x 20 + 1 x 3 (PAR)
= 10 x 23 x 2 + 1 x 23 (FAC+LRS)
45 x 24
= 45 x 20 + 45 x 4 (LRS)
= 45 x 25 - 45 (PAR)
= 40 x 20 + 40 x 4 + 5 x 20 + 5 x 4 (PAR)
= 45 x 4 x 6 (FAC)
= 45 x 10 x 2 + 4 x 40 + 5 x 4 (FAC + PAR)
The greater range of strategies suggested by the third year group suggests a better SCK for
this group and may have been a factor in their better test performance. Still, the range of
suggested strategies from both groups were fairly limited with a majority of blank, incorrect
or inappropriate strategies suggested. The group’s responses as a whole fall short of the
level suggested by the Australian curriculum for Year 5 students and hence the goal for our
pre-service teachers. It is obvious from the above results that this group of pre-service
teachers are not at that level as adults even though their responses to Items 9 and 10 of the
questionnaire may have suggested otherwise.

85
As a final comment on the participants SCK, Table 4.12 repeats the correlation coefficient
matrix for Items 9 to 11 from the Questionnaire.
Table 4.12 Correlation Coefficient Matrix for Items 9 to 11 of Questionnaire
Spearman’s Correlations Q9 Q10 Q11
Q9 1.000 .776** .646**
Sig (2-tailed) .000 .000
Q10 1.000 .659**
Sig (2-tailed) .000
Q11 1.000
Sig (2-tailed)
** Correlation is significant at the 0.01 level (2-tailed)
There was a strong correlation between participants’ responses to these three related
questions regarding their knowledge and use of a range of mental computation strategies.
However, when it came to the harder problems involving two-digit x two-digit
multiplications, the successful use of appropriate strategies markedly declined. This
suggests that while half the participants had a knowledge of mental multiplication strategies,
most of these allowed them to only attempt the simpler multiplications by one-digit
numbers. Few had the ability to suggest appropriate strategies for harder problems (33%)
and their success in applying them was poor.
Future programs of instruction in mental computation need to focus strongly on Basic Fact
Shortcuts to reduce computation time. The shortcuts suggested in the intervention appear to
be unknown to the participants as none were used in the coding sheets or questionnaire. The
more flexible strategies of Left Right Separation and Partitioning were used for 31% of
responses but there was little use of Factors, Compensation and Combinations of strategies.
These would all be seen as essential components of a teacher’s SCK for this topic.

86
4.7 Knowledge of the Place of Mental Computation in the Curriculum
Having considered content knowledge in relation to appropriate mental multiplication
strategies (SCK) in the previous section, analysis moves on to the participants’ knowledge
of the place of mental multiplication in the curriculum. Items 12, 14, 16 and 17 of the
questionnaire addressed that area, with participant responses summarised in Figure 4.6.
Figure 4.6 Responses to KCC Items (n=33)
Again, tabulated as percentages in Table 4.13:
Table 4.13 Responses to KCC Items by Percentage
Item Prompt Strongly
Disagree Disagree Not
Sure Agree
Strongly
Agree 12 I am aware of the place of mental multiplication in
the curriculum. 6% 6% 18% 55% 16%
14 I think mental computation is an essential skill for school students
0% 6% 12% 33% 48%
16 Mental computation is best learned in primary school
3% 0% 33% 30% 33%
17 Mental computation should be taught before formal methods of written computation
9% 18% 39% 21% 12%
Items 14 and 16 indicate quite a strong belief in mental computation being taught to school
students but slightly less acceptance that its best place is in the primary curriculum. One
2 2
6
18
5
02
4
11
16
1 0
11 10 11
3
6
13
7
4
StronglyDisagree
Disagree NotSure Agree StronglyAgree
ResponsestoKCCQuestionsQ12 Q14 Q16 Q17

87
third of participants were unsure that this topic should be placed in primary. This contradicts
the 71% of participants who felt that they knew its place in the curriculum. So in terms of
KCC, this suggests some deficits as the Australian curriculum clearly places it in Year 5.
The other comparison of interest is between Items 12 and 17. Having suggested that a large
majority know the place of mental multiplication in the curriculum (71%), this contrasts
with participants’ views about teaching mental computation before formal algorithms. As
demonstrated in the previous section, there was a considerable reliance on the formal
algorithm as a mental strategy. Fifteen of the 36 participants (42%) used it as one of their
main strategies for the coding sheet. Also, there were 121 entries for the RLS strategy in
coding sheets (22%). It is not surprising that 27% would disagree that mental computation
should be taught before formal algorithms if they believe RLS to be a viable mental
multiplication strategy. This may also reflect the fact that whilst they have not experienced
mental multiplication in their current course, they have encountered the formal algorithm in
its written and graphical forms.
4.8 Knowledge of Content and Teaching
Questions relating to KCT were Items 13, 18 and 19 in the questionnaire with participant
responses summarised in Figure 4.7.
Figure 4.7 Responses to KCT Items from Questionnaire (n = 33)
69 10
7
113 3
13 13
0 02
15 16
StronglyDisagree
Disagree NotSure Agree StronglyAgree
ResponsestoKCTItemsQ13 Q18 Q19

88
Table 4.14 summarises the data in terms of the level of agreement with each prompt.
Table 4.14 Responses to KCT Grouped by Percentage (n=33)
Question Prompt Strongly
Disagree
Disagree Not
Sure
Agree Strongly
Agree
13 I feel confident about teaching mental computation to Year 5
18% 27% 30% 21% 3%
18 All students have the potential to be good at mental computation
3% 9% 9% 39% 39%
19 It is important for students to have as wide a range of mental multiplication strategies as possible to allow them to solve different problems efficiently.
0% 0% 6% 46% 49%
Beginning with item 13, there was a strong lack of confidence in teaching this topic – 45%
disagreed with the prompt and a further 30% were unsure. Only 24% seemed to have some
degree of confidence in their ability to teach this topic. Following some ordinary timed test
results and coding sheets where only 56.3% of strategy suggestions may have led to a
correct answer, the participants’ lack of confidence in teaching the topic seems to be
justified. An interesting comparison is how responses to this item relate to responses for
item 11 ( I am confident using a range of strategies for mental computation). Table 4.15
compares percentage responses for items 11 and 13.
Table 4.15 Comparison Between KCT and SCK Responses to Q11 and Q13
Question Prompt Strongly
Disagree
%
Disagree
%
Not
Sure
%
Agree
%
Strongly
Agree
%
13 I feel confident about teaching mental
computation to Year 5
18% 27% 30% 21% 3%
11 I am confident in using a range of strategies for
mental computation
12% 36% 27% 18% 6%
Whilst the data might seem to be similar, there was little correlation between the two items
(𝜌 = 0.158,𝑝 = 0.381) as further demonstrated by the scatter plot shown in Figure 4.8.

89
Figure 4.8 Scatter Plot of Responses to Items 11 and 13 (n=33).
Only three participants felt both confident with their knowledge and ability to teach the
subject. In one case, this confidence would seem to be misplaced as the participant scored 3
in the test and could only suggest LRS and BDF for strategies and offered only one alternate
strategy for the four problems in the questionnaire. The other two participants both scored
8/15 in the test and had a far greater range of strategies at their disposal and offered
alternatives for the four questionnaire problems.
A second group (𝑛 = 5) seemed to have realistic expectations of themselves and their
ability to teach this topic. They all felt confident; strongly agree (𝑛 = 1) or agree (𝑛 = 4); in
their knowledge of a range of strategies and this was supported by their test scores of
between 7 and 11 (𝜇 = 8.4). Yet, they were unsure (𝑛 = 2) or disagreed (𝑛 = 3) with the
KCT prompt. With appropriate assistance, they should be capable of teaching this topic.
The next group of interest (𝑛 = 5) were not confident with their ability to use mental
computation strategies (strongly disagree=1, disagree =3, unsure=1) but were confident in
their ability to teach the topic (agree=5). This group is of concern as their test average
(𝜇 = 3.2) indicates a substantial weakness in SCK but they still felt confident in teaching
the topic. This concern was compounded when none of the group took up the opportunity of
attending the intervention or reading the notes.
The final group of 20 participants is consistent in their assessment of their ability and
confidence in teaching the topic. They were either unsure or lacked confidence in their

90
ability in mental computation and expressed similar concerns about teaching the topic. This
is supported by this group’s test average ((𝜇 = 3.4) and coding sheets. The fact that they are
realistic about their abilities suggests a willingness to seek help to overcome these
weaknesses and, consequently, seven members of this group attended the intervention.
The response to item 18 demonstrated strong acceptance (79% strongly agree or agree) of
the statement that all students had the potential to learn mental computation strategies
thereby implying that it was not just an extension topic for the more able student. This
certainly reflects the spirit of the current syllabus (NESA, 2015) that asks teachers to
practise mental computation skills on a regular basis with all students and sees it as
important outcome for all students.
Item 19 strongly suggests that the participants are receptive to learning and teaching a wide
range of strategies rather than looking for a few strategies that will answer most questions.
This is consistent with research literature (see Section 2.6) that does suggest the flexible use
of a wide range of strategies. The NSW syllabus objectives (NESA, 2015) however, seem to
suggest a more limited range of strategies, listing only RLS, LRS and FAC in their notes
and examples. Based on coding results, the participants are relying on a limited range of
strategies that include RLS, LRS and PAR with the latter mainly involving Subtractive
Distributive suggestions. It will be of interest to see if their recommendations for their own
teaching programs suggest a wider range of strategies after they have had experience of
other strategies through the intervention.
4.9 Knowledge at the Mathematical Horizon
Items 20 and 21 deal with knowledge that is a component of other topics and strands in the
syllabus. Participant responses for these questions are shown in Figure 4.9.

91
Figure 4.9 Responses to Items 20 and 21 of the Questionnaire (n=33)
Table 4.16 summarises the data in terms of the level of agreement with each prompt.
Table 4.16 Responses to KMH Items Expressed as Percentages (n=33)
Question Prompt Strongly
Disagree
Disagree Not
Sure
Agree Strongly
Agree
20 Mental multiplication promotes critical
thinking and problem solving.
0% 0% 12.1% 39.4% 48.5%
21 Mental multiplication promotes
number sense.
0% 0% 24.2% 42.4% 33.3%
Items 20 and 21 show a strong belief in the use of mental computation as a problem solving
activity (87.9% agreement), and to enhance students’ number sense, (75.9% agreement).
These two questions have a moderately strong correlation (𝜌 = 0.645,𝑝 < 0.01). This was
a surprisingly positive response to what is a central message of the intervention. The use of
non-standard partitioning (PAR) features in the tutorial notes as a way to enhance flexibility
in mental computation by suggesting multiple solution pathways. Using this technique in
combination with other strategies, such as BFS, assists students to solve harder problems
and find alternative solutions. It is this approach that turns mental computation into a
problem solving activity where multiple solution pathways can be explored and assessed.
Examples of this approach were provided in Section 4.5. Research mentioned in the
0 0
4
1316
0 0
8
1411
StronglyDisagree
Disagree NotSure Agree StronglyAgree
ResponsestoKMHItemsQ20 Q21

92
literature review also strongly supports the role of mental computation in enhancing number
sense, whilst also being seen as part of number sense (Barody, 2006; Hartnett, 2007).
4.10 Common Content Knowledge
The last item in the questionnaire to require analysis was Item 15 and it was the only
question in the category of Common Content Knowledge (CCK) that deals with knowledge
common to other professions. Participant responses are shown in Figure 4.10.
Figure 4.10 Common Content Knowledge Responses
This data is summarised in Table 4.17.
Table 4.17 Percentage Comparison of Item 15 Responses
Question Prompt Strongly
Disagree
Disagree Not
Sure
Agree Strongly
Agree
15 I think mental computation is an essential skill
for adults
0% 6.1% 15.2% 27.3% 51.5%
There was strong support (78.8% agree) for the premise that mental computation is an
essential skill for all adults. This supports the literature that suggests that mental
computation is an essential precursor to estimation and approximation and used by adults in
preference to written algorithms (Northcote & Marshall, 2016).
0 25
9
17
StronglyDisagree
Disagree NotSure Agree StronglyAgree
CCKResponsesQ15

93
4.11 Chapter Conclusions
The participation rates from the two cohorts were initially encouraging with 36 of the total
56 candidates agreeing take part in the research. The timing of the research, however, meant
that numbers declined in Phases 2 and 3 as the students faced competing demands on their
time. Phase 1, which involved the initial timed test, test coding and the first questionnaire,
did provide a rich source of data that has been analysed in this chapter.
Despite a willingness to participate and some knowledge of mental computation skills,
initial testing showed deficiencies across both cohorts when it came to implementing
strategies in a timed situation. The third year cohort showed a slightly better aptitude (but
not statistically significant), as did those who had expressed greater confidence in their
mathematical ability during school and greater enjoyment of the subject. Results were not
dependent on the level of mathematics studied at High School or on the participants’ school
experience with mental computation strategies. Rather their experience as adults, their
perceived awareness and confidence with mental computation proved to be a strong
indicator of test performance.
The performance in the first test demonstrated a need for further investigation to ascertain
just what strategies the pre-service teachers knew and could use in their own computations
as adults and in teaching the topic to their prospective students. To this end, Section 4.6
investigated the pre-service teachers’ knowledge and use of mental multiplication strategies
(SCK) in untimed situations. The strategies used in both untimed sections (test coding sheet
and questionnaire) fell into three categories:
• Blank, incorrect or inappropriate to the problem (43.7%)
• Inflexible and appropriate to a limited range of problems (23.3%)
• Flexible and appropriate to a wider range of problems (33.0%)
This is somewhat consistent with Whitacre’s (2007) findings of number sensible mental
strategies that were discussed in the literature review in Chapter 2. Whitacre found that prior
to intervention there was a heavy reliance on the use of the formal algorithm (MASA) as a
mental multiplication strategy (53.5%) with Partial Products being used in 14% of strategy
suggestions. This study found a lower, but still substantial, reliance on the formal algorithm

94
(23% usage) with 28% suggesting LRS (Partial Products). This study also had the added
dimension of blank entries where no strategy could be suggested (23%) and strategies
applied incorrectly (16%).
The use of the more flexible strategies of FAC, BFS, PAR, CMP and CMB is similarly
limited in both studies. Whitacre (2007) found that NAD was used once, SD accounted for
11.6% of strategy use, AP 9.3%, FAC was used once and Derived was used three times.
This study saw PAR (NAD and SD) used 10% of the time with Subtractive Distributive
(SD) being the dominant component. FAC was used on six occasions (1%). CMP (contains
AP) was not used and CMB (Derived) was used six times.
The analysis of the seven questions with two-digit multipliers gave an added dimension to
this study as it highlighted a significant weakness in this area. Only one participant scored
above 2/7 for these questions and there were only 73 appropriate strategies suggested
(29%). The remainder were blank, incorrect or RLS. The section on alternate strategies
using four of the seven two-digit x two-digit problems from the test, yielded 57 alternate
strategies with the dominant suggestions being RLS (24 or 42%) and PAR (18 or 32%).
The only other strategies suggested as alternatives were LRS (11 or 19%) and FAC (3 or
5%).
Having highlighted significant deficiencies in the participants’ SCK, it was then necessary
to assess their knowledge of the place of mental computation in the curriculum. Although
71% of participants felt that they knew the topic’s place in the curriculum, 36% were unsure
or disagreeing with the prompt that it is best learned in primary school, even though the
curriculum firmly places it in Year 5. A further 66% were unsure or disagreeing with the
prompt that it should be taught prior to the formal algorithm despite strong advice to the
contrary in curriculum documents and research literature.
Clark (2005) summarises research that points to the potential dangers of teaching formal
algorithms to primary school students prior to them experiencing their own informal
strategies that include mental computation. He also cites an issue of relevance as the formal
algorithm does not correspond to the way adults think about numbers. He suggests it is less
efficient as a computation strategy and encourages students to give up their own thinking
leading to a blind acceptance of results and over zealous application of the strategy. The
extensive use of RLS as a mental strategy by the participants would suggest that one

95
recommendation of this research would be to suggest that the following clause that appeared
in the 2002 BOS syllabus be added to the present curriculum notes to avoid confusion in
this area:
formal written algorithms are introduced after students have gained a firm understanding of basic concepts including place value, and have developed mental strategies for computing with two-digit and three-digit numbers (BOS, 2002, p. 9).
The next area of interest and analysis was the participants’ knowledge of content and
teaching (KCT). In summary, most had a realistic concept of their own abilities in relation
to mental computation and this translated into an appropriate assessment of their readiness
to teach the topic. Twenty participants (61%) expressed concern, or were unsure regarding
their mastery of a range of strategies and ability to teach the topic. There were five
participants, all with low test scores, who expressed concern about their ability but were still
confident in teaching the topic and did not attend the intervention or access the notes. As the
literature points out (Hill, Rowan & Ball, 2005; Hill & Rowe, 1998) there is a significant
correlation between teachers’ ability in mathematics and their students’ performance in the
subject. As a microcosm, this would suggest that this group may have significant difficulty
in imparting the important concepts in this topic to their students.
The section dealing with KMH showed strong support for contention that mental
computation skills enhanced number sense and problem solving. The research also shows an
increase in flexibility and adaptability when students are encouraged to seek alternate
pathways to mental multiplication problems, a feature of the intervention.
Carroll (1996) found that a focus on students discussing alternate pathways to solutions
using informal and invented strategies led to an increase in number sense and a greater
capacity for mental calculations.
Teaching students strategies that facilitate mental computation, estimation and
number sense and allowing students to investigate, explore and develop
alternatives for numerical computations are essentially the suggested avenues
to improve student mental computation skills. (p. 142)
Rathgeb-Schnierer and Green (2013) speak of flexibility in mental computation as a highly
desirable goal in elementary (primary) education. They define flexibility as “the knowledge

96
of multiple solutions as well as the ability and tendency to selectively choose the most
appropriate ones for a given problem and a particular problem-solving goal” (p. 354).
Mental computation has the ability to enhance number sense and problem solving ability in
students and the approach suggested in the next chapter may facilitate that goal. The strong
support of the participants for these two propositions is encouraging although early evidence
presented in this chapter suggests they are unsure of their own ability in this regard and the
teaching strategies required to promote both objectives.
The ability to use mental computation in conjunction with estimation and approximation is
an important skill for adults and common knowledge in a wide range of trades and
professions. The strong support for this contention was not reflected in their own experience
with mental computation as adults. Only 48% agreed that they used the skill regularly
although four of the five participants who strongly agreed with the prompt scored 8/15 or
better in the first test. The correlation between test results and participants use of mental
computation as an adult was moderately strong at 𝜌 = 0.645 (𝑝 < 0.01).
The next chapter examines strategies presented to the participants and any resultant changes
in their test and coding performance. It then proceeds to look at subsequent changes to the
participants’ perceived knowledge for teaching the topic again using the same set of
questions that focussed on five of the six strands of MKT in the first questionnaire.

97
Chapter 5 Phase 2 and 3: The Intervention and its Effect
5.1 Introduction
This chapter outlines the intervention or Phase 2 of the research project and analyses any
resultant effect in terms of test scores, strategy use and attitude towards mental
multiplication and its place in the curriculum as evidenced in Phase 3. Participants were
given the option of attending a two-hour tutorial, presented by the researcher, on the
strategies suggested for mental multiplication. The tutorial took the form of an interactive
workshop and was offered in each cohort’s usual lecture slot. Due to the voluntary nature of
the tutorial and its placement just prior to assignment deadlines and exams, attendance was
reduced with 11 attending from the original 36 participants – six from EDME145 and five
from EDME369.
The tutorial was presented via PowerPoint slides and each slide had review questions for the
participants to attempt during the session. These slides were posted on each cohort’s
Moodle site along with a comprehensive set of notes and further practice questions. These
notes and the final session of the tutorial appear in Appendix 5. One participant from
EDME145 accessed the notes but did not attend the tutorial and five more accessed the
notes following attendance at the tutorial. Four participants who attended Phases 1 and 2 did
not attend Phase 3 of the project and one completed the test and coding sheet but not the
questionnaire. Three participants completed the questionnaire and answered that they had
attended the lectures and read the notes. As they were not on the tutorial roll and their
coding sheets showed no evidence of the use of new strategies encountered in the notes and
tutorial, their input was not included with the above group.
The notes provide examples of the strategies suggested for this topic and the breadth of
Basic Fact Shortcuts suggested. Due to the limited time available for the intervention, many
of the basic fact shortcuts appear as procedures or, at best, alternatives. Given more time, a
more constructivist approach would have been used allowing students to suggest their own
strategies and build on these suggestions through class discussion. Some procedures are
necessary to shorten calculation time such as Trachenberg and Hall shortcuts (see Apprndix

98
7, pp. 182 – 186). The notes demonstrate a teaching approach for the topic that is designed
to facilitate flexibility and adaptivity in students (through the use of non-standard
partitioning) and present the topic with twin foci of number sensible strategies in a problem
solving setting.
Twenty-five participants completed the test and coding sheet but two of those had not
participated in the initial phases of the project and had not signed consent forms. Their data
is not included in this study. Of the 23 participants who completed the test, 18 then
completed the questionnaire. This included seven participants who were involved in all
three phases of the project. The bulk of analysis in this chapter considers the latter group’s
responses and test and coding sheet results.
Comparisons were made between Test 1 and Test 2 for all participants and then split into
the three groupings dependent on participation in some or all of the Phases. A similar
analysis of coding sheet results looked at the two groups who completed both tests with the
difference being participation in Phase 2. Comparisons of the questionnaire items were
again split into the relevant components of the MKT framework outlined in Chapter 3. This
section uses data exclusively from the seven participants who completed all three Phases.
As this is a small sample, it was difficult to apply traditional measures of significance to
comparisons between the data sets obtained in Phases 1 and 3. De Winter (2013) argues that
the t-test is acceptable provided effect sizes are large. He recommends use of the paired
samples t-test and Wilcoxon test for small populations and these appear in the analysis.
The lack of any significant difference between the two cohorts of EDME145 and EDME369
demonstrated in Chapter 4, resulted in comparisons between groupings based on Phase
attendance rather than by cohort in this chapter.
5.2 Participant Evaluation and Recommendations from Phase 2
Eleven participants attended the intervention and six of those also completed all of Phase 3.
One other participant attended the lecture and completed the test and coding sheet but not
the final questionnaire. Another participant accessed the notes without attending the lecture
and completed Phase 3. Table 5.1 shows the responses of the six participants who were
involved in both Phase 2 and 3.

99
Table 5.1 Combined Ratings of Tutorial and Notes (n = 6)
Item Prompt Of No
Value
Of
Little
Value
Of
Moderate
Value
Of
Considerable
Value
Of Great
Value
28 If you attended the
tutorial, please rate it
0 0 2 0 4
30 If you studied the notes,
please rate them
0 0 0 3 3
Both the tutorial and the notes rated highly amongst the participants who accessed them,
with the notes receiving slightly higher ratings than the two-hour tutorial. There were no
participants who found them of little or no value. The participants were then asked which of
the strategies they encountered in the tutorial or notes should be taught to a Year 5 class. Six
participants completed this question and their choices are shown in Table 5.2. It was
assumed that BDF and COU strategies would have been taught in Year 4 and, hence, they
were not included in this list.
Table 5.2 Choice of Strategies for a Year 5 Class (n=6)
Strategy BFS LRS RLS FAC PAR CMP
Frequency 6 6 0 1 6 6
Two important points come from analysis of this item. Firstly, the complete lack of support
for the formal algorithm as a mental multiplication strategy (RLS). Secondly, the unanimous
support for Basic Fact Shortcuts (BFS), Left Right Separated (LRS), non-standard
Partitioning (PAR) and Compensation (CMP) as essential components of a teaching
program for this topic. Compared with CMP, Factors (FAC) received little support, even
though they are complementary strategies. Since the two strategies are closely related, it
may be possible to combine them in future research into one heading containing factors and
compensation. The preference for CMP over FAC in the participants’ teaching program is
also of interest as FAC and LRS are the only strategies mentioned in the current NESA
(2015) syllabus documents that relate to mental multiplication at this level.

100
Participants were then asked to rate each strategy separately with the results shown in Table
5.3
Table 5.3 Participant Ratings of Individual Strategies from the Intervention (n=6)
Code Strategy Of No
Value
Of
Little
Value
Of
Moderate
Value
Of
Considerable
Value
Of
Great
Value
BFS Basic Fact Shortcuts – shortcuts
for multipliers from 2 to 12, 15
and 20.
0 0 1 1 4
LRS Left to right separated – standard
partitioning
0 0 1 1 4
RLS Right to left separated –
visualising the formal algorithm
0 2 3 1 0
FAC Factors 0 0 3 3 0
PAR Partitioning (Non-standard) 0 0 0 2 4
CMP Compensation 0 1 0 1 4
From these responses, the relative value of the strategies to the participants can be expressed
in a hierarchical order from most valued to least valued as shown in Table 5.4. To achieve
this, rating options were allocated a value from 0 for Of No Value to 4 for Of Great Value.
A total summated score was calculated for each strategy, with the strategies ordered
according to the total score from highest to lowest.
Table 5.4 Participant Ratings of Strategies in Order
Rating Most
Valued
Least
Valued
Strategy PAR BFS/LRS CMP FAC RLS
The participant who saw CMP being of little value would still include it in their teaching
program. The participant who mentioned RLS as being of considerable value would not
have had it in their teaching program but would have used it as an extension strategy. Those
strategies chosen as extension strategies are shown below in Table 5.5.

101
Table 5.5 Strategies Participants Would Use as Extensions to Their Program (n=7)
Strategy BFS LRS RLS FAC PAR CMP
Frequency 3 3 5 4 5 6
This question may have been confusing to participants. Two suggested that they would use
all six strategies for an extension group having left out some in their mainstream teaching
program. One suggested the two strategies as extensions that were left out of her teaching
program. Those choosing RLS as an extension did not have it as part of their mainstream
program. This, perhaps, indicates that they view it as more appropriate for able students
after encountering an initial program of mental multiplication. All those choosing BFS,
LRS, PAR and CMP as extensions also had them as part of their mainstream teaching
program.
A final question asked participants how they would pace their instruction for this topic (with
a Year 5 class) with the results shown in Table 5.6.
Table 5.6 Suggested Duration of Instruction for Year 5 (n=7)
Duration of
Instruction
Two to Three
Weeks
Over One
Term
Over Two
Terms
Over Three or Four
Terms
Frequency 1 2 2 2
The mixed response to this question suggests there may be some uncertainty amongst
participants about the time needed to teach this topic to Year 5. However, the majority
would see it as taking at least one term to complete and possibly more. This is in keeping
with the current NESA (2012) syllabus recommendation MA3-6NA that states:
In Stage 3, mental strategies need to be continually reinforced
(NESA, 2015: Multiplication and Division 1, Backgound Information, para 2)
Four participants also chose to comment on the intervention in the free response section of
the questionnaire.

102
Comment 1:
I found that the lecture on the mental computation to be interesting since I was
unaware of the range of mental strategies that could be used and how to teach them.
The comment above indicates a growth in this participant’s SCK and KCT as a result of the
intervention and a lack of knowledge of mental multiplication strategies from previous
school and tertiary experiences.
Comment 2:
The content learnt is very valuable to young children as the different strategies help
visualise the process of multiplication and overall improve a child's number sense
and ability to modify numerals and equations to suit the task at hand.
This comment demonstrates a similar growth in this participant’s KCT as well as an
understanding of the topic’s contribution to number sense and flexibility in problem solving.
Comment 3:
Extremely useful tool for teachers as well when generating equations for children. I
think that coming from not being able to do any mental multiplication larger than
single digits, this has given me a much broader range of skills. Given more time to
learn and consolidate the strategies I would be confident that I would be able to
answer the test questions efficiently.
The above comment indicates a growth in this participant’s SCK. It also highlights the short
duration of the intervention and the need for more time to fully digest the information.
Comment 4:
I am not a strong mathematician and have struggled with it since High School.
Personally, the very first thing my brain goes to is always the formal algorithm.
After participating in this trial I am definitely aware that my difficulties in maths
stem from being taught mental skills at school, then being taught the formal
algorithm. After I learnt the formal algorithm, I decided that this was obviously the
correct and 'adult' way to do multiplication so this is what I used. And so I forgot all
the important mental skills. I also have trouble visualising and manipulating

103
algorithms to make them easier to complete. Although intellectually I always know
it is an option, to me it feels wrong to be able to simply change the question to an
easier one. As a result I now don't really know where to start when doing these
manipulations.
The last comment provides insight into the effect of the formal algorithm that has concerned
many researchers, particularly Clark (2005), who contends that the formal algorithm
“encourages children to give up their own thinking, leading to a loss of ‘ownership of ideas’
and tends to lead to blind acceptance of results and over-zealous applications” (p. 97).
Handal (2003) comments that “pre-service teachers bring into their education program
mental structures overvaluing the role of memorization of rules and procedures in the
learning and teaching of school mathematics” (p. 49). Whilst this participant has certainly
identified that as a problem, the short intervention was not sufficient to allow him to feel
confident with alternate pathways to solutions. He did, however, improve his score in the
second test and used a greater range of strategies in more questions in his second coding
sheet.
5.3 Comparisons of Participant Test Performance
There was a two-week gap between Test 1 and Test 2 and the number of participants
attempting Test 2 (n = 23) declined from Test 1 (n = 36). Hence the comparisons in Figure
5.1 of distributions by class in both tests are expressed in terms of percentages.

104
Figure 5.1 Distribution of Test Scores by Class Expressed as %
Scores ranged from 0 to 11 in Test 1 compared with a range between 1 and 13 in Test 2.
While the pass rate increased from 22% in Test 1 to 30% in Test 2, as mentioned
previously, a mere pass could not be considered as mastery of mental multiplication at a
Year 5 exit level. The 13% who scored 12 or more could be reasonably satisfied with their
performance in relation to their own SCK. A dependent samples t-test was conducted for the
23 participants who had completed both Test 1 and Test 2, with a statistically significant
improvement in performance identified: (𝑋!"#$ ! = 4.43,𝜎!"#$ ! = 3.31,𝑋!"#$ ! =
5.81,𝜎!"#$ ! = 3.70,𝑑𝑓 = 20, 𝑡 = −3.185,𝑝 = 0.005).
The improvement in test means could have resulted from the intervention but other factors
may also have had a bearing on this. For example, the second test may have been easier,
there could have been a practice effect, and/or the quality of the testing cohort may have
changed. The high correlation of Test 1 and 2 scores, 𝜌 = 0.82, may indicate that there was
consistency in the test design, administration and environment and, indeed, that was true.
The tests were administered in the same location, at the same time of day and using the
same presentation mode (PowerPoint slides of 15 second duration). The test questions were
also similar as shown in Table 5.7
47
3122
0
3930
1713
0to3 4to7 8to11 12to15
DistributionofScoresT1/T2byClass,ExpressedasPercentages
%T1 %T2

105
Table 5.7 Distribution of Test Questions by Category
Test Retest
No. Question NSW Outcome No. Question
1 40 x 90 2 x 2 digit 1 50 x 90
2 5 x 8000 1 x 4 digit 2 6 x 7000
3 18 x 6 1 x 2 digit 3 22 x 6
4 5 x 19 1 x 2 digit 4 5 x 23
5 126 x 4 1 x 3 digit 5 217 x 4
6 9 x 45 1 x 2 digit 6 9 x 37
7 3 x 195 1 x 3 digit 7 3 x 295
8 143 x 7 1 x 3 digit 8 321 x 8
9 19 x 25 2 x 2 digit 9 23 x 25
10 23 x 12 2 x 2 digit 10 32 x 12
11 15 x 18 2 x 2 digit 11 14 x 17
12 21 x 23 2 x 2 digit 12 32 x 31
13 123 x 11 3 x 2 digit 13 432 x 11
14 45 x 24 2 x 2 digit 14 24 x 35
15 34 x 35 2 x 2 digit 15 46 x 45
The table demonstrates consistency in the categories of each question asked in the two tests.
There were nine questions with the same multiplier, while others were of a similar
difficulty. The products for the two sets of questions were larger in Test 2 with only two
exceptions. This suggests, that the second test may have been slightly more difficult that the
first. For example, consider Question 12, Test 1
21 x 23 = 20 x 23 + 1 x 23 = 460 + 23 = 483
This uses LRS. The same strategy applied to Question 12, Test 2 produces:
32 x 31 = 30 x 32 + 1 x 32 = 960 + 32 = 992

106
Tripling would normally be seen as more difficult than doubling so the second question
would be considered slightly more difficult. Given that, the second test does not appear
easier than the first.
Practice effect is defined by the APA Dictionary of Psychology (2007) as “any change or
improvement that results from practice or repetition of task items or activities”. The
Dictionary then expands further:
The practice effect is of particular concern in experimentation involving within-subjects
designs as participants’ performance on the variable of interest may improve simply from
repeating the activity rather than from any study manipulation imposed by the researcher
(VandenBos, 2007).
Twenty-one students completed both the pre- and post-test, with seven of these completing
the intervention. A paired samples t-test completed for those who did not complete the
intervention indicated an improvement on the second test that was close to being
statistically significant:
(𝑋!"#!!"#! = 4.71,𝜎!"#!!"#! = 3.54,𝑋!"#$!!"#! = 5.79,𝜎!"#$!!"#! = 3.53, 𝑡 = −1.883,𝑝 =
0.082,𝑑𝑓 = 10, suggesting that there may have been some training effect. Future research
designs would benefit from a larger time gap between testing, thus allowing for a longer
intervention as mentioned below.
The seven participants who completed the intervention and both tests demonstrated a
statistically significant improvement: 𝑋!"#!!"#! = 3.86,𝜎!"#!!"#! = 2.99,𝑋!"#$!!"#! =
5.86,𝜎!"#$!!"#! = 4.30, 𝑡 = −3.240,𝑝 = 0.018,𝑑𝑓 = 6. A comparison of the
improvement for the two groups was done by subtracting the pre-test result from the post-
test result for the 23 students and then performing an independent samples t-test based upon
whether the intervention had been completed. While those who completed the intervention
demonstrated more improvement, the difference was not statistically significant:
𝑋!" !"#$%&$"#'(" = 1.07,𝜎!" !"#$%&$"#'(" = 2.13,𝑋!"#$%$"#&'" = 2.00,𝜎!"#$%$"#&'" =
1.63, 𝑡 = −1.010,𝑝 = 0.325,𝑑𝑓 = 19.
This analysis indicates that, while those students who completed the intervention have
obtained improved results, a longer intervention would be required to achieve statistically

107
significant improvements in performance. The intervention in this study was limited in
length, largely due to time constraints arising from unit requirements.
To consider this further, we need to split the test results into groupings shown in Table 5.8.
Table 5.8 Test Statistics Based on Phase Groupings
Test All groups Phase 1 only
Group 1
Phases 1 and 3
Group 2
All Phases
Group 3
𝑋 𝜎 𝑛 𝑋 𝜎 𝑛 𝑋 𝜎 𝑛 𝑋 𝜎 𝑛
1 4.3 2.8 36 4.2 2.4 13 4.6 1.3 16 3.9 3.0 7
2 5.7 3.7 23 5.6 3.5 16 5.9 4.3 7
The 16 participants completing both tests but not attending the intervention had a 21.6%
improvement in their mean result. The seven participants involved in all three Phases had a
51.9% increase in their mean result. This suggests that there was a substantial net effect of
the intervention in improving the test scores of the seven participants involved in all three
Phases.
It is hypothesised that the improvement in scores resulted from a combination of practice
effect and the intervention with the latter having a substantial effect on the scores of the
seven participants who completed it. It is also interesting to note that this group of seven
started with the lowest test mean of the three groupings and ended with the highest test
mean. This is directly related to a low SCK in five of the seven participants and a lack of
confidence in their mental computation abilities as shown in Section 4.5
The seven two-digit x two-digit problems (Q9 to Q15) continued to be difficult for both
groups who attempted the second test. The group experiencing the intervention (n=7) were
able to lift their total score in this area from four correct to 10, but one participant accounted
for six of those 10. The group not experiencing the intervention (n=15) lifted their score
from 10 to 15 with one participant scoring five of those 15. A greater improvement by the
intervention group but certainly not significant to the study as the level of competency of
both groups remained low (apart from two participants).

108
Whilst the improvement in scores was encouraging, the means of all groupings including
those who had experienced the intervention were still well below the level that would
indicate some mastery of the topic knowledge (SCK). An analysis of strategy use by the two
groups who did both tests may provide some further insight into the efficacy of the
intervention program
5.4 Comparison of Strategy Use by Participants Completing Both Tests
A group of 15 participants completed Test 1 and Test 2 but not the intervention. Their
strategy suggestions for the 15 questions in both tests are shown in Table 5.9.
Table 5.9 Strategy Suggestions of Group 2 (n=15)
Strategies BDF COU RLS LRS PAR FAC BFS CMP CMB Blank Total
T1 correct 24 9 28 25 28 0 0 0 5 51 170
T1 incorrect 1 0 17 28 2 0 0 7 0
55
Subtotals 25 9 45 53 30 0 0 7 5 51 225
T2 correct 24 1 38 46 20 0 1 0 0 39 169
T2 incorrect 1 0 10 37 2 0 0 6 0
56
Subtotals 25 1 48 83 22 0 1 6 0 39 225
Strategy usage in the second test showed a slightly improved awareness of mental
multiplication that could be attributed to practice effect i.e. the opportunity to reflect and
interact with other participants after Test 1 may have been responsible for the few major
changes in the choice of strategies. Certainly, the number of blank entries decreased from
22.7% to 17.3%. There was an increase in LRS, one of the preferred mental strategies in
syllabus documents, however, the large number of incorrect applications of that strategy
indicates that the participants are not confident with its use particularly with two-digit
multipliers. This was also evident in Test 1. The use of RLS persisted showing a misplaced
reliance on the formal algorithm for mental multiplication, particularly with two-digit
multipliers (15 strategy suggestions). There was, again, little use of sophisticated strategies
such as BFS, CMP and CMB. The same participant again applied an incorrect compensation
strategy to six of the two-digit x two-digit problems.

109
Using the same breakdown as in the previous chapter, the strategies used fell into three
categories as shown in Table 5.10.
Table 5.10 Strategy Suggestions of Group 2 by Category (n=15)
Strategy Category Test 1 Test 2
Blank, incorrect or inappropriate to the problem 49.3% 48.9%
Inflexible and appropriate to a limited range of problems 24.9% 21.3%
Flexible and appropriate for a wider range of problems 25.8% 29.8%
This was a slight improvement on strategy suggestions by Group 2 (no intervention) but still
poor in terms of the participants’ SCK and, as a consequence, their ability to teach the topic
effectively. Almost 50 % of the strategy suggestions from this group in both tests were
either blank, incorrect or inappropriate to the problem.
The strategy use of the eight participants that completed the intervention and both tests is
shown in Table 5.11.
Table 5.11 Strategy Suggestions Group 3 (n=8)
Strategies BDF COU RLS LRS PAR FAC BFS CMP CMB Blank Subtotals
T1 correct 10 0 36 34 13 6 0 0 1 14 114
T1 incorrect 1 0 1 3 1 0 0 0 0
6
Subtotals 11 0 37 37 14 6 0 0 1 14 120
T2 correct 14 0 4 31 10 3 18 1 2 31 114
T2 incorrect 0 0 0 4 2 0 0 0 0
6
Subtotals 14 0 4 35 12 3 18 1 2 31 120
The second set of strategy choices of these eight participants did show a marked change
from Test 1 choices. The almost complete abandonment of RLS as a choice was
encouraging and the four instances of it were all with single digit multipliers. There was a
considerable increase in the use of BFS, all applied appropriately and correctly. Other
strategy choices remained largely consistent although there was an increase in blank entries
from 14 (11.7%) to 31 (25.8%). Without interview, the latter would be difficult to explain.

110
However, three of the four participants who left blanks on their coding sheet were later able
to suggest alternate strategies to four of those questions repeated in the questionnaire.
Using the same criteria as above, the strategies used fell into three categories as shown in
Table 5.12.
Table 5.12 Strategy Suggestions of Group 3 by Category (n=8)
Strategy Category Test 1 Test 2
Blank, incorrect or inappropriate to the problem 30.0% 30.8%
Inflexible and appropriate to a limited range of problems 25.0% 15.0%
Flexible and appropriate for a wider range of problems 45.0% 54.2%
This again, demonstrates an improvement in this group’s strategy use above that of the
comparison group not experiencing the intervention or notes. Whilst the timed test scores
for this group remains low, their knowledge of, and use of, more flexible strategies suggest
that their performance could improve with practice. Over 50% of strategies suggested by
this group were of the more flexible category and appropriate for a wider range of problems.
The next useful comparison is the range of strategies used, remembering that the Question
10 prompt was ‘I am aware of a range of strategies for mental computation’. Table 5.13
summarises the range of strategies used by each individual participant for the 15 test
questions.
Table 5.13 Variety of Strategies Used by Each Participant in the 15 Test Questions
Group 2 Number of Strategies
Used
1 2 3 4 5 6 Total
Phases 1 and 3 only Number of Participants 3 4 6 2 15
% of Participants 20% 27% 40% 13% 100%
Group 3 Number of Strategies
Used
1 2 3 4 5 6
All 3 Phases Number of Participants 1 3 2 1 1 8
% of Participants 12.5% 37.5% 25% 12.5% 12.5% 100%

111
The range of strategies suggested, even amongst the weaker participants, increased
markedly for the group encountering all three phases of the study. The top three scores in
the test all used four or more strategies with the highest score using six strategies. By
contrast, the range of strategies used by the group who did not experience the intervention
stayed the same and top scores used between two and four strategies.
The questionnaire repeated four questions from the test and asked for alternate solutions to
the problems. The questions were of similar types to those used in the first questionnaire
and the responses from both questionnaires for Groups 1 and 2 are shown in Table 5.14.
Table 5.14 Comparison of Alternate Strategy Suggestions Between Tests and Groups
Test 1 RLS LRS PAR FAC BFS CMP CMB Total
Group 2 (n=10) 6 7 3 0 0 0 1 17
Group 3 (n=7) 12 6 7 0 0 0 0 25
Test 2
Group 2 (n=10) 0 12 6 0 0 1 0 19
Group 3 (n=7) 0 6 9 4 3 1 0 23
In both groups, the use of RLS disappeared entirely in Test 2 alternate suggestions. Group 3
containing participants who experienced the intervention were able to suggest more
alternates in Test 1 but they had a heavy reliance on RLS (12 of 25 suggestions) with only
two other strategy types offered. In the second test they also offered more alternatives that
Group 1 but now had a much wider strategy repertoire of five different strategies compared
to three from Group 1.
To illustrate the approach when coding solutions, some of the responses, from both groups
are shown. Trachtenberg’s and Hall’s methods are detailed in the tutorial notes (Appendix
5, pp. 182 – 186) and are shortcuts that apply to mulitpliers of 11, 12 and 9 respectively.
23 x 25
= 23 ÷ 4 x 100 (CMP)
= 25 x 25 – 2 x 25 (PAR)
= 20 x 25 + 3 x 25 (LRS)

112
= 20 x 20 +20 x 5 + 3 x 20 + 3 x 5 (PAR)
= 23 x 5 x 5 = 115 x 5 (FAC)
32 x 12
= 32 x 11 + 32 (PAR)
= Trachtenberg’s method (BFS)
= 30 x 12 + 2 x 12 (LRS)
= 10 x 32 + 2 x 32 (LRS)
= 30 x 10 + 30 x 2 + 2 x 10 + 2 x 2 (PAR)
14 x 17
= 14 x 10 + 14 x 7 (LRS)
= 17 x 10 + 4 x 17 (LRS)
= 20 x 14 – 3 x 14 (PAR)
= 15 x 17 – 17 (PAR)
= 14 x 7 x 2= 98 x 2 (FAC)
= 12 x 17 + 28 (BFS + PAR)
9 x 37
= 9 x 30 + 9 x 7 (LRS)
= 10 x 37 - 37 (PAR)
= Hall’s method (BFS)
= 37 x 3 x 3 (FAC)
= 30 x 3 x 3 + 9 x 7 (FAC + PAR)
= 9 x 40 – 3 x 9 (PAR)
Note: For explanations of Trachenberg’s methods and Hall’s method see workshop notes in
Appendix 5, pp. 182 -186.

113
5.5 Changes in Participant Knowledge of Mental Computation
5.5.1 Introduction
This section deals with any changes in the knowledge of those participants who experienced
the intervention and answered both questionnaires (n=7). The changes are related to Hill,
Ball and Schilling’s (2008) framework for MKT.
5.5.2 Changes in Participants’ Perceived SCK
Items 10 (I am aware of a range of strategies for mental computation) and 11 (I am
confident in using a range of strategies for mental computation) of both questionnaires dealt
with the participants’ personal knowledge of mental computation strategies and their
confidence in using these strategies (SCK). Table 5.15 summarises their responses to these
questions. The result of a Wilcoxon Signed Ranks test is also shown.
Table 5.15 Responses to Items 10 and 11 for Both Questionnaires (𝑛 = 7)
Item
No
Strongly
Disagree
Disagree Not
Sure
Agree Strongly
Agree
Z p
10 Q1 1 2 0 3 1 -1.508 0.132
10 Q2 0 0 1 3 3
11 Q1 1 3 0 2 1 -1.469 0.142
11 Q2 1 1 0 3 2 Note: Q1 stands for Questionnaire 1 and Q2 for Questionnaire 2
While the differences are not statistically significant, largely due to the small sample size,
this shows a substantial improvement in awareness of strategies and confidence in using
them.
5.5.3 Changes in Participants’ Perceived KCC
Having considered content knowledge in relation to appropriate mental multiplication
strategies (SCK) in the previous section, analysis moves on to the participants’ knowledge

114
of the place of mental multiplication in the curriculum (KCC). Items 12, 14, 16 and 17 of
both questionnaires addressed this area, with participant responses summarised in Table
5.16. The result of a Wilcoxon Signed Ranks test is also shown.
Table 5.16 Responses to KCC Items in Both Questionnaires (n=7)
Item Prompt Str’ly
Disagree
Dis-agree
Not Sure
Agree Str’ly Agree
𝑍 𝑝
12 Q1
I am aware of the place of mental multiplication in the curriculum.
1 4 2 -1.732 0.083
12 Q2
3 4
14 Q1
I think mental computation is an essential skill for school students
1 2 4 -1.732 0.083
14 Q2
1 6
16 Q1
Mental computation is best learned in primary school
1 2 4 -0.577 0.564
16 Q2
1 1 5
17 Q1
Mental computation should be taught before formal methods of written computation
5 1 1 -2.271 0.023
17 Q2
3 4
Note: Q1 stands for Questionnaire 1 and Q2 for Questionnaire 2
The participants all agree that mental computation is an essential skill for school students.
There is an increased awareness of the place of mental computation in the curriculum and
all see it being taught prior to the formal algorithm. The latter statement is encouraging as
many were previously uncertain about this. The placement of the topic in the primary
curriculum was supported by six of the seven participants.
5.5.4 Changes in Participants’ Perceived KCT
Questions relating to KCT were Items 13, 18 and 19 in both questionnaires with participant
responses summarised in Table 5.17. The result of a Wilcoxon Signed Ranks test is also
shown.

115
Table 5.17 Frequency of Responses to KCT Items in Both Questionnaires (n=7)
Item Prompt Strongly
Disagree
Disagree Not
Sure
Agree Strongly
Agree
𝑍 𝑝
13 Q1 I feel confident
about teaching
mental computation
to Year 5
1 2 3 1 -1.841 0.066
13 Q2 3 3 1
18 Q1 All students have
the potential to be
good at mental
computation
3 4 -1.000 0.317
18 Q2 2 5
19 Q1 It is important for
students to have as
wide a range of
mental
multiplication
strategies as
possible to allow
them to solve
different problems
efficiently.
3 4 -.0577 0.564
19 Q2 2 5
Note: Q1 stands for Questionnaire 1 and Q2 for Questionnaire 2
The participants all agreed that a wide range of strategies should be taught which was earlier
supported by their selection of LRS, PAR, BFS and CMP for teaching programs. They also
believed that all students have the potential to access this topic which is the intention of the
syllabus documents.
Their confidence in teaching the topic would seem to have improved after the intervention.
Table 5.18 compares this with previous items 10 and 11 also dealing with awareness and
confidence in using strategies (as opposed to teaching them).

116
Table 5.18 Comparison Between KCT and SCK Responses to Items 10, 11 and 13 from
Questionnaire 2 (n=7)
Question Prompt Strongly
Disagree
Disagree Not
Sure
Agree Strongly
Agree
13 I feel confident about teaching
mental computation to Year 5
3 3 1
10 I am aware of a range of
strategies for mental
computation
1 3 3
11 I am confident in using a range
of strategies for mental
computation
3 3 1
Whilst awareness of strategies improved markedly, both confidence with those strategies
and the ability to teach them had only improved moderately. This is possibly a reflection of
the lack of time to practise the strategies, continued weak test scores for the lower achievers
in the group and continued difficulty with two-digit multipliers.
5.5.5 Changes in Participants’ Perceived KMH
Questions relating to KMH were Items 20 and 21 in both questionnaires with participant
responses summarised in Table 5.19.
Table 5.19 Responses to KMH Items in Both Questionnaires (n=7)
Question Prompt Strongly
Disagree
Disagree Not
Sure
Agree Strongly
20 Q1 Mental multiplication promotes critical thinking and problem solving.
1 2 4 20 Q2 2 5
21 Q1 Mental multiplication promotes number sense.
1 2 4
21 Q2 2 5
Note: Q1 stands for Questionnaire 1 and Q2 for Questionnaire 2

117
Items 20 and 21 showed a continued strong belief in the use of mental computation as a
problem solving activity and to enhance students’ number sense. All participants agreed, to
some extent, with both prompts. Having experienced the intervention, this could be
regarded as an affirmation of the approach used.
5.5.6 Changes in Participants’ Perceived CCK
The last item in the questionnaire to require analysis was Item 15 and it was the only
question in the category of Common Content Knowledge (CCK). Participant responses for
both questionnaires are shown in Table 5.20.
Table 5.20 Comparison of Item 15 Responses Between Questionnaires (n=7)
Question Prompt Strongly
Disagree
Disagree Not
Sure
Agree Strongly
Agree
15 Q1 I think mental computation is
an essential skill for adults
1 2 4
15 Q2 1 6
Note: Q1 stands for Questionnaire 1 and Q2 for Questionnaire 2
There was strong support for the premise that mental computation is an essential skill for all
adults, with the exception of one participant who remained unsure. This supports the
literature that suggests that mental computation is an essential precursor to estimation and
approximation and used by adults in preference to written algorithms (Clark, 2005).
5.6 Chapter Conclusions
Despite the short duration of the intervention and reduced numbers, there was considerable
agreement about the efficacy of the program and the strategies recommended to the
participants. The tutorial and, more particularly, the notes received strong support from the
participants. Similarly, strategies of LRS, PAR, BFS and CMP were strongly recommended
for inclusion in a teaching program for Year 5. There was little support for the use of RLS
as a mental strategy although some saw it as an extension to the topic. FAC also received
little support for inclusion in teaching programs although this may be a result of it closely

118
resembling CMP which had the added strategy of Aliquot Parts i.e. it may have been seen as
a subset of CMP.
Recommendations from the most recent Australian (2012) and NESA (2015) curriculum
documents for this topic include LRS, PAR and FAC, although partitioning is only
mentioned in the Australian curriculum and the only example of non-standard partitioning
in either document involves subtractive partitioning. The participants also recommended
that BFS should be considered in teaching programs. The NESA (2015) curriculum does
make mention of BFS in its Background Information to the outcome MA3-6NA, which
states:
Students could extend their recall of number facts beyond the multiplication
facts to 10 × 10 by memorising multiples of numbers such as 11, 12, 15, 20 and
25.
(NESA, 2015: Mathematics K to 10, Stage 3, Multiplication and Division 1,
Background Information, para 1)
However, the techniques used in the intervention for this range of multipliers did not rely on
memory but rather on strategy use. For example, x 12 could be seen as x 10 + double (LRS)
or as x 11 + x 1 (PAR). The use of Trachtenberg and Hall shortcuts would involve
memorising the procedure.
The majority of participants favoured an extended treatment for this topic rather than
condensing it into a short block of two to three weeks. Again, this was supported by
statements in the NESA (2015) curriculum, mentioned above.
The strong acceptance of the material presented in the intervention also reflects on the
approach taken to the topic – that of teaching a broad range of strategies that can then be
combined to allow multiple pathways to the solution. This provides a practical example of
how flexibility and adaptivity can be incorporated to enhance students’ number sense and
give the topic a problem solving focus. Although flexibility/adaptivity are often treated as
synonymous terms in the research literature (see Chapter 2), this study uses Verschaffel,
Luwel, Torbeyns and Van Doren’s (2009) distinction between ‘flexibility’ as the use of a
variety of strategies and ‘adaptivity’ as the selection of the most appropriate strategy for a

119
particular problem. Whilst the notes (Appendix 5) focus on the flexible use of strategies in
mental multiplication, the tutorial had the additional focus of the most appropriate pathway
to a solution. For example, each of the sets of reflection exercises in the basic fact section
had one example that was best done using subtractive partitioning and this was emphasized
in the tutorial. The review of Test 1 problems at the end of the tutorial also looked at the
relative value of solution approaches to achieve a result in the given timeframe. This section
has been added to the original notes in Appendix 5.
The study does not, however, take into consideration the socio/cultural aspect of the
intervention – its voluntary nature, its placement against competing demands on participants’
time and the lack of opportunities for participants to interact significantly. These
considerations would require a greater timeframe than was possible, more in keeping with
the recommendations of the participants for teaching this topic to Year 5.
The participants who completed all three phases of the project began with test scores that
identified them as the weakest of three groups – those completing Phase 1 only, those
completing Phases 1 and 3 and those completing all three phases. Table 5.21 is repeated
below to facilitate further discussion.
Table 5.21 Test Statistics Based on Phase Groupings
Test All groups Phase 1 only
Group 1
Phase 1 and 3
Group 2
All Phases
Group 3
𝑋 𝜎 𝑛 𝑋 𝜎 𝑛 𝑋 𝜎 𝑛 𝑋 𝜎 𝑛
1 4.3 2.8 36 4.2 2.4 13 4.6 1.3 16 3.9 3.0 7
2 5.7 3.7 23 5.6 3.5 16 5.9 4.3 7
Whilst the average achievement of the two groups completing both tests (Groups 2 and 3)
remained low, the group participating in all three phases (Group 3) ended as the group with
the highest average and included the best-performed participant. Although the difference in
test means was not statistically significant, the increase for Group 3 was. With such a short
intervention, test results are not the best measure of the participants’ changes in SCK for
this topic. A better measure would appear to be their use of strategies in the untimed section

120
on suggested test strategies and open-ended questions that canvassed alternate strategy
suggestions.
Group 3’s range and knowledge of strategies improved considerably from six strategies in
Test 1 to eight in Test 2. They also reduced their reliance on RLS from 37 instances (30.8%)
to four instances (3.3%) and in the latter, RLS was appropriately applied to single digit
multipliers. LRS became its most popular strategy suggestion for Group 3 with 35 instances
(29.2%) and was reasonably consistent with its use in Test 1 (37 instances or 30.8%). Their
strategy suggestions that could have produced a correct answer to test problems improved
from 60.0% to 69.2% (see Table 5.11) and they had only 5% incorrect suggestions. The use
of more flexible strategies increased from 45% to 54.2% and the largest increase was for
BFS (0 to 18 correct uses). The seven participants offered 23 viable alternate strategies for
the four test questions in the questionnaire using a range of five strategies and did not
include RLS in their suggestions.
In contrast, Group 2 did not make similar gains in flexible strategy use. Six strategies were
used by this group in both tests. They increased their reliance on RLS from 20.0% (45
instances) to 21.3% (48 instances). Their use of their modal strategy, LRS, improved from
23.6% (53 instances) to 36.9% (83 instances), however there were 16.4% (37 instances)
incorrect applications of this strategy compared to 12.4% (28 instances) in Test 1. They
knew it was a more appropriate strategy but could not apply it effectively in 44.6% of
problems where it was suggested. Their strategy suggestions that could have produced a
correct answer to test problems improved marginally from 50.7% to 51.1% (see Table 5.10)
and the more flexible use of strategies increased from 25.8% to 29.8%. The ten participants
offered 19 viable alternate strategies for the four test questions in the questionnaire using a
range of three strategies and also did not include RLS in their suggestions.
Recall Table 3.4 that compared Whitacre’s (2007) taxonomy with that of this study. It is
now repeated as Table 5.22.

121
Table 5.22 Comparison of Whitacre’s Taxonomy for Multiplication Strategies and the
Taxonomy Used in This Study
Categorisation Standard Transition Non Standard Non Standard with Reduction
Specific coding (Whitacre)
MASA Partial Products
Additive Distributive
Non-standard Partitioning (SD and AD), Aliquot Parts, Derived, Factors
Specific Coding (Hall)
RLS Partial Products
LRS, BFS PAR, FAC, CMP, CMB
Figures 5.2 and 5.3 compare the strategy use of participants in this study and Whitacre’s
(2007) study before and after their intervention.
Figure 5.2 Strategy Use of Group 3 Participants in this Study (n=7)

122
Figure 5.3 Strategy Use of Participants in Whitacre;s (2007) Study (n=13)
In relation to Whitacre’s (2007) study, he found that, following intervention,
the frequency of use of the MASA (RLS) dropped to less than one-third of that seen in first
interviews (15.9%), In this study the frequency use of RLS dropped from 30.8% to 3.3%. In
Whitacre’s study, Partial Products (LRS) became the most common strategy for
multiplication, with students using it 34.9% of the time. In this study, LRS also became the
most popular strategy with 29.2% usage. The frequency of use of six of the seven
alternative strategies increased in Whitacre’s study and increased in five of six alternate
strategies in this study. In Whiacre’s study, SD accounted for 22.2% of strategy uses, AP for
15.9%, FAC 4.8%, and Derived 6.4%. In this study, BFS (including AP) accounted for 15%
of strategy uses, PAR (including SD) for 10%, FAC and CMP (similar to FAC) for 3.3%
and CMB (Derived) for 1.7%.
A similar comparison of Group 2’s strategy use in Test 1 and 2 is shown in Figure 5.4

123
Figure 5.4 Strategy Use of Group 2 Participants in this Study (n=15)
The movement by participants from inflexible to more flexible strategy use in Whitacre’s
study and Group 3 in this study was not reflected in the results of Group 2 – the group that
did Phases 1 and 3 but not the intervention. Whilst their use of LRS increased, so too did
their use of RLS. The more flexible number sensible strategies of BFS, FAC, CMP and
CMB were barely used and PAR declined in its usage. This suggests that the intervention,
despite its short timeframe, had a positive effect on Group 3’s choice of more number-
sensible, flexible strategies.
Items 10 to 21 of the two questionnaires sought responses from participants involving all six
categories of the MKT framework. For Group 3, there was a strong improvement in
awareness of strategies (although not statistically significant) and a moderate improvement
in confidence in using them (SCK). Group 3 participants all agreed that mental computation
is an essential skill for school students and most saw it being taught in primary with only
one participant unsure about that statement. There was an increased awareness of the place
of mental computation in the curriculum and all saw it being taught prior to the formal
algorithm (KCC).
Whilst knowledge of strategies had improved markedly, confidence in teaching them had
only improved moderately. This is possibly a reflection of the lack of time to practise the
strategies, continued weak test scores for the lower achievers in the group and continued
difficulty with two-digit multipliers. There was a strong belief in the use of mental
computation to enhance students’ critical thinking and number sense (KMH). The
0.05.010.015.020.025.030.035.040.0
BLK BDF COU RLS LRS PAR FAC BFS CMP CMB
FrequencyofUse%
StandardtoNon-StandardSpectrum
MultiplicationStrategyUsebyGroup2Participants
T1
T2

124
participants all agreed that a wide range of strategies should be taught which was earlier
supported by their selection of LRS, PAR, BFS and CMP for teaching programs. They also
believed that all students have the potential to access this topic (KCT). There was strong
support for the premise that mental computation is an essential skill for all adults, with the
exception of one participant who remained unsure (CCK).
The final chapter relates the data analysis presented in this and the previous chapter to the
research questions outlined in Chapter 1.

125
Chapter 6 Thesis Summary, Conclusions and Implications for
Practice
6.1 Introduction
As the title of the thesis indicates, this project explored the flexible use of a range of mental
multiplication strategies to solve problems that satisfy the outcomes of the NESA and
Australian curriculum documents for the Year 5 outcome of mental multiplication by one-
and two-digit numbers. The participants in this case study were drawn from two cohorts of
pre-service teachers at the University of New England (n=36) who had not previously
encountered the topic but had knowledge of graphical and written methods of
multiplication.
The project aimed to establish the participants’ knowledge of mental multiplication and
whether any changes to this knowledge resulted from exposure to a proposed teaching
strategy that involved a flexible approach to mental multiplication using a range of number
sensible teaching strategies. Data relating to changes in the participants’ knowledge of
mental multiplication were collected and analysed using a concurrent mixed methods
approach that involved two rounds of timed testing, reflection and a questionnaire separated
by an intervention in the form of a two-hour tutorial. The research design that dictated data
collection and analysis was based on Hill, Ball and Schilling’s (2008) framework of
Mathematical Knowledge for Teaching (MKT) as outlined in Chapter 3. Chapters 4 and 5
reported the data analysis for Phases 1, 2 and 3 respectively. This chapter summarises those
statistics and relates them to the research questions outlined in Chapter 1.
The project aimed to address four related research questions:
1. What was the prior knowledge of mental multiplication displayed by pre-service
teachers?
2. How did this change following exposure to strategies suggested in the research
literature and presented through the intervention?

126
3. What strategies do pre-service teachers propose for a teaching program that
addresses the mental multiplication component of the Year 5 Australian Curriculum
outcome ACMNA100 and its NSW counterpart?
4. What implications for practice are suggested by the study for possible inclusion in
curriculum documentation?
6.2 Conclusions
This section deals with conclusions that answer the first three Research Questions. Each
conclusion is followed by argument supporting the conclusion with evidence developed in
Chapters 4 and 5. Conclusions 6.2.1 to 6.2.3 relate to the first research question;
Conclusions 6.2.4 and 6.2.5 relate to the second research question and Conclusions 6.2.6
and 6.2.7 relate to the third research question.
6.2.1 Conclusion 1
It was concluded that the mental multiplication capacities of the participants were not
sufficient for most participants to teach this area of the syllabus at a Year 5 level. Both the
timed test results and untimed strategy suggestions of participants demonstrated a poor
knowledge of mental multiplication strategies (specific content knowledge - SCK) that
could be described as traditional (Menon, 2009) and lacking in flexible and number sensible
strategies (Whitacre, 2007). The participants were particularly weak in two-digit x two-digit
calculations and associated strategy suggestions, with many suggesting the use of right-left
separated (mental image of the formal algorithm). The majority of participants had a limited
repertoire of strategy choices.
The test results for the entire group (n=36) and the two cohorts are repeated in Table 6.1.
Table 6.1 Means and Standard Deviations of Test 1 by cohort
Statistic All Participants𝑛 = 36
EDME 145𝑛 = 16
EDME 369𝑛 = 20
Mean 4.3 3.6 4.9 Std Dev 2.8 2.4 3.0

127
Considering that the 15-question test was designed as an exit test for Year 5 after
experiencing tuition in mental multiplication techniques, it was expected that the
performance of the pre-service teachers would be substantially better than the results shown
above. The test scores ranged from 0 to 11 with only eight students (22%) scoring 8/15 or
better with one student recording a score that could be considered as competent (11/15). The
comparison between the two cohorts shows a slightly better performance by the third-year
group, however the difference was not statistically significant (𝑡 = −1.44,𝑑𝑓 = 34,𝑝 =
0.160). The entire group was particularly weak in two-digit x two digit problems with only
one participant scoring above 2/7.
Whilst timed testing provided some useful insights in answering the first research question,
the untimed suggestions of strategy use by participants enhanced the data from Test 1.
Figure 6.1 repeats the coding summary of those strategies reported in Chapter 4.
Figure 6.1 Strategies Suggested for Test 1 Questions
As outlined in Chapter 4, these can be split into three categories based on the flexibility of
the strategies (Whitacre, 2007) as shown in Table 6.2.
BDF COU BFS RLS LRS FAC PAR CMP CMB BlankIncorrect 5 0 0 27 39 0 6 7 1Correct 50 11 0 94 111 6 55 0 6 122
0
20
40
60
80
100
120
140
160
Frequency
StrategyUseforTest1

128
Table 6.2 Strategy Suggestions for Test 1 Questions by Category (n=36)
Strategy Category Strategies Frequency %
Blank, incorrect or
inappropriate to the problem
RLS was considered inappropriate
for use with two-digit multipliers
236 43.7%
Inflexible and appropriate to a
limited range of problems
BDF, COU, RLS for one-digit
multipliers
126 23.3%
Flexible and appropriate for a
wider range of problems
LRS, PAR, FAC, CMP, BFS, CMB 178 33.0%
Table 6.2 shows that only 56.3% of strategy suggestions had the potential to solve the target
problem, and a low 33% could be described as flexible and capable of solving the full range
of problems encountered in the test.
The modal strategy suggestion was left-right separated (150 instances or 27.8%) although
39 of these suggestions would have led to incorrect solutions. The latter were mainly
associated with two-digit x two-digit problems. Right-left separated (RLS), a mental version
of the formal algorithm, was suggested 121 times (22.4%) although 27 would have led to
incorrect solutions and a further 29 were inappropriate suggestions for two-digit x two-digit
problems. That left 65 suggestions of RLS for one-digit multipliers that are appropriate but
considered slightly more difficult than LRS (Hierdsfield, Cooper, Mulligan & Irons, 1999).
Of the more flexible strategies, only non-standard partitioning (PAR) received much support
with 49 correct suggestions (9.1%). Most of these were subtractive distributive with few
instances of non-standard additive partitioning. There was only one instance of a
combination of strategies and no use of any basic fact shortcuts. The seven suggestions of
compensation (CMP) by one participant would all have led to incorrect answers.
The large number of blank entries (122 or 22.6%) prompted a closer examination of the
two-digit x two-digit problems (Q 9 to 15). These seven questions had only 73 strategy
suggestions that might have produced a correct answer. This was only 29% of possible
suggestions; the remainder being left blank or leading to an incorrect answer. Twenty-three
of the 33 participants (69.7%) scored 0/7 for this section and only one participant scored
above 2/7. This demonstrates a particular problem with this type of mental multiplication.

129
When asked for alternate solutions to four of the seven two-digit x two-digit problems, there
were only a total of 32 appropriate suggestions, most of those using LRS or an expanded
version of the formal algorithm (4 partial products).
In terms of the range of strategies suggested by participants, 50% could only suggest one or
two strategies, while the best-performed students used either three or four strategies. There
were only four of 33 participants (12.1%) who could suggest appropriate strategies for all
15 test problems.
6.2.2 Conclusion 2
The experience of participants with Mathematics at school seemed to have little or no
bearing on their mental computation skills. This included both specific tuition in mental
computation and the level of Maths studied for the HSC. Similarly, any subject
specialisation in their current course was not a significant predictor of performance in this
topic. The better predictors of performance were the participants’ own assessment of their
knowledge and use of mental computation as adults although the results from the test and
strategy suggestions demonstrated that this experience was superficial with few exceptions.
All but three participants had studied Mathematics for their HSC and the dominant course of
study was General Maths (58%). A further 18% had studied Mathematics 2U and 14% had
studied Ext 1 or higher. As a predictor of test results, the level of Maths attempted at the
HSC showed no significant correlation with the test scores (𝜌 = 0.314,𝑝 = 0.075).
In relation to their experience with mental computation, only 39% could recall specific
teaching of mental computation strategies at school with 36% disagreeing with the prompt
to some extent. This prompt had a similarly weak correlation with test results that was not
statistically significant (𝜌 = 0.333,𝑝 = 0.058).
Nearly half of the respondents (48%) agreed that they used mental computation as adults
regularly and a similar percentage expressed awareness of a range of strategies for mental
computation (45%). However, a low 24% felt confident about using mental computation
strategies with almost half (48%) lacking confidence in this area. The last three prompts –
knowledge of mental computation as an adult, their regular use and participants’ confidence

130
in using them all showed a significant correlation with test results in the moderate to strong
range (Chapter 4, Table 4.10).
6.2.3 Conclusion 3
The participants expressed a general lack of confidence in their ability to teach this topic
and some deficits were evidenced in curriculum and content knowledge associated with the
placement of this topic in the primary curriculum and its relationship to the teaching of the
formal algorithm. It is strongly recommended that this topic be viewed as a separate topic in
any pre-service mathematics course and taught in conjunction with graphical methods, such
as arrays, using a constructivist approach. The topic should have its own unique set of
strategies and be placed firmly in the Stage 3 curriculum (NESA, 2015). In addition, it
should be taught in advance, and separate from, the formal algorithm for long
multiplication.
After examining participants’ SCK, the questionnaire focussed on their knowledge and
attitude towards four other areas of the MKT framework. In relation to the knowledge of
curriculum and content (KCC), items 14 and 16 indicated quite a strong belief in mental
computation being taught to school students (81% agreement) but slightly less acceptance
that its best place is in the primary curriculum (66% agreement). One third of participants
were unsure that this topic should be placed in primary. This contradicts the 71% of
participants who felt that they knew its place in the curriculum (item 12). So in terms of
KCC, this suggests some deficits as the Australian curriculum clearly places mental
multiplication by one- and two-digit numbers in Year 5.
The other comparison of interest was between items 12 and 17. Having suggested that a
large majority knew the place of mental multiplication in the curriculum (71%), this
contrasted with participants’ views about teaching mental computation before formal
algorithms. As demonstrated in the argument following Conclusion 6.2.1, there was a
considerable reliance on the formal algorithm as a mental strategy. Fifteen of the 36
participants (42%) used it as one of their main strategies for the coding sheet and there were
121 suggestions of the RLS strategy (22.4% of all strategy suggestions). It is not surprising
that 27% would disagree that mental computation should be taught before formal algorithms
if a considerable number of participants believe RLS to be a viable mental multiplication

131
strategy. This raises concerns about their own tertiary mathematics methods courses that
have already treated graphical and formal methods of multiplying prior to any mention of
mental strategies.
Items 13, 18 and 19 were related to participants’ knowledge of content and teaching (KCT).
Beginning with item 13, there was a strong lack of confidence in teaching this topic – 45%
disagreed (to some extent) with the prompt and a further 30% were unsure. Only eight
participants (24%) expressed any confidence in their preparedness to teach this topic. Whilst
this item did not correlate significantly with item 11 (I am confident in using a range of
strategies for mental computation), analysis of the two sets of responses did provoke some
interesting comparisons. Only three participants expressed confidence in both their use of
mental computation strategies and their ability to teach the topic. In one case, this
confidence was misplaced as he scored 3/15 in the test and could suggest only two strategies
(BDF and LRS) for the 15 test questions. The other two participants scored 8/15 and had a
broader range of strategy suggestions. Another group of five participants expressed a lack of
confidence in their own ability in mental computation but professed confidence in teaching
the topic. Again this confidence seemed to be misplaced as the test mean of this group was
only 3.2. In summary, only two participants expressed a confidence in teaching the topic
that could be supported by test results and strategy suggestions.
The response to item 18 demonstrated strong acceptance (79% strongly agree or agree) of
the statement that all students had the potential to learn mental computation strategies
thereby implying that it was not just an extension topic for the more able student. Responses
to item 19 strongly suggested (94% strongly agree or agree) that the participants are
receptive to teaching a wide range of strategies rather than looking for a few strategies that
will answer most questions.
There was strong acceptance of the relationship between mental computation and number
sense (76% strongly agree or agree) and 88% thought it had the potential to promote
problem solving and critical thinking (KMH). A large majority saw it as an essential skill
for adults (78.8%) and school students (81%) alike (CCK and KCC).

132
6.2.4 Conclusion 4
Both Test 2 results and the associated strategy suggestions demonstrated a strong
improvement in the SCK of participants completing the intervention (Group 3) that was not
replicated, to the same extent, in the results and strategy suggestions of Group 2 (Phases 1
and 3 only). There was a substantial decrease in Group 3’s reliance on RLS while Group 2
increased their use of the mental image of the algorithm.
While 36 participants completed the first test and strategy suggestions, the number
completing the second test and associated strategy suggestions reduced to 23 participants
due to competing demands on their time. Seven of those also completed the intervention and
that resulted in three distinct groups involved in the analysis of results. Table 6.3 (repeated)
shows the difference in test means and standard deviations for the three groups.
Table 6.3 Test Statistics Based on Phase Groupings
Test All groups Phase 1 only
Group 1
Phase 1 and 2
Group 2
All Phases
Group 3
𝑋 𝜎 𝑛 𝑋 𝜎 𝑛 𝑋 𝜎 𝑛 𝑋 𝜎 𝑛
1 4.3 2.8 36 4.2 2.4 13 4.6 1.3 16 3.9 3.0 7
2 5.7 3.7 23 5.6 3.5 16 5.9 4.3 7
There was a 32.6% improvement between Test 1 and Test 2 for all those completing both
tests. Various factors may have influenced this improvement: the improvement of Group 3
scores possibly resulting from exposure to the intervention, a practice effect resulting from
the proximity of the two tests and an improvement in the candidature’s strength resulting
from some of the weaker students not participating beyond Phase 1.
The 16 participants (Group 2) completing both tests but not attending the intervention had a
21.6% improvement in their mean result. A paired samples t-test completed for this group
indicated that this improvement was close to being statistically significant: It is
hypothesised that this improvement was due mainly to practice effect combined with a
small improvement due to changes in candidature (2.3%).

133
The seven participants involved in all three Phases had a 51.9% increase in their mean
result, demonstrating a statistically significant improvement: A comparison of the
improvement for the two groups was done by subtracting the pre-test result from the post-
test result for the 23 students and then performing an independent samples t-test based upon
whether the intervention had been completed. While those who completed the intervention
demonstrated more improvement, the difference was not statistically significant:
The strategy suggestions, however, did demonstrate a strong improvement in the SCK of
participants completing the intervention that was not replicated in the strategy suggestions
of Group 2 (Phases 1 and 3 only). Figure 6.1 shows the change in strategy suggestions for
Group 2 (no intervention)
Figure 6.2 Strategy Use of Group 2 Participants in this Study by Percentage (n=15)
Group 2 used a total of six strategies in both tests. They increased their reliance on RLS
from 20.0% (45 instances) to 21.3% (48 instances). Their use of their modal strategy, LRS,
improved from 23.6% (53 instances) to 36.9% (83 instances), however there were 16.4%
(37 instances) of incorrect applications of this strategy compared to 12.4% (28 instances) in
Test 1. They knew it was an appropriate strategy but could not apply it effectively in 44.6%
of problems where it was suggested. As in Test 1, there was little use of the more flexible
strategies of BFS, FAC and CMB. The seven suggestions of CMP would all have led to
incorrect answers.
0.010.020.030.040.0
BLKBDFCOURLS LRSPARFAC BFSCMPCMB
FrequencyofUse%
StandardtoNon-StandardSpectrum
MultiplicationStrategyUsebyGroup2Participants
T1
T2

134
Their strategy suggestions that could have produced a correct answer to test problems
improved marginally from 50.7% to 51.1% (see Table 5.10) and the more flexible use of
strategies increased from 25.8% to 29.8%. The ten participants offered 19 viable alternate
strategies for the four test questions in the questionnaire using a range of three strategies and
did not include RLS in their suggestions.
Figure 6.3 shows the change in strategy suggestions for Group 3 (all three phases).
Figure 6.3 Strategy Use of Group 3 Participants in this Study by Percentage (n=7)
Group 3’s range and knowledge of strategies improved considerably from six strategies in
Test 1 to eight in Test 2. They also reduced their reliance on RLS from 37 instances (30.8%)
to four instances (3.3%) and these four instances were appropriately applied to single digit
multipliers. LRS became the modal strategy suggestion for Group 3 with 35 instances
(29.2%) and this was reasonably consistent with its use in Test 1 (37 instances or 30.8%).
Their strategy suggestions that could have produced a correct answer to test problems
improved from 60.0% to 69.2% (see Table 5.11) and they had only 5% incorrect
suggestions. The use of more flexible strategies increased from 45% to 54.2% and the
largest increase was for BFS (0 to 18 correct uses) The seven participants offered 23 viable

135
alternate strategies for the four test questions in the questionnaire using a range of five
strategies and did not include RLS in their suggestions.
6.2.5 Conclusion 5
There was a strong improvement in awareness of strategies (although not statistically
significant) and a moderate improvement in confidence in using them (SCK) for those
experiencing all three phases of the project (Group 3). There was also an increase in
confidence about teaching this topic (KCT) and an increased awareness of the place of
mental computation in the curriculum and all now agreed that it should be taught prior to the
formal algorithm (KCC).
Group 3 participants all agreed that mental computation is an essential skill for school
students and most saw it being taught in primary with only one participant unsure about that
statement. There was an increased awareness of the place of mental computation in the
curriculum and all saw it being taught prior to the formal algorithm (KCC). There was also
an increase in confidence about teaching this topic and all agreed that it was appropriate for
all students and that a wide range of strategies should be taught (KCT). There was
unanimous agreement that mental computation had the potential to improve students’
number sense and problem solving ability (KMH). All but one participant agreed strongly
that it was an essential skill for adults (CCK).
6.2.6 Conclusion 6
Following the intervention, there was unanimous support from Group 3 for BFS, LRS, PAR
and CMP as essential components of a teaching program for this topic. In particular, non-
standard partitioning (PAR) was seen as the most valuable strategy. There was no support
for the formal algorithm (RLS) as a mental multiplication strategy and little support for
FAC.
The strong acceptance of the intervention and accompanying notes by the participants was
encouraging. This led to the following choice of strategies for an ungraded Year 5 class is
shown in Table 6.4.

136
Table 6.4 Choice of Strategies for an Ungraded Year 5 (n=6)
Strategy BFS LRS RLS FAC PAR CMP
Frequency 6 6 0 1 6 6
Participant rankings of those strategies is shown in Table 6.5
Table 6.5 Participant Ratings of Strategies in Order
Rating Most
Valued
Least
Valued
Strategy PAR BFS LRS CMP FAC RLS
The preference for CMP over FAC in the participants’ teaching program is also of interest
as FAC and LRS are the only strategies mentioned in the current NESA syllabus documents
(2015) that relate to mental multiplication at this level. FAC could reasonably be seen as a
subset of CMP and hence the latter may have been more valued in a teaching program.
6.2.7 Conclusion 7
The participants strongly suggested that this Year 5 topic be spread over an extended period
of at least one term and not treated as a two-week topic. As the syllabus background
information recommends, “mental strategies need to be continually reinforced”. (NESA,
2015: Mathematics K – 10, Stage 3, Multplication and Divisoion 1, Background
Information, para 2) This suggests a program over at least one term where strategies are
introduced incrementally and practised before progressing to the next strategy. Following
terms would regularly revise mental multiplication, along with the other three operations.
The final question in the second questionnaire asked participants how they would pace their
instruction for this topic with the results shown in Table 5.6.

137
Table 6.6 Suggested Duration of Instruction (n=7)
Duration of
Instruction
Two to Three
Weeks
Over One
Term
Over Two
Terms
Over Three or Four
Terms
Frequency 1 2 2 2
The mixed response to this question suggests there may be some uncertainty amongst
participants about the time needed to teach this topic. However, the majority would see it as
taking at least one term to complete and possibly more.
6.3 Implications for Practice
The first implication for practice relates to the final research question, while the second
relates to pre-service teacher courses in Mathematics.
6.3.1 Implication 1
The first implication of the research is that the NSW (NESA, 2015) syllabus outcomes,
notes and background information for this topic should be expanded and clarified as
follows:
• Outcomes should differentiate between mental, written and graphical strategies for
this topic and include specific examples of non-standard subtractive partitioning and
non-standard additive partitioning. These examples should include two-digit
multipliers. Compensation should also be included as an appropriate strategy for
mental multiplication with an example such as 18 x 35 = 9 x 70 = 630.
Factors would still be mentioned for simple one-digit multipliers such as 6.
• It is also suggested that the curriculum notes for this outcome should include the
previous statement contained in the BOS (2002) syllabus notes:
formal written algorithms are introduced after students have gained a firm
understanding of basic concepts including place value, and have developed
mental strategies for computing with two-digit and three- digit numbers
(BOS 2002 p 9).
• Background Information for the NESA K-10 Mathematics Curriculum (2015)
outcome MA 3-6 NA states, in part, that “students could extend their recall of

138
number facts beyond the multiplication facts to 10 × 10 by memorising multiples of
numbers such as 11, 12, 15, 20 and 25. It is suggested that the phrase “by
memorising multiples of numbers such as 11, 12, 15, 20 and 25” be replaced with “
by calculating multiples of numbers such as 11, 12, 15, 20 and 25 using mental
multiplication strategies of partitioning and compensation”.
6.3.2 Implication 2
A second implication of the research involves the following suggestions for the
programming of pre-service teacher courses in Mathematics.
• Mental computation strategies, as recommended in the syllabus and research
literature (Clark, 2005), need to be introduced prior to formal algorithms for each
operation. Graphical methods, particularly arrays, should be used to illustrate the
mental multiplication strategies.
• The strategies used need to build upon student-developed strategies and address the
number sensible elements of flexibility, adaptivity and multiplicative thinking
(Heirdsfield & Cooper, 2004). The research supports the inclusion of LRS, PAR,
FAC, CMP and CMB as appropriate number sensible strategies for introducing
mental multiplication to pre-service teachers.
6.4 Limitations of the Research Project
Schoenfeld (2002 p 497) argues that there are three fundamental dimensions of research
findings: generality, trustworthiness and importance. An exploration of these three
dimensions reveals any limitations of the research project:
• Generality, or Scope. The small sample size, even for the first survey completion, limits
the capacity to generalise the results (Field, 2009). It was difficult to apply traditional
measures of significance to comparisons between the data sets obtained in Phases 1 and 3.
De Winter (2013) argues that the t-test is acceptable provided effect sizes are large. He
recommends use of the paired samples t-test or the Wilcoxon test for small populations and
both of these were used in Chapter 5. Correlations between item responses have not been
used as a consequence of the small sample size. However, there are still useful comparisons

139
to be made between the data sets, particularly with strategy selection and these comparisons
primarily use frequency distribution for analysis.
The demographics of this cohort compared with a distance cohort of students may be
different as would a larger cohort in city universities. The epistemology of symbolic
interactionalism also suggests that each student will bring his or her own constructed views
of mental computation to the project based on age, prior experience and culture.
At best, the study is one case of a cohort of pre-service teachers experiencing mental
multiplication for the first time with planned intervention aimed at broadening their
conceptions of mental multiplication strategies. Given a different researcher, the strategies
suggested in the intervention may be completely different (Whitacre, 2007).
• Trustworthiness. Given the limitations of the case in question, any claims concerning
preferred strategies or a hierarchy of strategies are but one example of opinion from one
cohort of pre-service teachers. The study will add to the body of knowledge and perhaps
suggest strategies worthy of further consideration in research with teacher and student
samples.
• Importance: The call for research into pre-service teacher MKT (Hine 2015) specifically
related to number sense (Whitacre, 2016) means that this research offers concrete
suggestions for the selection of possible strategies for mental multiplication based on the
experiences of one cohort of pre-service teachers. The elements of flexibility, adaptivity and
multiplicative thinking that are incorporated into the design of the project add to the body of
research in these areas with particular reference to number sensible mental multiplication
strategies.
An additional limitation is one of structure. Given that the research took place within a
program of instruction dictated by the relevant department and course co-ordinators, the
research needed to fit in with their timeframes and the demands of other units of work and
assessments. This led to a compacted timeframe and competing demands for the participants.
The voluntary nature of their participation meant that some may not have placed great
emphasis on the material or the discussions and may have resulted in decreased
participation in the intervention phase. The intervention also occurred in a week when

140
normal lectures were suspended just prior to final exams, hence affecting attendance. Given
only a two-week gap between testing, practice effect had to be considered when analyzing
test data.
6.5 Recommendations for Future Studies
In relation to future studies of mental multiplication with pre-service teachers, the following
recommendations are suggested:
• that the topic be encountered over an extended period of time, and prior to the
introduction of formal algorithmic procedures
• that the participants be taught coding of strategies and provided with opportunities to
discuss each other’s strategies and code them
• that some measure of participants’ knowledge of basic multiplication facts up to 10
x 10 be made initially
• that FAC and CMP be combined into one category
• that subtractive and additive non-standard partitioning be separated to enable a better
measure of additive partitioning
• that BFS include multiples from 2 to 12, 15, 20 and 25, moving Aliquot parts from
CMP
In relation to future research into the topic of mental multiplication, research with existing
teachers and their students would be the logical next step. This might involve:
• Initial testing of basic multiplication facts to 10 with a Year 5 cohort
• Post-testing of mental multiplication with a Year 6 cohort (having experienced it in
Year 5).
• Coding of strategies used by Year 6 with teachers.
• Development of a learning community within each school to design teaching
programs for the topic, and remedial programs for basic number facts as needed.
• Implementation of the program over a term.
• Records of teachers in the form of diaries.
• Post-testing of Year 5, coding and comparison with Year 6 initial testing.

141
• Regular colleagial discussions of progress amongst teachers and with the researcher.
It might also be useful to work with at least three schools, possibly involving different
sectors – Government, Catholic and Private.
6.6 Chapter Conclusion
Despite the limited time frame for the study, Phase 1 provided some rich data for the first of
four research questions. The 36 participants in this phase had a severely limited knowledge
of mental multiplication that relied on procedural methods at the expense of any flexible,
number-sensible strategies. Their poor performance in both timed testing and strategy
suggestions showed a lack of SCK required to teach the topic. Most of their limited
knowledge seemed to come from experiences with mental multiplication as an adult rather
than their school or university experience of the topic. There was confusion regarding the
formal algorithm – whether it was a useful strategy for mental multiplication and its
placement in regard to this topic. As a group, they generally lacked confidence in their own
mental computation ability and their ability to teach the topic. Conclusions 1 to 3 address
that first research question.
The second research question was addressed by Conclusions 4 and 5. A reduced group of 23
participants were involved in Phase 3 and seven of those experienced the intervention. The
small group size made comparisons using significance and correlation difficult, but some
useful data, particularly in relation to strategy choice was obtained. The group experiencing
all three phases of the project had a significant improvement in test scores and a measurable
change in strategy use. Their use of inflexible strategies almost disappeared, except in cases
where those strategies were appropriate. They adopted more flexible strategies and were
able to offer more alternative solutions to problems using these. The group not experiencing
the intervention did not make the same gains in strategy use and their small improvement in
test scores was not significant.
In response to the third research question, the seven participants strongly suggested a
teaching program that involved PAR, BFS, CMP and LRS strategies. They saw this being
taught over an extended period and could see value in the program in terms of students’

142
number sense and problem solving. In general, they embraced the concept of flexible
number sensible strategies with multiple pathways to solutions.
The first implication for practice relates to the NSW syllabus outcomes, notes and
background information for multiplication by one- and two-digit numbers. Unless schools
have strong learning communities, it is felt that the syllabus needs to be more prescriptive in
this area and provide a wider range of mental multiplication strategies with appropriate
examples. If number sense and mental computation are to be seen as important, they need a
stronger focus in curriculum documents that clearly details the extent and treatment of the
topic.
The second implication for practice suggests that this topic receive at least equal
prominence with graphical and algorithmic approaches to mental multiplication in pre-
service teacher mathematical methods courses. It should be encountered prior to the formal
algorithm, using graphical methods to support its introduction. Possible strategies for
inclusion in pre-service teacher courses would include PAR, LRS, BFS, CMP and CMB.
The concepts of flexibility and adaptivity would be addressed through the use of multiple
pathways to the solution of mental multiplication problems that used a combination of
number sensible strategies as listed above.

143
References
Alajmi, A., & Reys, R. (2007). Reasonable and reasonableness of answers: Kuwaiti middle
school teachers’ perspectives. Educational Studies in Mathematics, 65(1), 77-94.
Almeida, R., Bruno, A., & Perdomo-Díaz, J. (2016). Strategies of number sense in pre-
service secondary mathematics teachers. International Journal of Science and
Mathematics Education, 14(5), 959-978.
American Psychological Association. (2010). Publication Manual of the American
Psychological Association (6th ed.). Washington, DC: APA.
An, S., Kulm, G. & Wu, Z. (2004). The pedagogical content knowledge of middle school,
mathematics teachers in China and the U.S., Journal of Mathematics Teacher
Education 7, pp. 145–172.
Anghileri, J. (1999). Issues in teaching multiplication and division. In I. Thompson (Ed.),
Issues in Teaching Numeracy in Primary Schools (pp. 184-194). Buckingham, UK:
Open Press University.
Askew, M. (2008). Mathematical discipline knowledge requirements for prospective
primary teachers, and the structure and teaching approaches of programs designed to
develop that knowledge. Knowledge and Beliefs in Mathematics Teaching and
Teaching Development, 1, 13-35.
Australian Curriculum Assessment and Reporting Authority. (2012) F-10 Mathematics
Curriculum: Year 5 Number and Algebra. (v8.3) Retrieved from
https://www.australiancurriculum.edu.au/f-10
Australian Education Council (AEC). (1991). A national statement on mathematics for
Australian schools. Carlton, Vic: Curriculum Corporation.
Baker, M., & Chick, H. L. (2006). Pedagogical content knowledge for teaching primary
mathematics: A case study of two teachers. In P. Grootenboer, R. Zevenbergen, & M.
Chinnappan (Eds.), Identities, cultures and learning spaces (Proceedings of the 29th
annual conference of the Mathematics Education Research Group of Australasia, pp.
60-67). Sydney: MERGA. Ball, D. L. (1990). The mathematical understandings that prospective teachers bring to
teacher education. The Elementary School Journal, 90(4), 449-466.
Ball, D. L., & Bass, H. (2000). Interweaving content and pedagogy in teaching and learning
to teach: Knowing and using mathematics. In J. Boaler (Ed.), Multiple perspectives on
the teaching and learning of mathematics (pp. 83-104). Westport, CT: Ablex.

144
Ball, D. L., Hill, H.C., & Bass, H. (2005). Knowing mathematics for teaching: Who knows
mathematics well enough to teach third grade, and how can we decide? American
Educator, 29(1), 14-17.
Ball, D. L., Thames, M., & Phelps, G. (2008). Content knowledge for teaching: What makes
it special? Journal of Teacher Education, 59(5), 389-407.
Baxter, P., & Jack, S. (2008). Qualitative case study methodology: study design and
implementation for novice researchers . The Qualitative Report, 13(4), 544-559.
Beishuizen, M. (1993). Mental strategies and materials or models for addition and
subtraction up to 100 in Dutch second grades. Journal for Research in Mathematics
Education, 24(4), 294-323.
Beishuizen, M. (2001). Different approaches to mastering mental calculation strategies. In J.
Anghileri (Ed.), Principles and practices in arithmetic teaching (pp. 119-130).
Buckingham: Open University Press.
Beishuizen, M., Van Putten, C. M., & Van Mulken, F. (1997). Mental arithmetic and
strategy use with indirect number problems up to one hundred. Learning and
Instruction, 7(1), 87-106.
Benbow, R. M. (April, 1993). Tracing mathematical beliefs of pre-service teachers through
integrated content-methods courses, Paper presented at the Annual Conference of the
American Educational Research Association, Atlanta, Georgia. USA.
Benzies, K. M., & Allen, M. N. (2001). Symbolic interactionism as a theoretical perspective
for multiple method research. Journal of Advanced Nursing, 33(4), 541-547.
Beswick, K., Ashman, D., Callingham, R., & McBain, D. (2011). Teachers' and pre-service
teachers' confidence to teach primary school mathematics. Proceedings of the
Australian Association for Research in Education Conference (AARE 2011
Conference) (pp. 1-10).
Blumer, H. (2012). Symbolic interactionism [1969]. Contemporary Sociological Theory, 62.
Boaler, J. (2015). Fluency without fear: Research evidence on the best ways to learn math
facts. Retrieved from youcubed. org.
Board, R. N. J., & Davenport, L. (1993). Algorithms supplant understanding: Case studies
of primary students’ strategies for double-digit addition and subtraction. In Becker, J.
& Preece, B. (Eds.), Proceedings of the 15th Annual Meeting of the North American
chapter of the International Group for the Psychology of Mathematics Education (Vol
1, pp. 254-260). San Jose, CA: Center for Mathematics and Computer Science
Education, San Jose State University.

145
Board of Studies New South Wales (2002). Mathematics K–6 Syllabus. Sydney.
Board of Studies, Teaching and Educational Standards NSW. (2015). Mathematics K-10
Syllabus. Retrieved from http://syllabus.nesa.nsw.edu.au/mathematics/mathematics-
k10/
Callingham, R. (2005). A whole-school approach to developing mental computation
strategies. International Group for the Psychology of Mathematics Education, 201.
Caney, A. (2002). Exploring mental computation in the middle years. In MERGA 25 (Vol.
1, pp. 163-170).
Caney, A. (2008). The middle years of schooling: a critical time for developing mental
computation (Doctoral dissertation, University of Tasmania). Retrieved from
https://eprints.utas.edu.au/
Carpenter, T. & Moser, J. (1982). The development of addition and subtraction problem-
solving skills. In Carpenter, T., Moser, J. & Romberg, T. (Eds.) Addition and
subtraction: A cognitive perspective (pp. 9-24). Hillsdale, New Jersey: Lawrence
Erlbaum Associates.
Carroll, W. (1996). Mental computational skills of students in a reform mathematics
curriculum. Paper presented at the Annual Meeting of the American Educational
Research Association (New York, NY, April 8-12, 1996).
Carroll, W. (1997). Mental and written computation: Abilities of students in a reform-based
curriculum. The Mathematics Educator, 2(1), 18-32.
Clarke, D. (2005). Written algorithms in the primary years: Undoing the good work. In
Making Mathematics Vital. (Proceedings of the Twentieth Biennial Conference of The
Australian Association of Mathematics Teachers 93-98). Adelaide: AAMT.
Cowan, R., Donlan, C., Shepherd, D. L., Cole-Fletcher, R., Saxton, M., & Hurry, J. (2011).
Basic calculation proficiency and mathematics achievement in elementary school
children. Journal of Educational Psychology, 103(4), 786.
Cohen, L., Manion, L., & Morrison, K. (2013). Action research. In Research methods in
education (pp. 368-385). New York: Routledge.
Conference Board of the Mathematical Sciences. (2001). The mathematical education of
teachers (Vol. 11). American Mathematical Soc.
Cooper, T., Heirdsfield, A., & Irons, C. (1996). Children's mental strategies for addition and
subtraction word problems. In J. Mulligan & M. Mitchelmore (Eds.), Children's
number learning (pp.147-162). Adelaide, SA: Australian Association of Mathematics
Teachers, Inc.

146
Courtney-Clarke, M., & Wessels, H. (2014). Number sense of final year pre- service
primary school teachers. Pythagoras, 35(1), 1-9.
Creswell, J. W. (2014). Research Design: Qualitative, Quantitative, and Mixed Methods
Approaches (4th ed.). California: Sage Publishers.
Creswell, J. W., Hanson, W. E., Clark Plano, V. L., & Morales, A. (2007). Qualitative
research designs: Selection and implementation. The Counseling Psychologist, 35(2),
236-264.
De Winter, J. (2013). Using the Student's t-test with extremely small sample sizes. Practical
Assessment, Research & Evaluation, 18(10).
Delaney, S., Ball, D. L., Hill, H. C., Schilling, S. G., & Zopf, D. (2008). Mathematical
knowledge for teaching: Adapting US measures for use in Ireland. Journal of
Mathematics Teacher Education, 11(3), 171-197.
DfES (Department for Education and Studies). (2007). Primary framework for literacy and
mathematics: Guidance paper: calculation. [online] Retrieved from
http://www.standards.dfes.gov.uk/
primaryframeworks/mathematics/Papers/Calculation/
Diener, E., & Crandall, R. (1978). Ethics in social and behavioral research. Chicago. USA:
University of Chicago Press.
Ell, F., Irwin, K., & McNaughton, S. (2004). Two pathways to multiplicative thinking. In I.
Putt, R. Faragher & M. McLean (Eds.), Mathematics education for the third
Millennium, towards 2010 (Proceedings of the 27th annual conference of the
Mathematics Education Research Group of Australasia, Townsville pp. 199-206).
Sydney: MERGA.
Field, A. (2009). Discovering statistics using SPSS. Los Angeles. California: Sage
publications
Ghazali, M., Othman, A. R., Alias, R., & Saleh, F. (2010). Development of teaching models
for effective teaching of number sense in the Malaysian primary schools. Procedia-
Social and Behavioral Sciences, 8, 344-350.
Gravemeijer, K., van Galen, F., Boswinkel, N., & van den Heuvel-Panhuizen, M. (2011)
Semi-informal routines as alternatives for standard algorithms in the primary school.
In McIntosh, A., & Sparrow, L. (Eds.). Beyond written computation (pp. 126-136)
Perth, Australia: Mathematics, Science & Technology Education Centre, Edith Cowan
University.

147
Griffin, S. (2003). Laying the foundation for computational fluency in early children.
Teaching Children Mathematics, 9(6), 306-310.
Handal, B. (2003). Teachers' mathematical beliefs: A review. The Mathematics Educator,
13(2), 47-57.
Handley, B. (2012). Speed mathematics. Sydney: John Wiley & Sons.
Harrison, H., Birks, M., Franklin, R., & Mills, J. (2017, January). Case study research:
Foundations and methodological orientations. In Forum Qualitative
Sozialforschung/Forum: Qualitative Social Research (Vol. 18, No. 1. p. 17).
Hartnett, J. (2005). Changing the focus of computation instruction in primary schools:
Putting the research into practice. Review process, pp. 300-307.
Hartnett, J. (2007) Categorisation of Mental Computation Strategies to Support Teaching
and to Encourage Classroom Dialogue. In Watson, Jane and Beswick, Kim, (Eds.)
Proceedings 30th annual conference of the Mathematics Education Research Group
of Australasia - Mathematics: Essential Research, Essential Practice, pp. 345-352,
Hobart, Tasmania.
Heinze, A., Marschick, F., & Lipowsky, F. (2009). Addition and subtraction of three- digit
numbers: adaptive strategy use and the influence of instruction in German third grade.
ZDM - The International Journal on Mathematics Education, 41(5), 591-604.
Heirdsfield, A. (2002). Flexible mental computation: What about the accuracy? In A.
Cockburn & E. Nardi (Eds.), Proceedings of the 26 conference of the International
Group for the Psychology of Mathematics Education (Vol. 3, pp. 89-96). Norwich,
United Kingdom: PME.
Heirdsfield, A. (2003). "Spontaneous" mental computation strategies. In N. A. Pateman, B.
J. Dougherty & J. Zilliox (Eds.), Proceedings of the 27th conference of the
International Group for the Psychology of Mathematics Education (Vol. 3, pp. 55-62).
Honolulu: Center for Research and Development Group, University of Hawaii.
Heirdsfield, A., & Cooper, T. (2004). Factors affecting the process of proficient mental
addition and subtraction: case studies of flexible and inflexible computers. Journal of
Mathematical Behavior, 23(4), 443-463.
Heirdsfield, A., Cooper, T., Mulligan, J., & Irons, C. (1999). Children's mental
multiplication and division strategies. In O. Zaslavsky (Ed.), Proceedings of the 23rd
Conference of the International Group for the Psychology of Mathematics Education
(Vol. 3, pp. 89-96). Haifa, Israel: PME.

148
Heirdsfield, A., Dole, S., & Beswick, K. (2006). Instruction to support mental computation
development in young children of diverse ability. In Proceedings of the 2006
Australian Association for Research in Education Conference. Hawthorn, Vic:
Australian Association for Research in Education.
Heirdsfield, A. & Lamb, J. (2005) Mental computation: The benefits of informed teacher
instruction . In Clarkson, P.. Downtown, A., Gronn, D., Horne, M., McDonough, A.,
Pierce, R., & Roche, A., (Eds.) Proceedings MERGA 28 - 2005 Building connections:
Theory, research and practice 2, pp. 419-426, Melbourne: MERGA.
Hill, H., Ball, D., & Schilling, S. (2008). Unpacking pedagogical content knowledge:
Conceptualizing and measuring teachers' topic-specific knowledge of students.
Journal for Research in Mathematics Education, pp. 372-400.
Hill, H.; Charalambous, C. (2012) Teacher knowledge, curriculum materials, and quality of
instruction: Lessons learned and open issues. Journal of Curriculum Studies, 44, (4),
pp. 559-576.
Hill, H., Rowan, B., & Ball, D. (2005). Effects of teachers’ mathematical knowledge for
teaching on student achievement. American Educational Research Journal, 42, pp.
371–406.
Hine, G. (2015). Strengthening pre-service teachers' mathematical content knowledge.
Journal of University Teaching and Learning Practice, 12(4), p. 5.
Huckstep, P., Rowland, T., & Thwaites, A. (2003). Observing subject knowledge in primary
mathematics teaching. Proceedings of the British Society for Research into Learning
Mathematics, 23(1), pp. 37-42.
Hurst, C. (2014). Big challenges and big opportunities: The power of “big ideas” to change
curriculum and the culture of teacher planning. Paper presented at the 37th Annual
Meeting of the Mathematics Education Research Group of Australasia. Sydney,
Australia.
Hurst, C., & Hurrell, D. (2016, December). Captain Zero... hero or villain?. In 2016
Mathematical Association of Victoria’s Annual Conference Proceedings, pp. 59-70.
Hurst, C., & Hurrell, D. (2015). Developing the big ideas of number. International Journal
of Educational Studies in Mathematics, 1(1), pp. 1-17.
Hurrell, D. P. (2013). What teachers need to know to teach mathematics: An argument for a
reconceptualised model. Australian Journal of Teacher Education, 38(11), pp. 54-64.
Ineson, E. (2008). The mental mathematics of trainee teachers in the UK: Patterns and
preferences. The Mathematics Educator, 11(1/2), 127-142.

149
Jordan, N., Kaplan, D., Locuniak, M., & Ramineni, C. (2007). Predicting first‐grade math
achievement from developmental number sense trajectories. Learning Disabilities
Research & Practice, 22(1), 36-46.
Kamii, C., Lewis, B. A., & Livingston, S. J. (1993). Primary arithmetic: Children inventing
their own procedures. Arithmetic Teacher, 41(4), 200- 203.
Kennedy, M. (1998). Form and substance in inservice. Teacher education. (Research
Report for the National Science Foundation) Retrieved from https://files.eric.ed.gov/
Kilpatrick, J., Swafford, J. & Findell, B. (Eds.) (2001). Adding it up: Helping children learn
mathematics. Washington: National Academy Press.
Kirch, Wilhelm, (ed.) (2008). Level of measurement. Encyclopedia of Public Health. 2.
Springer. pp. 851–852. doi:10.1007/978-1-4020-5614-7_1971.
Klein, A. S., Beishuizen, M., & Treffers, A. (1998). The empty number line in Dutch
second grades: Realistic versus gradual program design. Journal for Research in
Mathematics Education, 29(4), pp. 443-464.
Ma, L. (1999). Knowing and Teaching Elementary Mathematics. Mahwah, NJ: Lawrence
Erlbaum.
Mack, L. (2010). The philosophical underpinnings of educational research. Polyglossia, 10,
5-11.
McIntosh, A. (1990). Becoming numerate: Developing number sense. In S. Willis (Ed.),
Being numerate: What counts? (pp. 24-43). Hawthorn, Vic: Australian Council for
Educational Research.
McIntosh, A. (1995). Mental computation in school mathematics: Preference, attitude and
performance of students in Years 3, 5, 7, and 9. Perth, Western Australia:
Mathematics, Science and Technology Education Centre (MASTEC), Edith Cowan
University.
McIntosh, A. (2002). Developing informal written computation. In M. Goos & T. Spencer
(Eds), Mathematics ~ Making Waves. (Vol. 1, p. EJ) Adelaide: AAMT.
McIntosh, A. (2006). Mental computation of school-aged students: Assessment,
performance levels and common errors. In The Fifth Swedish Mathematics Education
Research Seminar (MADIF-5)-Developing and Researching Quality in Mathematics
Teaching and Learning, Malmö, Sweden.
McIntosh, A., De Nardi, E., & Swan, P. A. (1994). Think mathematically!: How to teach
mental maths in the primary classroom. Melbourne: Longman Cheshire.
McIntosh, A., & Dole, S. (2005). Mental computation: A strategies approach. Hobart:

150
Department of Education, Tasmania.
McIntosh, A. J., Reys, B., & Reys, R. (1992). A proposed framework for examining basic
number sense. For the Learning of Mathematics, 12, 2-8.
McIntosh, A. J., Reys, B., Reys, R., Bana, J., & Farrell, B. (1997). Number sense in school
mathematics: Student performance in four countries. Perth: Edith Cowan University
Menon, R. (2003). Using number relationships for estimation and mental computation.
Mathematics Teaching in the Middle School, 8(9), 476.
Menon, R. (2009). Preservice teachers’ subject matter knowledge of mathematics.
International Journal for Mathematics Teaching and Learning, 12, 89-109.
Miles, M., & Huberman, A. (1994). Qualitative data analysis: An expanded sourcebook.
Los Angeles: Sage.
Mulligan, J., & Mitchelmore, M. (1997). Young children's intuitive models of multiplication
and division. Journal for research in Mathematics Education, 28(3), 309-330.
Murray, H., Olivier, A., & Human, P. (1994). Fifth graders’ multi-digit multiplication and
division strategies after five years’ problem-centered learning. In Proceedings of the
Eighteenth International Conference for the Psychology of Mathematics Education
(Vol. 3, pp. 399-406).
National Council of Teachers of Mathematics (NCTM) (2000). Principles and standards for
school mathematics. Reston, VA: NCTM.
Northcote, M., & Marshall, L.(2016). What mathematics calculations do adults do in their
everyday lives? Part 1 of a report on the Everyday Mathematics project. Australian
Primary Mathematics Classroom, 21 (2), 8-17.
Northcote, M., & McIntosh, A.(1999). What mathematics do adults really do in everyday
life? Australian Primary Mathematics Classroom, 4 (1), 19-21.
Park, S., & Oliver, J.S. (2008). Revisiting the conceptualisation of Pedagogical Content
Knowledge (PCK): PCK as a conceptual tool to understand teachers as professionals.
Research in Science Education 38, 261-284. doi.org/10.1007/s11165-007- 9049-6.
Pittalis, M., Pitta-Pantazi, D., & Christou, C. (2018). A longitudinal study revisiting the
notion of early number sense: Algebraic arithmetic as a catalyst for number sense
development. Mathematical Thinking and Learning, 20(3), 222-247.
Rathgeb-Schnierer, E. (2006). Kinder auf dem Weg zum flexiblen Rechnen: Eine
Untersuchung zur Entwicklung von Rechenwegen von Grundschulkindern auf der
Grundlage offener Lernangebote und eigenständiger Lösungsansätze [Study on

151
students‘ flexibility in mental calculation based on an open approach]. Hildesheim,
Berlin: Franzbecker.
Rathgeb-Schnierer, E., & Green, M. (2013). Flexibility in mental calculation in elementary
students from different math classes. In Proceedings of the eighth congress of the
European Society for Research in Mathematics Education (pp. 353-362). Ankara:
Middle East Technical University.
Resnick, L. B. (1983). Mathematics and Science Learning: A New Conception. Science,
220(4596), 477-78.
Reys, B. J., & Barger, R. H. (1994). Mental computation: Issues from the United States
perspective. In R. E. Reys & N. Nohda (Eds.), Computational alternatives for the
twenty-first century: Cross-cultural perspectives from Japan and the United States (pp.
31-47). Reston: National Council of Teachers of Mathematics.
Reys, B. J., Reys, R. E., & Hope, J. A. (1993). Mental computation: A snapshot of second,
fifth and seventh grade student performance. School Science and Mathematics, 93(6),
306-315.
Reys, R. E. (1984). Mental computation and estimation: Past, present, and future. The
Elementary School Journal, 84, 547-557.
Reys, R. E., & Nohda, N. (1994). Computation and the need for change. In R. E. Reys & N.
Nohda (Eds.), Computational alternatives for the twenty-first century: Cross-cultural
perspectives from Japan and the United States (pp. 1-11). Reston: National Council of
Teachers of Mathematics.
Reys, R., Reys, B., Emanuelsson, G., Johansson, B., McIntosh, A., & Yang, D. C. (1999).
Assessing number sense of students in Australia, Sweden, Taiwan, and the United
States. School Science and Mathematics, 99(2), 61-70.
Rogers, A. (2009). Mental computation in the primary classroom. In MAV Annual
Conference (pp. 190-199). Melbourne: MAV.
Schoenfeld, A. (2002). Research methods in (mathematics) education. Handbook of
International Research in Mathematics Education, 18, 435-487.
Schoenfeld, A. (2011). Reflections on teacher expertise. In Expertise in mathematics
instruction (pp. 327-341). Boston, MA: Springer
Scotland, J. (2012). Exploring the philosophical underpinnings of research: Relating
ontology and epistemology to the methodology and methods of the scientific,
interpretive, and critical research paradigms. English Language Teaching, 5(9), 9.

152
Shulman, L. (1986). Those who understand, knowledge growth in teaching. Educational
Researcher 15(2), 4-14. doi: 10.3102/0013189X015002004.
Shulman, L. (1987). Knowledge and teaching: Foundations of the new reform. Harvard
educational review, 57(1), 1-23.
Silverman, J. & Thompson, P.W. (2008). Towards a framework for the development of
mathematical knowledge for teachers. Journal of Mathematics Teacher Education, 11,
499-511. doi.org/10.1007/s10857-008-9089-5.
Sowder, J. (1988). Mental computation and number comparison: Their roles in the
development of number sense and computational estimation. In J. Hiebert, & M. Behr
(Eds.), Number concepts and operations in the middle grades (pp. 182-197). Hillsdale,
NJ: Lawrence Erlbaum Associates.
Stake, R. E. (1995). The art of case study research. Los Angeles: Sage.
Stevens S. S. (1946). On the theory of scales of measurement. Science 103 (2684): 677–680.
doi:10.1126/science.103.2684.677.
Sullivan, P. (2008). Knowledge for teaching mathematics. Knowledge and Beliefs in
Mathematics Teaching and Teaching Development, 1-9. Rotterdam: Sense Publishers.
Sullivan, P. (2011). Teaching mathematics: Using research-informed strategies (Australian
Education Review, 59). Camberwell, Australia: Australian Council for Educational
Research.
Teddlie, C., & Tashakkori, A. (2012). Common “core” characteristics of mixed methods
research: A review of critical issues and call for greater convergence. American
Behavioral Scientist, 56(6), 774-788.
Threlfall, J. (2002). Flexible mental calculation. Educational Studies in Mathematics, 50,
29-47.
Threlfall, J. (2009). Strategies and flexibility in mental calculation. ZDM - The International
Journal on Mathematics Education, 41(5), 541-555.
Torbeyns, J., De Smedt, B., Ghesquière, P., & Verschaffel, L. (2009). Jump or compensate?
Strategy flexibility in the number domain up to 100. ZDM - The International Journal
on Mathematics Education, 41(5), 581-590.
Trafton, P. R. (1978). Estimation and mental arithmetic: Important components of
computation. NCTM Yearbook, 196(213), 78.
Trafton, P., & Thiessen, D. (2004). Linking mental and written computation via extended
work with invented strategies. In McIntosh, A., & Sparrow, L. (Eds.). Beyond written

153
computation. 113-125 Perth, Australia: Mathematics, Science & Technology
Education Centre, Edith Cowan University.
Treffers, A., & DeMoor, E. (1990). Proeve van een national programma voor het reken-
wiskunde-on-derwijs op de basisschool. Deel 2: Basisvaardigheden en cijferen
[Specimen of a national programme for primary mathematics teaching. Part 2: Basic
mental sills and written algorithms]. Tilburg, Zwijsen.
Tsao, Y. L. (2005). The number sense of preservice Elementary School teachers. College
Student Journal 39(4), 647-679.
Turnuklu, E., & Yesildere, S. (2007). The pedagogical content knowledge in mathematics:
Pre-service primary mathematics teachers' perspectives in Turkey. Issues in the
Undergraduate Mathematics Preparation of School Teachers, 1, 1-13.
Uusimaki, L., & Nason, R. (2004). Causes underlying pre-service teachers' negative beliefs
and anxieties about mathematics. Proceedings of the 28th Conference of the
International Group for the Psychology of Mathematics Education, 369-376.
VandenBos, G. R. (2007). APA dictionary of psychology. Washington, DC: American
Psychological Association.
Veloo, P. K. (2010). The development of number sense and mental computation
proficiencies: An intervention study with secondary one students in Brunei
Darussalam (Doctoral dissertation, University of Otago).
Verschaffel, L., Greer, B., & De Corte, E. (2007). Whole number concepts and operations.
In F. Lester (Ed.), Second handbook of research on mathematics teaching and
learning (pp. 557-628). Charlotte, NC: National Council of Teachers of Mathematics.
Verschaffel, L., Luwel, K., Torbeyns, J., & Van Dooren, W. (2009). Conceptualizing,
investigating, and enhancing adaptive expertise in elementary mathematics education.
European Journal of Psychology of Education, 24(3), 335-359.
Walliman, N. (2010). Research methods: The basics. New York: Routledge.
Whitacre, I. M. (2007). Preservice teachers’ number sensible mental computation strategies.
In Proceedings of the Tenth Special Interest Group of the Mathematical Association
of America on research in undergraduate mathematics education. San Diego, CA.
Retrieved from http://sigmaa.maa.org/rume/crume2007/papers/whitacre.pdf
Whitacre, I., & Nickerson, S. D. (2016). Investigating the improvement of prospective
elementary teachers’ number sense in reasoning about fraction magnitude. Journal of
Mathematics Teacher Education, 19(1), 57-77.
Wigley, A. (1996). Last chant for times tables. Times Educational Supplement. 24 May.

154
Retrieved from https://tes.co.uk\section\story\?story_id=23573&window_type=print
Yang, D. C., Reys, R. E., & Reys, B. J. (2009). Number sense strategies used by pre-service
teachers in Taiwan. International Journal of Science and Mathematics Education,
7(2), 383-403.
Yazan, B. (2015). Three approaches to case study methods in education: Yin, Merriam, and
Stake. The Qualitative Report, 20(2), 134-152. Retrieved from
https://nsuworks.nova.edu/tqr/vol20/iss2/12
Yin, R. K. (2015). Qualitative research from start to finish. New York: Guilford
Publications.

155
Appendix 1 – Participant Information Sheet and Consent Form
Information Sheet for Participants
My name is Peter Hall and I am conducting research into effective mental multiplication strategies
for primary school students as part of a Research Masters in Education through the School of
Education, UNE. My supervisors are Dr Robert Whannell and A/Prof Pep Serow. This paper
outlines the reasons for the research, its format and anticipated outcomes and the benefits to
participants. Ethical considerations are mentioned and a formal written consent form is attached
should you agree to participate. Please return the consent form to the researcher at the first tutorial
before research commences. Your participation in this research is voluntary.
Research Project Investigating strategies for one- and two-digit mental multiplication used by
pre-service teachers.
Aim of the
Research
The research initially aims to explore pre-service teachers’ conceptions of
mental multiplication. These conceptions are tested against their initial
knowledge before the students are introduced to a range of possible
classroom strategies. Following this intervention, the conceptions of the
cohort are again surveyed and compared with a second test.
The main aim of the research is to discern appropriate classroom strategies
for mental multiplication that are supported by this cohort of pre-service
teachers, studying EDME145 and EDME 369 in second trimester, 2018.
Questionnaires and
tests
Participation will be done in scheduled on-campus tutorial sessions allocated
to EDME145 and EDME 369 in trimester 2, 2018 but in a week where
lectures do not take place. Participants will be required to complete the
following during three on-campus tutorials, requiring a total of three hours
School Of Education
University of New England
Armidale NSW 2351
Australia
Phone: (02) 6773 5981
Email: [email protected]
www.une.edu.au/education
Information Sheet
For
Participants

156
of time commitment:
• Initial Questionnaire: 28 questions aimed at eliciting students’ pre-conceptions of mental computation.
• Test 1 (pre-test): Timed assessment using 15 mental multiplication questions involving one- and two-digit multipliers.
• Test 1 coding: students annotate coding sheet with their working for the test questions which are then coded by the research team using a coding taxonomy developed by the researcher.
• Intervention: the researcher introduces a number of strategies for consideration.
• Test 2 (post-test): a similar 15 question test. • Test 2 coding: students annotate coding sheet with their working for
the test questions which are then coded by the research team using a coding taxonomy developed by the researcher.
• Questionnaire 2: 3 Sections relating to strategy use, choice of strategies for a possible teaching program and their relative value and sequencing.
Note that the research study participants will complete all of these steps.
Those students not participating in the research will not complete the initial
and final tests and questionnaires, but may participate in the intervention.
Students who are not participating in the research will be provided with
alternate activities by the course co-ordinator, Dr Schmude.
Confidentiality Any personal details gathered in the course of the study will remain
confidential. No individual will be identified by name in any publication of
the results. All names will be replaced by pseudonyms; this will ensure your
anonymity. If you agree I would like to quote some of your responses from
the questionnaires. This will also be done in a way that ensure that you are
not identifiable.
Reciprocity Participants will have access to detailed lecture notes outlining the
Mathematical Knowledge for Teaching (MKT) framework as it relates to
mental multiplication, all suggested strategies with examples, the strategy
taxonomy and test questions (after the second test).
Participation is
Voluntary
Please understand that your involvement in this study is voluntary and I
respect your right to withdraw from the study at any time without
consequence and without needing to provide an explanation.
Other Ethical
Considerations
The research project will be conducted as part of EDME145 and EDME 369
with the approval of the Unit Coordinator, Dr Martin Schmude.
Participation in the research project is voluntary but the project is part of the

157
EDME145 and EDME 369 course curricula. Therefore, the intervention
phase of the research project will be available to the entire cohort. Students
who decide not to participate will not be required to complete the two tests
and questionnaires.
It is unlikely that there will be any additional risks associated with the
research as it will be conducted in normal lecture venues using the existing
course timetable.
No data from the research will be used in determining results or grades for
either course and data will only be available to the researchers mentioned
above.
Use of Information I will use information from the various data collection instruments as part of my Masters thesis, which I expect to complete in early 2019. Information from the various data collection instruments may also be used in academic journal articles and conference presentations after this date. At all times, I will safeguard your identity by presenting the information in a way that will not allow you to be identified.
Upsetting Issues It is unlikely that this research will raise any personal or upsetting issues but
if it does you may wish to contact your local Community Health on 6776
9600 on weekdays between the hours of 8.30 am and 5.00 pm. You may also
contact Student Support at UNE, located in the West Wing of the TC Lamble
Building, or by phone (02 6773 2897) or email ([email protected]).
Storage of
Information
Data from the research will be stored securely, initially in the une.cloud.une
account of Mr Hall, and then later in Dr Whannell’s account. Hard copy data
will be stored in locked filing cabinets, separate to any identifiers, in the
School of Education.
Disposal of
Information
All the data collected in this research will be kept for a minimum of five years after successful submission of my thesis, after which it will be disposed of by deleting relevant computer files, and destroying or shredding hardcopy materials.
Approval This project has been approved by the Human Research Ethics Committee of the University of New England (Approval No. HE18-135 Valid to 26/6/2019).
Researchers
Contact Details
Feel free to contact me with any questions about this research by email at [email protected]. You may also contact my supervisors. My Principal supervisor’s name is Dr Robert Whannell and he can be contacted by email at [email protected] or by phone on 02 6773 5981 and my Co-supervisor’s name is A/Prof Pep Serow and her email address is

158
[email protected] and phone number is 02 6773 2378
Complaints Should you have any complaints concerning the manner in which this research is conducted, please contact: Mrs Jo-Ann Sozou Research Ethics Officer Research Services University of New England Armidale, NSW 2351 Tel: (02) 6773 3449 Email: [email protected]
Thank you for considering this request and I look forward to further contact with you.
Regards,
Peter Hall

159
Research Project: Investigating strategies for one- and two-digit mental
multiplication used by pre-service teachers.
I, ……………………………………………………………………….., have read the information contained in the Information Sheet for Participants and any questions I have asked have been answered to my satisfaction. Yes/No I agree to participate in this activity, realising that I may withdraw at any time. Yes/No I agree that research data gathered for the study may be quoted and published using a pseudonym. Yes/No
I am older than18 years of age. Yes/No
…………………………….. …………………………. Participant Date
…………………………….. ………………………….
Researcher Date
School Of Education
University of New England
Armidale NSW 2351
Australia
Phone: (02) 6773 5981
Email: [email protected]
CONSENT FORM
for
PARTICIPANTS

160
Appendix 2 - Test and Retest
Table A.1
Questions Used for Tests 1 and 2
Test Retest
No. Question NSW Outcome No. Question
1 40 x 90 2 x 2 digit 1 50 x 90
2 5 x 8000 1 x 4 digit 2 6 x 7000
3 18 x 6 1 x 2 digit 3 22 x 6
4 5 x 19 1 x 2 digit 4 5 x 23
5 126 x 4 1 x 3 digit 5 217 x 4
6 9 x 45 1 x 2 digit 6 9 x 37
7 3 x 195 1 x 3 digit 7 3 x 295
8 143 x 7 1 x 3 digit 8 321 x 8
9 19 x 25 2 x 2 digit 9 23 x 25
10 23 x 12 2 x 2 digit 10 32 x 12
11 15 x 18 2 x 2 digit 11 14 x 17
12 21 x 23 2 x 2 digit 12 32 x 31
13 123 x 11 3 x 2 digit 13 432 x 11
14 45 x 24 2 x 2 digit 14 24 x 35
15 34 x 35 2 x 2 digit 15 46 x 45

161
Test Answer Sheet
Write answers only.
These are mental questions with no written working allowed.
There is a 15 second delay between questions.
Student Identifier:
Test # No. Answer 1 2 3 4 5 6 7 8 9 10 11 12 13 14 15

162
Appendix 3 - Taxonomy of Mental Multiplication Strategies and
Coding Sheets
Table A.2
Coding Taxonomy with Examples
Code Descriptor Examples BDF Basic or Derived Fact
5 x 8 = 40, 50 x 8 = 400, 50 x 80 = 4000
COU Counting – skip counting, doubling +/- 3 x 24 = 24+24+24 = 48+24 =72
3x24=2x24+24 = 48+24 = 72
BFS Basic Fact Shortcuts – shortcuts for
multipliers from 2 to 12, 15 and 20. x5 = ½ x 10 x8 = double, double, double x9 = x10 – x1 x11 = x10 + x1 x12 = x10 + double x15 = x10 + x5 Trachtenberg, teen multipliers, squares ending in 5
LRS Left to right separated – using the Distributive Law
7x23: 7x20=140, 7x3=21, 140+21=161
RLS Right to left separated – visualising the formal algorithm
7x23: 7x3=21write 1 and carry 2, 7x2=14, 14+2=16. Answer=161
FAC Factors 6x32: 6=2x3, 32x3=96, 96x2=192 PAR Partitioning (Non-standard) 8 x 21 = 8x10+8x11 = 80 + 88 = 168
19x34 = 20x34 – 1x34 = 680 – 34 = 646 CMP Compensation 17x25 = 17x100 ÷ 4 = 425
15x24 = 30x12 = 360 CMB A combination of the above strategies 21 x 23 = 11 x 23 + 10 x 23 (PAR)
= 253 (BFS) + 230 = 483

163
Test 1
Question
No.
Question Working Code Research
Comment
Example 18 x 7 10 x7 + 8x7 LRS
1 40 x 90
2 5 x 8000
3 18 x 6
4 5 x 19
5 126 x 4
6 9 x 45
7 3 x 195
8 143 x 7
9 19 x 25
10 23 x 12
11 15 x 18
12 21 x 23
13 123 x 11
14 45 x 24
15 34 x 35

164
Test 2
Question
No.
Question Working Code Research
Comment
Example 18 x 7 10 x7 + 8x7 LRS
1 50 x 90
2 6 x 7000
3 22 x 6
4 5 x 23
5 217 x 4
6 9 x 37
7 3 x 295
8 321 x 8
9 23 x 25
10 32 x 12
11 14 x 17
12 32 x 31
13 432 x 11
14 35 x 24
15 46 x 45

165
Appendix 4 - Questionaire 1 and 2
Research Project: Investigating strategies for one- and two-digit mental
multiplication used by pre-service teachers.
Please return to the Researcher, Mr Peter Hall at the first tutorial session.
For any questions regarding this research project, please contact:
Dr Rob Whannell
Principal Supervisor 02 6773 5981
email: [email protected]
Mr Peter Hall Research Masters
Candidate
02 6775 1161 or
0427 255 685
email: [email protected]
Information:
This questionnaire has 28 questions and should take approximately 20 minutes to complete.
If you have agreed to participate in the research, I would appreciate it if you could complete
a hard copy of the questionnaire and return it to me at the first tutorial session. Alternately,
you could email an electronic copy to me prior to the first tutorial.
The questionnaire has some demographic questions followed by responses regarding your
present conceptions of mental arithmetic. Questions 6 to 21 are based on a common 5-point
Likert scale ranging from Strongly Disagree to Strongly Agree. You only need to tick one
School Of Education
University of New England
Armidale NSW 2351
Australia
Phone: (02) 6773 5981
Email: [email protected]
Questionnaire 1

166
box that best reflects your opinion. Questions 22 to 26 provide an opportunity to
demonstrate your knowledge of mental multiplication strategies without time constraints.
Question 28 provides an option of further comment to clarify any of your answers.
The student identifier aims to protect your identity. It is a two letter/two-digit identifier of
your choice that you will need to use on all data collection instruments during the research.
An example could be PH27 – the choice is entirely yours but make it something easy to
remember.

167
Participant Identifier: ___________
Q1. What is your gender? Male ¨ Female ¨ Other ¨
Q2. What is your age group? 18 – 25 ¨ 26 – 35 ¨ 36 – 45 ¨ > 45 ¨
Q3. What level of mathematics did you complete at High School?
Year 10 ¨ Year 11 ¨ Maths General ¨ MA 2 ¨ Ext 1 or higher ¨
Q4. What is your major teaching area? ___________________________
Q5. What is your specialisation teaching area? ___________________________
For questions 6 to 21 nominate your level of agreement with the prompt by ticking the relevant box
No Prompt Strongly Disagree
Disagree Not Sure
Agree Strongly Agree
Q6 At school I was good at Maths ¨ ¨ ¨ ¨ ¨ Q7 I enjoyed doing Maths at school ¨ ¨ ¨ ¨ ¨ Q8 I learned a number of mental
computation strategies at school ¨ ¨ ¨ ¨ ¨
Q9 As an adult I use mental computation regularly
¨ ¨ ¨ ¨ ¨
Q10 I am aware of a range of strategies for mental computation
¨ ¨ ¨ ¨ ¨
Q11 I am confident in using a range of strategies for mental computation
¨ ¨ ¨ ¨ ¨
Q12 I am aware of the place of mental multiplication in the curriculum.
¨ ¨ ¨ ¨ ¨
Q13 I feel confident about teaching mental computation to Year 5
¨ ¨ ¨ ¨ ¨
Q14 I think mental computation is an essential skill for school students
¨ ¨ ¨ ¨ ¨
Q15 I think mental computation is an essential skill for adults
¨ ¨ ¨ ¨ ¨
Q16 Mental computation is best learned in primary school
¨ ¨ ¨ ¨ ¨
Q17 Mental computation should be taught before formal methods of written computation
¨ ¨ ¨ ¨ ¨
Q18 All students have the potential to be good at mental computation
¨ ¨ ¨ ¨ ¨

168
Q19 It is important for students to have as wide a range of mental multiplication strategies as possible to allow them to solve different problems efficiently.
¨ ¨ ¨ ¨ ¨
Q20 Mental multiplication promotes critical thinking and problem solving.
¨ ¨ ¨ ¨ ¨
Q21 Mental multiplication promotes number sense.
¨ ¨ ¨ ¨ ¨
For Questions 22 to 26, write down as many different mental strategies as you can to answer each
question.
No. Question Strategies Coding (leave
blank)
Q 22 19 x 25
Q 23 23 x 12
Q 24 15 x 18
Q 25 21 x 23
Q 26 45 x 24

169
Q27 By participating in this research, what do you hope to gain or achieve? (free response)
___________________________________________________________________________
___________________________________________________________________________
___________________________________________________________________________
Q28 Do you have any optional comments to make regarding any of the questions above? (free
response)
___________________________________________________________________________
___________________________________________________________________________
___________________________________________________________________________
Thank you for completing this questionnaire.
Peter Hall

170
Research Project: Investigating strategies for one- and two-digit mental
multiplication used by pre-service teachers.
Please return to the Researcher, Mr Peter Hall at the last tutorial session.
For any questions regarding this research project, please contact:
Dr Rob Whannell
Principal Supervisor 02 6773 5981
email: [email protected]
Mr Peter Hall Research Masters
Candidate
02 6775 1161 or
0427 255 685
email: [email protected]
Information:
The final questionnaire has 3 sections and should take approximately 20 minutes to
complete. If you have agreed to participate in the research, I would appreciate it if you could
complete a hard copy of the questionnaire and return it to me at the last tutorial session.
Alternately, you could email an electronic copy to me after the project has finished.
In Section 1, Questions 1 to 9 have not been included as they were completed in the first
survey. Questions 10 to 21 are similar to those in the first questionnaire and are also based
School Of Education
University of New England
Armidale NSW 2351
Australia
Phone: (02) 6773 5981
Email: [email protected]
Final
Questionnaire

171
on a 5-point Likert scale ranging from Strongly Disagree to Strongly Agree. You only need
to tick one box that best reflects your opinion.
Section 2 provides the opportunity to demonstrate your knowledge of alternate strategies for
mental multiplication.
Section 3 seeks your opinion on the range of strategies for mental multiplication that you
would ideally include in a Year 5 teaching program and the timing of that program. There is
a final opportunity to comment on the research and expand upon any answers to previous
questions.
Again, please use your student identifier to protect your identity. It is a two letter/two-digit
identifier of your choice that you will need to use on all data collection instruments during
the research. An example could be PH27 – the choice is entirely yours but it must be the
same as previously used.

172
Section 1 Student Identifier: __________________ (Same as questionnaire 1 to allow data
matching)
No Prompt Strongly Disagree
Disagree Not Sure
Agree Strongly Agree
Q10 I am aware of a range of strategies for mental computation
¨ ¨ ¨ ¨ ¨
Q11 I am confident in using a range of strategies for mental computation
¨ ¨ ¨ ¨ ¨
Q12 I am aware of the place of mental multiplication in the curriculum.
¨ ¨ ¨ ¨ ¨
Q13 I feel confident about teaching mental computation to Year 5
¨ ¨ ¨ ¨ ¨
Q14 I think mental computation is an essential skill for school students
¨ ¨ ¨ ¨ ¨
Q15 I think mental computation is an essential skill for adults
¨ ¨ ¨ ¨ ¨
Q16 Mental computation is best learned in primary school
¨ ¨ ¨ ¨ ¨
Q17 Mental computation should be taught before formal methods of written computation
¨ ¨ ¨ ¨ ¨
Q18 All students have the potential to be good at mental computation
¨ ¨ ¨ ¨ ¨
Q19 It is important for students to have as wide a range of mental multiplication strategies as possible to allow them to solve different problems efficiently.
¨ ¨ ¨ ¨ ¨
Q20 Mental multiplication promotes critical thinking and problem solving.
¨ ¨ ¨ ¨ ¨
Q21 Mental multiplication promotes number sense.
¨ ¨ ¨ ¨ ¨

173
Section 2
Write as many strategies as possible to solve each problem and code them.
No. Question Strategies Coding (leave blank)
1 9 x 37
2 23 x 25
3 32 x 12
4 14 x 17
5 24 x 35

174
Section 3
Q1. Did you attend the lecture? Yes ¨ No ¨
Prompt Of No Value
Of Little Value
Of Moderate
Value
Of Considerable
Value
Of Great Value
Q2. If you attended, how would you rate the lecture?
¨ ¨ ¨ ¨ ¨
Q3. Did you study the lecture notes? Yes ¨ No ¨
Prompt Of No Value
Of Little Value
Of Moderate
Value
Of Considerable
Value
Of Great Value
Q4. If you studied the lecture notes, how would you rate them??
¨ ¨ ¨ ¨ ¨
Question 5
Considering your coding sheet and given that Basic Number Facts, Derived facts and
Counting Methods are encountered in earlier years, which of the following strategies would
you teach to an ungraded Year 5? (tick if you would teach the strategy)
Code Descriptor Examples Tick BFS Basic Fact Shortcuts – shortcuts
for multipliers from 2 to 12 x5 = ½ x 10 x8 = double, double, double x9 = x10 – x1 x11 = x10 + x1 x12 = x10 + double x15 = x10 + x5 Trachtenberg, teen multipliers, squares ending in 5
¨
LRS Left to right separated – using the Distributive Law
7x23: 7x20=140, 7x3=21, 140+21=161
¨
RLS Right to left separated – visualising the formal algorithm
7x23: 7x3=21write 1 and carry 2, 7x2=14, 14+2=16. Answer=161
¨
FAC Factors 6x32: 6=2x3, 32x3=96, 96x2=192 ¨ PAR Partitioning (Non-standard 8 x 21 = 8x10+8x11 = 80 + 88 = 168
19x34 = 20x34 – 1x34 = 680 – 34 = 646
¨
CMP Compensation 17x25 = 17x100 ÷ 4 = 425 15x24 = 30x12 = 360
¨

175
Question 6
Considering your coding sheet, how would you rate each strategy?
Code Strategy Of No Value
Of Little Value
Of Moderate
Value
Of Considerable
Value
Of Great Value
BFS Basic Fact Shortcuts – shortcuts for multipliers from 2 to 12
¨ ¨ ¨ ¨ ¨
LRS Left to right separated – standard partitioning
¨ ¨ ¨ ¨ ¨
RLS Right to left separated – visualising the formal algorithm
¨ ¨ ¨ ¨ ¨
FAC Factors ¨ ¨ ¨ ¨ ¨ PAR Partitioning (Non-standard) ¨ ¨ ¨ ¨ ¨ CMP Compensation ¨ ¨ ¨ ¨ ¨
Question 7
Considering your coding sheet, what strategies, if any, would you only teach as extensions
to a more able group of students? (tick as appropriate)
BFS 0 LRS 0 RLS 0 FAC 0 PAR 0 CMP 0
Question 8
How would you pace your instruction of mental computation strategies? (tick your preferred
option)
As a block of 2-3 weeks 0 Over 1 term 0 Over 2 terms 0 Over 3 or 4 terms
Question 9
Are there any general comments in relation to the research project that you would like to
make?
________________________________________________________________________
Thank you for completing this questionnaire.
Peter Hall

176
Appendix 5 – Lecture Notes
Mental Multiplication by One- and Two-digit Numbers
Peter Hall
Basic Number Fact Shortcuts
Let’s consider each multiplier from 2 to 12 separately as there are different shortcuts
associated with each one.
Times 2: Doubling is, of course, the same as multiplying by two, or adding the same
number. This may sound trivial but it can be achieved in two ways, which I’ll call unders
and overs.
Unders implies that the product doesn’t need a carry to complete. For example, 14 x 2 is
simply double 10 then double 4 to give 20 + 8 = 28. It’s generally done in one go from left
to right.
Other examples are
a) 13 x 2 b) 21 x 2 c) 43 x 2 d) 62 x 2 e) 74 x 2 f) 103 x 2 g) 121 x 2
Overs implies a carry of some sort, such as 27 x 2. Generally, I would double the tens digit
first to give 40 and then 2 x 7 = 14 and add to get 54. This is the reverse of the formal way
of doing the problem (right to left) but research suggests it works better when doing mental
calculations.
Similarly with 68 x 2, I’d hold 60 x 2 = 120 in my head and double 8 (2x8=16) then add to
get 136. When you get used to it, you simply double 60 and add 10 to get 130 because you
know it is overs; then add 6 because you know double 8 ends in 6.

177
With something like 172 x 2: I’d do 2 x 170 = 200 + 140 = 340 and add 4 (2x2) to get 344.
It pays to know the doubles up to 20 to cut down calculation time – if I know double 17 is
34 then double 170 is 340 and add double 2 to get 344.
Other examples are:
a) 18 x 2 b) 26 x 2 c) 48 x 2 d) 67 x 2 e) 79 x 2 f) 136 x 2 g) 161 x 2
Generally, when you double something in your head, you start with the highest place value
and work back to digits. Students need to be proficient at doubling and halving as so many
shortcuts rely primarily on those two skills.
Times 3: This can be seen as tripling if you are good at that or double + itself.
Try 32 x 3: double = 64 and add 32 =96
Or 3 x 30 = 90 3x2 = 6
90 + 6 = 96
57 x 3: I’d probably do 3 x 50 + 3 x 7 = 150 + 21 = 171
Again, I’d multiply the tens digit first, hold that in my head, then the units digit and add.
123 x 3 = 3 x 120 + 3 x 3 = 360 + 9 = 369 or
= 246 + 123 = 369 (using double + itself)
In my head I’ll double 123 to get 246 then add 100 for 346, then 20 for 366, and finally 3
for 369.
47 x 3 = 3 x 40 + 3 x 7 =120 +21 = 141 or
= 94 + 47 = 134 + 7 = 141 (using double + itself)
You’ll notice that I added the 40 to 94 using overs then finished by adding the 7, again
using overs.
Like doubles, it pays to know the triples up to 20
Then 182 x 3 = 540 + 6 = 546

178
Now try
a) 13 x 3 b) 21 x 3 c) 43 x 3 d) 62 x 3 e) 74 x 3 f) 103 x 3 g) 121 x 3
h) 173 x 3
Times 4: Is of course x 2 x 2 or double double
13 x 4 =26 x 2 = 52
43 x 4 = 86 x 2= 160 + 12 = 172
Hold 160 in your head, add 10 for overs (170), then 2 for double 6 (172)
123 x 4 = 246 x 2 = 480 + 12 = 492
For a straight mental multiplication by 4:
13 x 4 = 40 + 12 = 52
43 x 4 = 160 + 12 = 172
123 x 4 = 400 + 80 + 12 = 492
Try these for yourself:
a) 18 x 4 b) 26 x 4 c) 43 x 4 d) 67 x 4 e) 72 x 4 f) 106 x 4 g) 161 x 4
Times 5: This is x 10 then halved or half and times by ten. Your choice depends on whether
the multiplicand is odd or even.
For even numbers, half first then times by ten.
Examples:
16 x 5 = 8 x 10 = 80
24 x 5 = 12 x 10 = 120
38 x 5 = 19 x 10 = 190
114 x 5 = 57 x 10 = 570
Try these:

179
a) 18 x 5 b) 26 x 5 c) 48 x 5 d) 66 x 5 e) 72 x 5 f) 126 x 5 g) 164 x 5
For odd numbers do the reverse; times by ten and then half:
13 x 5 = 130 ÷ 2 = 65
17 x 5 = 170 ÷ 2 = 85
23 x 5 = 230 ÷ 2 = 115
45 x 5 = 450 ÷ 2 = 225
When you halve, think of the even ten multiple below, halve it and add 5.
So 130 ÷ 2 is 120 ÷ 2 = 60, add 5 = 165.
Try these for yourself
a) 15 x 5 b) 21 x 5 c) 43 x 5 d) 67 x 5 e) 71 x 5 f) 103 x 5 g) 121 x 5
For direct multiplication by 5, start with the highest digit (left to right).
16 x 5 = 50 + 30 = 80
24 x 5 = 100 + 20 = 120
45 x 5 = 200 + 25= 225
114 x 5 = 500 + 50 + 20 = 570
Try these for yourself
a) 19 x 5 b) 26 x 5 c) 42 x 5 d) 67 x 5 e) 74 x 5 f) 109 x 5 g) 122 x 5
Times 6: Either use its factors 2 and 3 or times 5 plus itself or do a straight multiplication
by 6.
When using factors, the choice of doubling first or second is probably dependent on the
question rather than a suggested order.
Factors of 2 and 3 Times 5 + x1 x6
13 x 6 13 x 3 = 39 13 x 5 = 65 10 x 6 = 60

180
39 x 2 = 78 65 + 13 = 78 3 x 6 = 18
60 + 18 = 78.
25 x 6 25 x 2 = 50 25 x 5 = 125 20 x 6 = 120
50 x 3 = 150 125 + 25 = 150 5 x 6 = 30
120 + 30 = 150.
83 x 6 83 x 3 = 249 83 x 5 = 415 80 x 6 = 480
249 x 2 =250 x 2 – 2 415 + 83 = 498 3 x 6 = 18
= 498 480 + 18 = 498.
132 x 6 132 x 3 = 396 132 x 5 = 660 100 x 6 = 600
396 x 2 = 400 x 2 - 8 660 + 132 = 792 30 x 6 = 180
= 792 2 x 6 = 12
total = 792
You could try:
a) 18 x 6 b) 26 x 6 c) 143 x 6 d) 670 x 6 e) 1234 x 6
Times 7: Done as x 5 + double or as straight x 7
X 5 + double Times 7
23 x 7 23 x 5 = 115 20 x 7 = 140
115 + 46 = 161 3 x 7 = 21
140 + 21 = 161
56 x 7 56 x 5 = 280 50 x 7 = 350
280 + 112 = 392 6 x 7 = 42
350 + 42 = 392.
124 x 7 124 x 5 = 620 100 x 7 = 700
620 + 248 = 868 20 x 7 = 140
4 x 7 = 28
total = 868

181
Here’s some to try:
a) 22 x 7 b) 46 x 7 c) 76 x 7 d) 112 x 7 e) 134 x 7
Times 8: Double, double, double or x10 – double or straight x 8
Double, double, double Times 10 – double x 8
13 x 8 13 x 2 = 26 13 x 10 = 130 10 x 8 = 80
26 x 2 = 52 130 - 26 = 104 3 x 8 = 24
52 x 2 = 104 80 + 24 = 104.
35 x 8 35 x 2 = 70 35 x 10 = 350 30 x 8 = 240
70 x 2 = 140 350 - 70 = 280 5 x 8 = 40
140 x 2 = 280 240 + 40 = 280.
73 x 8 73 x 2 = 146 73 x 10 = 730 70 x 8 = 560
146 x 2 = 145 x 2 + 2 730 - 146 = 600 - 16 3 x 8 = 24
292 x 2 = 300 x 2 - 16 = 584 560 + 24 = 584.
= 584
132 x 8 132 x 2 = 264 132 x 10 = 1320 100 x 8 = 800
264 x 2 = 528 1320 - 264 = 1100 - 44 30 x 8 = 240
528 x 2 = 1056 = 1056 2 x 8 = 16
total = 1056
Try the following:
a) 23 x 8 b) 45 x 8 c) 67 x 8 d) 71 x 8 e) 120 x 8 f) 305 x 8
Times 9: x10 – x1 or Hall’s method or straight x9
Hall’s method: add 1 to the tens digit and subtract this from the number. Now add a nine
complement to the remaining digits.
For example: 36 x 9. Add one to the tens digit 3+1=4. Take this away from the number 36 -
4=32. Add a nine complement 3+2=5, 9-5=4. Hence add a 4 to get 324.

182
Another example: 87 x 9. Add one to the tens digit 8 + 1 = 9. Take this away from the
number 87 – 9 = 78. Add a nine complement 7 + 8 = 15, 18 – 15 = 3. Hence 783
And another: 234 x 9. Add 1 to the tens digit 23 + 1 = 24. Take 24 from 234 = 210. Add a
nine complement (6) to get 2106
x10 – x1 Hall’s method x9
19 x 9 19 x 10 = 190 19 – (1+1) = 17 10 x 9 = 90
190 - 19 = 171 171 9 x 9 =81
90 + 81 = 171.
57 x 9 57 x 10 = 570 57 – (5+1) = 51 50 x 9 = 450
570 - 57 = 513 513 7 x 9 = 63
450 + 63 = 513.
112 x 9 112 x 10 = 1120 112 – (11+1)= 100 100 x 9 = 900
1120 -112 = 1008 1008 10 x 9 = 90
2 x 9 = 18
total = 1008
Note: Don’t use Hall’s method for multiples of 10 . Use either times tables or x10 – x1. For
example 40 x 9 = 360 (4X9=36) or 40 x 10 – 40 = 400 – 40 = 360.
Try the following:
a) 23 x 9 b) 45 x 9 c) 63 x 9 d) 71 x 9 e) 120 x 9 f) 345 x 9
Times 10: Shift left and add a zero if whole numbers.
36 x 10 = 360 49 x 10 = 490 123 x 10 = 1230 102 x 10 = 1020

183
The concept of shift left and add zero for whole numbers is important. If you just say ‘add
zero’, it causes problems later when students encounter decimal multiplication. For
example, 3.4 x 10 can sometimes lead to incorrect answers of 3.40 or 30.4, if students have
just been given the rule as ‘add zero’. Shift left tells them you are moving a place in the
decimal system, which is an important concept for students to grasp. Always talk about 360
being ten times larger than 36 or 36 is tens times smaller than 360. Eventually this leads to
saying that 36 is one tenth of 360.
For a better understanding of the research behind this, try Hurst, C., & Hurrell, D. (2016,
December). Captain Zero... hero or villain?. In 2016 Mathematical Association of Victoria’s
Annual Conference Proceedings.
Times 11: x10 + x1 or Trachtenberg or x11
We’ll hear more of Trachtenberg later in the chapter, but for now his simple rule for
multiplying by 11 is to add each number to its right hand neighbour.
For example: 342 x 11 = 03420 x 11 = (0+3)(3+4)(4+2)(2+0) = 3762
Note: Imagine a zero at the front and rear of the number. Trachtenberg calls this a nought
sandwich. He defines a neighbour as the digit to the left.
For two digit numbers x 11, just add the two digits to get the middle digit. Leave the outside
digits as they are except if a carry is required.
Examples:
24 x 11= 2(2+4)4 = 264
43 x 11 = 4(4+3)3 = 473
57 x 11 = 5(5+7)7 = 627 note the carry as 5 + 7 =12, hence carry 1.
Examples using all three methods:
x10 + x1 Trachtenberg x11
23 x 11 23 x 10 = 230 2(2+3)3=253 20 x 11 = 220

184
230 + 23 = 253 3 x 11 = 33
220 + 33 = 253
56 x 11 56 x 10 = 560 5(5+6)6 = 616 50 x 11 = 550
560 + 56 = 616 6 x 11 = 66
550 + 66 = 616
73 x 11 73 x 10 = 730 7(7+3)3 = 803 70 x 11 = 770
730 + 73 = 803 3 x 11 = 33
770 + 33 = 803.
124 x 11 124 x 10 = 1240 1(1+2)(2+4)4 120 x 11 = 1320
1240 + 124 = 1364 = 1364 4 x 11 = 44
1320 + 44 = 1364
Try the following:
a) 23 x 11 b) 45 x 11 c) 67 x 11 d) 121 x 11 e) 320 x 11 f) 4135 x 11
Times 12: x10 + x2 or by factors of 3 and 4 or by x11 + x1 or Trachtenberg.
Triple, double, double x10 + x2 x11 + x1
13 x 12 13 x 3 = 39 13 x 10 = 130 13 x 11 = 143
39 x 2 = 78 130 + 26 = 156 143 + 13 = 156
78 x 2 = 156
35 x 12 35 x 2 = 70 35 x 10 = 350 35 x 11 = 385
70 x 3 = 210 350 + 70 = 420 385 + 35 = 420
210 x 2 = 420
57 x 12 57 x 2 =114 57 x 10 = 570 57 x 11 = 627
114 x 3 = 342 570 + 114 = 684 627 + 57 = 684
342 x 2 = 684

185
132 x 12 132 x 3 = 396 132 x 10 = 1320 132 x 11 = 1452
396 x 2 = 800 - 8 1320 + 264 = 1584 1452 + 132
792 x 2 = 1600 -16 = 1584
= 1584
Try the following:
a) 23 x 12 b) 45 x 12 c) 67 x 12 d) 121 x 12 e) 320 x 12 f) 135 x 12
Trachtenberg’s Multiplication for 12
Rule: to multiply by 12:
Make a nought sandwich and starting from the right digit, double each digit and add to the
neighbor
If the answer is greater than a single digit, simply carry over the extra digit (which will be a
1 or 2) to the next operation.
Examples:
316 x 12 = 03160 x 12
= (0x2+3=3) (3x2+1=7) (1x2+6+1=9) (6x2=12, write down 2, carry1)
= 3792
12345 x 12 = 0123450 x 12
= (0x2+1=1)(1x2+2=4)(2x2+3 +1=8) (3x2+4 +1=11, write 1, carry 1) (4x2+5+1=14, write 4,
carry 1) (5x2=10, write down 0, carry1)
Answer = 148140
Higher Number Fact Shortcuts
Multiply by 15: x10 then add half again
For example:
26 x 15 = 260 + 130 = 390
46 x 15 = 460 + 230 = 690
87 x 15 = 870 + 435 = 1305

186
35 x 15 = 350 + 175 = 525
A few to try:
a) 18 x 15 b) 26 x 15 c) 43 x 15 d) 67 x 15 e) 124 x 15
Multiply by 20: double, shift left, add a place holder if needed.
For example:
34 x 20 = 68 x 10 = 680
52 x 20 = 104 x 10 = 1040
96 x 20 = 192 x 10 = 1920
A few to try:
a) 35 x 20 b) 29 x 20 c) 43 x 20 d) 67 x 20 e) 103 x 20 g) 121 x 20
Multiplying Numbers in the teens – from 10 to 19
Rule: Add the last digit of the multiplier to the first number. Multiply this by ten, then add
the product of the two units digits.
Examples:
13 x 16
Add 6 to 13 (or 3 to 16) and x10 = (13 + 6) x 10 =190
Add 3 x 6 = 190 + 18 = 208
14 x 17
14 + 7 = 21 21 x 10 = 210, 4 x 7 = 28 210 + 28 = 238
16 x 19
16 + 9 = 25 25 x 10 = 250, 6 x 9 = 54 250 + 54 = 304
Try these for yourself:
a) 15 x 14 b) 12 x 17 c) 16 x 14 d) 15 x 18 e) 17 x 18 f) 18 x 19

187
As you get used to it, you start to skip steps and do more and more in your head. Eventually,
the aim is to do it all mentally.
And in the twenties
Rule: Add the last digit of the multiplier to the first number. Multiply this by 20, then add
the product of the two units digits.
Examples:
23 x 26
Add 6 to 23 (or 3 to 26) and x20 = (23 + 6) x 20 =29 x 20 = 580
Add 3 x 6 = 580 + 18 = 598
24 x 27
24 + 7 = 31 31 x 20 = 620, 4 x 7 = 28 620 + 28 = 648
26 x 29
26 + 9 = 35 35 x 20 = 700, 6 x 9 = 54 700 + 54 = 754
Try these for yourself:
a) 25 x 24 b) 22 x 27 c) 26 x 24 d) 25 x 28 e) 27 x 28
This method also works for any two numbers in the same decile. Use the same rule except
multiply by the appropriate multiple of ten. In the thirties, multiply by 30; in the forties,
multiply by 40; and so on.
Squaring Numbers Ending in 5: Multiply the ten multiples above and below the number
and add 25.
Examples:
25! = 20 × 30+ 25 = 625
35! = 30 × 40+ 25 = 1225
65! = 60 × 70+ 25 = 4225

188
95! = 90 × 100+ 25 = 9025
Try a few:
a) 15! b) 45! c) 55! d) 75! e) 85! f) 105!
Near Squares
Examples:
34 x 35 = 35! - 35 = 1225 – 35 = 1190
23 x 25 = 25! - 2 x 25 = 625 – 50 = 575
65 x 66 = 65! + 65 = 4225 + 65 = 4290
95 x 97 = 95! + 2 x 95 = 9025 + 200 -10 = 9215
Try a few:
a) 14 x 15 = 15! - 15 b) 43 x 45 = 45! - 90
c) 55 x 56 = 55! + 55 d) 77 x 75 = 75! + 150
There are many other shortcuts for squares and using squares, and different combinations of
two-digit multipliers. You could try Handley, B. (2012). Speed mathematics. John Wiley &
Sons for some more ideas.
Partitioning, Factor and Compensation Strategies and Combined
Strategies
Standard Partitioning involves splitting one of the multipliers into its powers of ten and
then multiplying left to right. This is also know as Left Right Separated (LRS)
For example:
12 x 135 = 10 x 135 + 2 x 135 or 100 x 12 + 30 x 12 + 5 x 12
= 1350 + 270 = 1200 + 360 + 60
= 1620 = 1620
Non-standard partitioning involves splitting one or both multipliers into parts and then
multiplying each part and finally adding by the Distributive Law.

189
12 x 135 = 4 x 135 + 4 x 135 + 4 x 135 or 11 x 135 + 1 x 135
= 540 + 540 + 540 = 1485 +135
= 1620 = 1620
12 x 135 = 20 x 135 – 8 x 135 or 9 x 135 + 3 x 135
= 2700 – 1080 = 1215 + 405
= 1620
The splits chosen reflect shortcuts mentioned in the last section.
Compensation covers a mix of strategies involving an adjustment to one multiplier and
then compensation of some sort.
12 x 135 = 6 x 270
= 3 x 540
= 1500 + 120 = 1620
Now consider 23 x 21 and the range of strategies available to calculate the answer.
Standard Partitioning
23 x 21 = 20 x 23 + 1 x 23
As a mental calculation, you do 20 x 23 in your head (shift, double) and hold the answer of
460 there. Then add 1 x 23 to this and get 483.
Similarly we could partition 23:
21 x 23 = 21 x 20 + 21 x 3
As a mental exercise, do 21 x 20 = 420 (hold that in your head) and add 21 x 3 = 63 to get
483.
You could partition both numbers into tens and digits:
21 x 23 = (20 + 1) x (20 + 3)

190
This produces four partial products: 20 x 20 + 20 x 3 + 1 x 20 + 1 x 3
= 400 + 60 + 20 + 3 = 483
Non-Standard Partitioning
However, you could split 21 into 10 + 11.
Then do 23 x 10 = 230 (hold that in your head) and use the 11 trick (add to the neighbour)
to get 23 x 11 = 253.
Finally, 253 + 230 = 483.
21 could also be split into 12 + 9 and use both the 12 trick (double + neighbour) and one of
the many 9 tricks (x10 – x1).
This gives me 276 + 207 = 483.
What about splitting 21 into 15 + 6?
23 x 15 is x10 then half again = 230 + 115 = 345.
23 x 6 = 23 x 3 x 2 (using factors) = 69 x 2 = 138.
345 + 138 = 483.
Admittedly a little harder to hold the partial products in your head and do the addition.
One more? Try splitting 23 into 8 + 15 and multiply by 21.
21 x 15 = 210 + 105 = 315.
21 x 8 is double, double, double = 42, 84, 168.
168 + 315 = 483
So how many ways are there to multiply 21 x 23? Well, using partitioning, there are actually
an infinite number of ways of doing it, most ridiculous, but all possible. Using whole
numbers, there are 10 ways of partitioning 21 and 11 ways for 23. This implies that there
are 10 + 11 = 21 ways of partitioning either number. But if you partition both, there are
many more options.
This could be further extended if by considering a greater number of partitions.
For example:

191
Split 23 into 2 + 10 + 11.
21 x 23 = 21 x (2 + 10 + 11)
Expanding:
21 x 23 = 42 + 210 + 231 (using the 11 shortcut of add to neighbour)
= 483
All of the partial products can be done mentally through times tables or simple shortcuts.
Non-standard partitioning with negatives (Subtractive Distributive)
23 x (30 - 9) or 21 x (25 - 2) or 21 x (30 – 7)
So,
23 x 30 is triple, shift = 690.
9 x 23 = 23 – 3 + (9 complement) = 207
690 – 207 = 483
21 x 23 = 21 x 30 – 7 x 21
21 x 30 is triple, shift = 630.
7 x 21 = 147
630 – 130 - 17 = 500 – 17 = 483
Compensation
21 x 23 = 7 x 69 (one third of 21 x triple 23)
= 7 x 70 – 7 (subtractive distributive)
= 490 – 7 = 583
Can you think of other ways of distributing either 21 or 23 to get the same answer by a
different route. Of course you can and that’s what we want our students to be capable of.
Not just a rote learned method but the ability to choose a pathway that suits their individual
knowledge of multiplication and its short cuts.
Here’s one using partitioning and factors

192
21 x (22 + 1) = 21 x 11 x 2 + 1 x 21
= 231 x 2 + 21 = 462 + 21 = 483
And another with partitioning and factors
split 21 into 22 – 1
23 x 22 = 23 x 11 x 2 = 253 x 2 = 506
506 – 23 = 483.
Another compensation strategy is used to multiply by 25:
Multiply by 25: As 25 is ¼ of 100, divide by 4 then x 100
16 x 25 = 4 x 100 = 400
28 x 25 = 7 x 100 = 700
36 x 25 = 9 x 100 = 900
52 x 25 = 13 x 100 = 1300
Harder examples:
19 x 25 = 19/4 x 100 = 4 ¾ x 100 = 475
19 divided by 4 goes four and remainder ¾ . That’s 4 hundreds and 3 x 25 = 475
25 x 25 = 6 ¼ x 100 = 625
53 x 25 = 13 ¼ x 100 = 1325
85 x 25 = 21¼ x 100 = 2125
106 x 25 = 26 ½ x 100 = 2650
Some to try yourself:
a) 24 x 25 b) 48 x 25 c) 68 x 25 d) 72 x 25 e) 120 x 25 f) 304 x 25
And some harder ones:
a) 25 x 25 b) 43 x 25 c) 65 x 25 d) 71 x 25 e) 122 x 25 f) 306 x 25

193
This shortcut would then allow another alternate pathway for 21 x 23 mentioned above
21 x 23 = 21 x 25 – 2 x 21
21 x 25 = 5 ¼ x 100 = 525 and
2 x 21 = 42.
Therefore, 21 x 23 = 525 – 42 = 483
One last example using a variety of strategies
Try 55 x 90
Let’s start by partitioning 55 in different ways:
90 x 55 = 90 x 50 + 90 x 5 (Standard partitioning)
= 4500 + 450
= 4950
90 x 55 = 90 x 25 + 90 x 30 (Non-standard partitioning)
= 2250 + 2700
= 4950
90 x 55 = 90 x 10 + 90 x 45 (Non-standard partitioning and factors)
= 900 + 2 x 45 x 45
= 900 + 2 x 2025 (Note the trick for 45! = 40×50+ 25 = 2025)
= 900 + 4050
= 4950
90 x 55 = 90 x 100 – 90 x 45 (Non-standard partitioning and factors)
= 9000 – 2 x 45 x 45
= 9000 - 4050
= 4950
90 x 55 = 90 x 60 - 90 x 5 (Subtractive partitioning)
= 5400 – 450
= 4950

194
90 x 55 = 90 x 40 + 90 x 15 (Non-standard partitioning)
= 3600 + 900 + 450
= 4950
We could also partition 90 in a number of ways:
55 x 90 = 55 x 55 + 25 x 55 + 10 x 55
= 3025 + 1375 + 550 (Note the trick for 55! = 50×60+ 25 = 3025)
= 4400 + 550
= 4950
55 x 90 = 55 x 55 + 20 x 55 + 10 x 55 + 5 x 55
= 3025 + 1100 + 550 + 275
= 4125 + 825
= 4950
55 x 90 = 55 x 100 – 55 x 10
= 5500 – 550
= 4950
55 x 90 = 55 x 50 + 55 x 40
= 5500 ÷ 2 + 550 x 4
= 2750 + 2200
= 4950
55 x 90 = 55 x 10 + 55 x 80 (double, double, double, shift for 80)
= 550 + 440 x 10
= 550 + 4400
= 4950
55 x 90 = (55 x 10) x 9 (by the factors)
= 550 x 9
= 550 x 10 – 550 x 1
= 5500 – 550

195
= 4950
55 x 90 = 11 x 450 (÷5 and x5) (Compensation)
= 4950 (using the 11 shortcut)
Taxonomy of Strategies
The categorization to be used in this study has seven classifications of mental multiplication
strategies listed with examples above. Added to this are the simpler strategies of Basic
Derived Fact and Counting to form a taxonomy of nine strategies:
• Basic Fact (BDF) – a multiplication fact such as 5 x 8 or derived fact such 50 x 80.
• Counting (COU) – any counting strategy including repeated addition, skip counting,
doubling and doubling plus or minus.
• Basic Fact Shortcuts (BFS) includes shortcuts for multipliers from 2 to 12 and
include some of Trachtenberg’s shortcuts, particularly x11 and x12, teen multiples
and squares ending in 5.
• Right Left Separated (RLS) - use of the standard algorithm to multiply from right to
left by place value. This is not mentioned above as it is regarded as a poor mental
multiplication strategy suitable only for single-digit multipliers.
• Left Right Separated (LRS) use of the Distributive Law to multiply from the highest
place value to the lowest. Also known as Standard Partitioning.
• Factors (FAC) – one or both numbers being split into factors to multiply
successively.
• Partitioning (PAR) – non-standard additive and subtractive distribution
• Compensation (CMP) – includes Aliquot parts and Derived (see examples)
• Combined (CMB) – a combination of two or more of the above

196
Table A.3
Taxonomy of Strategies Used in this Study with Examples
Strategy Coding Examples
Basic or
Derived Fact
BDF 5 x 8 = 40, 50 x 8 = 400, 50 x 80 = 4000
30 x 70 = 2100
40 x 600 = 24 000
Counting –
skip counting,
doubling +/-
COU 3 x 24 = 24+24+24 = 48+24 =72
3x24=2x24+24 = 48+24 = 72
Basic Fact
Shortcuts
BFS x5 = ½ x 10
x8 = double, double, double
x9 = x10 – x1
x11 = x10 + x1
x12 = x 11 + x1
Trachtenberg shortcuts, numbers in the same decile, squares
ending in 5, near squares.
Right Left
Separated
RLS 7x23: 7x3=21write 1 and carry 2, 7x2=14, 14+2=16.
Anwer=161 or 7x 3 + 7 x 20 = 21 + 140 = 161
Left Right
Separated
LRS 7x23: 7x20=140, 7x3=21, 140+21=161
127 x 4 = 100 x 4 + 20 x 4 + 7 x 4 = 400 + 80 +28 = 508
Factors FAC 6x32: 6=2x3, 32x3=96, 96x2=192
32 x 12 = 32 x 4 x 3 = 128 x 3 = 360 + 24 = 384
Partitioning
(nonstandard)
PAR 8 x 21 = 8x10+8x11 = 80 + 88 = 168
21x23 = 11x23 + 10x23 = 253 +230 = 483
19x34 = 20x34 – 1x34 = 680 – 34 = 646
Compensation
CMP 17x25 = 17x100 ÷ 4 = 425
15x24 = 30x12 = 360
Combination CMB 21 x 23 = 21 x 25 – 2 x 21 = 525 – 42 = 483 (CMP + PAR)

197
This completes the lecture notes although the PowerPoint presentation then went on to
consider the 15 questions from the first test and relate them to the strategies discussed and
the taxonomy.
Initial Test Questions and Suggested Strategies
This section was a feature of the tutorial that looked at the relative merits of different
strategies in achieving a solution in the given time. This deals with the adaptivity of
particular solutions or the appropriate choice of strategy. Alternatives were offered for each
question and the participants were left to decide the best pathway for them.
40 x 90 = 4 x 9 x 10 x 10 = 36 x 100 (shift right two and add two place holders). This is a
BDF strategy or FAC.
5 x 8000 = 5 x 8 x 1000 = 40 x 1000 (shift right three and add three placeholders), BDF or
FAC.
18 x 6 = 18 x 3 x 2 = 54 x 2 = 108 (FAC)
= 9 x 12 = 108 (CMP)
= 6 x 10 + 6 x 8 = 60 + 48 = 108 (LRS)
= 18 x 5 + 18 = 90 + 18 = 108 (PAR)
5 x 19 = 190 ÷ 2 = 95 (BFS)
= 5 x 20 – 5 = 100 – 5 = 95 (PAR)
= 5 x 10 + 5 x 9 = 50 + 45 = 95 (LRS)
126 x 4= 100 x 4 + 20 x 4 + 6 x 4 = 400 + 80 + 24 = 504 (LRS)
= 125 x 4 + 4 = 500 (double double) + 4 = 504 (PAR)
= 252 x 2 = 504 (double double) (BFS)
9 x 45 = 45-5 + nine complement = 405 (BFS)
= 10 x 45 – 45 = 450 – 45 = 405 (PAR)
= 9 x 40 + 9x 5 = 360 + 45 = 405 (LRS)

198
3 x 195= 3 x 200 – 3 x 5 = 600 – 15 = 585 (PAR)
= 3 x 100 + 3 x 90 + 3 x 5 = 300 + 270 + 15 = 585 (LRS)
143 x 7= 100 x 7 + 40 x 7 + 3 x 7 = 700 + 280 + 21 = 1001 (LRS)
= 143 x 5 + 143 x 2 = 1430 ÷ 2 + 286 = 715 + 286 = 1001 (PAR + BFS)
= 150 x 7 – 7 x 7 = 1050 – 49 = 1001 (PAR + BFS)
19 x 25 = 20 x 25 – 25 = 400 – 25 = 375 (PAR + CMP)
= 4 ¾ x 100 = 475 (CMP)
= 10 x 25 + 9 x 25 = 250 + 225 = 475 (LRS + CMP)
23 x 12 = Trachtenberg = 276 (BFS)
= 23 x 11 + 23 = 253 (Trachtenberg) + 23 = 276 (PAR + BFS)
= 23 x 10 + 23 x 2 = 230 + 46 = 276 (LRS)
= 46 x 6 = 92 x 3 = 276 (CMP)
15 x 18 = 180 + 90 = 270 (BFS)
= 30 x 9 = 270 (CMP + BDF)
= 10 x 15 + 8 x 15 = 150 + 120 (double x3) = 270 (LRS + BFS)
21 x 23 = 10 x 23 + 11 x 23 = 230 + 253 = 283 (PAR + BFS)
= 20 x 23 + 1 x 23 = 460 + 23 = 483 (LRS)
123 x 11 = Trachtenberg = 1353 (BFS)
= 123 x 10 + 123 = 1230 + 123 = 1353 (LRS)
45 x 24 = 90 x 12 = 1080 (CMP)
= 45 x 20 + 45 x 4 = 900 + 180 = 1080 (LRS)
= 25 x 24 + 20 x 24 = 600 + 480 = 1080 (PAR + CMP)
34 x 35 = 39 x 30 + 4 x 5 = 40 x 30 – 30 + 20 = 1200 – 10 =1190 (BFS + PAR)
= 70 x 17 = 10 x 70 + 7 x 70 = 700 + 490 = 1190 (CMP + LRS)
= 35! - 35 = 1225 – 35 = 1190 (BFS + PAR)

199
Appendix 6 - Ethics Approval

200
Appendix 7 Excerpts From Relevant Curriculum Documents
The Australian Curriculum (ACARA, 2012)
The three-dimensional design of the Foundation – Year 10 Australian Curriculum recognises the importance of disciplinary knowledge, skills and understanding alongside general capabilities and cross-curriculum priorities.
Disciplinary knowledge, skills and understanding are described in the eight learning areas of the Australian Curriculum: English, Mathematics, Science, Health and Physical Education, Humanities and Social Sciences, The Arts, Technologies and Languages. The latter four learning areas have been written to include multiple subjects, reflecting custom and practice in the discipline. In each learning area or subject, content descriptions specify what young people will learn, and achievement standards describe the depth of understanding and the sophistication of knowledge and skill expected of students at the end of each year level or band of years.
General capabilities comprise one of the three dimensions of the Australian
Curriculum. They encompass knowledge, skills, behaviours and dispositions
that, together with curriculum content in each learning area and the cross-
curriculum priorities, assist students to live and work successfully in the twenty-
first century. They play a significant role in realising the goals set out in the
Melbourne Declaration on Educational Goals for Young Australians
(MCEETYA) 2008 that all young people in Australia should be supported to
become successful learners, confident and creative individuals, and active and
informed citizens.
The Australian Curriculum includes seven general capabilities. These are:
• Literacy • Numeracy • Information and communication technology capability • Critical and creative thinking • Personal and social capability • Ethical understanding • Intercultural understanding.
In the Australian Curriculum, general capabilities are addressed through the learning areas and are identified wherever they are developed or applied in content descriptions. They are also identified where they offer opportunities to

201
add depth and richness to student learning in content elaborations. The Australian Curriculum gives special attention to three cross-curriculum priorities:
• Aboriginal and Torres Strait Islander histories and cultures • Asia and Australia’s engagement with Asia • Sustainability
The cross-curriculum priorities are embedded in the curriculum and will have a
strong but varying presence depending on their relevance to each of the learning
areas.
Of particular relevance to this study is the General Capability of Numeracy
Numeracy
In the Australian Curriculum, students become numerate as they develop the knowledge and
skills to use mathematics confidently across other learning areas at school and in their lives
more broadly. Numeracy encompasses the knowledge, skills, behaviours and dispositions
that students need to use mathematics in a wide range of situations. It involves students
recognising and understanding the role of mathematics in the world and having the
dispositions and capacities to use mathematical knowledge and skills purposefully.
When teachers identify numeracy demands across the curriculum, students have
opportunities to transfer their mathematical knowledge and skills to contexts outside the
mathematics classroom. These opportunities help students recognise the interconnected
nature of mathematical knowledge, other learning areas and the wider world, and encourage
them to use their mathematical skills broadly.
This icon shows where Numeracy has been identified in learning area content descriptions
and elaborations.
Key ideas
The key ideas for Numeracy are organised into six interrelated elements in the learning
continuum, as shown in Figure A.1
.

202
Figure A.1 Key Elements of Numeracy
At the Year 5 Level, the key element of estimating and calculating with whole numbers
requires students to solve complex problems by estimating and calculating using efficient
mental, written and digital strategies.
This is reflected in the Year 5 outcome ACMNA 100, which asks students to:
Solve problems involving multiplication of large numbers by one- or two-digit numbers
using efficient mental, written strategies and appropriate digital technologies
Elaborations
• exploring techniques for multiplication such as the area model, the Italian lattice method or the partitioning of numbers
• applying the distributive law and using arrays to model multiplication and explain calculation strategies
The Australian Curriculum: Mathematics aims to be relevant and applicable to the 21st
century. The inclusion of the proficiencies of understanding, fluency, problem-solving and
reasoning in the curriculum is to ensure that student learning and student independence are
at the centre of the curriculum. The curriculum focuses on developing increasingly
sophisticated and refined mathematical understanding, fluency, reasoning, and problem-
solving skills. These proficiencies enable students to respond to familiar and unfamiliar

203
situations by employing mathematical strategies to make informed decisions and solve
problems efficiently.
The proficiency strands describe the actions in which students can engage when learning
and using the content of the Australian Curriculum: Mathematics.
Understanding
Students build a robust knowledge of adaptable and transferable mathematical concepts.
They make connections between related concepts and progressively apply the familiar to
develop new ideas. They develop an understanding of the relationship between the ‘why’
and the ‘how’ of mathematics. Students build understanding when they connect related
ideas, when they represent concepts in different ways, when they identify commonalities
and differences between aspects of content, when they describe their thinking
mathematically and when they interpret mathematical information
Fluency
Students develop skills in choosing appropriate procedures; carrying out procedures
flexibly, accurately, efficiently and appropriately; and recalling factual knowledge and
concepts readily. Students are fluent when they calculate answers efficiently, when they
recognise robust ways of answering questions, when they choose appropriate methods and
approximations, when they recall definitions and regularly use facts, and when they can
manipulate expressions and equations to find solutions.
Problem Solving
Students develop the ability to make choices, interpret, formulate, model and investigate
problem situations, and communicate solutions effectively. Students formulate and solve
problems when they use mathematics to represent unfamiliar or meaningful situations, when
they design investigations and plan their approaches, when they apply their existing
strategies to seek solutions, and when they verify that their answers are reasonable.
Reasoning

204
Students develop an increasingly sophisticated capacity for logical thought and actions, such
as analysing, proving, evaluating, explaining, inferring, justifying and generalising. Students
are reasoning mathematically when they explain their thinking, when they deduce and
justify strategies used and conclusions reached, when they adapt the known to the unknown,
when they transfer learning from one context to another, when they prove that something is
true or false, and when they compare and contrast related ideas and explain their choices.
Fluency
In Years 3–6, students become fluent as they develop skills in choosing appropriate procedures; carrying out procedures flexibly and accurately; and recalling factual knowledge and concepts readily. Students are fluent when they calculate answers efficiently, when they recognise robust ways of answering questions, and when they recall definitions and regularly use facts.
The National Numeracy Learning Progression (ACARA, 2018)
Numeracy development influences student success in many areas of learning at school. The progression can be used to support students to successfully engage with the numeracy demands of the Foundation to Year 10 Australian Curriculum.
The National Numeracy Learning Progression outlines a sequence of observable indicators of increasingly sophisticated understanding of and skills in key numeracy concepts. By providing a comprehensive view of numeracy learning and how it develops over time, the progression gives teachers a conceptual tool that can assist them to develop targeted teaching and learning programs for students who are working above or below year-level expectations.
Of particular relevance to this study is the sub-element of multiplicative strategies which
describes how a student becomes increasingly able to use multiplicative strategies in
computation. The coordination of units multiplicatively involves using the values of one
unit applied to each of the units of the other, the multiplier. This process of coordinating
units is equally relevant to problems of division.
The indicators that are relevant to this study are contained in Mus6 and Mus7.
MuS6

205
Flexible strategies for multiplication
• draws on the structure of multiplication to use known multiples in calculating related
multiples (uses multiples of 4 to calculate multiples of 8)
• uses known single-digit multiplication facts (7 boxes of 6 donuts is 42 donuts
altogether because 7 x 6 = 42)
• applies known facts and strategies for multiplication to mentally calculate (3 sixes is
‘double 6’ plus 1 more row of 6, 5 x 19 is half of 10 x 19 or 5 x 19 is 5 x 20 take
away 5)
• uses commutative properties of numbers (5 x 6 is the same as 6 x 5)
MuS7
Flexible number properties
• uses multiplication and division as inverse operations
• uses factors of a number to carry out multiplication and division (to multiply a
number by 72, first multiply by 12 and then multiply the result by 6)
• uses knowledge of distributive property of multiplication over addition (7 x 83
equals 7 x 80 plus 7 x 3)
• uses decomposition into hundreds, tens and ones to calculate using partial products
with numbers of any size (327 x 14 is equal to 4 x 327 plus 10 x 327)
• uses estimation and rounding to check the reasonableness of products and quotients
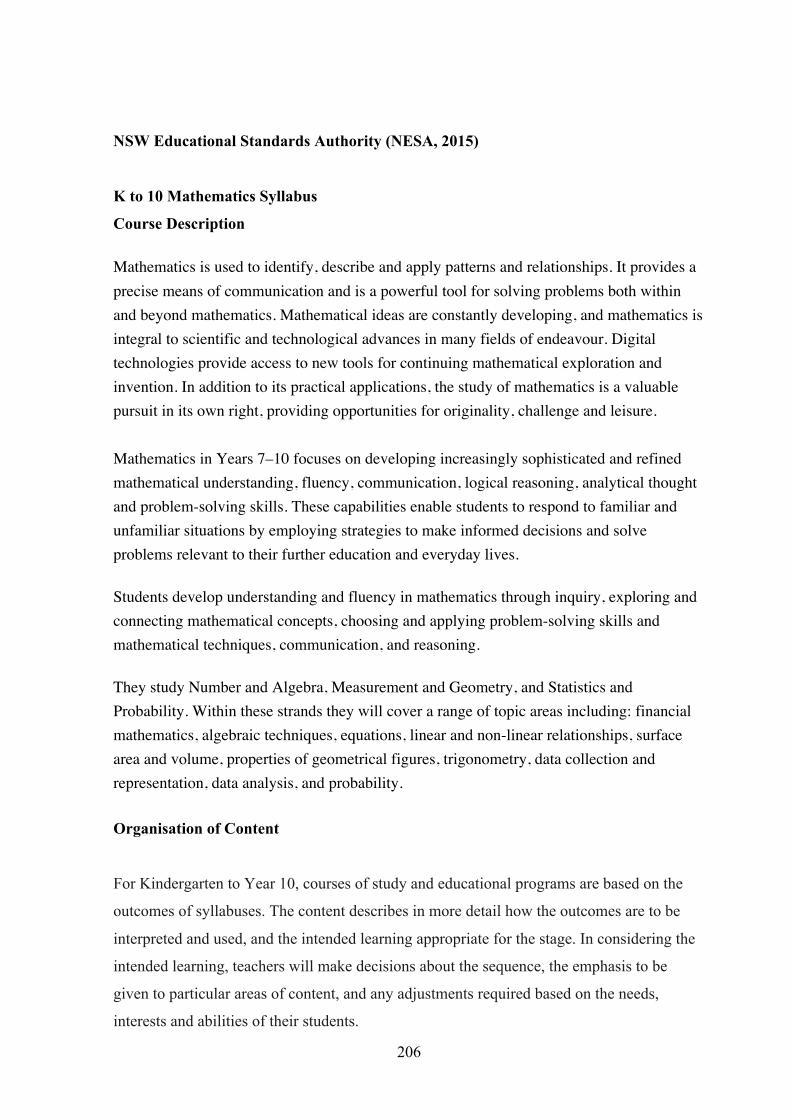
206
NSW Educational Standards Authority (NESA, 2015)
K to 10 Mathematics Syllabus
Course Description
Mathematics is used to identify, describe and apply patterns and relationships. It provides a precise means of communication and is a powerful tool for solving problems both within and beyond mathematics. Mathematical ideas are constantly developing, and mathematics is integral to scientific and technological advances in many fields of endeavour. Digital technologies provide access to new tools for continuing mathematical exploration and invention. In addition to its practical applications, the study of mathematics is a valuable pursuit in its own right, providing opportunities for originality, challenge and leisure. Mathematics in Years 7–10 focuses on developing increasingly sophisticated and refined mathematical understanding, fluency, communication, logical reasoning, analytical thought and problem-solving skills. These capabilities enable students to respond to familiar and unfamiliar situations by employing strategies to make informed decisions and solve problems relevant to their further education and everyday lives.
Students develop understanding and fluency in mathematics through inquiry, exploring and connecting mathematical concepts, choosing and applying problem-solving skills and mathematical techniques, communication, and reasoning.
They study Number and Algebra, Measurement and Geometry, and Statistics and Probability. Within these strands they will cover a range of topic areas including: financial mathematics, algebraic techniques, equations, linear and non-linear relationships, surface area and volume, properties of geometrical figures, trigonometry, data collection and representation, data analysis, and probability.
Organisation of Content
For Kindergarten to Year 10, courses of study and educational programs are based on the
outcomes of syllabuses. The content describes in more detail how the outcomes are to be
interpreted and used, and the intended learning appropriate for the stage. In considering the
intended learning, teachers will make decisions about the sequence, the emphasis to be
given to particular areas of content, and any adjustments required based on the needs,
interests and abilities of their students.

207
The knowledge, skills and understanding described in the outcomes and content provide a
sound basis for students to successfully move to the next stage of learning.
Figure A.2 shows the scope of the strands and substrands, and illustrates the central role of
Working Mathematically in Mathematics K–10 teaching and learning.
Figure A.2 Strands and Sub-strands of the K-10 NESA Mathematics Syllabus
The content presented in a stage represents the knowledge, skills and understanding that are
to be acquired by a typical student by the end of that stage. It is acknowledged that students
learn at different rates and in different ways, so that there will be students who have not
achieved the outcomes for the stage(s) prior to that identified with their stage of schooling.

208
For example, some students will achieve Stage 3 outcomes during Year 5, while the
majority will achieve them by the end of Year 6. Other students might not develop the same
knowledge, skills and understanding until Year 7 or later.
The Mathematics K–10 Syllabus contains the syllabus content for Early Stage 1 to Stage 5.
Within each stage, the syllabus is organised into the three content strands, Number and
Algebra, Measurement and Geometry, and Statistics and Probability, with the components
of Working Mathematically integrated into these strands. The syllabus is written with the
flexibility to enable students to work at different stages in different strands. For example,
students could be working on Stage 4 content in the Number and Algebra strand, while
working on Stage 3 content in the Measurement and Geometry strand.
Outcomes, content, background information, and advice about language are organised into
substrands within the three content strands. There are some substrands, mainly in Early
Stage 1 to Stage 3, that contain the development of several concepts. To assist programming,
the content in these substrands has been separated into two parts, ‘1’ and ‘2’, such as in
‘Area 1’ and ‘Area 2’. The first part typically focuses on early concept development.
Teachers and schools need to decide how to program the two parts of these substrands
within a stage.
In Early Stage 1 to Stage 3, the language section of each substrand includes a word list. Words appearing for the first time in each substrand are listed in bold type. In Stage 4 and Stage 5, the background information includes the purpose/relevance of the substrands.
Course Performance Descriptors
Areas for Assessment
Knowledge, skills and understanding
Students:
Working Mathematically – develop understanding and fluency in mathematics through inquiry, exploring and connecting mathematical concepts, choosing and applying problem-solving skills and mathematical techniques, communication and reasoning
Number and Algebra – develop efficient strategies for numerical calculation, recognise patterns, describe relationships and apply algebraic techniques and generalisation

209
Measurement and Geometry – identify, visualise and quantify measures and the attributes of shapes and objects, and explore measurement concepts and geometric relationships, applying formulas, strategies and geometric reasoning in the solution of problems
Statistics and Probability – collect, represent, analyse, interpret and evaluate data, assign and use probabilities, and make sound judgements.
Strand overview: Number and Algebra
The knowledge, skills and understanding developed in the Number and Algebra strand are fundamental to the other strands of this syllabus and are developed across the stages from Early Stage 1 to Stage 5.3.
Numbers, in their various forms, are used to quantify and describe the world. From Early Stage 1 there is an emphasis on the development of number sense, and confidence and competence in using concrete materials and mental, written and calculator techniques for solving appropriate problems. Algorithms are introduced after students have gained a firm understanding of basic concepts, including place value, and have developed mental strategies for computing with two- and three-digit numbers. Approximation is important and the systematic use of estimation is to be encouraged at all times. Students should always check that their answers ‘make sense’ in the contexts of the problems that they are solving.
In the early stages, students explore number and pre-algebra concepts by pattern making, and by discussing, generalising and recording their observations. This demonstrates the importance of early number learning in the development of algebraic thinking and the algebra concepts that follow.
The use of mental-computation strategies should be developed in all stages. Information and communication technology (ICT) can be used to investigate number patterns and relationships, and facilitate the solution of real problems involving measurements and quantities not easy to handle with mental or written techniques.
In Stage 2 to Stage 5, students apply their number skills to a variety of situations, including financial situations and practical problems, developing a range of life skills important for numeracy. Ratios and rates underpin proportional reasoning needed for problem solving and the development of concepts and skills in other aspects of mathematics, such as trigonometry, similarity and gradient.

210
Following the development of foundational number skills and pre-algebra concepts through patterning, a concrete approach to algebra is continued when students generalise their understanding of the number system to the algebraic symbol system. They develop an understanding of the notion of a variable, establish the equivalence of expressions, apply algebraic conventions, and graph relationships on the number plane.
Students recognise that graphing is a powerful tool that enables algebraic relationships to be visualised. The use of ICT for graphing provides an opportunity for students to compare and investigate these relationships dynamically. By the end of Stage 5.3, students have the opportunity to develop knowledge and understanding of the shapes of graphs of different relationships and the effects of performing transformations on these graphs.
Algebra has strong links with the other strands in the syllabus, particularly when situations are to be generalised symbolically.
Stage 3 Outcomes Related to This Study
A student:
MA3-1WM
describes and represents mathematical situations in a variety of ways using
mathematical terminology and some conventions
MA3-2WM
selects and applies appropriate problem-solving strategies, including the use of digital
technologies, in undertaking investigations
MA3-3WM
gives a valid reason for supporting one possible solution over another
MA3-6NA
selects and applies appropriate strategies for multiplication and division, and applies
the order of operations to calculations involving more than one operation
MA3-6NA – Content
Students:
▪ Solve problems involving multiplication of large numbers by one- or two-digit numbers
using efficient mental and written strategies and appropriate digital
technologies(ACMNA100)

211
▪ use mental and written strategies to multiply three- and four-digit numbers by one-digit
numbers, including:
▪ multiplying the thousands, then the hundreds, then the tens and then the ones, eg
673×4=(600×4)+(70×4)+(3×4)=2400+280+12=2692
▪ 673×
4
=(600×4)+(70×4)+(3×4)
=2400+280+12
=2692
▪ using an area model, eg 684 × 5
▪ using the formal algorithm, eg 432 × 5
▪ use mental and written strategies to multiply two- and three-digit numbers by two-digit
numbers, including:
▪ using an area model for two-digit by two-digit multiplication, eg 25 × 26

212
▪ factorising the numbers, eg 12 × 25 = 3 × 4 × 25 = 3 × 100 = 300
▪ using the extended form (long multiplication) of the formal algorithm,
▪ use digital technologies to multiply numbers of up to four digits
▪ check answers to mental calculations using digital technologies (Problem Solving)
▪ apply appropriate mental and written strategies, and digital technologies, to solve
multiplication word problems
▪ use the appropriate operation when solving problems in real-life situations (Problem
Solving)
▪ use inverse operations to justify solutions (Problem Solving, Reasoning)
▪ record the strategy used to solve multiplication word problems
▪ use selected words to describe each step of the solution process (Communicating, Problem
Solving)
Background Information
Students could extend their recall of number facts beyond the multiplication facts to 10 × 10 by memorising multiples of numbers such as 11, 12, 15, 20 and 25. They could also utilise mental strategies, eg 14 × 6 is 10 sixes plus 4 sixes'.
In Stage 3, mental strategies need to be continually reinforced.
Students may find recording (writing out) informal mental strategies to be more efficient
than using formal written algorithms, particularly in the case of multiplication.
An inverse operation is an operation that reverses the effect of the original operation.
Addition and subtraction are inverse operations; multiplication and division are inverse
operations.

213
The area model for two-digit by two-digit multiplication in Stage 3 is a precursor to the use of the area model for the expansion of binomial products in Stage 5.
Language
Students should be able to communicate using the following language: multiply, multiplied by, product, multiplication, multiplication facts, area, thousands, hundreds, tens, ones, double, multiple, factor, divide, divided by, quotient, division, halve, remainder, fraction, decimal, equals, strategy, digit, estimate, round to.
In mathematics, 'quotient' refers to the result of dividing one number by another.
Teachers should model and use a variety of expressions for multiplication and division. They should draw students' attention to the fact that the words used for division may require the operation to be performed with the numbers in the reverse order to that in which they are stated in the question. For example, 'divide 6 by 2' and '6 divided by 2' require the operation to be performed with the numbers in the same order as they are presented in the question (ie 6 ÷ 2). However, 'How many 2s in 6?' requires the operation to be performed with the numbers in the reverse order to that in which they are stated in the question (ie 6 ÷ 2).
The terms 'ratio' and 'rate' are not introduced until Stage 4, but students need to be able to interpret problems involving simple rates as requiring multiplication or division.
Working Mathematically
Working Mathematically relates to the syllabus objective:
Students develop understanding and fluency in mathematics through inquiry, exploring and connecting mathematical concepts, choosing and applying problem-solving skills and mathematical techniques, communication and reasoning
As an essential part of the learning process, Working Mathematically provides students with the opportunity to engage in genuine mathematical activity and develop the skills to become flexible and creative users of mathematics.
In this syllabus, Working Mathematically encompasses five interrelated components:
1. Communicating
Students develop the ability to use a variety of representations, in written, oral or graphical
form, to formulate and express mathematical ideas. They are communicating

214
mathematically when they describe, represent and explain mathematical situations,
concepts, methods and solutions to problems, using appropriate language, terminology,
tables, diagrams, graphs, symbols, notation and conventions.
2. Problem Solving
Students develop the ability to make choices, interpret, formulate, model and investigate
problem situations, and communicate solutions effectively. They formulate and solve
problems when they use mathematics to represent unfamiliar or meaningful situations,
design investigations and plan their approaches, apply strategies to seek solutions, and
verify that their answers are reasonable.
3. Reasoning
Students develop an increasingly sophisticated capacity for logical thought and actions, such
as analysing, proving, evaluating, explaining, inferring, justifying and generalising. They
are reasoning mathematically when they explain their thinking, deduce and justify strategies
used and conclusions reached, adapt the known to the unknown, transfer learning from one
context to another, prove that something is true or false, and compare and contrast related
ideas and explain their choices.
4. Understanding
Students build a strong foundation that enables them to adapt and transfer mathematical
concepts. They make connections between related concepts and progressively apply the
familiar to develop new ideas. Students develop an understanding of the relationship
between the ‘why’ and the ‘how’ of mathematics.
They build understanding when they connect related ideas, represent concepts in different
ways, identify commonalities and differences between aspects of content, describe their
thinking mathematically, and interpret mathematical information.
5. Fluency
Students develop skills in choosing appropriate procedures, carrying out procedures
flexibly, accurately, efficiently and appropriately, and recalling factual knowledge and

215
concepts readily. They are fluent when they calculate answers efficiently, recognise robust
ways of answering questions, choose appropriate methods and approximations, recall
definitions and regularly use facts, and manipulate expressions and equations to find
solutions.
The five components of Working Mathematically describe how content is explored or developed − that is, the thinking and doing of mathematics. They provide the language to build in the developmental aspects of the learning of mathematics. The components come into play when students are developing new skills and concepts, and also when they are applying their existing knowledge to solve routine and non-routine problems both within and beyond mathematics. At times the focus may be on a particular component of Working Mathematically or a group of the components, but often the components overlap. While not all of the Working Mathematically components apply to all content, they indicate the breadth of mathematical actions that teachers need to emphasise.
In addition to its explicit link to one syllabus objective, Working Mathematically has a separate set of outcomes for the components Communicating, Problem Solving and Reasoning. This approach has been adopted to ensure students’ level of proficiency in relation to these components becomes increasingly sophisticated over the years of schooling.
Separate syllabus outcomes have not been developed for the Working Mathematically components Understanding and Fluency. These components are encompassed in the development of knowledge, skills and understanding across the range of syllabus strands, objectives and outcomes.
Teachers are able to extend students’ level of proficiency in relation to the components of Working Mathematically by creating opportunities for their development through the learning experiences that they design.


![Masters Thesis[1]](https://static.fdocuments.in/doc/165x107/5434f4fb219acd5e1a8b5b85/masters-thesis1.jpg)