Master s Thesis A STUDY ON LIVESTOCK AND LAND … · Master’s Thesis A STUDY ON LIVESTOCK AND...
182
Master’s Thesis A STUDY ON LIVESTOCK AND LAND MANAGEMENT IN KYRGYZSTAN ZHUMANOVA MUNAVAR Graduate School for International Development and Cooperation Hiroshima University September 2011
Transcript of Master s Thesis A STUDY ON LIVESTOCK AND LAND … · Master’s Thesis A STUDY ON LIVESTOCK AND...

Master’s Thesis
A STUDY ON LIVESTOCK AND LAND MANAGEMENT IN
KYRGYZSTAN
ZHUMANOVA MUNAVAR
Graduate School for International Development and Cooperation
Hiroshima University
September 2011

i
Title of the
Master’s Thesis A Study on Livestock and Land Management in Kyrgyzstan
Student ID Number
Name of the Student Munavar ZHUMANOVA
Main Academic Advisor Professor Keshav Lall MAHARJAN
Abstract
Kyrgyzstan is a mountainous country with the livelihood condition of its population
determined by climate, landscape, soil, water resources, biodiversity, as well as social and
economic conditions. Most of its population derives a substantial proportion of its income
from livestock rearing and farming. Moreover, mountainous pastures, which consist 86% of
total agricultural land, favour livestock in Kyrgyzstan. The population of all livestock species
has been constantly increasing over the years with decline in productivity at national level.
Thus, increase in livestock production is realized by mainly increase in numbers of animals.
This study‘s specific objectives are to study the trends in population and composition of
livestock diversity by comparing two types of agro-pastoral systems (mainly livestock-
additional crop and mainly crop–additional livestock). It also analyses feed types and feeding
systems and derived productivity of livestock. It studies cropland and pastures management
by analysing economic cost-benefits from crops, and seeks to measure the condition and
botanical composition of pastures by assessing the extent of their utilisation. Moreover, it
examines the social and economic context of agro-pastoral systems in terms of income
sources. A household survey was conducted by administering semi-structured questionnaires
to households and pastoralists. And pasture measurement survey in two Village Governments
(VGs) of Ala-Buka district. It was done to understand the factors effecting agro-pastoral
systems and mountain pastures.
From the survey and analysis of agro-pastoral systems, it was found that considerable

ii
changes are taking place in livestock population, herd composition, and management systems
with different predominance of livestock species. Changes in livestock population are closely
associated with land holding, forage and pasture availability. The households‘ perceptions
about the changes in their herd sizes show that the total livestock population is increasing in
both VGs. In Torogeldy Baltagulov Village Government is 65% and in 1-May Village
Government is 62% respectively. The main reason for the changes in herd composition are
income level from livestock and market demand for livestock and its products in general. The
most noticeable change is the considerable decline in cattle and goats numbers in BVG, and in
sheep numbers in MVG households. The higher number of cows correlates with the major
reason of keeping cattle for dairy products; mainly self-consumption and selling extra
products in the market, and also using dung as winter fuel. Horse and donkey numbers
increased due to the necessity of draft power in the households (HHs).
The increase in the number of horses and donkeys can be an indication of advanced rural
poverty as the poor prefer to use livestock in order to avoid extra expenditure for tractor
services, such as fuel and rent payments to tractor owners. It can also attributed to insufficient
numbers of agricultural machines during land preparation, intercultural operations, harvesting
and transporting. On the other hand, the increase in the use of livestock for agricultural
purposes decreases the use of agricultural machines; thereby leading to low carbon agriculture.
This will be crucial in mitigating the adverse impacts of climate change on human beings and
environment through reduced GHG emissions. Forage scarcity is considered the main factor
regulating the herd size. Forage scarcity occurs at the end of winter. The main reason of
forage scarcity is caused by lack of enough time for hay making during summer. Time
shortage for hay-making corresponds with the changing weather condition as climate change
causes the depletion of forage species in nearby pasture. Forage availability and scarcity

iii
affect milk yield and the shape of lactation curve. On the other hand, lack of breeding
technology (artificial insemination) and unplanned calving without considering forage
availability decreased the productivity of cows. Thus, lactation curves were very sensitive in
winter and autumn calving season in MVG and winter and summer calving season in BVG.
Besides, the majority number of cows falls under those calving seasons, which are suffering
from ‗low productivity‘. As a result, this affects the total milk yield as cows are becoming less
productive; thereby decline in productivity. However, the total milk produced in the district as
well as at national level is still increasing due to the increase in the number of cattle.
The cropping patterns in the study area vary for self-consumption, forage and cash
income. Majority of HHs in BVG used the main land area for wheat (self-consumption)
growing, whereas in MVG, maize (forage) was grown in large areas. However, wheat
cropland area decreased due to lack of properly working combine harvesters and high costs.
Thus, the majority of HHs uses their land for forage and cash crops. It was found that HHs
can sell their livestock and buy wheat after harvesting in summer at low price from local
markets or imported wheat flour. The costs and benefits from crops are reflected by crop
productivity and demand. The greatest benefits were recorded for vegetables produced in
kitchen gardens, due to high demand with good price at local and urban markets. Majority of
HHs informed that crop yield from 2005 to 2010 decreased and only few HHs had increase in
crop yield in both VGs. The low yields for all crops were also attributed to the changes in
weather condition, new crop diseases and unfavourable condition for seedlings.
A decline in pasture productivity was also observed in remote pastures, although there
was less intensive grazing caused mainly an increase in invasion of semi-arid and steppe grass
species, such Artemisia and Stipa spp. in Chapchyma pastures, bushes such as Rosaceae and
Ephedra spp.in Chanach-Say pastures. It can be concluded that forage grass species are

iv
suffering from triple risks; overgrazing (near-village pastures), dominating non-edible plants,
and climate change (remote pastures). It was found that in the last decade, Artemisia species
moved up by 200 m in Chapchyma pastures due to changes in temperature and precipitation
patterns. On the other hand it can be attributed to the drying Aral Sea which affects soil
quality in mountain pastures. Such conditions also favour the growth of Artemisia species,
which lead to aridization of mountain pastures in South-Western Tien-Shan.

v
Acknowledgements
First and foremost, I offer my sincerest gratitude to my academic supervisor, Professor
Maharjan Keshav Lall, who has supported me throughout my study with patience and
knowledge. He allowed me the room to work in my own way. His encouragement, guidance
and support from the initial to the final level enabled me to develop an understanding of the
subject. Without him this thesis, would not have been completed.
I thank my sub-advisor, Associate Professor Yuzo Kurokawa, Graduate School of
Biosphere Science, Department of Bioresource Science, Hiroshima University, whose
patience and kindness, as well as academic experience, has been invaluable, and for giving me
the opportunity to visit Hiroshima University farm and to gain practical knowledge related to
my research. I am also grateful to my sub-advisor, Associate Professor Kensuke Kawamura.
He has very generously prouded broad sub-advisor expertise and deep knowledge of
Grassland Ecology and Environmental Science. I also thank him for many insightful
suggestions during the development of the ideas of this thesis. Moreover, I would like to
express my appreciation to my sub-advisor, Associate Professor Masahiko Togawa, for his
valuable suggestions and comments. I also acknowledge suggestions received from Professor
Dharma Raj Dangol, Institute of Agriculture and Animal Science, Tribhuvan University,
visiting Professor of Hiroshima University, during seminars and discussions.
Very special thanks also goes to Japan International Cooperation Center and Japanese Grant
Aid for Human Resource Development Scholarship (JDS) program for giving me the
opportunity to study at Hiroshima University and for support in any respect during the time
completion of conducting my research, and for the assistance for my studies. The Graduate
School for International Development and Cooperation (IDEC) of Hiroshima University
offered tremendous advice and support through its staff. I am highly indebted to these

vi
institutions.
I also take this opportunity to acknowledge Luni Piya, Niraj P. Joshi, Arija Vaydiya and
others seminar colleagues for the comments and suggestions and for the great role they played
in the easy adaptation to the new environment. My special thanks go to Boga T. Manatsha for
editing my thesis. I offer my regards and blessings to all those who supported me in any
respect during my study in Japan. It is not possible to name all of them. In particular, my
warm thanks are forwarded to those researchers who are cited in my thesis for providing
useful materials and information, and giving me guidelines useful for academic writing.
My special thanks to my colleagues in Ala-Buka District Department of Agrarian
Development, Kyrgyzstan, and to Director of the Department, Satylgan A. Akishev for their
help in providing valuable time and information. Great respect is also paid to local farmers
and other key informants in Ala-Buka district.
Lastly, my immense gratitudes go to the never-ending support, patience and
encouragement of my family. I have enjoyed the unfailing support and substantial good
humour of all my brothers and sisters. Thanks for all your love and attentions.
With all kinds of support, I have learnt so much through this research. However, all the
errors and remaining deficiencies in this study solely remain my own responsibility.
Munavar Zhumanova
September 2011
Graduate School for International Development and Cooperation (IDEC)
Hiroshima University

vii
Table of Contents
Abstract .................................................................................................................................................... i
Acknowledgements ................................................................................................................................. v
List of Tables ....................................................................................................................................... x
List of Figures .................................................................................................................................... xi
List of Pictures .................................................................................................................................. xii
Abbreviations / Acronyms................................................................................................................ xiii
Chapter I Introduction ............................................................................................................................. 1
1.1 Background of the Study ............................................................................................................... 1
1.2 Statement of the Problem .............................................................................................................. 5
1.3 Significance of the Study .............................................................................................................. 7
1.4 Research Questions ....................................................................................................................... 9
1.5 Objectives of the Study ............................................................................................................... 10
1.6 Conceptual Framework ............................................................................................................... 10
1.7 Limitations of the Study .............................................................................................................. 12
Chapter II Literature Review ................................................................................................................. 14
2.1 Introduction ................................................................................................................................. 14
2.1.1 The Importance of Livestock in Countries‘ Economy ......................................................... 14
2.1.2 Livestock Research and Development Issues ....................................................................... 17
2.1.3 Trends and Management Strategies in Mixed Livestock-crop Production Systems ............ 19
2.1.4 Technological and Institutional Issues ................................................................................. 20
2.2 Livestock Diversity ..................................................................................................................... 21
2.3 Forage Resources and Natural Resource Management Issues .................................................... 24
2.3.1 Feeds and Feeding Systems .................................................................................................. 25
2.3.2 Use of Energy from Liveweight Loss. ................................................................................. 28
2.3.3 Forage Quality, Feeding Value and Animal Performance ................................................... 30
2.4 Grazing Management .................................................................................................................. 36
2.5 Importance of Livestock in the Present and Future and How Climate Change Can Affect It .... 39
2.5.1 Forage and Water ................................................................................................................. 41
2.5.2 Changes in Livestock Species Composition ......................................................................... 43
2.5.3 Livestock and Human Health ............................................................................................... 43
2.6 Constraints to Livestock Production Systems ............................................................................. 44
2.7 Socio-Economic Issues of Livestock Management ..................................................................... 47

viii
2.8 Conclusion ................................................................................................................................... 48
Chapter III Research Methodology ....................................................................................................... 50
3.1 Introduction ................................................................................................................................. 50
3.2 Description of the Research Sites ................................................................................................ 50
3.3 Sampling for Household Survey ................................................................................................. 56
3.4 Sources of data ............................................................................................................................ 57
3.5 Methods of Data Collection ........................................................................................................ 58
3.5.1 Pasture Survey ...................................................................................................................... 59
3.5.2 Traditional Ecological Knowledge ....................................................................................... 60
3.6 Methods of Data Analysis ........................................................................................................... 60
Chapter IV Livestock in Production Systems........................................................................................ 62
4.1Introduction .................................................................................................................................. 62
4.2 Background: Agrarian Sector of Kyrgyzstan: Pre- and Post-independence Periods ................... 63
4.3 Livestock Diversity: Trends in Population and Composition ..................................................... 67
4.3.1 Changes in Livestock Composition ...................................................................................... 78
4.4 Social and Economic Issues Associated with Livestock Production .......................................... 81
4.5 Factors Affecting Livestock Production Systems ....................................................................... 87
4.6 Livestock Feeds, Feeding Methods and Derived Productivity .................................................... 93
4.7 Forage Shortage Impact to Milk Production and Lactation Curve .............................................. 99
4.8 Wood‘s Model: Factors Affecting the Lactation Curve of Cows .............................................. 103
4.8.1 Empirical Strategy .............................................................................................................. 104
4.8.2 Parity .................................................................................................................................. 106
4.8.3 Calving Season ................................................................................................................... 107
4.8.4 Calving Period .................................................................................................................... 107
4.8.4 Lactation Length ................................................................................................................. 108
4.8.5 Results and Discussions ..................................................................................................... 108
4.9 Conclusion ................................................................................................................................. 110
Chapter V Land Management: Cropland and Pastures.........................................................................114
5.1 Introduction ............................................................................................................................... 114
5.2 Background: Land Holding and Cropping Pattern in Kyrgyzstan ............................................ 115
5.3 Changes in Cropping Pattern ..................................................................................................... 117
5.4 Pasture Types and Condition ..................................................................................................... 125
5.4.1 Climate ............................................................................................................................... 125

ix
5.4.2 Biodiversity ........................................................................................................................ 127
5.4.3 Impact of Climate Change .................................................................................................. 129
5.4.4 Pasture Types and Condition .............................................................................................. 130
5.5 Pasture Management ................................................................................................................. 132
5.6 Factors of Pasture Degradation ................................................................................................. 134
5.7 Conclusion ................................................................................................................................. 141
Chapter VI Conclusion and Recommendations................................................................................... 144
6.1 Conclusions ............................................................................................................................... 144
6.2 Recommendations ..................................................................................................................... 148
Annexes ........................................................................................................................................... 152
References ....................................................................................................................................... 159

x
List of Tables
Table 4.1 Characteristics of a typical household in both VGs* ............................................... 74
Table4.2 Livestock holding; total cattle number by physiological state and lactation stage ... 76
Table 4.3. Livestock holding, total sheep, goats and horse number by physiological state . 76
Table 4.4 Households‘ perception in herd-size change during 2005-2010 .............................. 77
Table 4.5 Farmers‘ perception of the most important livestock species (% of HHs in which
each species important – multiple answer possible) ................................................ 84
Table 4.6 Feed types and availability, feeding methods and ratio and classes of animals feed
reduced ..................................................................................................................... 96
Table 4.7 Variation in cows‘ number by lactation length ...................................................... 100
Table 4.8 Variation in number of cows by calving season .................................................... 100
Table 4.9 Variation in milk yield by lactation stage .............................................................. 100
Table 4.10 Descriptive Statistics of Lactation Data & Determining Factors of Milk Yield
Curve ...................................................................................................................... 105
Table 4.11 Main model least squares mean lactation curve constants for cows with different
parity ...................................................................................................................... 106
Table 4.12 Main model least squares mean lactation curve constants for cows with different
calving season ........................................................................................................ 107
Table 4.13 Main model least squares mean lactation curve constants for cows with different
calving period ........................................................................................................ 107
Table 4.14 Main model least squares mean lactation curve constants for cows with different
lactation length ....................................................................................................... 108
Table 4.15 Changes in initial and the peak milk yield with time and lactation persistency by
parity ...................................................................................................................... 109
Table 4.16 Changes in initial and the peak milk yield with time and lactation persistency by
calving season ........................................................................................................ 109
Table 4.17 Changes in initial and the peak milk yield with time and lactation persistency by
lactation length ....................................................................................................... 110
Table 5.1 Number and percentage of households by owned land size (hectare) ................... 120
Table 5.2 Operated land area with mean number and different crop varieties ...................... 121
Table 5.3 Ecosystems of Kyrgyzstan ..................................................................................... 128
Table 5.4 Percentage of income sources for pastoralists ....................................................... 133

xi
List of Figures
Figure 1.1 Frameworks for the study on livestock and land management in Kyrgyzstan ...... 12
Figure 3.1 Map of Kyrgyzstan showing the study area – Ala-Buka district ........................... 52
Figure 3.2 Map of Ala-Buka district showing sample VGs and pastures ............................... 52
Figure 3.3 Land degradation: overgrazing and pressure on mountain slopes ......................... 55
Figure 4.1 The percentage of product mix by farm type from 1998-2007 .............................. 66
Figure 4.2 Livestock inventories by farm type from 1960-2010 in Kyrgyzstan ..................... 66
Figure 4.3 Changes in total livestock number (thousand head) in Kyrgyzstan ........................ 69
Figure 4.4 Trends in total cattle and improved breeds number in Kyrgyzstan ........................ 70
Figure 4.5 Total cows‘ number and milk yield during 1940-2008 in Kyrgyzstan ................... 71
Figure 4.6 Total livestock number by species in Ala-Buka district from 1997-2009 .............. 72
Figure 4.7 Changes in cows number, average milk yield and total milk production in
Ala-Buka district from 1997-2009 ........................................................................................... 73
Figure 4.9 Percentage of households in different herd size categories with mixed species .... 83
Figure 4.10 The share of income by different sources ............................................................ 86
Figure 4.11 HHs‘ identification of major problems of keeping animals from their own
experiences ............................................................................................................................... 87
Figure 4.12 The rank of annual feed scarcity problem ............................................................ 88
Figure 4.13 Main problems related to forage storage .............................................................. 90
Figure 4.14 Percentage of changes in cultivated area of major crop varieties in 1991, 1997
and 2006 in Kyrgyzstan ............................................................................................................ 94
Figure 4.16 Forage effect on seasonal lactation curve .......................................................... 102
Figure 4.17 Overall actual and predicted lactation curves of cows ....................................... 106
Figure 5.1 Arable lands in individual farms and development of peasant farms in Kyrgyzstan
................................................................................................................................................ 116
Figure 5.2 Yield (quintals/ha) of some selected crops in Kyrgyzstan between 1990 and 2009
................................................................................................................................................ 116
Figure 5.3 Trends in sown area of major crops in Kyrgyzstan between 1990 and 2009 ....... 118
Figure 5.4 The total costs and profit margins for major crops in the study area ................... 123
Figure 5.5 Percentage of farmers‘ perception for low crop yield related problems .............. 124
Figure 5.6 Average long-term data for Zhalal-Abad city, South-Western Kyrgyzstan ......... 126
Figure 5.7 Ecosystem map of Kyrgyzstan ............................................................................. 128
Figure 5.8 Pastures (rangelands ) condition with composition profiles ................................ 131
Figure 5.9 Forage quality changes according to climate and plant‘s stage of growth. .......... 132
Figure 5.10 Variation in percentage of sent and retained animals during summer among
Groups‘ categories .................................................................................................................. 134
Figure 5.11 Chapchyma pasture condition, MVG ................................................................. 136
Figure 5.12 Chanach-Say pasture condition, BVG ............................................................... 137

xii
List of Pictures
Picture 1 Gissar breed ram and lambs in BVG taken by author in August 2010 .................... 79
Picture 2 Althea nudiflora Lindl. taken by author in August 2010, BVG ............................... 91
Picture 3 Poacea dominated hay land and occurred rain during mowing and collecting time91

xiii
Abbreviations / Acronyms
ADB Asian Development Bank
AI Artificial Insemination
APPS Agro-pastoral Production Systems
BVG Torogeldi Baltagulov Village Government
CACILM Central Asian Countries Initiative for Land Management
DA District Administration
DADD District Department of Agrarian Development
DCP Dietary Crude Protein
DE Digestible Energy
DM Dry Matter
FAO United Nations Food and Agriculture Organization
GAO Gross Agricultural Output
GEF Global Environmental Facility
Gosregistr
State Agency for the Registration of Rights to Immovable
Property under the Government of the Kyrgyz Republic
Giprozem Kyrgyz State Project Institute on Land Management
Kyrgyzgiprozem
GTZ German Society for Technical Cooperation (Gesellschaft fÜr
Technische Zusammenarbeit)
IFAD International Fund for Agricultural Development

xiv
LLM Livestock and Land Management
ME Metabolise Energy
MoA (MAWMPI) Ministry of Agriculture (Ministry of Agriculture, Water
Management and Processing Industry
MIG Management Intensive Grazing
MVG 1-May Village Government
NEAP National Environmental Action Plan
NSC National Statistical Committee
PRA Participatory Rural Appraisal
RAS Rural Advisory Service
UNDP United Nations Development Programme
UNEP United Nations Environment Programme
UNCCD United Nations Convention to Combat Desertification
UNFCCC United Nations Framework Convention on Climate Change
VG Village Government
WFP World Food Programme
WB World Bank
WUA Water Users Association

1
Chapter I Introduction
1.1 Background of the Study
Throughout history, livestock have been kept for a variety of purposes, with the almost
exclusive focus on food use of livestock in modern agricultural systems being a relatively
recent development. But, in many developing countries, livestock are still a critical support to
the livelihoods of people who live in or near poverty, and it is here that the non-food uses of
livestock, such as source of fertiliser (manure), draught power and insurance assets for natural
and other emergencies, remain predominant. Livestock, or symbols of them, also play an
important role in religious and cultural lives (Steinfeld, 2010). An increase in livestock
production comes from increases in animal numbers (in developing countries, small mixed
farming systems) and in yields per animal (in industrialized countries). Livestock production
is practiced in many different forms. Like agriculture, as a whole, two rather disparate
systems exist side by side. In another case, livestock are kept in traditional production systems
in support of livelihoods and household food security; other case commercially intensive
livestock production and associated food chains support the global food supply system. The
latter provides jobs and income to producers and others in the processing, distribution, and
marketing chains and in associated support systems. Sere & Steinfeld (1996) distinguish at the
highest level the two groups of farming systems: those solely based on animal production,
where less than 10% of the total value comes from non-livestock farming activities, and those
where livestock rearing is associated with cropping in mixed farming systems, with more than
10 % of total value of production coming from non-livestock farming activities. Livestock
productions are determined by the physical (climate, soils, and infrastructure) and the
biological environment (plant biomass production and livestock species composition), by

2
economic and social conditions (prices, population pressure and markets, human skills, and
access to technology and other services), and by policies (on land tenure, trade and subsidies).
These conditions, together, generate the so-called production systems, that is, production units
(herds, farms) with similar structure and environments –that can be expected to produce
similar production functions (Cees da Haan, 2010).
In Central Asian countries in the past, transhumant stock rearing were the main land use.
Nomadic, transhumant and agro-pastoral systems were common. Traditional forms of mobile
pastoralism were widely practised in the Soviet Republics of Central Asia until the 1930s. In
Kyrgyzstan territory, transhumant grazing of sheep, goats, cattle and horses and, in some areas,
yaks and Bactrian camels was practiced (Miller, 2001). Traditionally, horses were the main
livestock species, being best suited to long transhumance and foraging in deep snow (Suttie
&Reynolds, 2003c). Rangeland use was regulated by tribal councils. However, during the
1930s, mass collectivization took place and the economic system became based on public
(state) and collective ownership of productive resources, including the majority of the
livestock population. During the collectivization process, nomadic pastoralists were forcibly
transferred to permanent settlements, which brought traditional nomadism to an end.
Semi-nomadic types of production emerged, under which animals grazed during winter and
spring in a fixed location where houses, shelters and water points are provided, while during
summer and autumn, animals grazed pastures at more distant locations. The new systems
involved the introduction of improved breeds, and specialized commercial production
oriented towards exporting livestock and livestock products to Russia (Miller, 2001).
In Central Asia, pasture management has moved from state-managed mobile systems
towards de facto common property regimes and, more recently, to leasing or privatization.
Mobility has contracted due to drops in animal numbers and the collapse of state subsidies for

3
migration and water supply. The sector today is characterized by a large number of small
herds used for subsistence, and a much lower number of large commercially viable herds.
Broadly, the major barrier to movement amongst small herders is the cost of migration itself,
combined with the lack of infrastructure in remote areas (Kerven et al 2004).
However, as livestock numbers recover, the influence of property rights on movement will
become increasingly important. In Kyrgyzstan, following the collapse of state farms, pasture
continued to be used by those communities that historically exploited them, and common
herding systems enabled partial use of remote pastures (Farrington, 2005). Climate conditions
and topography of Kyrgyzstan assessed the main role of sheep breeding ‗industry‘ in the
agriculture sector. The share of sheep products in 70‘s was 35 % in total agricultural
production, while in mountainous districts was 56.3-86.3 %. Kyrgyzstan was in the third place
after Russia and Kazakhstan in wool production and the share of meat production among the
Former Soviet Union countries was 12-14 % and inside the country it reached up to 60 %
(Balyan, 1978). Livestock still moved between seasonal grazing lands, but many of the
summer pastures became intensively grazed. Winter grazing lands were often located
hundreds of kilometres away and animals were transported by trucks and trains between
seasonal grazing lands (Miller, 2001). Since the transition of the Former Soviet Union
countries from a centrally-planned to a free-market economy, the agricultural sector has
undergone substantial changes as a result of privatization, land reforms, price liberalization,
and decentralization of decision-making. The system of collective livestock production has
ceased, and pastoral livestock production has adjusted to the market economy (Suttie &
Reynolds, 2003c). Intensive and industrialized livestock production systems were replaced by
grazing and mixed–crop livestock or agro-pastoral systems. Livestock were shared among
former state-owned farms workers, and thus private herding developed.

4
Agriculture in Kyrgyzstan has been one of the leading sectors of the economy. In the total
GDP of the country, the share of agriculture is significant about 24%. In addition,
approximately 65.0% of the population lives in rural areas, the total number of all employed
34,0% or 14% of the total population engaged in agriculture (in developed countries this
figure is 1-3%). These data show that agriculture in Kyrgyzstan is not only economic, but also
was a great social and political significance (Abdurasulov, 2009). Animal husbandry, the
historical tradition of Kyrgyz people as nomadic and pastoralists continues to be crucial. The
role and importance of livestock in Kyrgyzstan is due to the presence in the country of large
amounts of natural mountain pastures and hay lands which occupy 45% of the entire country
(about 200.0 thousand sq. km.) or 87% of all agricultural land (9.6 million hectares).
Underdevelopment of other sectors of the economy, especially industry, construction, services
and the lack of other employment opportunities, especially in high mountain regions of the
country where extensive livestock farming is the only source of income in remote areas, made
livestock the mainstay of rural livelihoods. The trends in number of livestock in recent years
have tended to increase though a small amount each year. When compared with past planned
economy, the number of cattle had reached the Soviet period, the horses exceeded by 100.0
thousand heads, while pigs and sheep exceeded with about 50% (Ajibekov, 2005).Extensive
livestock systems (pastoral, agro-pastoral and mixed farming) restored under market-based
economy with preserved nomadic traditional knowledge by providing food, employment and
income in remote areas. These systems, based on the use of resources available at low or very
low cost, are driven by access to feed resources with minimum or noninvestment.
Supplemented feed used mainly during winter till mid spring accumulated during summer and
partial in autumn.
Mixed farming systems are conducted on a small scale by households and combine
5
various sources of livestock feed: natural pastures, hays from haylands (meadows), crops
residues, forage crops, and rare bought feed at markets. These systems became more
sustainable and dominate in rural areas. There are many benefits from integrating crop and
livestock production; livestock are sources of draught power, fertilizer, and insurance asset.
Non-product purpose of livestock continues to give more pressure on pastures; most areas of
land are used for cash crops and decrease forage cropland areas.
The grassland-based grazing systems in Kyrgyzstan depend on rainfall, not suitable for
cropping. The pastoral systems are predominantly grazing, which depend on the natural
productivity of pastures. Mobility is one of its characteristics. In the nomadic systems, people
and livestock move according to the growth season of pastures; divided to spring/autumn,
summer and winter pastures. These three types of pastures are called intensive, remote and
near-village pastures according to geographical location. The agro-pastoral systems, as
modernized mix of pastoral and mixed farming systems in general, includes subsistence
arable cropping, fruit production, livestock production, and increase income from cash
cropping1.
1.2 Statement of the Problem
Livestock play an important role in Kyrgyzstan economy. Over the past years,
considerable changes have taken place in populations of livestock and the composition of
livestock holdings, as well as in the management strategies, as a result of population growth
1 During Soviet times, kolkhozy are cooperatives comprising a number of families which pooled land and
equipment together and whose members were paid according to the work undertaken. Members did not receive
an annual salary, but a division of the collective income after costs. This variable monthly portion was often in
kind. In sovkhozy (state farms), planned and budgeted by the Ministry of Agriculture, every sovkhoznik
(worker) received a wage, the same amount with a bonus at the end of the year if the income of the operation
was sufficient. Sovkhozy, according to Humphrey (1983) in the case of Soviet Buryatiya, having been
considered a 'higher' social economic form than the collective farm (kolkhoz), received large subsidies and other
advantages over collective farms.

6
and land use intensification. There are different social, economic, environmental and political
constraints to livestock production systems, which are reflected by livestock productivity,
natural and social risks of agro-pastoral systems and natural resources degradation. The
absence or weak legal and regulatory framework for agriculture is one of the weaknesses of
agrarian policy in Kyrgyzstan. Current policies are based on the former planned economy
policy reforms which are not appropriate to market-based economy. These legislations mainly
focused on state-owned farms, collective farms and cooperatives, such as development of
livestock industry in plain, high populated areas rather than remote, marginalized and
small-scale extensive production systems. The adopted laws and other legislations about
livestock breeding, pasture utilization and others practically do not work, due to the lack of
mechanisms to implement them. After the Land Reform in 90‘s, people with different
backgrounds became farmers. Most of them were not familiar with the basic fundamentals of
agricultural production (For instance, former teachers, doctors, engineers and others).
Similarly, even people who were experienced in farming and livestock raising are faced with
new conditions of production; the changed scale of production industrial relations, economic
arrangements, and many more. The lack of institutional development of the sector, in terms of
marginalized extensive livestock production systems, is also one of the weaknesses in
agrarian policy. The absence of training or underdeveloped training and lack of information
services to farmers in remote areas create many difficulties in production-marketing process.
During the 20 years of independence, conserved indigenous knowledge about animal
husbandry and traditional pasture management are facing serious problems on animal health
control, choosing market-oriented and appropriate livestock species, feed shortage during
winter time and unpredictable natural hazard in grazing land during other seasons. Limited
income and high expenditure of making feed cause difficulties, and the nutrition value of

7
winter feed is also low. Inadequacy of livestock nutrition and insufficient veterinary services
increased diseases and parasites affecting livestock productivity. Increased livestock products
is due to increase numbers of livestock. At the same time, forage shortage gave pressure to
pastures. Large parts of pastures (near-village pastures) have already been overgrazed. A
Significant decline in pasture productivity and unbalanced pasture composition with different
types of degradation is acute. Conservation and rehabilitation of pastures have been largely
ignored. There is a serious imbalance in pasture utilization; remote pastures, which are
difficult to access by majority farmers, are underutilised. In other words, degradation of
pastures affect biotic and abiotic factors such as increase in temperature and decrease in
precipitation, high evaporation rate and wind erosion. Constraints to livestock production
systems are interdependent. One‘s stability or accessibility afford another development while
degradation or changes increase others vulnerability. They cannot be solved in isolation or
independently or just by providing some projects or policy intervention to one factor. The
factors are interdependent, ignoring one of them causes another problems.
1.3 Significance of the Study
Livestock production systems have played the main role in the economy of high altitude
areas because the features of pastoral systems here suit the specific characteristics of these
mountainous areas. During the Soviet time, ecologically or biophysically driven livestock
production systems lost importance as a result of the changing, socio-economically and
politically determined circumstances in Kyrgyzstan. Specialized livestock industry-collective
systems had influenced rich nomadic traditional knowledge preservation. Other major
changes were the shift from local breeds to centre-demand breeds with imported livestock
feed from other Soviet countries. The collapse of the Soviet Union gave some opportunities to

8
farmers and created new constraints also. New herd size and free access to pasture resources
in some level facilitated the recovery of nomadic pastoral systems with mixture of modern
market oriented production systems, the so called agro-pastoral systems. There is considerable
increase taking place in livestock population at the district, region and national level. This
study tried to identify the process which led to the adoption of livestock species, and herd
composition at household level, explore linkages between livestock management, cropland
and pastures, and outline the key constraints and strategies for the management of
agro-pastoral systems in Kyrgyzstan.
Two main factors contribute towards better results in livestock farming; the quality of the
stock and its management. Dependence on livestock keeping and herd size accordingly are
based on geographic location of farms and the availability of irrigated cropland areas. Where
crop production is practicable, livestock are a crucial element of farming systems. Where
extremes of climate and topography make crop production especially difficult, livestock can
often live and thrive on available resources and provide livelihood necessities. A Study on
interrelationship between crop and livestock, and derived income from them will be helpful to
understand the socio-economic context of agro-pastoral systems under a market-based
economy.
Easy access to seasonal pastures with rich nutritive and valuable forage plants, enhance
livestock population, while market enhances selected composition of them. Productivity of
pastures is varied according to geographical zones and climate conditions. Also, it is dynamic,
pastoralists‘ knowledge in grazing management to conserve pasture biodiversity. One of the
most important assets of most pastoralists is their rich knowledge of complex ecosystem
dynamics, which make them often the best detectors of environmental change. Within this
context, it is clear that any minor or major changes to climatic patterns will have significant

9
consequences for many pastoralists, as it increases resource variability, while also reshaping
its overall availability (Nori, 2007). The traditional indigenous knowledge of nomadic
peoples—regarding seasonal pastures, grazing times, and the composition and quantity of
grasses are valuable store of Traditional Ecological Knowledge (TEK). The findings of
observations and measurements on pasture quality, in terms of composition, balance of
species and climate factors, will be helpful to researchers and academicians for further
research.
There are few studies about agro-pastoral production systems in South-Western
Kyrgyzstan. Further research is required to find out if the problems are common to small
holders across the region and in the other regions of Kyrgyzstan. Certain areas of animal
husbandry on the small holdings could be further improved through more in depth research
which would be crucial in finding out the feasibility of certain education and co-operative
programs for the contribution of livestock to rural livelihoods.
This research tried to find out the common and specific gaps and priorities among
production systems across the region and in the other regions of Kyrgyzstan. It can also be a
guideline to policy makers and researchers to improve certain areas of animal husbandry
smallholdings.
1.4 Research Questions
This research tried to answer the questions below. In general, what are the key factors that
affect agro-pastoral systems?
Specific questions:
− What have been the changes in livestock population and composition at household level,
in which livestock are the main or additional part of the system?

10
− What is the relationship between animal nutritional inputs with livestock products output?
− What are the linkages between livestock and crops, with pastures (common property
resources) and farm land (private land), and sustainable pasture management with
livestock management in market-based agro-pastoral systems?
− Are livestock contributing to an improvement in pastures or to their degradation?
1.5 Objectives of the Study
The general objective of the study is to study the key social, economic and environmental
factors affecting agro-pastoral systems in Kyrgyzstan. The specific objectives to meet the
general objective are:
To study the population and composition of livestock diversity by contrasting two types
of agro-pastoral systems (mainly livestock - additional crop, mainly crop –additional
livestock)
To analyse feed types and feeding systems and derived productivity of livestock
To examine land management and cropping patterns with the cost and benefit analysis
To survey grazing ecology, seeking to measure condition and botanical composition of
pastures by assessing the extent of utilisation
To examine the social and economic context of agro-pastoral systems in terms of income
sources
1.6 Conceptual Framework
To address the objectives and research issues identified in the preceding sections a
conceptual framework was developed as illustrated in Figure 1.1. It serves as a guide to the
study. The conceptual framework for this research on sustainable livestock and land
management in agro-pastoral systems draws from transition economy in agrarian sector that

11
explains the changing management systems as a result of changing relative factors. The key
outcomes of systems include livestock and crop productivity derived from supplied forage
and pastures, household income sources and changes in natural resource conditions; pastures-
cropland degradation or improvement. These outcomes also affect households‘ benefits and
opportunities in the future income strategies and livestock- land management; increases in
agricultural production and income can facilitate greater investment in different types of
capital, whether physical (increase improved herd size or area of rented cropland), financial
(cash income), human capital ( majority income from livestock used for education payment),
and natural capital (soil quality improvement, reseeding in pastures) and non-returned capital
(self-investment by building house, shelters, and forage storage space ). These changes in
agro-pastoral ‗range‘ may promote enough potential and appropriate factors for development.
Various constraints in different levels can cause opposite changes in the systems; low
productivity, low income, poverty and cropland and pasture degradation, loss of biodiversity
and high vulnerability to outside factors as marginalised system. They are related to each
other. There is another factor not included to system, but it can be one of the key factors
affecting whole system that is the climate change. The study tried to examine the on-going
climate related changes inside and outside agro-pastoral systems.
Changes in livestock population and composition depend on access to market,
infrastructure and the amount of other income sources. Income strategies influence land
management and labour intensity. Mixed crop–livestock producers are more likely to apply
manure to their crops and use of animals as draught power. The impact of livestock on land
degradation may be mixed, and depends on the type of degradation as well as on interactions
between crops and livestock.

12
Figure 1.1 Frameworks for the study on livestock and land management in Kyrgyzstan
On the other hand, households with greater off-farm opportunities may be less prone to
crop production or labour-intensive land management practices because their opportunity
costs of labour may be higher (Pender, 2006). Decrease in food and forage crops areas cause
winter forage scarcity which gives pressure to pastures.
1.7 Limitations of the Study
This study has its own limitations because it was conducted within a given time frame. It
covers only one district, with two VGs and two intensive remote pasture areas. The researcher
was not able to make chemical analysis of sample (certificated at The State Quarantine
Inspection and Protection of Plants of KR) for analysing nutritive quality of forage species
due to high risk of Foot and Mouth Disease in Kyrgyzstan. And pastoralists‘ location on the

13
remote pastures in far distance from each other, and limited time for field visit made the
researcher unable to collect more information on pastoralists‘ livelihood. The sampling units
for the study were chosen randomly, thus, there are possibilities of sampling error in the study.
Generalization of the findings outside the study area should be done carefully, taking into
considerations the similarities in production systems, socio-economic parameters, ecosystems,
pasture biodiversity and topography.

14
Chapter II Literature Review
2.1 Introduction
A comprehensive literature review was done to encompass most of the literatures
available about extensive pastoral and agro-pastoral production systems in the world. The
literature review has five main purposes: to review literatures related to livestock and land
management; to review studies done in Kyrgyzstan‘s livestock, natural resource management
and agriculture sector, to review researches and literatures done in developing countries;
similar terrain and grassland with Kyrgyzstan; to review previous researches and literatures
done in developed countries (to observe how they had developed their livestock sector as
industrialized, and sustainable management of grassland systems) and to review extension
research reports and projects done by international organizations and NGOs in different
livestock production systems.
The content of each reviewed literature tried to provide a context of the research, what
was done and how it will match with the current study and what are the differences between
the previous and the current studies.
The reviewed literatures is arranged into six broad categories: the importance of livestock
in countries‘ economy, livestock research development issues, forage resources and natural
resource management, constraints to LPSs, socio-economic issues in LLM and conclusion.
2.1.1 The Importance of Livestock in Countries’ Economy
―Livestock development is projected in coming decades to become the world‘s most
important agricultural subsector in terms of value added and land use. Global meat demand is
projected to increase from 209 million tons in 1997 to 327 million tons in 2020, while global
milk consumption is projected to increase from 422 million tons to 648 million tons over the
15
same period. This increase in demand is expected to exert undue pressure on natural resources
worldwide, possibly crowd out the poor, endanger global food security, thwart animal welfare
and ensure further degradation of the land and erosion of biodiversity‖ (World Bank, 2000).
The Livestock sector plays a vital role in the economies of many developing countries. It
provides food or more specifically animal protein in human diets, income, employment and
possibly foreign exchange. For low income producers, livestock also serve as a store of
wealth; provide draught power and organic fertiliser for crop production and a means of
transport. Consumption of livestock and livestock products in developing countries, though
starting from a low base, is growing rapidly (Sere & Steinfeld, 1996). The way livestock are
kept and milk and meat are produced will be key factors in the future health of the planet.
Animal agriculture is one of the most important components of global agriculture, and
livestock are one of the main users of the natural resource base: livestock use 3.4 billion
hectares of grazing land and livestock production from about one-quarter of the world's
croplands. In total, livestock make use of more than two-thirds of the world's surface under
agriculture, and one-third of the total global land area; livestock raising is the sole source of
livelihood for at least 20 million pastoral families, and an important, often the main, source of
income for at least 200 million smallholder farmer families in Asia, Africa and Latin America.
Livestock provide the power to cultivate at least 320 million hectares of land, or one-quarter
of the total global cropped area (FAO, 1994). This would, otherwise, have to be cultivated by
hand tools resulting in harsh drudgery, especially for women, or by tractor power with an
inevitable drain on foreign exchange. Livestock provide the plant nutrients for large areas of
cropland. For example, estimates carried out in Jensen & de Wit‘s study (1996) shows that,
for the tropical irrigated areas, manure provides nutrients of an estimated value of US$ 800
million per year. Finally, livestock are an important asset for investment and insurance for

16
hundreds of millions of rural poor in situations where banks are often too remote and the
banking systems too unreliable for safeguarding any savings a smallholder might accumulate.
Livestock play an important role in mountain economies. Overall livestock contribute
36-47 % of the total agriculture income in the mountains and hills of Nepal. In Tibet, they
account for more than 50 % of the total gross production value of agriculture (Tashi &Partap,
2000). Livestock play an equally important role in the agricultural economy of the African
highlands. In Ethiopia, animals and their products account for 30 % of agricultural GDP and
12 % of the total GDP excluding the value of draught and manure (Sileshi & Tegegne, 2000)
The income–generating functions of livestock vary from livestock being the main cash
crop, as in smallholder dairy systems, to the occasional chicken or goat sold to cover sporadic
or emergency expenses. The range and the amount of products sold depend on the different
systems, but they can vary from meat to manure, eggs to fibre, milk to work. Livestock are
critical in maintaining soil fertility. They allow land-use intensification though the
concentration of nutrients and the acceleration of nutrient cycling. In the majority of mountain
areas, chemical fertilisers are still unavailable or beyond farmers means. In such cases manure
serves as the fertiliser, but significant amounts of nutrients are often lost as the result of poor
collection and storage methods for manure and exposure of livestock excreta (Tulachan, 2000;
Dijkman, 2000).
Hodgson and White (1999) define the importance of pastoral agriculture to the New
Zealand economy, and an overview of livestock systems and their distribution, followed by a
more detailed appraisal of individual systems. Dairy product sales more, even though dairy
cattle account for only 28 % of the total stock units farmed. They described the main pastoral
systems as they exist in New Zealand to cover the major historical milestones in their
development.

17
2.1.2 Livestock Research and Development Issues
Agricultural research previously focused on improving animal and crop productivity
independently. In the 70s and 80s, it was recognised that crop and livestock interact and must
be considered jointly to optimise overall farm performance (Kaufmann & Mohamed Saleem,
2000). Mountain areas are characterised by some specific features that distinguish them from
the plains. They include limited accessibility, a high degree of biophysical and social fragility,
marginality, and diversity and specific niche opportunities-including human adaptation
mechanisms. These mountain specificities and their implications for livestock production
systems need to be taken into consideration when addressing livestock issues in mountain
areas, in particular the potential for development (Jodha, 2000; Tulachan, 2000). The main
challenges to livestock research and development, however, result not from these specificities,
but from shortcomings in government policies related to institutional and environmental
undertakings to market economic technological changes. Successful development of the
livestock sector, particularly market oriented livestock production systems, require that
everyone involved is aware of mountain specificities, gender issues and marginality of farms
and livestock farming (ibid.).
The complexity and heterogeneity of different agro-ecological zones need to be
recognised and taken into consideration when formulating policies. This is the prime obstacle
to the transfer of technologies from one region to another. It is also important to recognise that
diversified and inter- linked resource- based activities are a key attribute of sustainable
production systems in mountain areas that research has an important role to play in ensuring
the continued success of such systems (Jodha, 2000). If all these constraints are taken into
account during the initial design of research programme, there is considerable potential for

18
increasing the sustainability of crop-livestock productivity and household income
(Leon-Velarde & Quiroz, 2000).
Notwithstanding improved accessibility and market links, the dependence of livestock on
local resources will continue to be an important factor. Hence conservation and efficient use
of these resources, including such things as recycling and reprocessing need to be an integral
part of the management of livestock production systems. It can play an important role in
ensuring the efficient use of scarce resources, the quality of animals, and the most effective
composition of animal holdings (Staal & Jabbar, 2000). Zarate (2000) argues that research and
development programs should be directed towards encouraging and empowering local people
to retain their unique genetic livestock resources in these ecologically fragile, but globally
important mountainous environments.
Sileshi and Tegegne (2000) describe three broad themes important for future research in
the African highlands; sustainability of the crop-livestock production system, which include
improvement of feed resources, animal traction, nutrient cycling and management, health
management at the farm level and options for diversification of animal power; improvement
of market–oriented smallholder production, which include development of a feeding package,
appropriate breeding schemes and recording systems, efficient processing and handling
methods, health management and delivery services, health standards for export of meat and
animals, policy adjustment and marketing, and conservation and utilisation of animal and
forage genetic resources, which includes characterization and evaluation of genetic resources
and selection of animals for resistance to diseases. Singh (2007) explains that the best
approach to improving milk production in smallholder dairies is thought to be through
reducing the actual numbers of animals whilst improving the quality of the remaining animals
and of the feed supply. The major challenge is to increase production whilst avoiding
19
environmental and natural resource degradation. Mixed crop-livestock production systems are
means of generating employment.
2.1.3 Trends and Management Strategies in Mixed Livestock-crop Production Systems
Over the past years, considerable changes have taken place in populations of livestock
and the composition of livestock holding, as well as in management strategies, as a result of
population growth and land-use intensification. In mixed farming systems in mountains, there
has been a decline in the populations of goat and sheep and an increase in the populations of
cattle and horses, indicating a growing importance of cattle and horses in the livestock
economy.
In the mountains, accessibility and development of road networks have played a crucial
role in the development of smallholder dairies as an integral part of mountain farming systems.
There has been a considerable shift in the management strategies of smallholder dairy
farmers; from extensive grazing to intensive stall feeding, from use of public land to use of
private land for growing fodder and forage crops, and from feeding crop-residues to increase
the use of purchased feeds. There is a growing trend in Himachal Pradesh towards keeping
cross-bred cows for milk production-reflecting a shift from low-producing indigenous animals
to dairy animals with higher milk yields (Tulachan, 2000). Analysis of the livestock
production trends in high –pressure areas across Kenya and Ethiopia indicate that there is an
increasing trend towards smallholder crop-livestock production. Smallholder dairies have
flourished better in Kenya partly as a result of the differences in the types of animals raised in
the two countries. In Kenya, dairy development has been based on the use of cross-bred
animals, whereas in Ethiopia the numbers of these animals are negligible (Dijkman, 2000).
According to Tashi and Partap (2000), an interesting trend is emerging in livestock production

20
systems in Tibet, especially in the lower altitude areas, with a transition from animal
husbandry based on rangelands to a mixed crop-livestock system, from the extensive
traditional system to an intensified system. Commercialised livestock production is increasing
as a result of both state and private investment.
2.1.4 Technological and Institutional Issues
Before introducing new technologies, it is important to predict the impact on the
economy and the environment. Despite an array of scientific innovations, science and
technology have had little impact on livestock development or improvement in developing
countries. Sound policy backing is crucial for the dissemination of technology. Having
policies to promote credit is a key element for adaptation of improvement technologies. Credit
must be made available to farmers so that they can make use of new technologies. In Africa,
some technologies, like the introduction of cross breeds, have brought households additional
income. In Kenya, a recent study shows that farmers with crossbred cows had an additional
income of 50 dollars per cow per month without the need for additional labour. There was no
significant increase in household milk consumption, however. When evaluating the net benefit
of new technologies like this, improved nutrition of the household should be considered
(Hugo Li Pun & Victor Mares, 2000)
Zapata (1997) explains two productive technologies aimed at increasing farm production;
a conventional and new approach. The conventional technical approach tries to increase milk
yields using imported concentrates, improved breeds such as Holstein, and vast amounts of
chemical fertilisers. This approach has drawbacks, such as the need for large amounts of
capital, dependency on imported inputs, and deterioration of the environment. The new
approach is an integrated and environmentally-friendly technology. It uses crossbred cattle

21
and pigs to produce energy and earthworms for composting solid wastes, which combined
with the effluent from the bio digesters, to provide organic fertiliser. Some of the numerous
advantages of this technology are a feed supply for cattle and pigs, food for humans, pest-free
and healthy pastures, natural regeneration of fragile areas, maintenance of soil fertility, a
supply of biogas for cooking and the availability of high quality fertiliser. The heterogeneity
of mountain regions in terms of factors like altitude, climate, soils, quality and quantity of
feed resources, and ethnic background poses a great challenge to the transfer of technologies
like this from one region to another.
2.2 Livestock Diversity
Livestock diversity depends on the condition of the area; climate, landscape and forage
species. There is insignificant number of specialized beef breed cows in Kyrgyzstan, and the
beef industry is based on calves produced by dairy cows. Beef cattle productivity at the farm
level is usually measured by some measure of growth, such as average daily weight gain or
carcass weight at slaughter. But in Kyrgyzstan, there are 4,435 thousand hectare summer
pastures possible to breed beef cattle. A Study on crossbreeding local Ala-Too breed with
Aberdeen-angus confirmed this hypothesis; abilities and genetically potential of cross-bred
(Nogoev, 2008). Minezawa (2002) focuses on cattle genetic resources in Japan; and explains
that the beef cattle can be classified into two categories, indigenous and non-indigenous cattle.
The former includes 1,700,000 Japanese beef cattle, named Wagyu, and the latter involves
461,000 non-indigenous dairy cattle and 663,000 corresponding crossbred animal. Wagyu
includes four breeds, Japanese Black (93.9%), Japanese Brown (4.2%), Japanese Poll (trace),
and Japanese Shorthorn cattle (1.0%). However, exotic cattle breeds contribute most milk
production and more than 99% of the dairy cattle are Holsteins. Production from the two

22
genuine Japanese native cattle is in trace proportions.
Prioritizing livestock breeds for conservation needs to incorporate both genetic and
non-genetic aspects important for the survival of the breeds. Gizaw (2008) applied a
maximum-utility-strategy to prioritize 14 traditional Ethiopian sheep breeds based on their
threat status, contributions to farmer livelihoods (current breed merits) and contributions to
genetic diversity. Contributions of the breeds to genetic diversity were quantified using
marker-estimated kinship approaches. Non-genetic aspects included threats (e.g. low
population size, low preferences by farmers) and current merits (economic, ecological and
cultural merits). Threat analysis identified eight of the 14 breeds as threatened. The analysis of
current merits shows that sub-alpine and arid-lowland breeds contribute most to farmer
livelihoods in comparison to other breeds. Their results balanced the trade-offs between
conserving breeds as insurance against future uncertainties and current sustainable utilization.
The ranking of breeds provided a basis for conservation strategies for Ethiopian sheep and
contributes to a regional or global conservation plan.
A study conducted in the Andean Valley, Bolivia, in which breeding groups held under
different ecological, socio-economic conditions were compared, show the clear superiority of
pure-bred, local animals in harsh environments, crossbreeds in improved environments, and
pure-bred exotics under conditions of intensive feeding and husbandry. Crossbred and
pure-bred animals are not available to most farmers in mountainous areas, however. The
results show that local genetic resources play an important role in producing optimised
breeding stock (Zarate, 2000).
Dairy farming is important and has tremendous potential in developing the economy of a
country. In developing countries, dairy farming is predominantly a smallholder mixed
crop-livestock farming operation. Many Third World countries have taken steps to develop
23
dairy sector under the cooperative system so that rural poor farmers can have access to
necessary services for dairy development. Ghosh (2003) focuses on analysing the role of
cooperatives in dairy development and its impacts on rural income generation in Bangladesh.
His study examines the milk-marketing channel in Bangladesh as a whole, evaluates the
economic efficiency of dairy farming under the cooperative and non-cooperative systems, and
measures the extent of the income earned by dairy farmers under cooperatives and
non-cooperatives in different regions. According to Singh (2007), dairy development could
help to generate large amount of income for small and medium farmers who are the most
target group in any development program. Dairy contributes significantly in the improvement
of rural livelihoods by providing food, income, energy for household purpose, and improved
health and sanitation. In mountain areas, smallholder dairy farming has been gaining
importance. There is emerging trend towards the introduction of new dairy livestock species
for better milk yields. Singh (1999) examines the operation of dairy cooperatives in Himachal
Pradesh, and outlines the factors determining their successes and failures. These cooperatives
were introduced as a management strategy for milk producers and were intended to act as
reliable market outlets for milk producers and as regular suppliers of milk at reasonable prices
to consumers. The failures resulted from inefficient management and the problem of vested
interests, with people using the cooperatives as a way of gaining power and prestige.
Kenya is one of the few success stories for smallholder dairy development on the African
continent. The success mainly resulted from the introduction of exotic and crossbred cattle by
Europeans. A profit analysis of the adoption of dairy cattle in the Kenyan highlands indicated
those household and local area characteristics, availability of veterinarians, the agro-climate,
and formal markets are the important factors affecting the successful adoption of crossbred
cattle. The distance by road to an urban centre also has a significant impact (Staal & Jabbar,

24
2000). Zapata (1999) examines the systems of dairy production practiced in two areas of the
Andean region of Colombia; located in the central range of the mountains. Specialised dairy
is the common system in Colombia. The most popular breed of cattle is Holstein. Feeding is
based on pasture; lactating cows are supplemented with concentrate. This popular system
called ―pigs-pasture-milk‖, pigs are penned in a high part of the farm, their manure is used as
fertiliser to increase grass production, and the grass is fed to the cattle.
Most dairy producers utilizing Management Intensive Grazing (MIG) were former
confinement or non-intensive pasture operations while the others started their operation with
MIG. Which farms are candidates for success following a switch? What changes in labour,
cost of production, and herd health might be expected? These and other questions were
investigated by examining 29 MIG dairy farms in Michigan (Taylor, 2009). These farms
experienced similar milk production levels per cow, reduced feed and hired labour cost
significantly, reduced the acres of row crops grown, and experienced improved herd health
resulting in much lower herd health costs. Those farms did not build farm acres, but rather
grew cattle numbers and improved management of pasture forage. Research work remains to
be done that will more accurately measure the true economic progress and further find
management techniques that prove successful for MIG farms (Taylor, 2009).
2.3 Forage Resources and Natural Resource Management Issues
In the winter months, livestock are fed on stored feed accumulated during the growing
season. These feeds include a large component of crop residues as well as green fodders, such
as Lucerne that are grown specifically for livestock. A component of winter nutrition also
comes from winter pastures and other arid range plants found in winter pasturing areas close
to the villages. During the summer, nutritional inputs to livestock are largely derived from

25
summer pastures including temperate alpine pastures made up of grasses, forbs and shrubs.
Seasonal measurements of feed use and livestock performance highlight the seasonal
dynamics of transhumance system and emphasize the findings of previous studies, which
have pointed to a substantial shortage of winter fodder as being important constraint within
system. Two fodders are extensively cultivated in Kyrgyzstan, Lucerne (Medicago sativa) and
Sainfoin (Onobrychis viciifolia). Hay is a very important winter feed. In the absence of
concentrates, it is all that is available to many livestock owners. Hay comes from two sources;
natural meadows, which are traditionally seen as a community resource, and sown and
irrigated forage, which is the property of the individual farm or farmer. Cereal straw is saved
for fodder.
2.3.1 Feeds and Feeding Systems
With most feeds eaten by ruminants, the Growth Energy (GE) values reflects that of
carbohydrates such as cellulose (17.6 MJ/kg); it increases with increasing concentrations of
protein (about 24 MJ/kg) and fat (about 39 MJ/kg), but decreases as its ash content rises
which may be due to either a change in the natural mineral content of the feed or to
contamination with soil or other extraneous inorganic material. Mitchell (1974) reports that
the range of MJ/kg DM for white clover, ryegrass and cocksfoot cut from Tasmanian pastures
at various times throughout the year, and values for temperate pastures herbages in New
Zealand gave other results; which content of value depends on where the grass grown.
M/D of forages (for fresh temperate grasses and legumes, except lucerne), compound feeding
stuffs – in meal or pelleted form, may contain a wide variety of ingredients, including feeds of
vegetable, animal or marine origin with high protein and silage can be expected, that will
differ from different places and countries in several respects. For example, plant maturation

26
often proceeds more rapidly in Australia making it more difficult to time harvest so that the
forage is in a young, highly digestible condition. The DM of European and North American
maize silages often contain more than 50 % of cob and there may be up to 50 % grain, but
there may be less in the Australian product because of differences in growing conditions and
plant cultivars (CSIRO, 1990).
Grains. There is variation in the energy value of Australian oats. It is likely to be low when
owing to moisture stress in the plant during growth; the grain has a high proportion of hull
which is of very low digestibility. Briggs et al. (1956) give 2.3-2.6 kg /per week of wheat, or
maize, or barley, or sorghum to sheep in a drought feeding experiment, and give 3 kg of oats
to similar sheep on the assumption, which grain had a lower energy value. After 20 weeks of
feeding, the liveweight of the sheep had plateaued and those given oats were 1-3 kg heavier
than those given the other grains. This result gives support, that in practical drought feeding of
cattle and sheep the ME of all cereal grains is same. When animals are given oats in
circumstances other than drought feeding, account should be taken of the variability in its
M/D. There appears to be negligible loss of whole grain in the faeces of sheep, but when
cattle are fed whole grain, they may excrete substantial amounts. Some may be reingested by
coprophagy, which probably accounted for the small difference in performance observed by
Southcott and McClymont (1960) among drought-fed cattle given whole wheat and those
given crushed wheat, but any excretion, in effect, reduces M/D. The loss appears to be less
when cattle are given roughage, which appears to affect a reduction in the time the grain is
retained in the rumen. It appears from these results that when rations for cattle containing
whole grain are being established, it may be advisable initially to discount their ME value,
except with maize, to allow for faecal loss. Cotton seed, milk and milk substitutes, fodder
trees and shrubs (browse) feeds are considered particular regionally; they are not common

27
used feeds.
The digestibility in vivo of forage is lower when it is ground then when in long or
chopped form, but the practical consequences are probably small in animals fed for
maintenance. Any reduction in M/D is at least counterbalanced by an increase in the net
efficiency of use of the ME for growth and fattening and probably for lactation (Greenhalgh
& Wainman, 1972). The digestibility of a feed decreases with increasing level of intake, the
greatest effect being found with concentrate feeds and ground forages. Mould et al. (1983b)
find that when hay was ground and fed with rolled barley, contributing two-thirds of diet DM,
the hay DM digestibility could be reduced. The reduction in hay digestibility was less when it
was given in chopped form, and when the barley was whole rather than rolled the reductions
were about 0.12 for ground hay and about 0.05 for chopped hay. Poppi et al. (1981) found that
conversely cattle digest poorer quality feeds more than do sheep; because cattle retained
fibrous material in the rumen for longer period. Goats also appear to digest fibrous to a
greater extent than sheep.
Age. Graham (1980) find that feed digestibility appears to increase with age in sheep, but this
effect has not been identified with cattle and he concludes that because of energy losses in
methane and urine tend to be less earlier ages, so that ME/DE is higher than in adults, ME
values of feeds determined in adult sheep can be used to calculate rations for growing
ruminants, at least for the same feeding level.
Reproduction. Lamberth (1969) concludes that compared with non-breeding cattle and sheep
given the same feed, M/D may be lower in late pregnancy and in early lactation, because of an
increased rate of outflow from reduced residence time of digest in the rumen. But no
method allowing for such a reduction in M/D can be recommended, but the possibility of its
occurrence should be borne in mind when establishing rations for and assessing the

28
performance of breeding stock.
Cold and heat. Digestibility varies with prevailing ambient temperature. From an examination
of numerous studies made with cattle and sheep in temperatures ranging from -11o to 38
oC,
this effect appeared to be of more importance for forage than for concentrate diets, and it
might be advisable to allow for it in computer models particularly for a period following
shearing when the thermal insulation of sheep is reduced (NRC, 1981a).
2.3.2 Use of Energy from Liveweight Loss.
Animals will intermittently experience periods of feed shortage, especially in a pastoral
system production, when they have to use energy from catabolism of body fat protein for
maintenance or survival. The energy from liveweight loss will not be used with 100%
efficiency, but there is little information on its use maintenance (Marston, 1948).
Calorimetric studies have established the following energy costs of various physical activities
by ruminant animals:
Activity Energy cost per kg W (kJ/day)
Standing 10
Changing body position (double movement of lying down and standing
again)
0.26
Walking (horizontal component) 2.6
Walking (vertical component) 28
Eating (prehension and chewing) 2.5
Ruminating 2.0
For animals given feed in stalls, pens, or yards, it can generally be assumed that EGARZE=0
Adam et al. (1984) found that cattle expended less energy for eating 1 kg DM in the form of
pelleted feeds 0, 23 kJ/kg, 1.03kJ/kg for eating 1 kg hay or dried grass DM either long or
chopped, and 1.43 kJ/kg in eating 1 kg DM (7, 4 kg fresh weight) in chopped turnips. Housed
animals would not usually be required to walk so far to feed or milking that there was
important effect on their energy requirements. The value of EGRAZE for animals at pasture

29
will vary with grazing conditions including the availability (tones DM/ha) and digestibility of
the feed which will affect the rate and amount of intake, and which will effect distances
walked as will the distribution of watering points, weather, topography and interactions
between these factors. Farrel (1972) found that the unit cost of walking did not differ among
sheep of similar skeletal size that were emaciated (27 kg) or in better condition (32 or 47 kg)
and for cattle it did not vary with ambient temperature.
When the animal is heat stressed, productivity falls primarily because feed intake is
reduced, but its elevated deep-body temperature increases metabolic rate and consequently its
maintenance requirement. The lower limit of the zone of the zone of thermo neutrality is
termed the lower critical temperature; for an animal varies with its thermal insulation or
resistance to heat flow to the environment. Mount & Brown (1982) found that sheep in full
wool will be more resistant to cold than a shorn sheep. Sheep experience a sudden major
change in their thermal environment when they are shorn. Heat loss by animal is increased
during and for some time after rainfall because replacement of air in the pelage by water
increases thermal conductivity, because heat energy is used to evaporate the water; and
because of induced physical activities by the animal (e.g. shaking). The problem of partial
wetting is accommodated, though there remains some difficulty in identifying from daily
precipitation the diurnal pattern of wetting and the effects on energy expenditure over 24
hours periods. Hutchinson (1968) found that there may be high mortality during the following
one to two weeks after shearing, especially if there is cold wind and rain. Problems of
thermoregulation off-shears can be compounded by a reduction in the time spent grazing
which probably signifies a lowered feed intake as has been observed in penned sheep
immediately after shearing, though after few days intake generally increases and becomes
higher than it was before shearing. The first cause of compensatory or ‗catch up‘ growth by

30
animals given abundant feed after a period of under nutrition is probably an above-average
feed intake though this may not occur immediately with re-alimentation. Increased feed intake
will cause substantial increases in gut-fill and liveweight, but there is also evidence of
increase in the gross efficiency of conversion of feed to body gain with the result that the
proportion of total feed intake available for production will be greater than with animals
continuously well fed. Such increases in efficiency are likely to be transitory and it is
concluded that the energy content of compensatory gains should be calculated in the same
manner as for gains during uninterrupted growth (Tornton et.al, 1979).
Searle et al. (1972) concludes that the composition and energy value of liveweight loss in
a sheep of any given type and liveweight is similar to that of its liveweight gain which may
also be taken to be valid for cattle. In lactating cows, energy from body tissues is often
utilized for milk synthesis, especially during the weeks immediately after calving, but at this
time, it is particularly difficult to determine what fraction of an observed liveweight change is
actually due to change in gut fill. Several studies have shown that when lactating cows are in
positive energy balance the efficiency of conversion of ME to body tissue gain is considerably
greater than in non-lactating animals. Moe et al. (1970) report efficiencies in lactating and dry
cows, given the same feeds. During the first lactation, skeletal size and weight are likely to be
less than those it will eventually attain. In addition, in predicting the animal‘s performance,
the lactation curve, defining potential milk yield, would be set lower for first lactation than for
subsequent lactation (Wood, 1969) allowing that a greater proportion of the feed intake would
be available for growth.
2.3.3 Forage Quality, Feeding Value and Animal Performance
It is important for the intensive livestock industries to be able to specify and provide for

31
animals‘ protein requirements as precisely as possible because protein feeds are generally the
most expensive components of their rations. A protein feeding system is also needed for
grazing animals to identify effective and economic procedures of supplementary feeding, i.e.
lactating cows. Moreover, the low protein content of tropical and subtropical pastures during
dry season, Mediterranean-type pastures during summer and native pastures on the Tablelands
during the winter, reduces the growth rates of young animals, extends the time to puberty and
first pregnancy, and adversely affects reproductive performance and lactation in mature
animals (Hennesy, 1983). It appears probable that seasonal change in microbial crude protein
(MCP) from forage diets (fresh and dried forages, silage) is associated with the changes in
chemical composition that the result in lower net energy values for animal of later compared
with spring growth of temperate pastures. Beever et al. (1978) find that MCP yield higher in
spring growth ryegrass than autumn growth one. His studies with cattle fed early, midseason
and late growth of ryegrass and white clover again, as with the spring and autumn ryegrasses,
did not show a clear effect of season on MCP yield. MCP yields may be higher in lactating
cows with high feed intakes than in beef cattle and sheep with lower intake. Although realistic
allowances have been made for variation in intake between animals varying in type and
physiological state, and between pastures which vary immensely in plant species, herbage
availability, composition and digestibility, the predicted intakes are inevitability imprecise.
The requirements for minerals, as for other nutrients and energy, are estimated factorially
and by the complementary method of feeding experiments; they must then be tested in
practical feeding trials. Grazing animals generally do not require supplementary vitamin A,
even during drought, because hepatic stores make good a dietary inadequacy (Southcott,
1960). One possible exception is rams, perhaps bulls, required for breeding after some month
dry pasture. Supplementation may be desirable for lambs and calves weaned early during

32
drought on to grain and dried forage diets, and recommended allowances in feedlot diets for
cattle and sheep are tabulated (NRC, 1980).
Lynch et.al (1972) find that merino ewes in the temperate climate of the Northern
Tablelands deprived of drinking water for 12 months or more could survive and breed and
have similar productivity to ewes with water; non-breeding cattle may sometimes not drink
for long periods. Indeed, extensive areas of pastoral lands have been made usable only by
establishing watering points, often supplied by bores into underground sources. Many of these
sources contain various salts which are compounded if there is a high salt intake in the feed.
Sheep and cattle in small paddocks may drink several times in 24 h but as area served by one
watering point increases the time required walking to water from grazing and return becomes
longer and drinking frequency will decrease (Squires, 1971). He observed, that lambs will
usually walk some distance with their mothers, but when breeding ewes and wethers were
provided with salty feed only at a distance of about 4.5 km from water the frequency,
decreased to three to two day or once daily, and their feed intakes and productivity decreased.
Sheep grazing in semi-arid grassland have been observed to range more 5 km from water,
drinking only every third day after even longer intervals in winter, but drinking daily when
temperatures exceeded 410C. Schmidt (1969) observes the behaviour of Shorthorn cattle in
Australia during the dry season where little shade is available. He classifies his cattle as
‗walkers‘ and ‗non-walkers‘. Both types drank once daily but the non-walkers‘ grazed poorer
quality pastures close to the watering points while walkers travelled up to 16 km/d in order to
graze better quality pastures further away. There were a greater proportion of ‗walker‘ cows
without calves than ‗non-walkers‘.
Forages, either grazed of fed, after conservation, supply at least 75 % of the ME and DCP
requirements of ruminant livestock. Many reasons can be advanced, related to forage species,

33
environmental conditions and stage of growth when the forage is ‗harvested‘ and the
processes of conservation. To optimize utilization of nutrients, it is necessary to recognize the
rumen as the principal site of digestion, where extensive fermentation of structural
carbohydrates provides energy directly to the microbial population and indirectly, as volatile
fatty acids, to the animal. Digestibility of organic matter and crude protein, as indices of
forage nutritive value are of little relevance to feeding of ruminants and a more
comprehensive assessment of the carbohydrate and protein fraction is essential (Beever et al.
1985)
Grasses, legumes, cereal straws and grains, and forage maize are the principal forages for
ruminant livestock. Sheep production relies on most forage being utilized by the grazing
animal, whilst supplementary feeding (hay, silage, concentrates) is largely restricted to
pregnant ewes. With beef production, both grazed and conserved forage may vary according
to the system of production adopted and especially the expected age and body weight of the
animal at slaughter. With dairy-cows, high-energy and protein feeds of non-forage origin are
fed as milk yields commensurate with the animals‘ genetic merit cannot be achieved from
forage-only diets. Furthermore, as demand increases for animal products of defined protein
and fat contents, forage content of the diet is unlikely to increase. On the other hand, if it can
be recognized where current forages fail as adequate feeds for high producing ruminants, it
may be possible to reverse this trend by breeding forages with improved characteristics which
more closely reflect the animals‘ requirements for specific nutrients. It is necessary to analysis
the issues relating to forage utilization by ruminants and provide insight to improving the
nutritive value of currently available forage.
Poor feed intake or impaired protein supply may compromise the level and composition of
animal production which can be achieved forages. Thomson et al. (1984) considered this by
34
grazing dairy cows on pure swards of perennial ryegrass or white clover from lactation week
4 to 18. Overall the milk output from the clover fed cows increased by 300 l, with a small
increase in milk protein content and a larger reduction in milk fat content. Post-experimentally,
all cows were housed and fed grass silage and fixed amount of concentrates, during which
time an extra 600 l of milk were produced by the cows that had previously received white
clover, suggesting a substantial residual effect which may have been related to changes in the
endocrinological status of the cows as moderated by the different diets. Rinne et al. (1992)
find that, indoor feeding and grazing with dairy cows in Finland were compared at two levels
of energy and protein from concentrates during three growing seasons. Grazed cows produced
more milk, and their milk contained more protein and less fat than that of completely indoor
fed cows. The number of animals culled due to mastitis was higher for the completely indoor
fed cows than for grazed cows. There were several reasons for the higher milk yield of grazed
cows. Because of the grazing was efficiently managed, there was plenty of good quality grass
available. The long Finnish summer days allowed more time for daily feed intake during
grazing than indoor feeding.
Anderson et al. (1966) determined the comparative advantages of feeding baled hay in
three different ways to cattle wintered in the open. One group of cattle was fed hay in a rack
daily in an amount equivalent to 2.3 pounds per 100 pounds of body weight. The second
group was fed an equivalent amount of hay, but it was spread on the ground at each daily
feeding. Hay for the third group of cattle was placed in a rack once each week in an amount
which would permit the animals to have all they wanted to eat during the week. These trials
were conducted during three winter seasons. The actual beginning and ending of a trial was
largely dictated by weather conditions and their effect on grazing. The results of these trials
may be summarized as follows:

35
Weekly Feeding in Rack
1. Requires least time for feeding.
2. Results in greatest feed wastage.
3. Costs involved in removing manure from around rack may offset saving in feeding time.
4. It requires most feed.
5. Cattle gained an average of 25 lbs. during wintering period.
Daily Feeding
1. Requires more time for feeding.
2. Least feed wastage.
3. Major differences between rack and ground feeding were:
a. Cost of removing manure from around rack.
b. Cattle fed on ground lost weight, whereas those fed the same amount of hay from a rack
maintained their weight, suggesting less feed wastage with this method.
Sheets et al. (1926) analyses the solution of problems related to winter feed and feeding
method with less cost and more effects in 3 a year-study, while in all previous works, the
cattle were kept for one year only. They also define relationship between stall feeding and
grazing issues under winter feeding methods.
Ration I
Clover hay
Corn silage
Wheat straw
Ration II
Cottonseed meal
Corn silage
Wheat straw
Ration III
Mixed hay (grain mixture)
Corn silage*
Wheat straw*
*- they were given only on the third winter feeding year.
When the cattle graze in the summer (without additional feed) the lots which gain heavily
during the previous winter (in the first year Ration III, the second and the third years Ration I
and ration II ) did not gain so much in the following summer, and the lots gaining less in
winter make relatively large summer gains.
Zhang et al. (2008) determine the effect of feeding rice whole crop silage (RWCS, Oryza
sativa) with substituting corn silage (CS) diets on milk production, milk fatty acid
composition, rumen fermentation and blood metabolism in lactating dairy cows. DM intake,
milk yield and milk composition did not differ between RWCS and CS diets. Their study
suggested that RWCS could be well utilized as basic roughage as CS for lactating dairy cows.

36
Put simply, digestion in the rumen is characterized by feed conversion to short chain fatty acid
(SCFA), the propionate, which provide the primary energy source for ruminants, which is
the major source of protein and finally the gases, mainly CO2 and CH4 which are digestive
waste products and obviously of major environmental concern, observed less in RWCS than
CS diets.
2.4 Grazing Management
Grasslands and rangelands usually produce the majority of the forage ingested by
ruminant animals during the grazing season. Grass, is above all, a healthy food, usually free
of residue or toxic substances. Eaten at a sufficiently young stage, they are highly digestible
and contain almost as much energy as cereal grains. At this stage, they also have high mineral
and protein contents that cover a large part of animals‘ requirements (Henry et al., 1995).
Pastureland is critical to the production of these ruminants and the products they provide. In
order to obtain maximum profits from pasture grazing, producers must manage the land for
high production per acre and must manage the animals to minimize forage waste and to
ensure that they are growing sufficiently. Grazing systems provide high-quality forage and
reduce feed and veterinary costs while avoiding manure build-up. Feed costs are reduced
because farmers and ranchers do not have to grow or purchase forage and grain year-round,
and veterinary costs are reduced because animals on pasture have fewer health problems than
those that feed in the barnyard. In addition, pastures require few or no pesticides and allow
natural recycling of manure. They also provide a continuous soil cover, thus protecting
wildlife habitats and important ecosystems.
The maximum carrying capacity of Kyrgyzstan‘s grazing-land is estimated at 7 mln sheep
equivalents. This includes all ruminant stock (cattle, yaks, sheep and goats) and horses.

37
Official estimates of sheep equivalents are about 8, 216 thousand units. Though sheep
numbers have significantly reduced, the number of 'sheep equivalent' has not when cattle and
horses using the pastures and the abandonment of the outlying grazing is taken into account.
Previously, large numbers of cattle were managed under intensive conditions, and fewer
grazed on natural pasture. The reduction of sheep numbers from 14 mln head in the late 1980s
to 3 mln head or less in 1995 should have resulted in a general and gradual improvement of
all the pastures. But there has been no policy to bring stock numbers with the carrying
capacity of the land. The numbers of grazing horses is probably more than statistics indicate,
as ownership is not well recorded. So stock numbers, in 'sheep units' are still higher than the
carrying capacity of the grazing, and are excessive on pastures within easy walking distance
of settlements. Almost nowhere is controlled grazing management being practised and the
privatisation of herds and flocks has only increased this problem (Fitzherbert, 2005). Kyrgyz
Pastoralism is much more than simply a mode of livestock production. It is also a
consumption system that supports Kyrgyz population, a natural resource management system,
key to poverty reduction, development livestock contribution, decreasing external-internal
migration and also support of the pastoral livelihood systems. Esengulova (2007) argues, that
in Kyrgyzstan, where all pastures belong to the state and there is weak land legislation, the
absence of maps of pastures which show boundaries, status of land, lack of knowledge on
sustainable practices among land users, inequitable access to resources and not registered
rights, maximisation of pasture use is in place, lead to over exploitation of natural resources.
She focuses on a case of developing local community association for management of high
altitude pastures in Kyrgyzstan; in Tolok community (village) Kok-Jar near fresh water Lake
Son-Kol, Kochkor district, Naryn oblast, by comparing pasture condition in pre-Soviet, Soviet,
past-Soviet and present period. Further researches are required to find out in other regions of

38
Kyrgyzstan.
The three most widely used grazing systems are continuous grazing, intensive rotational
grazing, and multispecies grazing. The primary grazing system used in Alabama USA, as in
many other states, is continuous grazing. In this grazing system, animals graze a specific
pasture area freely and uninterruptedly throughout the year or grazing season. Because
continuous grazing allows animals to graze selectively, individual animal performance is
usually maximal. However, due to the selective grazing nature of animals, some forages are
overgrazed while less desirable plants are under grazed, which damages or wastes pastureland.
The grazing system that most effectively uses pastureland is the intensive rotational grazing
system, which includes short-duration grazing, rapid grazing, cell grazing, and strip grazing.
In a rotational grazing system, the pasture is fenced off into subdivisions or paddocks, and
animals are rotated according to the forage available and the forage growth rate. Short grazing
periods are beneficial because they can increase the carrying capacity of the pasture without
plants being damaged. However, research indicates that individual animal weight gains are
higher under a continuous grazing system than under an intensive rotational grazing system.
Intensive rotational grazing focuses more on animal production per acre than on individual
animal performance. Multispecies grazing is a grazing system in which cattle and sheep graze
together. Studies in the1950s and 1960s show that cattle, sheep, and goats do well together on
shared range because they have different grazing behaviours. Cattle mainly eat grasses, and
sheep and goats prefer broad-leafed plants such as forbs and leaves from some small shrubs.
Multispecies grazing offers producers the opportunity for complementary pasture use since
what one species will not eat, the other will. This significantly maximizes forage utilization,
which translates into higher animal production rates per acre, lower costs of production, and
better returns for farmers and ranchers. In addition, the cattle's presence protects the sheep and

39
goats from coyotes and wild dogs (Correa, 1999).
Peeters (2004) reports the main characteristics for wild and sown grasses for grasslands in
Australia. Grass covers are key components of the landscape and of human culture. In
pastoral regions, pastures are major constituents of the landscape and, notably in zones of
farmland crest-crossed with hedges and trees, in the hills and in the highlands. The grazing
livestock contribute to the attractiveness of the countryside. Grassland landscapes have deeply
affected the cultures, the traditions and the lifestyles of the people who live within them.
Numerous proverbs and expressions bear witness to the importance of grass and grasslands in
the collective psyche. Such landscapes also have a recreational function (tourism) that is
reinforced by the region‘s cultural and aesthetic characteristics in Australia. Despite the fact
that many grasses exhibit a great similarity of growth habit, they have very different
ecological requirements for many factors (soil moisture, soil texture, nutrient availability, soil
pH etc.) and they can also be more or less tolerant of limiting factors (flood, drought,
trampling, winter frost, snow periods and late frost in spring). All aspects are influenced by
the frequency of defoliation, the stocking rate and grazing system (rotational or continuous).
2.5 Importance of Livestock in the Present and Future and How Climate Change Can
Affect It
Globally, livestock contributes 40 % to agricultural GDP, employs more than a billion
people and create livelihoods for more than 1 billion poor (Steinfeld et al., 2006). From a
nutritional standpoint, livestock contributes about 30 % of the protein in human diets globally,
and more than 50 % in developing countries. In many developing countries, livestock is also
considered to be the backbone of agriculture, as they provide draught power and farmyard
manure, often the sole source of crop nutrition. As outlined in the livestock revolution
scenario (Delgado et al., 1999) the consumption of animal products will rise particularly in

40
the so called developing countries in response to urbanization and rising incomes. While the
increasing demand for livestock products offers market opportunities and income for small
holder producers and even landless, thereby providing pathways out of poverty, livestock
production globally faces increasing pressure because of negative environmental implications
particularly because of greenhouse gas emissions. Besides greenhouse gases, high water
requirement in livestock production systems is a major concern. The relationships between
livestock and the environment are complex and appear to be viewed very differently from
developed and developing country perspectives (Kristjanson, 2004). The FAO report,
Livestock‘s Long Shadow (2005), focuses on the effects of livestock on the environment. The
climate change impacts of livestock production have been widely highlighted, particularly
those associated with the rapidly expanding industrial livestock operations in Asia. Yet, in
smallholder crop-livestock and agro-pastoral and pastoral livestock systems, livestock are one
of a limited number of broad-based options to increase incomes and sustain the livelihoods of
an estimated 1 billion people globally, who have limited environmental footprint (Steinfeld et
al., 2006).
Livestock are particularly important for increasing the resilience of vulnerable poor people,
subject to climatic, market and disease shocks through diversifying risk and increasing assets.
The demand for energy supply through biofuels is yet another factor that is putting increased
pressure on the natural resource base and balance between different natural resource uses,
especially in mixed crop-livestock systems. Blummel et al. (2009) report that in the absence
of efficient livestock extension and veterinary services, there has been severe genetic erosion,
resulting in low productivity. This compelled small farmers to expand their herd size,
resulting in shortage of fodder and feed. As it was not economically viable to feed low
productive livestock, farmers facing shortage of fodder let them out for free grazing on

41
common lands and forests which suppressed the productivity further, while accelerating the
pressure on the livestock owners either to cull their uneconomic animals or to control their
herd size. With the growing threat on food security arising due to global warming, small
farmers dependent on rainfed agriculture are likely to be affected more severely, which may
compel them to shift over to livestock husbandry for their livelihood. Therefore, there should
be development to promote the productivity of livestock, while reducing the population and
conserving water and fodder. In relation to climate change, livestock will have to play a dual
role: mitigation and adaptation.
2.5.1 Forage and Water
Water scarcity has become globally significant over the last 40 years or so, and is an
accelerating condition for 1-2 billion people worldwide (MEA, 2005). The localised impacts
of global change on water sources are starting to receive attention, but in the same way as for
localised agricultural impacts, there is a great deal of work to be done. The response of
increased temperatures on water demand by livestock is well-known. For Bos indicus, for
example, water intake increases from about 3 kg per kg DM intake at 10 0
ambient
temperature, to 5 kg at 300
C, and to about 10 kg at 350
C (NRC, 1981). The impacts of
climate change on water supply changes in livestock systems, however, are not well-studied.
The key contribution of groundwater to extensive grazing systems will probably become even
more important in the future in the face of climate change, although the impacts on recharge
rates of the aquifers involved are essentially unknown.
Land use and systems changes
As temperature increases and rainfall increase or decreases (depending on location) and
becomes more variable, the niches for different crops and grassland species change. For

42
example, in parts of East Africa, reductions in the length of growing period are likely to lead
to maize being substituted by crop species more suited to drier environments such as sorghum
and millet (Thornton & Herrero, 2008). These land-use changes can lead to a different
composition of animal diets and to a change in the ability of smallholders to manage feed
deficits in the dry season. These two effects can have substantial effects on animal
productivity and on the maintenance of livestock assets.
Changes in the primary productivity of crops, forages and rangelands
This is probably the most visible effect of climate change on feed resources for ruminants.
However, the effects are different depending on location, production system and crop and
pasture species. In C4 plant species, increases in temperature up to 30-350
C will, in general,
increase the productivity of crops, fodders and pastures, as long as the ratio of evaporation to
potential evapotranspiration and nutrient availability do not significantly limit plant growth.
In C3 plants such as rice and wheat, temperature effects have a similar effect but increases in
CO2 levels will also have a significant (positive) impact on the productivity of these types of
crops (IPCC,2007). For food-feed crops, since harvest indexes change with the amount of
biomass produced, the end result for livestock production is a change in the quantity of grains
and straws and availability of ME for dry season feeding. Higher temperatures increase
lignification of plant tissues and, therefore, reduce the digestibility and the rates of
degradation of plant species (Minson, 1990). This leads to reduced nutrient availability for
animals and ultimately to a reduction in livestock production, which may have impacts on
food security and incomes through reductions in the production of milk and meat for
smallholders.

43
2.5.2 Changes in Livestock Species Composition
Species composition in rangelands and some managed grasslands are important
determinant of livestock productivity. As temperature and CO2 levels change, the optimal
growth ranges for different species also change; species alter their competition dynamics, and
the composition of mixed grasslands changes. For example, in the temperate regions and
subtropics, where grasslands often contain C3 and C4 species, some species are more
prominent than others in the summer, while the balance of the mix reverts in winter. Small
changes in temperature alter this balance significantly and often result in changes in livestock
productivity. The proportion of browse in rangelands may increase in the future as a result of
increased growth and competitive of browse species due to increased CO2 levels (Morgan et
al., 2007).
2.5.3 Livestock and Human Health
The major impacts of climate change on livestock and human healh have manifested
themselves on diseases that are vector-borne. Increasing temperatures have supported the
expansion of vector populations into cooler areas, either into higher altitude systems or into
more temperate zones (the spread bluetongue disease in northern Europe). Changes in rainfall
pattern can also influence an expansion of vectors during wetter years. This may lead to large
outbreaks of disease, such as those seen in East Africa due to Rift Valley Fever virus, which is
transmitted by a wide variety of biting insects. Helminthic infections, particularly of small
ruminants will be greatly influenced by changes in temperature and humidity. Climate
changes could also influence disease distribution indirectly through changes in the
distribution of livestock. Areas becoming more arid would only be suitable for camels and
small ruminants. If these species are forced to aggregate around water points, the incidence of

44
parasitic disease could increase. ―Environment-Friendly‖ development of livestock
production systems demand that the increased production is met by increased efficiency of
production and not through increased animal numbers (Leng, 1993). As livestock is, and will
remain, an important source of livelihood, it is necessary to find suitable solutions to convert
this industry into an economically viable enterprise, while reducing the ill-effects of global
warming. In relation to climate change, livestock is part of the problem, but part of the
solution where cropping becomes too risky and where livestock will serve as an important
tool for risk mitigation and diversification. Increasing the efficiency of livestock production
that is harvesting higher productivity from fewer numbers of livestock will play a key role in
mitigating environmentally adverse effects from livestock. There are, however, ceilings to this
approach mainly defined by feed resources. Feeding of livestock should not lead to
competition for human sources and should be based on converting non-human edible feed
sources into human edible ones. Some trade-offs between positive and negative effects of
livestock have to be accepted (Mendelsohn & Dinar, 2008).
2.6 Constraints to Livestock Production Systems
The inaccessibility and ruggedness of mountain areas are well recognized as physical
constraints, but there are other less well-understood constraints. Human disregard for
mountain specificities results in a blanket approach providing solutions which does not meet
the need to improve farmers‘ welfare. One of the characteristics of the mountain region that
enriches its diversity but is constraint livestock production systems is its heterogeneity of
mountain regions which impedes the transfer of technology from one region to another. Other
constraints include lack of methodologies for integrating research results into technological
alternatives, inappropriate incorporation of socio-economic aspects into the technology

45
development and transfer process and irrelevance of technological innovations to farmers
(Varde, 1999). Shortage of animal feed and the lack of adoption of technologies to improve
feed production in monocultures or in association with other crops are seen by some as some
of the key constraints in the livestock sector. It is necessary to draw attention to the presence
of anti-nutritional factors in highland vegetation as fodder problem. Specific reference is
made to the tannins present in many trees that have negative influence on protein digestion;
tree fodder is an integral part of feed in many highland mountain areas (Djikman, 1999). The
low returns that farmers receive from investments on livestock or another constraint to the
development of livestock production can be one of the major constraints of livestock
production systems. The low price milk has been seen as a disincentive for smallholder dairy
farmers in the mountain areas (Tulachan, 2000).
Broad regional studies and case studies in East Africa show that livestock production is
particularly constrained by market and spatial factors. These constraints are likely to become
even greater as a result of the high costs of infrastructure and risks of disruption. Selected
case studies show that the primary constraints to livestock production in highland and
mountain areas are remnants of restrictive policies and regulations, high transaction costs as a
result of poor infrastructure and information systems and poorly developed markets for inputs
and outputs. These case studies also show the recent reforms have eased some of these
constraints with good results for both producers and consumers. Further reform and
investment in supporting infrastructure, including farmers‘ group development, can help
provide good growing opportunities for smallholder livestock producers in highland systems.
Inadequate veterinary services and health care are general and serious problems for the
development of the livestock sector. In the highlands, the withdrawal of subsidised extension
and veterinary services has not only affected animal health, but also the adoption of

46
technologies (Staal & Jabbar, 1999).
Kerven (2005) studied other constraints to livestock production in Central Asia.
Native goats of Kazakhstan, Kyrgyzstan and Tajikistan produce good quality cashmere that is
recently being bought by international processors. Central Asian producers are not equipped
to take full advantage of these new marketing opportunities. Lacking prior experience, Central
Asian producers are unable to distinguish well cashmere from poor. International markets
reward quality with higher prices. Producers and local traders lack global market information
on demand and prices. Producers also lack skills in harvesting and sorting cashmere according
to international quality standards, and sell individually to traders rather than pooling to gain
higher prices. Consequently, Central Asian producers receive much lower prices than
Mongolians and Chinese. Strong international demand continues for cashmere. Beauvais
(2005) focuses on defining practical, economically viable ways of increasing productivity of
Kyrgyz sheep and cattle herds, focussing on animal husbandry. Seven case studies in Karakol
in Kyrgyzstan were used as a basis for describing farming methods. A questionnaire was used
to find the main problems and diseases associated with the loss of productivity. A number of
different problems and diseases were identified. Animal husbandry problems included poor
control of nutrition, lack of breeding strategy, poor treatment of disease, poor hygiene and
transportation methods. Further research is required to find out if the problems are common to
smallholders across the region and in the other regions of Kyrgyzstan. Certain areas of animal
husbandry on the smallholdings investigated could be further improved through more in depth
research. For example, increasing the lambing rate and milk productivity of cattle through
genetics, nutrition control or other methods; enabling a more accurate picture of diseases
present through improved diagnostics; finding out the feasibility of certain education and
co-operative programs.

47
2.7 Socio-Economic Issues of Livestock Management
Gender and Livestock - Gender is a vital issue for the sustainable management of
livestock in mixed crop-livestock farming systems because of the substantial role women play
in livestock management. Men and women have different domains of activity and different
knowledge and skills. In some areas, the knowledge and skills of women are considerably
greater than those of men, but, in general, this does not receive due recognition (Njiro, 1999).
When rural women have access to cash or microcredit, they usually choose to invest in
livestock, which provide food, cash, draft power, and fertilizer, and gain value through
reproduction. With increasing male outmigration and the feminization of rural poverty,
women have a greater need and desire for livestock to improve their food security and income
levels.
Livestock and poverty- The fight against poverty starts with rational use of available natural
resources. Among those most readily available to the world's poor are farm animals. One-third
of the world's 6 billion people depend on animals daily. Of the 1.3 billion people living in
absolute poverty, 80% live in rural areas and of these, two-thirds—some 678 million
poor—keep livestock (ILRI, 2007). Livestock are a crucial source of financial capital for the
rural poor. For many, livestock ownership is the only form of savings available. In fact, for
pastoralists and often for poor women, livestock are the most important fungible asset they
own. Livestock provide a critical reserve against emergencies and decrease vulnerability to
financial shocks from ill health, crop failures, and other risks. They yield direct benefits in the
form of food, wool, or hides, and can raise farm productivity by providing manure and
draught power. In a comparative study of poor livestock keepers in Bolivia, India, and Kenya,
households in all three countries ranked livestock above business and housing as their best
investment. In 40% of Kenya‘s districts, livestock represent more than a quarter of total
48
household income. In rural Nepal, they contribute 9-14% of production for home
consumption, and are even more important as a source of cash income. For Nepal isolated
mountain communities, livestock are among the few items exchanged for cash, constituting
nearly half of total farm cash income. These studies have found that livestock generally
contribute significantly more to the income stream of poor households, particularly the
income controlled by women, than to the incomes of those living above the poverty line
(Thornton, 2002). The benefits from livestock can even extend to those who do not own
livestock, often the poorest members of the community. Non-owners are sometimes able to
obtain milk, dung for fuel, or help with ploughing of fields. These may be given free of charge
from livestock owners or at greatly reduced prices (Shackleton, 2005). Perhaps not
surprisingly, livestock figure prominently in the movement of households into and out of
poverty. In a study of household poverty dynamics in 20 communities in Kenya, researchers
found that more than 40 %of families that escaped poverty did so by diversifying their farm
income, primarily by acquiring livestock (Kristjanson, 2004). When the poor have access to
markets, livestock can serve as a source of collateral, giving households access to other forms
of capital and opening pathways for further income diversification. The role of livestock in
rural communities extends significantly beyond their economic value. Most notably, livestock
play a prominent role in social and cultural relationships. Loans and gifts of livestock
contribute to family and communities and often play a central role in cultural traditions such
as weddings and funerals. Owning livestock can also bring better nutrition to some of the
most vulnerable groups, including women and children (IFAD, 2004).
2.8 Conclusion
Academic interest in local-level livelihood studies in rural Kyrgyzstan is growing.

49
Existing case studies illustrate the variety of coping strategies employed by rural households,
depending on their socio-economic background. To some extent, however, most of these
studies neglect the importance of the institutional context, most probably because it is highly
demanding and time-consuming to capture other more complex institutional aspects in a
survey. Most surveys, therefore, have done with understanding the ways in which institutions
contribute to the achievement of collective (community) goals. Similarly, many development
projects engaged in institutional strengthening focus on visible, formal organisations only
(Mearns & Scoones, 1999). The report on global environmental issues related to livestock
herding concludes that there is an urgent need to develop suitable institutional and policy
frameworks, at local, national and international levels in order to decrease the often severe
environmental impacts caused by the livestock sector (FAO, 2006). Although transition
research made a remarkable step from the macro-economic down to the local and household
levels, many effects of post-socialist transition upon people‘s livelihoods remain difficult to
grasp. This has to do with certain shortcomings of the often-applied household-surveys.
Analyses of household strategies tend to neglect intra-household disparities, i.e. between
gender and age groups, which often exceed inter-household disparities. Domestic units are,
therefore, best conceptualized as the site of multiple and interlocking sets of processes. These
may activate different sub-sets of individuals who constitute appropriate units of analysis
(Kandiyoti 1999). This research tried to find out the main socio-economic and environmental
factors affecting agro-pastoral systems in two VGs and to analyse how those factors are
related to each other.

50
Chapter III Research Methodology
3.1 Introduction
This chapter includes research designs and methods. This study was conducted at
different levels – at individual and household levels for analysing livelihoods; and at local,
regional and national level for the analysis of the institutional, socio-economic context of
agro-pastoral systems2. Another type of agro-pastoral systems practiced in the study area is
sedentary transhumance. Pastoralists sometimes rent in some arable land and cultivate crops.
The nature of study is cause-effect study – combined qualitative and quantitative data to
analyse the interaction between livelihood levels. Additional qualitative methods for studying
agro-pastoral systems i.e. analysis of narratives stories, helps in addressing the distinct time
component in this study; pre-Soviet time and post-transition (previous 10-15 years) and
current-market oriented economy. It is expected that this method will examine how
households and pastoralists react to new opportunities with old systems and to new systems
with old farming methods and conserved indigenous knowledge. The different components of
the study design are below.
3.2 Description of the Research Sites
Ala-Buka district is located in the South part of the Western Tien-Shan, 1600-1800 meters
above sea level (average) in north-western Fergana Valley. Seventeen ecosystems can be
found from a total 22 ecosystems in the northern temperate part of the district, while in the
southern part only three ecosystems are found. The Western part of Zhalal-Abad, including
the study district have significant importance in natural resources and biodiversity
2 -Agro-pastoral production systems are depending on a mix of farming and pastoralism, typically with one or
more fixed settlements and pastures to which the animals are sent with some group or household members
seasonally.

51
conservation; three nature reserves (Besh Aral, Sary-Chelek and Padysha-Ata) established to
preserve valuable and endemic species in the area. With these points, this research tried to
examine the interrelationship between nature and people through livestock and land
management issues and the condition of utilization and conservation of natural resources.
Ala-Buka district was selected for the study. It is located in the south-west of Zhalal-Abad
region, Kyrgyzstan. Within the area of 3 thousand km2, the district is bounded by Chatkal and
Aksy districts of Zhalal-Abad region in East, West and North, and Namangan region of
Uzbekistan in the south t (Figure 3.1). Ala-Buka village, that is the centre of district, is located
250 km far from Zhalal-Abad region centre, 700 km far from capital city-Bishkek, and 55 km
far from Namangan city, Uzbekistan. Namangan is the nearest market at which most
households‘ economy strongly depends. The main activity in the area is agriculture. There are
21,134 hectares of arable land, including 16718 ha of irrigated and 5416 hectares dry land
areas. Most are grown: wheat corn, potatoes, beans, oil plants, tobacco, cotton, melons,
vegetables and forage crops. Pastures of district are 129429 ha, including 9,738 ha
near-village pastures (by seasonal use called winter pastures-kyshtoo), 47616 ha of intensive
(spring/autumn pastures– jazdoo/kuzdoo) and 72,075 ha remote (summer pastures-jayloo)
pastures, which create favourable conditions for breeding of cattle, horse and small ruminants.
Other land areas such as 400 ha hay land, 1,517 ha orchard and 25,379 ha forests also play
major role in district socio-economy. There are 73 agricultural cooperatives, 467 peasant
farms, 4,731 private farms and two state owned Kyrgyz fine-wool merino sheep breeding
farms (DADD, 2009).

52
Figure 3.1 Map of Kyrgyzstan showing the study area – Ala-Buka district
Figure 3.2 Map of Ala-Buka district showing sample VGs and pastures

53
For the purpose of household surveys, the research was conducted in two VGs, in three
agro-pastoral systems: the first mainly livestock with additional cropping, the second mainly
farming with additional livestock and for both VGs along livestock holding, shown in Figure
3.2. A single-study design was adopted for all objectives in two VGs: 1-May3 Village
Government (MVG) and Torogeldi Baltagulov Village Governments (BVG). Another reason
of choosing two VGs among eight VGs in the district was specialised to different livestock
species breeding during Soviet time, due to topography and pasture condition. In the past,
MVG and other three neighbouring VGs mainly specialized in Kyrgyz fine-wool merino
sheep and cashmere goats breeding, and MVG partially represents other VGs. The same case
for BVG represents other three VGs, formerly specialised in Ala-Too meat-dairy direct cattle
breed. This background is important in the market based-economy of the district and
agro-pastoral systems; gained experiences and new opportunities have had different feedback
in both VGs. It is expected that a comparison of the two locations leads to a better
understanding of gaps and priorities, and the importance of livestock based livelihood and the
ways in which these agro-pastoral systems can be strengthened.
MVG (former 1-May kolkhoz) with total 29,221 ha area is located in the south-western
part of Ala-Buka district, 800-3300 m above sea level. The total population is 11,279 people.
Ethnic composition is Kyrgyz (96 %), Uzbek (0.3%), Tajiks (3.5%) and others (0.2%). The
total arable land area is 2321 ha, including 1668 ha irrigated and 653 ha dry land area.
Farmers grow wheat, maize, sunflower, forage crops, cotton, tobacco, beans, watermelon and
gourds; double cropping and transitional cropping are common in the south part, while in the
north farmers grow only forage crops. During the Soviet time irrigation-drainage systems
were strictly controlled and without interruption during the growing season; water was taken
3 - 1-May reads as Birinchi May

54
by three main pump stations, which after independence were abandoned and created huge
difficulties with water to farmers. A total 7865 ha pastures area plays main role in VGs
livelihood, with the condition in favour of raising small ruminants.
BVG, former Birlik sovkhoz, is in the south-eastern part located 12 km far from the district
centre, neighbouring with Uzbekistan. During the Soviet time, this VG was mainly
specialized in breeding Ala-Too breed and there was one of the biggest complexes of pure
breed raising in the oblast. The total area of VG is 25549 ha, located between 800-2700 m
above sea level in the south-eastern. The total population is 11723 people (2010), ethnic
composition consists Kyrgyz (62 %), Uzbek (32%), Tajiks (4.5%) and others (1%). There are
2506 HHs in BVG and 908 HHs of the 37.3% of the total HHs monthly income is up to 175
som4. In MVG, it is 810 HHs or 39.9% of the total 2034 of HHs, higher than in BVG. The
total arable land area is 2512 ha, including 2155 ha irrigated and 357 ha dry land area.
Compared to MVG, irrigated land area is also more than in MVG with ground water sources
in four villages. Water availability in the growing season has made farming the main source of
income with additional livestock keeping in BVG. In general, farmers grow multiple purpose
crops, such as wheat, maize, vegetables, forage crops and cash crops, such as potato and sun
flower. The weather condition in BVG is cooler than in MVG; therefore cotton and gourds
cannot be grown in BVG. The land size per capita also differs in both VGs, in MVG, 0.12 ha
irrigated and 0.06 ha dry land in a total 0.18 ha arable land, while in BVG 0.17 ha irrigated
and 0.03 ha dry land with a total of 0.20 ha arable land area per capita5.
It was observed that lack of land (especially irrigated) and the pressure on resources are
4 Som is National currency of Kyrgyzstan, 1 USD is equal to 46,45 Som (2010)
5 Private land ownership in Kyrgyzstan was authorized by a constitutional amendment adopted in 1998,
followed in 1999 by the implementing legislation. Land distribution and ownership depended on total arable land
area of kolkhozes and sovkhozes, where in BVG was 0.2 ha arable land (0.17 ha irrigated and 0.03 ha dry land)
per capita and 0.18 ha arable land (0.12 ha irrigated land and 0.06 ha dry land) per capita.

55
higher in Ala-Buka district than other neighbouring districts, which increase overgrazing and
deforestation, as shown in Figure 3.3.
Figure 3.3 Land degradation: overgrazing and pressure on mountain slopes
Source: EnvSecurity, 2005
New agriculture development and recent human occupation gave pressure on mountain
slopes. Since this district is located on transboundary zone, pasture and forest usages have
political-economic implications. To analyse pasture quality changes (according to temperature
and precipitation), plant growth stage, composition and condition, were selected; Chapchyma
intensive-remote pasture (location 41025
/N, 70
057
/E, 2500-3000 m altitude, survey area 3.2 ha,
1-May VG) and Chanach-Say (Ak Tash kungoy (sunny side)) intensive-remote pastures
Ala-Buka

56
(location 41034
/N, 71
029
/E, 1800-2400 m altitude, survey area 3.4 ha, T. Baltagulov VG)
located in the south of Western Tien-Shan. Chapchyma pasture, with dryer and hotter climate
conditions in summer, its average precipitation is 800 mm a year. It is located near Besh-Aral
nature reserve and it favours the grazing of small ruminants and horses. Unlike Chapchyma,
Chanach-Say‘s climate is more humid even in summer; the average precipitation is 1100 mm
a year. The biodiversity is almost the same with Padysha-Ata and Sary-Chelek nature reserves.
These characteristics necessitate the analysis people-nature interrelationship through livestock
and land management and biodiversity conservation issues by comparing the composition,
utilisation and degradation levels and factors affecting degradation between two types of
pastures. Condition and utilisation of near-village pastures was observed in Suu Bashy pasture
in Kashkalak village (B VG). This pasture consists of rainfed and irrigated pasture, which can
be utilised all year round; in autumn, and in winter, grazing includes cropland.
3.3 Sampling for Household Survey
Following VGs selection, a baseline survey was conducted in different villages to
gather basic information on livestock and land holdings, livestock compositions, income
resources and other details. Households were then selected for detailed study on the basis of
the baseline survey, using stratified, random sampling procedure to ensure that the full range
of household sizes was covered. A household survey was conducted both in MVG and BVG
to gather basic information on livestock holdings, livestock compositions, income sources,
and forage availability, consumption and storage. A total of 240 households, 120 households
from each VG, were selected for a detailed study. A household survey used stratified random
sampling procedure to ensure that the full ranges of household sizes were covered. Household
survey was conducted with semi-structured questionnaire. A total of 80 pastoralists, 40 from

57
each VG, were selected and interviewed in order to gain additional information, including
information on pastures and grazing management of the chosen agro-pastoral systems
strongly related with them. Information was also collected through interviews with farmers,
key informants, discussions with agricultural specialists and government officers of local
administration and district.
3.4 Sources of data
Data were collected from both primary and secondary sources. Primary data collection
was done in two phases. The first fieldwork was done before starting the research for the
study in 2007-2008. Another field survey was done in August-September 2010. Quantitative
and qualitative primary data were collected through individual household, village and pasture
survey by participant observation, interviews and direct observation at household level. At
national level and for supplementing the data from primary sources, various secondary
sources were considered such as reports, books, journal articles, and annual statistics reports,
and related legislative documents. Many concerned organizations; Ministry of Agriculture and
Water Resources and Processing Industry of Kyrgyzstan (MAWRPI, currently Ministry of
Agriculture (MoA)), Kyrgyz State Agrarian University, Ala-Buka District Administration
(DA), Regional Department of Agrarian Development (DADD), The District Veterinary
Department and State Veterinary Laboratory, Rural Advisory Service, Pasture Committees of
MVG and BVG were visited. To supplement the data for primary and secondary sources of
feeds and feeding methods, additional information from Hiroshima University farm, which
was collected during 2009-2011 was used. Some secondary sources were downloaded through
the internet.

58
3.5 Methods of Data Collection
Household and Pastoral survey was conducted by using two types of questionnaires; to
generate quantitative data for cause-effect and comparative analysis of data. Questionnaires
consisted of three main parts: the first was livestock and land holding with socio-economic
issues, second part was about feeds, feeding methods and output from livestock, and, the third
part was about access to pastures, pasture management, pastoralists‘ viewpoints about pasture
conditions and socio-economic characteristics of pastoralists and hired shepherds.
Questionnaires were designed in three parts to obtain information for meeting all objectives.
The first part of the questionnaire held information on the socio-economic characteristics
of HHs, including education, livelihood activities, cropland size, crop species, cropping
patterns, income sources, and problems related to livestock and land management issues. The
second part was about livestock holding, herd size and composition, changes in herd size and
composition in the last five years and reasons for changing. The third part included questions
on feeding types, traditional feeding methods, problems with winter shortage and purchasing
and selling issues and output from livestock; in terms of milk and milk products. Data on
daily milk yield and total milk yield per cow by calving stage, season, length and period were
collected in this part. This information was essential for calculating Wood‘s model; factors
affecting lactation curve shape. The forth part was about grazing, transhumance, herding size,
payment for herding, income from pasture side, pastures condition and pasture management
related gaps and priorities. The Participatory Rural Appraisal (PRA) techniques were used to
obtain qualitative information on pasture use and management. The major PRA tools were
applied for key informants‘ interviews and group discussions. Information on some forage
species, poisonous plants and the period of poisoning was obtained from pastoralists, some
households‘ members and agricultural specialists. Livestock and crop productivity, fertilisers

59
and fuels supply issues and changes in pasture management and control by Pasture
Committee (PC) related information were obtained from the Department of Agrarian
Development of District (DADD), Rural Advisory Service (RAS) and Veterinary Department
of District (VDD) and Village Governments‘ specialists by interviewing during field visits.
These were supplemented with participant observations and informal discussions with farmers
and pastoralists.
3.5.1 Pasture Survey
The second questionnaire was designed about the socio-economic context of pastoralists.
This questionnaire mainly focused on pasture management issues; herding, herding cost,
income sources and problems of pastoralists. Additional information about daily milk yield
and total milk yield of mares were also collected.
To analyse pasture condition and to determine the factors that cause pasture degradation
visual survey, according to pasture types, were made. For pasture measurement, Quadrate
method (the size of square is 1m2) was used. Vegetation was measured for a wide range of
purposes, such as: description in terms of botanical composition, ground cover, amount of dry
matter, quality of dry matter6, non-edible and edible plant species, height of forage species,
and temperature by altitude, biological alters in relation with climate changes, and for
determining its capacity to provide feed of livestock. This information were used for assessing
pasture degradation level in each pasture side; highlighted main evidences of degradation by
species and supplemented with the secondary data. Pasture condition was surveyed in both:
utilised and non-utilised intensive and remote pastures.
6 With purpose of analysing forage quality in Hokkaido University, few collected samples from both
Chapchyma and Chanach-Say pastures were brought to Japan. Due to high risk of Foot and Mouth Disease in
Kyrgyzstan was not able to analyse the samples.

60
3.5.2 Traditional Ecological Knowledge
The traditional ecological knowledge (TEK) was used to analyse its role in pasture
management, showing how herders ‗knowledge is reflected in pasture use norms and herding
practices pre-, during and post-Soviet periods in Kyrgyzstan. Pastoralists are knowledgeable
about their environments, topography, climate, and are capable for regulating seasonal
resource use among pastoralists, shepherds (themselves and hired). Therefore, examining the
role that pastoralists‘ ecological knowledge plays in resource management becomes
increasingly important in understanding the conditions necessary for the success of traditional
resource management. TEK consists of biophysical observations, skills and technologies, as
well as social relationships, such as human-environmental interactions. It transferred from one
generation to the next, represented cumulative local knowledge and modified as a result of
new experiences and observations. This study analyses how TEK acts in common property
utilisation among pastoralists. According to Usher (2000), TEK distinguishes four categories:
(A) Factual/ rational knowledge about the environment
(B) Factual knowledge about the past and current use of the environment
(C) Culturally based values about the environment
(D) Knowledge system
This study focused on factual knowledge of modern (hired shepherds, appeared after
independence) and traditional pastoralists about the environment, using the category (A), to
assess pasture quality and productivity and pasture degradation level, using the category (B)
to collect information regarding pasture use and management from modern and traditional
pastoralists, PC workers and agricultural specialists, as well as they have different viewpoints
about pasture use and herd size management.
3.6 Methods of Data Analysis
The basic mode of data analysis on the livestock diversity, feeds, and outputs from

61
livestock and pasture use and management issues was quantitative with qualitative-descriptive
analysis. And these data were complemented with simple statistical tools such as percentages
and means used for describing the socio-economic parameters of livestock holdings and
pasture measurements. To analyse the socio-economic status of households in terms of the
quantity and quality of livestock and land holding, we used household stratification according
to herd size in four groups: No livestock-G1, 1-20 livestock-G2, 20-60 livestock-G3 and more
than 60 livestock-G4; for land holding: no land, 0-1ha, 1-5ha and more than 5 ha respectively.
An economic cost-and benefit analysis for major crops was also analysed using primary data.
Some data related to forage shortage and importance of livestock species were ranked by
weighting of answers. T-tests and chi-square tests were done for testing differences among the
households and between two study VGs. Factors affecting lactation curves in terms of milk
production was analysed by using Wood‘s gamma model, calculated with STATA software.
Data entry was done in Excel and Statistical Package for Social Sciences (SPSS) spread
sheets.

62
Chapter IV Livestock in Production Systems
4.1Introduction
Kyrgyzstan is a mountainous country with livelihood condition of its population
determined by climate, landscape, soil, water resources, biodiversity, as well as social and
economic conditions. Most of its population derive a substantial proportion of its income from
livestock and farming. Moreover mountainous pastures, which consists 86% of total
agricultural land, favour livestock rearing in Kyrgyzstan.
The agro-pastoral system includes subsistence farming of main food crops and to an
increasing extent, cash crop farming. A key feature of livestock production is the practice of
transhumance. Access to common properties, pasture all year round for grazing and
supplementary feed from cropping, increased livestock population in general in the country.
In other words, an increased demand for livestock and livestock products has resulted in
increased number of livestock by species and also by changing its composition. Increased
demand for meat and milk production has forced an increase in the number of animals
without considering forage availability and pastures‘ productivity, especially in the case of
cattle. This is the main factor that decreases the productivity of livestock species, and can also
lead to other constraints of the livestock sector.
The aim of this chapter is to analyse the current condition of two agro-pastoral systems in
remote areas; with a focus on livestock-transhumance and additional crop production. In the
second section, the basic background information is discussed. The third section is about
livestock diversity; trends in livestock population and composition. This section discusses
reasons of increasing livestock population and changing composition and how they can
contribute to sustainable management of pastures in Kyrgyzstan. The fourth section analysed
social and economic issues associated with livestock production. The analysis data was based

63
on households with different herd size categories with mixed livestock species by
stratification in four groups. Thus, it discussed the main income sources of these groups to
determine the reasons of change in livestock quantity and quality. The fifth section examines
livestock feeding by feed types, feeding methods and ratio, and forage deficit by season. The
sixth section examines how forage shortage affects output from livestock in terms of milk
yield. The calculation of Wood‘s model about the factors affecting lactation curve based on
seasonal forage shortage. The conclusion of this chapter is given in the seventh section.
4.2 Background: Agrarian Sector of Kyrgyzstan: Pre- and Post-independence Periods
Agriculture in Kyrgyzstan has been one of the leading sectors of the economy. In the total
GDP of the country, the share of agriculture is significant; about 24%. In addition,
approximately 65.0% of the population lives in rural areas. The total number of all employed
(34,0%) or 14% of the total population is engaged in agriculture in 2009 (in developed
countries this figure is 1-3%). These data show that agriculture in Kyrgyzstan is not only
economic, but also has a great social and political significance (Abdurasulov, 2009). When
after 1927, the Soviet regime started to force the formerly nomadic Kyrgyz people to settle
down and lead a sedentary life, it soon realised that a complete abandonment of livestock
migration to summer pastures would hinder further economic development in the Republic. In
order to intensify livestock production – mainly sheep production for the Soviet meat and fine
wool market – seasonal migration to remote summer pastures was taken up again, yet on a
much larger scale than before (Dienes, 1975). The mechanisation of the agricultural sector led
to a rapid increase in flock sizes, and overall livestock numbers in the Republic reached about
17.8 million sheep equivalents7
in 1989 (Farrington, 2005). Semi-nomadic types of
7 Approximate comparative animal equivalents (AUE) (conversion factors) are taken from Sheep

64
production emerged, under which animals grazed during winter and spring in a fixed location
where houses, shelters and water points are provided, while during summer and autumn,
animals grazed pastures at more distant locations. The new systems involved the introduction
of improved breeds, and specialized commercial production oriented towards exporting
livestock and livestock products to Russia (Miller, 2001).
Climate conditions and topography of Kyrgyzstan assessed the main role of sheep
breeding ‗industry‘ in the agriculture sector. The share of sheep products was 35 % in total
agricultural production, while in mountainous districts was 56.3-86.3 %. Kyrgyzstan was in
the third place after Russia and Kazakhstan in wool production. The share of meat production
among Former Soviet Union countries was about 12-14 % and inside the country it reached
up to 60 % (Balyan, 1978). Livestock herding was based on transhumant grazing. Most
livestock belonged to the state, as property of the collective farms, yet individual herding
families could own up to ten sheep, a cow, a horse and one or two goats. Seasonal migration
of the collective farms‘ flocks to summer pastures was organised through kolkhoz herders
who, in some cases, together with their families, spent the summer months, or even the whole
year, on remote mountain pastures. A highly developed infrastructure was provided to these
herders even in the most distant mountain locations, i.e. access to roads, watering points,
housing, transport and monthly truck deliveries, and a range of social and cultural services
(Fitzherbert 2000; Farrington, 2005). It is estimated that about 75% of all kolkhoz herders
operated a transhumant system (van Veen, 1995). The new systems involved the introduction
of improved breeds, and specialized commercial production oriented towards exporting
livestock and livestock products to Russia (Miller, 2001).
Unit Equivalent (SUE): 1 sheep equals to 1 sheep, 1cow equals to 5 sheep, 1 horse equals to 6 sheep
and 1goat equals to 0.7 sheep (MAWRPI, 2007)

65
After independence, with the transition of the CIS countries from a centrally-planned to a
free-market economy, the agricultural sector has undergone substantial changes as a result of
privatization, land reforms, price liberalization, and decentralization of decision-making. The
system of collective livestock production has ceased, and pastoral livestock production has
adjusted to the market economy (Suttie & Reynolds, 2003c). Intensive industrialized livestock
production systems were replaced by grazing and mixed–crop livestock or agro-pastoral
systems. Depending on the size of the kolkhozes and sovkhozes, every individual (including
children, born until 1995) received between 0.18 ha and 0.5 ha of arable land and a few
animals, so that thousands of small family farms (depending on family size) with around 0.85
to 4 ha of arable land, a few sheep and goats, one or two cows and one horse to four-or five
households8, were created (Figure 4.1). In 1991, 32.7% of cattle, 42.5% of sheep and goats,
and 37.2% of horse were owned by the state, while in 2008, it was 0.2%, 3% and 5% (98%
total livestock owned by the private sector) as shown in Figure 4.2 (Nazarkulov, 2009).
Collective and state farms had distributed almost all their animals and livestock. Today they
are concentrated almost exclusively in household plots and peasant farms. There were
considerable differences between state-owned or collective farms, peasant farm and
household plots. Extensive livestock systems (pastoral, agro-pastoral and mixed farming)
have been restored under market-based economy with preserved nomadic traditional
knowledge by providing food, employment and income in remote areas. These systems are
based on the use of resources available at low or very low cost, and are driven by access to
feed resources with minimum or noninvestment.
8 - quantity of livestock and species also depended on former kolkhoz and sovkhoz livestock specialization: if it
is fine-wool sheep breed specialized, distributed sheep were mainly fall to those breeds, in terms of goats and
cattle also distributed similarly. Horses were mainly distributed to peasant farms; one or two horses to one
peasant farm, which equaled to one horse to 4-5 households
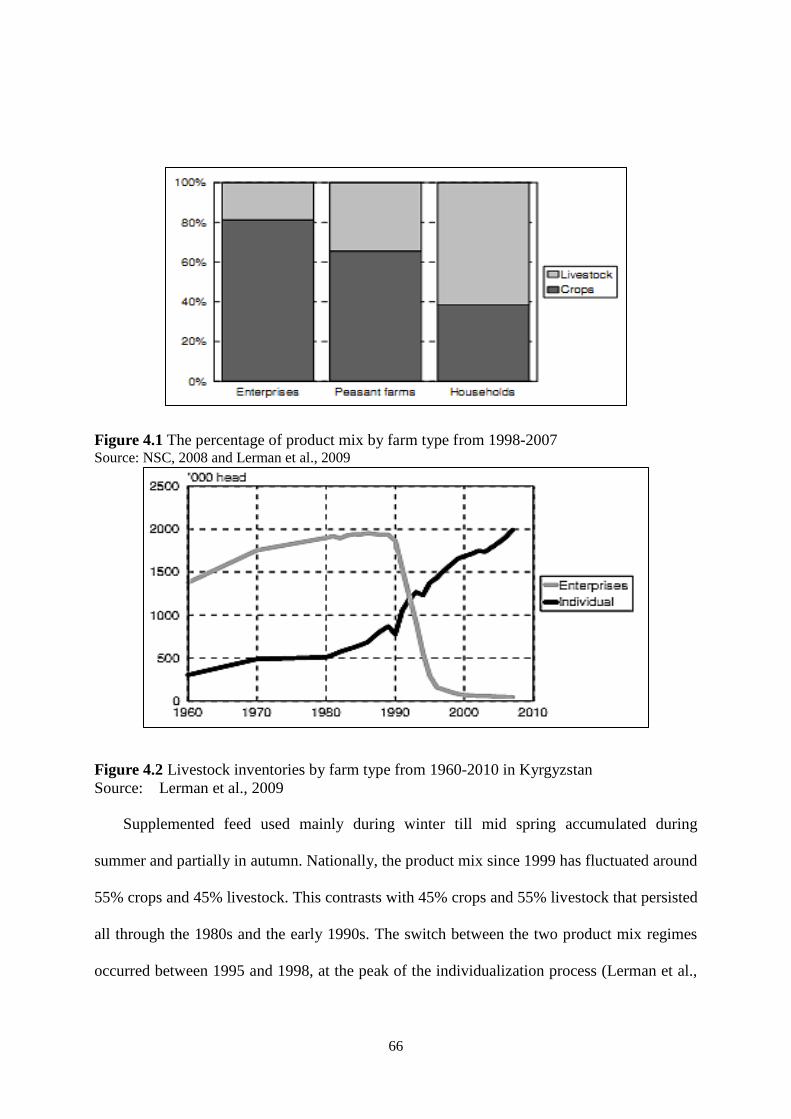
66
Figure 4.1 The percentage of product mix by farm type from 1998-2007 Source: NSC, 2008 and Lerman et al., 2009
Figure 4.2 Livestock inventories by farm type from 1960-2010 in Kyrgyzstan
Source: Lerman et al., 2009
Supplemented feed used mainly during winter till mid spring accumulated during
summer and partially in autumn. Nationally, the product mix since 1999 has fluctuated around
55% crops and 45% livestock. This contrasts with 45% crops and 55% livestock that persisted
all through the 1980s and the early 1990s. The switch between the two product mix regimes
occurred between 1995 and 1998, at the peak of the individualization process (Lerman et al.,
67
2009). From 2000, crop and livestock shares had drastically changed; increased in crop
production with decline in livestock production at national level. Mixed farming systems are
conducted on a small scale by households and combine various sources of feed: natural
pastures, hays from hay lands (meadows), crops residues, forage crops, and at times feed
bought at markets. These systems became more sustainable and dominant in rural areas.
There are many benefits from integrating crop and livestock production; livestock are sources
of draught power, fertilizer, and insurance asset. On the other hand, non-product purposes of
livestock continue to give more pressure to pastures; most areas of land are used for cash
crops grow and decrease forage cropland areas. These factors necessitate the examination of
the share of crop and livestock at household level and among peasant farms.
4.3 Livestock Diversity: Trends in Population and Composition
Although the livestock sector has experienced phenomenal growth, different regions are
responding differently to the increase in livestock population. The livestock sector varies from
region to region, between districts and within different parts of the country.
Underdevelopment of other sectors of the economy, especially industry, construction, services
and the lack of other spheres of employment, especially in high mountain regions of the
country where extensive livestock farming is the only source of income in remote areas made
livestock the mainstay of rural livelihood. The trends in number of livestock in recent years
have tended to increase the system though by a small amount per year. When compared with
the past planned economy, the current number of cattle had reached the Soviet period, the
horses exceeded by 100.0 thousand heads, and the pigs and sheep by 50% (Ajibekov, 2005).
This is attributed mainly to population growth, and income growth. Hence there is need
observation the role played by livestock in the rural and national economy, and how it relates
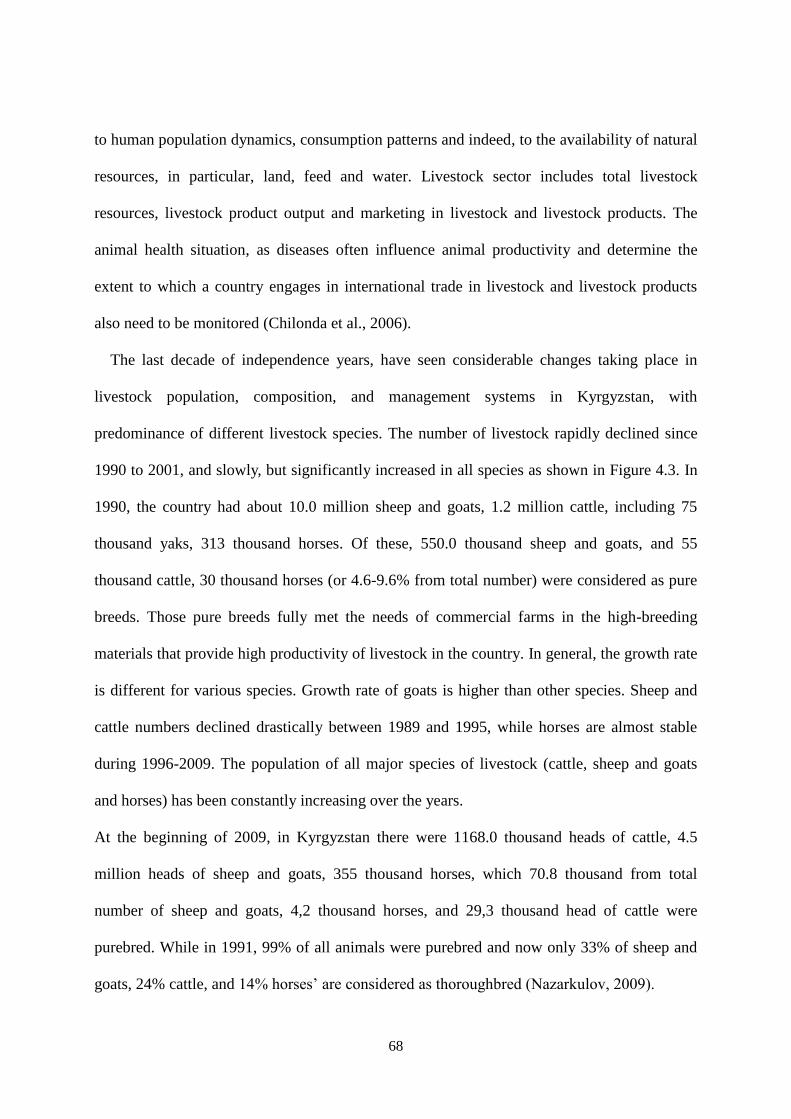
68
to human population dynamics, consumption patterns and indeed, to the availability of natural
resources, in particular, land, feed and water. Livestock sector includes total livestock
resources, livestock product output and marketing in livestock and livestock products. The
animal health situation, as diseases often influence animal productivity and determine the
extent to which a country engages in international trade in livestock and livestock products
also need to be monitored (Chilonda et al., 2006).
The last decade of independence years, have seen considerable changes taking place in
livestock population, composition, and management systems in Kyrgyzstan, with
predominance of different livestock species. The number of livestock rapidly declined since
1990 to 2001, and slowly, but significantly increased in all species as shown in Figure 4.3. In
1990, the country had about 10.0 million sheep and goats, 1.2 million cattle, including 75
thousand yaks, 313 thousand horses. Of these, 550.0 thousand sheep and goats, and 55
thousand cattle, 30 thousand horses (or 4.6-9.6% from total number) were considered as pure
breeds. Those pure breeds fully met the needs of commercial farms in the high-breeding
materials that provide high productivity of livestock in the country. In general, the growth rate
is different for various species. Growth rate of goats is higher than other species. Sheep and
cattle numbers declined drastically between 1989 and 1995, while horses are almost stable
during 1996-2009. The population of all major species of livestock (cattle, sheep and goats
and horses) has been constantly increasing over the years.
At the beginning of 2009, in Kyrgyzstan there were 1168.0 thousand heads of cattle, 4.5
million heads of sheep and goats, 355 thousand horses, which 70.8 thousand from total
number of sheep and goats, 4,2 thousand horses, and 29,3 thousand head of cattle were
purebred. While in 1991, 99% of all animals were purebred and now only 33% of sheep and
goats, 24% cattle, and 14% horses‘ are considered as thoroughbred (Nazarkulov, 2009).

69
Figure 4.3 Changes in total livestock number (thousand head) in Kyrgyzstan Source: MoA (MAWRPI), 2010
The socio-economic conditions have brought about a change in livestock preference, away
from sheep to goats, cattle and horses. Starting in the 1940s and increasing steadily over the
next thirty years, Kyrgyzstan became a wool farm for the Soviet Union. However the pedigree
structure of sheep in Kyrgyzstan has changed during the recent last years in connection with
transition to a market economy. Thus, in 1990, the share of fine wool production was 87%,
semi-fine wool production was 7%, semi-coarse wool production was 3%, and coarse wool
fat-tailed production was 3% of the total livestock. In 2003, the share was 31.3% (fine wool),
6.2% (semi-fine), 0.6% (semi-course), and 61.9% (course). The reason of this pedigree ratio
was the sharp reduction of the number of fine-fleece and semi-fine-fleece sheep due to the fall
of prices and demand for fine and semi-fine wool, and also due to the increase of fat-tailed
meat sheep, which has a niche in the domestic mutton market (Ajibekov, 2001).
50
250
450
650
850
1050
1250
1450
1
2
3
4
5
6
7
8
9
101990
1991
1992
1993
1994
1995
1996
1997
1998
1999
2000
2001
2002
2003
2004
2005
2006
2007
2008
2009
Cat
tle,
goat
s an
d h
ors
es,
thousa
nd
Shee
p n
um
ber
, m
illi
on
sheep goat cattle horse

70
Cattle in Kyrgyzstan have mainly been kept for dairy production, later for meat; hence
the introduction of other breeds. Currently, 97 % of the cattle are bred by farms and personal
subsidiary plots. Forty eight per cent of all cattle belong to subsidiary farms which mainly
near use village pastures. Main breed are Ala-Too9; kept for meat and dairy production and
Oluya-Ata for milk production in northern part of Kyrgyzstan. Ala-Too is spread all over
Kyrgyzstan (Nogoev, 2008). Improving pathway of local breeds in Kyrgyzstan; territory is
shown in Figure 4.4
Figure 4.4 Trends in total cattle and improved breeds number in Kyrgyzstan Source: Nogoev, 2008
Cattle remain the main livestock specie at household level. From 1940 to 2009, total cattle
numbers rose from 555 thousand to 1,168 thousand head. In 1990, the percentage of
purebred10
was 85 % of the total cattle number. Introduction of crossbreeding for improved
milk-production resulted in increased interest in cattle-raising in the 1980s and 90s. Milk
9 The Ala – Too (meat-and-dairy) breed of cattle of meat-and-dairy direct has been developed in 1950. It is an
improved crossbred of local cattle with Swiss brown and Jersey blood and it makes up about 85% of the total
cattle number. Oluya-Ata breed, which make up about 10% of the cattle in the Republic are black and white
graded up from Friesian / Holstein imports (Nogoev, 2008;Fitzherbert, 2005) 10
The Ala – Too breed of cattle of meat-and-dairy direct has been developed in 1950. It is improved
crossbred of local cattle with Swiss brown and Jersey blood, and it makes up about 85% of the total
cattle number. Oluya-Ata breed which makes up about 10% of the cattle in the republic are black and
white graded up from Friesian / Holstein imports (Nogoev, 2008; Fitzherbert, 2005)
0
20
40
60
80
100
0
100
200
300
400
500
1939 1950 1955 1960 1964 1969 1974 1980 1990
Total number of crossbred cows, thous.head Ala-Too breed,thous.head
Pure breed percentage from total Oluya-Ata breed, thous.head
The
per
cen
tage
of
cro
ssb
red
s

71
yield of cows reached 3208 kg per cow in 1990 (the highest average milk yield). Cows are
mainly raised in state–owned farms, while households had 1-2 cows in general among all
rural families regardless of ethnic background. Thus, the total number of cattle has remained
stable since independence (Figure 4.5). From 1990, there was a sharp decline in number of
cattle from 1,219 thousand to 920 thousand heads and also milk yield increased from 3208 kg
to 1761 kg till 1995. However, the population of cattle, as well as milk yield, increased till
2005 (2218 kg) and again there was a decline in milk yield. The milk yield of cows decreased
from 3208 kg to 2069 kg per head between 1990 and 2009 and increases in livestock
production come from increases in animal numbers. There are also other factors responsible
for the decline in the yield such as decreasing number of purebred animals, due to lack of
control in animal breeding and animal health which affect livestock productivity at regional
and national levels (MAWRPI, 2009). At national level, it was considered that the current
levels of animal productivity in terms of milk and wool are low – due to poor nutrition, the
high incidence of diseases, and poor farm management.
Figure 4.5 Total cows‘ number and milk yield during 1940-2008 in Kyrgyzstan
Source: Nogoev, 2008
0
500
1000
1500
2000
2500
3000
3500
100
300
500
700
900
1100
1300
1500
194
0
19
50
195
5
196
0
196
5
197
0
198
0
198
5
199
0
199
5
200
0
200
5
200
6
200
7
200
8
An
nu
al a
ve m
ilk,k
g
Tota
l co
w s
nu
mb
er a
nd
pro
du
ced
m
ilk
Total cows‘ number(thous.head) Total produced milk (thous.ton)
Annual average milk yield, kg/per cow

72
Addressing these constraints rather than increasing animal numbers or changing the genetic
composition of the national herd, is the key to raising output from the livestock sector. Lack
of good-quality fodder to sustain animals through the long and harsh winter is a critical issue.
Many animals lose half of their body weight during winter, and mortality among young
animals is very high. This poor nutritional status is closely linked to the problem of animal
diseases. After a long winter with poor nutrition, often having lambed or calved, animals are
highly susceptible to infections (World Bank, 2005).Therefore, increase in livestock
production is realized mainly by increase in numbers of animals. Similar changes in the
population of livestock; their yield of total milk production is observed at district level as well
(Figure 4.6 and 4.7). Numbers of goats and sheep have increased significantly, while cattle are
almost stable. Horse numbers have changed drastically: it dropped sharply between 2004 and
2006 and increased again.
Figure 4.6 Total livestock number by species in Ala-Buka district from 1997-2009
Source: DADD, 2010
4600
4800
5000
5200
5400
5600
5800
15000
35000
55000
75000
95000
115000
135000
155000H
ors
e n
um
ber
Cat
tle
and s
hee
p,
goat
s num
ber
cattle sheep, goats horse

73
Figure 4.7 Changes in cows number, average milk yield and total milk production in
Ala-Buka district from 1997-2009
Source: DADD, 2010
Another reason for the change in number can be development of other sectors of the economy
or changes in infrastructure. Another main stimulus for change is inappropriate agricultural
policies, services and institutional and community-based rural development. Inappropriate
policy mechanisms, lack of services in terms of agro-veterinary services, bad conditions of
pasture-village link roads and lack of institutional development activities at district level have
led to the decline in both crop-livestock and pasture productivity.
Another reason for the changing numbers can be due to development of other sectors of
the economy or changes in the country and district infrastructure. First, the reconstruction of
the Bishkek-Osh highway, linking the South to the North, has led to dramatic improvement in
communication infrastructure. The road has improved and increased the movement of
commodities and people in and out of the region. Imports of external products and
transporting produced products to the capital city have both opened markets for internal
produce and led to increased competition between production systems and markets. The
500
800
1100
1400
1700
2000
2300
2600
5000
10000
15000
20000
25000
30000
35000
Aver
age
mil
k y
ield
, kg
Tota
l co
ws
num
ber
and p
roduce
d
mil
k
Total cows‘ number Total produced milk (thous.ton)
Annual average milk yield, kg/per cow

74
second main stimulus for change is inappropriate agricultural policies, services and
institutional development and community-based rural development. Improved transport
infrastructure has increased the opportunity for short-term migration out of the district for
employment on a seasonal basis. Another consequence of this recent change has been
employment patterns; predominantly economically motivated migration became an important
livelihood strategy to diversify the sources of income. But from evidence of research, the
livestock and cropping are increasingly financed through remittances, and this leads to the
absence of labour at household level. Furthermore, improved trade and market have led to
increased opportunities for higher education and off-farm employment in remote areas of the
district.
Majority households keep livestock in both VGs. And where crop production is
unsustainable livestock are essential component of farming systems. Thus, farming systems
with livestock holding establish different types of LPSs with dominating livestock (inside
system has dominating different species) or dominating farming activities. The characteristics
of typical households in both VGs are presented in Table 4.1.
Table 4.1 Characteristics of a typical household in both VGs*
Species BVG MVG
Cattle 2.8 3.2
Sheep 18.8 52.3
Goats 5.8 18.5
Horses 0.7 1
Donkey 0.2 0.8
Land holding**, ha 0.82 0.5
Own land, ha
Irrigated land
Dry land
0.20
0.17
0.03
0.18
0.12
0.06 Note: * There was no pasture land, as well as it is common property and can be accessed freely in near
village pastures, while for intensive and remote pastures required pasture tickets
**Includes rented land areas; renting from the Fund of Land Redistribution (FLD) or from
neighbours or purchased land
Source: Field survey, 2010
Livestock play significant multipurpose role in household livelihood and availability of

75
resources in terms of forage is also important for stable herd size. Percentage of households
with different numbers of species in their herds in both VGs is presented in Figure 4.8.
Figure 4.8 Percentage of households with different species number in their herds
Source: Field survey, 2010
According to data, majority households keep 1-10 cattle in both VGs. They consist 60.9% in
BVG and 55% in MVG respectively. From this number it can be said that there was at least
one lactated cow with calve in each household. In BVG, 42.5% (in MVG 27.5%) of
households had no cattle in their herds, where only 2.5% (in MVG 11.6%) of them have
10-50 cattle. The next important livestock specie is sheep; where 25.8% HHs in BVG and
32.4% HHs in MVG had 10-50 sheep in their herd. However, 52.5% HHs in BVG and 40.8%
of HHs in MVG had no sheep. In case of goats, 41.6% of HHs in MVG and 77.4% of HHs in
BVG did not keep goats in their herd. Horse (and donkeys) numbers were less (89.1% of HHs
in BVG and 68.3%of HHs in MVG has no horse) than other species as well as it needs extra
labour and care. Livestock holding with different species numbers by physiological condition
(age, sex and lactation stage of cows) is given in Table 4.2 and 4.3.
0% 10% 20% 30% 40% 50% 60% 70% 80% 90% 100%
BVG
MVG
BVG
MVG
BVG
MVG
BVG
MVG
Cat
tle
Sh
eep
Go
ats
Ho
rses
0 from 1-10 from10-50 50-100 more than 100

76
Table4.2 Livestock holding; total cattle number by physiological state and lactation stage
VGs Physiological state
Male Female Tot
al Bulls Calves Calves Heifers Cows
BVG Total number 38 50 46 33 104 265
Average number per HH,
n=801
0.4 0.6 0.5 0.4 1.3 3.3
Ave number per owned HH 1.6 0.9 0.8 1.4 1.8 3.8
MVG Total number 102 109 74 75 178 537
Average number per HH, n=92 1.1 1.2 0.8 0.8 1.9 5.8
Ave number per owned HH 2.4 2.1 1.4 1.4 2.3 5.8
Note: 1 These 80HHs in BVG and 92 HHs in MVG are with different species in their herd. HHs in G1
has no any livestock; it was not included to this calculation.
Table 4.3. Livestock holding, total sheep, goats and horse number by physiological state
Total Male Female Castrated Age1 1 2 3 4<
Shee
p
BV
G
Total number 1095 227 804 50 328 241 249 264 % 100 21.4 74.4 4.5 30.9 22 22.7 24.4 Ave number per HH, n=58
18.8 3.9 13.8 0.8 5.6 4.1 4.3 4.5
Ave number per owned
HH 18.8 4.6 14.3 7.1 8.2 7.7 8 11
MV
G
Total number 3559 671 2476 412 1118 646 960 833 % 100 18.8 69.7 11.5 31.6 18.1 26.9 23.4 Ave number per HH, n=68
52.3 9.8 36.4 6 16.4 9.5 14.1 12.2
Ave number per owned
HH 52.3 11.1 39.3 14.4 21 14 20 21
Goat
s
BV
G
Total number 217 29 183 5 44 36 123 14 % 100 13.3 84.4 2.3 20.2 16.5 56.9 6.4 Ave number per HH, n=28
10.8 1 6.5 0.1 1.5 1.2 4.3 0.5
Ave number per owned
HH 10.8 2 9.6 4.2 3.3 3.6 12 4.6
MV
G
Total number 2082 511 1373 309 624 444 748 256 % 100 24.7 60.5 14.8 29.9 21.3 35.9 12.2 Ave number per HH, n=73
28.5 7 18.8 4.2 8.5 6 10.2 3.5
Ave number per owned
HH 28.5 9.1 19.3 8.1 12.4 8.8 14.1 7
Ho
rses
BV
G
Total number 27 12 15 - 7 3 10 7 % 100 44.4 55.6 - 25.9 11.1 37.1 25.9 Ave number per HH, n=12
2.2 1 1.2 - 0.5 0.2 0.8 0.5
Ave number per owned
HH 2.2 1.2 3 - 1.5 3.3 1 1.4
MV
G
Total number 128 60 68 - 29 17 45 37 % 100 46.8 53.2 - 22.6 13.2 35.3 28.9 Ave number per HH, n=30
3 2 2.2 - 0.9 0.5 1.5 1.2
Ave number per owned
HH 3 2 3.4 - 2 1.7 2 2.7
Source: Field survey, 2010
Age1 The age group of livestock species 1 – 0-1 year old, 2 – 1-2 years old, 3 – 2-3 years old, 4 –
more than 3 years old

77
The number of animals has altered the relationship of livestock to the overall production
systems and to natural resource management. In addition, changes in the natural resources
themselves have also had an impact on livestock management practice. Each parameter has its
importance in the herd, the differences between age and sex groups explain the importance of
livestock on their livelihood based on market demand and products consumption. As shown in
Table 4.2 and 4.3, herd compositions of the households indicate that there were more female
animals than male. The higher numbers of female cattle reflect with the major reason for
keeping cattle, which is milk production for self-consumption, selling in the market and using
dung as winter fuel. In case of other species, they have more female in order to increase herd
size and to sell live animals to augment household income. There was unclear impression,
whether livestock population is increasing or decreasing at household level. For this purpose,
the households‘ own perceptions of changes in their herd sizes during 2005-2010 were studied
in both VGs, and this shows a great variation (Table 4.4). The result shows that, in general,
the total livestock population increased by 65% BVG and 63% households in BVG and MVG
respectively.
Table 4.4 Households‘ perception in herd-size change during 2005-2010
Change
in LS
numbers
In general By species
Cattle Sheep Goat Horse
BVG MVG BVG MVG BVG MVG BVG MVG BVG MVG
Less 7 14 32 17 9 27 47 3 5 11
Same 24 16 52 25 36 22 9 18 39 28
More 65 63 14 48 55 49 34 62 7 35
No def.
answer
4 7 5 10 5 2 10 17 49 26
Source: Field survey, 2010
Majority (62%) of the sampled HHs in MVG perceived that there is increase in goat numbers.
Similarly, 48% of sampled HHs experienced increase in cattle in MVG, whereas, in BVG,
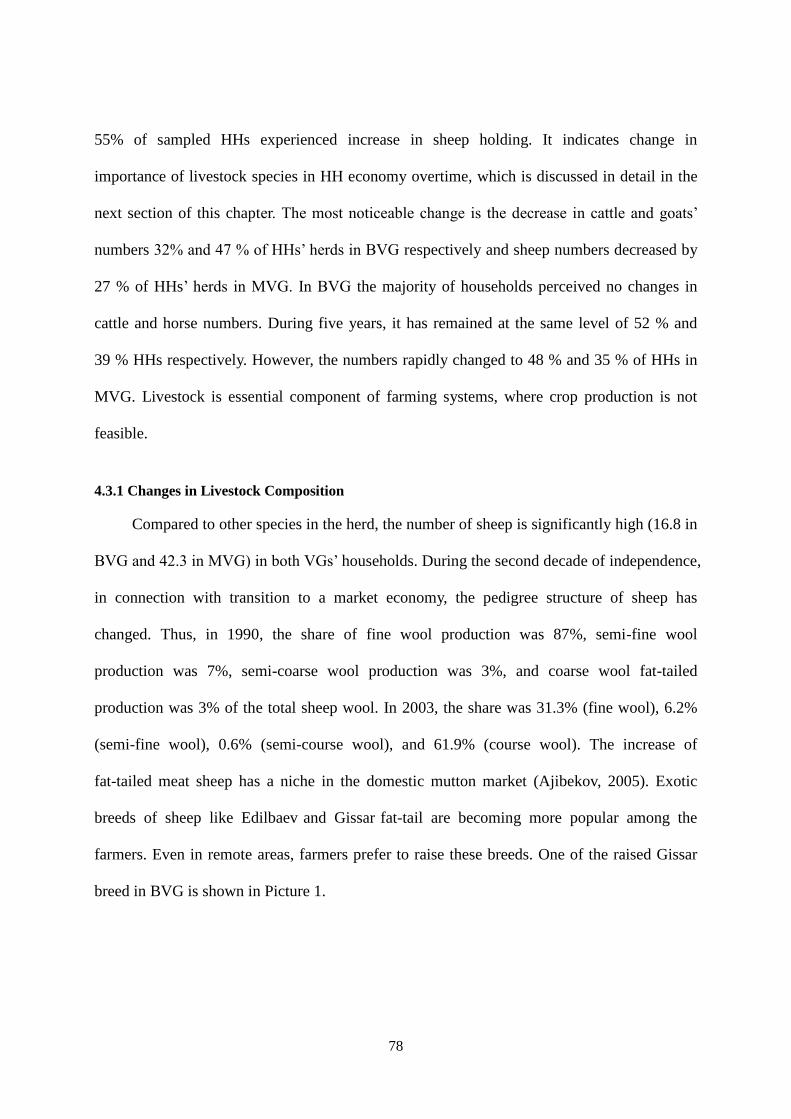
78
55% of sampled HHs experienced increase in sheep holding. It indicates change in
importance of livestock species in HH economy overtime, which is discussed in detail in the
next section of this chapter. The most noticeable change is the decrease in cattle and goats‘
numbers 32% and 47 % of HHs‘ herds in BVG respectively and sheep numbers decreased by
27 % of HHs‘ herds in MVG. In BVG the majority of households perceived no changes in
cattle and horse numbers. During five years, it has remained at the same level of 52 % and
39 % HHs respectively. However, the numbers rapidly changed to 48 % and 35 % of HHs in
MVG. Livestock is essential component of farming systems, where crop production is not
feasible.
4.3.1 Changes in Livestock Composition
Compared to other species in the herd, the number of sheep is significantly high (16.8 in
BVG and 42.3 in MVG) in both VGs‘ households. During the second decade of independence,
in connection with transition to a market economy, the pedigree structure of sheep has
changed. Thus, in 1990, the share of fine wool production was 87%, semi-fine wool
production was 7%, semi-coarse wool production was 3%, and coarse wool fat-tailed
production was 3% of the total sheep wool. In 2003, the share was 31.3% (fine wool), 6.2%
(semi-fine wool), 0.6% (semi-course wool), and 61.9% (course wool). The increase of
fat-tailed meat sheep has a niche in the domestic mutton market (Ajibekov, 2005). Exotic
breeds of sheep like Edilbaev and Gissar
fat-tail are becoming more popular among the
farmers. Even in remote areas, farmers prefer to raise these breeds. One of the raised Gissar
breed in BVG is shown in Picture 1.

79
18
Picture 1 Gissar breed ram and lambs in BVG taken by author in August 2010
Gissar breed adapts to mountain conditions well. Lambing usually takes place in a year giving
total of 2-3 lamb birth, which in case of earlier breed was 1-2 lamb. Thus, a wide adoption of
this breed is one of the reasons for the faster increase in livestock numbers and also higher
profit from selling live animals.
Historically, goat breeding has been a traditional sector of the animal husbandry in the
country (Alymeev et al., n.d.). Large areas of semi-arid and steppe type of remote natural
pastures also promoted goat breeding during the Soviet time, especially in Batken and
Zhalal-Abad provinces for producing wool and down. In MVG, Angora, Cashmere and local
breeds are common, while in BVG, milking goats and hybrid Saanen (Zaanen) breed are
becoming popular (DADD,2010). During the interviews, most households from MVG
informed that goats‘ number is increasing in their herd. Less cropland area and easy access to
common property pastures, well-adapted to harsh climate conditions and natural resource
based fattened feeding systems make the goats more preferable. Goats are easy to feed, thus
require less labour and forage. In addition, they give two kids in a year. Goats, as an asset, can
be easily sold in the market at the time of urgent household needs, fertilisers, fuel and
veterinary treatments. High number of animals is an additional income source that can help to

80
perform other socio-cultural functions, as well as nomadic people‘s cultural activities and
ceremonies related with livestock.
A goat promotion project organised in Ala-Buka district by district and local
administration and two breeding farms initiative in 2001-2005, called ―An Iron Goat‖, is
helping to increase the number of goats in the study area, in particular, and, as a whole, in the
country. Under the ―An Iron Goat‖ program, 2-3 goats are provided to poor households in
VGs through local administrations. After a year, when those goats give birth, kids become
their own, goes should be given to other families identified as poor by the program. Less feed
requirement and relatively easy rearing practice make goat raising well accepted by poorer
HHs. In addition, a higher demand for goat milk makes goat popular among poor. However,
there is a growing concern that whether increasing numbers of goats is an indication of
increasing rural poverty. Thus, there is future uncertainty that cattle will be replaced by goats
in rural areas.
Majority of these HHs retain their cattle in near-village pastures all year round, which
leads to overgrazing near-village pastures. Households increase cattle numbers in their herd in
order to increase additional cash income through increased production because ability and
probability of market participation by farmers will be reduced significantly as the small
quantities of milk from local cows are inadequate to save time and labour necessary to reach
market. HH sells dairy products to intermediary women buyers of dairy products who
significantly increased in BVG because of low price of dairy products in the market. The
price paid is almost equal to transportation cost. Besides, it also requires extra labour for
handling and is time consuming. Intermediaries buy dairy products from farmers owning 1-2
cows in lower price than market as they have small quantities of milk (daily 5-6 litres milk,
excluding self-consumption) or dairy products. In case of MVG, livestock holders and

81
livestock producers are generally scattered in remote rural areas and summer pastures that are
often characterised by inadequate access to roads and transportation facilities. HHs increased
cattle number due to transhumance movement to summer pastures where dairy products can
be increased with sufficient forage. They prefer bulky sell of dairy products not raw milk and
without intermediaries. HHs and pastoralists accumulate products during summer and sell in
late autumn or winter, when the demand for dairy products and consequently the price is high.
Almost all HHs have at least one donkey in both VGs, while horse is owned by few
households. Horse is kept by well-off households. Since it requires more forage and extra care,
it cannot be affordable to all households. Horse and donkey provide draft power, which is
important in farming activities. The attributes of draft animals are subsidiary for agricultural
machines; plugging and threshing the land, transporting the physical products,
income-employment gain (services to other farmers) and socio-cultural (nomadic culture,
having a horse) and ecological services. Beside these, abandoned or no roads for truck in
remote pastures enhanced the use of donkeys and horses as main transport during
transhumance. Is this Rural Poverty or Low Carbon Agriculture? Agricultural machines
vs. Livestock; the reason of increasing number of horses and donkeys can be an indication of
advanced rural poverty (to avoid extra expenditure for tractor services, fuel and payments,
they prefer to use livestock). On the other hand, the increased use of livestock for agriculture
decreased the number of agricultural machines, thereby reducing GHG emissions leading to
low carbon agriculture. This will help to mitigate the adverse impact of global warming on
human beings as well as environment.
4.4 Social and Economic Issues Associated with Livestock Production
This part of study focuses particularly on households‘ perceptions of animal husbandry.

82
However, the interpretation and generalisations of herd sizes must also consider factors other
than altitude and accessibility, such as fodder and pasture resources, grazing and management
traditions, and off-farm influences (Wright et al., 2005). What is less well recognised is the
importance of livestock markets, and also the special constraints that such markets face in
remote areas to furthering the contribution of livestock to livelihoods. It can be explained as
Von Tunen Model; the distance from the market is the main determinant of what combination
of crops or what kind of livestock species a farmer should grow or rear and with what
intensity and density (Grigg, 1995). These changes have altered the relationship of livestock
to the overall production systems and to natural resource management. In addition, changes in
the natural resources themselves have also had an impact on how livestock are managed.
The percentage of households with different herd size categories with mixed livestock species
is given in Figure 4.9 by stratifying of households in four groups. Around 33% of HHs in
BVG falls in G1 category, where the HHs does not have any livestock, whereas the figure is
only 23% in MVG. These HHs‘ main income sources are farming, wage and off-farm
employment. This is one of the reasons of change in livestock numbers, livestock holding
increase with decrease in cash crop and via versa. In BVG, a significantly higher proportion
(38.3%) of HHs falling under G2 category hold 1-20 mixed livestock numbers compared to
MVG with only 5.8%. Usually, HHs in this group keep a 5-10 sheep or goats or 1-2 cattle, or
one horse. Majority of animals are kept under stall-feeding during morning and evening
providing crop residue and weeds from cropland or HH plot, whereas during day time, they
are grazed in near-village pasture. HHs under this category keep livestock mostly for
self-consumption of livestock products.

83
Figure 4.9 Percentage of households in different herd size categories with mixed species
Source: Field survey, 2010
Significantly lower proportion of HH (19.1%) in BVG falls under G3 category in contrast to
42.6% in MVG. The HHs in G3 category hold 20-60 livestock. In case of MVG, main
livestock species in their herd are goats and sheep. High altitude, more pastureland, less
cropland and harsh climate are important reasons of farmers‘ preference for sheep and goats
in MVG. MVG also has significantly higher proportion (28.3%) of HHs under G4 category,
which has more than 60 livestock species, compared to BVG where only 9.3% HH falls under
G4 category. For HH under G4 category, the main income is from livestock and its derived
products. Households under this category cannot get enough crop from their own land due to
lack of water during growing season and bad physics-chemical properties of soil (stony and
saline), which force HHs to increase livestock numbers to meet livelihood needs. Thus,
increase or decreases are closely interconnected with land size and soil quality. Income from
cash crop and farming can affect income from livestock (Figure 4.10). Majority (52.5%) HHs
have 0-1 ha of land in MVG, compared to 29.1% in BVG. In contrast, majority (54.1%) HHs
in BVG hold 1-5 ha of land, whereas in MVG, only 25.8% of HHs hold 1-5 ha of land.
2
6
10
14
18
22
26
30
34
38
42
46
VG Baltagulov VG 1-May
no livestock from 1-20 20-60 60 <
G1 G2 G3 G4 G1 G2 G3 G4
Nu
mb
er o
f sp
ecie
s in
her
d

84
Around 6 % of HHs in BVG own and rent more than 5 ha of land, whereas, in MVG only one
HH has such amount of land. Households generally perceived cows to be the most important
animals (Table 4.5). In general, farmers‘ perception in keeping livestock was tradition and
culture related to their nomadic history.
Table 4.5 Farmers‘ perception of the most important livestock species (% of HHs in which each
species important – multiple answer possible)
BVG Cows Sheep Goats Horses Donkey
G-2 82 36 - 12 6
G-3 67 48 14 17 12
G-4 51 57 47 24 19
MVG
G-2 78 35 39 27 16
G-3 59 45 56 35 13
G-4 28 58 66 37 25
Source: Field survey, 2010
Herd composition of the households indicate that there were more female cattle than the male;
the average proportions of male to female were about1:16 for adult cattle and 1:4 for calves
and heifers. The first proportions were higher in areas closer to district market and in large
herds in remote areas. The observed herd structure remarkably typified a smallholder dairy
production system. The higher number of cows believed to correlate with the major reason for
keeping cattle, which is milk production; G2 (95%), G3(93% ) and 87% in G4 in BVG and
G2(95%), G3(90%) and 86% in G4 HHs in MVG respectively. The next important reason of
keeping livestock was providing dung (mainly fuel for winter and partially manure for
cropping), in G2 (91%), G3 (86%) and 93% for G4 in BVG. In MVG, G2 (88%), G3 (89%)
and G4 was 92% of HHs are kept livestock for dung. Hired shepherds in near-village pastures
can sell dung, accumulated during grazing season. In recent 5 to 6 years, majority of farmers
started to use dung as fertilisers in their cropland, due to lack of chemical fertilisers. However,
they are not satisfied with only using manure in their cropland. During Soviet time,

85
households adapted to use of the maximum amount of chemical fertilisers which was easy to
purchase. Keeping livestock for meat purpose and wool purpose was higher in both VGs. G3
(48%) and 37%, G4 (69%) and 68% in BVG and G3 (35%) and 58%, G4 (40%) and 67% of
HHs in MVG responded that they keep mainly small ruminants for self-consumption and for
selling in the market under grazing based or stall-fed based fattening feeding methods. Many
households depended on animals for transport and for draft power, which is continuing to
increase. Lack of mechanisation or shortage of tractors (in the beginning of the growing
season and during harvesting season) or high expenditure for using them are making draft
animals more important at households.
The share of income from different income sources by income groups show the
importance of the livestock sector for different income groups (Figure 4.10). Income sources
differ significantly among the groups. Farming and cash crop together constitute the largest
share of income among the households falling under G1 category in both VGs; BVG (41%)
and MVG (40%). Potato and sun flower are the most important cash crops grown in the study
area. HHs under G1 category do not have any income from livestock. Other important sources
of income for this group are wage labouring followed by off-farm employment and others.
Other sources of income include hay, forage crop (lucerne), wheat straw and maize stover
trading, selling honey, non-wood forest products, such as fruits and medicinal plants. For all
income groups, maize and wheat are too important crops cultivated under farming. Both of
these crops are multipurpose crops used for human consumption (grain) as well as livestock
consumption (crop residue and grain as basic and supplementary feed). For HHs falling under
G2 group farming (farming and cash crop) is still an important source of income contributing
44% of the total income in BVG. However, for household in MVG, livestock constitute the
highest share (41%), followed by crop and cash crop farming.
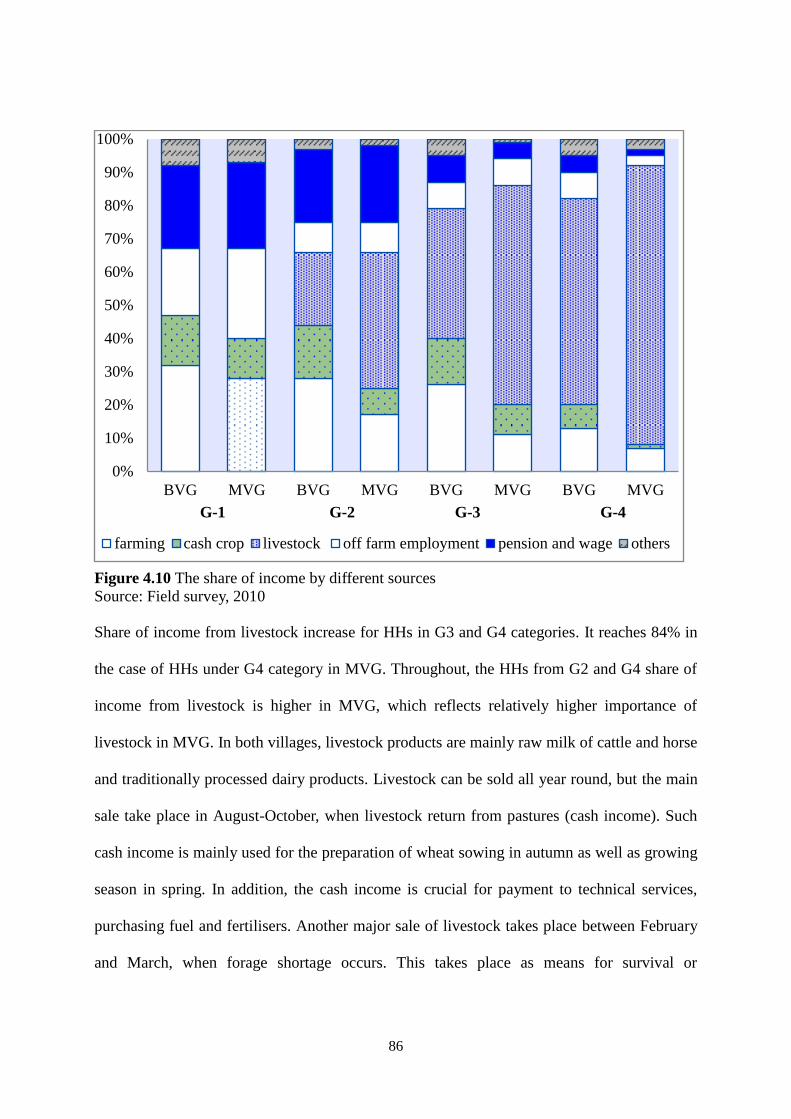
86
Figure 4.10 The share of income by different sources
Source: Field survey, 2010
Share of income from livestock increase for HHs in G3 and G4 categories. It reaches 84% in
the case of HHs under G4 category in MVG. Throughout, the HHs from G2 and G4 share of
income from livestock is higher in MVG, which reflects relatively higher importance of
livestock in MVG. In both villages, livestock products are mainly raw milk of cattle and horse
and traditionally processed dairy products. Livestock can be sold all year round, but the main
sale take place in August-October, when livestock return from pastures (cash income). Such
cash income is mainly used for the preparation of wheat sowing in autumn as well as growing
season in spring. In addition, the cash income is crucial for payment to technical services,
purchasing fuel and fertilisers. Another major sale of livestock takes place between February
and March, when forage shortage occurs. This takes place as means for survival or
0%
10%
20%
30%
40%
50%
60%
70%
80%
90%
100%
BVG MVG BVG MVG BVG MVG BVG MVG
G-1 G-2 G-3 G-4
farming cash crop livestock off farm employment pension and wage others

87
subsistence. Thus, farmers are forced to sell bulk of their livestock at lower prices. This
increases the poverty. However, at the same time, it also gives new opportunity for ―new
business‖, businessmen who send those animals to summer pastures and sell those livestock
again in autumn claim higher price. This causes temporary increase in livestock holding
among the buyers.
4.5 Factors Affecting Livestock Production Systems
In agro-pastoral systems, social, economic, and environmental constraints cannot be
solved in isolation or independently. Increase in livestock population and change in
composition of herds depends on household welfare. The major problems of keeping livestock
from own experiences of households are given in Figure 4.11. Lack of fodder from the end of
winter to mid spring and pasture shortage both of which are related to feeding livestock are
perceived as the major problems by almost 50% of HH in both VGs. However, traditional and
modern private livestock management strategies have been developed to regulate herd size,
according to the available fodder supplies.
Figure 4.11 HHs‘ identification of major problems of keeping animals from their own
experiences
Source: Field survey, 2010
Forage shortage causes feed scarcity problem at the end of winter, annual feed scarcity
by month in the two VGs is given in Figure 4.12. Very serious scarcity occurs from March to
10 30 50 70 90
BVG
MVG
lack of fodder lack of labour pasture shortage skills others none

88
April in MVG, which in case of BVG, it extended till May, but with less intensity of the
problem compared to MVG. Lower score in BVG is related to pasture shortage in early spring,
which is mainly due to the early movement to pastures when grasses do not grow well.
In the case of MVG, however, forage shortage is related to less crop land areas per
household. It is 0.6 ha of irrigated land/HH in MVG compared to 1.0 ha of irrigated land/HH
in BVG. Bad condition of drainage systems or lack of water during growing season adversely
affect productivity of forage crops and cereals. Hay land is important forage source in MVG.
In remote areas, households store only hay for winter feeding which will be fed when heavy
snow occur.
Figure 4.12 The rank of annual feed scarcity problem
Source: Field survey, 2010
Note: *Feed scarcity ranks from 5 ―no problem‖ to 1 ―serious feed scarcity‖
Other times, animals will be grazed in near-village pastures or even in intensive pastures
also. This forage sufficiency mostly took place in near-village–crop land areas, after
harvesting wheat (major cereal, which grown in large areas) and continuing till the end of
harvesting other crops, side by side. In MVG, forage scarcity occurred in spring, when stored
forage was not enough, while in BVG it continued with the permanent keeping of animals
near village pastures instead of sending them to summer pasture, and this cause pasture
0
1
2
3
4
5
6
12 1 2 3 4 5 6 7 8 9 10 11
Sco
re
Months MVG BVG

89
degradation. Forage scarcity increase livestock mortality. During winter, animal will loss
liveweight and in early spring they will be weak and less resistant to cold weather. Poisonous
grass species cause high mortality in April (mostly in MVG) and in May in BVG, when
hungry animals allowed to access in pastures dominated by such poisonous grass species
(Annex 3). Poisonous grasses cannot be easily observed when that species grow with other
species. In some cases, poisoning can be observed when the thirsty livestock drink water
immediately after eating suspected poisonous plants in near-village semi-arid pastures of
BVG. During spring, very cloudy weather favours the build-up of nitrates in plants, which
cause nitrate-nitrite plant poisoning. In 1996, high mortality of animals was observed in
Chapchyma pastures in MVG, when continuous rainfall occurred, for about 41 days. During
recent years, April is becoming a rainy month. In addition invasive diseases such as foot and
mouth among cattle and brucellosis among sheep and goats increased (DADD, 2010).
Helminthic diseases increase among small ruminants with change in temperature and
humidity. In recent years, sheep mortality rose after shearing in May and early June because
of heavy rain, and the occurrence of snow in intensive pastures. This difficulty is increasing
hazard among farmers do not to send animals to intensive and remote pastures and prefer
retain near-village pastures.
There are different reasons of forage shortage; lack of land for forage making, or
growing only cash crop, which do not have forage residue (such as potato and sunflower) or
lack of finance for purchasing it from the market in winter, when the price reaches the higher
levels. Beside, two of these factors, there are other factors that cause forage shortage. Time
shortage for forage storage is the main problem that leads to forage shortage in both VGs. A
quarter of HHs in both VGs found time shortage as the main problem. It is understandable
that lack of labour has affected time shortage for storing forage. During interviews with

90
farmers and agricultural specialists it was found that climate change impact on forage storage.
Early maturing of hays, forage grasses and forage crops such as Lucerne are caused by
increased temperature.
Figure 4.13 Main problems related to forage storage
Source: Field survey, 2010
Farmers told that mowing would be starting 15-20 days earlier than before; grasses are also
flowering earlier. In addition, the weather is becoming hotter and dryer. As a result, grasses
are maturing quickly, which reduce nutritive value of forage. Farmers had enough time for
mowing11
; collecting and transporting of hay back home, and the quality of the grass was also
valuable 7-10 years ago (pers.comm, 2010). Flowering of ‗hay mowing is time indicator‘12
Althaea nudiflora Lindl started earlier than before and there is significant change in
vegetation. Usually, flowering starts from down past of stems to up part of stems, but it can be
seen how flowering are mishmash (Picture 2).
11
During the Soviet time, hay mowing was done by agricultural machines, which in Kyrgyzstan it
was well-developed. However, at household level, mowing was done manually and it increased after
independence. 12
One of the local indigenous ethno botanical knowledge about definition of starting time for hay
mow; flowering of this grass indicates that hay is ‗ready‘ for mowing.
timeshortage
lack ofhayland
lack oflabour
highexpences of feed
problems with
transporting
lack ofstorageplace
lack ofmower
highprice
BVG 25% 14% 17% 5% 11% 9% 13% 6%
MVG 26% 19% 15% 8% 13% 11% 4% 4%
0%
5%
10%
15%
20%
25%
30%

91
Picture 2 Althea nudiflora Lindl. taken by author in August 2010, BVG
Moreover, these observations show lessen in density and quantity of forage species,
increase quantity of poisonous and low nutritive value species and shrink in the height of
forage species. During hay mowing, collecting and transporting time, heavy rains, and
hailstorms occur or most of the time, the weather is cloudy and it takes more time for hay to
dry (Picture3).
F
Picture 3 Poacea dominated hay land and occurred rain during mowing and collecting time
Taken by author in August 2010, BVG
According to climate condition and vegetation, hay content is mainly Poacea spp; in such
kind of weather condition increase nitrate-nitrite poisoning13
of animals (Annex 3). Mostly,
13
Nitrates and nitrites are closely linked to the causes of poisoning. When feed containing nitrate is
eaten by ruminant animals, nitrate is converted to nitrite, and then to ammonia, by rumen microbes.

92
hay is stored in open place, which diminishes quality and quantity of forage. Early movement
to pastures has negative impact on vegetation period of plants and preliminary degradation of
pastures and pasture shortage problem in terms of less availability of palatable species. Such
kind of changes in cropland, mainly during wheat harvesting time, cause more problems to
farmers; continuously occurring rain increase weeds in matured wheat crop areas and create
difficulties for combine-harvesters. Farmers‘ lost almost half of their crop yield and the
quality of cereal worsened due to seeds of weeds which require more labour in cleaning them.
The next most important factors that households identified was lack of labour (21% of
HHs in MVG and 14% in BVG) and time for herding animals during transhumance
movement. This factor is met by reducing the herd size by keeping more animals permanently
near-village pastures. Poor or lack of skills (10% of HHs in MVG and in BVG 14% of HHs)
in animal husbandry, especially lack of information in interconnection of producer-consumer
chains had caused some problems with inappropriate composition of animals in the herd.
Farmers had difficulties with the treatment of suddenly occurred contagious diseases among
livestock species, mechanical damages, and the invasion of some helminthic worms and other
parasites. About 90%of the farmers practiced uncontrolled breeding of all livestock species;
other 10% of farmers use selective natural breeding (Not artificial insemination (AI) at all).
The proportion of breeding male stock (bull, ram, and stallion) was low in village herd. Most
farmers did not keep breeding male animals. They mainly purchased bull as common village
property and at the end of the grazing season (in autumn) it will be sold out and replaced in
spring. And in some cases, farmers hired breeding stock from their neighbouring households
Non-ruminant animals are unable to do this. Factors which cause nitrate to accumulate in the plant
include drought, cloudy or cold weather. Hays made from cereal crops, especially those grown under
drought conditions and cut while ‗sappy‘ can develop toxic nitrite levels when they heat up. Oaten hay is
particularly risky and becomes poisonous if previously dry hay is dampened by rain or snow some time before
feeding out (Sarah Robson, 2007).

93
to serve their cows. The fact that few farmers or households owned breeding stock implies
that these animals increase inbreeding levels of population. Furthermore, most of the breeding
stock would be unknown pedigree, without systematic breeding. The skill of farmers in these
issues is very important to avoid unfavourable long-term effects of productivity and genetic
quality of livestock. Other reported problems include unfavourable weather, such as sudden
snow during spring and summer, heavy rain after shearing of animals and diseases. These
problems are of minor importance, but are more relevant during grazing time in summer
pastures.
4.6 Livestock Feeds, Feeding Methods and Derived Productivity
Livestock production in Kyrgyzstan is based on transhumance system. During summer,
livestock move up to alpine pastures by free grazing. In winter, mainly livestock fed with
stored forage during growing season by stall-feeding and partial grazing in near village
pastures. Availability of all year round feed is one of the most important factors in the
livestock production. During the Soviet time, Lucerne (Medicago sativa) and Sainfoin
(Onobrychis viciifolia) were extensively cultivated in Kyrgyzstan (were mechanically mown
and baled, one of the main factories manufacturing hay balers in the USSR was in
Kyrgyzstan), and was a major seed producer of Lucerne (Fitzherbert, 2005). Silage making
(mainly green maize, but also Lucerne and grasses) was common, associated with the
production of dairy and beef cattle. Barley was widely grown as a fodder and cereal crop in
the lower valleys, sugar beet in the North was grown for dairy cattle, cotton cake was in the
South as supplemented feed for all ruminants. Supplement feed imports amounted to about 1
million tons of feed grain a year (van Veen, 1995). Hay is major winter roughage. It comes
from two sources: natural meadows (community source) and sown and irrigated forage (the

94
property of the individual farm or farmer). After independence, forage crops and cereals
grown areas declined and were replaced by other cash crops as shown in Figure 4.14. Data
comparisons of 1991-1997-2007 show that there are pronounced changes in the structural
development of areas under cultivation. Areas planted with forage crops have reduced
considerably from 48.5% in 1990 to 18 % in 2006, and areas planted with cotton, potatoes
and oil plants crops have markedly increased. Forage crops area declined from 641,427 ha to
248905ha in 1990-2009. Area of cultivated cereals increased from 537,351 ha to 654,532 ha
(in 1997 it reached to 683489 ha). Cash crops‘ area increased from 53,129 ha to 137,205 ha
during 1990-2009 (NSC, 2010).
Figure 4.14 Percentage of changes in cultivated area of major crop varieties in 1991, 1997
and 2006 in Kyrgyzstan
Source: MAWRPI, 2007 Note: Others include main cash crop varieties such as cotton, tobacco, oil plants
One of the reasons in increasing cereals (wheat) area is farmers‘ multipurpose preference
in crop species and for self-consumption and crop residues (straw, bran and residue from
cleaning of seed) for winter feeding of animals and surplus seed and straw for selling as
additional income. Forages, whether grazed or hayed, supply the major source of nutrition for
0
1
2
3
4
5
6
7
8
9
10
2
12
22
32
42
52
62
1991 1997 2006
Pota
to
Fora
ge
crops,
cer
eals
and o
ther
s
Forage crops Cereals Others Potato

95
livestock. The stall-feeding and grazing habits of sheep and goats differ from traditional
livestock production and they can be incorporated into the grazing systems for cattle and
horses (Figure 4.15). Goats tend to browse more while sheep tend to graze. Animals offer an
alternative to utilizing forage and vegetation which is otherwise "wasted‖ (Lemus et al., 2008).
These types of habit are very important in mixed herds which are applicable in majority of
households. Composition of herd can be preferred by eating habit of animals. Feeding with
weeds mainly apply to retained animals (mostly to cattle and sheep) near-village pastures
during summer; in the evening, when they return from pastures, animals will be fed with
weeds collected from household plot or crop land.
Figure 4.15 Dietary preferences of different livestock species
Source: Lemus et al., 2008
As shown in Figure 4.15, horses prefer more grass, which is suitable for all year round
grazing and in winter they also feed on selective roughage and grains. This suggests that all
households cannot afford to keep horses in their herd. Donkeys are fed with residue (60% of
HHs in MVG and 54% of HHs in BVG) from other animals fodder and some mix roughage.
Presented in Table 4.6 are the feed composition, feeding methods, ratio, surplus and
deficit for stored feeds, and classes of animals feed reduced at overwintering time.

96
Table 4.6 Feed types and availability, feeding methods and ratio and classes of animals feed reduced
Parameters Parameters BVG MVG Aggregate
Feed
composition,
Roughage
Wheat straw 38 14 26
Maize stover 21 26 23.5
Lucerne 11 29 25.5
Hay 12 26 19
Other crops‘ stalk 18 5 11.5
Grain feed
Maize 25 36 30.5
Wheat residue (chary) 17 9 13
Wheat bran (kevek) 28 9 18.5
Barley 6 13 10
Cottonseed 3 15 9
Oil plant residue 15 13 14
Concentrate 6 5 5.5
Other
supplements
Vitamin, minerals 11 16 13.5
Feeding types Ground (chopped) 32 34 33
Whole 48 46 47
Feeding methods
Grazing 23 68 45.5
Grazing +stall feeding 47.8 26.6 37.2
Stall feeding 28.2 5.4 16.8
Feeding ratio
Maintenance 60.4 69.7 65
Production 33.6 27.3 30.4
Balanced 5 3 4
HHs with surplus
and deficit of
forage
Surplus 58.7 21.5 40.1
Barely deficit 28.5 39.6 34
Deficit 12.7 38.9 51.6
Classes of
animals reduced
feed during feed
scarcity period
Cattle (Heifers) 40(36) 17 28.5 (26.5)
Sheep and goats 23 53 38
For all 37 30 33.5
Source: Field survey, 2010
On average, in all HHs, stored roughage at the end of autumn season included wheat straw
(26%), maize stover (23.5%), Lucerne (25.5%), hay (19%), and other crop stalks (11.5%).
The types of accumulated roughage in both VGs were generally similar. However the
proportions differed in case of wheat straw, Lucerne, crop residues and hay. In BVG, HHs
stored 24 % and 13 % more wheat straw and other crop residues (such as bean, pea), whereas
18 % and 14% more Lucerne and hay were stored in MVG. According to nutritive value of
feeds, Metabolise energy (ME) and crude protein (CP) content play important role in feed
composition; whereas in both VGs it was observed a lower percentage of high ME and CP

97
content roughages, such as Lucerne and hay, which suggested low nutritive value of roughage
in both VGs. On average stored feed grains, fed as concentrate and mixed grains, included
maize (30.5%), wheat residue, locally name chary, residue after cleaning of wheat seed (13%),
Wheat bran, locally name is kevek, residue after milling of wheat flour (18.5%), barley (10%),
cottonseed, locally name is kunjara (9%), oil plant residue, seed residue after squeezing oil
(14%) and concentrate, mixed grain flour (5.5%). Maize (36%) was main grain feed in MVG,
whereas in BVG wheat bran (28%) was dominated feed type. In both VGs, observed that
main percentage of grains came from wheat, maize and sunflower crop residues, as well as
they grown as multipurpose crops. Other supplements, such as vitamins, minerals and salt are
purchased and they were given only by 11% HHs in BVG and 16% HHs in BVG, while salt
was purchased by all HHs in both VGs. Types of feeding ground (for grain), chopped (for
roughage) and whole depends on HHs welfare. Forty eight per cent of HHs in BVG and 46 %
HHs in MVG fed whole roughage and grain because this type of feeding requires labour, time
and payment.
A vast majority of the HHs in MVG (68%) depended on grazing, which this type of
agro-pastoral system characterized by whole year round grazed with low or no inputs to
livestock production systems. In BVG, majority of HHs (47.8%) fed their animals under dual
feeding: grazing and stall feeding. HHs graze their stock from April to October day time and
feed with crop residues or weeds from HH plot and cropland in the evening, after returning
from near-village pastures to increase milk production. Feeding in the morning depends on
grass availability in the pastures and livestock classes. For example lactated cows usually in
summer feeds in the morning and in the evening (because days are longer). On the other hand,
stall feeding for all animals is between late November and March due to climate condition.
Stall feeding was observed in G2 category HHs, and it is higher in BVG HHs (28.2%),

98
whereas in MVG is 5.4%. With this method, mainly fattened animals such as castrated, male
and old animals are sold as additional income and replaced with younger ones. There are also
popular many traditional methods of cooking and making supplementary feed Atala – boiled
feed, consists of a mixture of wheat bran, maize flour, sunflower seed residue, salt and water.
Usually prepared during winter feeding time and mostly feeds lactated animals. Tert – soaked
wheat straw or some woody hays in warm water (20-30 minutes before feeding) or in cold
water (7-10 hours) after that mixed with wheat bran or maize flour. Prepared with maize flour
contents more nutritive value than with wheat bran; this is also prepared during winter time
for lactated animals; cows, ewes, goats and also fed all small size herd (1-20). Shor tokoch -
salty cake, baked like bread. It is a mixture of wheat, maize flour (sometimes barley flour)
with salt and water. Mostly fed fattening animals: castrated (wethers, steers), young ram
lambs, old animals.
Majority of HHs in BVG (58.7%) responded that they have enough feed for
overwintering of their herd, whereas in MVG, only 21.5% HHs had stored feed surplus. This
percentage belongs to HHs of G2 category, where G3 category has barely deficit (in BVG
28.5% and 39.6% in MVG) while G4 HHs suffer from deficit of stored forage shortage.
Deficit of feed forced HHs to reduce the amount of feed by classes of animals. Reduction
percentage was higher in cattle number in BVG (40%). From this, 36% is for heifers, whereas
in MVG 38% was for small ruminants. Decreasing amount of feed for all animal classes was
significantly high in both VGs (37% in BVG and 30% in MVG). With these results of feeding
in both VGs, the study agrees with Tashi et al, (2000) findings from Tibet. Because of lack of
supplementary feed for animals during the winter and spring, most herders suffer a huge loss
of animals. And overstocking, combined with fragile rangeland ecosystem, parts of pastoral
areas were trapped in a vicious cycle of ―weight increase in summer – fattening in autumn –

99
loss of weight in winter – death in spring‖. This is also applicable to White et al. (1999) who
highlight about the effects of underfeeding on animal production to the condition of the study
area, that failure to meet nutrient requirements through underfeeding can adversely affect
animal production. At crucial stages of the life cycle, there can be major long-term effects.
For young animals, restricted feeding at an early age is unlikely to be compensated by higher
levels of feeding at a later stage in life, resulting in small-framed animals. It also affects
mating that failure to meet target weights at mating may result in reduced ovulation rates,
resulting in a failure to conceive or a lower proportion of multiple births. Poor feeding during
pregnancy can result in substantial weight losses by the dam, low birth weights for the
offspring and reduced milk yields in the following lactation. Excessive feeding leading to
internal fat deposition may cause difficulties during birth. Underfeeding in lactation causes
lower milk yields and poorer growth rates in suckling young. Loss of live weight in the dam
will be recovered later during lactation at the expense of milk production.
4.7 Forage Shortage Impact to Milk Production and Lactation Curve
Majority of HHs keep local breed Ala-Too meat-milk direct breed cattle. Selling raw milk
and milk products by farmers started after independence mainly as additional income source
of households. While the majority of them keep cows for self-consumption, some households
do not sell milk as they have a belief that ―white thing‖ cannot be sold. Rather they give for
free to people who need and request it. Milk productivity was analysed in 98 cows from
BVG; 178 cows from MVG‘s households. They were classified according to calving stage,
lactation length and calving season as shown in Table 4.7; 4.8 and 4.9. Lactation length varied
from 186-365 days with different stage and breed. Usually, local breed has short lactation
period (10.1% in MVG, 6.1 % in BVG) with less amount and high fat content milk (3-5 litres

100
per day).
This breed has small body shape and body condition is good fitted for mountain climate.
Majority household have meat-milk direct Ala-Too breed cows. Since most of the lactated
cows are grazed in near-village, they are bred naturally. Farmers do not care about the quality
of bulls in grazing herd. Even if it is high quality bulls; they will be over used in large size
herds.
Table 4.9 Variation in milk yield by lactation stage
Parity Average milk yield, kg Min milk yield, kg Max milk yield, kg
BVG MVG BVG MVG BVG MVG
1st 1107 1290 500 680 1810 1830
2nd
1402 1643 540 750 2000 2606
3rd
1255 1396 530 710 2640 2940
4th 1751 2069 1210 960 2650 2911
5th 1205 1955 784 1410 1470 2660
6th 1614 1658 730 685 2760 2650
Source: Field survey, 2010
These issues can be one of the reasons of decreasing milk productivity in the district.
Main percentages of lactation length are from 279-305 days in both VGs. In MVG, 13 cows
Table 4.7 Variation in cows‘ number by lactation length
VGs Total
cows‘
number
Lactation days
186 227 248 279 305 330 365
MVG 178 18(10.1) 24(13.4) 28(15.7) 32(17.9) 49(27.8) 14(7.8) 13(7.3)
BVG 98 6(6.1) 11(11.2) 28(28.6) 27(27.6) 23(23.4) 3(3.1) -
Total 276 24(8.7) 35(12.6) 56(20.2) 59(21.4) 72(26.3) 17(6.1) 13(4.7)
Source: Field survey, 2010
Note: Figures in the parenthesis indicate percentage
Table 4.8 Variation in number of cows by calving season
VGs Total cows‘
number
Parity (calving season)
spring summer autumn winter
MVG 178 80(49.7) 23(12.9) 31(17.5) 34(19.7)
BVG 98 26(26.7) 3(3.1) 8(8.1) 55(62.1)
Total 276 106(44.3) 26(9.4) 39(14.1) 89(32.2)
Source: Field survey, 2010
Note: Figures in the parenthesis indicate percentage

101
or 7.3% of 178 cows have 365 days of lactation lengths, which can be milked all year round
from current calving to the next one. BVG has significantly higher proportion of cattle with
lactation length of 248 and 279 days, whereas MVG has significantly higher proportion of
cow with lactation length of 305 days. The total average milk yield varies from 1107 kg to
2069 kg by parity (Table 4.9). The lowest milk yield was at 1st parity in both VGs (500kg and
680 kg respectively). The highest milk yield quantified in 4th
parity in BVG (2650 kg) and 3rd
parity in MVG (2940 kg). The amount of milk yield depends on breed quality, parity and
calving season. All these factors effect with feed sufficiency in winter and in summer are
shown in Figure 4.16. According to Table 4.8, the number of cows in spring calving season
was significantly high in MVG, 80 or 49.7 % of total number, while in BVG it shows high
number in winter calving season 55 or 62.1 % of total numbers respectively. This was because
of natural breeding; when cows gain enough live weight and have good condition score. For
example, if the calf was born in April, insemination was in August, when enough grass is
available. On the other hand, farmers usually keep two cows with different calving season to
supply milk and milk products all year round. Number of cows in summer and autumn
calving is lower in both VGs, even though they have significant positive changes in lactation
curves (Figure 4.16). The lactation curves are very sensitive in winter and autumn calving in
MVG, in winter and summer in BVG. Higher decrease in milk yield observed in these
seasons affects the total milk production at local and district level with assessment in forward
to all cows as low productive. These points concluded that BVG‘s HHs are more suffering
with ‗low productivity‘ by dominating cows number in winter calving while similar issues
observed in MVG by dominating spring and autumn calving. On the other hand the majority
numbers of cows belonging to those calving season suffered from forage shortage.

102
Figure 4.16 Forage effect on seasonal lactation curve Source: Field survey, 2010

103
4.8 Wood’s Model: Factors Affecting the Lactation Curve of Cows
Data used were obtained from a total of 98 mixed-breed herds under conditions varying
from a smallholding herd in BVG. The proposed model is reasonable and appropriate for a
complete description of lactation trends of individual cows based on monthly test-day milk
yield data. Variations in the shape of the lactation curve (LC) for dairy cows are believed to
stem from both genetic and environmental factors (Wood, 1969). Wood (1969) inferred that
the suitability of empirical models of the lactation curve does not depend on the mathematical
form of the function alone, but rather more on the biological nature of the lactation. Seasonal
patterns in pasture availability, for instance, are a major environmental factor contributing to a
typical lactation that cannot be adequately described by standard models. Of particular
significance are animals in agro-pastoral production systems in BVG, where farmers are
largely constrained in terms of management, lack of supplementary feeds, diseases and
seasonal forage shortages. Lactation curve represents the relationship between milk yield and
time after calving. In dairy cattle, milk production typically rises to a peak between 2 to 8
weeks post-partum and steadily declines thereafter (Wood, 1969; Kamidi, 2005). The lactation
curve technique is often used to estimate lactation yield, expected time of peak milk
production, peak milk yield, and persistency of yield and this is useful for managers of cows
in culling low milk producers and in planning for feed and farm resources (Anwar et al.,
2009).
This study focuses on peak yield, persistency and lactation yield that are clearly the
parameters of major interest in individual lactation curves. The study intends to use Wood‘s
model (Gama model) to estimate parameters of the lactation curve and analyse the influence
of some determining variables on the parameters of the lactation curve in BVG.

104
4.8.1 Empirical Strategy
The empirical technique employed for this study is based on the gamma function Wood model
(1967) as follows:
𝒀𝒏=𝜷𝟎𝒏𝜷𝟏𝒆−𝜷𝟐𝒏 (1)
Where 𝑌𝑛 is the average monthly milk yield in month n, 𝛽0 is the scale parameter (Initial
milk Yield),𝛽1 and 𝛽2 are the shape parameters of the curve, for the increasing and
decreasing phases of the curve respectively.
The gamma model is transformed logarithmically into a linear form as follows for least
squares regression analysis:
ln(𝒀𝒏)=ln𝜷𝟎+𝜷𝟏ln(n)-𝜷𝟐n (2)
Ordinary Least Squares (OLS) estimates of constant𝛽0, coefficients 𝛽1 and 𝛽2 from above
equation can be used to calculate time to peak milk production, time to peak production and
the persistence of the yield curve. Time to peak milk production is calculated by using the
ratio of 𝛽1 and 𝛽2 coefficients whereas peak milk yield and persistence of the yield curve
are estimated using the following formulas:
Peak Milk Yield14
: 𝜷𝟎(𝜷𝟏/𝜷𝟐)β1
exp(-𝜷𝟏) (3)
Persistence: [(𝜷𝟏+1)*ln𝜷𝟐 (4)
The above-mentioned features of the lactation curve are further analysed by lactation stage,
lactation length, months of calving and the season of calving. The study to analyse the shape
of the lactation curve in Kyrgyzstan takes into consideration four main variables. They are the
parity, month of calving, season of calving and lactation length. Number of cows used for this
14
The exponential function is used to model a relationship in which a constant change in the
independent variable gives the same proportional change (i.e. percentage increase or decrease) in the
dependent variable. The function is often written as exp(x), especially when it is impractical to write
the independent variable as a superscript.

105
study has been categorized based on the stage of lactation (Table 4.7 and 4.8.). The mean milk
yield for all cows was of 1358.65kg and the standard deviation is 522kg.
Apart of parity, other factors considered are month of calving (month a calf is delivered),
season of calving (season a calf is delivered) and the lactation length (duration of lactation
from beginning to the end of calving) (Table 4.10).
Table 4.10 Descriptive Statistics of Lactation Data & Determining Factors of Milk Yield Curve
Parameters N Mean Standard
Deviation
Minimum Maximum
Milk Yield 89 1358.65 522.74 540 3090
Parity 6 - - 1 6
Calving period 12 - - 1 12
Calving season 4 - - 1 4
Lactation Length 5 8 1.58 6 10
Calving months were grouped into 12 periods, running from January to December. There
were four seasons and they are winter (December to February), spring (March to May),
summer (June- August) and autumn (September-November). The lactation lengths were
grouped into five (5) categories comprising cows with lactation length of up to six (6) months.
The overall least squares mean lactation yield for cows was 1,239.02 kg with a standard
deviation of 105.43 kg. The mean lactation length was 8 months with a standard deviation of
1.58 months. The overall estimates for initial milk yield (𝛽0), inclining slope (𝛽1) and
declining slope (𝛽2) were 175.084 (1.040), 0.946 (0.081) and 0.317 (0.021) respectively with
standard errors enclosed in parenthesis. All of the parameters of the lactation curve are
significant at 1%. The R-squared for the transformed logarithmic gamma function is 0.27. The
estimated lactation curve together with actual curve is shown the Figure 4.17. Both actual and
predicted monthly milk yields increase to reach a peak within few months and, thereafter,
decline over several months, which is the defining characteristic of lactation curves. Over the
entire duration of lactation, the predicted lactation yield curve lies below the actual lactation
yield curve, indicating that the predicted milk yield underestimates actual milk yield of all

106
cows considered under this study.
Figure 4.17 Overall actual and predicted lactation curves of cows
4.8.2 Parity
Table 4.11 shows the values of initial milk production ( 𝛽0 ), the inclining coefficient
of the lactation curve (𝛽1) and the declining coefficient (β2) from first parity to sixth together
with their standard errors (se). Initial milk yield, inclining coefficient and the declining
coefficients are highest among fourth stage calving. The lowest initial milk yield was,
however, observed among first parity cows. Both the inclining and the declining coefficients
are lowest among parity six (6) cows. All the parameters of the lactation curve by parity are
all significant at 1%. The R-squared for the transformed logarithmic gamma function is 0.24.
Table 4.11 Main model least squares mean lactation curve constants for cows with different parity
Parity 𝛽0 𝛽0se 𝛽1 𝛽1se 𝛽2 𝛽2se
Overall 175.084*** 1.040 0.946*** 0.081 0.317*** 0.021
By parity
1st 149.249*** 1.072 1.118*** 0.155 0.370*** 0.043
2nd
161.400*** 1.091 0.791*** 0.177 0.252*** 0.045
3rd
153.697*** 1.086 0.870*** 0.172 0.284*** 0.045
4th 253.168*** 1.089 1.496*** 0.175 0.501*** 0.045
5th 188.949*** 1.130 0.807*** 0.258 0.313*** 0.068
6th 227.955*** 3.096 0.715*** 0.226 0.265*** 0.059
***- significant at 1%

107
4.8.3 Calving Season
Various seasons had differing impact of the parameters on the lactation yield curve (see
Table 4.12). Initial milk yield was highest among autumn season calving and lowest among
spring calving as shown in Table 4.12. The inclining slope was highest among summer
calving and lowest in winter. The declining slope was highest in summer but lowest in
winter and spring. This implies that the lactation curve for winter calving is flatter and
lactation lasts over longer duration as compared to other calving season. The R-squared for
the transformed logarithmic gamma function is 0.31.
Table 4.12 Main model least squares mean lactation curve constants for cows with different calving
season seasons 𝛽0 𝛽0se 𝛽1 𝛽01se 𝛽2se 𝛽2se
Winter 197.98*** 1.05 0.98*** 0.11 0.32*** 0.03
Spring 141.33*** 1.06 0.99*** 0.13 0.32*** 0.03
Summer 187.20*** 1.17 1.19*** 0.37 0.45*** 0.11
Autumn 238.90*** 1.15 1.10*** 0.33 0.43*** 0.09
***significant at 1%
4.8.4 Calving Period
Initial milk yield is highest in May calvers and lowest among July calvers (Table 4.13).
Table 4.13 Main model least squares mean lactation curve constants for cows with different calving
period Calving Month 𝛽0 𝛽0se 𝛽1 𝛽1se 𝛽2 𝛽2se
January 187.237 1.068 0.990 0.133 0.319 0.034
February 170.421 1.103 0.970 0.207 0.321 0.055
March 131.370 1.074 0.985 0.146 0.310 0.038
April 170.595 1.184 1.491 0.418 0.528 0.130
May 245.987 1.141 1.225 0.300 0.500 0.083
June 193.545 1.249 1.835 0.613 0.823 0.217
July 110.114 1.236 1.245 0.501 0.375 0.144
August 176.582 1.142 1.439 0.315 0.491 0.091
October 207.341 1.170 0.975 0.364 0.395 0.105
November 206.525 1.254 1.269 0.506 0.393 0.141
December 132.815 1.128 0.947 0.249 0.327 0.065

108
The inclining slope is steepest in June calvers and lowest among December calvers. The
declining slope was highest in June and lowest in March. No clear pattern has emerged in
analysing the lactation curve by the month of calving. The R-squared for the transformed
logarithmic gamma function is 0.57.
4.8.4 Lactation Length
The initial milk yield increased with lactation length, reach its maximum at lactation
length of 244 days and begin to fall (see Table 4.14). The inclining slope is highest in
lactation length of 215 days and lowest in lactation length of 305 days. The declining slope is
highest in lactation length of 215 days and lowest in 305 days. This implies that the lactation
curve is flattest in the case of lactation length of 305 days, and lactation lasts over a longer
duration as compared to other lactation lengths. The R-squared for the transformed
logarithmic gamma function is 0.45.
Table 4.14 Main model least squares mean lactation curve constants for cows with different lactation
length
Lac length 𝛽0 𝛽0se 𝛽1 𝛽1se 𝛽2se 𝛽2se
186 days 163.32*** 1.15 1.42*** 0.38 0.58*** 0.13
215 days 185.01*** 3.15 1.60*** 0.38 0.60*** 0.12
244 days 222.84*** 1.06 1.51*** 0.13 0.55*** 0.04
273 days 179.21*** 1.06 1.18*** 0.13 0.39*** 0.03
305 days 73.02*** 1.08 1.07*** 0.15 0.3*** 0.04
***significant at 1%
4.8.5 Results and Discussions
Milk production is largely dependent on the shape of the lactation curve. Relevant
elements of the lactation pattern are the peak yield, which represents the maximum milk yield
during the lactation, and the lactation persistency, which expresses the ability of animals to

109
maintain a reasonably constant milk yield after the lactation peak. Thus, cows with persistent
lactation tend to have flatter lactation curves. Parity had a significant effect on lactation
parameters. Calvers with high initial milk yield tend to have higher peak milk (see Table 4.15).
In general, higher parity cows, on average, tend to have shorter time to peak milk and weak
lactation persistence as compared to low parity calvers. For instance, fourth parity calvers
have highest initial milk and peak milk, but time to peak and lactation persistence are low,
implying the higher parity calvers are relatively inefficient.
Table 4.15 Changes in initial and the peak milk yield with time and lactation persistency by parity
Parity Initial milk Peak milk Time to peak Persistence
1st 149.249 167.86 3.02 (0.91)
2nd
161.400 181.06 3.14 (1.07)
3rd
153.697 170.52 3.06 (1.02)
4th 253.168 291.70 2.99 (0.75)
5th 188.949 180.84 2.57 (0.91)
6th 227.955 226.82 2.70 (0.99)
The effect of season of calving was highly significant. Cows calving in winter and autumn
have high initial milk and peak milk levels as compared to spring and summer calvers. Winter
and summer have longer time to peak and strong lactation persistence as compared to the
other seasons. Summer and autumn have shorter time to peak milk production as compared to
winter and spring (see Table 9). The above analysis implies that winter calvers tend to have
high peak milk while at the same time efficient as evidenced by larger lactation curve.
Table 4.16 Changes in initial and the peak milk yield with time and lactation persistency by calving
season
Calving
seasons
Initial Milk Peak milk Time to peak Persistence
Winter 197.98 220.25 3.05 (0.97)
Spring 141.33 158.48 3.03 (0.97)
Summer 187.20 181.11 2.64 (0.76)
Autumn 238.90 221.20 2.53 (0.76)
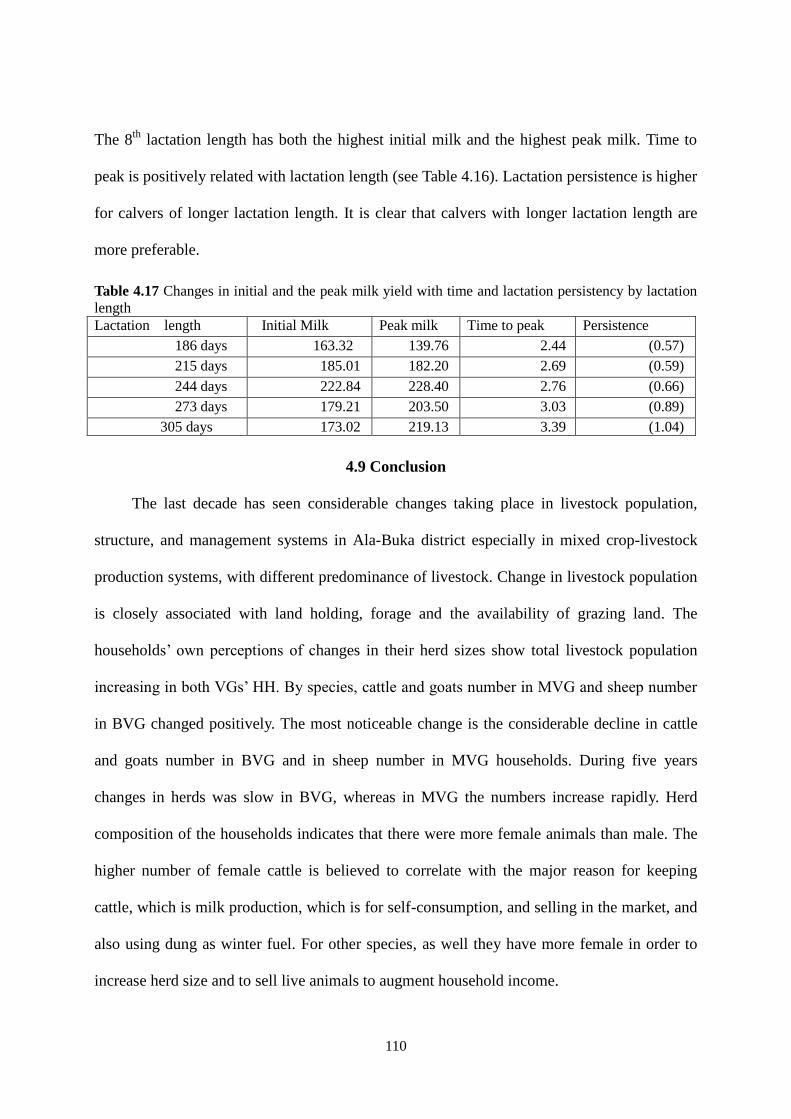
110
The 8th
lactation length has both the highest initial milk and the highest peak milk. Time to
peak is positively related with lactation length (see Table 4.16). Lactation persistence is higher
for calvers of longer lactation length. It is clear that calvers with longer lactation length are
more preferable.
Table 4.17 Changes in initial and the peak milk yield with time and lactation persistency by lactation
length
Lactation length Initial Milk Peak milk Time to peak Persistence
186 days 163.32 139.76 2.44 (0.57)
215 days 185.01 182.20 2.69 (0.59)
244 days 222.84 228.40 2.76 (0.66)
273 days 179.21 203.50 3.03 (0.89)
305 days 173.02 219.13 3.39 (1.04)
4.9 Conclusion
The last decade has seen considerable changes taking place in livestock population,
structure, and management systems in Ala-Buka district especially in mixed crop-livestock
production systems, with different predominance of livestock. Change in livestock population
is closely associated with land holding, forage and the availability of grazing land. The
households‘ own perceptions of changes in their herd sizes show total livestock population
increasing in both VGs‘ HH. By species, cattle and goats number in MVG and sheep number
in BVG changed positively. The most noticeable change is the considerable decline in cattle
and goats number in BVG and in sheep number in MVG households. During five years
changes in herds was slow in BVG, whereas in MVG the numbers increase rapidly. Herd
composition of the households indicates that there were more female animals than male. The
higher number of female cattle is believed to correlate with the major reason for keeping
cattle, which is milk production, which is for self-consumption, and selling in the market, and
also using dung as winter fuel. For other species, as well they have more female in order to
increase herd size and to sell live animals to augment household income.

111
However, traditional and modern private livestock management strategies have been
developed to regulate herd size based on the available fodder supplies. The sale of animals in
autumn, after returning from summer pastures or slaughtering at the beginning of winter are
some of such management strategies. Livestock can be sold all year round, but major sale
takes place in August-October, when livestock return from pastures. Cash income from such
sale is mainly used in preparation for wheat sowing in autumn and for growing season in
spring. Another major sale takes place in February-March when forage shortage occurs. This
time the sale of livestock is high with low price which exacerbates poverty, as poor people are
forced to make such sales. This provides new opportunity for ‗new businesses‘. Here
wealthier farmers or other businessmen buy livestock at lower price and send them to summer
pastures. They sale them in autumn at higher price. This type of business has temporarily
increased livestock numbers among buyers‘ household.
Livestock contribute 21% of household income in BVG and in MVG 31%. Besides, it
also provides products for home consumption. The main reason of changes in herd
composition was income level and market demand in general. In case of sheep, higher
demand for meat led to increase in population of Gissar breed. Goats‘ number is increasing in
the herds of MVG households. Less cropland area and easy access to common property
pastures, well-adaptation of goats to harsh climate conditions and natural resource based
fattened feeding systems make the goats more preferable. A high demand for goat milk and
less feed requirement made goats well-accepted by poorer households. In future, there is an
uncertainty, whether they can be replaced with cattle in rural area with improvement of
welfare among rural poor. Increase in numbers of intermediary women buyers of milk and
milk products in BVG led to increase in cattle numbers in the herd, majority of which are
retained in near-village pastures all year round. Horse and donkey numbers increased due to

112
necessity of draft power in the households. The attributes of draft animals are subsidiary for
agricultural machines that help in performing plugging and threshing the land, transporting of
physical products, income-employment gain (services to other farmers) and socio-cultural
(nomadic culture, having a horse) and ecological services. Lac of roads in remote pastures
enhanced the use of donkeys and horses as main transport during transhumance. The increase
number of horses and donkeys can be indication of advanced rural poverty as poor prefer to
use livestock in order to avoid extra expenditure for tractor services, fuel and payments. On
the other hand, the increase in the use of livestock for agriculture operation decreases the use
of agricultural machines; thereby leading to low carbon agriculture. This will be crucial in
mitigating adverse impact of climate change on human beings and environment through
reduced GHG emissions.
Forage scarcity, especially from the end of winter to mid spring is the main constraint.
In addition, time shortage in hay-making in summer because of lack of labour as well as in
favourable changes in pasture brought by climate change is another important constraint.
Declining pasture productivity was observed even in not stocked intensive and remote
pastures of the study area. Thus, forage species are suffering from triple risks; overgrazing,
dominating non-edible plants and climate change. Forage shortage and poisonous grass
species increase livestock mortality in early spring.
Forage availability and scarcity affect milk yield and made significant change in
lactation curves by calving season. The number of cows in summer and autumn calving is
lower in both VGs, even though those calving seasons have significant positive changes in
lactation curves. The lactation curves are very sensitive in winter and autumn calving in MVG
and in winter and summer calving in BVG. Higher decrease in milk yield is observed in these
seasons that affect the total milk production in local and district level as all cows became less

113
productive. Therefore, it concluded that BVG‘s HHs are suffering from ‗low productivity‘.
Besides, majority numbers of cows belonged to winter and spring calving season suffered
from forage shortage. This affects total milk yield at district and national levels because of the
decline in milk yield as cows become less productive.
Lactation curve calculation had two limitations; usually milk yield is taken weekly, for
this calculation used the amount of monthly milk yield. Secondly, lactation curve for season
was very sensitive due to forage shortage, which has high number of standard error. The
effects of farm operation, calving stage, calving season, period and length must also be taken
into consideration when evaluating cows‘ productivity. The mean milk yield for all cows was
of 1358.65kg and the standard deviation is 522kg. The overall estimates for initial milk yield
(β0), inclining slope (β1) and declining slope (β2) were 175.084 (1.040), 0.946 (0.081) and
0.317 (0.021) respectively with standard errors enclosed in parenthesis. All of the parameters
of the lactation curve were significant at 1%. The R-squared for the transformed logarithmic
gamma function is 0.27. Highest peak and lactation yields were associated with cows that
calved in autumn and winter. Persistency was higher for 4th
stage cows (the favourable
lactation persistence as compared to calvers of other stages) and cows that calved in winter
and spring. Summer and autumn have shorter time to peak milk production as compared to
winter and spring. Time to peak is positively related with lactation length. The 8th
lactation
length has both the highest initial milk and the highest peak milk. Lactation persistence has no
definite relationship with lactation length. Among the different measures of persistency, the
ratio of lactation to peak yield may be desired by breeders because of its higher lactation yield
and easy for calculating. Further analysis of the calving season, stage, and period, especially
with regard to consumption of winter forage and grazing and farming operation would be of
interest.

114
Chapter V Land Management: Cropland and Pastures
5.1 Introduction
Agricultural land is classified into two main components: arable land, which is the
cultivable land to grow crops, and pastures, the uncultivated component used for grazing
animals. Pastures make up 85% of agricultural land in Kyrgyzstan, with arable land
accounting for the remaining 15%. As the privatization process approached its completion, the
total arable land in individual use (by peasant farms and household plots combined) stabilized
at around 920,000 hectares, with the remaining agricultural enterprises and other users
controlling less than 400,000 hectares. The main crops grown in Kyrgyzstan are wheat, maize
(for grain and silage), potato, forage crops, industrial crops (oilseed crops, tobacco, and
cotton), and vegetable. Since independence, the need for local food self-sufficiency has given
wheat production importance by replacing forage crops and barley, which previously was the
main crop for intensive livestock industry. The cropping patterns in the study area vary due to
self-consumption, forage and cash income from farming. In the case of income, costs and
benefits from crop species depends on crop land size, productivity and demand for those
crops. However, in the last decade, this proportion was altered by the use of the land for
more profitable crops, mainly fodder crops in response to the fast growing livestock economy.
According to report by MoE (1998), a range of factors over the last century have had an
impact on biodiversity in Kyrgyzstan, resulting in declines in many groups, and leading to
concern for a growing number of species, including key ones of economic importance.
Pastures are formed by the variable climate of certain areas and the composition of plant
species adapted to grow in those particular conditions. In these areas, primary biological
production – animal breeding – supports an important sector of the economy upon which the
majority of the population depends. On the other hand, both a rise in average temperatures

115
and an increase of extreme weather conditions are putting pressure on biodiversity, landscape,
and agriculture.
This chapter analyses past and current changes in cropping patterns, pasture types and its
management through farming and animal husbandry activities. It reports the results of a study
of farming economics, which is reflected by inputs and outputs of farming systems. The
results of the pasture studies conducted in two types of pastures aims to gain information
about the condition of mountain pastures in the study area. Results are obtained by two main
methods: the first is to examine the current condition of pastures in terms of coverage,
composition, and factors of pasture degradation. The second was to analyse socio-economic
and environmental context of pasture management by pastoralists and large herd owners.
5.2 Background: Land Holding and Cropping Pattern in Kyrgyzstan
Agricultural land is classified into two main components: arable land, the cultivable land
to grow crops, and pastures, the uncultivated component used for grazing animals. Pastures
make up 85% of agricultural land in Kyrgyzstan, with arable land accounting for the remaining
15%. Pastures were not subject to privatization and remained state property. Privatization
efforts focused only on arable land. While reform legislation is in place in Kyrgyzstan (See
Annex 1), and about three-quarters of former collective farm households have now become
private farmers, implementation of the reforms is not yet complete. The land reform legislation
set a privatization target of 75% of arable land, with the remaining 25% to be held in a State
Land Redistribution Fund for future contingencies. As the privatization process approached
completion, the total arable land in individual use (by peasant farms and household plots
combined) stabilized at around 920,000 hectares, with the remaining agricultural enterprises
and other users controlling less than 400,000 hectares. By February 2009 the number of
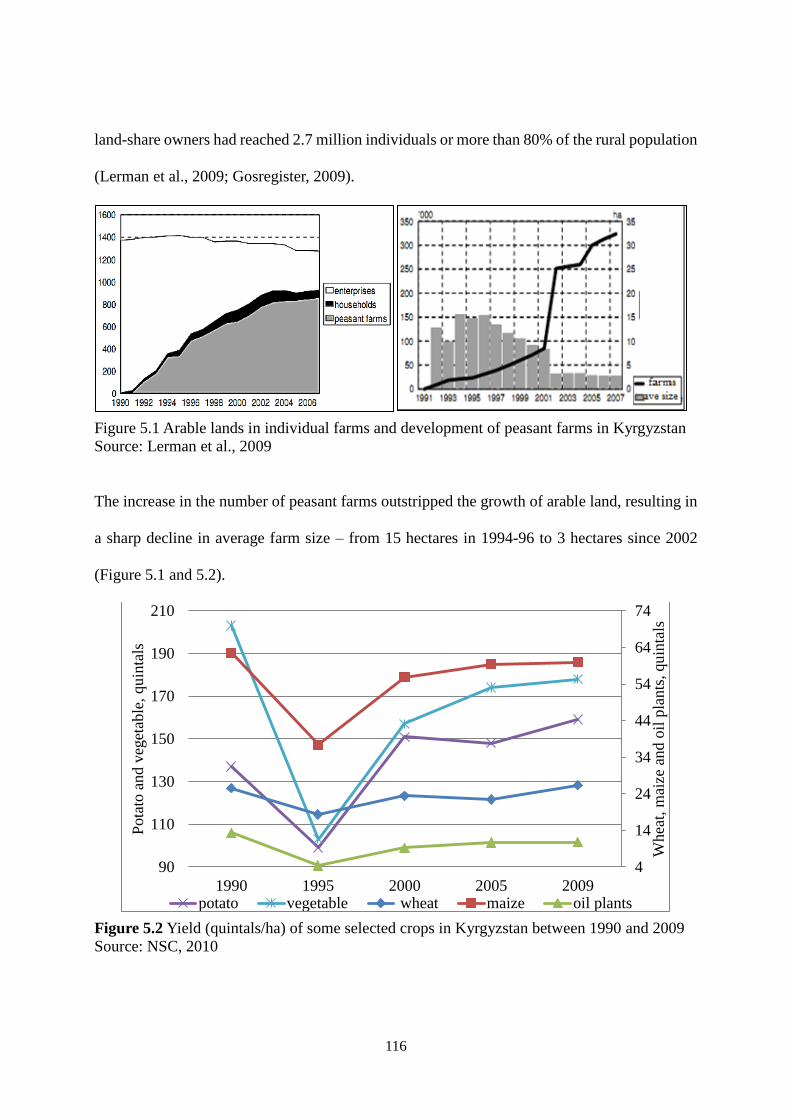
116
land-share owners had reached 2.7 million individuals or more than 80% of the rural population
(Lerman et al., 2009; Gosregister, 2009).
Figure 5.1 Arable lands in individual farms and development of peasant farms in Kyrgyzstan
Source: Lerman et al., 2009
The increase in the number of peasant farms outstripped the growth of arable land, resulting in
a sharp decline in average farm size – from 15 hectares in 1994-96 to 3 hectares since 2002
(Figure 5.1 and 5.2).
Figure 5.2 Yield (quintals/ha) of some selected crops in Kyrgyzstan between 1990 and 2009
Source: NSC, 2010
4
14
24
34
44
54
64
74
90
110
130
150
170
190
210
1990 1995 2000 2005 2009
Whea
t, m
aize
and o
il p
lants
, quin
tals
Pota
to a
nd v
eget
able
, quin
tals
potato vegetable wheat maize oil plants

117
Land uses of farms of the three main types are agricultural enterprises, peasant farms, and
household plots. Individual farms (the traditional small household plots outperform the newly
emergent peasant farms) achieved consistently higher levels of land productivity than
agricultural enterprises. Crop yields dropped between 1990 and 1995 with transition of the
traditional Soviet farming system and the disruption of all infrastructures in agriculture. From
1995, because of land and farm reform, crop yield per hectare increased. This was accompanied
by land and farm reform; changing landownership from collective farming to individual
farming. There were negative impacts of increasing crop yield by land degradation. Arable land
contracted from a peak of 1.4 million hectares in 1994 to 1.3 million hectares in 2007, while
more than 5 million hectares of pasture land shifted out of productive use by farms and villages.
The potentially negative effect of the decrease was reinforced by the shrinkage of machinery
inventories and sharp reduction in the use of fertilizers and other purchased inputs and
worsening irrigation-drainage systems (Lerman et al., 2009).
5.3 Changes in Cropping Pattern
The main crops grown in Kyrgyzstan are wheat, maize (for grain and silage), potato,
forage crops, industrial crops (oilseed crops, tobacco, and cotton), and vegetable (Figure 5.3).
Since independence, the need for local food self-sufficiency has given wheat production
importance. According to NSC (2010) data, a total of 193 582 ha of wheat were grown in 1990,
it increased to 549638 ha in 1997, whereas in 2009 it declined to 402575 ha (both irrigated and
rain fed land) by replacing forage crops and barley, which previously was the main crop for
intensive livestock industry. This reflects diversion of land to more profitable crops, mainly
fodder crops in response to the fast growing livestock economy. As a result, the area cultivated
for fodder crops has increased by 43 % or by nearly 90 000 ha from 2003 to 2010, particularly

118
in the South part of the country, where it has doubled (FAO/WFP, 2010).
Figure 5.3 Trends in sown area of major crops in Kyrgyzstan between 1990 and 2009
Source: NSC, 2010
Another reason of decreasing wheat cropland area is agriculture machines; cereals are almost
entirely harvested by combine harvesters, and this represents the most important cost for
producing staple crops. The acute machinery deficit was estimated in 2009 at 45% for combine
harvesters, 40 % for tractors with different tools and 30% for seeders. As a result, farmers losses
were 15-25% higher (the amount is higher in remote areas) than normal losses (FAO, 2009). Oil
seed crops (irrigated crops of sunflower and rape, and mainly rain-fed crops of safflower) have
shown a remarkable increase from a total of 7 801ha in 1990 to a total of 66192 ha in 2009. The
largest area of oilseed crops (86941 ha) were sown in 2004. The area cultivated for food
self-sufficiency crops, such as potato and vegetables has increased substantially; potatoes from
25 188 ha in 1990 to 87227 ha in 2009, and vegetable crops from 20 655 ha in 1990 to 43447 ha
in 2009. This also reflects a growing demand in urban areas and neighbouring countries.
20
40
60
80
100
120
140
160
180
100
150
200
250
300
350
400
450
500
550
600
650
700
1990
1991
1992
1993
1994
1995
1996
1997
1998
1999
2000
2001
2002
2003
2004
2005
2006
2007
2008
2009
ind
ust
rial
cr
op
s an
d p
ota
toan
d v
egat
able
, th
ou
san
d h
a
cere
als
and f
ora
ge
crops,
thousa
nd h
a
cereals forage crops
industrial crops potato and vegetable

119
Compared to other crops, maize decreased slightly with significant change in proportion
between grain and silage production. Maize was planted in a total of 155 261 (65664 ha or
42.3% for grain and 89 597 ha or 57.7% was for silage) ha of land. The data for 1999 show
decrease in sown area; a total of 81 560 ha planted with maize (a reduction of 73 701 ha) of
which 61 009 ha (74.8%) was for grain, and 20 551 ha (25.2%) for silage (Central Asia Project,
n.d).
Seed quality plays important role in farming. Decreasing maize cropland can coincide with
lack of machinery, such as feed combines, cutters and rollers. In individual sector, harvesting is
almost done manually by requiring high labour. On the other hand, insufficiency and high diesel
prices, which are almost not acceptable by the majority peasant farmers, negatively affect land
preparation in spring, cultivation in summer and harvesting in summer and in autumn. This
mainly happens in spring, when mostly households have financial shortage which is combined
with forage shortage for animals, low price for livestock in the market and food shortage for
households. These factors contributed to the reduction of spring crops or late sowing in spring.
Irrigation also plays major role in farming, where most of annually grown cereals, potato,
vegetable and industrial crops are grown on irrigated land, whereas other dry land crops
strongly depends on precipitation. As FAO/WFP reports of Kyrgyzstan (2009) point out other
factors affecting crop yield are fertiliser supply, which decreased in amount per hectare supply
after independence. Fertiliser price and availability (sometimes will be high in demand, even if
it is in high price) represent a significant constraint to increase fertiliser use by farmers in
individual sector.
In the mixed crop-livestock farming systems, livelihood and livestock rely on arable land
including irrigated and dry land with integrated crop land (Wright et al., 1995). The average
size of owned land also plays important role in sustainable farming. The size of owned land

120
varies in both VGs; in BVG was a total of 0.20 ha arable land including 0.17 ha irrigated and
0.03 ha dry land, whereas in MVG it was a total of 0.18 ha arable land, including 0.12 ha
irrigated and 0.06 ha dry land area. This variation depends on the size of former kolkhoz‘s
(1-May kolkhoz-MVG) and sovkhoz‘s (Birlik sovkhoz-BVG) arable land area and its
population. The average land holdings in each VG by land size stratification is given in Table
5.1.
Table 5.1 Number and percentage of households by owned land size (hectare)
Land size BVG MVG
HHs % HHs %
No land 13 10.8 25 20.8
0-1 ha 35 29.1 63 52.5
1-5 ha 65 54.1 31 25.8
5-< 7 5.8 1 0.9
Source: Field survey, 2010
Majority of households, 63 or 52.5 % have 0-1 ha of land in MVG (in BVG 35 or 29.1%), while
in BVG, majority of HHs; 65 or 54.1 % (in MVG 31 or 25.8 %) hold 1-5 ha of land. Seven or
5.8 % of HHs in BVG own and rent more than 5 ha of land and in MVG only one HHs has such
amount of land. Excluding owned land, majority of HHs have rented land from the State Land
Redistribution Fund (SLRF) and from neighbours. Latter one can be rented from poor HHs,
mainly those who are not able to use it due to high expenditure of cropping and lack of labour.
Land holding by land types and ownership forms, with main crop varieties are given in Table
5.2. In general, land size for all types are larger in BVG, excluding hay land (0.32 in MVG and
0.23 ha in BVG). The average size of arable land is 1.56 ha in BVG and 1.12 ha in MVG
respectively. Water availability and condition of irrigation-drainage systems are also important
in land use. The size of irrigated land is larger in BVG (1.01 ha) than in MVG (0.62 ha). Water
to the irrigated land areas in MVG is supplied by three old pump stations and channels, which
were constructed during the Soviet time and require capital repair. Each year, during the

121
growing season those pumps and channels are destroyed by heavy rain and increasing water
amount due to melting snow. The large size of total arable land and especially irrigated land
area is due to the availability of ground water in three high populated villages in BVG.
Table 5.2 Operated land area with mean number and different crop varieties
Land, ha
BVG MVG
Total land Mean HHs
n=107 Total land Mean
HHs
n=95
Total arable
land 165.73
1.56 107
105.36
1.12 95
Irrigated 108.1 1.01 107 60.25 .62 89
Dry land 22.76 .48 48 21.24 .48 45
Hay land 2.12 .23 9 5.08 .32 19
SLRF land 32.78 2.04 16 15 2.01 7
Orchard 12.35 .65 19 3.79 .27 14
Crop
Wheat 62.75 .89 71 24.78 .52 47
Maize 33.19 .46 76 33.41 .36 66
Sun flower 34.03 .54 64 12.97 .36 37
Potato 14.93 .24 47 4.62 .14 34
Vegetable 2.5 .08 31 2.38 .10 23
Forage crop 18.33 .52 37 26.26 .47 34
Tobacco .38 .12 3 .94 .26 4
Source: Field survey, 2010
The cropping patterns in the study VGs is reflected by mainly food crop self-sufficiency.
Majority HHs in BVG (71 HHs) used the main land area for wheat growing, whereas in MVG,
number of HHs is lesser (47 HHs). The next important crop is maize in both VGs and the
number of HHs is even higher than numbers of wheat growing; 76 HHs in BVG and 66 HHs in
MVG. This suggests that majority HHs use their land for livestock forage, thereafter they can
sell their livestock and buy wheat (after harvesting with low price) or wheat flour from the
market. That type of purposive cropping includes Lucerne. Those purposes of cropping of
maize and forage crops are more profitable than other crops (pers.comm., 2010). The

122
cultivation of potatoes, sunflower and vegetables grown as cash crops, for self-consumption
can be grown in household plots. The increased cultivation of potato as contrasting to other
cereals and forage crops led to lower animal feed resources because it does not produce forage
for animals itself. However weeds in potato crop land give significant amount of ‗hay‘. Lack of
herbicides leads to increase weeds in crop land. During the Soviet time, tobacco was one of the
main industrial crops in Kyrgyzstan. All activities related to tobacco growing was mechanised
and man-labour was required in sorting and pressing. After independence, tobacco planted
areas drastically reduced because of the gap in demand, and lack of labour. In the study VGs,
few farmers grow tobacco; a total of 0.38 ha and in 0.94 ha area was planted by 3 HHs in BVG
and by 4 HHs in MVG.
The cropping patterns in the study area vary for self-consumption, forage and cash income
from farming. In case of income, costs and benefits from crop species depends on crop land size,
productivity and demand for those crops (Figure 5.4 and Annex 4). Cultivation of the described
major crops provide significant savings for the farmer, the greatest benefit recorded for
vegetables due to higher inputs and high demand with proper price at local and urban markets.
The vegetables include carrot, onion, garlic, tomato, cabbage and paprika. However, vegetable
requires more input in terms of labour than other crops. Farmers mainly grow them in their
plot(s) and this calculation did not include the cost for transporting. This benefit interrelate
with climatic conditions and labour, which, in turn, provide greater flexibility in their
management practice. Usually, vegetables are grown in household plots, which reduce time and
expenditures for harvesting and transportation.

123
Figure 5.4 The total costs and profit margins for major crops in the study area (som/ha)
Source: Author‘s calculation from primary data, 2010
These costs and margins were calculated for average price of per kilogram of crops. However,
majority of HHs sell their crop in autumn at lower price. In case of vegatables, the fresh types‘
availability is seasonal, it can be sold in summer and autumn at lower price. Because some
crops need expenditure for storing during winter time and there is always high risk due to
sudden cold weather. Other cash crops, such as tobacco and cotton also have higher benefits.
However, they are grown by few HHs in small land sizes. Unlike these cash crops, potato has
less profit with higher cost because of bought seeds from market or from other farmers. Potato
can also be sold as seed in the local and neigbouring regions‘ markets (pers.comm., 2010).
Wheat, maize and sunflower are regular crops, which are mainly grown for self-consumption
and for livestock forage. These crops are grown in larger areas, even though the profits are
lesser compared to other crops. In case of Lucerne, main output comes from supplied labour
for three times mowing growing season, due to lack of grass cutter machinery in the study
area. Instead of this outputs, it causes other dificulties such as high time consuming and being
5
35
65
95
125
155
185
215
245
275
305
335
5
40
75
110
145
180
215
250
285
320
355
Wheat Maize Potato Vegetable Sun
flower
Tobacco Cotton Lucerne
To
tal
cost
and
Gro
ss m
argin
, th
ousa
nd
so
m
Ou
tpu
t, t
ho
usa
nd
so
m
Output Total cost Gross margin

124
late to water for the next mowing. Such system could appeal to part-time farmers, who may
not benefit directly, but rather in terms of improved labor productivity, which increase income
from off-farm employment from both an economic and social context.
Farmers were asked about their perception for changes of crop yield and productivity of
crop varieties during 2005-2010 in the study area.They gave different results. Majority HHs
(44 HHs in BVG and 51 HHs in MVG) responded that the crop yields for major crops
decreased. Fifty six HHs in BVG higher than MVG (41 HHs) had no any change in crop yield.
Increase in crop yield was only in 7 HHs in BVG and 3 HHs in MVG respectively. Farmers‘
perception for low crop yield related problems are given in Figure 5.5.
Figure 5.5 Percentage of farmers‘ perception for low crop yield related problems
Source: Field survey, 2010
The most important problem in both VGs was insufficient agricultural inputs, such as
fertiliser (25 % in BVG and 20% in MVG), machinery (17% and 15 %) and seed quality
(14% and 10%) of crops. Irrigation related problems followed those problems with 13 % in
BVG and 16 % in MVG. Lack of machinery (mainly combine harvesters and mowers in both
1
6
11
16
21
26
BVG MVG

125
VGs) increased problem because of shortage of labour during growing season. The low yields
for wheat were attributed to changes in weather condition (continuosly occuring rain and
humid condition in April and May) in the study area elevated levels of new crop diseases. As
a result, farmers currently obtained skills are not enough to identify and to prevent, and to use
proper chemical treatments (pers.comm.2010). As a consequence of the mild and humid
weather, fungal desiseas (Stripe rust, Stem and Leaf rust) are a challenge to farmers.
Moreover, plant diseases (mostly for maize is fungus -corn smut-Ustilago maydis), weeds and
insects (for potato is the Colorado potato beetle – Leptinotarsa decemlineata, for maize and
tomato is the larva of moth – Helicovera zea) increased due to continuos monocultural
cropping in the same land area. Suddenly, a sharp increase in temperature in May and June
caused unfavorable condition for seedlings; after heavy rain, soil surface become hard and
seedlings cannot grow up. Thereafter, farmers have to reseed crops. However, all farmers
cannot afford to reseed, due to lack of finance and machinary. Thus, cropland remains with
less dencity, which leads to low crop yield. Soil quality is an important factor for crop
productivity. HHs (7%) in BVG considered fertiliser insufficiency in general, whereas HHs
(14%) in MVG considered physics-mechanic content of soil (stony and saline) which does not
favor all crops.
5.4 Pasture Types and Condition
5.4.1 Climate
The territory of the Kyrgyz Republic can be subdivided into the following four climatic
zones: The Northern and North-Western Kyrgyzstan, which include Chui, Talas and Kemin
valleys embraced with mountain ridges; The South-Western Kyrgyzstan that includes Fergana,
Chatkal and Alai valleys embraced with ridges; The North-Eastern Kyrgyzstan that includes

126
Issyk-Kul hollow embraced with mountain ridges and The Inner Tien-Shan system.
South-Western Kyrgyzstan is the warmest and dewy climatic zone, where, in contrast to
the other climatic zones, a considerable proportion of precipitation falls during wintertime
(Figure 5.6).
Figure 5.6 Average long-term data for Zhalal-Abad city, South-Western Kyrgyzstan Source: UN Framework Convention on Climate Change in Kyrgyzstan, 2003
This changes in precipitation and temperature is based on the south-western part which is
under the strong pressure of the southern cyclones bringing humid air while the other climatic
zones experience the influence of Siberian anti-cyclones. At the foothills of Fergana valley,
the average air temperature is 8 to 12°C; the average temperature of January is about -3 to
-4°C; and the average temperature of July is 23 to 26°C. The absolute maximum of
temperature is about 40 degrees while its absolute minimum ranges from -23°C to -29°C. The
annual precipitation level at the foothills varies from 300 to 650 mm. The altitude increases,
the level of precipitation also increases. At the slopes of sub-meridian ranges (Ugamskiy,
Sandalshskiy, Pskemskiy, Ferganskiy and Chatkalskiy), the annual precipitation level ranges
from 1,000 to 1,500 mm.; at the slopes of sub latitudinal ranges (Turkestanskiy, Alaiskiy and
Zaalaiskiy ) the precipitation fallout is lower (Climate of Kyrgyzstan, n.d.).

127
5.4.2 Biodiversity
The ecosystems represent a range from high mountains, to lowland fertile plains and large
freshwater systems. The character of biodiversity in the country reflects the high altitude of
much of the land, being dominated by montane and alpine species. A range of factors over the
last century have had impact on biodiversity in Kyrgyzstan, resulting in declines in many
groups, and leading to concern for a growing number of species, including key ones of
economic importance. Seasonal pastures are formed by variable climate of certain areas (e.g.
the direction of prevailing winds) and the composition of plant species adapted to grow in
those particular conditions. In these areas, primary biological production – animal breeding –
supports an important sector of the economy upon which the majority of the population
depends. This activity, if managed appropriately, conserves vegetation cover, thereby
preventing soil erosion on mountain slopes, and reducing the likelihood of flooding In total,
22 different classes of ecosystem are recorded in Kyrgyzstan (Table 5.3). Most of these
ecosystems (14 or 63.6%) are found between 2000-3000 m altitude, although only 30.8% of
the territory lies within this range. Furthermore, the range of ecosystems is not evenly
distributed throughout the country. Sixteen ecosystems (72.7%) are found in Western and
Central Tien Shan (the northern part of the study district included in this group), while the
Ferghana valley (includes the southern part of the study district) and Southern Kazakhstan
biogeographic region have the fewest ecosystems, three and five respectively (Figure 5.7).
Thirteen ecosystems are represented in Alai, while ten ecosystems are found in other Northern
Tien Shan and Issyk-Kul biogeograhic regions. A number of ecosystem types are very fragile,
and are threatened by human activities.

128
Table 5.3 Ecosystems of Kyrgyzstan
Ecosystems Area
sq.km
% Ecosystems Area
sq.km
%
1.Spruce forest 2,772 1 12. Cryophilic steppe 21,413 11
2. Juniper forest 2,680 1 13. Cryophilic desert 1,911 1
3. Broad-leafed forest 464 >1 14. Mid-mountain meadow 8,764 4
4. River forest (tugai) 226 >1 15. Mid-mountain steppe 17,643 9
5. Small-leafed forest 771 >1 16. Mid-mountain desert 2,543 1
6. Mid-mountain deciduous
shrub land
970 >1 17. Mountainous
dry-farming land (bogara)
2,791 1
7. Mid-mountain pterophilic
shrub land
2,317 1 18. Foothill steppe 823 >1
8. Savannah 6,081 3 19. Foothill desert 8,768 4
9. Almond and pistachio
forest
182 0.1 20. Pterophilic lowland
shrub
181 0.1
10. Glacier and subglacier 11,527 6 21. Lakes and wetlands 393 4
11. Cryophilic meadow 27,242 14 22. Cultivated land 12,475 7
Source: Ministry of Environmental Protection, 1998
Figure 5.7 Ecosystem map of Kyrgyzstan
Source: Ministry of Environmental Protection, 1998 Note: The numbers show ecosytems (the same in Table 5.3 ) which are found in biogeographical regions

129
The most threatened ecosystems in Kyrgyzstan include the fruit and nut forests of the south
(threatened by overuse), fragile mountain forest communities, steppes near large human
settlements, high mountain meadows (threatened by overgrazing), and some areas of
semi-desert and dry steppe (which are easily degraded through grazing, MoE, 1998). There
are all kinds of soil erosions on Kyrgyzstan‘s territory: pasture, wind, water, irrigation surface,
and ravine erosion. Now, 5302.1 thousand hectares of arable lands are exposed by erosion,
including about 968 thousand hectares of arable lands, about 4544.8 thousand hectares of
pasture, and about 87.1 thousand hectares of hay cultivation15
.
5.4.3 Impact of Climate Change
Climate, Land, Biodiversity, Livestock and People – interrelationship among them varies
differently in different parts of the Earth. They are interdependent. Ignoring one of them
causes another problem. In agro-pastoral systems social, economic, and environmental
constraints cannot be solved in isolation or independently or just by providing some projects
or policy intervention to one factor and it cannot give successful results. Both a rise in
average temperatures and an increase of extreme weather conditions are putting pressure on
biodiversity, landscape, and agriculture.
The occurrence of maximum precipitation varies significantly among different parts of
the country. This has significant effect to ecosystems. There is evidence of a long-term rise in
temperature that has been faster in Kyrgyzstan than in the rest of the world (the average
annual temperature has risen 1.6°C in Kyrgyzstan16
during the last century versus the global
average rise of 0.6°C). According to the assessment conducted in the First Review of
15
"Demonstrating Sustainable Mountain Pasture Management in the Susamyr Valley, Kyrgyzstan" GEF/UNDP
Project, 2008 16
Government of the Kyrgyz Republic, First National Communication of the Kyrgyz Republic under
the United Nations Framework Convention on Climate Change, (UNFCCC) and Zholdosheva, 2009.
130
Climate Change in the Kyrgyz Republic (2003), possible climate scenarios to 2100 show
average annual warming varying from 1.8 to 4.9С, and annual precipitation falling slightly
(by 6%) to considerable increase (by 54%). Such important changes in climate parameters
will have an impact on natural systems through various activities.
5.4.4 Pasture Types and Condition
Chapchyma (location 41025
/N, 70
057
/E, 2500-3000 m altitude, survey area-3.2 ha, MVG)
and Chanach-Say (Ak Tash kungoy (sunny side)) remote pastures (location 41034
/N, 71
029
/E,
1800-2400 m altitude, survey area - 3.4 ha, BVG) are located in the south part of Western
Tien-Shan. The main features considered were vegetation composition by altitude, utilisation
and livestock species compostion by altitude. The soils of the study area mainly composed of
meadow and alpine meadow soils in Chach-Say pasture, while meadow steppe soils covered
large area in Chapchyma pasture (The Atlas of Kyrgyz SSR, 1987). Rock layer content of the
surveyed area is mainly covered by limestone in Chach-Say (6%), whereas sandstone and
other siliceous rocks cover was larger in Chapchyma (8%) pasture (Figure 5.8).
In the northern part of Chach-Say pasture, there are kinds of trees (27%) such as: firtree
Picea schrenkiana, broad-leafed species including poplar Popules ssp., willow Salix spp in
general. In the western part, with drier territories, pistachio-tree Amuldalus communic and
walnut trees Junglans regia grow. On the drier mountain slopes of Chapchyma (10% of total
coverage) different kinds of the wood Juniperus spp. occur. From the bushes, mainly
Rosacea spp. are dominant in both pasture types. Pasture species in both area are
predominatly cryophit forage species (see Annexes 2 and 3, about found forage species in
surveyed area). Non-edible plants are mainly dominant in the low altitudes, such as Artemisia
and Stipa spp.

131
Figure 5.8 Pastures (rangelands ) condition with composition profiles
Source: Field survey, August, 2010
Changes in pasture condition occur according to time of rainfall, pasture plants stage of
growth, plants type (Grass vs. Forbs) and soil fertility. In poor condition, pasture areas have
few non-edible grasses or bareground cover, whereas this area is larger in Chapchyma
pastures (11%).
Plant growth stage is a major factor affecting forage quality (Figure 5.9). Forage quality
increases rapidly from May to July in both pasture areas. As grasses mature after flowering
(late July-August) their quality declines due to increase in the proportion of less digestible
material. On the other hand, this change has positive effect in increase fat content of milk with
decline protein content. Grazing management is important in all stages, to conserve pasture
species; early movement to pasture decreases number of new growing forage species,
overstocking decreases number of flowering species and continuosly raining and early

132
Figure 5.9 Forage quality changes according to climate and plant‘s stage of growth.
Adopted from Henri et al., 1995
snowing decrease seeding of plants. Latter one is due to climate, as well as livestock is
returned to villages at that time.
5.5 Pasture Management
Summer pastures are used by minority HHs (pastoralists; hired shepherds and large herd
owners from G3 and G4) as part of the agro-pastoral systems17
. To use remote pastures for
grazing, herd should consist of at least 300-500 sheep and goats, 15-40 horses, 20-30 lactated
cattle or 100-200 dry cattle. However, majority of HHs in G3 and G4 have more than the
above numbers of livestock. Movement of HHs to pastures closely depends on income
sources obtained from pasture side (Table 5.4). The main income comes from the selling of
livestock and its products (in autumn) and from payment for herding. Recently, horse milk
products became in high demand and more attractive for pastoral tourism, especially in
summer, increased number of people in pastures, who goes to drink raw horse milk for health.
17
According to Law on Pasture, 2009, farmers, who wants to use summer pastures, they should buy
pasture ticket and the price of ticket is based on livestock number and varies among species

133
Table 5.4 Percentage of income sources for pastoralists
Sources Chapchyma (MVG) Chanach-Say (BVG) Dairy products * 21 18 Honey 11 13 Selling animals 25 27 Medicinal herbs 6 9 Selling dung 5 3 Tourism 7 6 Selling hay 4 7 Hire for herding 14 12 Others 7 5 Source: Field survey, 2010
*It includes melted butter (sarymay) and its residue (totro), dried yogurt (kurut), cheese (byshtak),
fermented horse milk (kymyz),and raw horse milk
This type of tourism can coincide with the selling of honey and medicinal herbs and dairy
products at pasture side. On the other hand, hired shepherds increase in rural areas; 4-5 hired
shepherds randomly18
collect livestock from their own and from other villages and even other
districts. Herding costs vary among species ; higher in the first month for each animal; 70 (for
other month 50) som19
for per sheep and goat, 200 (250) som per cattle and 250 (300) som
per horse. Due to bad animal performance in early spring, high mortality risk, less grass in
pastures (too early movement) and harsh climate conditions. Sometime farmers exchange
butter and other products for herding. High herding cost for sending livestock to summer
pastures creates difficulties for poorer households. However, HHs, who own on average 20-25
sheep and goats, 2-5 cows, rare 1-2 horses are not able to pay for herding and livestock have
to remain in near-village pastures all year round (Figure 5.10). .
18
Divided to less labour required and more labour required; randomly collected herd composition
depends on pasture topography, distance from the village and purposed livestock product types (milk
products: horse and cow) and physiological state (age of animals in case of cattle). On the other hand,
before the collecting animals, hired shepherds should bargain the grazing payment for each livestock
species with elders of the village. They will make oral contract and some elders will be guarantor for
hired shepherds, to control payments. And also those elders are make negotiation between farmers and
shepherds about payment for lost animals (some animals die with different reason or become sick or
stealing of animals from summer pastures and etc.) 19
1USD equal to 46.52 som (August, 2010)

134
Figure 5.10 Variation in percentage of sent and retained animals during summer among
Groups‘ categories Source: Field survey, 2010
A high number of retained animals for all group categories are observed in BVG in general
compared to MVG. Among groups a higher number are in G2 HHs in BVG (62%) and in
MVG (42%). Payment of retained animals for herding in both VGs are different. Two types
of herding are observed; the first Bada system (hired 3-4 shepherds and cowboys) from spring
till autumn, ussually applied for lactated cows. And payment per lactated cow is 100 som per
month. The second type of herding is Kezuu (Turn in rotation), every day one person from
each 2-4 HHs look after the herd. HHs‘ number for rotation depends on herd size and
season; in spring and autumn increases and in summer decreases due to availability of grasses
and avoid damage of croplands.
5.6 Factors of Pasture Degradation
Definition of pasture degradation can be shown by different evidences by farmers,
ecologists and policy makers. Also, a defined and quantified degree of degradation is also
important for future land-use options. Pasture condition is also influenced by a combination of
grazing pressure and climate. Pasture quality changes according to precipitation, pasture
08
1624324048566472808896
G 2 BVG G 2 MVG G 3 BVG G 3 MVG G 4 BVG G 4 MVGwithin village at summer pastures

135
plants growth stage and plants types (grasses or forbs) which assess forage nutritive value.
Pasture condition is related to botanical composition, cover and yield potential of the pasture,
proportion of edible and non-edible plants, ground cover, woody weeds or re-growth
problems and sign of erosion or soil degradation. Thus, pasture types have different levels of
resilience to inappropriate grazing management and unfavorable seasons. In both pastures
percentage of edible species reduce by replacing non-edible plants and bushes. Most of the
researches also highlight that the main indicators of pasture degradation are overstocking and
overgrazing in near village and intensive pastures (Esengulova,2007; World Bank Report,
2005; Shukurov, 2004; Zholdosheva, 2009). It was reported that lack of land availability
(especially irrigated) and areas of pressure on resources are higher in Ala-Buka district than
other neighbouring districts, which increase overgrazing and deforestation. New agriculture
development and recent human occupation gave pressure on mountain slopes. Since this
district is located on transboundary zone, the use of pasture and forest resources has
international political-economical implications (EnvSecurity, 2005). However, surveys
showed pasture degradation in terms of declining productivity in not stocked intensive and
remote alpine Chapchyma and Chanach-Say pastures of the study area.
Quantitative assessments of pasture condition show differences between changes in 500 m
altitude, in terms of total coverage, edible, non-edible plants, height of grasses and
temperature (Figures 5.11 and 5.12). Average temperature decrease with altitude increase by
300 C to 210 C upto in Chapchyma pasture, while in Chanach-Say, temperature rose with
increase in altitude by 14.70 C to 26.20 C. Observations show that in Chapchyma pasture,
till 2750 m altitude. High temperature has significant effect on composition of plants with a
few dominating heat-drought tolerated non-edible species. Beside this, the height of plants
also shortened. A number of forage species increased with decrease in temperature.

136
Figure 5.11 Chapchyma pasture condition, MVG
Source: Field survey, 2010
These changes marked topography of pastures, glacier surface and wind speed.
Disappearing glaciers had significant effect on ecosystems in this grassland. As mentioned
above, these vegetation changes also varied with annual precipitation amount. Usually, in the
pasture, annual precipitation is about 600-700 mm, which mostly occurs in winter and early
spring (Climate of Kyrgyzstan, 2007). In Chanach-Say, up to 2100 m altitude pasture
coverage and balance of edible-and non-edible plants did not give much difference and started
to decline sharply of forage species by substituting non-edible plants (Figure 5.12). For
increase in temperature within increase in altitude can be explained by different reasons.
Firstly, it can be a temperature inversion, an increase in temperature with height. With
sufficient humidity in temperate areas, fogs present below the inversion cap.There is a
relationship between surface air temperature, inversion temperature difference and inversion
depth. It is clear
3
10
17
24
31
38
45
52
59
66
73
80
87
94
2500 2550 2600 2650 2700 2750 2800 2850 2900 2950 3000Altitude, m
coverage% edible plants% non-edible plants%
number of species temperature,C

137
that when surface air temperature is warm (cold), inversion depth and inversion temperature
difference will be small (large).
Figure 5.12 Chanach-Say pasture condition, BVG
Source: Field survey, 2010
Secondly, drying of Aral Sea brought tangible changes in climate conditions and destroyed
water circulation. The increase of dust aerosols on glacier surfaces (brought with western
wind) and led to intensive melting of glaciers in South-Western Tien-Shan. Sand-and-salt
aerosol effects soils and pastures by replacing multilayer plant species by singlelayer species
with decrease in a number of forage grasses.
A significant number of drought and heat tolerated steppe and semi-desert plants have
appeared in Chapchyma pastures, while Chanach-Say pastures invaded with semi-arid zone
bushes and shrubs. Relevant functions such as providing water quantity and quality, slope
stability and biological processing of matter ensure ecosystem services such as
cultural/medicinal plants, forage production, water infiltration and storage, nutrient retention,
and insurance of catastrophic slope failure (Ministry of Environmental Protection,1998). The
3
13
23
33
43
53
63
73
83
93
103
113
1800 1850 1900 1950 2000 2050 2100 2150 2200 2250 2300 2350 2400Altitude, m
coverage,% edible plants,% non-edible plants,%
number of species temperature,C

138
main indicator of pasture degradation is the changes in vegetation species composition,
replacing of edible species by non edible, decreasing of coverage and biomass (Natsagdorj,
2003). During field survey, the above mentioned changes in pasture composition and
conditions were observed in both pasture sides. According to results of the survey in
Chapchyma pasture, pasture degradation can be classified in three groups (Figure 5.12). Light
level of degradation (2700-2950 m) has no changes in biomass, but percentage of edible
plants were decreased. Quantity of Artemisia appears by dominating in downhill pastures.
Moderate level of degradation (2650-2750 m) has significant increase of Artemisia by moving
to uphill. Decrease in numbers of total and edible species. And severe level (2500-2650 m)
destroyed vegetation composition. Artemisia becomes dominant. Artemisia already moved up
by 200 m in this level of degradation. Valuable forage species with affect growth stage are
replaced by Artemisia because of drier and hotter weather, which started to increase in
downhill pastures 7-8 years ago (pers.comm., 2010).
Changes in vegetation also caused by Stipa spp. In the north-western part of Chapchyma
pasture, Stipa kirghisorum specie significantly increased. In moderate degradation indicated
significant increase of feather grass (in some literatures mentioned as needle grass) Stipa
kirghisorum in sunny side of pastures. It is a common forage grass in steppe regions. Feather
grass is not a valuable fodder plants, and, therefore, in areas dominated by meadow vegetation,
is considered as a weed. But due to its weak root system, it cannot spread on meadows for
long-term. However, due to the fact that the feather is more resistant to drought than other
perennial grasses, it can start to dominate the vegetation in those areas which, although they
do not belong to the dry steppes. These processes affect the ecosystem, as the feather in the
first place, does not form a black soil (high nutritive soil), and secondly, in its rhizomes after
the end of the growing season (which ends in early enough) begins to develop fungi that

139
produce enzymes in the soil acidic. These factors impede restoration of valuable grass after
the drought. Such a process leading to degradation of vegetation in some sources called
steppe or Stipa dominated pastureland. In the Soviet Union in areas adjacent to the feather
grass steppes, the meadows were at risk of steppe, waged the struggle against this
phenomenon, which consisted of periodic crops of valuable perennial grasses (especially after
the drought years), as well as flooding the most arid areas (The Great Soviet Encyclopedia,
1990). Grazing on Stipa dominated pastures in late summer leads to feather disease - awn
feather stick into the skin of animals, especially small ruminants; sheep and goats, causes its
inflammation.
In case of Chanach-Say pasture, degradation levels and unbalanced composition type
varied from Chapchyma pasture as shown in Figure 7. Numbers of valuable cryophilic forage
species of Poacea, Asterecae, Fabaceae and Lamiacae significantly lessen. In general, there is
no change in biomass, quantity of forage species decreased in uphill and replaced with mainly
Rosaceae (Rosa kokanica, Rosa maracandica, R. canina) bushes. The recent years in
downhill Artemisia covered areas enlarged. Decrease in quantity of Juniperus species (J.
seravschanica, J. semiglobosa and J. turkestanica) raise landslides, visible soil erosion in
sunny hillside by reducing temperate zones‘ plant density. Semi-arid and arid zones‘ plant
species are moving up from low altitudes. Increasing temperature affect forest-grassland
mixed pasture areas converting it into semi-arid steppes.Temperate zone‘s forage species are
suffering from triple risks; overstocking, dominating non-edible plants and finally, changing
climate.
Zholdosheva (2010) points out that Juniper (locally called archa) forests are important in
water circulation in alpine pastures. The largest areas of archa forests are concentrated in Osh
and Batken regions on the slopes of the Turkistan and Altai mountain ranges, but it is also

140
found extensively in Zhalal-Abad region, in Chatkal, Ala-Buka and Aksy districts on
mountain slopes at altitudes from 1200 to 3200 masl. Archa forests are located on steep
mountain slopes and they perform important water regulation and water conservation
functions, preventing soil erosion and preventing mud- and landslides. Over the last 25
years, the archa forests acreage has diminished by 18% and the rate of degradation has
reached 0.8% per year. Over the last 25 years, the desertification border advanced vertically
into the mountains by 500 m. One effect of the increased summer temperatures is that the
archa forest ecosystem will gradually move higher, and by 2100 could be 150–200 m higher
than now. According to Ionov (2004), as impact of climate change in South-Western
Kyrgyzstan, desert area will move up 200 m, steppes – 250 m and for rangelands, it will be
150 m. Artemisia-Ephemera ‗community‘ will dominate savannah and mid-mountain
meadows. Area of deserts will increase. Annual ephemeras and ephemerides with short spring
vegetation will increase. It will cause pasture shortage during dry summer and autumn by
giving pressure to near-village pastures. The degradation of the mountain vegetation is caused
by the progressive aridization of the mountain slope pasture lands and overall climate
aridization.
There are many uncertainties in observation of climate patterns in subalpine and alpine
pastures and pastoral systems. Thus many studies and observations in remote areas of
Kyrgyzstan are still needed. Poor policy limits people‘s capacity to adapt to the changes being
brought by global warming. There persists among many governments, the beliefs that local
people are a problem and that their knowledge and ways of life are outdated. A set of policy
narratives have remained very strong, and continues to influence how governments intervene
in these areas. The need of stay above the ‗carrying capacity‘ emphasizes the problem of
‗overgrazing‘ and ‗the tragedy of the commons‘. Researches in the past 15-20 years have

141
shown these concepts to be unhelpful. Many dryland grazing systems are well managed by
local pastoral systems, given the highly uncertain patterns of rainfall (rather than overgrazing)
that are primary cause of shifts in vegetation availability (Anderson, 2010).
Grazing lands - alpine pastures and meadows - are critical to both the ecological and
economic functioning of mountain regions. Climate and land use change drive changes in the
vegetative cover and the use of this land affecting ultimately the carbon, nitrogen and water
cycles, the stability of mountain slopes and household economies (GLOCHAMORE, 2005).
Changing climate presents agro-pastorals with most reflective and complicated challenges.
There are few facts on how the costs and benefits of climate adaptation are scattered in reality
and how greater evenhandedness can be brought into the distribution process. Valuable coping
strategies of agropastorals should be strengthened by joint environmental and agrarian policy
and government support as adaptive strategies to changing climate and changing ecosystems.
5.7 Conclusion
The cropping patterns in the study area vary for self-consumption, forage and cash
income from farming. Majority HHs in BVG use the main land area for wheat growing,
whereas in MVG, maize was grown in large areas. Wheat cropland area decreased due to lack
of properly worked agriculture machines because cereals are harvested by combine
harvesters, and this represents a significant loss of crop yield during the harvesting of crops.
This suggests that he majority of HHs use their land for livestock forage. Thereafter, they can
sell their livestock and buy wheat after harvesting with low price or wheat flour from the
market. This type of purposive cropping coincides with forage crops also. Another side, lack
of herbicides leads increasing weeds in crop land. The greatest benefit recorded for vegetables
due to higher inputs and high demand with proper price at local and urban markets. This

142
benefit corresponds with climatic conditions and labour, which, in turn provides greater
flexibility in their management practice. Wheat, maize and sunflower are grown in larger
areas, even though the profits are lesser compared to other crops. In case of Lucerne, main
input is from supplied labour for three times mowing growing season, due to lack of grass
cutter machinery in the study are.
The perception of HHs for the changes of crop yield and productivity of crop varieties
during 2005 to 2010 in the study area gave different results. Majority of HHs responded that
the crop yields for major crops decreased and only few HHs had increase in crop yield. The
most important problem in decreasing crop yield was insufficient agricultural inputs, such as
fertiliser, machinery and seed quality and unsatisfactory irrigation.
The data obtained from Chapchyma and Chanach-Say pasture in terms of pasture
coverage are different. Chanach-Say pastures vegetation are dominated by several kinds of
forage species, trees and bushes, while Chapchyma has less Juniperus numbers and mainly
cryophyte forage species. Pasture degradation was also observed at non-stocked pastures.
Other important differences between the two pastures are changes in temperature within
altitude. In Chapchyma, temperature decreased with increase altitude, while in Chach-Say an
opposite situation was observed; increasing temperature with increase in altitude. This can be
one impact of climate change. Non-edible plants (Artemisia and Stipa spp.) are mainly
dominant in the low altitudes in Chapchyma, while number of Rosacea and other ephemeral
bushes increased in Chanach-Say pastures due to increasing temperature in mountain pastures.
Changes in number of forage quality is reflected by weather condition, grazing and dominated
by non-edible, steppe species. Thus, forage species are suffering from triple risks; overgrazing,
dominating non-edible plants and climate change.
Summer pastures are used by two types of HHs; large herd owners-pastoralists and hired

143
shepherds. Movement of HHs to pastures closely depends on income sources obtained from
pasture side. The main income comes from the selling of livestock and its products and from
payment for herding. High demand for horse milk becomes more attratictive for
pastoraltourism. This type of tourism increased the selling of collected different products at
pasture side. On the other hand, higher herding cost creates difficulties for poorer households
and livestock have to remain in near-village pastures all year round. High number of retained
animals for all group categories are observed in BVG in general compared to MVG. These
high retained numbers lead to overgrazing of near-village pastures.

144
Chapter VI Conclusion and Recommendations
6.1 Conclusions
This research was conducted with specific objectives of studying the population and
composition of livestock diversity by comparing two types of agro-pastoral systems (mainly
livestock - additional crop, mainly crop–additional livestock); analysing feed types and
feeding systems and derived productivity of livestock; studying cropland and pasture
management by analysing economic cost-benefits from crops and measuring condition and
botanical composition of pastures by assessing the extent of utilisation and examining the
social and economic context of agro-pastoral systems in terms of income sources. This
research highlighted the main factors affecting agro-pastoral systems by identifying
constraints and opportunities.
Livestock diversity: trends in population and composition:
From the survey and analysis of livestock sector at national and district levels, it was
found that the last decade has seen considerable changes taking place in livestock population,
structure, and management systems in Ala-Buka district especially in mixed crop-livestock
production systems, with different predominance of livestock. Change in livestock population
is closely associated with land holding, forage and pasture availability. The HHs own
perceptions for the changes in their herd sizes show that the total livestock population
increasing in both VGs; BVG (65%) and MVG (62%). By species, cattle and goats number in
MVG and sheep number in BVG change positively. The higher number of female cattle is
believed to correlate with the major reason for keeping cattle, which is the milk production,
which is for self-consumption, and selling in the market, and also using dung as winter fuel.
However, traditional and modern private livestock management strategies had been
145
developed to regulate herd size based on the available fodder supplies.
Socio-economic context of production systems:
Livestock contribute 21% of household income in BVG, while in MVG is 31%. Besides,
it also provide products for home consumption. Main reason of changes in herd composition
was income level and market demand in general. In case of sheep, higher demand for meat led
to increase in population of Gissar breed. Goats‘ numbers are increasing in the herds of MVG
households. Less cropland area and easy access to common property pastures, well-adaptation
of goats to harsh climate make goats more preferable. In future, there is an uncertainty,
whether they can be replaced with cattle in rural area with improvement of welfare among
rural poor.
Increase in numbers of intermediary women buyers of fresh milk and dairy products in
BVG led to increase in cattle numbers in the herd, majority of which are retained in
near-village pastures all year round. Horse and donkey numbers increased due to necessity of
draft power in the households. The attributes of draft animals are subsidiary for agricultural
machines, that help in performing plugging and threshing the land, transporting of physical
products, income-employment gain (services to other farmers) and socio-cultural (nomadic
culture, having a horse) and ecological services.
Feeds, feeding methods and forage shortage problems:
Forage scarcity, especially from the end of winter to mid spring is a main constraint. In
addition, time shortage in hay-making in summer because of lack of labour as well as in
favourable changes in pasture brought by climate change is another constraint. Declining
pasture productivity was observed even in not stocked intensive and remote pastures of the
study area. Thus forage species are suffering from triple risks; overgrazing, dominating
non-edible plants and climate change. Forage shortage and poisonous grass species increase

146
livestock mortality in early spring.
Forage availability and scarcity affect milk yield and made significant change in lactation
curves by calving season. Numbers of cows in summer and autumn calving are lower in both
VGs, even though they have significant positive changes in lactation curves. The lactation
curves are very sensitive in winter and autumn calving in MVG and in winter and summer
calving in BVG. Besides, majority of numbers of cows which fall into winter and spring
calving season suffered from forage shortage. This affects the total milk yield at district and
national levels because of the decline in milk yield as cow becomes less productive.
Land holding and changes in cropping patterns
The cropping patterns in the study area vary as for self-consumption, forage and cash
income from farming. Majority of HHs in BVG use the main land area for wheat growing,
whereas in MVG, maize was grown in large areas. Wheat cropland area decreased due to lack
of properly working agricultural machines because cereals are harvested by combine
harvesters and this represents the loss of significant crop yield during the harvesting of crops.
This suggests that the majority of HHs use their land for livestock forage. Thereafter they can
sell their livestock and buy wheat after harvesting with low price or wheat flour from the
market. Lack of herbicides leads increasing weeds in crop land.
In case of income, costs and benefits from crop species reflected by crop land size,
productivity and demand for those crops. The greatest benefit recorded for vegetables is due
to higher inputs and high demand with proper price at local and urban markets. This benefit
corresponds with climatic conditions and labour, which, in turn, provide greater flexibility in
their management practice. In case of Lucerne, the main input is from supplied labour for
three times mowing growing season due to lack of grass cutter machinery in the study area.
The perception of HHs for the changes of crop yield and productivity of crop varieties

147
during 2005-2010 in the study area give different results. Majority of HHs responded that the
crop yields for major crops decreased and only few HHs had increase in crop yield. The most
important problem in decreasing crop yield was insufficient agricultural inputs, such as
fertiliser, machinery and seed quality and unsatisfactory irrigation. The low yields for all
crops were attributed to changes in weather condition in the study area increased new crop
diseases. Suddenly a sharp increase in temperature in May and June caused unfavourable
condition for seedlings, which decreased crop yield.
Pastures condition and factors of pasture degradation:
Grazing lands; alpine pastures and meadows, are critical to both the ecological and
economic functioning of mountain pastures and settlements. Pasture degradation was also
observed at non-stocked pastures. Non-edible plants (Artemisia and Stipa spp.) are mainly
dominant in the low altitudes in Chapchyma, while a number of Rosaceae and other
ephemeral bushes increased and number of Juniperus spp. significantly reduced in
Chanach-Say pastures due to increasing temperature in mountain pastures. Thus, forage
species in pastures are suffering from triple risks; overgrazing, dominating non-edible plants
and climate change.
Pasture management:
Summer pastures are used by two types of HHs; large herd owners-pastoralists and hired
shepherds. Movement of HHs to pastures closely depends on income sources obtained from
pasture side. The main income comes from the selling livestock and its products (in autumn)
and from payment for herding. On the other hand, a higher herding cost creates difficulties for
poorer households and livestock have to remain in near-village pastures all year round. High
number of retained animals for all group categories are observed in BVG in general compare
to MVG. These retained numbers leads to overgrazing of near-village pastures.

148
6.2 Recommendations
Livestock and forage, its derived productivity issues
Inputs and outputs from livestock are related to household welfare. At the same time
household welfare depends on livestock number and its productivity. On the other side,
increase in livestock numbers in the study area is related to livestock revolution in developing
countries.
- Increased number of livestock mainly based on the pastures availability; natural
resource based livestock keeping requires the consideration of winter forage and to
increase the amount of stored forage. Thus, the early movement to pastures reduces
and prevents overgrazed based pasture degradation. Households need training skills on
how to improve feed quality and feeding conditions.
- Send animals to summer pastures and improve its utilisation; it will reduce labour for
stall feeding, who can then be involved in other farm or off-farm activities.
- Some households informed about trades of livestock fodder as additional income.
This suggests the necessity of support for enhancing forage trading at local and
national levels
- Livestock population and productivity can be improved by involving artificial
insemination (AI) and basic information on tackling some diseases. On the other hand,
it reduces the expenses for keeping bulls and diseases caused by natural breeding.
- Improved marketing and processing-market chains for livestock products will increase
net return from livestock.
Land management and cropping patterns
Majority of households informed that lack of agriculture machines, fertilisers; insufficient
irrigation and increasing plant diseases were the main problems in their farming activities.

149
- Mostly agricultural machines are very old and consume a lot of fuel, and they were
mainly designed to be use in large land areas of state-owned enterprises. They are
uncomfortable for individual sector‘s small land size. Modern individual sector needs
mini tractors and combine harvesters for the efficient use of land and harvest crops on
time, and it require less amount of fuel.
- Depending on chemical fertilisers is from former farming methods; the price of
fertilisers and unavailability during growing season cause difficulties for the majority
of HHs. The study suggests the provision of trainings on how to prepare farm yard
manure (FYM) and compost.
- Insufficient irrigation is caused not only by bad conditions of irrigation-drainage
systems and pump stations, but also by ineffective use of available water in
marginalised croplands by small land size. If 100 litres of water was enough for
irrigating 10 ha land on the whole by collective farms during the Soviet time, now it is
not enough for 10 ha land, which was distributed at least to 10-12 HHs. On the other
hand, different crops require different time for water, which cause other difficulties for
farmers. This cause late sowing and harvesting and conflicts between farmers. The
study suggests the establishment of cooperatives to rationally use the land and water
resources to improve rural livelihood.
- Increasing plant diseases are caused by changing weather conditions and by
monoculture crops. A research is required on the vulnerability and adaptive capacity of
farmers to climate change and the suggestion of new crops. There may be potential to
introduce leguminous crops after the major crops harvesting, which produce green
fodder and improve soil quality. Also trainings on rotational and intercropping and use
of organic pesticides to decrease crop diseases and weeds are needed.

150
- Since Kyrgyzstan is temperate zone country, there are some positive effect of climate
change on horticulture and farming. This requires more research.
Pastures and pasture management
The results of this study show that the factors of pasture degradation are caused by
overgrazing, climate change and effect of drying Aral Sea.
- Early movement of livestock to pastures has negative impact on vegetation and
preliminary degradation of pastures. As a result, forage scarcity in early spring will
cause early movement of livestock to near-village and intensive pastures. At this time,
the soil is usually soft because of the recently melting snow, and rains are frequent. At
the same time, the plants must have an opportunity to produce leaves and strengthen
their root systems; otherwise their subsequent growth will be reduced. The study
suggests the increase of winter forage or to reduce numbers of animals in the herd and
to move to pastures at the appropriate time to make better use of their potential.
- Rotational grazing and reducing number of animals in near-village pastures during
summer can be one of the solutions of preventing pasture degradation. The increase of
livestock numbers in remote pastures (Chanach-Say pastures) can control the bush
dominated areas.
- It requires deep research on pasture condition and grazing management; how climate
change impact on ecosystems and mountain pastures. The study suggests a research on
the socio-economic context and vulnerability of pastoralists.
- Recently, a demand for horse raw and fermented (kymyz) milk at pasture side of the
study area is increasing. Besides, visitors can buy organic products (grazing based
livestock products, honey and medicinal herbs). The study suggests improving
pastoral tourism in in this area; providing services by pastoralists and conservation of

151
natural resources. This can also be a good source for ethnobotanical research and
conserving traditional knowledge in pastoralists‘ livelihood.

152
Annexes
Annex1. Chronology of land legislation in Kyrgyzstan
Reform phases Date Name of Legislation
First phase
Feb 1991 Law on Peasant Farms (superseded by 1999 law)
Feb 1991 Law on Enterprises
Apr 1991 Law of Land Reform
Apr 1991 Measures for Implementation of Land Reform
Jun 1991 Land Code (superseded by 1999 code)
Dec 1992 Measures for Continuing Implementation of Land and Agrarian
Reform
May 1993 New Constitution of KR
Second phase
Feb 1994 Measures on Deepening Land and Agrarian Reform
Mar 1994 Creation of the National Land Fund (later renamed Land
Redistribution Fund)
Aug 1994 Procedures for Implementation of Land and Agrarian Reform
Aug 1994 Procedures for Reorganization of Agricultural Enterprises
Aug 1994 Procedures for Land Share Determination and Issue of Land Use
Certificates
Jun 1998 Referendum on Private Landownership (leading to a new
constitution)
Oct 1998 Presidential Decree on Private Land Ownership
Dec 1998 Law on State Registration of Immovable Property Rights and
Transactions in Them
May 1999 Law on Mortgage (Ch. 6: Special features of land mortgage)
Jun 1999 Land Code (superseded the 1991 code)
Jun 1999 Law on Peasant Farms (supersedes the original 1991 law)
Jan 2001 Law on Agricultural Land Management: lifting the moratorium
on land sales (Mar 2001)
Jan 2002 Law on Access to Pasture
Third phase
Apr 2004 New Directions and Measures of Land and Agrarian Reform
Jun 2004 Law on Cooperatives
Jun 2007 Standard Procedure for Agricultural Land Leasing from the State
Redistribution Reserve
Oct 2008 Tax Code (Section XIV, Chapters 48-51): Land Tax
Jan 2009 New Law on Pastures

153
Annex 2 List of major pasture plants found in Chapchyma and Chanach-Say pastures
Scientific name English Russian Family Pasture
type
Artemisia cina O. Berg
& C.F.Schmidt
Santonica, sagebrush Полын цитварная Asteraceae I
Artemisia maritime L. Sea wormwood Полынь приморская Asteraceae I,N, R
Artemisia sogdiana Sogdiana mugwort П. согдийская Asteraceae I
Artemisia tenuisecta
Nevski
Nevski wormwood П.тонкорассеченная Asteraceae R,I
Alcea nudiflora
(Lindl.) Boiss.
Шток-роза
голоцветковая
Rosaceae I,N
Alchemilla retropilosa
Juz.
Lady's mantle Манжетка Rosaceae R
Alopecurus pratensis
L.
Meadow foxtail Лисья хвость
луговая
Poaceae I,N
Artemisia dracunculus
L.
Tarragon Полын эстрагон Asteraceae R,I
Artemisia ferganensis
Krask & Polyakov
Fergana mugwort Полын ферганская Asteraceae R,I
Artemisia vulgaris L. Common
wormwood, mugwort
Полын
обыкновенный
Asteraceae R,I
Bothriochloa
ischaemum (L.) Keng
Yellow
bluestem,Turkistan
bluestem
Туркестанская
плодоножка
Poaceae R,I
Bromopsis inert Hungarian brome Кострец Bromeliaceae R*,I
Bromopsis ramosa Hairy brome Кострец Poaceae R,I
Calamagrostis
epigejos (L.) Roth
Wood small-reed Ве́йник назе́мный Poaceae I
Chorispora elegans Mustard family‘ Хориспора Brassicaceae R,I
Cichorium intybus L. Chicory Цикорий
обыкновенный
Asteraceae I,N
Cynodon dactylon (L.)
Pers
Bermudagrass (devil
grass)
Свиноро́й
па́льчатый,
пальча́тник
Poaceae R,I,N
Dactylis glomerata L. Cocks foot Ежь сборный Poaceae R
Descurainia Sophia
(L.) Webb. ex Prantl
Herb sophia Дескурения Софии
или гулявник
Brassicaceae R,I,N
Dichodon cerastoides Starwort mouse-ear
chickweed
Ясколка Caryophyllaceae R,I
Elymus dasystachys Wildrye Дикая рожь Poaceae I
Elytrigia repense (L.) Couch grass Пыре́й ползу́чий Poaceae I
Elytrigia trichophora
(Link) Nevski
Piliferous bluegrass Пырей
волосоносный
Poaceae R,I
Epilobium palustre L. Marsh willowherb Кипрей Onagraceae R,I
Eremurus altaicus
(Pall.) Steven
Foxtail lilies, desert
candle
Еремурус
алтайский
Asphodelaceae R,I
Erigeron speciosus Aspen fleabane Мелколепестник Asteraceae R
Festuca kryloviana Krylov fescue Овсяница Крылова Poaceae R,I
Festuca valesiaca
Gaud.
Volga fescue Овсяница (betege) Poaceae R,I*
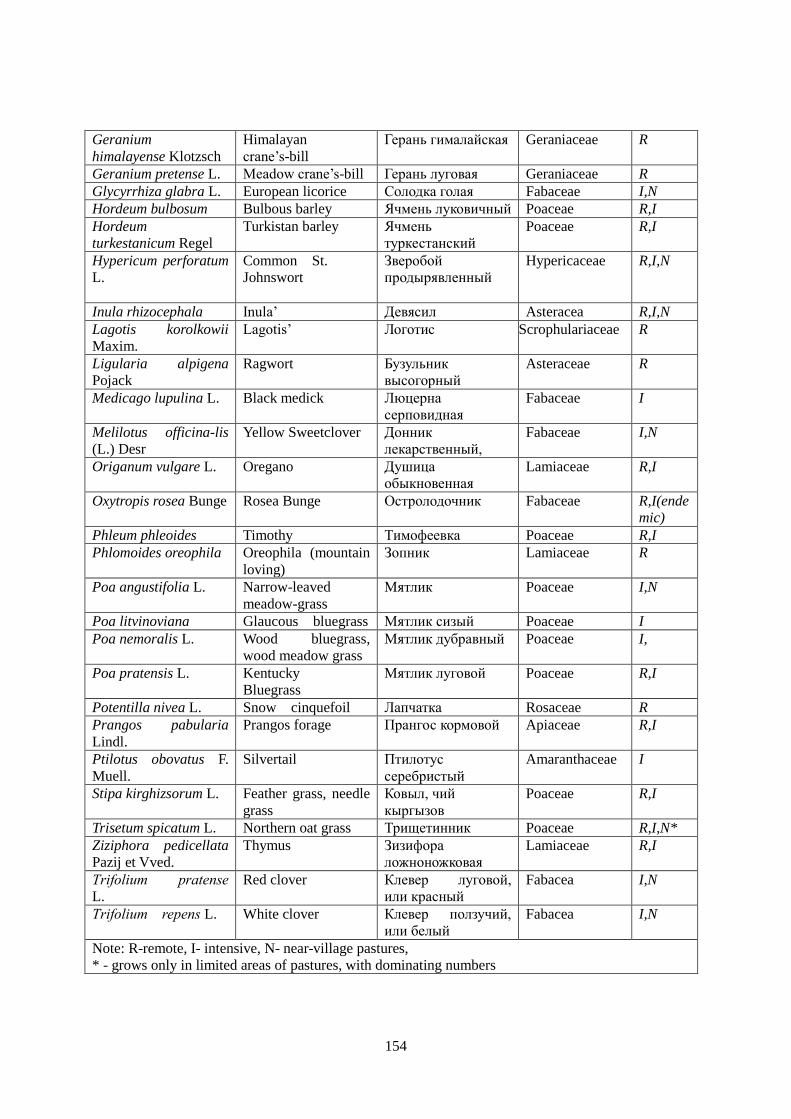
154
Geranium
himalayense Klotzsch
Himalayan
crane‘s-bill
Герань гималайская Geraniaceae R
Geranium pretense L. Meadow crane‘s-bill Герань луговая Geraniaceae R
Glycyrrhiza glabra L. European licorice Солодка голая Fabaceae I,N
Hordeum bulbosum Bulbous barley Ячмень луковичный Poaceae R,I
Hordeum
turkestanicum Regel
Turkistan barley Ячмень
туркестанский
Poaceae R,I
Hypericum perforatum
L.
Common St.
Johnswort
Зверобой
продырявленный
Hypericaceae R,I,N
Inula rhizocephala Inula‘ Девясил Asteracea R,I,N
Lagotis korolkowii
Maxim.
Lagotis‘ Логотис Scrophulariaceae R
Ligularia alpigena
Pojack
Ragwort Бузульник
высогорный
Asteraceae R
Medicago lupulina L. Black medick Люцерна
серповидная
Fabaceae I
Melilotus officina-lis
(L.) Desr
Yellow Sweetclover Донник
лекарственный,
Fabaceae I,N
Origanum vulgare L. Oregano Душица
обыкновенная
Lamiaceae R,I
Oxytropis rosea Bunge Rosea Bunge Остролодочник Fabaceae R,I(ende
mic)
Phleum phleoides Timothy Тимофеевка Poaceae R,I
Phlomoides oreophila Oreophila (mountain
loving)
Зопник Lamiaceae R
Poa angustifolia L. Narrow-leaved
meadow-grass
Мятлик Poaceae I,N
Poa litvinoviana Glaucous bluegrass Мятлик сизый Poaceae I
Poa nemoralis L. Wood bluegrass,
wood meadow grass
Мятлик дубравный Poaceae I,
Poa pratensis L. Kentucky
Bluegrass
Мятлик луговой Poaceae R,I
Potentilla nivea L. Snow cinquefoil Лапчатка Rosaceae R
Prangos pabularia
Lindl.
Prangos forage Прангос кормовой Apiaceae R,I
Ptilotus obovatus F.
Muell.
Silvertail Птилотус
серебристый
Amaranthaceae I
Stipa kirghizsorum L. Feather grass, needle
grass
Ковыл, чий
кыргызов
Poaceae R,I
Trisetum spicatum L. Northern oat grass Трищетинник Poaceae R,I,N*
Ziziphora pedicellata
Pazij et Vved.
Thymus
Зизифора
ложноножковая
Lamiaceae R,I
Тrifolium pratense
L.
Red clover Клевер луговой,
или красный
Fabacea I,N
Тrifolium repens L. White clover Клевер ползучий,
или белый
Fabacea I,N
Note: R-remote, I- intensive, N- near-village pastures,
* - grows only in limited areas of pastures, with dominating numbers

155
Annex 3. Dominated near-village pasture plants: weeds, poisonous and harmful plants
Scientific name English name Russian name Family Poisonous level
Silybum marianum
(L.) Gaertn.
Variegated
thistle
Расторо́пша
пятни́стая
Asteraceae Poisoning can occur, sheepand cattle are allowed to access to large
amounts of plant or when conditions are suitable for the plant to
accumulate nitrates(herbicides can increase nitrate content)
Xanthium pungens
Nallr.
Noogoora burr Дурнишник Asteraceae Harmful plant, hooks clinging to passing animals, vegetable faint
and low price of wool. Poisonous when seedling is two leave stage
(cotyledons acute liver damage)
Xanthium spinosum
L.
Bathurst burr Дурнишник
игольчатый
Asteraceae Weed
Atriplex muelleri
Benth.
Mueller‘s
saltbush
Солянка
Мюллера
Chenopodiaceae Grows in high saline soils, hungry or travelling stock may suffer
poisoning on pastures flushed with new growth of it. Death from
nitrate poisoning is rapid while the effects of oxalate poisoning are
prolonged
Chenopodium
album L.
Fat hen Солянка Chenopodiaceae the nitrates in the plant can be converted very efficiently to nitrites
in the rumen of cattle, leading to changes in hemoglobin and
reducing the ruminants' oxygen binding capacity.
Neobassia
proceriflora F.
Muell.
Soda bush Солянка
степная
Chenopodiaceae Prefer clay soils and saline or scalded areas. Especially the pasture
has been overgrazed Often grazed without ill effect. However, it
can be poisonous, occurs mainly with hungry, inexperienced
stock, particularly after travelling or being released from yards.
Sclerolaena birchii
S.lanicuspis
F.Muell.
S.muricata (Moq.)
Galvanised burr
Woolly
copperburr
Black roly-poly
Оцинкованная
Шерстистый
меди заусенцев
Черный Сайкин
Chenopodiaceae Dense stands of these plants indicate a recent history of
disturbance by drought and or overgrazing. The plants increase in
a run of wet winters after drier summers. Harmful for wool.
Swainsona
microphylla
(A.Gray)
Small-leaved
Darling pea
Мелколиственн
ый горох
Fabaceae Affected animals are said to be ―pea struck‖. All parts of the plant
poisonous at all growth stages. Signs take several weeks to
develop. Loss of condition, nervous signs,easily excited,
head-shaking, staring eyes and uncoordinated gait. Pregnant cows
may abort or deliver short-lived calves.
Abutilon
leucopetalum
(F. Muell.)
Desert Chinese
lantern or
Flannel weed
Китайский
фонарик или
фланели
Malvaceae Can dominate pastures near stock camps
Hibiscus trionum L. Bladder ketmia Гибискус
тройчатый, или
Malvaceae It is often a weed in cultivation but is not aggressive

156
гибискус
северный
Malva parviflora L. Small-flowered
mallow
Мальва Malvaceae Weed. The plant can be toxic to sheep, cattle, horse and poultry.
Poisoning occur where large amounts of plants Have been
consumed. Lambs are most susceptible
Haloragis
odontocarpa
F. Muell.
Mulga nettle or
Raspweed
Малга крапивы
или рашпиль
Haloragaceae Weed
Salvia reflexa
Hornem
Mintweed Шалфей Lamiaceae It is serious weed in cultivation, poisonous. Poisoning due to
nitrates in the plants.
Portulaca oleracea
L.
Pigweed Портулак
огородный
Portulacaceae However oxalate or nitrate poisoning occurs when hungry or
travelling stock it alone.
Tribulus terrestris Caltrop or
goathead or
cat-head
Я́корцы
сте́лющиеся
Zygophyllaceae Cause liver damage, when rarely grazed when little other feed
aviable. It can either cause staggers or photosensitisation in sheep
and goats.
Papaver rhoeas L. Corn poppy, red
weed
Мак
самоцветка
Papaveraceae The leaves and latex have an acrid taste and are mildly poisonous
to grazing animals
Sorghum halepense
(L.) Pers.
Johnson grass Со́рго
аллепскоe,
Гумай
Poacea Johnson grass has been used for forage and to stop erosion, but it
is often considered a weed for the following reasons:Foliage that
becomes wilted from frost or hot dry weather can contain
sufficient amounts of hydrogen cyanide to kill cattle and horses if
it is eaten in quantity. The foliage can cause 'bloat' in such
herbivores from the accumulation of excessive nitrates; otherwise,
it is edible .It grows and spreads so quickly that it can 'choke out'
other cash crops that have been planted by farmers.
Stellaria graminea
L.
Grass leaf
starwort
Звездчатка
злаковидная
Caryophyllaceae Weed
Critesion murinum
subsp.glaucum
(Steud.) W.A.
Northern barley
grass
Ячмень заячий Poaceae Harmful grass. Well grazed during autumn and winter before the
sharp bristles of seed heads develop. The seeds penetrate the skin
of sheep particularly their mouths and eyes and can be fatal. They
also cause vegetable contamination of wool

157
Annex 4. An economic cost-benefit analysis of major crops cultivation (1 hectare) in study area (price for items is given for 2010)
No Activities and cost Amount and cost Crop varieties
Winter
wheat Maize Potato Vegetable
Sun
flower Tobacco Cotton Lucerne
1
Ploughing
Labour payment, som/ha 550 550 550 550 550 550 550 550
Diesel fuel, 35 l/ha 1225 1225 1225 1225 1225 1225 1225 1225
2
Levelling (Harrowing)
Labour payment, som/ha 250 250 250 250 250 250 250 250
Diesel fuel, 10 l/ha 350 350 350 350 350 350 350 350
3
Sowing
Labour payment, som/ha 300 300 300 300 300 300 300 300
Diesel fuel, 7 l/ha 245 245 245 245 245 245 245 245
4
Row bedding
Labour payment, som/ha 200 200 200 200 200 200 200 200
Diesel fuel, 7 l/ha 245 245 245 245 245 245 245 245
Total cost for land
preparation
Labour payment, som/ha 1300 1300 1300 1300 1300 1300 1300 1300
Diesel fuel, 59 l/ha 2065 2065 2065 2065 2065 2065 2065 2065
Total cost 3365 3365 3365 3365 3365 3365 3365 3365
5
Intercultural operations
1*
Labour payment, som/ha
150 150 150 150 150 150
Diesel fuel, 10 l/ha
350 350 350 350 350 350
6
Intercultural
operations2
Labour payment, som/ha
150 150 150 150 150 150
Diesel fuel, 10 l/ha
350 350 350 350 350 350
7
Intercultural
operations3
Labour payment, som/ha
150 150
150 150
Diesel fuel, 10 l/ha
350 350
350 350
8
Intercultural
operations4
Labour payment, som/ha
350 350
350 350
Diesel fuel, 10 l/ha
150 150
150 150
Total cost for cultivation 1000 2000 4000 1000 2000 2000
9
Seed
Sown kg/ha 300 20 3000 5 15 0.1 60 20
Price per kg, som 15 20 25 600 45 9000 65 150
Total price, som 4500 400 75000 3000 675 900 4000 3000

158
10
Fertiliser
Required kg/ha 300 300 400 500 250 400 400 300
Price per kg, som 15 15 15 15 15 15 15 15
Total price, som 4500 4500 6000 7500 3750 6000 6000 4500
Application payment 200 200 200 200 200 200 200 200
Total cost, som 4700 4700 6200 7700 3950 6200 6200 4700
11
Pesticide Herbicide
Total price per ha/som 600 600 1000 1000 400 600 1000
Spreading payment 200 200 200 200 200 200 200
Total cost, som 800 800 1200 1200 600 800 1200
12
Water
Each time payment, som 45 100 100 100 100 100 100 100
Total payment 135 300 400 400 300 700 800 400
13 Harvesting Total cost 3000 5000 10000 10000 3000 9000 12000 15000
14 Transporting Total cost 700 1000 3000 3000 1000 3000 5000 8000
15 Cleaning Total cost 300 500 500 500 500
16 Land tax 306 306 306 306 306 306 306 306
17 Social Fund 306 306 306 306 306 306 306 306
18 Other expenses
1000 1000 8000 1000 10000 10000 16888
19 Total cost, som (1+18) 18112 18677 103207 42777 16002 36577 45177 51965
20 Crop yield ton/ha 2.4 5.5 10 17 1.9 2.4 2.5 13
21 Cost per kg/ yield 100% 7.56 3.39 10.32 20.08 8.42 15.24 18.07 39.97
22
Market price of crops,
som/kg
min 6 5 8 7 12 45
max 25 22 20 35 20 65
average 15.5 13.5 14 21 16 55 60 7.5
23 Output Min price 14400 27500 80000 116000 22800 108000
24 Gross margin Min price -3712 8823 -23207 76223 6798 71423
Output Max price 60000 121000 200000 595000 38000 156000
Gross Max price 41888 102323 96793 552223 21998 119423
23 Output Ave price 37200 74250 140000 354000 30400 132000 150000 97500
24 Gross margin Ave price 19088 55573 36793 314223 14398 95423 104823 45535
*- this activity includes hoeing, weeding and threshing

159
References
Abdurasulov, Y. (2009). Condition of Agrarian Sector of Kyrgyzstan. Bishkek: AKIpress.
Adam,B.A.,Young,A.M.Nicol and Degen,A.A. (1984). Energy Costs of Eating in Cattle Given Diets of
Different Form. Animal Production, 38:53-56.
ADB. (2007). The Kyrgyz Republic Natural Resource Sector Study .
AFFRCS. (1999). Japanese Feeding Standard for Dairy Cattle. Tokyo: Japan Livestock Industry
Assosiation.
AFRC. (1993). Energy and Protein Requirements of Ruminants. London, UK: CAB International.
Ajibekov, A. (2005). Animal Husbandry in Kyrgyzstan. Strategies for Development and Food Security in
Mountainous Areas of Central Asia (p. Paper 5.). Dushanbe: GTZ.
Alymeev,A. Abdurasulov,A.H. Nogoev,A.I. Toygonbaev,S. Catkankulov,E. Jeenbekova,B. (n.d.).
Charachteristics of Southern Kyrgyzstan's goat breeds and types . Bishkek.
Anderson, G., Cunningham, C., & Heishman, J. (1966). A Comparison of Three Methods of Feeding Hay
to Wintering Yearling Cattle. Agricultural Experiment Station,West Virginia University, 534:5-8.
Anderson, S. (2010). Climate Change for Agrarian Societies in Drylands:Implications and Future
Pathways. In R. a. Mearns, Social Dimensions of Climate Change: Equity and Vulnerability in a
Warming World (pp. 199-227). Washington: The World Bank.
Anvar, M. P., Cain, P. R., Kahn, M., Abdallah, M., & Babarences, M. E. (2009). Factors Affecting the
Shape of the Lactation Curve in Pakistan. Pakistan Journal of Zool. Suppl.Ser, N9, 201-207.
Aydaraliev, A. (2001). Mountains of Kyrgyzstan. Bishkek.
Balyan, G. (1978). Forage Plants ofKyrgyz Republic: its cultivation in acclimatized deserts, semideserts
and steppes. Frunze: Kyrgyzstan.
Beever,D.E. and Thomson, M.J. (1985). The Digestion of Fresh Perennial Ryegrass and White Clover by
Grazing Catttle Fed Indoors. British Journal of Nutrition, 54:763-775.
Beever,D.E.,Terry,R.A. and Wallace, A.S. (1978). The Digestion of Spring and Autumn Harvested
Perennial Ryegrass by Sheep. Journal of Agricultaural Science, Cambrige, 90:463-470.
BetaA.Miller. (2001). Empowering Women to Achieve Food Security Rights to Livestock.
Blummel,M., Wright,I.A. and Hegde,N.G. (2010). Climate Change Impact on Livestock Production and

160
Adaptation Strategies: A Global Scenario. Lead Paper, ISDA, India, 136-147.
Borril, M. (1976). Temperate Grasses. Lollium Festuca Dactylis, Phleum, Bromus in N.W.Simmonds,
ed.Evolution of Crop Plants. Longman Group LTD, London, 137-142.
CACILM. (2005). National Framework Program, Kyrgyz Republic. Bishkek:
http://www.adb.org/Projects/CACILM/milestones.asp.
Cees da Haan, P. G. (2010). Structural Change in the Livestock Sector. In H. M. Steinfel, Livestock in a
Changing Landscape Volume 1 (pp. 35-51). Washington /Covelo/London : Island Press.
Chilonda, P. a. (2006). Indicators to monitor trends in livestock production at national, regional and
international levels. Rome: FAO, Animal Production and Health Division, Livestock Research for
Rural Development 18(8) .
Commitee, N. S. (2004). Kyrgyzstan in Figures. Bishkek: NSC,KR.
Correa, J. E. (1999). Grazing Systems. Alabama and Mandauburn Universities.
CSIRO. (1990). Feeding Standards for Australian Livestock Ruminants. Australia: CSIRO Publication.
DA. (2010). The passport of Ala-Buka District. Ala-Buka: DA, District Administration of Ala-Buka.
DADD. (2009). Report on Agrarian Sector of Ala-Buka District -2010. Ala-Buka District Department of
Afrarian Development.
Delgado,C.,Rosegrant, M.,Steinfeld,H. Ehui,S. and Courbois,C. (1999). Livestock to 2020: The Next
Food Revolution. Washington,DC: IFPRI,FAO,ILRI. Agriculture and the Environment Discussion
Paper.
Dijkman, J. (2000). Researchand Development Challenges in Livestock Production Systems: A Report of
the E-Conference. In P. M.-S. Tulachan, Contribution of Livestock to Mountain Livelihoods (pp.
109-123). Kathmandu: ICIMOD.
Djikman, J. (1999). Livestock Production in Areas of High Pressure Crop-Livestock Farming Systems in
the East African Highlands.
Dufrasne,I., Gielen,M., Limbourg,P., Hornick,J.L. and Istasse, L. (1994). Effects of Inclusion of a Grazing
Period on performance of Fattening Bulls. In L. a. Mannetje, Grassland and Society (pp.
224-226). European Grassland Federation.
ECE, U. (2009). Kyrgyzstan:Environmental Performance Review. Geneva.
Environment and Security,OSCE, NATO,UNDP, UNEP. (2005). Environment and Security: Central Asia
- Ferghana Valley.

161
Esengulova, J. A. (2007). Community Management of High -Alpine Grasslands in the Kyrgyz Republic:
Social, Economic and Ecological Implications. Bishkek: Public Fund 'Ak Terek'.
FAO. (1994). The State of Food and Agriculture. Rome: FAO,Agriculture Series, No. 27.
FAO. (2007). The State of the World's Animal Genetic Resources for Food and Agriculture, 550 pp.
Rome: FAO.
FAO. (2010). Climate Change Impacts on Forest Management in Eastern Europe and Central Asia. .
Rome: Forests and Climate Change Working Paper 7.
FAO, Suttie,J.M.Reynolds,S.G. (2003c). Transhumant Grazing Systems in Temperate Asia. Rome: FAO
Plant Production and Protection Series No.31.
FAO/WFP. (2010). Crop and Food Security Assessment Mission in Kyrgyzstan. Rome: FAO and World
Food Programme.
Farrell, D.J., Leng,R.A. and Corbett, J.L. (1972). Undernutrition in Grazing Sheep,II. Calorimetric
Measurements on Sheep Taken from Pasture. Australian Journal of Agricultural Research,
23:466-509.
Farrington, J. (2005). De-development in Eastern Kyrgyzstan and Persistence of Semi-nomadic Livestock
Herding. Nomadic Peoples, 9(1-2):171-197.
Fitzherbert, A. (2005). Country Pasture/Forage Resource Profiles.Kyrgyzstan. Grassland and Pasture
Crops. Bishkek: FAO.
GEF/UNDP. (2008). Demonstrating Sustainable Mountain Pasture Management in the Susamyr Valley,
Kyrgyzstan. Bishkek.
Ghosh, A. (2003). Role of Cooperative on Dairy Development and Its Impacts on Rural Income
Generation in Bangladesh. Higashihiroshima: Hiroshima University, GS for IDEC.
GLOCHAMORE. (2005). Global Climate and Mountain Regions: An Integrated Assessment of Causes
and Consequences .
Goat Handbook, G. F. W. Haenlein; R. Caccese; U. Delaware, Newark. (1992). Goat Handbook. USA:
Agricultural Research Service, USDA.
Gosregistr. (2009). Information about land. http:/www.gosreg.kg: Gosregistr, KR.
Graham, N. (1980). Variation in Energy and Nitrogen Utilization by Sheep between Weaning and
Maturity. Australian Journal of Agricultural Research, 31:335-345.
Graham, N. (1985). Draught Animal Power for Production. Australia Center Integrated Agricultural

162
Resource and new Zealand Society of Animal Production, 96-108.
Greenhalgh, J.F. and Wainman, F.W. (1972). The Nutritive value of Processed Roughages for Fattening
Cattle and Sheep. Proceedings of the British Society of Animal Production., 61-72.
Hennessy,D.W., Williamson,J.V., Kempton,T.J. and Leng,R.A. (1983). The Roles of Enegrgy or Protein
-rich Supplements in the Subtropics for YoungCattle Consuming Basal Diets Those are low in
Digestible Energy and Protein. SASAS, 100:657-666.
Henry,D.R.Hall,T.J.,Jordan, D.J.,Milson, J.A.,Schefe,C.M.,Silcock,R.G. (1995). Pasture Plants of
Southern Inland Queensland. Queensland: Department of primary Industries.
Hodgson and White. (1999). New Zealand Pasture and Crop Science. Oxford University Press.
Hugo Li Pun and Victor Mares. (2000). The Sustainable Development of Mountain Regions: A Paradigm
Shift and New Considerations. In Contribution of Livestock to Mountain Livelihoods, Chapter 2.
(pp. 35-43). Kathmandu, Nepal: ICIMOD.
IFAD. (1995). Common Property Resources and the Rural Poor in Sub- Saharan Africa. Rome.
IFAD. (1999). Integrated Feed and Livestock Production in the Steppes of Central Asia. Rome: IFAD,
Livestock and Rangelend Related Technical Assistance Grant.
IFAD. (2004). Livestock Services and the Poor a Global Initiative Collecting, Coordinating and Sharing
Experiences. 152 p. www.ifad.org/lrkm/book/english.pdf: IFAD, DANIDA, The World Bank. .
Ionov, P. (2004). Vulnerability and Adaptation of Plant Species and Communities to Climate Change.
Bishkek: UDK528:581.524:577.41.
IPCC. (2007). Climate Change 2007: Impacts, Adaptation and Vulnerability;Summary for Policy Makers.
http://www.ipcc.eg/SPM13apr07.pdf.
Jensen and de Wit. (1996). Livestock and the Environment: Finding a balance... Rome: FAO, Corporate
Document Repository.
Jodha, N. S. (2000). Livestock in Mountain/Highland Production Systems: Challenges and Opportunities.
ICIMOD.
Kamidi, R. E. (2005). A Parametric Measure of Lactation Persistency in Dairy Cattle . Livestock
Production Science, ILRI, No 96, 141-148.
Kaufmann and Mohamed Saleem. (2000). Animal Agriculture and Watershed Management: Reconciling
Public and Private Good. In Contributioon of Livestock to Mountain Livelihoods, Chapter 15 (pp.
203-221). Kathmandu: ICIMOD.

163
Kerven, C. (2005). Cashemere Marketing: A new Income Source for Central Asian Livestock Farmers.
Kerven,C.,Alimaev,I.,Behnke,R.,Davidson,G.,Franchois,L.,Malmakov,N., Mathijs, E., Smailov, A.,
Temirbekov,S. and Wright,I. (2004). Retraction and Expansion of Flock Mobility in Central Asia:
Costs and Consequences. African Journal of Range and Forage Science, 21(3):91-102.
KR, U. (2005). Global Environmental Conventions:Crossectoral Interaction and Capacity Building in
Kyrgyzstan. Bishkek.
Kristjanson, P. (2004). Pathways out of poverty in Western Kenya and the Role of Livestock. PPLPI,
Working Paper, 14.
Lemus, R. and Brown, K. (2008). Feeding Small Ruminants: Developing a Grazing System for Sheep and
Goats . Mississippi State University, Cooperative Extension Service.
Leng, A. (1993). Quantitative Ruminant Nutrition -A Green Science. Australian Journal of Agricultural
Research, 44:363-380.
Leon-Velarde and Quiroz, P. Z. (2000). Sustainability Concerns of Livestock-Based Livelihoods in the
Andes. In Contribution of Livestock to Mountain Livelihoods (pp. 183-201). ICIMOD.
Lerman, Z. (2009). Agrarian Reforms in Kyrgyzstan Achievments and the Unfinished Agenda. FAO,
Regional Office for Europe and Central Asia Policy Studies on Rural Transition No.2009-1.
Lushihin, M. (1959). The Kyrgyz Fine-fleece Wool Sheep. Frunze: Kyrgyz State Printing.
Ly,C.,Fall,A. and OkikeI. (2010). West Africa. The Livestock Sector in Need of Regional Strategies. In P.
H. Gerber, Livestock in a Changing Landscape. Volume 2. (pp. 27-54). Washington: IslandPress.
Lynch,J.J.,Brown,G.D. and Donnelly J.B. (1972). The Effect of Withholding Drinking Water on Wool
Growth and Lamb Production of Grazing Merino Sheep in a Temperate Climate. Australian
Journal of Agricultural Research, 23:659-668.
Marston, H. (1948). Energy Transaction in Sheep I.The Basal Heat Production and the Heat Increment.
Australian Journal of Science Research B., 1:91-129.
MEA. (2005). Ecosystems and Human Well-being: Our Human Planet. Summary for Decision Makers.
The Millenium Assessment, http://www.milleniumassessment.org.
Mendelsohn,R. and Dinar,A. (2008). Climate Change and Agriculture. An Economic Analysis of Global
Impacts, Adaptation and Distributional Effects, pp.20-42. MA, USA: Northampton.
Messerli, B. (1998). Mountains-Global Priority. Moscow: Neosphere.
Miller, D. (2001). Sustainable Development of Mountain Ranglands in Central Asia:an update from the

164
Kyrgyz Republic.
Minezawa, M. (2002). Cattle Genetic Resources in Japan: One Successful Crossbreeding Story and
Genetic Diversity Erosion.
Ministry of Environmental Protection, K. (1998). Kyrgyz Republic Biodiversity Strategy and Action Plan.
Bishkek.
Moe,P.W.,Flatt,W.P. and Tyrrell,H.F. (1970). Energy Metabolism of Farm Animals. In A. a. Schurch. Juris
Druck: Zurich.
Mould,F.L., Orskov, E.R. (1983/1984). Manipulation of rumen fluid pH and its Influence on Cellulosis in
Sacco Dry matter Degradability and the Rumen Microflora of Sheep Offered either Hay or
Concentrate. Animal Feed Science and Technology, 10:1-14.
Mount,L.E., Brown,D. (1982). The Use of Meteorological records in Estimating the Effects of Weather,
on Sensible Heat Loss from Sheep. Agricultural Meteorology, 27:241-255.
Natsagdorj. (2003). Impact of Recent and Past Climate Change on Climate Extremes and Climate
Variability in Mongolia:Potential Impacts of Climate Change, Vulnerability and
AdaptationAssessment for Grassland Ecosystem and Livestock Sector in Mongolia project.
UlaanBaatar: AIACC Annual Report.
Nazarkulov, A.N. Mukashev, Z.M. and Nurdinov M.S. (2003). The Aikol meat-greasy pedigree group.
Bishkek: KNII Animal Huzbandry, Veterinary and Pastures, UDK 636.082.11 No.25-2003.
Nazarkulov, K. (2009). Animal Husbandry in Kyrgyzstan. Condition, Problems and Ways of Improvement.
Bishkek: MAWRPI, Bishkek www.agroprod.kg.
Nogoev, A. (2008). Selectional-technological Methods of Increasing Beef Production in Kyrgyzstan.
Bishkek: Kyrgyzstan.
Nori, M. a. (2007). Change of Wind or Wind of Change? Climate Change, Adaptation and Pastoralism.
The World Initiative for Sustainable Pastoralism. Nairobi: IUCN.
NRC. (1981a). Effect of Environment on Nutrient Requirements of Domestic Animals. National Research
Council, Washington DC.
Peeters, A. (2004). Wild and Sown Grassess. Profiles of a temperate species selection: ecology,
biodiversity and use. Rome: FAO and Blackwell Publishing.
Pender, J. .. (2006). Strategies for Sustainable Land Management in the East African Highlands.
Washington,D.C.: International Food Policy Research Institute.

165
Poppi,D.P., Minson,D.J. and Ternouth,J.H. (1981). Studies of Cattle and Sheep Eating Leaf and Stem
Fraction of Grassess,II. Factors Controlling the Retention of Feed in the Rectilo-rumen.
Australian Journal of Agricultural Research, 32:109-121.
Project, C. A. (n.d.). Agriculture Sector of Kyrgyzstan. http://www.centralasia-biz.com/cabiz/.
Reid,J.T.,White,O.D., Anrique, R. and Fortin, A. (1980). Nutritional Energetics of Livestock: Some
present boundaries of knowledge and future research needs. Australian Journal of Animal Science,
51:1393-1415.
Rinne, K., Suvitie,M. and Rinne, S.L. (1992). Indoor Feeding or Grazing. Agricultural Research Center,
North Savo Research Station, Finland.
Ruth,B. Franziska,K.Brigitta,A.Gabriele,C.Willy,T. (2008). Vegetation History of the walnut forests in
Kyrgyzstan(Central Asia):natural or anthropogenic origin? Quatemary Science Reviews, 621-632.
Schmidt, P. (1969). Behavior of Cattle in a Hot Dry Climate. University of New England, Master Thesis.
Seinfeld,H., Gerber,P., Wassenaar, T., Castel, V., Rosales, M.,De Haan,M. (2006). Livestock's Long
Shadow: Environmental Issues and Options. Rome, Italy: FAO.
Sere,Steinfeld. (1996). World Livestock Production System: Current status, issues and trends. Rome: FAO
Animal Production and Health Paper 127.
Sheets,W. and Tuckwiller,R.H. (1926). Effect of Winter Rations on Gains of Calves marketed as 3
years-old Steers, 1431:5-11. USDA, In Cooperation with the West Virginia Agricultural
Experimental Station.
Shukurov, E. (2004). Ecologcal Value of the Kyrgyzstan's Forests and the State Support for Their
Preservation. Regional Forest Congress. Bishkek.
Sileshi, Z., & Tegegne, A. (2000). Challenges and Opportunities for Livestock Development in the
highlands of Ethiopia. In P. M.-H. Tulachan, Contribution of Livestock to Mountain Livelihoods
(pp. 95-102). Kathmandu: ICIMOD.
Silva, F., G., B. M., & Ponte, R. (2011). Estimation of the Milk Production Function: Application of the
Incomplete Gamma Function in the Sao Miguel Island (Azores). Centro de Estidos de Economia
Aplicado do Atlantico, CEEAplA WP 16.
Singh, M. (2007). Contribution of Farming on Rural Livelihood in Nepal: Focusing on Dairy Farming in
Chitwan. Higashihiroshima: Hiroshima University, GS for IDEC.
Singh, V. (1999). Draught Animal Power in MOuntain Highland Agriculture: Issues and Options. India:

166
GB Pant University of Agriculture and Technology.
Southcott, W.H. and McClymont,G.L. (1960). Drought Feeding of Cattle II. Comparison of daily and
weekly feeding of all-grain rations: with observations on Vitamin A status. Australian Journal of
Agricultural Research, 11:445-456.
Squires, V.R. and Wilson,A.D. (1971). Temporal Patterns of Activity in a Small Flock of Merino Sheep as
Determined by an Automatic Recording Technique. Australia Journal of Agricultural Reasearch,
22:283-90.
Staal, S. J., & Jabbar, M. A. (2000). Markets and Livestock in the Coming Decades: Implications for
Smallholder Highland Producers. In P. M. Tulachan, M. A. Saleem, J. Maki-Hokkonen, & T.
Partap, Contribution of Livestock to mountain Livelihoods Chapter 4. (pp. 57-71). ICIMOD.
Steinfeld, H. S. (2010). Livestock in a Changing Landscape. Washington: Islandpress.
Sulastri, E. (2007). Dairy Development in Indonesia: Role of Dairy Cooperative in Developing Dairy
Farming of Daerah Istimewa YogyaKarta, PhD, Thesis. Hiroshima University, IDEC.
Tashi, N., & Partap, T. (2000). Livestock Based Livelihoods in Tibet, China, and Sustainability Concerns.
In P. M. Tulachan, M. A. Saleem, J. Maki-Hokkonen, & T. Partap, Contribution of Livestock to
Mountain Livelihoods: Research and Development Issues (pp. 171-183). Kathmandu: ICIMOD.
Taylor, P. (2009). Methods of Change and Financial Performance of Dairy Farms Before and After a
Switch to Management Intensive Grazing. Plan B Paper.
The Great Soviet Encyclopaedia. (1929-1990). Moscow.
The Atlas of Kyrgyz SSR. (1987). Moscow: Atlas Kirgizskoy SSR, in Russian.
Thornton, T. (2002). Mapping Poverty and Livestock in the Developing World. ILRI.
Tulachan, P. (1998). Gender Differences in Livestock Production Management in Chitwan Diostrict of
Nepal. Kathmandu: ICIMOD.
Tulachan, P. (2000). Livestock Production and Management Strategies in the Mixed Farming Areas of the
Hindu Kush-Himalayas, Asia. In P. M.-S. Tulachan, Contribution of Livestock to Mountain
Livelihoods: Research and Development Issues (pp. 123-135). Kathmandu: ICIMOD.
Tulachan, P. (2000). Livestock Production and Management Strategies in the Mixed Farming Areas of the
Hindu Kush-Himalayas,Asia. In P. M.-S. Tulachan, Contribution of Livestock to Mountain
Livelihoods: Research and Development Issues (pp. 123-135). Kathmandu: ICIMOD.
UNCCD. (2006). National Report of the Kyrgyz Republic on Implementationof UNCCD. Bishkek.
167
UNDP, K. (2005). Functional Review of the Ministry of Ecology and Emergency Situations of the Kyrgyz
Reoublic. Bishkek.
van Veen, T. (1995). The Kyrgyz Sheep Herders at a Crossroads. Pastoral Development Network,Series
38.
Wendy, B. (2005). Kyrgyz Herds:A Report to Investigate Ways to Improve Productivity.
Wood, P. (1967). Algebraic Model of the Lactation Curve in Cattle. Nature, London, 216:164-165.
Wood, P. (1969). Factors Affecting the Shape of the Lactation Curve in Cattle. AnimalProduction,
11:307-316.
World Bank. (2000). Livestock Development: Implications for Rural Poverty, the Environment, and
Global Security. World Bank.
World Bank. (2005). Kyrgyz RepublicLivestock Sector Review: Embracing the New Challenges. World
Bank.
Wright, I., & Duncan, A. (2005). Livestock, Fodder, Pastures and People An Integrated Study in the
Northern Areas of Pakistan. Kathmandu, Nepal: ICIMOD.
Zapata, A. (1997). Systems of Milk Production in the Andean Regions: A Paradigm Shift and New
Considerations. Colombia: Fundation CIPAV.
Zarate, A. (2000). Livestock biodiversity in Mountains/Highlands - Opportunities and Threats. In
Contribution of Livestock to Mountain Livelihoods, Chapter 5 (pp. 71-83). ICIMOD.
Zhang,Y., Kurokawa, Y., Motobayashi,T., Kamada,T., and Itabashi,H. (2008). Rumen Fermentation,
Blood Metabolism and Milk Production by Dairy Cows Fed Rice Whole Crop Silage. The
Japanese Journal of Animal Hygiene, 34:51-59.