CHAPTER VII-LIVESTOCK AND LIVESTOCK...
19
. CHAPTER VII- LIVESTOCK AND LIVESTOCK PRODUCTS 333
Transcript of CHAPTER VII-LIVESTOCK AND LIVESTOCK...
. CHAPTER VII- LIVESTOCK AND
LIVESTOCK PRODUCTS
333
CONTENTS
Introduction.......... . . . . . . . . . . . . . . . . . . . . . .. . . . . .............. , ............ 335 Problems in enumeration.............. . . . ............................•........ 535 Plan of presentation .••.•.................. , ...•.................... ; . . . . . . . . . . . • 336 Comparability oi statistics .....................•................ ,, ....•....... ,. 336 Value of farm products and sales .••.............................•.............. · •• 344 Horses and mules .......•.......•....•.......... : ...................... , .. , ...... ,. 545 Cattle ............................ , .......... , .. , ................................ 345
Page Hogs ............................................................................ 348 Sheep and wool •.............................. , ...... -. • . . . . . . . . . . . . . . . . • . . . . . . . . . 348
Goats........ . . . ....................•................... o •••••••••.••••••••••• 349 Animals butchered and animals sold alive............ . . . . . . . . . . . . . . . . . . . . . . 3·50 Cost of feed bought...... . . . . . . • . . ........................................... , 350 Poultry ............................................................ ,., ... , .. ,, .. 350 "
CF.ARTS Page
Farm work power--Nwnbers of horses and mules and tractors show~ -by the census in relation to annual ·estimates of January 1.: inven';ories ot horses and- m\cl:es by Bureau of Agricultural Economics, for the United States •.........•....•. , ................ ,., ..•..••..•. , ••..•..•..•....... ,.,, .•.••....• ~ .•. ·-·., ..• , .. , .••. , ..••••. o, 0 0 346
Cattle-Number shown by the census on specified dates of enumeration in' relation to cyclical changes indicated by annual estimates of January 1· inve-ntories
~i~ ~~~~e~:-~~~~~~~:!J~~~~~~· t~~r u~~e~n;~:~e;;at~~89~i944::::::::::: :.:::::::::::::::::::::::::::::::::: :~:::::::::::::::::: :.::::::::::::::::::: :·:::::::::::::::: ~1; Hogs-Number shown by the census on specified dates of enumeration in r~lation .to cyclical changes 'indicated by annual estimates of Ja.ntlary 1 inventories by
Bureau of Agricultural Ec·.:.nomics, for the United States ...•.............• , .....•.. , ...••• , ........•.....•••. ,., ....... , .•..• , •. ,,, .. ,, .•.•.•.• , ...••..• , ..••• ,,,, •• , ••• 347 Wool produced-Number of pounds, for the United States: 1839-1944 •.......•......•. , .•. , ...•.•.••.. , ••... , , , •.•..... , .• , , .. , • , .. , . , ......• , •...•....•..•.. , .• , •. , •• , ..•. , , 341;
. Sheep-Number shOl't'n by the census on specified dates of eg.umeration in relation to cyclical changes indicated by annual estimates of January 1 inv~ntt:ries by Bureau of Agricultural Economics, for the United States ........................ ,, ... , .... , .... , ... ,., ....... , ..............•..• ,, ........ ,, •.•...... , •..•.... ,., .. ,. 34~1
Goats-Number in the United Sl.ates: 1900-1945 •.....•.......... ,., ............ , •.•.. , ........... , ... ,., .............•..... , ... ,., ... , .. ,, ... , .· .. , •..••....•. , , , ...•••. , .•. 34t: Chickens-Number on hand in the United States: 1880-1945 •..•.....•......•.......•............................. , .. , .... -.. , .......•.... , .......... , ....••. , . , ... ' ... , ..•. , , . 351
~~~k~~~d~~!~~~=~e~f ~~~e~~~ ~~;t~~e 5~~~~=~ s~~{~;~94i879~i944::::::::::::::::::::::::::::::::::::::::: :·:::::::: ~:::::::::::::::::::::::::::::::::::::::::: :. ::::::::: ~~i
!MIPS
Page Value of livestock, dollars, Jan\lal'y 1, 1945· •••••. , ••.••• o ••••• o • • • • • • • • • • 352 Value of all livestock and livestock products sold, dollars, 1944· ...............• 352 Horses, number, January- 1, 1945 ••.•. o •••••••••••••••••••••• o •••• o •••••••••••••••• 352 Jl:ules, number, January 1, 1945· •• o •••• o. •• oo •• o. • • oo o • • o •• • • • •• • • •••••••••••••••• ·352 Ca. t tle, number, Janua.ry 1, 1945 ••• o ••••••• o o o •••••• o o ••• o • o • • • • • • • • • • • • • • • • • • • • • • 352 Hogs, number, Januar,y 1, 1945. o •• o •••• o •••••••••• • • • • • • • o • • • • • • o o. • • • • • • • • • • • • • • • 352 Sheep, number, January- 1, 1945 o ••••• o •• o ••••••• o. o •••• o •••••••• o o • • • • • • • • • • • • • • • • 352 Go.t:tts .. number, January 1, 1945 •••..•..•.•• , •••••••••• o •••••••• • ••.· ••••••••••••••• 352
Pa(:e ~ilk produCed, number of gallons, 1944 ..•...•..........................•..•... , .• 353 Whole mil:k sold, -number of gallons., 1944, ..............•........................ 353 Cream sold, number Of pounds of butterfat-, 1944 ........... · ...................... 355 Wool shorn-, number of pounds, 1944. o•.,, o o,, ••••••• o •••• o ••••••• o ........... _ ••.••• 353 f~hicken!jl o-n hand, numuer over 4 months old, January 1, 1945 .. o·· .................. 353 Chickens raised, nwnber, 1944 •..................... · .............. · ...........•... 353 Turkeys raised, nuinber, 1944. . . . . . . . . . . . . . . . . . . . . . . . • . • . .. . . . . . . . . . • • . . . • . . • • • . • . 353 Cost of feed bought, dollars, 1944 ••...•••.........••...........•••.••• ; •....•..• 353
'!'ABLES
Page History of enumeration in t.he census of livestock and lives.tock products: 1840 -to 194'5, ..... : .....•••....•....... : •......•....•.•.••••..•..•.•.......•.•.••...•...•.. o •• 337 Age, sex and other groups enumerated for various classes of livestock, 1945; with ·approximately comparable groups: 1900 to' 1940 ••.•..•.•••.••..•••••.•...•••••••.•....• 34C Specified livestock on farms-_Farms reporting, 1900 to 1945-; number, 1840 to 1945; and value, 1800 to 1945; for sp<;ci.fied age &Ild .sex groups, for the
United States .................................•.....................•........•..........••......•...•..•.....••.•....•.......•..•...•.........•........••.••........•... 341 Specified livestock products of farms-Farms reporting, 1899 to 1944; quantity, 1839 to 1944; and value, 1899 to 1944; for the United States ....•....... : ...............• 343 Value of sp<:=cified cla.·ses of livestock on farms, by divisions .s.nd States: 1945, 1940, and 1935 .......................................................................... 354 Value of specified livestock products of farms, by divisions and States: 194-t and 1939 ••................. , .............. , ........•. , .•............•.... ~ .•.••......•.... 356 Pe:-cent distribution of total value of specified cla$ses of livestock and per.cent of total value r·epresented by the several classes, by d-ivisions and States:
19•15, 1940, ano 1935 .•... · •.. ~· ........• ~ ......•....•.•....•.••.........••....................•................ ~ ........ , ..... .- ...••....••......••......•...•...........• 358 Percent distribution of total value of specified livestock producl.s and of specified livestock sales anc;l percent of total reprew:mted by the several classes, by
divisions and States: 1944 and 1939 ••. : ............... • .....•...••. o ••••••••••••••••••••••••••••••••••• : ••••••• ,, •••••••• , •••••• .' ••••••••••••••••••••••••••••••••••••• 359 Income on livestock, dairy, and poultry farm:;-Gross farm income £rom all sources and from princi-pal source, by divisions and· Stfl,tes: 194--1 and 1939 ...................... 360 Income from live::tock and liveztock prodllcts, with cost of feed--Gross income from sales, by source; and farms reporting and coat of feed purchased; by
divisions and states: 194~1 and 1939 ............•......•..•.................•.......................... · .............................•.. ' ....•... _.·... .•. . . . . . .. . . . . . 363 Horses-Farms reporting, number, and value, by divisions and States: 1945, 1940, and 1935 .....•..........••. · ............•......•••..••.................••..•......•.. ·• 364 Mules-Far::ns reporting, number, and value, by divisions and States: 1945, 1940, and 1935 •.......•.........................•........................................ · · •. ·. 565 H~.o. ses-Farms reporting, 1900 to 1945; aai number, 1840 to 1945; by divisions and States .................................... , ........................... ,., ............... 366 !J.ll:_es-Farms reporting, 1~00 to 1945; and number, 1850 to 1945; by divisions and States ......•.•....•..•... : ...................•............... ··· .....• · .•.... ········· • · 366 Farm work power-Horses and mules and tractors, with acres of cropland harvested, by divisions and States: Censuses of 1920 to 194'5, •...............• : .......•••••. · · · • • 37G Cattle-Farms reporting, number, and value, b.7 divisions and States: ~945, 1940, and 1935 ....................... ~ ....................................... ~ ............... 375 Cows and heifers and uall other cattle11 -Farms rep~rting, number, and value of C·JN3 and heifers and nwnbe!" and ·1alue of all other cattle,, by divisions and
states: 1915, 1940, and 1955 ...........................•...............•...•.......•...................................•......•.........•..................... · •..• · · • • · 374 Cattle-f'arms reporting, 1900 to 1945; ::.nd number, 1840 to 1~45; by divisions and States .....•.................•.............•...••.•.........•••............ ··•········· • 376 Cows and heifers 2 yea.rs old and over-Number and percent of all cattle, by divisions and St.ates: 1900 to 1945 •...................••......•........•.. · ...... · · · · · · · · · • • · 3?~ cows mili<:e"d and milk produced-Farms reporting and number of cows-milked and gallons of milk produced, by divisions and· St.ates: 1944, 19~9, and 1934 ••••••... • · • · • · · · g~z
~~: ;!~~~~ti~~~~W:~~~r~~":a~n~~;rdi:fs~!~!s:~ss~~e;~at.~~~9 ~~2~9~~. ~~~::::::::: :.:::: ~::::::::::::: :'::::::.:::::::::::::::::::: :::::: :·:::::::::::::: ::::::::::::: 382 Dairy products-Farms reporting, quantity, and value of whole milk, cream, and' butter sold, with milk equivalents; milk for use c.n farms-; and total milk 382
production and value; b:t divi::;ions and States: 1g4,, &nd 1939 ....•.............•..•............•.............................. · · · ........ ·. · · · · · · · · · · · · · · · · · · · · • · • · · · • · · · · Dair.t products sold...:_Quantity of whole milk sold, 186~ to 194..);;_ quantity o1' cream sold, 1899 to 1929; and quantity of b~..otter sold~ 189£1 to· 1929; by 38()
Ho~v~~o~~e~F~;::~e~~~~ti~~: · ~;.;.b~~: · ~d· ~~i~~:· b~· di~i~i~~~ · ~d-;t~t~~; · • i94S: · i94o:·· ;.ct· :955::::::::::::::::::::::::: ~:::: ::·::::: ::::::::::::::::::::::::::::::::::: 39e. Sows and t;L.ts for ;.;pring farrowing....:...Farms reporting, number, and value, by divisions and States: 1945, 1940, and 1935 ..•..... ·• · ...••..• • · • · · · · · · · · · · • · · · • · · · • • • • • • · · · • 38{i Ho,;s and pigs-F.<:Lrlll!: reporl.ing, 1900 to 1945; and number, 1840 to 1945; by divisions and' States ............. ~ ................................. .- ............................ 39(• Sows and c:ilts CJ.n::f 11all other hogs and pi~s•f-Nuinber of sows ami gilts, 19.<::0· to 1945; an:.~ number and value of other hogs and pigs, 1945, 1940, and, 193-5; 39r
Sh~p d;~;si:~s~;a;!:t;:~~~~j_~~: , ~~b~~: . ~~d. ~~i~~: . b~. ~j_~j_;j_~~~. ~~d. S~~t~;; .. i~45: , i94Q:. ~~~, i935: : : :: : : : : : : : : : : : : : : : : : : : : : : ·: : : : : : : : : : :: :: : : : : : : : : : : : : : : : : : : : : :: : : : : : : : 393 Ew-::s and 11a11 other sheep and lambs"-FQ.rms !'eportlng, number, a!ld value of ewes; and number and value of all other- s!"leep and lambs; by divisions and States: 394
sh~:!5 ~!9i~b~r!;!!· ~~~~;;_~~: · i9LO' t~ · i94S: · ~~d · ~~~;: · i840 · t~ · i945 ~ · :.ith · ~~b~; · ~f · ~~~~: · i90C/ t~ · i930~ · b; 'di;i-~1~~~ -~~d ·st~t~~:::::::::::::::::::::::::::::::::: ~:: 59~1 't:ool product:d-Farm~ repor:in&, quantity, ant! v.a.lue, by divisions bod States: 1944, 1939, and 1934 ......•.•.•..... , ............ · .. · .... · · · · · · · · · · · · · · • · · • • • • · • · • · · · · · · · · • ~~~-Wocl prodo.lced-Numi;...::- of pounds, C;r aivi:>ions a.nd St.<:Ltes: 1839 to 1934 ••....•...•••••....•. ····••·····•·········•··· ······•························· ···· ··••·•.·•··•·•·•· Goats and kids-Far.~ . .s reporting, number, and value, by divisions and .States: 1945,, 1940, and 1935 ......•••..• ·. · •...•. · ·• · · · · · • · • • • · · · · · • • • · · · · • · · · · • • • • • • · · · · • · · · ·: · · ·' :~~-Goats and kids-Farms. reporting and number, by divisions and States: 1900 to 1945 .... · ......... · ·. · ... · · · · · · · · · · ..• · · · · • · · · · · · · • · · · · • • • · · • · · · • · · • • · · · • · · · · · · · • · · · · · · · · ·' 40:! Livestock sales-farms reporting and nu:nber of S!Jecified cla~ses of livestock sold alive, by 1ivisions and Stt.ttes·: 194•1 and 1939. · · · · · • · · · · • • • · · · · • · • • • · · • · · · · · · · · · · · ·' ·' 4._-...t
·Farm s!.auehter-Farms reporting and number of specified classes of livestock butchered, 1909 to 1944; and value, 1944 and 1939; by divisions and St-'.ltes. • • • · · · · · · · · · · · · · · Chickens on hand-farms reportiJ16:, 1Sl0 to 1945; number, 1880 to 1945; and value, 1945, 1940, and 1935; by divistons and States. • · · · · · • • • · · · · · · • · · • · · · · • · • · · · · · · • · · · · · · '• 4V-6 Chiclt.ens r~ised-Farms reportin~, 1919 to.lSt-1; number, 1909 to 1944; and value, 1929 to 1944; by divisions snd States.·· o. • • • • • • • ·-· • • • • • • • • • • • • • • • • • • • • • • • • • • • • • • • • • • • • • !i~ Eggs proo.uced--Farms reporting, 1':1::.9 to l~·H; number of dozens, 1879 to 194·.; and value, 1944,. :L9Z:9, e.nC. 193--i; by divisions and States. • • · • · · · • • · • · · · • · • · • · · · · · · · · · · · '·' 41 :.! T .. rt;.-<.:.:r~ r~.-:.::;.:.1-F::.m.s r-=-por-tir,;_;, nl.ilT.ter, and val1.;e, by divisions :md States: 1944, 1959, ano ..i.929 ....... · ..... ·· ...................... · ............... "" · · · · · .. " ... 41~ fts.nk in num~:~er ;,.f specified kind 3 of lJvestock, 19t15, 19,~0, and 1~35; and in q_uantity of specified livest<?ck prOducts, 1944, 1939, and 1934; ·by divisions and States.····
334
CHAPTER VII-LIVESTOCK AND LIVESTOCK PRODUCTS Introduction.-This chapter presents the data, collected
in the 1945 Census of Agriculture, relating to livestock and 11vesto·ck proaucts. The inquiries, which were standard for all states, provided for: (1) inventories of the total numbers of horses, mules, cattle, hogs, sheep, and goats; chickens over 4 months old; and cows and heifers 2 years old and over, sows and gilts kept for spring farrowing, and ewes and ewe· lambs kept for breeding ewes; (2) production of milk '1-nd n\l]llber of cows milked, wool shorn, and chicken eggs; (3) number of chickens and turkeys raised; (4) number of cattle and calves, hogs and pigs, and sheep and lambs sold alive; (5) number of cattle, calves, and hogs and pigs butchered; (6) quantities of whole milk, cream, and butter sold; and (7) the value of sales of three broad groupings of livestock and livestock products, viz, (a) live animals, meat, wool, mohair, etc.; (b) dairy products; and (c) poult~, eggs, baby chicks, poults, etc. All inventory numbers wer~to be secured as of the date of the census, January 1, 1945, while all production and sales data were to be reported for the calendar year, 1944. As an adjunct to the livestock inquiries, the cost of feed bought in 1944 for all livestock, including dairy animals and poultry, was secured for each farm.
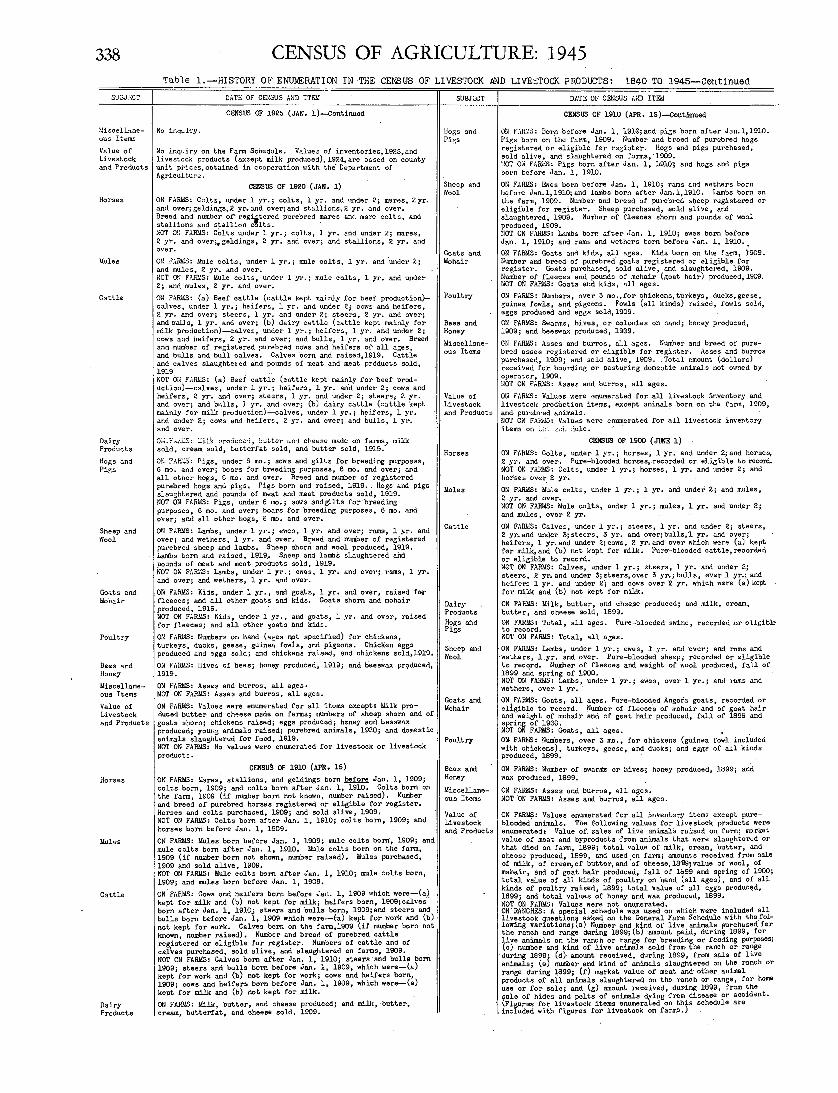
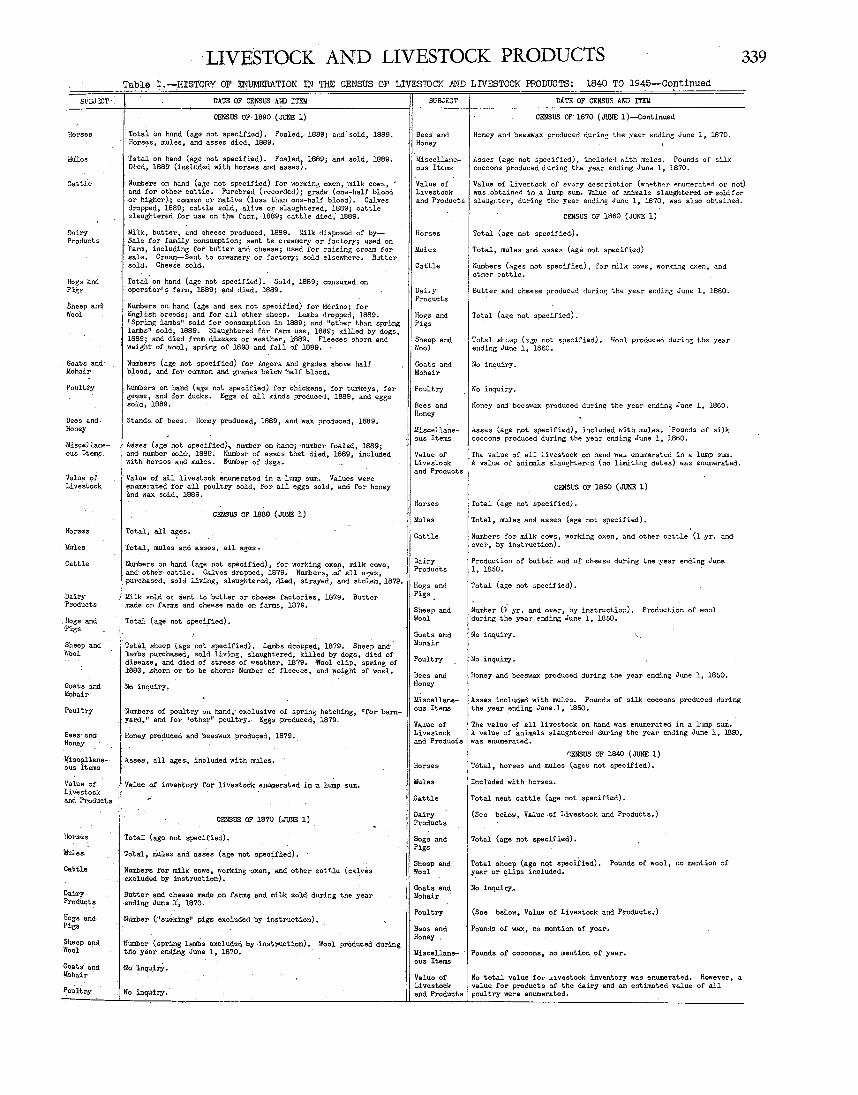
Comparative data for earlier censuses, beginning with the first agricultural census of 1840, are also shown in this chapter. For the census years ending in "5," viz, 1945, 1935, and l92~the inquiries relating to livestock and livestock products were, in genera!, limited in number as compared with those for recent decennial census years. Also, the form of the inquiries has been changed from time to time in order to obtain more usable ~~rmation or to obtain data which might be more comparable with those for other census years. January l is the date which is most widely used for showing inventory numbers of livestock. However, the various acts of Congress authorizing a census of agriculture necessitated the fixing of certain dates other than January l for several of the censuses. A compilation, given in table 1, has been made to show,· for each .. census, the date of the enumeration, the livestock inquiries included, age and sex classifications, and other descriptive information. Another descriptive comptlation, presented in table 2, shows the infor-· mation available for earlier censuses, from 1900 onward, which may be com~ared in a general way with that secured in the Census of l94ti.
The values for· iRventory and production items (but not the value of sales), shown in the accompanying tables, represent computed values for censuses beginning with 1925 and enumerated values for censuses prior to 1925. Beginning with the 1925, Census, the values were obtained by multiplying the number of units reported in the census by average unit prices which were determined cooperatively by the Bureau of the Census and the Bureau or Agricultural Economics of the Department of Agriculture. These unit values were based, for the most part, upon average prices reported by correspondents to the Division of Agricultural Statistics of the Bureau of Agricultural Economics. In 1945, 1940, and 1930, State values were obtained by assembling county values, computed by using county-unit prices; in 1935, only State-unit prices were determined and used; and 1n 1925, State values were obtained by totaling county values derived by . using average prices for crop-reporting districts (groups of contiguous counties). Prior to 1925, values were obtained by Census enumerators. The method used for obtaining these values is shown in table 1.
The number of "farms reporting" any of the various classes of livestock or livestock products is an important product of the enumeration.· The term simply means a count of the number of farms on which, or for which, a given item has been reported by the enumerators. For example, the State of Nevada had 3,429 faDms in 1945, but not all of these farms had horses, cattle, or sheep in that year, as the enumerators listed horses on only 2,585 of these farms, cattle on.2,770, and sheep on 685. Hence, the numbers of farms reporting horses, cattle, and sheep, respectively, for·Nevada are shown in the tables as 2,585, 2,770, and 685 for the year 1945. Of these 3,429 farms in 1945, only
2,317 reported milk production in 1944. The "percent of farms reporting" and "average per farm reporting" are expressions of the relationships existing between the total number of farms and the number of farms reporting, or between farms reporting and the total number of animals, as the case may be.
Problems in enumera tion.-As in several of the preceding censuses, the 1945 schedule is entitl~d "Farm and Ranch Schedule" so that the enumerator would be repeatedly reminded that all tracts of land called "ranches" were to be included in the canvass if such tracts met the Census definition of a "farm." Some livestock are found, or are kept, on places which are hot classified as farms and were therefore_, by definition, excluded from the enumeration; for example, livestock in terminal stockyards, horses kept by a riding academy, work animals in mines or in logging or construction camps, etc. The terms "livestock" and "livestock products" have been used in Census reports in a ger·eral way to include not only horses, cattle, hogs, sheep, etc., but also all poultry and bees and their production. Many village and urban households with small inventory numbers, particularly of poultry, do not produce a sufficient volume of agricultural products to be classified as farms and,therefore, were not included in the enumeration. (See the Introduction to this v01ume for the operations which are considered "agricultural" or •rarming" and the minimum size of farms as measured in land area and volume of production necessary for places to be classified as "farms.")
Some kinds of livestock found on farms were not included in the enumeration. Because of the limitation in the number of schedule inquiries for the 1945 Census, separate data were not secured for donkeys, burros, hives of bees, ducks, geese, guin_eas, etc. However, the three value questions for sales of livestock and livestock pi'Oducts were all-inclusive, and enumerators were to include therein the value of the sales of all livestock and livestock products, regardless of whether such items were covered by a separate inquiry on the schedules.
The accurate counting of all livestock on farms and ranches presents some dlffi cul ties, particularly in seeing that the count is complete and that the same animals are not counted more than once. These difficulties arise especially when livestock are owned by one farmer·, but ·located on the farm of another; when part or all of the animals on the farm are owned by hired laborers; when livestock ·are pastured on a per-head basis; or when livestock are on feed on a share or contract basis. In all censuses of agriculture,enumerators have been instructed to report livestock on the farm or ranch on which they were located as of the census date, regardless of whether such livestock were owned by the operator.
In the case of multiple units (plantation operations), the tracts operated by CI'Oppers, or tenantsy were considered to be separate farms for Census purposes. Animals located on such tracts on January 1 were enumerated there, even though they belonged to the plantation owner. 0n the other hand, all the livestock used on a plwtation rught be kept on the "home farm, • and·in such cases were to be enumerated there and not on the share' cropper, or tenant, farm. A modification of the ge~eral rule was made in the instructions for the 1945 Census of Agriculture for sheep on open range. In the Western States, sheep were enumerated· at the headquarters (in most cases, the winter headquarters) of the ranch or sheep owner, regardless of where the sheep were located on January 1.
Livestock operations were to be reported for the farm ~ven though, in the case of a new operator, the items sold or produced represented operations for the former operator. On tenant-operated farms, livestock operations were included in the enumeration of such farms, whether the proceeds accrued entirely to the tenant or were shared with the landlord.
The over-all time required to complete the enumeration of all farms in an area may have had some effect on the accuracyof the .returns. In 1945, the enumeration was unduly delayed, and this increased the difficulty in obtaining numbers of animals as of January 1 and the production or sales for 1944, parti-cularly
335

336 CENSUS OF AGRICULTURE: 1945 where a change of operator had occurred durl.ng the latter part of 1944 or in 194<:i before the enumeration. (See the Introduction to this volume for the average date of the 1945 enumeration and the proportion of the enumeration completed by specified dates. )
The foregoing problems need to be considered rn making interpretations of' the statistics for 11 vestock and 11 vestock products. Difficulties in the enumeration ·are discussed more fully under the individual classes of livestock.
Plan of presentation.- In addition to grand totals for the continental United States, totals are shown not only forthe nine geographic divisions and for each of the 48 States and the District of Columbia, as has been the custom in general summary reports for a census of agriculture, but also for three larger geographic regions.; viz, The North, The South, and The West. Total for all livestock items included in the 1945 Census, with comparative data for the 1940 ~ensus,are presented for counties in volume I, parts 1 to 33. Much of the ·ulfor;r.a tion i e also available in statistical tables for minor civil division,; (townships, precincts, etc.) and, although not published, this information may be obtained from the Bureau of the census by payment of the cost of making reproductions of such tables.
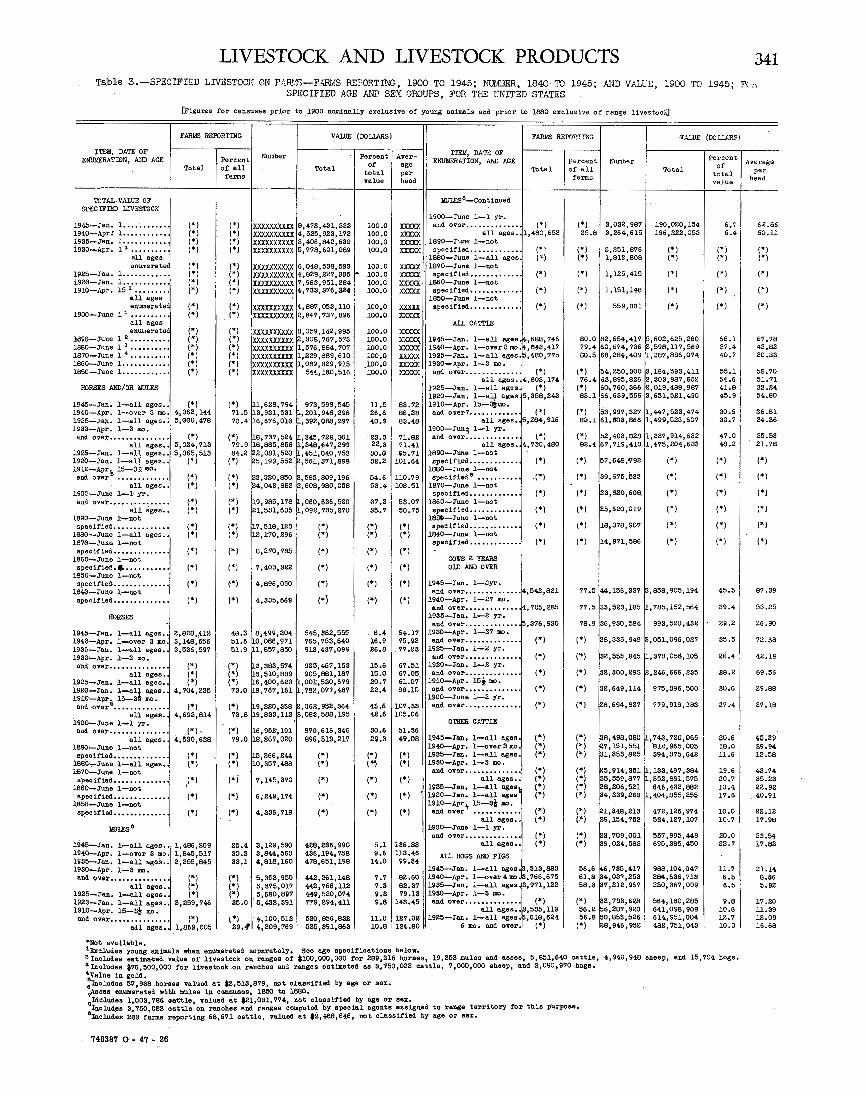
Tables 3 and 4 present for the United States, as a whole, figures for 1945 with as nearly comparable totals as possible for prior censuses. The subsequent tables, which present totals for regions, divisions, and States, do not give all the available data for earlier censuses, as data for values for earlier years are usually omitted. The general arrangement of the division and State tables provides for the presentation of the data for the two or three most recent censuses, and these are followed by other tables showing, whenever the use of space is jus~ifiable, a series beginning with the earliest census for which data are available.
Totals have been made for the value of those classes of livestock and of livestoc~ products for which data were secured in the 1945 Census. It ts recognized thai: these totals do not represent the value of all livestock or all livestock production. Therefore, in tables 3 and 4,where data are given for the United States only, and in tables 5 and 5, where the absolute data are given for regions, divisions, and States, s·uch total values are designated as representing "Specified livestock" or "Specified livestock products." The totals for the earlier years include, as nearly as possible, the same ~>;eneral classes as were included for 1945. Obviously such totals ror earlier years may differ from those shown in the publications for such years.
Explanatory notes accompanyeach table when it is considered necessary to call attention to major causes which might seriously affect the comparability of the statistics. Reference may always be made to tabl~ l to learn what additional inf'ormation may be available in the publications for earlier years, whether tor v~lues, age and sex -classifications, or all data for items not covered in the 1945 Census.
Some of the data on livestock are presented in graphic form in this chapter. Dot maps are used to show the geographic distribution of numbers, productio~and values, based on the•county as a unit. Bar charts are used to picture changes in the number of specified items or in production for the various censuses. On each of four combination bar and line charts, vertical bars have·been used to indicate the numbers of animals enumerated in census years and continuous lines have been superimposed to portray trends and/or cyclical changes in numbers as revealed by annual January 1 estimates of the Department of Agriculture. It is pointed out again that the census enumerations were not always made as of January 1. These charts are discussed more fully in the text in connection with the individual kinds of livestock.
Comparability of statistics.-Many factors affect the comparability or livestock statistics between one census and another. It is emphasized that direct comparison of numbers between any two censuses must take into consideration the age and sex composition. of the number for each census. Frequent references to tables l and 2 and to footnotes to the tables are recommended !or this purpose.
Each census represents, in some degree, a cross section of American agriculture as of a specific date. In accordance with instructions ror 1;he 1945 census. of Agriculture, all livestock
on farms were to be enumerated as of the first day of January of that year. Similarly, for the 1940 Census the date of enumeration was April'l. The official dates for earlier· censuses were as follows: For 1935, 1925, and 1920, January l; for 1930, April l; for uno, April 15; and for 1900 and all precedtng censuses, June l. An accurate comparison of the numbers of 11 vestock for one census with those for another census is difficult when the two censuses were taken in different months becaase of normal seasonal changes occurring from month to month. In general, the numbers of-breeding stock are more nearly comparable than total numbers, although a comparison of the numbers of breeding stock animals is affected by attempts in successive censuses to clarify and improve the inquiries for preceding censuses.
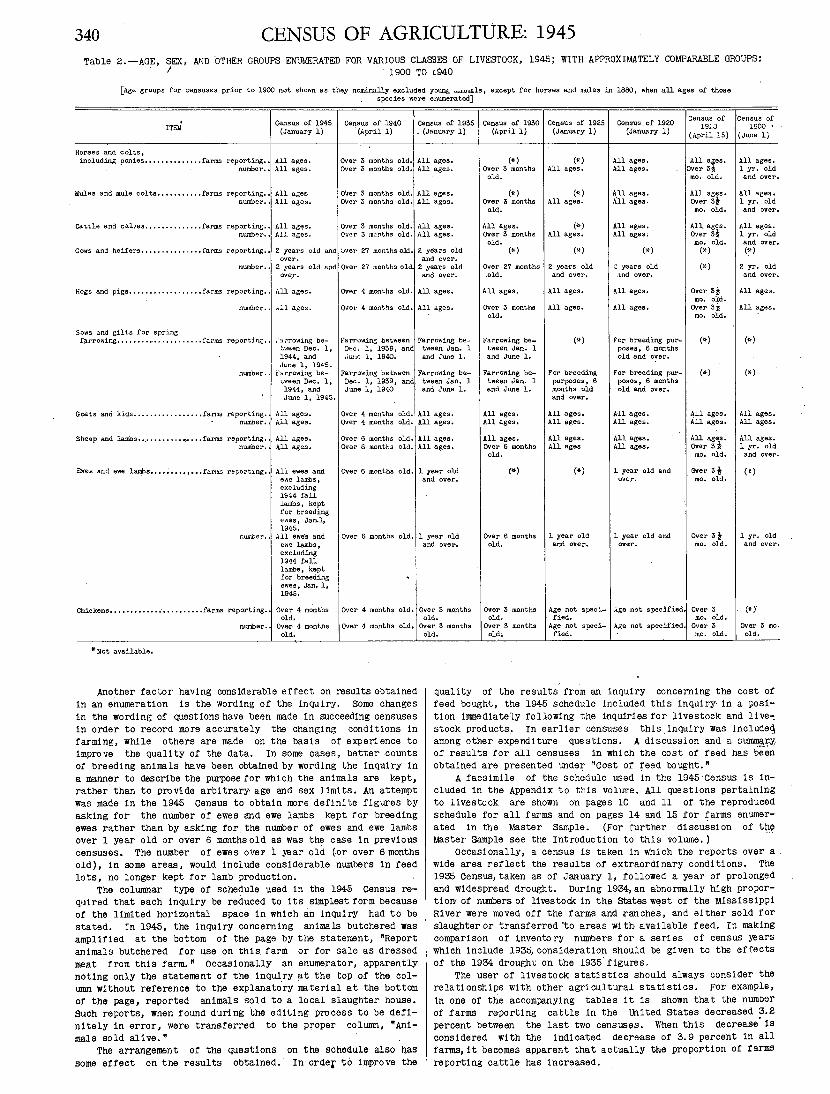
Changes in dates of enumeration from one census to another require that diligence be used 1n determining the age and sex compos! t1on of the statistics for the years being compared. It is for this reason that the information in tables 1 and 2 is frequently referred to in the text and in the tables which follow. Table 1 shows for each census, in abbreviated form, the items enumerated and a description of particular groups or classes. Table 2 presents. the items and groups included in the 1945 Census and. the nearest comparable group enumerated for each preceding census back to 1900. For example, under "Item" is shown "Horses and colts, including ponies." Under "Census of 1945 (January l)" 1s the statement "A~l ages. •· Sim1larly, for each of the earlier cens-uses, a description is g1 ven for the most nearly comparable age group. Thus, in the 1940 Census the age group ror horses is described as "Over 3 months old." By referring to table 1, it is found that the 1940 Census excluded colts less than 3 months old from the enumeration. Again, in table 2, appears the description "Over 3 months old" ror the 1930 Census and reference to table l shows that colts born after January 1 were to be enumerated separate!y as of April 1 ror that year. Hence, the total number of horses and colts, as published in the 1930 Census rep'lrts, included all ages; whereas, in the 1945 Census reports, the number shown for 1930 excludes the colts born after January l, 1930.
It is obvious that a comparison of the number of horses and colts of all ages on January 1 with the number over 3 months old on April 1 does not take into cons1derat1 on changes in inventories owing to mortalltlf or to movement of anima.s to farms from places_ not considered as farms or vice versa, or to the movement of animals from one farming area to another. With respect to horses and mules, these considerations are of minor importance, but with meat animals they are of great importance. For example,- the number of ,cattle co1mted in a census taken on January land in another taken on April l,or June l, might differ considerably because of the normal seasonal changes. for most kinds of meat animals, on January 1 considerable numbers are being fattened in surplus feed-producing areas. Many of these animals, and in some areas practically all, have been marketed by April 1. As a consequence, a simple comparison of a higher number of cattle of all ages on January l of a census year with the number of cattle ov~r 3 months of ag~ as recorded for April l of another year, would not necessarily indicate an increase in cattle numbers. Therefore, when making comparisons of inventory numbers of fann animals between one census and another, 1t is important to consider the differences due solely to the change in the date of enum3rat1on.
For most kinds of 11 vestock, the numbers increase for a {lSriod of yeats, decline for an approximately equal number of years, then increas.e and decline. again periodically through definite cycles, with the length of the cycle varying with the kinds of animals. Census years occurring at five-year intervals do not necessarily coincide _with any one phase of the cycle, either of the relatively long cycle for cattle or the short cycle for hogs, Hence, two censuses, \X)th taken during the same upward swing of a cycle in cattle numbers, would indicate, superficially, a decided increase for the f1 ve-year period, but might actually be' of little slgni!icance in portraying the longtime trend. As ·illustrations of the comparab1l1 ty of data among censuses in relation to cyclic changes in numbers, combination bar and line charts are shown for cattle, hogs, and sheep. Each or these charts is discussed further under the appropriate class of livestock.

SUBiJ:EeT
Horses
Mules
·Cdtlo
Dairy Products
Hogs and Pigs
-Sheep and Woo:l
Goats
Poultry
Value ot LtVBS•toCk and Products
Horses
Kulas
Cattle·
Dairy Products
Hogs and Pigs
Shoop and Wool·
Goats an.d llohair
Poultry
Bees and Honey ·
Jliscellaneoua Iteas
Val.ue ot Livestock and Pro.ducts
... Horses
llu1os C~ttle
llairy ProdUcts
!logs alld Pigs
Shoop and Wool ·
~ta alld llohair
Poultry
Bees and Boney
lliscsllallOous Iteas
Value ot ~i.;eatook u4 l'roducta
LIVESTOCK AND LIVESTOCK PRODUCTS 337
Table l.-HISTORY OF El\UMERATION IN T$ CENSUS OF LIVESTOCK A.i'I!D L!ITESTOCK PHODUCTS: 184U Tv !Y4E
DATE OF CENSl1S AND ITEII
CENSliS OF 1945 (JAN, 1)
Total, all ages, including_ ponies.
Total-, aU ages.
Total,· a:l.l ages; cows and betters 2 years old and oTer; total cattle and Ralves sold alive, 1944; cattle butchered, and calve4 butchered, 1944.
Cows and hatters milked during aD.J part ot 1944; aillc produced, 1944; and whOle •ilk, cream {butterfat content), and butter sold, 1944.
11\)tal, all ages; sows and gilts tor spriq farrowing (tarrowed si:nce Dec. 1, 1944, or to tarrow before J"une 1, 1945); total hogs and. pigs sold alive, 1944; and total hogs and pigs butchered, 19<&4 ..
Total sh~ep and lambs all ages; efts ud ewe lambs kept tor breeding ewe• (·exclUding 1944 tall l811bs); wool shorn, 19«; total sheeip and l..ambs sold· ali·ve, l9.W..
Total, all ages.
Chickens· over 4 months old on D.B.ne1; chicken ega produced, 1944; ohiokens ra·ised (including broilers and tryers·); and turkeys raised, 1944.
Values or sales were obtained iA three groups on the Para and. Ranch Schedule_: All dairy products, all poUltry and poUltry products, and livestock and llvestook products other than dair:y and poultrJ, sold or traded i-n 1944. Values 'of inventories, 1945, and l1yastoct products, 1944, are basad on county-unit prices obtained in cooperation with 'the Department or Acricul.ture.
CENSUS OF 1940 (APR. l)
Total, 1nolud:Lns ponies, oYer 3 110.; and c.olts, 3 to 27 mo.
To·tal'- over 3 mo.; and mula colts, 3· to 27 mo. Total, over 8 mo.; cows and hei:ters (2 yr. old and over on J'an. 1) ·Which 11ero-(a) kept mainly tor aillc production alld (b) kept 1111inly tor bee·f produc,tton; and n\llllbers of cat.:tle and ot calves butchered, purchased, and sold alive, 1939.
,coWs and heifers m.U:ka·d during any part ot 1939; mille produced,
SUBJECT
Horses
llulos
Cattle,
Dairy Products
!lop and Pigs
Sheep and Wool
.1939; butter churned on farms, 1939; and whole :&ilk, creall (butterfat Goats and content), and b11tter sold, 1939. Jrohair
Total, oier 4 mo.; sows and gilts tbat tarro11ed since Dec. 1, 1989, or were. to farrow before 1\ina 1, 1940; and numbers butchered, purc·hased, And sold· •J:iye, 1999.
To·tal ·~beep ana lambs over 6 ao. i yearling ewes (by instruction, 6 to lB.mo.); other ewes OYer 18 mo.; sheep and lambs shorn, 1939; wool produced, 1939; and D.UIIbera butchered, purchased, and sold aliv.e, 1939.
Nuabers ~t .Angora and· of other goa,ts and kids, over 4: mo.; il.ohair and kid hair olippod,l939; and goats mUJI:•" during any part or 1939.
Numbers, over 4- ao., on hand, and nuabers raised, 1939, tor chicken-a, turkeys:. ducka, geese, guineas, pigeons, quail, pheasants, etc.; chickens aold aliYe or dressed, 1939 (any sold as baby chicks omitted); :and chicken eggs produced, 1939.
Hives of bc:tas owned by others, but kept on operator's tar~~,and biYea ot bees owned by the operator, on M.a farm and on .nonterm laad. 8Uoll as deserts, hilla,awem.pa, ate.; and honey produced by operator' a bees.
'Numbers ot silver tox and ot mink taa.les, over S ao., ·kept 1:a cap·tiTitJ; BAd n\11\bers ot silver fox and of aink pelts taken., 1939.
Values were obt,i:ned tor dairy products, liv~stock, poultry and ,poultry products, and other livestock products, sold or traded 1Jl 1939, tn four questions on the !'arm an4 Ruch Schedule. ·values of' i 1nventor1es, 1$40, and liYestook products (except ailk )lroduced), 1939, are based· on county-unit Prices o~tainad i,n cooperatio.a with the Departll8nt or .Agriculture.
CENBUS OF 1935 (JAil. l)
Total (all 'types), all ages; and col to, tmdar 2 yr •
'rotal, all ages; and aUla colts, under 2 yr. TOtal., all ages; calYBS 1 '!l!lder 1 Jl"•i heifers, 1 ;yr. and \ULder 2; s'eers and bulls,. l yr. and oYer, aad oows and heifers, 2 7'r· an.d oYer.
Cows alld hoiters ot all kindS milked during 11117 par~ o't 19M; asd ailk: produced and butter churned o~ taru, 198".
Total, all agee; ~nd sows and gilts wbtch were bred or wre to lie bi"ed to !'arrow ·before June 1, 1'935.
Total sheep and laabs, all ages; awes, 1 yr. tmd O'fBr; and sheep lllld laaba shorn BJld wool produced 1 1934.
Total goa.ta and kids, all ages; and aohe.ir _produced, 193"·
H'UIIbera., over 3 ao .. , on hand, tor oh1okens aDd turke,-a; ah,ioku eBSB produced, lgs4; and chic.lcttns raised (an7 sold by the operator as baby ch.tokB· Oll1tto4), 1934.
No inqUiry.
' No lillCIUiry.-
No inqUiry em· the 'Jam and Ra!ICh Sohodule. Values ot·iavontor1oa, 1935, and lhoatook produoto (oxoopt allk pro4uood), 1VI4.,, are 'basad on .s·ta,te-un-it prioea o'btaia.ecl iD oooperatieD. witll the Departmon~ or. J81'ioulture~ '
Poultry
Bees and llouy
llis..Uanooua Itau
Value or Ltvestoolt aDd Products
lluloa
Ca~tlo
De1ry ProdQO~s
Hogs and Ptga
Shoop alld Wool
Cloa~a and lfo_hair
Poultry·
Beee ud Boney
DATE OF CENSUS AND IT~
CENSUS OF 1950 (APR. 1)
Colts bon attar J'an. 1, lvau; colts born, 1929; colts boro., 1928; and horses born betore 1928. Bread and nu:.ber o! registered purebred mares end mare colts; and stallions and stallion colts. Mllabers purchased and sold alive 1 aud hides sold, 1929.
Mule colts born attar Jan. 1, l9SO; aula colts born, 1929; aula colts born, 1928; and 11.u.J.as born betore 1928. HUilbers purchased and sold alive, and hides sold, 1929.
CalVes born after J'an. 1, 1930; steers and bulls born, 1929; baiters born, 1929; bulla born before 1929; steers born, 1928_; steers born betore 1928; hei('ers born, 1928, which we:re-(a) kept mainly tor milk cows and (b) .. pt mainly for beer cows or bear production; cows and baiters born before 1928, which were-(a) kept mainly tor ail.k production and (b) kept mainly "tor beet prodUCtion. Breed and number or registered purebred cows, hatters, and baiter calvea; and bulls and bull calves. HUIIbars ot cattle and or cel.vea slaughtered, purchased, and sold alive, 1929; and hides ~..,. cattle and of calYes aold, 1929·
Cows and heifers (both boer and dairy) milked duri"'! any part of 1929; ot these, the nUJiber mainly of beat or ot dual-purpose breeding; cows and baiters being •1lked daily and daily production ot .uJc at ti.- of entaeration; milk produced, butter churned, ail.k sold as whole a!lk, cream. sold as buttertat, cream aold not as buttertat, and butter sold, 1929.
Pigs born attar J'a.u.. l, 1930; sows and gilts that bad farrowed since J"an. 1 or were to farrow before .rune l, 1930; and other hogs and pigs bor11. baton J'an. 1, 1930. Breed and .nUIIber ot registered purebred hogs and pigs. Hwlbers slaughtered, purchased, and sold aliYe, 1929.
Laabs bom attar Oct. 1, 1929; rams and wethers born be tore Oct. l, 1929; yearling awes born between Oct. 1, 1~28; and Oct. 1, 1929; 8ll.d awes born betore Oct. 1, 1928. St-eed and number ot registered purebred sheep and lallbs. !fWibers of sheep and lUbe slaughtered, purchased, aold alive, and skins sold, 1929. Sheep and laJiba shorn, 1929; and wool produced, 1929.
Augora goats and kids, all asas; other gOnta and k~ds, all agea.; Angora goats and kids clipPed, 1929; and aohair and kid hair prodUced, 1929.
Chickens, over a .11.0., on band; nuabera raised, 1929, tor chickens, geese, ducks, and turkeys; chicken eggs produced, chicken eggs Bb"'-d, ohicken~t sold, and baby chicks bought, 1929; and daily proa.uctlon or chicken esga at the t1Ae or ·~UII.er&tion.
B1Yas ot" baas, owned by operator, on hls 1'ara or elsewhere; and J;aone7 produced, 1929.
Asaas and ·burros, all agee.
Values were obtained in a lump sua OD. the schedule, :tor: (a) All livestock· sola or traded in li29; and (b) all milk, ere•, butter, buttertat, aeat, poultry, ega, honey, wool, JII.Ohair, &.Dd other livestock products sold or traded 1 1'929. Value a wre obtained. on the schedule aoparately tor: (a) llill< sold as whole aill<; (b) croaa sold as butterfat; (c) creaa sold not as butterfat; and (d) butter sold (cbu:i'ned on this tam). Values ot inYen"bories, 19301 and of 11Yastock: products (except ailt produced) 1 19291 are base~ Oil
coun.t:y-\ULit prices obtai.D.ed in cooperation with Departaant of Agrioul~uro.
CENSUS OF 1925 (JAN. 1)
U"ader 2 'fr•; and a yr. ana ov • .r.
UI:Ldar 2 '17:•i ad 2 yr. aad oft!".
Boot oal>tlo (cattle kept llllinl:r tor beer produotioa): CalToo UDd.er 1 Jr.; hei:tera, 1 'fr• ud under 2; oows and beit"era, 2 p:. and over; steers (of dairy an.4 beer atook:), 1 yr. u.d oYer; u.cl b'lllla, l 'ir· alld onr. De.iry oattlo (ca.ttlo kop~ llllinly tor ailk Jrod.uct.ton): Bulla, 1 yr. ad oyer; calves, un.dar l yr.; beitera, 1 yr. aa4 \lllder 2; and oow B.Ad btitars, 2 yr. and oyer.. Calves bora alld ra1oe4, 1924; nuabera or calveo and or other oattle slauabtered t'or f'ood, 19:U. · •
Cows allko4 (dairy con and boot cow) duri"'! an:r part or 1924; llilk produced, butter aada, butterfat sold, creBJl 110ld ( :aot oa a butterfat basis), Blld whale ii.U.t sold. (ILOt on a butterfat baala) •· 1924.
P·igs, UD.!ler 6 ao.; sows and gilts tor breadin& purposes, 6 ao. and oYer; ad all otller hogs • 6 110. and onr i p:lga born and raised, 1924; llosa an4 p1sa al!>ll(!htored tor rood, 1924,
Le.llbe, Ulld.er 1 ,r.; ewee, l 'lr• aud overi and. rue and wetbera, 1 Jr. aA4 oyer i laDe bom and raised. 19M; ah"P alii J.aaba sla.qhtere4 tor food, liM; sheep llhoru. and wool produced, 1924:.
Goats and. kicla, all. aa••; u.d nu.ber ehom od aoha1r prod'UCecll lt84..
'l'o~al olli.-a ad ~otol ~urkoya (agoe 110t apocitio4); chioll:ell egsa )ll"odli.Ced ud. ah.1c.telll raiaad, 19U.
llo illi!Uir)',
338
Miscellaneous Items
Value of Livestock and Products
Horses
Mules
Cattle
Dairy Products
Hogs and Pies
Sheep and Wool
Goats and Mohair
Poultry
Bees and Honey
Miscellaneous Items
Value of Livestock and Products
Horses
Mules
Cattle
Dairy Products
CENSUS OF AGRICULTURE: 1945 Table 1.-HISTORY OF ENUM!:RATION IN ·THE CENSUS OF LIVESTOCK J\1\ID LIVEO:TOCK PRODUCTS: 1840 TO 1945-Continued
DAn OF CEl\SUS AND ITEM
CENSUS OF 1925 (JAN. 1)-<:ontinued
No inq'.Jl·ry.
No inq•~iry on the Fann Schedule. Values of inventories,l925,and livestoc;.:. products (except milk produced), 1924, are based on county unit prices, obtained in cooperation with the· Department of Agricultur·eo
CENSUS OF 1920 (JAN. 1)
ON FARMS: Colts, under 1 yr.; colts, 1 yr. and under 2; mares, 2'yr. and over-; geldings, 2 yr. and over; and stallions, 2 yr. and over.
~~~~i~~ ~u:b:~a~ii~~g~~~~d purebred ~res and ma·re. colts, ~d NOT 0!~ FARUS: COlts under 1 yr.; colts, 1 yr. and under 2; mares, 2 yr. and over;. geldings, 2 yr •. and over; and stallions, 2 yr. and over.
Or! F..1.R1!S: Mule colts, under l yr.; mule colts, 1 yr. and ·under 2; and mules, 2 yr. and over. NOT ON FARUS: Mule colts, under 1 yr.; mule colts, 1 yr. and under 2; and mules, 2 yr. and over.
ON FAR.M.S: (a) Beef cattle {cattle kept mainly for beef p'roduction)calves, unde-r "1 yr.; heifers, 1 yr. and under. 2r cows and heifers, 2 yr. and over; steers, l yr. and under 2; steers, 2 yr. and over; and bulJs, l yr. and over; (b) dairy cattle (cattle kept mainly for milk production)-calves, under 1 yr.; heifers, 1 yr. arid unde-r 2; cows and heifers, 2 yr. and over; and bulls, 1 yr. and over. Breed and number of registered purebred cows and heifers of' all ages, and bulls and bull calves. Calves born and raised,l919. Cattle and calves slaughtered and pounds of meat and meat pr6ducts sold, 1919 NOT ON F.-i.RL!S: (a) Beef cattle (cattle kept mainly for beef production)-calves, under l yr.; heifers, 1 yr. and under 2; cows and heifers, 2 yr-. and over; steers, 1 yr. and under 2; steers, 2 yr. and over; and bulls, 1-yr. and over; (b) dairy cattle (cattle kept rnaiP~Y for milk production)-calves, under 1 yr.; heifers, 1 y-r. and under 2; cows and heifers, 2 yr. and over; -and bulls, 1 yr. and over.
o;;. :',.,.;.-J.3: =.:it"k produc(!:l, lJ::t..tcr an::.i ct-,e"o::!';e made on farms, milk sold, cream. sold, butterfat sold, and butter sold, 1919;
m: FAP.:.:S: Pigs, under 6 mo.; sows and gilts for breeding purposes, 6 mo. and over; boars for breeding purposes, 6 mo. and over; and all other hogs, 6 mo. and over. Breed and number of registered purebred hogs and pigs. Pigs born and raised, 1919 •. Hogs and pigs slaughtered and pounds of meat and meat products sold, 1919. NOT ON FARMS: Pigs, under 6 mo.; sows and gilts for·breeding purposes, 6 mo. and over; boars .for breeding purposes, 6 mo. and over; and all other hogs, 6 mo. and over.
ON FARMS: Lambs, under 1 yr.; ewes, 1 yr. and over; rams, 1 yr. and over; and wethers, 1 yr. and over. Bz:eed and number of registered purebred sheep and lambs. Sheep shorn and wool produced, 1919. · Lambs born and raised, 1919,. Sheep and lambS slaughtered ahd pounds of lOOat and meat products sold, 1919. NOT ON F/,R:JS: Lambs, under 1 yr.; ewes, 1 yr. and over; rams, 1 yr. and over; and wethers, 1 yr. and over.
ON FARMS: Kids, under i yr., and goats, 1 yr. and over, raised fOJ' fleeces; and all other goats and kids. Goats shorn and mohair producCd, 1919. NOT ON FARMS: Kids, under 1 yr., and goats, 1 yr. and oVer, raised for fleeces; and all other goats And kids.
ON FARMS: Numbers on hand (a~es ~t specified) for chickens, turkeys, ducks, geese, guinea fowls, and pigeons. Chicken .eggs produced and eggs sold; and chickens raised, and chickens· sold,l919.
ON FARL1S: Hives of bees; honey produced, 1919; and beeswax PI'9duced, 1919.
ON FARMS: Asses and burros, all ages· Nor ON FARMS: Asses and burros, all ages.
ON FARYS: Values were enumerated for all items except: Milk produced butter and cheese made on farms; numbers of sheep shorn and of goats shorn; chickens raised; eggS· produced; honey and beeswax produced; your.g animals raised; purebred animals, 1920; and· domestic animals slaughtered for food, 1919. NOT ON FARMS: No values were enwner·at.ed for livestock or livestock product:;..
CENSU~ OF 1910 (APR. 15)
ON FA.RMS: !.:i.ares, stallions, and geldings born before Jan. 1, 1909; colts born, 1909; and colts born after Jan. 1, 1910. Colts born on the farm, 1909 (if numbE!r born not known, number raised). Number and breed of purebred horses registered or eligible for register. Horses and colts purchase-d, 1909; and sold alive, 1909. NOT ON FARMS: Colts born after Jan. 1, 1910; colts born, 1909; and horses born before Jan. 1, 1909;
ON FARMS: Mules born before Jan. 1, 1909; mule colts bon"l, 1909; and mule colts born after Jan. 1, 1910. Mule colts born on the farm, 1909 (if number born not shown, nwnber raised). Mules purchased, 1909 and sold alive , 1909. NOT ON FA.FWS: Yule colts born after Jan. lt 1910; mule colts born, 1909; and mules born before JA.n. 1, 1909.
ON FAFJAS: Cows and heifers born before Jan. 1, 1909 which were-(a) kept for milk and (b) not kept for milk; heifers born, l909;calves · born after Jan. 1, 1910; steers and bulls born, 1909;and steers and bulls born before Jan. 1, 1909 .which were-~a) kept for work and (b) not kept for work. Calves born on the fann.,l909 (if number born not known, number raised). Number and breed of purebred cattle re~istered or eligible for register. Numbers of cattle and of calves purchased, sold alive, and slaughtered on farms, 1909. . NOT ON FARUS: Calves born after Jan. 1. 1910; steers and bulla born 1909; steers and bulls born b~fore Jan. 1, 1909, which were-(e) kept for work and (b) not kept for work; cows and heifers born, 1909; cows and heifers born before Jan. 1, 1909, which were-(a) kept for milk and (b) not kept for milk.
ON F.AR11S: Milk, butter, and cheese produced; and milic, ·butter, cream, butterfat, and cheese sold, 1909.
SUJJJ::.CT
Hogs and Pi~s
Sheep and Wool
Goats and llohair
Poultry
Bees and Honey
Miscellaneous Items
Value of Livestock and Products
Horses
Mules
Cattle
Dairy Products Hogs alld Pigs
Sheep and Wool
Goats and Mohair
Poultry
Bees arxl Honey
Miscellaneous Items
Value of Livestock and Product:;
DAT~ OF CENSUS ;,;ID ITEM
CENSUS OF 1910 (APR. 15)-Cont±nued
ON FARI-,:5: Born before Jan. 1, l910;and pigs born after Jan.l,l910. Pigs born on the farm, 1909. Number and breed of puTebred hogs registered or eligible for retiister. Hogs and pigs purchased, sold alive, and slaughtered on fanns, '1909. i!OT ON FAru.:8: Pigs born after Jan. 1, 1910-; and hogs and pigs born before Jan. l, 1910.
ON FARMS: Ewes born before Jan. 1, 1910; ·rams and wethers born he fore Jan.l, 1910; and lambs born after Jan.l, 1910. Lambs born on the farm, 1909. Number and breed of pu-rebred sl)eep registered or eligible for register. Sheep purchased, sold alive, and slaughtered, 1909. Number of fleeces shorn and pounds of woo: produced, 1909. )iOT ON FARMS: Lambs born after Jan. 1, 1910; ewes born before Jan. 1, 1910; and rams and wethers born before Jan. 1, 1910 ••
ON FARMS: Goa·ts anrl kids, all ages. Kids born on the fa,rm, 1909. Nwnber and· breed of purebred· goats registered or eligible for register. Goats purchased, sold alive, and slaughtared, 1909. Number of fleeces and pounds of mohair (goat hair) produced, 1909. NOT ON FARMS: Goats and kids, all ages.
ON FAR.IdS: Numbers, over 3 mo.,for chickens, turkeys, ducks,geese, guinea fowls, and pigeons. Fowls (all kinds) raised, fowls sold, eggs produced and eg5s sold, 1909.
ON FARMS: Swarms, hives, or colonies on hand; honey produced, 1909; and beeswax ·produced, 1909.
ON FidWS: Asses and burros, all ages. Number and· breed· of purebred asses registered or eligible for register. Asses and bu-rros purchased, 1909; and sold alive, 1909 •. Total amount (dolla·rs) received for boarding or pasturing domestic animals not owned by operator, 1909. NOT ON FARMS: Asses and burros, all ages.
ON FARMS: Val:ues were enumerated for_ all livestock inventory and livestock prodUction items, except anirr.als born on the i'nrm, 1909, an~ purebred animals. · · NOT ot~ FA!'J.lS: Values were enumerated .for all livestoCk inveptory items on ~.;:.,_ ::·...:!·. ':iule.
CENSUS OF 1900 (JUNE 1)
ON FARMS: Colts, under 1 yr.; horses, 1 yr. and under 2; and horses, 2 yr. and over. Pure-blo·oded horses,. recorded or eligible to record. NOT ON FARMS: Colts, under l yr.; horses, 1 yr. and· under 2; and horses over .2 yr.
ON F.AR.ii!S: Mule colts, under 1 yr.; 1 yr. and under 2; and mules, 2 yr. and over. NOT ON FARMS: Mule colts, under 1 yr.; mules, 1 yr. and under 2; and mules, over 2 yr.
ON FARMS: Calves, under 1 yr.; stee-rs, 1 yr. and u . .rl.der 2;·steers, 2-yr.and under 3;steers, 3 yr. and over;bulls,·l yr. and over; heifers, 1 yr. and under 2; cows, 2 yr. and over which- were (a) kept for milk, and (b) not kept for milk. Pure·-blooded cattle, recorded or eligible to record. NOT ON FAR1lS: Calves, under 1 yr.; steers, 1 yr.. an.i under 2; steers, 2 yr. and under 3; steers, over 3 yr.; bulls, over 1 yr.; and heifers 1 yr. and unde.r 2'; and cows over 2 yr. whic·h were (a) kept. for milk and (b) not kept for milk.
ON FA.f.MS: Milk, butter, and cheese produced; and milk, cream, butter, and cheese sold, -1899. ON FARMS: Total, all ages. Pure-blooded swine, recorded or eligible to record. NOT ON FARMS: Total, all ages.
ON FARIJS: Lambs, under 1 yr.; ewes, 1 yr. and ·over; and r<lJlls and ·wethers, l.yr. and over. P:u·re-blooded sheep; recorded or eligible to record. Number of fleeces and weight of wool produced, fall of 1899 and spring of 1900. NOT ON FARMS: Lambs, under 1 'yr.; ewes, over 1 yr.; and rams and wethers , over 1 yr.
ON FARMS: Goats, all ages. Pure-blooded Angofa goats, recorded or ellgible to record. Number of fleece's of mohair and of goat hair and weight of mohair and of goat hair produced·, fall of 1899 and spring of 1900-. NOT ON FARMS: Goats, all ages. • ObJ. FARMS: Numbers, over 5 mo., for chickens (guinea fowl incl.aded with chickens), turkeys, geese, and ducks; and eggs of all kinds produced, 1899.
ON FARMS: Number of swarnts or hives; honey produced, 1899; and wax produced, :)..899.
ON FARMS; Asses and burros, all ages. NOT ON FARMS: Asses and burros, all ages.
ON F~: Values enumerated for all inventory· items except pureblooded animals. The following ·Values for livestock .products were enumerated: Value· Of sales of live animalS raised on farm; market value of meat and byproducts .from animals that were slaughtered or that died on fann, 1899; total value of milk, cream, butter, and cheese produced, 1899, and used. on farm; amounts received from sale of milk, of creaffit of butter, and of cheese, 1899; value of wool, of mohair, and of goat hair produced, fall of lb99 and spring of 1900; total value of all kinds of poultry on hand (all ages), and of all kinds of poultry raised, 1899; total value of all eggs prodUC!ii,ld, 1899; and total values of honey and wax produced, 18.99.
gg~RA~C~~A :a;~~~w::ilie~~ea~:e~:!dd~n which were included all livestock guest~onl} asked on- the .General Farm ·Schedule with the_following variations; ta) Number and ktnd of live animals purchased for the ranch and range during 1899; (b) amount paid, during 1899, for live animals ori the ranch or range for breeding or feeding purposes; (c) number and kind of live animals sold from- the ranch or range during 1899· (d) amount received, during 1899, from sale of live animals; (e~ number and kind of animals slaughtered on the ranch or range during 1899,; (f) market value of meat and· other animal products of all .animals slaughtered on the ranch or range, for home use or for sale; and (g) amount received, during 1699, from the ~}ale of hides and pelts of animals dying from disease or accident. tFigures for livestock items enumerated on this schedule a·re included with figures for livestock on farms.)
Horses
Mu':l:es
Cattle
Dairy Product!:
Hogs and Pigs
Sheep and Wool
Goats and· Mohair
Poultry
Bees and. Honey
Miscellaneous Items
Value of Livestock
Horses
Muil:es
Cattle
Dairy ··Products
Hogs and Pies
Sheep and WOol
Goat's a~d· Mohair
Pouil.try
Bees and· Honey
Miscellaneous Items
Value of Livestock and Produc·ts
Horses
Cattle
Dairy Pt!oducts
Hogs SodPigs
Sheep and Woo1
Goats' and l.!ohair
Poultry
·LIVESTOCK AND LIVESTOCK PRODUCTS 339 Table 1.-HISTORV OF ENUMERATION IN TP.E CENSUS OF LIVES'IOCY. AND LIVESTOCK PRODUCTS· 1840 TO 1945-Continued
DATE OF CENSUS AND ITEI!
CENSUS 0F 1890 (JUNE 1)
, Total on hand (age not. specified). Foaled, 1889; and.sold, 1889. .Hors~s, mules, and asses died, 1889.
Total on hand (age not specified). Foaledt 1889; and sold·, 1889. ·Died, 1889 (inc;luded With horses anrl asse~}.
NUmbers on hand (age not specified) for workins oxen, :milk cows, ~ and foP other cattle. Purebred (recorded); grade (one-half blood or higher).; coll\.Gion or native (less than one-half blood). Calves dropped, 1889; cattle sold, alive or slaughtered, 1889; cattle slaughtered for use on t,he farm, 1889; cattle died-; 1869.
Mitk, butter, and cheese produced, 1889. !.!ilk disposed of bySale for family consumption; sent to cr·eamery or factory; used on farm, inc1uding for but:te,r· and cheese; used for raising cream for sale. Cream-Sent. to crea:nery or factory; sold elsewhere. Butter sold. CheeSe sold·.
i Total on hand ·(age not specified). Sold, 1889; consumed on
, operator':;; far.11, 1889; and rlied. 1689.
Numbers on hand (age and sex not specified) for Merino; for English breeds; and for all other sheep. Lambs riropped, 1869. "Spring lambs1' sold for consumption in 1889·; and 11 other than spring lambs 11 sold, 1889. Slaughtered f-or farm use, 1889; killed by dogs, 1889; and di:ed from disease or weather, 1889. Fleeces shorn and weight Of .wool, spring of 1890 and fall of 1889.
Numbers (age not specified) for 1\ngora and grades above half b;tood, and for convnon and gr·ades below half blood.
Numbers On hand (age not specified) for chickens, for turkeys, for geese, and :Cor ducks. Eggs of all kinds produced, 1889, and eggs sold, 1889. ·
Stands of bees. Honey produced, 1889, and wax produced, 1689.
A·Sses (age not specified)., number on hana; ·munber foaled, 1889; and· number sold, 1889. Number of asses that died, 1.889, included with horses and rnu.l.es. Number of dogs.
Value of all livestock enumerated in a lump sum. Values were ~numeratec;l for all poultry sold, .t:Or all eggs sold, and for 11.oney S.nd wax sold, 1889.
CENSUS OF 1880 (JUNE 1)
Total, all ages.
Total, mules and asses, all ages.
Numbers on 'hand (age not specified), for working oxen, milk cows, and other cattle. Calves ·dropped, 1879. Numbers, of all a;;:es,
, pu·rc'hased, sold. living, slaughtered, died, st:r.ayed, and stolen, 16?9.
Milk sold 01 sent to butter or cheese factories, 18:79. Butter , made on farms and cheese made on farms, 1879.
Total (age not specified).
Total sheep (age not specified). Lambs dropp~d, 1879. Sheep and 1 lambs purchased, sold living, slaughtered, killed by dogs, died of disease, and died of stress of weather, 1879. Wool clip, spring of 1880, ,shorn or to be Shorn: Nuinber o.f flee~:es, nnd weight of wool.
, ·No ilnquiry.
:Numbers of: pouitry uu hand; exclusive of sp:ring hatching, 11for barnyard,11 anrl for "other" poultry •. Eggs produced, 1879.
H~ney pro?uced and beeswax produced, 1879.
A-sses, .all ages, included with mules.
, V~lue of inventory for livestock enumerated in a lump sum.
CENSUS OF 1870 (JUNE l)
Total {age not specified).
'I!btal, mu,l:es arid as-s'es (age not spec~fied).
Nwnbe:rs £or milk cows, working oxen, and other catt.le (c~lv~s excluded by instruction) .•
Butter and cheese made· on farms and milk sold· during the year ending June r, 18?0. .
, Nuinber ·("sucking" pigs excluded by .tnstruction).
Number (,spripg lambs e:<cluded· by inst~uction). Wool produced during , the year end:Lng June 1, 1870.
No inqui,.Y.
,j No inquiry.·
SUBJECT
Bees and Honey
Miscellaneous Items
Value of Livestock and Products
Horses
Mules
Cattle
DaLy Products
Hoes and Pigs
Sheep and ~lool
Goats and Mohair
Poultry
Bees and Honey
Miscella"neous Items
Value of Livestock and Products
Horses
Mules
Cattle
:Jairy Products
Hoes and Pigs
Sheep and Wool
Goats and Mohair
Poultry
Bees and Honey
Miscellaneous Items
Value of Livestock and Products
Horses
llules
~Cattle
Dairy Products
Hogs and Pigs
Shoop and Wool
Goats and llohair
Poultry
Bees and Honey
}fiscellaneous Items
Value of Livestock and Products
DATE OF CENSUS AND ITEII
CENSUS OF 1870 (JUNE 1)-Continued
Honey anr\ beeswax produced during the year ending June 1, 18?0.
Asses (age not specified), included with mules. Pounds of silk cocoons produced during the year ending June 1, 1870.
Value of live!::tock of ev.;;ry descri~;~tion (wnether ~nur..er:J.terl or not) was obtainP.rl in a lump sum. Value of animals slaughtered or sold for sla:;Gnter, during the year ending Jun(; 1, 1670! was also obtained.
CENSUS OF 1860 (JUNE l)
Total (age not specified).
Total, mules and asses (age not specified)
Numbers (ages not specified), for r.iilk cows, working oxen, and other cattle.
Butter and cheese produced duri.rlP, the year ending June 1, 1860.
Total (age not specified).
Total sheep ( 'l6C not specified). Wool produced during the year ending June 1, 1660.
No inquiry.
No inquiry.
Honey and beeswax produced during the year ending June 1, 1860.
Asses (age not specified), included with mules. ·Pounds of silk cocoons produced during the year ending June 1, 1660.
The value of all livestock on hand was enwnerated in a lump sum. A value of animals slaughtered (no limiting dates) was enumerated.
cmsus oF 1850 (JUNE 1)
Total (age not specified).
Total, mules and asses (age not specified).
Numbers for milk cows, working oxen, and other cattle (1 yr. and· over, by instruction).
Production of butter and of cheese during the year ·ending June l, 1850.
Total (age not specified).
Number (i yr. and over, by instructior.). Production of wool , during the year ending June 1, 1850.
No inquiry. \ _
No inquiry.
Honey and beeswax produced during the year ending June 1, 1850.
Asses include:d with mules. Pounds of silk cocoons produced during the yea·r ending June .1, 1850.
The value of all livestock on hand was enumerated in a lump sum. A value of 3.nimals slaughtered during the year ending June l, JB&l, was enumerated.
~ENSUS OF i840 (JUNE l)
Total, horses and mules (ag&s not specified).
Included with horses.
Total neat cattle (age not specified).
(See below, Value of Li"'Vestock and Products.)
Total (age not specified).
Total sheep (age n~t specified). Pounds of wool, no mention of year or glips included.
No inquiry.
(See below, Value of Livestock and Products.)
Pounds of wax, no mention of year.
Pounds of cocoons, no mention of year.
No total value fo.L· J.~Vestock inventory was enumerated. However, a value for products of the dairy and an estilnnted value of all poultry were enumerated.
340 CENSUS OF AGRICULTURE: 1945 Table 2.-AGE, SEX, AND 'oTHER GROUPS ENUMERATED FOR VARIOUS CLASSES OF LIVESTOCK, 1945; WITH APPROXIMATELY COMPARABLE GROUPS:
. I 1900 TO L940
[Age groups for censuses prior to 1900 not shown as they nominally excluded yoUJlt. .,..IJ..uuals, except for horses and mules in 1880, when all a·ges of those species were enumerated]
Horses and colts,
Census of 1945 (January 1)
l Census of 1940 Census of 1955
· (A.pril l) . (January 1) Census of 1930 Census of 1925
(April 1) (January 1) Census of 1920
(January 1)
c~nsus of 19;.J
(April 15)
Census of 1900
(June 1)
including ponies •••..•........ farms reporting •. All ages. Over 5 months old. All ages. (*) (*) All ages. t>!!~ ~ies. All ages. number .. All ages. Over 5 months old. All ages. Over 3 months All ages. All ages. - 1 yr. old
old. mo. old. and over.
J.(ules and mule colts .•......... farms reporting .. All ages OVer 5 months old. All ages. (*) (*) All ages. All ages. All ages. Over 3! number .. All ages. OVer 3 months old. All ages. Over 5 months All ages. All ages. 1 yr. old
old. mo. o1d. and over.
Cattle and caL1es., . .......... ,farms reporting .. All ag~s. Over 3 months old. All ages. All ages. (*) All ages, All ages, All ages. Over 3! number., All ages. Over 3 m:::nths old. All ages. Over 3 months All ages. All ages• 1 yr. old
old. mo. old. and over. Cows and heifers .•. , ........... far!I!S reporting., 2 years old and vver 27 months old, Z years old (*) (*) (*) (*) (*)
over. and over, number., 2 years old and Over 27 months old 2 years old Over 27 months 2 yea-rs old :;: years old (*) 2 yr . old
over. and over. . old. and over. :1nd over. and over.
Hogs and pigs •..... , ........... farms reporting .. All ages. Over 4 months old. All ages. All ages. All ages, All ages. Over 5~ All ages. mo. old.
number .. i-.ll ages. Over 4 months old. All ages. Over 3 months All ages. All ages, Over 3! All ages. old. mo. old.
Sows and gilts for spring f~rrowing . ....... ·-. , .......... farms reportj J1.S •• :-·EJ.rrowing be
~ween Dec. 1, 1944, and June l, 1945.
Farrowing .between Farrowing beDe..::. 1, 1939, and tween Jan. 1
Farrowing between Jan. 1 and June 1.
(*) For breeding pur- (*) (*) poses, 6 mon.thS
,June l, 1940. and June l. old and over.
number .. Farrowing bet.ween Dec. 1, 1944, and June 1, 1945.
Farrowing between Farrowing beDec. 1, 1939, and tween Jan. 1
Farrowing between Jan. 1 and June l.
For breeding pUrposes, 6
For breeding pur- (*) (*) poses, 6 months
June 1, 1940 and June 1. months old old and over. and over.
Goats and kids ................. farms reporting. All ages. Over 4 months old. All ages. All ages. All ages. All ages. 411 ages. All ages. number .. All ages. Over 4 months old. All ages. All ages. All ages. All ages. All ages. All ages.
Sheep aod lambs .. _ ...... ···- .•• farms reporting .. All ages, Over 6 months old. All ages. All ages. All ages. All ages. All ages. Over 3 ~
All ages. number. All ages. Over 6 months old. All a:ges. Over 6 months All ages All ages. l yr. old
old. mo. old, and over.
Elfes and ewe l~s ... .. , ... , .. . farms reportl.ng. All ewes and ewe lambs, excluding 1944 fall
Over 6 months old. 1 year old (*) (*) 1 year old and Over 5 ~ (*) and over.
lambs, kept for breeding ewes, Jan.l, 1945.
numbt~!'. , All ewes and Over 6 months old. 1 year old ewe lambs, and over. excluding 1944 fall lambs, kept for breeding ewes, Jan. 1, 1945.
Over 6 months 1 year old old. and over.
over.
1 year old and over.
mo. old.
Over 3 ~ 1 yr. old mo. old. and over.
Chickens ..••........ ; ...••.•... farms reporting .• Over 4 months old.
Over 4 months old. Over 3 months old.
Over 3 months old.
Age· not specified.
Age not spedfied::jOver 3 mo. old:.
number. Over 4 months old.
Over 4 months old. Over 3 months old.
Over 3 months old.
Age not specified.
Age not specified, Over 3 · mo. old ..
Over 3 mo. old.
*Not available,
Another factor having considerable effect on results obtained in an enumeration is the wording of the inquiry. Some changes in the wording of questfons have been made in succeedlng censuses in order to record more accurately the changing conditions in farming, while others are made on the basis of expert ence to improve the quality of the data. In some cases, better counts of breeding animals have been obtained by wording the inquiry in a manner to describe the purpose for which the animals are kept, rather than to provide arbitrar~ age and sex limits. An attempt was made in the 1945 census to obtain more definite figures by asking for the number of ewes snd ewe lambs kept for breeding ewes rather than by asking for the number of ewes and ewe lambs over 1 year old or over 6 months old as was the case in previous censuses. The number of ewes over i. year old (.or over 6 months old), in some areas, would include considerable numbers in feed lots, no longer kept for lamb production.
The columnar type or schedule used in the 1945 census required that each inquiry be reduced to its simplest form because of the limited horizontal space in which an inquiry had to be stated. In 1945, the inquiry concerning animals butchered was amplified at the ·bottom of the page by the stateroont, "Report animals butchered for use on this farm or for sale as dressed meat from this farm." occasionally an enumerator, apparently noting only the stateiOOnt of the inquiry at the top or the column without reference to the explanatory material at the bottom of the page, reported animals sold to a local slaughter house. Such reports, when found during the editing process to be definitely in error, were transferred to the proper column, "Animals sold alive. •
The arrangement of the questions some effect on the results obtained.
on the schedule also has In order to improve the
quality of the results from an inquiry concerning the cost of feed bought, the 1945 schedule included this inquiry· in a position imnediately following the inquiries for livestock and live-_ stock products. In earlier censuses this Inquiry was include<\ among other expenditure questions. A discussion and a SUill!Dil,l'.Y·
of results for all censuses in which the cost of feed has be~n obtained are presented under "cost of feed bought."
A facsimile of the schedule used in the 1945 Census is included in the Appendix to this volume. All questions pertaining to livestock are shown on pages 10 and ll of the reproduced schedule for all farms and on pages 14 and 15 for farms enumerated in the Master Sample. (For further discussion of tl;l~
Master Sample see the Introduction to this volume.) occasionally, a census is taken in which the reports over a.
wide area reflect the results of extraordinary conditions. The 1935 Census, taken as of January l, followed a year of prolonged and widespread drought. During 1934, an abnormally high proportion of numbers of livestock in the States west of the Mississippi River were moved off the farms and ~anches, and either sold for slaughter or transferred 'to areas with available feed. In ma.kil\g comparison of :t.nvento r~l' numbers for a series of census years which include 193b, consideration should be given to the effects of the 1934 drougho on the l935.figures.
The user of livestock statistics should always consider the rela ti oil ships with other agricultural s ta ti sti cs. For example, in one of the accompanying tables it is shown that the number of farms reporting cattle in the United States decreased 3.2 percent between the last two censuses. When this decrease" is considered with the indicated decrease of 3.9 percent in all farms, it becomes apparent that actually the proportion of farms repo.rting cattle has increased.
LIVESTOCK AND LIVESTOCK PRODUCTS 341 Table 3,-SPZCIFIED LIVESTOCK ON FAR!.'S-FARl\lS REfORTING, 1900 TO 1945; NUM8ER, 1840 '!'0 1945; AN::J VALUE, 1900 TO 1945; !"u,,
SPECIFIED AGE AND SEX GROUPS, FOR Th!!: UNITZD STATES
ITEM, DATE ·OF ENID.iERATION, AND AGE
TOTAL. VAilJE OF SP!JCIF!lll LIVESTOCK
1945-Jan. 1 .•••••••••• 1940-Apr: 1. .......... 1935-.Jan-. 1 ........... i930-Apr. 11 •.••.•••.
all ages t:lnumera-te
1925-Jan. 1 ........... i9~l0-Jan. 1 ........... 19!1.0-J..pr. 151 .........
all ages enumerate
1900-June 1 1 ••••••••• all ages enuinerat&<
1..890-June 1 2 •••••••••• 1880-June 1 3 ••.•••••••• 1870-June 1 4 •••••••••. lBGO-June 1 •••••••••••• 1850-.JUne 1 ••••••••••••
HORSES AND/OR liULES
1945-Jan. 1-nll ages •• 1940-lt.pr. l-over 3 mo. l935....:..Jan. l-a1l ageE.; 1930-Apr. l-3 mo.
and· over ••••.•• ·• •••••.• all ages ••
1925-Jan. 1-al~ ages •• 1920-Jan. 1-all ages •• 1910-Apr5 _ 15-3~ mo.
and over •••••••••••.•• all ages ••
190C-June l-1' yr. anoi over ••••••••.•.••••••
all Bees •• 890-Juno 1-not specltied •••••••••••••• 880-June 1-all ages ••
1870-J.une 1-not speci-fied ••••••••••.••• 860-June 1-not specified •••••••.••••• £;!50-June 1-not specified- •••••.•••••••••
1840--June 1-not specified ••••••••••••••
HORSES
1945-Jau. l-all ages •• 1940-Apr. l-over 3 mo~ 1935-Jan. 1-a-11 ages •• 930~Apr. l-3 mo. a'nd. over ••••..••••••••••
all ages. 1 1 1
925-Jan. 1-all ages •• 920-Jan. 1-al! ages •• 910-Apr. 15-3 ·mo .• and ·OYer 6 ••••••••••••••
all ages. 1 900-June 1-1 yr.
and over ••••••••••••.•• 8.11 ages ••
890._Ju·ne .1-not sp~ctf'ied •••••.•••••••••
1880-:-June :1.-all ages. ,870-June 1~not specified ••••••••••••• 8_60-June- 1-not specified ••••••••••••••
1850-June 1-not sp.ecitied ••••••••••••••
I!ULES.
'945-Jan. l 1 1 l
1-all ages. 9.40-Apr. l-over 3 mo. '935-J"an. 1-all ageS.~ 930-Apr. 1-3 mo. and over •••••••••••••••
all ages.' l925-Jan. 1-e.ll ages. ·920-Jan. 1-all ages ••
1910-Apr. 15-3! mo. and over •••••••.••••••.
all ages.
•No-t ava!la·ble.
[Figures .for censuses prior to .1900 nominally exclusive of young animals and prior to 1880 exclusive of range llvestocrJ
FA!!m REPORTniG VAllJE (DOLLARS) FAR1S REP0P.'!'!NC •VALUE (DOLU.RS)
Nwnber Percent Aver- ITEM, DATE OF Percent I Percent ENUMERATION, AND AGE Percent Number of Avere.ge
Total of all Total or age Total of all total par Total
total h~=~ farms value head fBI'DiS
Vt:!lUe
Jil,LES 5-Continuea
1900-.June 1-1 yr. (*) (*) .xxxxxxxxxx 8,4?2,431,333 100.0 xxxxx and over ••.••••••• , •• (*) (*) 3,032, 987 190' 020 J 154 6,7 62.65 (*) (*) XJO[](](XXJCXX 4,525,923,172 100,0 = all ages. 1,480,652 25,8 3,264,615 196,222,053 6.4 60.11 (*) (*) xxxxxxxxxx 3,406,842,630 100.0 xxxxx 1890-.Tune 1-not (*) (*) xxxxxxxxxx 5, 7?8, 601,089 100,0 xxxxx spocif'ied •••••••••••• (*': (*) 2,251,8'76 (*) (*) (*)
1880-June 1-~11 ages (•) (*) 1,812,808 (*) (*) (*) (*) (*) XXXXXXXXl\X 6,048,538,593 100.0 xxxxx 18?0-June 1-not (*) (*) xxxxxxxxxx 4,829,22?,335 100,0 xxxxx specified •••••••••••• (*) (*) 1,125,415 (*) (*) (*) (*) (*) xxxxxxxxxx 7. 963,951,284 100.0 = 1860-June 1-not (*) (*) xxxxxxxxxx 4, 733, 3'76, 324 100.0 = specified-••••••••••.• (*) (*) 1 J 151,148 (*) (*) (*)
(*) (*) xxxxxxxxxx 4, 887 J 053,110 100,0 = 1850-.Tune 1-not zpecitied •••••••••••• ~ (*) (*) 559,331 (*) (*) (*)
(*) (*) I XXXXJ(XlQ[](J{ 2, 847, 737,896 100.0 = AIL CATTlE (*) (*) . xxxxxxxxxx 3,059,_142,995 100.0 xxxxx (*) (*) xxxxxxxxxx 2,308,767,573 100,0 lCXXXl\ 1945-Jan. 1-all agee j4,688, 746 80.0 82,654,417 5,602,625,260 66.1 67,78 (*) (*) xxxxxxxxxx 1,576,884,707 100,0 = 1940-Apr. l-over3mo.
~::~~:i~~ 79.~ 60,674,736 ,s9e,ll7,569 57.4 42.82
(*) (*) xxxxxxxxxx 1,229,889,610 100.0 xxxxx 1935-Jan. 1-all ages. 80.5 68,284,409 1,387,896,074 40.7 20.33 (*) (*) pcxxxxxxxx 1, 089, 329 J 915 ,100.0 xx:xxx 1930-Apr. 1-3 too. (*) (*) xxxxxxxxxx 544, 180 J 516 roo.o xxxxx and over ••.••••••••••• (*) (*) 54,250,300 3,184,593,411 55.1 58,70
all ages. 4,803,174 76.4 0.3,895,826 3,303,987,602 54.6 51.71 1925--Jan. 1-all ages (*) (*) 60,760,366 2,019,488,987 41.8 33.24 1920-Jan. 1-all ages 5,358,243 83.1 66,639,556 3,651,521,490 45.9 54.80
(*) (*) 11,628,794 973,599,545 11.5 83.72 1910-Apr. 15-;illlo. 4,362,144 71.5 13,931;~31 1,201,948,398 26,6 86.28 and over7 ••••.•••••••• (*) (*) 53,997,327 1,447,523,474 30.6 26.81 5,000,478 73.4 16,676,010 1,392,088,297 W.9 83.48 e.ll a&es. 5,284, 916 83.1 61,803,866 1,499,523,607 30.7 24.26
1900-Jun~ 1-1 yr. (*) (*) 18,737,524 1,3-l5,728,301 . 23.3 71.82 and oTBr ••••••••••••• (*) (*) 52,403,828 1, 337,914, 632 47.0 25.53
5,024, 713 79,9 18,885,866 1~348.647,299 22,3 71.41 all ages. 4, 730,480 82.~ 67,719,410 1,475,204,633 48.2 21.78 5,365,513 84.2 22,081,520 1,451,040, 753 oo.o &5.71 1890-June 1-not
(*) (*) 25,199,552" j2,B61,371,898 32.2 10I.64 specified •••••••••••• (*) (*) 57,648,"192 (*) (*) (*) 1880-June 1-no'\
(*) (*) 23,320,850 2,58318091 196 54.6 110.79 specified 8 ••••••••••• .(*) (*) 39,675,533 (*) (*) (*) (*) (*) 24,042,882 2,608, 980,058 53.4 108.51 1870-June 1-not
specified ............. (*) (*) 23,820,608 (*) (*) (*) (·*) (*) 19,985,178 1,060,636,500 37.2 53.07 1860-June 1-not (*) (*) 21,531,635 1,092,735,270 35..? 50.75 specified •••••••••••• (*) (*) 25,620,019 (*) (*) (*)
lBM-June 1-not (*) (*) 17,518,120 (*) (*) (*) specitied ••••••••••••. (*) (*) 18,378,907 (*) (*) (*) (*) (*) 12,1:70,296 (*) (*) (*) 1840-June 1-not
:spacitied ••••.•••••••• (*) (*) 14,971,586 (*) (*) (*) (*) (*) 8,270, 785 (*) (*) (*)
COWS 2 YEARS (*) (*) ?,400,322 (*) (*) (*) OlD AND OVER
(*) (*) 4,896,050 (*) (*) (*) 1945-Jan. l-2yr. and oTer •••••••••••••• ,542,821 77.5 44,156,337 3,858,905,194 45.5 87.39
(*) (*) 4,335,669 c•l (*) (*) 1940-Apr. 1-27 mo. and over •••••••••••••• 1725,285 77.5 33,523,185 1,785,152,564 39.4 53.25
1935-Jan. 1-2 yr. and over •••••••••••••• .376, 930 78.9 36,930,584 993,520,432 29.2 26.90
2,828,,412 48.3 8,499,204 545,362.,555 6.-l 64.17 1930-Apr. 1-27 mo. 3,148,656 51.6 10 1 086,971 765,753,640 16.9 75,92 and over •••••••••••••• (*) (*) 28,335,949 2,051,096,027 35.5 72.38 3,536,597 51.9 11-1 857 1850 913,437,099 26.8 . 77.03 1925-Jan. 1-2 yr.
and over ••••.•••••••••• (*) (*) 32,553,845 11 373 1 056.1 105 28.4 42.18 (*) (*) 13,383,574, 903,467,153 15.6 67.51 1920-Jan. 1-2 yr. (*) (*) 13,510,839 905,881,187 15.0 67 ,05, and over •••••.•••••••• (*) (*) 32,300,293 2 1 246, 6661 235 28.2 69.56 (*) (*) 16 f 4001 6"23 1,001,520,679 20.7 61.07 1910-Apr. 15! ""'·
4;704,235 73.0 19,767,161 , 782,077,487 22.4 90.15 and over •••••••••••••• (*) (*) 32,649,114 975,396.500 20.6 29.88 1900-June 1-2 yr.
j28,694,827 (*) (*) 19,220,338 ,062, 952,364 43.6 107.33 and over •••••••••••••• (*) (*) 779' 919, 183 27•4 27.18
4,_692,814 73.8 19,833,113 ,083,588,195 42.6 105,06 OTHER CATTLE
(*). (*) 16, 952·, 191 870,616,346 30.6 51.36 4,530,628 79.0 18,267,020 896.513.217 29.3 49.08 1945-Jan, 1-all ages. (*) (*) 38,498,080 l, 743, 720' 066 20,6 45.29
1940-Apr. l-over3mo. (*) (*) 7,151,551 812. 965. 005 18.0 29.94 (*) (*) 15,266,244 (*) (*) (*) 1935-Jan. l-a11 ages. (*) (*) 31,353,825 394 t 375 1 642 11.6 12.58 (*) (*) 10,357,~ (*) (*') (*) 1930-Apr. 1-3 mo.
and over •••••••••••••• (*) (*) 5, 914,351 1,133,497,384 19.6 43.74
,(*) c•i 7,1-45,370 (*) (*) (*) all ages •• (*) (*) 35,559,877 1,252.891,575 20.7 35.23 1925-Jan. 1-all ages (*) (*) 28,206,521 646 1 432 J 882 13.4 22.92
(*) (*) 6,-249,174 (*) (*) (*) 1920-Jan. 1-e.l~ ages (*) (*) 34,339,263 1,404,855,255 17.6 40.91 1910-APrr, 15-3~ 1110.
(*) (*) 4,336, 719 (*) (*) (*) and over •••••••••••• (*) (*) 1,348,213 472,126,974 10.0 22.12 all ages •• (*) (~) 29,154,752 524,127,107 10.7 17.98
1900--'June 1-1 yr. ~3,709,001 and over •••• , ••••••••• (*) (*) 557 J 995,449 20.0 23.54
1,486,209 25.4 3,129,590 4~,236,990 5.1 136.83 all ages .. (*) (*) 39,024,583 695,285,450 22.7 17.82 1,845,517 30.3 3,844,560 436.194,758 9.6 113.46 ALL HOOS AND PIOS 2,255,845 33.1 4,818,160 478,651,198 14.0 99.3-l
1946-Jan. 1-all fl8es. ,313,883 56.6 ~. 735,~17 988,104,047 11.7 21.14 (*) (*) 5,353,950 442,261,148 ?.7 82,60 1940-Apr. l--over 4 mo. ,766,675 61.8 4,03?,253 284,636,713 6.3 8.36 (*) (*) 5,375,017 442,'766,112· 7.3 82,37 1935-Jan. 1-all ages. 3,971,122 58.3 37,212,967 220,367 J 009 6.5 5,92 (*) (*) '5,680,897 449,520,Q74 9.3 79.13 1930-Apr. 1-3 mo.
2,259,746 35.0 . 5,432,391 779,294,411 9.8 143.~5 and over •••••• •••••• •• (*) (*) 32,793,628 564 J 180 J 285 9.8 17.20 all ages •• ~,535,119 56.2 56,287,920 641,098,909 10.6 11.39
(*) (*) 4,100,512 520 i 856,832 11,0 127.02 1925-Jan. 1-all ages. ~,618,624 56.8 50,853,526 614,951,004 12.7 12.09 1,869,005 29A 4,209.,769 525,391,863 10.8 124.80 6 mo. and over. (*) (*) 28,946,952 482,751,043 10.0 16.68
1Exc1udea young animals when enumerated separately. See age specifications below. 2 Includes estima-ted value of livestock on ranges o-t $100,000,000 tor 289,316 horses, 19,253 mules and aeses, 5,851,640 cattle, 4,940,948 sheep, and 15,704 hogs. 3 Inaludes $76.,500,000 tor livestock .on ranches and ranges eatilllated as 3.1 750,022 cattle. 7 ,ooo,ooo sheep, and 2,090, 970 hogs. ~Value ~n ·gold. 8lnoludes 57,938 horses valued e.t $2,513,879, not classified by age or sex. ,Asses enumera-ted wi·th mules in cen~ses, 1850 to 1880, 8I6.cludes 1,.003,786 oat'tlo ._ valued at $21,031,774, not cla.ssi·tied by age or eex • . 9Inolud~s s:, '750, 022 cattle on ranches and ranges comput~ by special agents assigned to range territ-ory for this purpose.
Includes 283 !arms reporti-ng 68,.671 ·cEOtt:le, valued a-t $2,488,646, not o1assi!'ied by age or sex.
748387 0 - 47 - 26

342 CENSUS OF AGRICULTURE: 1945 Table 3.-sri::CIFIL'D LIVESTOCK ON P.AR!~S-FARM::l REPORTING, 1900 TO 1945; NUMBER, 1840, TO 1945; AND VALUE, 1900 TO 1945; FOR
SPECIFIED AGE AND SEX GROUPS, FOR TnE. U!~ITED STATES-Continued
-
!'ARIIS llEPORTII«l VAI.UE (DOLLARS) FARMS Rl!:I'ORTil'l<l
l'l'El4, DATE OF NUmber Pero&nt Aver- ITEII, DATE OF EIIUMERi. TION, AND AGE Percent or
l!!IUioiERATION, AND AGE Percent NUmber Total ot all Total
age Total of all total per
farms value head farms
AU. HOGS AND SHEEP-Con·tinued PIGS-Con.
1850-JUne 1-not IL920-J"an. 1-all ages •• 4,850,807 75,2 59,346,40,9 gae,se2, sao 12.4 16.66 specified •••••••• ;, •••• · (*) (*) 21,723,220
6 mo. and.l.over10• (*) (~) 33,169, '?49 '798,277 ,883 10.0 . 24.07 "1840-J\lne l-not 1910-Apr. 15-32 mo. ap8cit1ed ••••••••••••• (*•) (*) l9,3Jl,374
and over ••••••••••••••• 4,092.391 64.3 35,184,097 352,157. 958 7.4 10,02 all ages •• 4,351,751 6A,4 58,185,6'16 399, ~38; 3oe 8,2 6,86 EWI!S AND EWE LAIIBS
1900-JUD.e 1-all ages •• 4,335,363 75.6 62,868,041 231,978,031 8,1 3,69 1890-June l-not 1945-J'an. 1-kept tor .
specified •••••.•••.••.• (*) (*) 57,426,a59 (*) (*) . (*) breeding ewes ••••••••• 418,251 7.1 30,631,794 1880-J'u.ne 1-not 1940-Apr. l-over6mo. 541,844 8.9 35,579,506.
specified 11 •••••••••••• (*) (*) 49,772,670 (*) (*) (*) 6 tole mo · 389,872 6.4 '7,527,9!11 1870-J'Wle 1--not 18 mo. and over .• ~ 490,608 e.o 28,051,595 specified •••••••••.•••• (*) (*) 25,134,569 (*) (*) (*) 1935-J"an. l-1 yr.
1860-June 1-not and over ••••••••••••••. 589,571 8.7 34,000,286 (*) (*) (*) 1930-Apr. l-6 .mo. specified •••••••••••••• (*) (*) 33,512,867
1850-J'une 1-not and over ••••••• ••••••• (*) (*) . 38·,097,572
specified ••••••••.••••• (*) (*) 30,354,213 (*) (*) (*) 6 tole mo. (*) 1840-.rune 1-not 18 mo. and over. (*) specified •••••••••••• ,. (*) (*)· 26,301,293 (*) (*) (*) 1925-J"an, 1-1 yr.
and· over •••••• ••• ••••• (*) SOI15 AND GILTS 1920-J"an. 1-1 yr.
and over •••••••••••••• 492,311 1945-Jan. 1-f'or spr1~ 1910-Apr. 15-3i mo.
farrowing ••••• , ••••• ,., 1,839,458 31.4 8,482,031 303,900,362 3,6 35,83 and over •••••••••••••• 590,878 1940-Ap~. 1-to farrow 1900-J\lne 1-1 yr. Dec. 1, and over ••••••••••••• (*)
1939 to June 1, 1940 ........... 1,.987, 723 32,6 .? ,987,641 109,451,529 2.4 13.70 ALL O'lBER SHEEP
1935-Jan. 1-to rarrow AND LAIIBS before
June 1, 1935 •• 1, 937' 231 28.4 6,061,112 64,800,310 1.9 10.69 , 1945-.Tan. 1-all ages, (*) 1930-Apr. 1-to tarrow 1940-Apr. l-over 6 mo, (*)
J"an. 1 1935-J"an. 1-a11 ages (*) to .Tune 1, 1930 .. 1,685,946 26,8 7,6?3,741 207,276,627 3.6 27.01. 19.30-Apr. l-6 mo.
1925-J"an. 1-for and over •••••••••••••• (*) breeding, all agest- (*·)
6 mo. sod over •• . (*) (*) e,9e?,334 164,142,470 3.4 18.43! 1925-Jan. l-a11 ages, (*) 1920-Jan.. 1-tor 1 yr. and over. (*}
breeding, 1920-J"an. 1....:..11 eges .(*) 6 mo. a.nd over •• 2, 995,598 46.4 11,416,471 336,249,473 4.2 29.45": 1 yr. and over 12,. (*)
1910-Apr. l5-3t ""· ALL O'lBER HOGS and over ••••••••••••• (*)
AND PIGS all agee. (*) 1900-.l'une 1-1 yr.
1945-.Tan. l-al1 ages •• (*) (*) 38,253,386 684. 203.685 e.l 17.89 and over ••••••••••••• (*) 1940-Apr. l-over 4 mo. (*) (*) 26,049,612 175,185,184 3;9 6.73. all ages •• (*) 1935-Jan. 1-all ages •• (*) (*) 31,151,855 155,566,699 4.6 4.99 1930-Apr. l-3 mo.
GOATS OF ALL KINDS and over ••.•. , ••.••••••• (*) (*) 25,119,88? 356 I 903,658 6.2 14.21 all ages •• (*) (*) 48,614,.179 433,822,282 7,2 8,92
1925-J'an. 1-all ages •• (*) (*) 41,946,192 450.808, 534 9,3 10,75. 1945-.ran. 1-a11 ages 134,523
6 mo. and over •• (*) (*) 20,039,618 318,608,573 6,6 15,90. 1940-APr. l-over
1920-J"an. 1-all ages.~ (*) (*) 47,~29,938 652. 332. 907 8.2 13,61 4 mo •••••••••••••••••• 1~7,168
6 JIO. and over m •• (*) (•) 21,753,278 462,028,410 5,a· 21.24 1935-J"an. 1-all ages. 157,632 1930-Apr. 1-all ages, 112,864
SHEEP 1925-J"an, 1-all ages. 91,402 1920-J"an. 1.:...a11 ages, 107,267
1945-Jan, l-all ages .. 456,986 7.8 41,223,869 359.042.435 4.2 8,71· 1910-Apr. 15-all ages, 82,755
1940-Apr. l-over 1900--June 1--all ages.· '17,515
6 110 ••••••••••••••••••• 584,935 9,6 40,129,261 240' 189, 944 5.3 5,99 ·I 1935-J"an. 1-all ages •• 635,384 9,3 48,357~506 208,871,101 6.1 4,32 I CHICI!ENS 1930-Apr. l-6 m • and over ••••••••••••••• (*) (*) 41,780,146 343,154;271 5,9 8,21 1945--.ran. l-over
all e.s:es •• 583,578 9,3 56,975,084 413; 859. 962 6.8 7.26 4 JDD,, •••••••••••••••• ~,900,948 1925-J"an. 1-a11 ages .. 430,738 6.8 35,590,159 354,485,355 7.3 9.96 1940-Apr, l-over
l yr. and over •• (*) (*) 26,392,385 2'14,334,399 5,7 10.39' 4 mo •••.••• ., •••••••••• 5,150,055 1920-Jan. ~-all ages, 538,593 8.4 35,033,516 395,401,286 5,0 11.29. 1935-.Tan. l-over
1 yr. aDd over 12,. (*) (*) 25,824,015 314, 905. 553 4.0 12.19 3 mo •••••••••••••••••• ,833,079 1910-Apr. 15-sf mo. 1930-Apr. l-over
and over ••••••••••••••• (~) (*) 39,644,04.6 203,516,144 4 •. 3 5,13 3 mo •••••••••••••••••• 5,3'12,597 all ages •• 610,894 9.6 52,447,861 232,841,585 4.8 4.44 1925-J"an. l-not
1900-J"une l-l yr. speoif'ied •••• ~ •••• •••• 5,505,617 and over ••••••••• •••••• (*) (*)
:i::~~:~~:· 128,186,791 4.5 3.22 1920-J"u. 1-IJ>t · all ages •• 763,518 13.3 170,203,119 5,6 2,77 speo1t18d ••• •••••• ••• ~,83'1,3~7
1890-June 1-not 1910-Apr. 15-over apeoified .............. (~) (*) 40,876,312 (*) (*) (*) 3 mo •••••••.••••••••••• 5,578,425
1880-J"uno l-not '1900-June l-over specified 11 •••••••••••• (*} (*) 42,192,074 (*) (*) (*) f 3 ,.. .................. (*)
1870-J"une 1-not 1890-Juno 1-not · specitled ............ , • (*) (•) 28,477.951. (*) (*) (*) speo1t1ed ••••••••.••••• (*)
1860-.Tuns l-not , 1880--June 1-except spaoitied':o ••••••••••••• (*) (*) 22,4'11,275 (*) (*) (*) spr~ Ia tchlO ....... , (*)
-ra.cludes 69 terms reporting 4,421 hogs and pigs, Talued at t52,5'14, not claas:Ltied by sse or sex. 111Jloludes 2,090,970 hogs on ranches and ranges compute·d. by special a·gents assigned to ranse territory tor this purpo&f, lZinclud.ea 228 teras report1Dg 283,686 sbeep, Ta·lued at 12,291,761; no·t claasitied by age or sex. Urncludes '7,000,000 sheep on ranches and ranges '30aputed by apttc1a1 agents ass·igned. to range terri·tory tor this purpose. ~eludes guinea fowls. '
All towls, n:olud.iq pis:eons, paatowla, and ostriches,
(*) '7,302,336 (*) 30,795,236
(*) 24,591,302
7.6 23,518,631
9,3 31,933,'79'7
(*) 31,857,652
(*) 10,592,0'75 (*) 4,549,'755 (*) 14,35'1',220
(*) 3,682,574 (*) 18,8?'1.,512 (*) 10,998,857 (*) 1,801,083 (*) 11,514,885 (*) 2.,9G5 1384
(*l '1,'110,249 (*) .20,514,064
(*) 7,995,315 (*) 29.,646,061
2.3 4,265,50·1
. 2.1 4,175,047 2.3 4,093,441
.1.8· 4,821,294 1.4 3,3'10,218 1.7 3,458,925 1.3 2,915,125 1.4 1,8'10,~99
ea.6· ~,110,674
84.5 37,949,145
85.6 ~'11;603,136
85.4 3'!1, 8'18, 281
86.4 409,290,849.
90,5 359,537.127
87,7 lSO, 340, 959 '
(*) 283,566,021
(*) 258,871,125
(*) !1>2,272,135
VAlUE. (DOLLARS)
Percent or Average
Total total· per
value head
(*) (*) (*)'
(*) (*) (*)
253,246,3£?3 3,0 8,27 216. 941, _854 4.8 6,10
51,748,119 l.l 6,67 165,193,735 3,6 5.89
149,251,723 4.4 4.39
314,119,180 5.4 8,25 60,650,004 1.0 8,31
. 253,469,176 4,4 8.23
254,360,443 5.3 10.34
283,564,609 3,6 12.06
·164,855,314" 3.5 5.16
101,288. 730 3.6 3,18
105,796,082 1.2 9,99 23,248,090 0,5 5.11 59,619,378 1.7 4.15
29,035,091 0 .• 5 7.88 99,740,782 1.6 5,28
100,124,912 2.1 9.10 19,973,95~ 0.4 11.09
111,836,677 1.4 9.71 31,340,944 0.4 13.59
,se,sse,eso 0,8 5,01 67,986,271 lt4 3,31
26,898,061 u,9 3,36 68,9il.4,389 2.3 2.32
17,199,659 . 0.21 . 4.03
11, 944,'186 0,3 11,85 6,116,317 0.2 1 .• 49
19,320,072 o.2 4,01 10.,249,786 0,2 3,04 17,5_65,363 0.2 5,08
6,1'16,423 o.l 2.12 3,265,349 0,1 1,75
531,860.387 6.3 1.23
189·,085, 762 4.2 0,56
191,503,832 5.6 0,52
32i,.624, 749' 5.6 0,85
379,011,450 7.8 0,93
349,508,867 4.4 0.97
140,193,129 3.0 0,50
85,~56,593 2.0 0.37
(*) (*) (*)
(*) (*) (*)
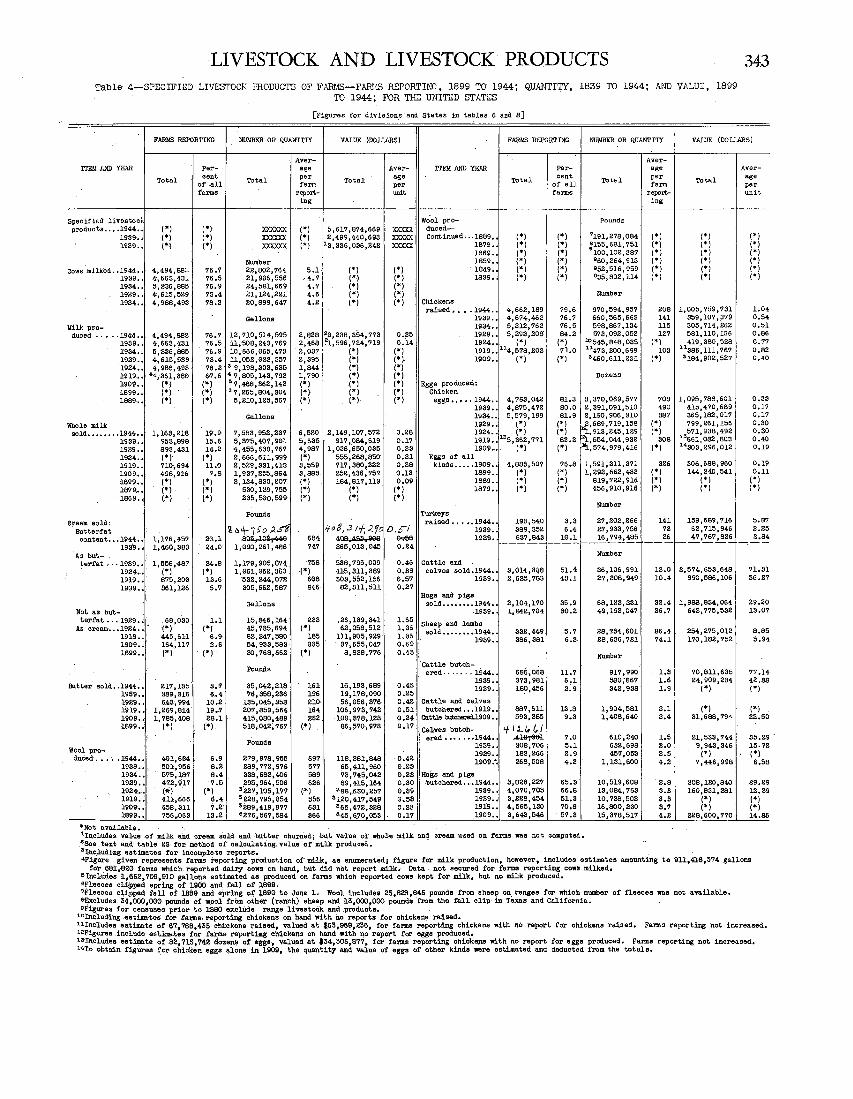
LIVESTOCK AND LIVESTOCK PRODUCTS Table 4-SPECIFI.ED LIVES'l'OCK PRODUCTS OF FARl.1S-FAR}1.S REPORTING, 1899 TO 1944; QUANTITY, 1839 TO 1944; AND VAC..UZ, 1899
TO 1944; FOR TIC UNIT'Ji:D STATES
[Figures for divisions ·and States in tables 6 and e]
343
FARMS REPORTING NUMBER OR QUANTITY VALUE (DOw.RS) FARMS REPORTING NUMBER OR QUANTITY VALUE (DOLLARS)
AVer- Aver-ITEM AN!) YEAR Per- age Aver- rn:M AND YEAR Per- age Aver-
Total cent Total
pe-r Total age Total cent To.tel per
Total age
of .all farm -per or all farm per farms report- unit rarms report- unit
1ng ing
Speclfied· liVestoe' w~Ol pro- pou.'1ds producta •••• 194·4 •.• (*) (*) = (*) 5,617,874,669 = duced-
1939.; (*) (*) xxxxxx (*) 2,499,440,693 xxxxx Cant inued • •. -1889. ~ (*) (*) 7191,278,084 i*l (*) (*) 1929 •• (*) (*) = (*) 13,336,036,242 = 18?9 •• (*) (*) 6155,681, ?51 (*) (*) (*)
1869 •• (*) (*) 9100,102,387 (*) (*) (*)
Number 1859 •• (*) (*) 960,264,913 (*) (*) (*)
Gows milked •• 1944 •• , 4,4'94,88::: ?6.7 22,802,764 5.i (*) (*) 1849 •• (*) (*) 952,516,959 (*) (*) (*)
1939 •• 4·,663,43.:.. 76.5 21;936,556 '4.? (*) (*) 1839.; (*) (*) 935,802, 114 (*) (*) (*)
1934 •• 5,2~61885 ?6.9 24,581,669 4.? (*) (*) 1929 •• 4-,615.,529 ?3.4 21, 124,22_1 4.6 (*) (*) Number 1924 •• 4,988,493 ?8.3 20,8991647 4.2 (*) (*) Chickens
raised ~ • • • 1944 o .. 4,662,189 ?9.6 970' 5941 95? 208 1,005, 7ti9, 731 1.04
Gallons 1939 •• 4,674,462 ?6.? 660,565,663 141 359 I 10? 1 3?9 0.54
llil:k pro- 1934 •• 5,212,762 ?6.5 598,8671134 115 305,714,262 0.51 duced • . • . ·1944 •• 4,.494,88'2 ?6.? 12,710,514,595 2,828 23,238,354,773 0.25 1929 •• 5,293,208 84.2 6?3,092,052 127 581,110,136 0.86
19S9 •• 4,-663,431 ?6.5 111_508,_243, 769 2,-468 ~,596,734,719 0.14 1924 •• (*) (*) lO 545, 848' 035 (*) 419 1 380 I 528 0.?7
1934 •• 5 t ·236,, 885 ?6.9 10,-666,065,473 . 2,037 (*) (*) 1919 •• 114,578,202 ?1.0 11473,200,699 103 11386,111,767 0.82 1929 •• 4,616,529 73.4 11,052,023,357 2,395 (*) (*) 1909 •• (*) (*) ~460,611,201 (*) ~184,902,52? 0.40
'1924 •• 4, 988,493 78.3 ~ 9,198,303,635 1,844 (*) (*) 19!1:9 .•• ' 4-1,·361,380 6?.6 4 ?.,805,143,792 1,790 (*) (*) Dozens 1909 .•• (*) (*) 1)71488,3621142 '(*) (*) (*) Eggs produced: 1899 •• (*) (*) 3 7,265,-804,304 (*) (*) (*) Chicken 1889 •• : (*) (*) 5,210,:125,56?. (*) (*) (*) eggs ...... 1944o. 4, 763,042 81.3 3,370,069,577 ?08 1,095,788,601 0.33
1939 •• 4,875,4?2 ao.o 2,391,091,510 490 415,470,689 O.l?
Gallons 1934 •• 5,579,199 81.9 211601906,310 387 365,182,01? 0.1?
Whole m-ilk 1929 •• (*) (*) 2,689,?19,158 (*) 799,261,156 0.30
sold •••••••• 1944 •• · 1116·31218 19.9 '1' 583, 952,237 6,520 2,149,107,572 0.28 1924 •• (*) (*) ~· 913,245,129 (*) 571,938,492 0.30
1939 •• 953,898 15.6 5,3?5·,407,901 5,635 91'7 1.084, 619 0.1? 1919 •• l:351362,77l 83.2 x:654,044,932 308 13661,082,803 0.40
1929 •• 893,431 14.2 4,455,638,767 4,987 1,036.,650,035 0.23 1909 •• (*) (*) ,574,979,416 (*) 14303,296,012 0.19
1924 •• (*) (*) 2,6661611,999 (*) 555,268j850 0.21 Eggs of all 1919 •• 710,694 n.o 2, 529., 331,413 3,559 717,380~222 0.28 kinde ••••• 1909oo 4,883,507 ?6.8 1,5911311,371 326 3061 6881 960 0.19
1909 •• 498,916 ?;a l,937,2e5,864 3,883 252 I 436 I 757 0.13 1899 •• (*) (*) 1,293,662,433 (*) 144,240,541 0.11
1899 •• (*) (*) 2, 13_4,830,207 (*) 184, 817,119 0.09 1889 •• (*) (*) 819 J ?22, 916 (*) (*) (*)
18?9, •• (*) (*) 530 J 1291 755 (*) (*) (*) 1879 •• (*) (*) 456,910,916 (*) (*) (*)
1869 •• (*) (*) 235,500,599 (*) (*) (*) Number
Pounds Turkeys Cream sold:
?,oo.\-']S'o~.s"'& raised •• , , .1944 •• 193,540 3.3 27,202,266 141 159' 689 J 716 5.8?
Butter-fa-t tfd 8,.3 if, .2.'1~ 0,$"1 1939 •• 389,352 6.4 271933,756 ?2 62,715,946 2.25
cont.en,t.-o .194-4 •• 1,17_6,457 20.1 .8~ 681 ~ ·0'0'56 1929. __ 6!._?.~~ 10.1 1---~~~~5 26 47,767,826 2.84
193'9 •• 1,460,383 24.0 1 1090 I 2611 486 74? 265 1 013 I Q4S 0.24 r-----A·s but_- Number
ter£at , . , :1929 •• 1,.556,-487 24.8 1,179,905,87~ 758 538,795,009 0.46 cattle and 1924 •• ,(*) (*) 1,06ll.,·0621363 (*) 415., 311' 389 0.39 calves sold.l944 •• 3,014,3a8 51.4 36,106,991 12.0 2,5?4,653,648 71.31
1919 •• 8'75,200 13.6 532, 244., 072 608 303 1 552 I 156 0.5? 1939 •• 2,6251783 43.1 27,308,949 10.4 990 1586 ,106 36.2?
1909 •• ' 361,126 5.? 305,662,587 846 82,311,511 0.2? Hogs and· p ig:s
Gallons sold •• •••o•ol944 •.• 2,104,1'70 35.9 68,122,231 32.4 1,988,834,064 29.20 No.t_ .as 'bu't- 1
.1939. 1,842, 704 30.2 49,192,047 26.7 642,775' 532 13.0? ·terfat .•.• 1929 •• 68,030 1.1 151'846 1 164 23? ,26,139,341 1.65 Sheep and lambs
As cream· ••• 1924. ~ · (*) (*) 45,735,.694 (*) 62,058,5~ 1.36 sold •••••••• 1944 •• 332,449 5.? 28,734,601 86.4 254,275,012 8.85 1919 •• ' 445,611 6.9 82,247,580 185 111,905,929 l. 36 1939 •• 386,381 6.3 28,636,721 ?4.1 170,182,752 5.94 1909 •• 164111-7 2.6 54,933,583 335 37 1.655 I 04? 0.69 1899 •• (*) . (*) 20,768,662 (*) 8,838,776 0.43 Number
Pounds Cattle butch-
ered· ....•.. 1944a. 686,068 11.? 917,990 1.3 70,8ll 1636 ??.14
·Butter sold. ol-944. a 217,135 3.7 35,042,218 161 15,1931689 0.43 1939 •• 3731981 6,1 580;867 1.6 24,909,234 42.88
1989 •• 389·,316 6.4 ?6,358,236 196 19,178',090 ' 0.25 1929 •• 18~1.456 2.9 342,938 1.9 (*) (*)
1929 •.• 6_43:,994 10.2 135,045,_358 210· 56_,-056,376 0.42 Cattle and oalves 1919 •• 1,269,·814 19.7 2071859 1 564 164 106,973,742 0.51 butchered o o .19l9a. 687,611 13.8 1,904,581 2.1 (*) (*) 1909 •• 11785,40~ 26.1 415, o8o·, 489 232 100 ,.378·, 123 0.24 CattJ.e1lub:llored.l909 •• 593,285 9.3 1,408,640 2.4 31,688, '7911., 22.50 1899.; (*) (*) 518,042~ 767 (*) 86,570,973 O.l? ca'lves ·butch- 'flU(,/
Pounds ered ••••••• 1944 •• ~1 ?.0 610,240 1.5 21,533,744 35.29
Wool pro-1939 •• 308,706 5.1 632,698 2.0 9,943,346 15·72
duced ••• • .1944 •• 401,634 6.9 279,9-78,955 69? 118,281,848 '0.42 1929 •• 183,266 2.9 457,053 2.5 (*) (*)
1939 ••. 501,956 8.2 289., 77-2,9:76 57? 6514ll,969 0.28 1909.·. 268,508 4.2 1,131,600 4.2 7,446,998 6.58
~934.; ;~~:!~; 8.4 338,682,406 589 ?3-,745,042 0.22 Hoke and pigs 1929 •• . 7.5 ,295, 964,506 626 89.,415,164 0.30 butchered ••.• 1944 •• 31823,227 65.8 10,519,'608 2.8 308,120,840 29.29
' 1924 •• ( .. ) (*) 3227,105,177 (*) 388,630,257 0.39 1939 •• 4,070,705 66.8 13,084, ?63 3.2 160' 831, 281 12.29 19J)9 •• 411,·666 6.4 3228-,795,354 556 3 1~0 ,"417 1 549 0.58 1929 •• 3,228,454 51.3 10,738,502 3.3 (*) (*) 1909 •• 458,311 7.2· 3289-1419,977 631 365,472,328 0.23 1919 •• 4,565,130 ?0.8 16,800,230 3.7 (*) (*) 1899 •• : 756,063 13.2 6276,667,584 366 645,6.70,053 0.1? 1909 •• 3,643,546 '5?.3 15,378,517 4.2 226,600,770 14.86
*Not availabll.e .• l·rncl:udes value ot millk ·a.il.d cream sold and· -bu.t-ter churn.ed; bu:t value or whole milk and cream used on farms was not computed. 2See- -te:z:-t and· ·table- 23 tor_ m.Bthod or oalaulat.Lng,value or milk produced. · 3 Inc_ludi-ng estimates tor incomplete- reports. 4Figure given represents farms reporting prod·uction or· milk, as enumerated-; figure f9!" milk production, ·however, includes estimates amounting to 911,416,374 gallons
~or .68~,820 fanne which·. reported dairy cows· on hand, but :did not _report milk-. Data not secured for farms reporting cows milked. 5Includes. 1,652, 706,910 gallons estimated as produced on farms which reported cows kept for milk, but no milk produced. •Fleeces clipped eprin& of 1900 and fall of 1899. 7·Fleece8 c-].:lpped fall of 1889 and spring o~ 1890 to June 1. Wool includes 25,828,845 pounds from sheep on. ranges far which number of fleeces was not auUable. a-~cludes 34,000,000 pounds· of wool :trOm_.other (ranch) sheep and 13,000,000 pounds from the· fall clip in Texas and California. 9Figures for censuses prior to 1"880 exclUde range livestock and _products.
10Including eat:i.Da tes for farms, reporting chickens on hand with ho reports for chickeru:s raised. 1.l_InCludes ee:tima.·te. ()f 67, 788~435· chio·kens ra-ised., valued at $53 1969-,236, for_ farms· reporting chickens with nO report for chickens raised, Fa-rms reporting not increased • . 12Figures .include estina·.tes for farms- reporting chickens -on ·hand with no report for eggs produced. ::1.3Includes eet~·te of' :82',71:5,742 dozens of eggs, valued at $34.,305,.877, for· farms reporting chickenB with no report for eggs prcxl.uced. Fanns reporting not increased. l 4To obtain. 1'ig.ure8 for ·chic:k.en eggs alone in 1909, the quantity and value of eggs of other kinds were estimated and deducted from the totals.

344 CENSUS OF AGRICULTURE: 1945 The total value of specified livestock was 87.2 percent
greater in 1945 than in 1940 because, in general·, the numbers were larger in 1945 and the values per head were highe~. Total sales of li vesta ck and livestock products were 143.7 percent greater for 1944 than for 1939 because of larger numbers or quantities and higher prices. But sales of livestock and livestock products per· dollar value of livestock as· inventoried were only 30.1 percent greater in 1944 than in 1939. However, since the inventory numbers as of January l, 1945, included considerable numbers of animals on feed that would not have been included in inventories_for April 1, the value of inventorieS for 1945, to be fully co~parable with the value for l940,would need to be reduced. A lower total value of inventories would, in turn, result in a higher ratio of sales to value with a correspondl ngly greater increase in the ratio of sales to inventories between the two years.
SELECT"'...D ITEMS FOR THE UNITED STATES, ¥liTH INDICATED CHANGE DURING FIVE-YEAR INTERVAL: ,CENSUSES OF 1945 AND 1940
1945 Census
1940 Census
.-';.f
Indicated change (percen~)
Fanns •..••.•.•.•.•.................... number. 5,859,169 6,096,799 -3.9 .• •;·.:~a~e she! of farm ................... acres.. 194.8 174.0 12.0 Cattle and calves ............ farms reporting.. 4,688, 746 4,845,417 ..:.3. 2
number.. 82,654,417 60,674,736 36.2 average number per farm reporting.. 17.6 12.5 40.8
Hoes and pigs ................ farms reporting.. 3,313,883 3, 766,675 -12.0 number.. 46,755,417 34,057,255 37.5
average number per farm reporting.. 14.1 9.0 56.? Total value of inventories of specified livestock and poultry ............... dollars .. 6,472,431,535 4,525,923,172 87.2
Tot-3.1 sales of specified livestock and livestock products .................. dollars .. B,644,670,850 3,547,482,358 143.7 Ratio of sales to value of
inventories ..... , ....... , ......... percent., 102.0 78.4 30.1
In the 1945 Census, a change was made in the method of enumerating the farming operations on Indian reservations. Generally, in previous censuses, all individual operations, if of sufficient size to qualify as farms· for census pu~oses, wer& enumerated as separate farms. In the 1945 Census, in many cases an entire reservation was reported as a smgffi farm if the acreage was used on a cooperative basis. In some States, Arizona for example, this change in method of enumeration affected the number of farms as reported by the Census and also the number of farms reporting the different kinds of livestock. These reduced numbers for farms materially affect the averages per farm reporting.
Value of farm products and sales.--Values shown in this chapter with the exception of tnose in tables 9 and 10, represent dollar measures of the livestock inventories and livestock production. The items for Which values are shown are, for the most part, those included in the 1945 Census. Tables 3 and 4 present available data for the United States for all censuses, beginning with 1840. Values for some of the earlier censuses are shown in these tables for certain combinations of items. Totals for these combinations are not fully comparable with the data available for 1945 as it was not feasible to segregate val-ues of certain minor items included in such combinations.
I The values shown for the various censuses reflect differences
in price per unit, as well as in numbers or quantities. Values provide a basis for measuring, in a limited way, the relative importance of individual items as reported in a particular census. In the 1910 census, the value or all horses and mules represented 53.0 percent of the value of all livestock inventories for the United States, while in 1945 the value represented only 11.5 percent. However, inventory values do not measure the relative importance of the contributions of the different classes or livestock to the farm income. The value of hogs, as o.f January 1,1945, represented but 11.7 percent of the total value of specified livestock on farms for the United Stutes, as contrasted with 66.1 percent for cattle. The value of hogs sold alive and hogs butchered on farms in 1944 was more than twice the January 1, 1945, inventory value of hogs, whereas the value of cattle and calves sold alive and cattle and calves butchered ~n farms in 1944 combined with the value of all milk production in that year is only slightly above the total value of January 1, 1945, cattle inventories.
The value of all milk produced on 1'arms in 1944 and in 1939 was calculated and is presented for the first time in this chap.,. ter. A description of' the method of computing the totai value of milk produced is given under· "Milk produced and dairy prod-qcts sold." ·
For censuses prior to 1935,value figures are shown only for the United States. In the tables which 1'ollow, values are showu, when appropriate, for the Censuses of 1945, 1940, and 1935. With the exception of tables 9 and 10, noted above, all values were computed, as described earlier in this chapte~ by applying a specified price per unit to the number of units reported.
The values for 1944 and 1939 given in tables 9 and 10 represent sales of 11 vestock and 11 vestock products as reported to the enumerators. Three inquiries were used in. the 1945 Census to secure these values. Each farm operator was asked the total amount received during 1944 for: (1) all dairy products sold; (2) all poultry and poultry products sold; and (:3) all livestock, wo:Jl, mohair, meat, etc., sold. In the 1940 Census, 1'our inquiries were used to secure the values of livestock and livestock products sold. In that year each farm operator was asked to report the total amount received during 1939 for: (1) all dair:l' products sold; {2) all poultry and poultry products sold; (3) all livestocl< sold alive; and. (4) all wool, mohair, meat, hides, etc., bees, honey, Wt;~X, and fur animals and pelts sold • The inquiries relaUng to dairy products sold and to poultry and poultry products sold were the same in both censuses. The third inquiry in the 1945 Census covered the same items as the third and fourth inquiries used in the 1940 Census.
Table 9 presents, by divisions and States, the gross total value of farm products sold or used by farm .households for all classified farms for the years 1944 and 1939. It also shows a similar gross total vall!le, as well as the value from the principal source, for dairy farms, for poultry farms, and for other livestock farms for the same years. The 1945 basis of classification of farms, by type, such as dairy, poultry, livestock, and other types, was somewhat different from that used in the 1940 Census.
A full deserl:ption of the method o.f classifyi'tl.g farms by type is'given in chapter X of this volume. The accompanying summary table, showing figures for the United States only., is included for ready reference. This table shows that the average gross farm income for the United States for all three types is above the average for all classHied farms for both 1944 and 1939; also, that, of the three types, livestock farms have the highest .gross average value of all products, that dairy farms
·have the next higllest, and po\!lltry farms the lowest. Livestock farms account for the largest proportion of the total gross United States farm income, with dairy next and poultry the smallest. All the above relationships hold true for both censuses. It is emphasized that these data are gross and do not, in any manner, represent net incomes or the profitableness of one enterprise as compared with that of another.
The classification of farms by type was based on source of income in both the 1945 and .1940 Censuses. Nine sources of income, each obtained by separate inquiry, were used in 1945 and ten sources in 1940; the es~ential difference being the combination of the two inquiries, viz, livestock sold alive; and wool., mohair, meat,. hides, etc. In the. 1940 Census, the largest single source of income, as shown by the replies to the ~;en inquiries, determined the "type" or classification by major source of income. Thus, if the largest amount reported in any of thfl ten inquiries was in reply to the question relating to dairY products sold, the farm was classified as "dairy," or if the largest amount reported was for poultry and poultry.products sold, the farm was classified as "poultry," etc. For the 1945 Census, a farm was classified as of a given type if the largest single amount represented more than half of the total receipts from all sales. Thus, if the amount reported in reply to the dafry products inquiry alone exceeded the combined receipts from all other sa1es, the farm was classified as "dairy"; if the amount reported did not exceed half of the total sales and no other single amount, exclusive of the value of products used by farm households, exceeded half of the total sales, the farm was classified as "general." No class was used in the 1940 Census similar to the 1945 "general" class.
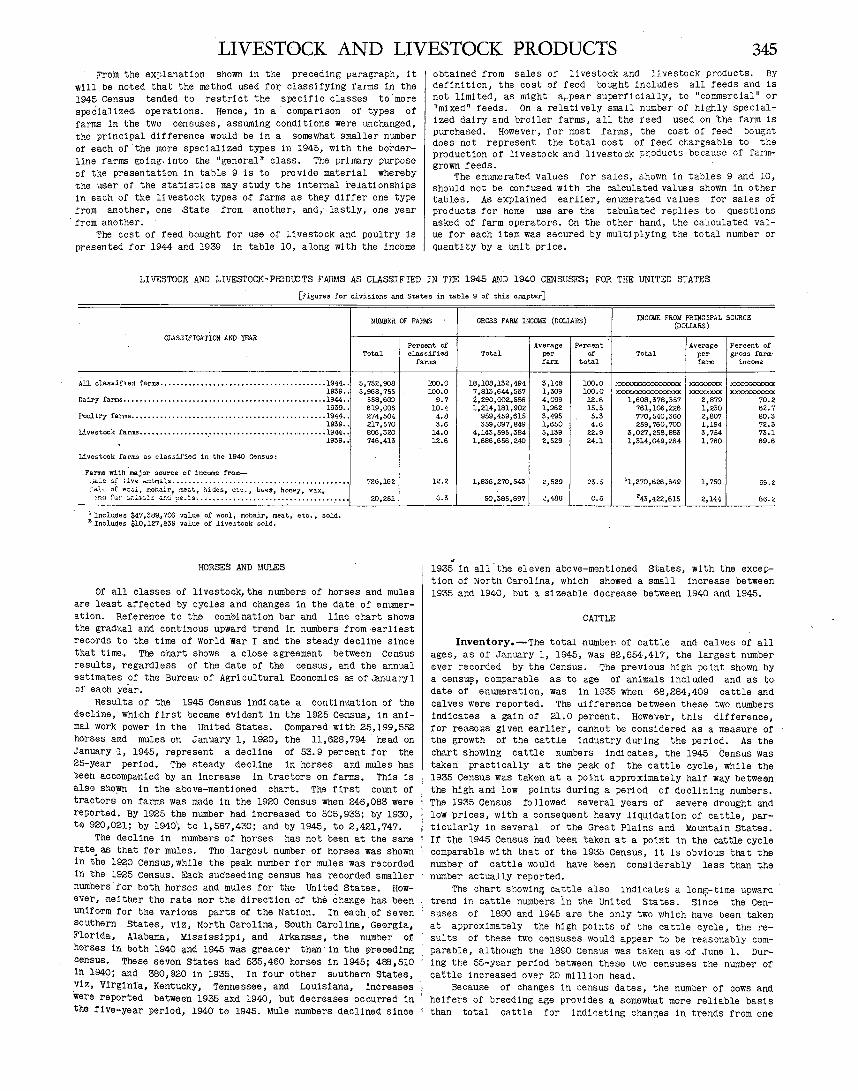
LIVESTOCK. AND LIVESTOCK PRODUCTS 345 Frain tile explanation shown. in the preceding paragraph, it
will be noted that the method used for classifying farms in the 1945 Census tended to restrict the specific classes to ·more specialized. operations. Hence, in a comparison of types of farms in the two censuses, assuming condi t1ons were unchanged, the pr1n·c1pal dH'ference wolild be in a somewhat smaller number of each of the more specialized types in 1945, with the borderline farms going. into the "general" class. The primary purpose of the presentation .in table 9 is to provide material whereby the user of the statistics may study the internal 'relationships in each of the livestock types of farms as they differ one type from another, one .State from another, and,· lastly, one year
· fnJm another. The cost of feed bought for use of livestock and poultry is
presented for 1944 and 1939 in table 10, alopg with the income
obtained from sales of livestock and livestock products. BY definition, the cost of feed bought includes all feeds and is not limited, as might appear superficially, to "commercial" or "mixed" feeds. On a relatively small number of highly specialized dairy and broiler farms, all the feed used on 'the farm is purchased. However, for most farm$, the cost of feed bought does not represent the total cost of feed cr.argeable to the production of livestock and livestock p~oducts because of farmgrown feeds.
The enumerated values for sales, shown in tables 9 and 10, should not be confused with the calculated values shown in other tables. As explained earlier, enumerated values tor sales of products for home use are the tabulated replies to questions asked of farm operators. On the other hand, the ca'lculated value for each item was secured by multiplying the total number or quantity by a unit price.
LIVESTOCK AND LIVESTOCK-PRlDU::TS FARMS AS CLASSIFIED IN THE 1945 AND 1940 CENSUSES; FOR THE UNITED STATES
[Figures f'or divj.sions and States in table 9 of this chapter]
NUIIBER OF FARMS GROSS FAR!! INCOI!E (DOLLARS) IN COllE FRO!! PRINCIPAL SOURCE (DOLLARS)
CLASSIFICATION AND YEAR Percent of Average Percent Average Percent of
Total classified Total per or Total per gross farm·
All classifJ.ed fu.·rms . •.•.••••••.•.••. ~ ....•••.•.•.•...•..... • 1944 • . 1939 ••
Dairy farms .•••.•..•..•...••.•..•..•....•............•.•....• 1944 •. 1939 ..
PoW. try farms .. , ............................................. 1944 .. 1939 ••
Livestock farms •••••.•.•.••....•..•.••.•..•..•••.......••..... 1944 .• . 1939 ..
Livestock fa.pms as classified in the 1940 Census:
Fa."!'s Yd_t~ .maJor s-o',ll"ce o.f income from-•Ja.;..e ~~ .~.~v~ ta.."li.ms. .... s •••••••.••••.•• ,., .•. , ••••..•..••••••••••••• ::"1 .. of wo¢l, mohair., meat., hides, ~t.c., bees, honey, w.;.x,
·.-:-:.c fur :,.r:..:.:n:;.:s ar~·:i pe_ ~s • ••••..••••••••••••••• : ••.•••••••.. · •••
·l InclJJdes $47 ,389., 706 value of wool, mohair, meat, etc., sold. 2 lncludes $10,127,859 val~e of livestock sold.
HORSES AND MULES
5,752,908 5,968,755
558,609 619,006 274,504 217,570 806,320 746,413
726,162
20,251
Of all classes of uv.estock, the numbers of horses and mules are least affected by cycles and changes in the date of enumeration. Reference to the combination bar and line chart shows the gradl!l.ai and continous upward trend in numbers from earliest records to the time of world War I and the steady decline since that time, The C'hart shows a close agreement between census resl!l.Us, regardless of' the date of the cerisus, and the annual estimates of the Bureau of Agricultural Economics as of .lmuaryl ol' each year.
Results of the 1945 Census indicate a c.ontinuation of the decUne, Wh1,ch first became evident in the 1925 Census, in animal work J')ower 1n the united States. Compared with 25,199,552 llorses and mules en January 1, 1920, the 11,628;794 -head on Jan,uary -1, 1945, represent a decline of 53.9 percent for the 25-year period. The steady decline 1n horses and mules has been accempanied by an increase in tractors on farms. This is also sho:wn in the above-mentioned chart. The first count of tractor,s o,n farms was made in the 1920 Census when 246,083 were reportM. BY 1925 the number had increased to 505,933.; by 1930, to 920,021; by 1940~ to 1,567,430; and by 1945, to 2,421,747.
The decline in numbers of horses has not been at the same rq.te. as that for mules. The largest number of hors.es was shown in, the 1920 Census, while the J'lElak number for mules was recorded in the 1925 census. Each suc'ceeding census has recorded smaller numbers tor both horses and mules for the United States. However, neither the rate !!10!1:' the direction of the change has been unifo,rm for the various parts oil' the Natton. In each. of s.even southern States, viz, North Carolina, South Carolina, Georgia, Florida, Alabama, Mississippi, and Arkansas, the number of herses in both 1940 and 1945 was greao:;er than· in the pre.ceding cen•sus. These se11en States had 535,460 horses in 1945; 4813,510 in 1940·; and 380,920 ln 1935. In tour other southern States, viz, Virginia, Kentucky, Tennessee, and Louisiana, increases 'were reported between 1935 and :t940, but decreases occurred in the five-year period, 1940 to 1945. Mule numbers de.clined since
farms farm total farm income
100.0 18,108,132,494 3,148 100.0 xxxxxxxxxxxxxxxx xxxxxxxx CC CCC~
100.0 7,813,644,567 1,309 100.0 XlOOClOCOOOOOOO xxxxxxxx xxxxxxxxxx:x 9.7 2,290,002,586 4,099 12,6 1,608,378,357 2,879 70.2
10.4 1,214,181,902 1,962 15.5 761,106,226 1,230 62.7 4.8 959,459,615 3,495 5.3 770,540,360 2,807 80.3 3.6 359,097,849 1,650 4.6 259,760,700 1,194 72.3
14.0 4,143,595,384 5,139 22.9 3,027,258,883 5,754 73.1 12.6 1,886,656,240 2,529 24.1 1,314,049,264 1,760 69.6
1~'.2 1,836,270,543 2,529 23.5 11,270,626,649 1,750 69.4
0.3 50,385,697 ~.488 0.6 243,422,615 2,144 SQ.;c
. . 1935 in all the eleven above-mentioned States, with the excep-tion of North Carolina, which showed a small increase between 1935 and 1940, but a sizeable decrease between 1940 and 1945.
CATTlE
Inventory.-The total number. of cattle and calves Of all ages, as of January 1, 1945, was 82,654,417 1 the largest number ev,er recorded by the Census. The previous high point shown. by a cans~, comparable as to age· of animals included and as to date of enumeration, was in 1935 when 68,284,409 cattle and calves were reported. The uifrerence between these two numbers indicates a gain of 21.0 percent. However, this difference, for reasons given earlier, cannot be considered as a measure of the growth of the cattle industry during the period. As the chart shoWing cattle numbers indicates, the 1945 Census was taken practically at the peak of the cattle cycle, while the 1935 Census was taken at a point approximately half way between the high and low points during a period of declining numbers. The 1935 Census followed several years of severe drought and low prices, with a consequent heavy liquidation of cattle, particularly in several of' the Great Plains and Mountain States. If toe 1945 Census had been taken at a poirit in the cattle cycle comparable with that of the 1935 Census, it is obvious that the number of cattle would have been considerablY less than the number actually reported.
The chart showin~ cattle also Indicates a long-time upwara trend in cattle numbers ln the United States. Since the Censuses of 1890 and 1945 are the only two which have been taken at approximately the high points of the cattle cycle, the results of these two censuses would appear to be reasonably comparable, although the 1890 census was taken as of June 1. During the 55-year period between these two censuses the number of cattle increased over 20 million head.
Because of changes in census dates, the number of cows and heifers of breeding age provides a somewhat more reliable basis than total cattle for indiGating changes in trends from one
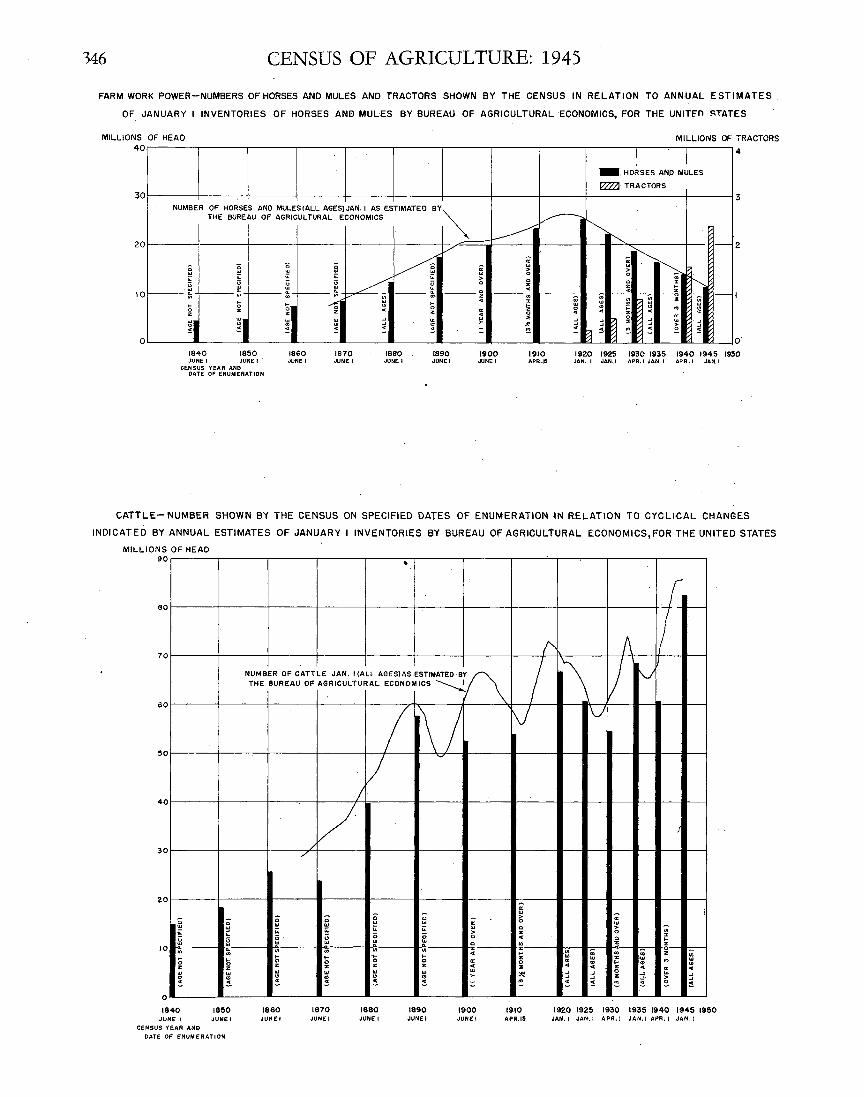
146 CENSUS OF AGRICULTURE: 1945
FARM WORK POWER-NUMBERS OF HORSES AND MULES AND TRACTORS SHOWN BY THE CENSUS IN RELATION TO ANNUAL ESTIMATES,
OF JANUARY I INVENTORIES OF HORSES AND MULES BY BUREAU OF AGRICULTURAL ECONOMICS, FOR THE UNITFn !';TATES
MILLIONS OF HEAD MILLIONS OF TRACTORS 40
I I 4
-· HORSES AN)) MULES 1ZiZ2J· TRACTORS
30
THE BUREAU OF AGRICULTURAL ECONOMICS NUMBER OF HORSES AND MULESIALL AGES)JAN.I AS ESTIMATED BY~ v-- ~
I ~ ~ !"'-. 1-20 2
10
0
Vi v
;; ~ 0 0
"' "' "' ~ ~ ;;; ;;: ~ ~ ~ <;
~ ~
r----~ 1---:; 1-----:; 1-----:l< ---:J; ---... 0 z
;I 1840 JUNE I
... 0 z
~I 1850 JUNE I
CENSUS YEAR AND DATE OF ENUMERATION
il 1860 JUNE I
-1 "' "' ~
1870 JUNE I
~ ~ .. 1880 JUNE I
... 0 z
"' "' ~
1890 JUNE I
"' "' ;; 0 z ---~
"' .. "' >---1900 JUNE I
'---._~ "' "' "' "' ;; > 0
0 "' "'-._ 0 ~ z z ... ~ ~ z --- - -o - I-t "' ~ 2
"" " 1910 APR.i5
"' "' "' "' "' 2 "' "' ~ "' "' "' "' " ~ 4 z 4 ~ "' ~ ~ ... ~
~ ~ e ~ .. .. 5 -~ ~ ~ ~ o· 1920 1925 1930 1935 1940 1945 1950 JAN. I JAN, I APR.I JAN. I APR.I JAN. I
CATTLE- NUMBER SHOWN BY THE CENSUS ON SPECIFIED DATES OF ENUMERATION IN RELATION TO CYCLICAL CHANGES
INDICATED BY ANNUAL ESTIMATES OF JANUARY I INVENTORIES BY BUREAU OF AGRICULTURAL ECONOMICS, FOR THE UNITED STATES
MILLIONS OF HEAD 90
eo
70
60
50
40
30
20
10
0 ;;; "' "' ;;: ;;: ;:;
~ ~- ~ ... ... 0 0 z z:
"' "' "' .. ~ ~
0
1840 1850 JUNE I JUNE I
CENSUS YEAR AND
DATE Of ENUMERATION
..
0_ A ~-
NUMBER OF CATTLE JAN. I (ALL AGES) AS ESTIMATED B~ I 1\ 1/ v THE BUREAU OF AGRICULTURAL ECON0MICS ~
I 1\/ ~ v
1860 JUNE I
./
v I v
;; "' ;;: ;; "' .. ... 0 %
"' .. ~
1870 JUNE I
;;; "' ;;:
~ .. ... 0 z
"' .. ~
1880 JUNE I
;; "' ;;:
~ .. ., ... 0 z
~ ~
1890 JUNE I
~
::; > 0 0 z .. "' .. "' ,.. ::
1900 JUNE I
~ "' > 0 0 z .. "' :c ... z 0
" :<:! ~
1910 APR.IS
i
'E I > 0 "' "' 0 ... z
~-., . ., ;;; r.::--" "' :c '"' "
:!l .. ·~ .. .. .. .. "' ..
~ 0 ... "' .... _, 2 ... > ... .. e 5 e :!.
1920 1925 1930 1935 1940 1945 1950 JAN. I JAN. I APR. I JAN, I APR. I JAN. I
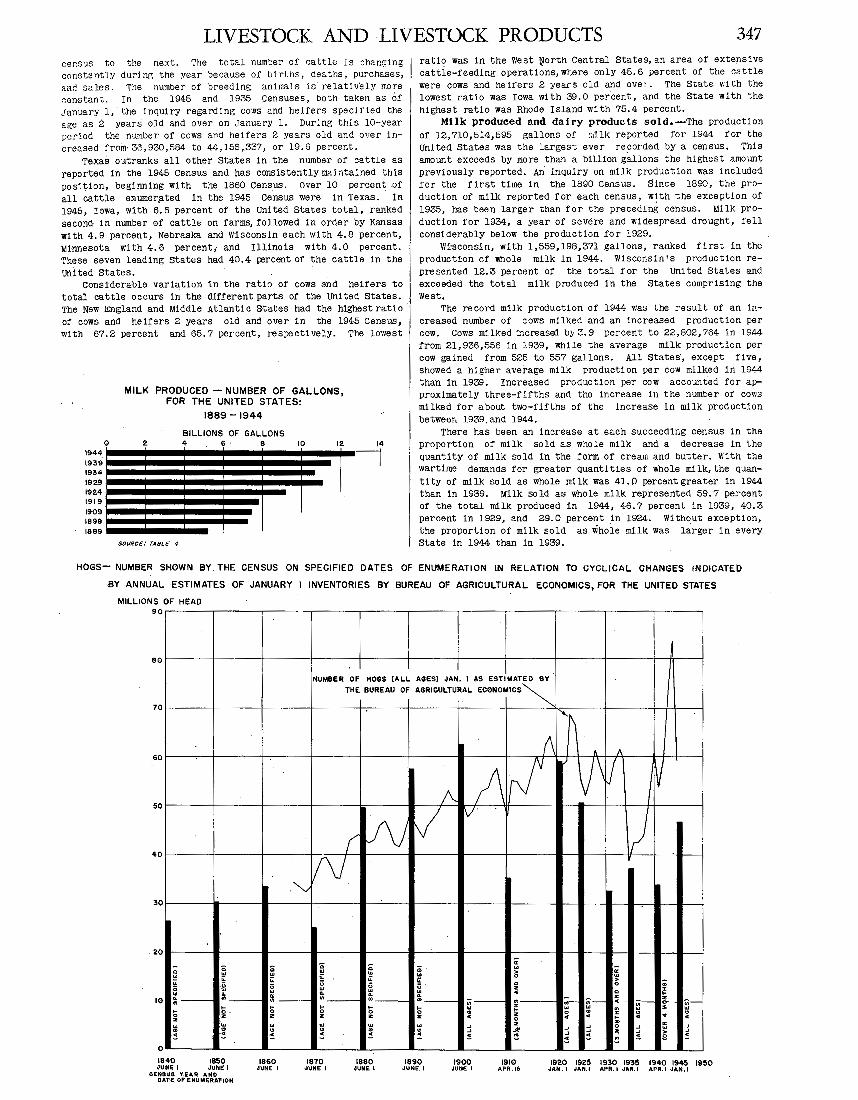
LIVESTOCK AND LIVESTOCK PRODUCTS 347
cer.s'.ls to the next. The total num::er of cattle ls ~hanr;ing consta.ntly durl nr; the year because of bi rt.hs, deaths, purchases, anc sales. The number of breeding animals is relati v'ely more constant. In the 1945 and 1935 .Censuses, both taken as of January 1, the inquiry regarding cows and heifers specified the age as 2 years old and over on ,Tanu&ry l. Dur~ng this 10-year period the number of cows and heifers 2 years old and over increased from· 36,930,584 to 44,156,337, or 19.6 percent.
Texas outranks all other States in the number of cattle as reported in the 1945 Census and has consistently mi ntained this posi~ion, beginning with the 1860 Census. over 10 percent of all cattle enumer.ated in the 1945 Census were in Texas. In 1945, Iowa, with 6.6 percent of the United States total, ranked second in number of cattle on farms, followed in order by Kansas with 4.9 percent, Nebraska and Wisconsin each with 4.8 percent, Minnesota with 4.6 percent; and Illinois with 4.0 percent. These seven leading Statt:s had 40.4 percent of the cattle in the United States.
Considerable variation in the ratio of cows and heifers to total cat-tle occurs in the different parts of the United States. The New England and Middle Atlantic States had the highest ratio of cows and heifers 2 years old and over in the 1945 Census, with 67.2 percent and 65.7 percent, respectively. The lowest
0
MILK PRODUCED -NUMBER OF GALLONS, FOR THE UNITED STATES:
1889-1944
BILLIONS OF GALLONS 2 4 6· e 10 12 14
1944EFI
1939 1934 1929 1924 1·9.19 1909 1899 1889
SOURCE.' TABLE 4
ratio was in the west ~orth Central States,an area or extensive cattle-reeding operations,where only 45.6 percent of the cattle were cows and heifers 2 years old and ove1. The State wlth the lowest ratio was rowa with 39.0 percent, and the State with the highest ratio was Rhode Island with 75.4 percent.
Milk produced and dairy products sold.--The production of 12,710,514,595 gallons of ~;,1lk reported for 1944 for the United States was the largest ever recorded by a census. This amount exceeds by more than a billion gallons the highest amount previously reported. Ari inquiry on milk production was included for the first time in the 1890 Census. Since 189C, the production of milk reported for each census, with the exception of 1935, has been larger than for the preceding census. Milk production ror 1934, a year of severe and widespread drought, rell considerably below the production for 1929.
Wi·sconsin, with 1,559,198,371 gallons, ranked first in the production of mole milk in 1944. Wisconsin's production represented 12.3 percent of the total for the United States and. exceeded the total milk produced in the States comprising the West.
The record milk production of 1944 was the result of an increased number of cows m1lked and an increased production per cow. Cows milked :lncreased by 3. 9 percent to 22,802,764 in 1944 from 21,936,556 in 1939, while the average milk production per cow gained from 525 t.o 557 gallons. All States·, except five, showed a higher average milk production per cow milked in 1944 than in 1939. Increased production per cow accounted for approximately three-fifths and the increase in the number of cows milked for about two-fifths of the increase in milk production betweer, 1939. and 1944.
There has been an increase at each succeeding census in the proportion of milk sold as whole milk and a decrease in the quantity of m1lk sold in the form of cream and butter. With the wartime demands for greater quantities of whole milk, the quantity of milk sold as whole milk was 41.0 percentgreater in 1944 than in 1939. · Milk sold as whole milk represented 59.7 percent of the total milk produced in 1944, 46.7 percent in 1939, 40.3 percent in 1929, and 29.0 percent in 1924. Without exception, the proportion of milk sold as whole milk was larger in every State in 1944 than in 1939.
HOGS-, NUMBER SHOWN BY. THE CENSUS ON SPECIFIED DATES OF ENUMERATION LN RELATION TO CYCLICAL CHANGES INDICATED
BY ANNUAL ESTIMATES OF JANUARY I INVENTORIES BY BUREAU OF AGRICULTURAL ECONOMICS, FOR THE UNITED STATES
MILLIONS OF HEAD 9 0
80
NUMBER OF HOGS (ALL AGES) JAN. I AS ESTIMA:~· THE BUREAU OF AGRICULTURAL ECONOMICS
"" 70
(\ A "
;\. 1\ lrl V' ~ v I
vv v rv· \) (_
IN
60
50
40
.'v 30
. 20
c; ~ "' :;: 0 0 ~ ... ... ... ... > i!i u: ;;: u: 0
;;: u: ;:; u: > ;; ~ ;; ~
0 0 " ... z ... .. 0 " ~ ... .. .. g;_ g; 1-
:;- .. _ ,_ " ;;;- - :- z z
" .,_ ;;;--10
1-1- ~· 0 z ... ... "'
.. :; :!
0
1840 1850 JUNE I JUNE I
CENSUS YEA'R A·ND D_ATE OF ENUMERATION'
1-0 z
"' .. :!
1860 JUNE I
1-0 z ... .. !
1870 JUNE I
'
1-0 z ... <!> :;
1880 JUNE I
1-0 z ... .. !
1890 JUNE_ I
... .. ..
.J
.J s
1900 JUNE I
" 1-z 0 ., 1!
1910 APR. IS
.. ... "' ... ,. 11 .. 0 " ..
" .. .. 1- .. .. .. 0: :: 0 .J .J .J "! .J
... .J -l .. > :; :; ~ s 2
1920 1925 1930 1935 1940 1945 1950 JAN. I JAN. I APR. I JAN. I APR. I JAN.I
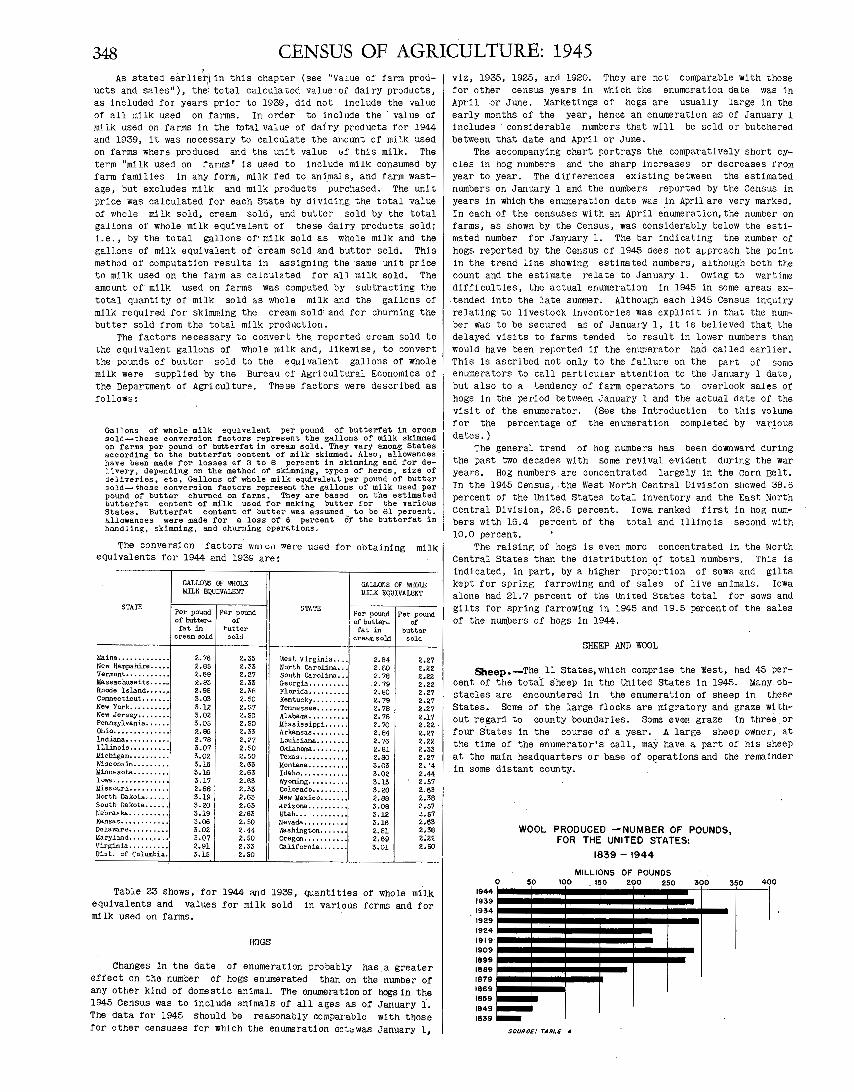
348 CENSUS OF AGRICULTURE: 1945 As stated earlie'h in this chapter (see "Value of farm prod:..
ucts and sales"), the\ total calculated value· of dairy products, as included fat' years prior to 1939, did not include the value of all milk used on farms. In order to include the value of milk used on farms in the total valu~ of dairy products for 1944 and 1939, it was necessary to calculate the aRount of milk used on farms where produced and the unit value of this milk. The term "milk used on farms" is used to include milk consumed by farm famllies in any form, milk fed to ani.mals, and farm wastage, but excludes milk and milk products purchased. The unit price was calculated for each State by dividing the total value of whole milk sold, cream sold, and butter sold by the total gallons of Whole milk equivalent of these dairy products sold; i.e., by the total gallons of· milk sold as whole milk and the gallons of milk equivalent of cream sold and butter sold. This method of computation results in assigning the ·same unit price to milk used on the farm as calculated for all milk sold. The amount of milk used on farms was computed by subtracting the total quantity of milk sold as whole milk and the gallons of milk required for skimming the cream sold: and for churning the butter sold from the total milk pr~duction.
The factors necessary to convert th~ reported cream sold to the equivalent gallons of whole milk and, likewise, to convert the pounds of butter sold to the e~ivalent gallons of whole milk were supplied by the Bureau of Agricultural Economics of the Department of Agriculture. These factors were described as follows:
Gallons of whole milk equivalent per pound of butterfat in cream sold--tbese conversion factors represent the gallons of milk skimmed on farms per pound of butterfat in cream sold. They vary among States according to the butterfat content of milk skimmed, Also, allowances have been made for losses of 3 to e percent in skimming and for de:ctvery, depending on the method of skimming, types of herds, size of ·1el1veries, etc. Gallons of whole milk equivalent per pound of butter sold-- these conversion factors represent the gallons of milk used per pound of butter churned on farms. They are based on the estimated butterfat content or mi'lk used for making butter for the various States. Butterfat content of butter was assumed to be e1 percent. ~llowances were made for a loss of 6 percent Of the butterfat in handling, skimming, and churning operations.
The conversion factors Wlll!:ll were used for obtaining milk equivalents for 1944 and 1939 are:
STATE
Maine ••••••••••••• New Hampshire ••••• Verm.ont ••••••••••• l&assachu.setts ••• ·-Rhode Island .. · ... ,. Connect.icut ••••••• Hew York. ••••••••• New Jersey •••••••• Pennsylvania •••••• Ohio .............. Indiana ........... Illinois ........ ,. lo!ichi<:an .......... ylisconsin ••••••••• llinnesota, •••••••• Iowa •••••••••• , •• , Missouri ••.••••••• North Dakota •••••• South Dakota •••••• Nebraska •••••••••• Kansas •••••••••• ,, Delaware ••••• , •••• Maryland ••••••.•• ·:, Virginia ••.••••••• Dist.. of Columbia.
GALLONS OF 1\IIOLE MILK EX;!UIVALENT
Per pound Per pound ot butte,_ oi: fat in hutter
cream sold sold .
2.76 2.33 2.85 2.33 2.69 2.27 2.83 2.35 2.95 2.38 5.05 2.50 5.12 2.57 5.02 2.50 5.05 2.50 2.86 2.55 2.78 2.27 3.07 2.50 5.02 2.50 5.16 2.65 5.16 2.65 3.17 2.65 2.88 2.55 5.19 2.65 5.20 2.65 5.19 2;65 5.06 2.50 5.02 2.44 3.07 2.50 2.91 2.35 3.15 2.50
STATE
West Virginia •.•• North carolina ••• South Carolina ••• Georgia •••••••••• Florida •••••..••• Kentucky •••• , •••• Tennessee •••••••• Alabsna .......... Mississippi. •••.• Arkansas ••••••••• Louisiana ••••••• , Oklahoma ......... Texas •••••••••••• Montana ••••• , •••• Idaho ............ Wyoming ••••••.•••• Colorado ••••••••• New Jlexico ••••••• Arizona •••••••••• Utah ••• Nevada ••••••••••• washingt.on •••••• 0
Oregon ••••••••••• california •••••••
GALLONS OF 'NHOT..E lo!ILK EQUIVALENT
Per pound Per pow1d of butter- of rat in butter
cream sold sold
2.84 2.27 2.SO 2.22 2.78 2.22
.2.79 2.22 2.SO 2.27 2.79 2.27 2.78 2.27 2.78 2.17 2.70 2.22. 2.84 2.27 2.76 2.22 2.81 2.55 2.80 2.27 5.05 2. ~4 5.02 2.44 3.15 2.57 5.20 2.65 2.8S 2.58 5.08 ?..57 5.12 ~.57
5.16 2.63 2.81 2.38 2.69 2;2~
3.01 2.50
Table 23 shows, for 1944 and 1939, ~antities of whole milk equivalents and values for milk sold in various forms and for milk used on farms.
HOGS
Changes in the date of enumeration probably has a greater effect on the number or hogs enumerated than on the number of any other kind of domestic animal. The enumeration of hogs in the 1945 Census was to include animals of all ages as of January i. The data for 1945 should be reasonably comparable with those for other censuses for which the enumeration d~:~was January 1,
viz, 1935, 1925, ancl 1920. They are not comparable with those for other census years in which the enumeration date was in April or June. Marketings of hogs are usually large in the early months of the year, hence an enumeration as of January 1 includes · considerable numbers that will be sold or butchered betw~en that date and April or June.
The accompanying chart portrays the comparatively short cycles in hog numbers and the sharp increases or decreases from year to year. The di1'ferences existing between the estimated numbers on January l and the numbers reported by the Census in years in Which the enumeration date was in April are very marked. In each of the censuses with an April enumeration, the number on farms, as shown by the Census, was considerably below the estimated number for January 1. The bar indicating the number of hogs reported by the Census of 1945 does not at:;proach the point in the trend line showing estimated numbers, although both the count and the estimate relate to January 1. Owing to wartime difficulties, the actual enumeration in 1945 in some areas ex
.tended into the late summer. Although each 1945 Census inquiry relating to livestock inventories was explicit in that the number was to be secured as of January 1, 1 t is believed that. the delayed visits to farms tended to result in lower numbers than would have been reported if the enumerator had called earlier. This is ascribed not only to the failure on the part of some enumerators to call particular attention to the January 1 date, but also to a tendency of farm operators to overlook sales of hogs in the period between January 1 and the actual date of the visit of the enumerator. (See the Introduction to this volume for the percentage of the enumeration completed by var1ous dates.)
The general trend of hog numbers has been downward during the past two decades with some rev! val evident durir.g the war years. Hog numbers are concentrated largely in the corn Belt. In the 1945 Census, .the West North Central Division showed 38.6 percent of the United States total inventory and the East North central Division, 26.5 percent. Iowa ranked first in hog numbers with 16.4 percent of the total and Illinois second with 10.0 percent.
The raising of hogs is even more concentrated in the North Central States than the distribution qf total numbers. This is indicated, in part, by a higher proportion of sows and gilts kept for spring farrowing and of sales of 11 ve animals. Iowa alone had 21.7 percent of the united States total for sows and gilts for spring farrowing in 1945 and 19.5 percentof the sales of the numbers of hogs ·in 1944.
SHEEP AND WOOL
Sheep.-The ll States, which comprise the West, had 45 percent of the total sheep ln the United States in 1945. Many obstacles are encountered in the enumeration of sheep in these States. Some of the large flocks are migratory and graze w~thout regard to county boundaries. Some even graze in three. or four States in the course of a year. A large sheep owner, at· the time of the enumerator's call, may have. a part· of his sheep at the main headquarters or base of OJ:?erations and the remainder
.in some distant county.
1944 1939 1934 1929 1924 1919 1909 1899 1889 1879 1869 1859 1849 1839
0
WOOL PRODUCED -NUMBER OF POUNDS, FOR THE UNITED STATES:
.1839- 1944
MILLIONS OF POUNDS 50 100 150 200 250 300 350
SOURCE.' TAIJL£ 4
400
I
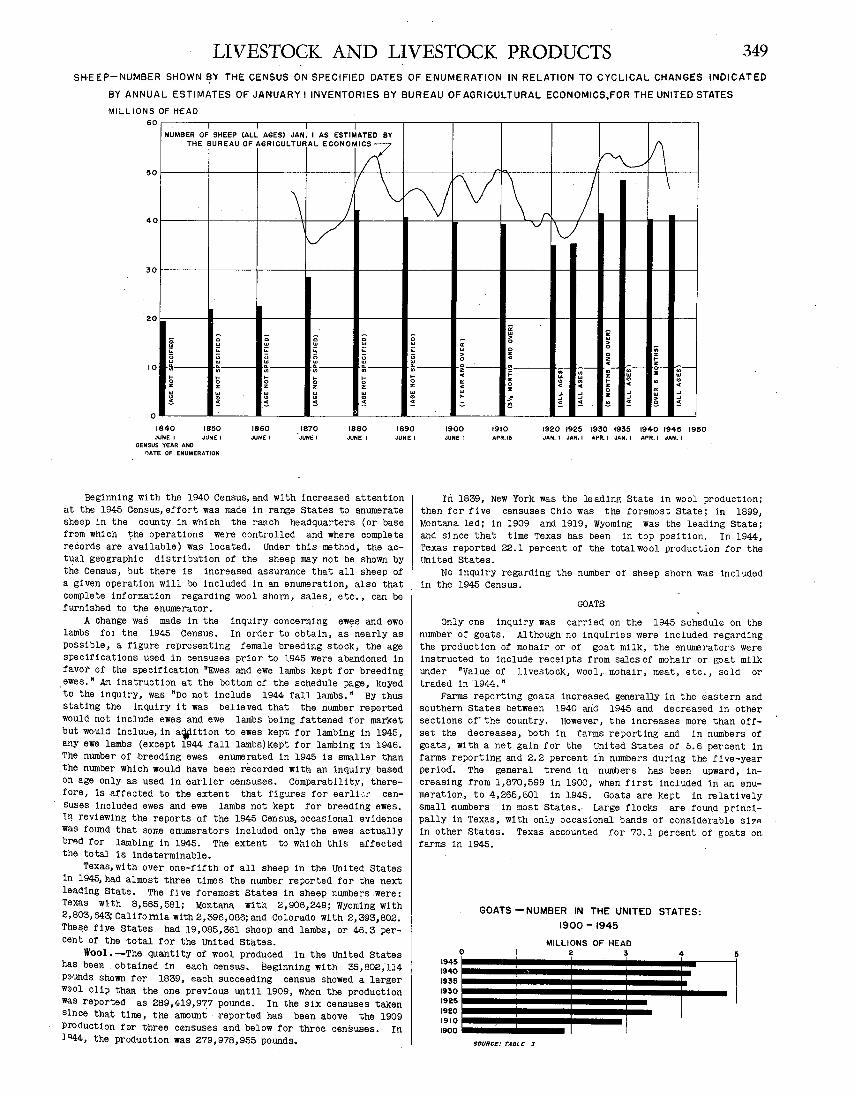
LIVESTOCK AND LIVESTOCK PRODUCTS 349 SHEEP-NUMBER SHOWN l?Y THE CENSUS ON SPECIFIED DATES OF ENUMERATION IN RELATION TO CYCLICAL CHANGES INDICATED
BY ANNUAL ESTIMATES OF JANUARY I INVENTORIES BY BUREAU OF AGRICULTURAL ECONOMICS,FOR THE UNITED STATES
MILLIONS OF HEAD 60
NUMBER OF SHEEP (ALL AGES) JAN~ I AS ESTI~ATED BY
1\ THE BUREAU OF AGRICULTUf AL ECONOMICS 7
~ /\ 50
\ ~ N rv \ J \ J r 40 v
30
~ c c f: '" "' !!; .. ;;: ;;:
" ~ ~ * "' .. .. "' "'
10 ... ... ... ... ~ 0 0 ~ z " "' "' "' "' ., ., ., ., ~ ~ ~ ~
0
1840 JUNE I
1850 JUNE I
1860 JUNE I
1870 ~JUNE I
1880 JUNE I
1890 JUNE I
CENSUS YEAR AND I"'ATE OF ENUMERATION
Beginning with the 1940 Census, and with increased attention at the 1945 Census, effort was made in range States to enumerate sheep in the county in which the ranch headquarters (or base from which the operations were controlled and where complete records are available) was located. Under this method, the actual ge·ographic distribution of the sheep may not be shown by the Census, but there is increased assurance that all sheep of a given operation will be included in an enumeration, also that complete information regarding wool shorn, sales, etc·., can be furnished to the enumerator.
A change was made in the inquiry concerning ew~s and ewe lambs fol the 1945 Census. In order to obtain, as nearly as possible, a figure representing female breeding stock, the age specifications used in censuses prior to 1945 were abandoned in favor of the specification "Ewes and ewe lambs kept for breeding
_ewes." An instruction at the bottom of the schedule page, keyed to the inquiry, was "Do not include 1944 fall lambs." BY thus stating the inquiry it was believed that the number reported would not include ewes and ewe lambs being fattenea for market but would 1ncluue,in a~ition to ewes kept for lambing in 1945, any ewe lambs (except 1944 fall lambs) kept for lambing in 1946. The number of breeding ewes enumerated in 1945 is smaller than .the number Which WOUld haVe been recorded With an inquiry based on age only as used in earlier censuses. Comparability, therefore, is affected to the extent that figures for earlLr censuses included ewes and ewe lambs not kept for breeding ewes. It} reviewing the reports o.f the 1945 Census, occasional evidence was found that some enumerators ineluded only the ewes actually br"d for lambing in 1945. The extent to which this affected the total is indeterminable.
Texas, with over one-fifth of all sheep in the U!li ted States in 1945, had almost three c1mes the number reported for the next leading State. The five foremost States in sheep numbers were: Texas with 8,585,581; MoNtana with 2,906,249; Wyoming with 2,803,643; California with 2,396,086; and -Colorado with 2, 393,802. These five State.s had 19,085,361 sheep and lambs, or 46.3 percent of the total for the United States.
Wool.-The quantity of wool produced in the united States has been . obtained in each censcis. Beginning with 35,802;ll4
·Pounds shown for 1839, each succeeding census showed a larger wool clip than the one previous until 1909, when the production was reported as 289,419,977 pounds. In the six censuses taken since that time, the amount reported has been above the 1909 production for three censuses and below for three censuses. In 1Q44, the production was 279,978,955 pounds.
a:
"' > 0 c
" c a:
"' .. ,.. ~
1900 JUNE I
2 '" > c c z
" .. " ... z 0 .. .:' ..
1910 APR,\5
v v
~ .. > 0
"' c " z ... " ~- ~- ~-,;- ~- .,- :a .. " ., ., .. ... c ..
"' "' c z 0 ~ j ..J
" ..J ..J
..J ..J > ..J
~ ~ l!! .. 2 ~
1920 1925 1930 1935 1940 1945 1950 JAN, I JAN, I APR. I JAN. I APR. I JAN. I
In 1839, New York was the leading State in wool production; then for five censuses Ohio was the foremost State; in 1899, Montana led; in 1909 and 1919, Wyoming was the leading State; and since that time Texas has been in top position. In 1944, Texas reported 22.1 percent of the totalwool production for the U!li ted States.
No inquiry regarding the number of sheep shorn was included in the 1945 Census.
GOATS
Only one inquiry was carried on the 1945 schedule on the number of goats. Although no inquiries were included regarding the production of mohair or of goat milk, the enumerators were instructed to include receipts from sales of mohair or goat milk under "Value of livestock, wool,. mohair, meat, etc., sold or traded in ·1944."
Farms reporting goats increased generally in the eastern and southern States between 1940 arid 1945 and decreased in other sections of' the country. However, the increases more than offset the decreases, both in farms reporting and in numbers of goats, with a net gain for the United States of 5.8 percent in farms reporting and 2.2 percent in numbers during the five-year period. The general trend in numbers has been upward, increasing from 1,870,599 in 1900, when first included in an enumeration, to 4,265,501 in 1945. Goats are kept in relatively small numbers in most States. Large flocks are found principally in Texas, with only occasional bands of considerable Si7-A in other States. Texas accounted for 70.1 percent of goats on farms in 1945.
GOATS -NUMBER IN THE UNITED STATES:
1900-1945
MILLIONS OF HEAD
SOURCE.' TABLE !
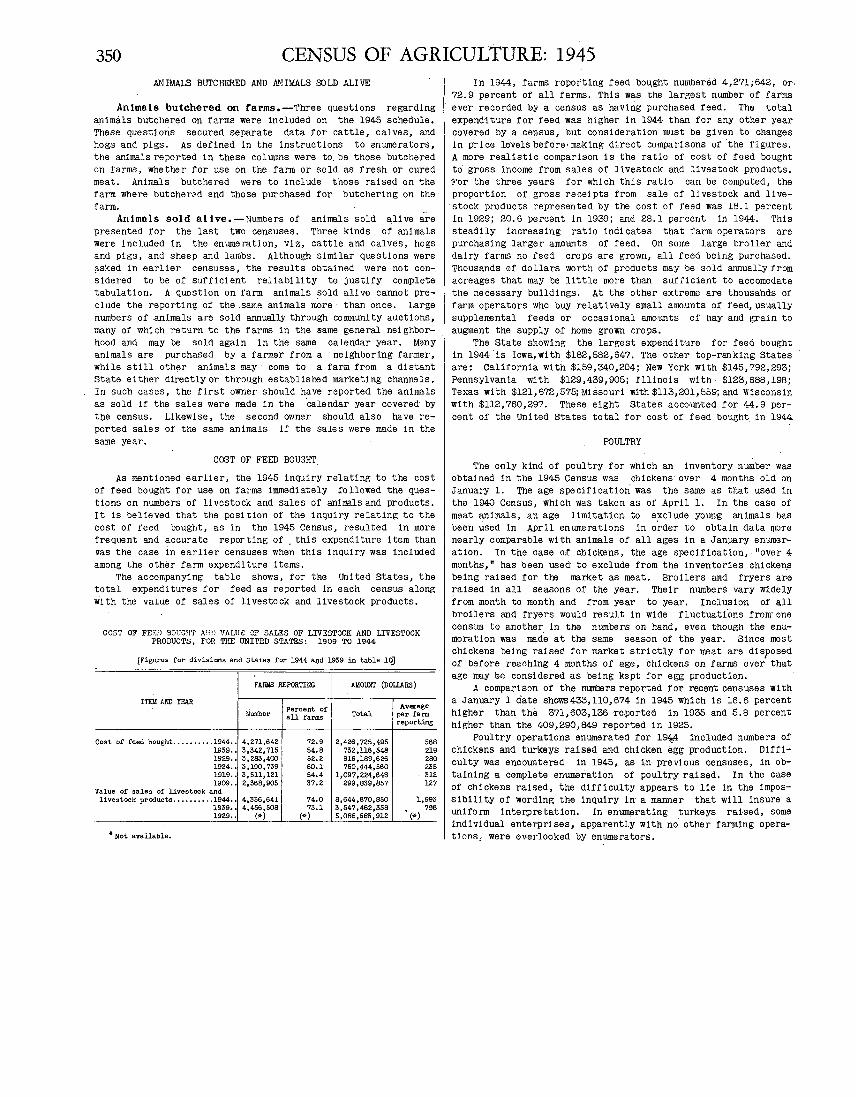
350 CENSUS OF AGRICULTURE: 1945 ANIMALS BUfCHERED AND ANIMALS OOLD ALIVE In 1944, farms reporting feed bou;ght numbere<il 4,271;642, or.
72.9 percent of all farms. This was the largest number of farms Animals butchered. on farms.-Three questions regarding ever recorded by a census as having purchased feed. The to'tal
animals butchered on farms were included on the 1945 schedule. These questions secured separate data for cattle, calves, and hogs and pigs. As defined in the instructions to anumerators, the animals reported in these columns were to. be those butchered on !'arms, whether for use on the farm or sold as fresh or cured meat. Animals butchered were to include those raised on the farm where butcher0d and those purchased for butchering on the· farm.
Animals sold alive.-Numbers of animals sold alive are presented for the last two censuses. Three kinds of animals were included in the enumeration, viz, cattle and calves, hogs and pigs, and sheep and lambs. Although similar questions were ?-Sked in earlier censuses, the results obtained were not con-. sidered to be of sufficient reliability to justify complete tab'llation. A question on rarm animals sold alive cannot preclude the reporting of the .same animals more than once. Large numbers of .animals are sold aimually through community auctions, many of which return to the farms in the same general neighborhood and may be sold again in the same calendar year. Many animals are purchased by a farmer from a ·neighboring farmer, while still other animals may· come to a farm from a distant State either directly or through established marketing channels. In such cases, the first owner should have reported the animals as sold if the sales were made in the ·calendar year covered· by the census. Likewise, the second owner should also have reported sales of the same animals if the sales were made in the same year.
COST OF FEED BOUGHT
As mentioned earlier, the 1945 inquiry relating to the cost of feed bought for use on farms immediately followed the questions on numbers of livestock and sales of animals and products. It is believed that the post tion of the inquiry relating to the cost of reed bought, as in the 1945 Census, resulted in more frequent and accurate reporting of . this expenditure item than uas the case in earlier censuses when this inquiry was included among the other farm expenditure items.
The accompanying table shows, for the United States, the total expenditures for feed as reported in each census along with the value of sales of livestock and livestock products.
COST OF FE'lD 8C>!.'GHT A!·;!! VALUe ·:!F SALES OF LIVESTOCK AND LIVESTOCK PRODUCTS, FOR THE UNITED STATES: 1909 TO 1944
[Figures for divisions and States for 1944 Bl)d 1959 in table 10]
FA!llJS REPORTING AMOUNT (DOLlARS)
ITEI! AND YEAR Average Percent of
Number all farms Total per farm reporting
Cost of feed bought .......... 1944 .. 4,271,642 72.9 2,426,725,495 568 1959 .. 3,342, 715 54.8 732,116,548 219 1929 •• 5,283,400 52.2 919,189,626 280 1924 .. 3,190,739 50.1 750,444,560 255 1919 .. 3,511,121 54.4 1,097, 224,648 312 1909 .. 2,368,905 37.2 299,839,857 127
Value of sales of livestock and livestock products~ ......... 1944 •. 4,336,641 74.0 8,644,670,850 1,993
1939 •• 4,456,508 73.1 3,547,482,558 796 1929 .. (*) (*) 5,065,585,912 (*)
*Not available.
expenditure for feed was higher in 1944 than for any other year covered by a census, but consideration must be given to changes in price levels before• making direct comparisons of ·the figures. A more realistic comparison is the ratio of cost of feed bought to gross income from sales of l1 vestock and 11 vestock products. For the three years for which this ratio can be computed, the proportion of gross receipts from sale of livestock and livestock products represented by the cost of feed was 18.1 percent in 1929; 20.6 percent in 1939; and 28.1 percent in 1944. This steadily increasing ratio indicates that farm operators are purchasing larger amounts of feed. On some large broiler and dairy farms no feed crops are grown, all feed being purchased. Thousands of dollars worth of products may be sold annually from acreages that may be little more than sufficient to accomodate the necessary buildings. At the other extreme are thousahds of farm operators who buy relatively small amounts of feed, usually supplemental feeds or occasional amo·unts of hay and grain to augment the supply of home grown crops.
The State showing the largest expenditure for feed bought in 1944 is Iowa,with $182,582,647. The other top-ranking States are: California with $159,340,204; New York with $145,792,293; Pennsylvania with $129,439,905; Illinois with· $123,688,198; Texas with $121,672,575;Missouri w1th$113,201,559;and Wisconsin with $ll2,760,297. These eight States accounted for ·~4.9 percent of the United States total for cost of feed bought in 1944.
POULTRY
The o~ly kind of poultry for which an inventory number was obtained in the 1945 Census was chickens over 4 months old on January l. The age specification was the same as that used in the 1940 Census, which was taken as ol' April l. In the case of meat animals, an age limitation to e;xclude young animals has been used in April enumerations in order to obtain data more nearly comparable with animals of all ages in a Jan~ry enumeration. In the case or chickens, the age specification, "over 4 months," has been used to exclude from the inventories chicken.s being raised for the market as meat. Broilers and fryers are raised in all seasons of the year. Their numbers vary Widely from month to month and from year to year. Inclusion of all broilers and fryers would result in wide fluctuatt'ons from· one census to another in the numbers on hand, even though the enumeration was made at the same season of the year. Since most chickens being raisec for market strictly for meat are disposed of before rea~hing 4 months of age, chickens on farms over that age may be considered as being kept for egg production.
A comparison of the numbers reported for recent censuses with a January l date shows433,110,674 in 1945 Which is 16.6 percent higher than the 371,603,136 reported in 1935 and 5.8 percent higher than the 409,290,849 reported in 1925.
Poultry operations enumerated for 19~ included numbers of chickens and turkeys raised and chicken egg production. Dif1'1-culty was encountered in 1945, as in previous censuses, in obtaining a complete enumeration of poultry raised. In the case of chickens raised, the difficulty appears to lie in the impossibility of wording the inquiry in a manner that will insure a uniform interpretation. in enumerating turkeys ralsed, some individual enterprises, apparently with no other farming operatfol'ls, were overlooked by enumerators.
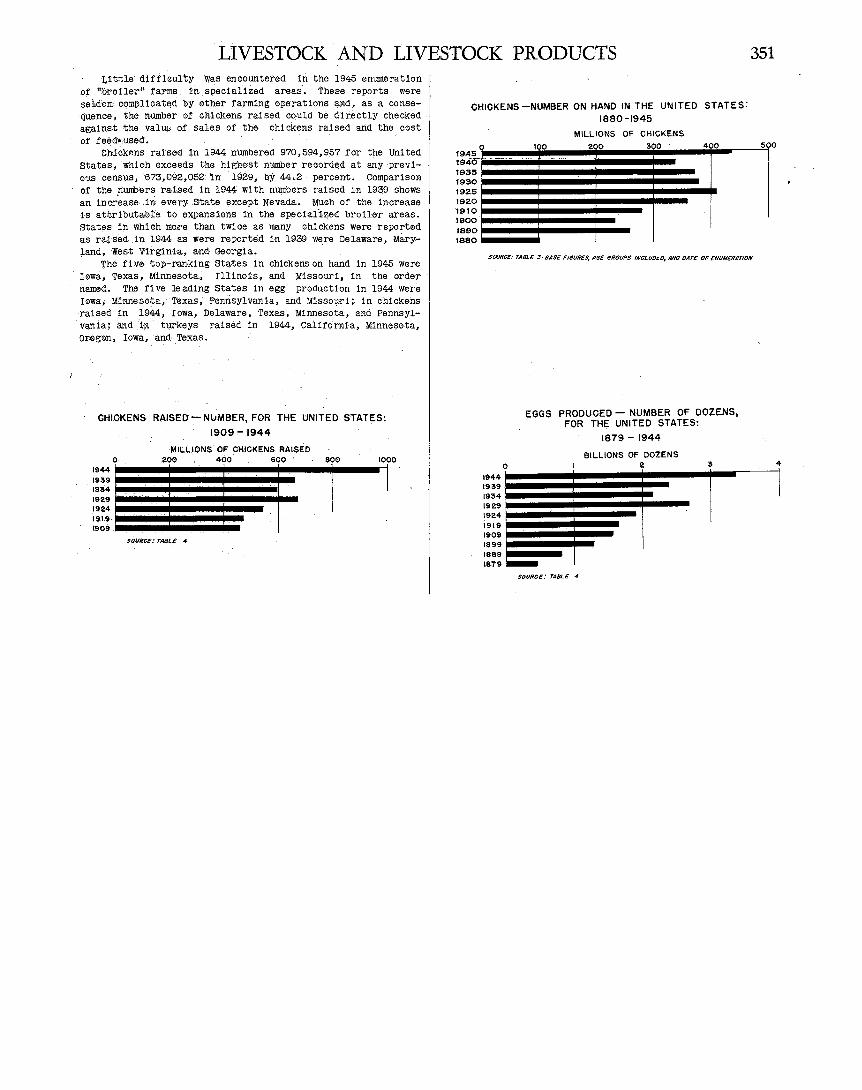
LIVESTOCK . AND LIVESTOCK PRODUCTS 351 ·J,.t·t;t;!Le d:H'ffculty 'WaS encountered in the 1945 enumeration
.of "f>ro.iier·• fa'rms. in specialized area-s-. These reports. were sellldem compllca:t;E!d by other farmin.g o.perati.ens an.d, as a consequenc.e, the n1illllber of cM·ckei::J.s raised could be directly checked. aiga1•ns•t the valUl> oif saies of the chickens raised and. the cost oif reed• used-.
c:nf.ckilns raisect in '1944 lii'UDiberE!d 970,594,957 for tne United States, ·wl11·ch .exce.ed!s tiie· 1).1g;ne·st number recorde<il. at any ·prev1-o·us cen.sus, 6?3.,092.,052: 'in ·1929,. by 44 •. 2 · percent. Comparison of th.e pumlilers :ra:Lse<ilin 1944 with n.umbers· raised 1n 1939 shows an ~ilil-orease h:i eveii'Y State except Nevada. Muclil of the increase is attr1butabl!e to expansions in the specialized brone·r areas. States· in.wfu.!ch lilo.re than twice as lll8iny chickens were reported as rai'se<il, .tn 1944 as were reported i-n 1939 were Delaware, :Mliry;tand, Wes-t Virginia, and Georgia.
Whii r.1ve top--ran•king States 1n chicke!IS on. ha:ri<il 1R 1945 were r.0wa., Texas, .·M1nResota; Ill1no1:;;, and Missouri, 111 .the or<iler Ramed-. Tne fiVe leading S-tates in egg· production 1n 1944 were Iowa:, M1!1neSota,· Tllxas, Pennsylvania, and M1sSol,lr1; 1n chickens raised 1-R' 1944, towa, Delaware, Texas, M1Mesota; and Pennsylv~i:a.;. an<il. 'tn . tl;lrkeys raised in. 1944, Cal11'oi"R1a, Minnesota, Ore$'!iil'l, Iowa.,· andi.Texas.
GHIOK~_N$ RAISED- NlJMBER, FOR THE UNITED STATES:
1909-1944
'~] 1939 193'4 ;'
--._::I. .1919·; 1909:
MILLIONS- OF CHICKENS RAISED :200·
l r T SOU!lCE.' TABLE 4
CHICKENS -NUMBER ON HAND IN THE UJ\IITED STATES: 1880-1945
MILLIONS OF CHICKENS
10 20 30 40 50
194ll!!i!!!!!llli!i!i!ili!i!~~~~~~;:f'""----~ 1940 193!5 1930 1925 1920 '1910 1-900 1890 1880
SOIJRCE: TABLE 3·8ASE FIGURES, AGE GROUPS INCLUOI!D, AND OAT£ OF ENUMERATtON
1944 1939 1934 1929 1924 ic9-19 1909 1899 1889
0
EGGS PRODUCED- NUMBER OF DOZENS, FOR THI;: UNITED STATES:
1879- 1944
BILLIONS OF DOZENS 2 3
1879 .....
SOURfJ.£.' TABLE ·4
4
I