Valuation of Ecosystem Service from Shellfish - The Pacific Shellfish
Massachusetts Shellfish Aquaculture
Economic Impact Study
Prepared for:
Presented By: The University of Massachusetts Dartmouth
Charlton College of Business
Center for Marketing Research
In Collaboration With: Dr. Nora Ganim Barnes
Director, Center for Marketing Research
Conducted By: Kevin Augusto
Glenn Holmes
With Support From:
Cape Cod Cooperative Extension
Woods Hole Sea Grant
SouthEastern Massachusetts Aquaculture Center
Winter 2015
UNIVERSITY OF MASSACHUSETTS DARTMOUTH
CHARLTON COLLEGE OF BUSINESS
CENTER FOR MARKETING RESEARCH
The Charlton College of Business, Center for Marketing Research at the University of
Massachusetts Dartmouth is a unique and affordable marketing assistance center. The
Center is dedicated to facilitating the economic development of the region by providing an
affordable, high-quality economic alternative to meeting business needs for research,
training, and consulting in all aspects of Marketing. Through the Center, businesses can
secure direct access to the full resources of the University, expertise of the Center’s faculty
and staff and assistance from selected faculty-supervised students.
Nora Ganim Barnes, Ph.D.
Chancellor Professor of Marketing
University of Massachusetts Dartmouth
Center Director
EXECUTIVE STAFF
Nora Ganim Barnes, Ph.D
Director
Ava Lescault, MBA
Senior Research Associate/
Associate Director
Correspondence and inquiries should be addressed to the Center for Marketing Research,
University of Massachusetts Dartmouth, 200 Mill Road Suite 150A, Fairhaven,
Massachusetts, 02719 (telephone: 508-999-8756; fax 508-910-6297; email:
Copyright Center for Marketing Research. All rights reserved. This document may not
be reproduced in any form without prior written permission from the Center for
Marketing Research.
Website address: www.umassd.edu/cmr/
The information and analysis in this report does not represent an official statement or view
of the University of Massachusetts.

TABLE OF CONTENTS
EXECUTIVE SUMMARY .............................................................................................. 1
INTRODUCTION............................................................................................................. 3
METHODOLOGY ........................................................................................................... 4
SURVEY INSTRUMENT ................................................................................................ 5
SIGNIFICANCE TEST .................................................................................................... 8
FINDINGS ......................................................................................................................... 9
ECONOMIC IMPACT .................................................................................................. 26
CONCLUSION ............................................................................................................... 28
RECOMMENDATION .................................................................................................. 30

UMASS report prepared for Cape Cod Cooperative Extension, Woods Hole Sea Grant & SEMAC Page 1
Executive Summary
Forty-nine percent of the shellfish farmers surveyed had a total of 256.11 acres in
production located in Cape Cod towns, 161.25 acres are located on the South Coast
(31%), 70.74 acres are located in South Shore towns (13%), 37.75 acres are located on
the Islands (7%) and 2 acres are located in North Shore towns (<1%).
Two percent of respondents had growing areas located in North Shore towns, 18% in
South Shore towns, 64% in Cape Cod towns, 10% on the Islands and 6% on the South
Coast.
Shellfish farming is the primary source of income for 48% of respondents and the
secondary source for 53%.
The surveyed leaseholders reported 423 jobs in 2013. Of those employed, 169 worked
full-time throughout the year (40% of all reported jobs), 121 worked part-time on a
seasonal basis (29%), 74 worked part-time throughout the year (17%) and 59 worked
full-time on a seasonal basis (14%).
Sixteen percent of leaseholders are 25-39, 31% are 40-59, 31% are 55-64 and 23% are 65
and over.
Ninety-six percent of respondents farmed oysters in 2013, 18% farmed hard-shell clams,
6% farmed soft-shell clams, 1% farmed bay scallops and no one farmed mussels.
Forty-five percent of respondents who farmed oysters in 2013 raised seed, 46% raised
petites, 92% raised legal and 5% raised some other class of oysters.
Of the 19,135,928 oysters sold by respondents, 58% were farmed in Cape Cod towns,
26% were farmed on the South Coast, 11% were farmed in South Shore towns, 5% were
farmed on the Islands and none were farmed in the North Shore towns.
Forty-three percent of respondents who farmed hard-shell clams in 2013 raised seed,
86% raised littlenecks, 19% raised cherrystones and 5% raised chowders.
Almost all of the reported hard-shell clam sales originated in the Cape Cod towns.
Thirty-seven percent of respondents reported sales of $9,999 or less, 13% reported sales
between $10,000 and $49,999, 21% reported sales between $50,000 and $99,999,
13% reported sales between $100,000 and $199,999, 10% reported sales between
$200,000 and $499,999 and 6% reported sales of $500,000 or more.

UMASS report prepared for Cape Cod Cooperative Extension, Woods Hole Sea Grant & SEMAC Page 2
Fifty-nine percent of respondents sell their shellfish to small, local wholesalers/retailers,
48% sell to larger, statewide/interstate wholesalers and 18% sell their shellfish
themselves as wholesale/retail dealers. Of those who classified themselves as a
wholesale/retail dealer, 62% sold all of their shellfish in Massachusetts.
Thirty-six percent of expenditures are for employee compensation, 16% are for purchases
of gear, 16% are for purchases of shellfish seed, 14% are for self-pay, 7% are for
truck/gas expenses, 4% are for boat expenses, 3% are for insurance, 1% is for leases and
permits and 3% are for other expenditures.
We estimate that the output of the shellfish aquaculture industry in Massachusetts was
valued at approximately $25.4m in 2013, which in turn generated approximately $45.5m
in the Massachusetts economy, or 1.79 times the activity.
Shellfish farmers were responsible for approximately 769 direct jobs in 2013. They also
generated an additional 140 jobs through indirect and induced activity, resulting in a total
of 909 jobs in Massachusetts.
Shellfish farmers paid approximately $11.9m in wages in 2013. Their economic activity
generated additional labor income of $8.2m, for a total of approximately $20.1m in labor
income in Massachusetts.
UMASS report prepared for Cape Cod Cooperative Extension, Woods Hole Sea Grant & SEMAC Page 3
Introduction
Aquaculture is the farming of aquatic organisms, such as fish, shellfish and plants, conducted in
land-based, freshwater and marine facilities. The farming of shellfish is a relatively recent
undertaking in the United States. Although the cultivation of aquatic species, specifically
shellfish and crustaceans, was practiced by the Native Americans and later by the Colonists on
Cape Cod, more efficient cultivation techniques were not developed for commercial activities
until the 1970s.1
Since then, the aquaculture industry has experienced significant growth. By 2021, worldwide
aquaculture production is expected to grow to about 172m metric tons, an increase of 15% over
2009-2011 levels.2
Over 1,500 leases, permits and licenses for place-based aquaculture are held in New England
alone. The value of shellfish aquaculture in the region is between $45m and $50m, with oysters
being the most valuable product being raised.2 According to the Northeastern Regional Ocean
Council, the future growth potential for shellfish aquaculture in New England is significant as
demand grows in the market.
In Massachusetts, aquaculture is managed by the Division of Marine Fisheries and coastal
municipalities. In 2011, 349 aquaculture license holders held 378 licenses totaling 1,030 acres.2
With no commercial finfish sites in the marine environment in Massachusetts, shellfish farming
is the dominant form of aquaculture. Species produced include oysters, hard-shell clams
(quahogs), soft-shell clams, bay scallops and blue mussels. Shellfish are typically cultivated for
food, research, biomedical, sport and ornamental purposes.3
Shellfish aquaculture in the state has demonstrated sizable growth over the past decade. Between
2001 and 2004, $3.5m of shellfish were produced annually.2 In 2006, that number increased to
$6.2m.1 By 2010, annual production included 71,831 bushels of oysters, 18,398 bushels of hard-
shell clams and 1,815 bushes of soft-shell clams (valued at $10.22m).2
The purpose of this study is to identify and quantify the economic impact of the Massachusetts
shellfish aquaculture industry during 2013. Of the approximate 334 leaseholders with acreage in
production in 2013, 118 individuals were surveyed. Lease locations were categorized within five
coastal regions: North Shore towns, South Shore towns, Cape Cod towns, the Islands, and the
South Coast. In order to provide current insights on the nature of the industry, the study aims to
pinpoint shellfish pricing and sales, identify regional differences in farming behaviors and
determine leaseholder and farm demographics.
1 Massachusetts Department of Agriculture Resources. 2014. Aquaculture Industry.
http://www.mass.gov/eea/agencies/agr/about/divisions/aquaculture-industry-generic.html 2 NROC. March 2013. Overview of the aquaculture sector in New England.
http://northeastoceancouncil.org/wp-content/uploads/2013/03/Aquaculture-White-Paper.pdf 3 Woodshole Sea Grant. September 2010. Shellfish aquaculture in Massachusetts.
http://www.whoi.edu/seagrant

UMASS report prepared for Cape Cod Cooperative Extension, Woods Hole Sea Grant & SEMAC Page 4
Methodology
The purpose of this study is to investigate and quantify the economic impact of the shellfish
farming industry in Massachusetts. In addition, the goals of this study are to:
Determine leaseholder and farm demographics.
Provide insight on shellfish sales in-state versus out-of-state by farmers in Massachusetts.
Identify potential leaseholders who are also wholesale/retail dealers and provide insight
into the percentage of sales in-state versus out-of-state.
Determine regional differences in farming behaviors and output.
To achieve these goals, the University of Massachusetts Dartmouth Center for Marketing
Research (CMR) contracted with the Southeastern Massachusetts Aquaculture Center (SEMAC)
to conduct a leaseholder survey via mail and through an online link.
CMR mailed a hard copy of the survey to 334 leaseholders. A postage paid envelope was
enclosed. An electronic copy of the survey was also made available to the farmer-leaseholders
and email reminders were sent out periodically. SEMAC informed the farmers that the returned
surveys would be handled by the UMass Dartmouth Center for Marketing Research.
The mailing went out on October 13, 2014 with a deadline for reply by November 29, 2014. The
data was tabulated December 12, 2014 to assure that all leaseholders had the opportunity to
participate in the study. Fifty-three percent (63) of the surveys were mailed back and 47% (55)
were taken online.
Of the 334 leaseholders contacted, 118 responded, yielding a response rate of 35%. Similar
studies report response rates of less than 15%.
The findings in this study are statistically valid at + 6.5%.
UMASS report prepared for Cape Cod Cooperative Extension, Woods Hole Sea Grant & SEMAC Page 5
Massachusetts Shellfish Aquaculture Economic Impact Study
Conducted by the University of Massachusetts Dartmouth Charlton College of Business
Center for Marketing Research
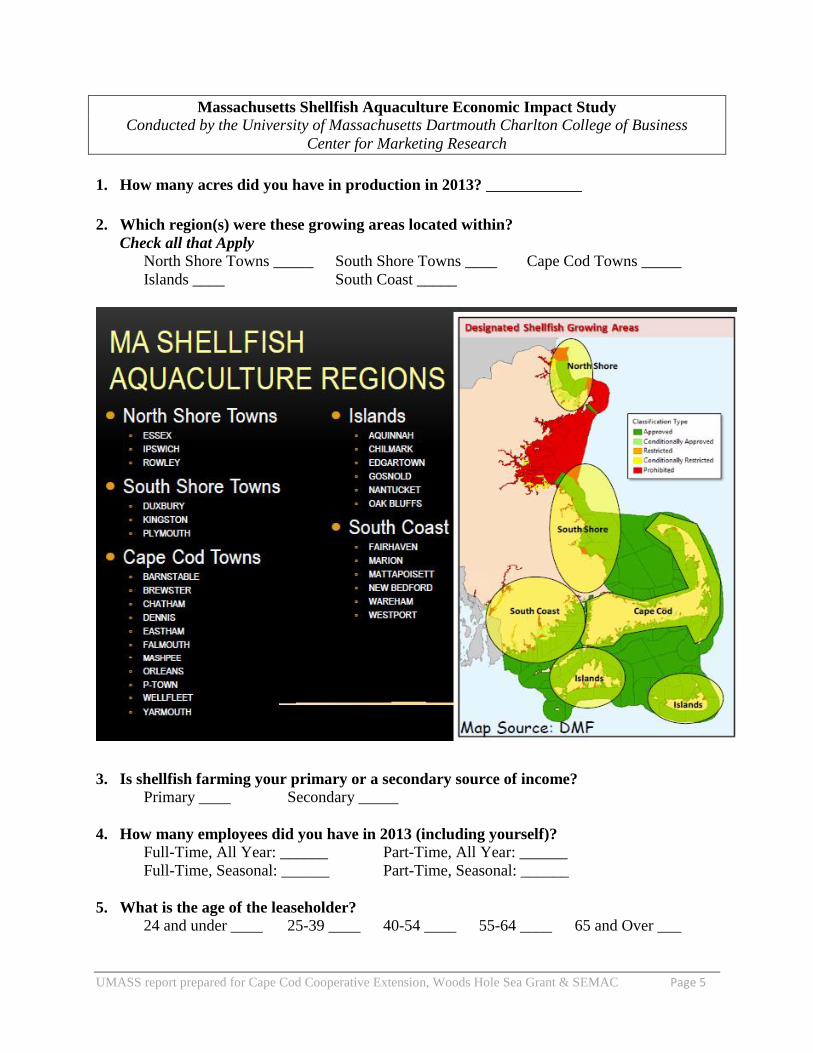
1. How many acres did you have in production in 2013? ____________
2. Which region(s) were these growing areas located within?
Check all that Apply North Shore Towns _____ South Shore Towns ____ Cape Cod Towns _____
Islands ____ South Coast _____
3. Is shellfish farming your primary or a secondary source of income? Primary ____ Secondary _____
4. How many employees did you have in 2013 (including yourself)?
Full-Time, All Year: ______ Part-Time, All Year: ______
Full-Time, Seasonal: ______ Part-Time, Seasonal: ______
5. What is the age of the leaseholder?
24 and under ____ 25-39 ____ 40-54 ____ 55-64 ____ 65 and Over ___
UMASS report prepared for Cape Cod Cooperative Extension, Woods Hole Sea Grant & SEMAC Page 6
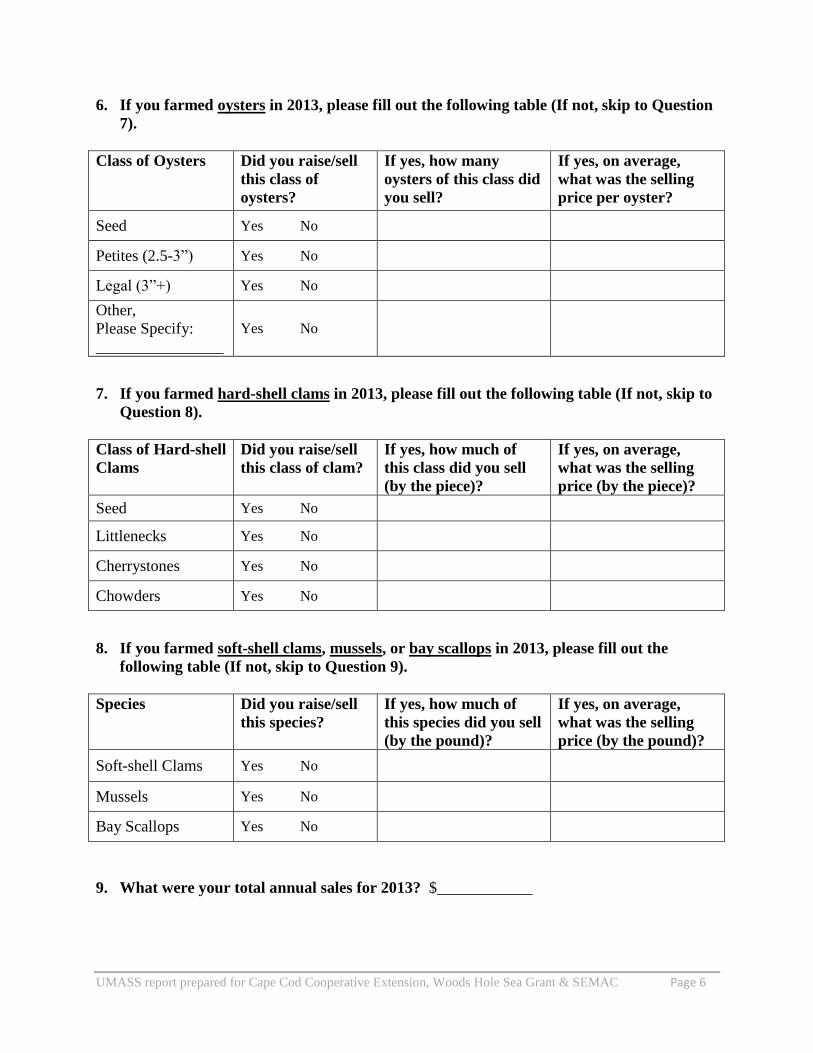
6. If you farmed oysters in 2013, please fill out the following table (If not, skip to Question
7).
Class of Oysters Did you raise/sell
this class of
oysters?
If yes, how many
oysters of this class did
you sell?
If yes, on average,
what was the selling
price per oyster?
Seed Yes No
Petites (2.5-3”) Yes No
Legal (3”+) Yes No
Other,
Please Specify:
________________
Yes No
7. If you farmed hard-shell clams in 2013, please fill out the following table (If not, skip to
Question 8).
Class of Hard-shell
Clams
Did you raise/sell
this class of clam?
If yes, how much of
this class did you sell
(by the piece)?
If yes, on average,
what was the selling
price (by the piece)?
Seed Yes No
Littlenecks Yes No
Cherrystones Yes No
Chowders Yes No
8. If you farmed soft-shell clams, mussels, or bay scallops in 2013, please fill out the
following table (If not, skip to Question 9).
Species Did you raise/sell
this species?
If yes, how much of
this species did you sell
(by the pound)?
If yes, on average,
what was the selling
price (by the pound)?
Soft-shell Clams Yes No
Mussels Yes No
Bay Scallops Yes No
9. What were your total annual sales for 2013? $____________

UMASS report prepared for Cape Cod Cooperative Extension, Woods Hole Sea Grant & SEMAC Page 7
10. Which of the following do you sell your shellfish to?
Check all that Apply
Small, local wholesalers/retailers ____
Larger, statewide/interstate wholesalers ____
Myself, as a wholesale and/or retail dealer ____ If so, percent sold in-state: _____%
11. Approximately, how much did you spend on each of the following in 2013?
Seed: $_________
Gear/Equipment: $_________
Employee Compensation (Including Benefits): $_________
Payments to Self (Personal Salary): $_________
Lease: $_________
Permit/Licenses: $_________
Boat Expenses: $_________
Truck/Transport Expense: $_________
Insurance: $_________
Other: $________

UMASS report prepared for Cape Cod Cooperative Extension, Woods Hole Sea Grant & SEMAC Page 8
Significance Test
Test Statistics
Which region
were these
growing areas
located within?
(North Shore
Towns)
Which region
were these
growing areas
located within?
(South Shore
Towns)
Which region
were these
growing areas
located within?
(Cape Cod
Towns)
Which region
were these
growing areas
located within?
(Islands)
Which region
were these
growing areas
located within?
(South Coast)
Chi-Square 110.136a 48.949
a 9.797
a 74.881
a 91.661
a
df 1 1 1 1 1
Asymp. Sig. .000 .000 .002 .000 .000
A Chi-Square test was performed on this data. The data in this study test significant at .000,
which indicates the findings are statistically valid.
UMASS report prepared for Cape Cod Cooperative Extension, Woods Hole Sea Grant & SEMAC Page 9
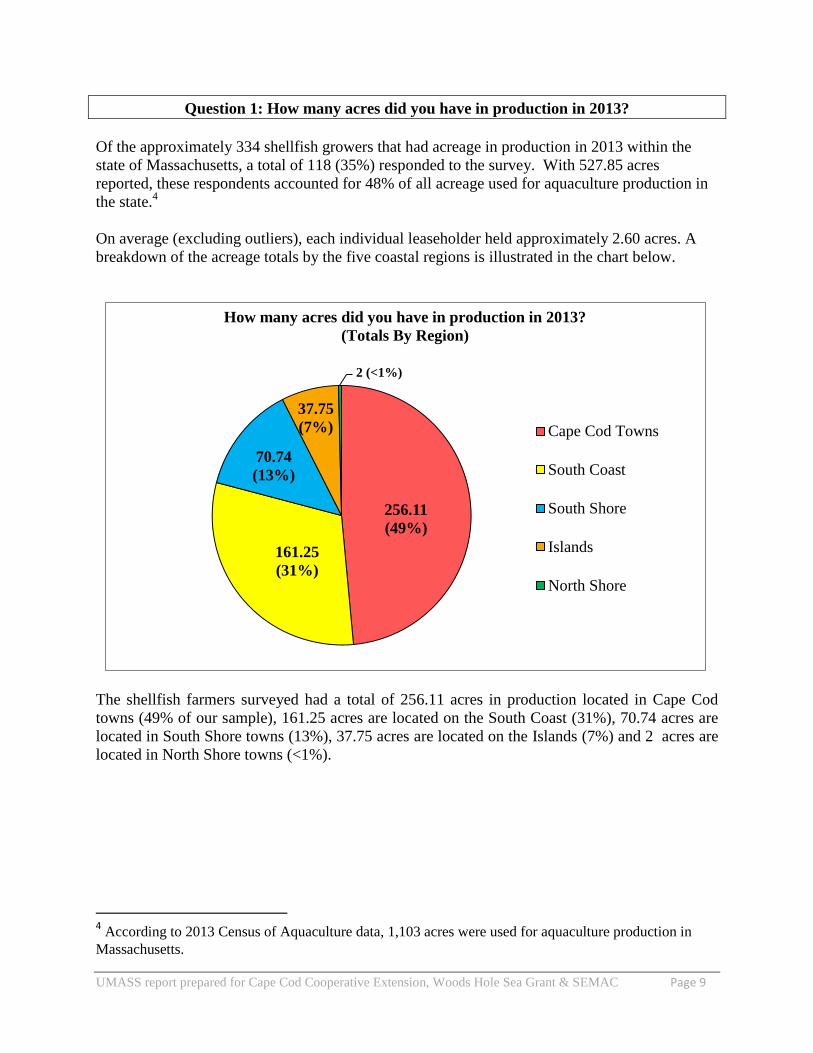
Question 1: How many acres did you have in production in 2013?
Of the approximately 334 shellfish growers that had acreage in production in 2013 within the
state of Massachusetts, a total of 118 (35%) responded to the survey. With 527.85 acres
reported, these respondents accounted for 48% of all acreage used for aquaculture production in
the state.4
On average (excluding outliers), each individual leaseholder held approximately 2.60 acres. A
breakdown of the acreage totals by the five coastal regions is illustrated in the chart below.
The shellfish farmers surveyed had a total of 256.11 acres in production located in Cape Cod
towns (49% of our sample), 161.25 acres are located on the South Coast (31%), 70.74 acres are
located in South Shore towns (13%), 37.75 acres are located on the Islands (7%) and 2 acres are
located in North Shore towns (<1%).
4 According to 2013 Census of Aquaculture data, 1,103 acres were used for aquaculture production in
Massachusetts.
256.11
(49%)
161.25
(31%)
70.74
(13%)
37.75
(7%)
Cape Cod Towns
South Coast
South Shore
Islands
North Shore
How many acres did you have in production in 2013?
(Totals By Region)
2 (<1%)

UMASS report prepared for Cape Cod Cooperative Extension, Woods Hole Sea Grant & SEMAC Page 10
Question 2: Which region(s) were these growing areas located within?
Which region(s) were these growing areas located within?
Frequency Percent Valid Percent Cumulative
Percent
Valid
North Shore Towns 2 1.7 1.7 1.7
South Shore Towns 21 17.8 17.8 19.5
Cape Cod Towns 76 64.4 64.4 83.9
Islands 12 10.2 10.2 94.1
South Coast 7 5.9 5.9 100.0
Total 118 100.0 100.0
Two percent of respondents had growing areas located in North Shore towns, 18% in South
Shore towns, 64% in Cape Cod towns, 10% on the Islands and 6% on the South Coast.
0%
10%
20%
30%
40%
50%
60%
70%
80%
90%
100%
North Shore
Towns
South Shore
Towns
Cape Cod
Towns
Islands South Coast
2%
18%
64%
10%
6%
Which region(s) were these growing areas located within?

UMASS report prepared for Cape Cod Cooperative Extension, Woods Hole Sea Grant & SEMAC Page 11
Question 3: Is shellfish farming your primary or secondary source of income?
Is shellfish farming your primary or secondary source of income?
Frequency Percent Valid Percent Cumulative
Percent
Valid
Primary 56 47.5 47.5 47.5
Secondary 62 52.5 52.5 100.0
Total 118 100.0 100.0
Shellfish farming is the primary source of income for 48% of respondents and the
secondary source for 53%.
0%
10%
20%
30%
40%
50%
60%
70%
80%
90%
100%
Primary Secondary
48%
53%
Is shellfish farming your primary or secondary
source of income?

UMASS report prepared for Cape Cod Cooperative Extension, Woods Hole Sea Grant & SEMAC Page 12
Question 4: How many employees did you have in 2013 (including yourself)?
The surveyed leaseholders reported 423 jobs in 2013. Of those employed, 169 worked full-time
throughout the year (40% of all reported jobs), 121 worked part-time on a seasonal basis (29%),
74 worked part-time throughout the year (17%) and 59 worked full-time on a seasonal basis
(14%).
Employment Totals by Region
North & South Shore Towns: Within these two regions, respondents employed 121 individuals.
Of those employees, 48 worked full-time throughout the year, 24 worked part-time throughout
the year, 10 worked full-time on a seasonal basis and 39 worked part-time on a seasonal basis.
Cape Cod Towns: Respondents with acreage in production in Cape Cod towns had 220
employees in 2013. Of those, 103 worked full-time throughout the year, 34 worked part-time
throughout the year, 36 worked full-time on a seasonal basis and 47 worked part-time on a
seasonal basis.
Islands: Leaseholders with acreage on the Islands employed 37 individuals. Of those employees,
8 worked full-time throughout the year, 9 worked part-time throughout the year, 5 worked full-
time on a seasonal basis and 15 worked part-time on a seasonal basis.
South Coast: Respondents within the South Coast region had a total of 45 employees. Of those,
10 worked full-time throughout the year, 7 worked part-time throughout the year, 8 worked full-
time on a seasonal basis and 20 worked part-time on a seasonal basis.
169
(40%)
121
(29%)
74
(17%)
59
(14%) Full-Time, All Year
Part-Time, Seasonal
Part-Time, All Year
Full-Time, Seasonal
How many employees did you have in 2013 (including yourself)?
(Totals by Employment Type)
UMASS report prepared for Cape Cod Cooperative Extension, Woods Hole Sea Grant & SEMAC Page 13
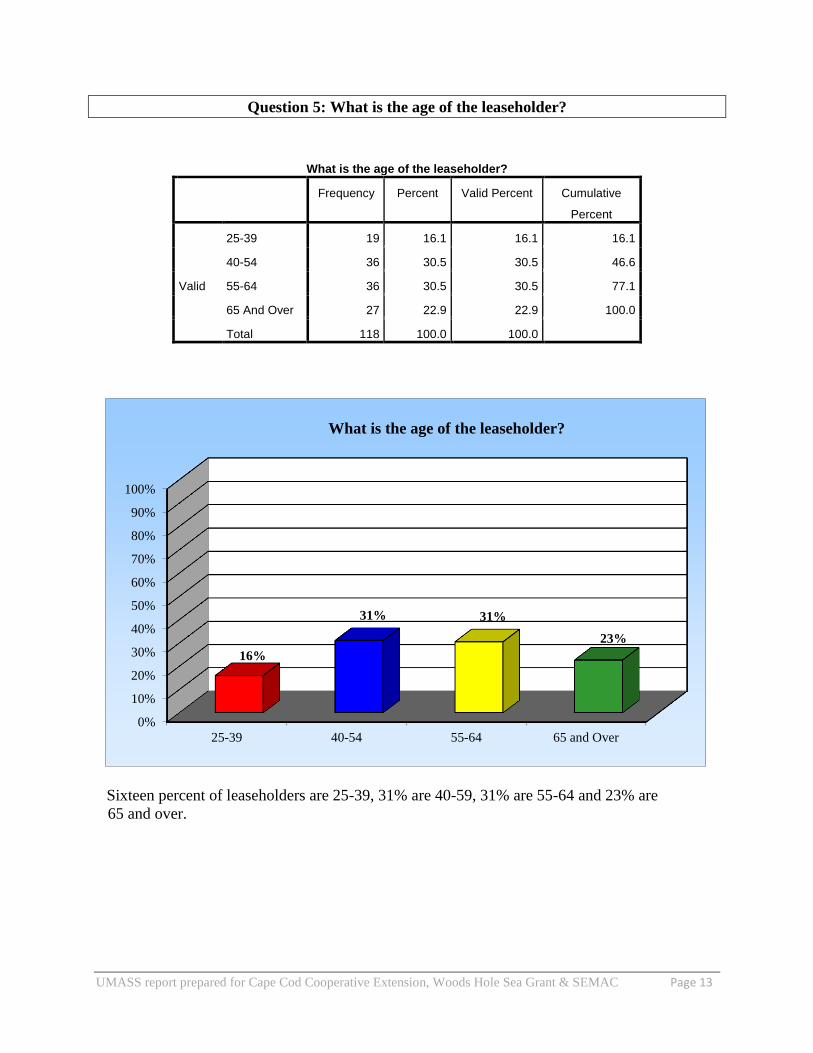
Question 5: What is the age of the leaseholder?
What is the age of the leaseholder?
Frequency Percent Valid Percent Cumulative
Percent
Valid
25-39 19 16.1 16.1 16.1
40-54 36 30.5 30.5 46.6
55-64 36 30.5 30.5 77.1
65 And Over 27 22.9 22.9 100.0
Total 118 100.0 100.0
Sixteen percent of leaseholders are 25-39, 31% are 40-59, 31% are 55-64 and 23% are 65 and over.
0%
10%
20%
30%
40%
50%
60%
70%
80%
90%
100%
25-39 40-54 55-64 65 and Over
16%
31% 31%
23%
What is the age of the leaseholder?

UMASS report prepared for Cape Cod Cooperative Extension, Woods Hole Sea Grant & SEMAC Page 14
Questions 6-8: Which species of shellfish did you farm in 2013?
(Check all that Apply)
Did you farm oysters in 2013?
Frequency Percent Valid Percent Cumulative
Percent
Valid
Yes 113 95.8 95.8 95.8
No 5 4.2 4.2 100.0
Total 118 100.0 100.0
Did you farm hard-shell clams in 2013?
Frequency Percent Valid Percent Cumulative
Percent
Valid
Yes 21 17.8 17.8 17.8
No 97 82.2 82.2 100.0
Total 118 100.0 100.0
Did you farm soft-shell clams in 2013?
Frequency Percent Valid Percent Cumulative
Percent
Valid
Yes 7 5.9 5.9 5.9
No 111 94.1 94.1 100.0
Total 118 100.0 100.0
Did you farm bay scallops in 2013?
Frequency Percent Valid Percent Cumulative
Percent
Valid
Yes 1 .8 .8 .8
No 117 99.2 99.2 100.0
Total 118 100.0 100.0
Did you farm mussels in 2013?
Frequency Percent Valid Percent Cumulative
Percent
Valid No 118 100.0 100.0 100.0

UMASS report prepared for Cape Cod Cooperative Extension, Woods Hole Sea Grant & SEMAC Page 15
Questions 6-8: Which species of shellfish did you farm in 2013?
(Continued)
Ninety-six percent of respondents farmed oysters in 2013, 18% farmed hard-shell clams,
6% farmed soft-shell clams, 1% farmed bay scallops and no one farmed mussels.
0%
10%
20%
30%
40%
50%
60%
70%
80%
90%
100%
Oysters Hard-Shell
Clams
Soft-Shell
Clams
Bay Scallops Mussels
96%
18%
6% 1% 0%
Which species of shellfish did you farm in 2013?
(% Yes)
UMASS report prepared for Cape Cod Cooperative Extension, Woods Hole Sea Grant & SEMAC Page 16
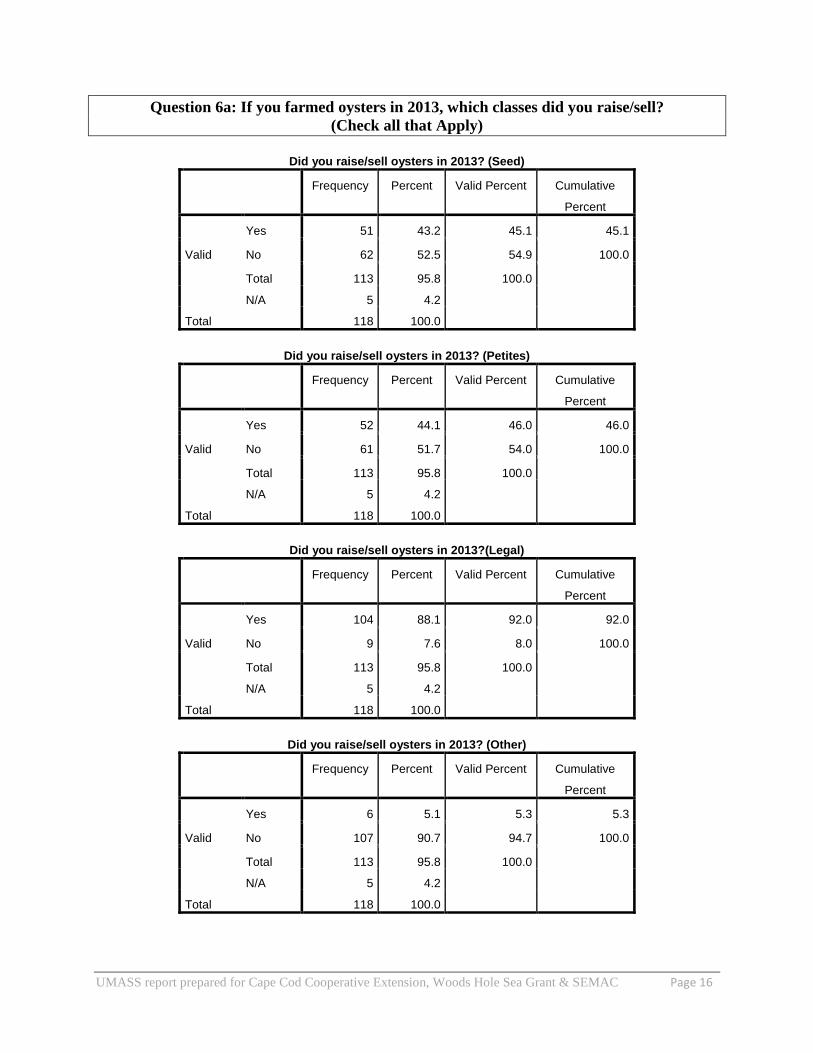
Question 6a: If you farmed oysters in 2013, which classes did you raise/sell?
(Check all that Apply)
Did you raise/sell oysters in 2013? (Seed)
Frequency Percent Valid Percent Cumulative
Percent
Valid
Yes 51 43.2 45.1 45.1
No 62 52.5 54.9 100.0
Total 113 95.8 100.0
N/A 5 4.2
Total 118 100.0
Did you raise/sell oysters in 2013? (Petites)
Frequency Percent Valid Percent Cumulative
Percent
Valid
Yes 52 44.1 46.0 46.0
No 61 51.7 54.0 100.0
Total 113 95.8 100.0
N/A 5 4.2
Total 118 100.0
Did you raise/sell oysters in 2013?(Legal)
Frequency Percent Valid Percent Cumulative
Percent
Valid
Yes 104 88.1 92.0 92.0
No 9 7.6 8.0 100.0
Total 113 95.8 100.0
N/A 5 4.2
Total 118 100.0
Did you raise/sell oysters in 2013? (Other)
Frequency Percent Valid Percent Cumulative
Percent
Valid
Yes 6 5.1 5.3 5.3
No 107 90.7 94.7 100.0
Total 113 95.8 100.0
N/A 5 4.2
Total 118 100.0

UMASS report prepared for Cape Cod Cooperative Extension, Woods Hole Sea Grant & SEMAC Page 17
Question 6a: If you farmed oysters in 2013, which classes did you raise/sell?
(Continued)
Forty-five percent of respondents who farmed oysters in 2013 raised seed, 46% raised
petites, 92% raised legal and 5% raised some other class of oysters.
* Those who selected “Other” classes specified large/jumbo, misshapen and XL (4”+).
0%
10%
20%
30%
40%
50%
60%
70%
80%
90%
100%
Seed Petites (2.5-3") Legal (3"+) Other
45% 46%
92%
5%
If you farmed oysters in 2013, which classes did you raise/sell?
(% Yes)

UMASS report prepared for Cape Cod Cooperative Extension, Woods Hole Sea Grant & SEMAC Page 18
Question 6b-c: If you farmed oysters in 2013, how many of each class did you sell and what
was the selling price per oyster?
Of the 19,135,928 oysters sold by respondents, 58% were farmed in Cape Cod towns, 26% were
farmed on the South Coast, 11% were farmed in South Shore towns, 5% were farmed on the
Islands and none were farmed in North Shore towns.
Total Number of Oysters Sold (By Class)
Class of Oysters Number of Oysters Sold
Petites 3,855,783
Legal 15,175,345
Other (Large/Jumbo/XL) 90,000
Other (Misshapen) 14,800
Total 19,135,928
*Since the majority of respondents who raised oyster seed did not sell any, we have excluded this class from the
proceeding sales data.
The value of oysters sold by the 92 respondents that provided both sales volumes and average
selling prices for each class offered is approximately $10.53m.
Average Selling Price of Oysters Sold (By Class)
Class of Oysters Average Selling Price (By the Piece)
Petites $0.52
Legal $0.60
Other $0.51
Cape Cod
Towns
58%
South Shore
Towns
11%
Islands
5%
South Coast
26%
2013 Massachusetts Oyster Sales/Production by Region

UMASS report prepared for Cape Cod Cooperative Extension, Woods Hole Sea Grant & SEMAC Page 19
Question 7a: If you farmed hard-shell clams in 2013, which classes did you raise/sell?
(Check all that Apply)
Did you raise/sell hard-shell clams in 2013? (Seed)
Frequency Percent Valid Percent Cumulative
Percent
Valid
Yes 9 7.6 42.9 42.9
No 12 10.2 57.1 100.0
Total 21 17.8 100.0
N/A 97 82.2
Total 118 100.0
Did you raise/sell hard-shell clams in 2013? (Littlenecks)
Frequency Percent Valid Percent Cumulative
Percent
Valid
Yes 18 15.3 85.7 85.7
No 3 2.5 14.3 100.0
Total 21 17.8 100.0
N/A 97 82.2
Total 118 100.0
Did you raise/sell hard-shell clams in 2013? (Cherrystones)
Frequency Percent Valid Percent Cumulative
Percent
Valid
Yes 4 3.4 19.0 19.0
No 17 14.4 81.0 100.0
Total 21 17.8 100.0
N/A 97 82.2
Total 118 100.0
Did you raise/sell hard-shell clams in 2013? (Chowders)
Frequency Percent Valid Percent Cumulative
Percent
Valid
Yes 1 .8 4.8 4.8
No 20 16.9 95.2 100.0
Total 21 17.8 100.0
N/A 97 82.2
Total 118 100.0

UMASS report prepared for Cape Cod Cooperative Extension, Woods Hole Sea Grant & SEMAC Page 20
Question 7a: If you farmed hard-shell clams in 2013, which classes did you raise/sell?
(Continued)
Forty-three percent of respondents who farmed hard-shell clams in 2013 raised seed,
86% raised littlenecks, 19% raised cherrystones and 5% raised chowders.
0%
10%
20%
30%
40%
50%
60%
70%
80%
90%
100%
Seed Littlenecks Cherrystones Chowders
43%
86%
19%
5%
If you farmed hard-shell clams in 2013, which classes did
you raise/sell?
(% Yes)
UMASS report prepared for Cape Cod Cooperative Extension, Woods Hole Sea Grant & SEMAC Page 21
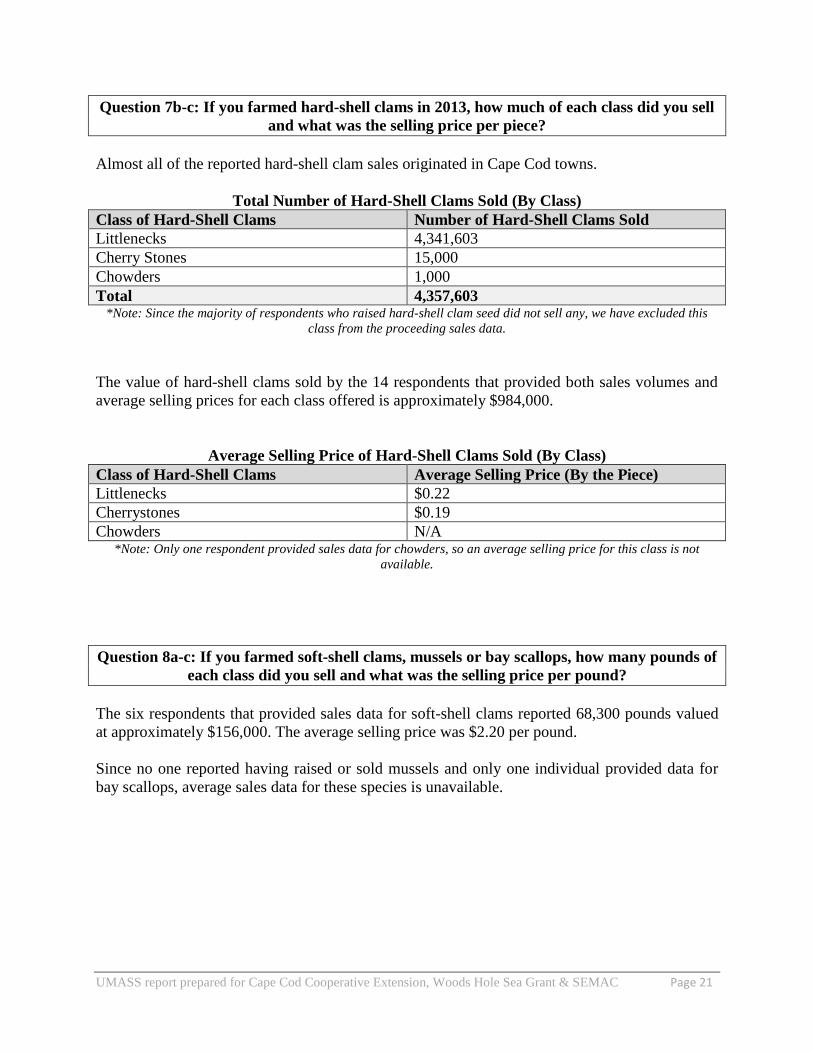
Question 7b-c: If you farmed hard-shell clams in 2013, how much of each class did you sell
and what was the selling price per piece?
Almost all of the reported hard-shell clam sales originated in Cape Cod towns.
Total Number of Hard-Shell Clams Sold (By Class)
Class of Hard-Shell Clams Number of Hard-Shell Clams Sold
Littlenecks 4,341,603
Cherry Stones 15,000
Chowders 1,000
Total 4,357,603 *Note: Since the majority of respondents who raised hard-shell clam seed did not sell any, we have excluded this
class from the proceeding sales data.
The value of hard-shell clams sold by the 14 respondents that provided both sales volumes and
average selling prices for each class offered is approximately $984,000.
Average Selling Price of Hard-Shell Clams Sold (By Class)
Class of Hard-Shell Clams Average Selling Price (By the Piece)
Littlenecks $0.22
Cherrystones $0.19
Chowders N/A *Note: Only one respondent provided sales data for chowders, so an average selling price for this class is not
available.
Question 8a-c: If you farmed soft-shell clams, mussels or bay scallops, how many pounds of
each class did you sell and what was the selling price per pound?
The six respondents that provided sales data for soft-shell clams reported 68,300 pounds valued
at approximately $156,000. The average selling price was $2.20 per pound.
Since no one reported having raised or sold mussels and only one individual provided data for
bay scallops, average sales data for these species is unavailable.
UMASS report prepared for Cape Cod Cooperative Extension, Woods Hole Sea Grant & SEMAC Page 22
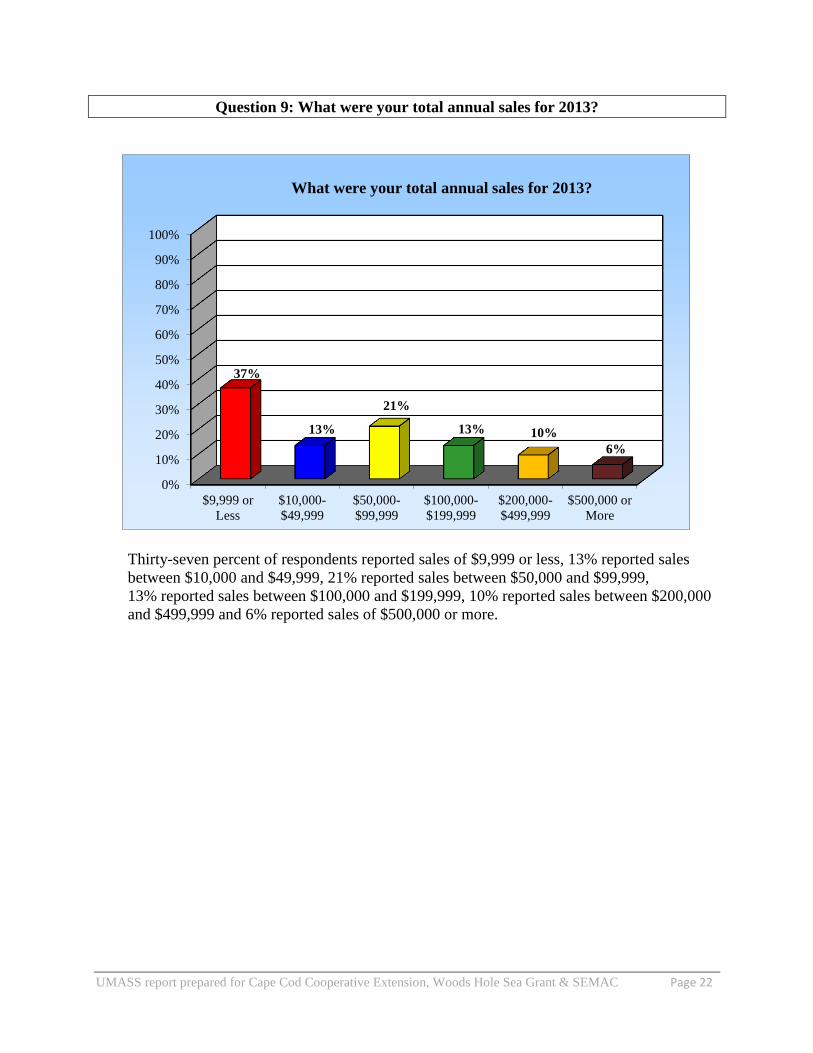
Question 9: What were your total annual sales for 2013?
Thirty-seven percent of respondents reported sales of $9,999 or less, 13% reported sales
between $10,000 and $49,999, 21% reported sales between $50,000 and $99,999,
13% reported sales between $100,000 and $199,999, 10% reported sales between $200,000
and $499,999 and 6% reported sales of $500,000 or more.
0%
10%
20%
30%
40%
50%
60%
70%
80%
90%
100%
$9,999 or
Less
$10,000-
$49,999
$50,000-
$99,999
$100,000-
$199,999
$200,000-
$499,999
$500,000 or
More
37%
13%
21%
13% 10%
6%
What were your total annual sales for 2013?

UMASS report prepared for Cape Cod Cooperative Extension, Woods Hole Sea Grant & SEMAC Page 23
Question 10: Which of the following do you sell your shellfish to?
(Check all that Apply)
Which of the following do you sell your shellfish to?
(Small, local wholesales/retailers)
Frequency Percent Valid Percent Cumulative
Percent
Valid
Yes 69 58.5 58.5 58.5
No 45 38.1 38.1 96.6
No Response 4 3.4 3.4 100.0
Total 118 100.0 100.0
Which of the following do you sell your shellfish to?
(Larger, statewide/interstate wholesalers)
Frequency Percent Valid Percent Cumulative
Percent
Valid
Yes 57 48.3 48.3 48.3
No 57 48.3 48.3 96.6
No Response 4 3.4 3.4 100.0
Total 118 100.0 100.0
Which of the following do you sell your shellfish to?
(Myself, as a wholesale and/or retail dealer)
Frequency Percent Valid Percent Cumulative
Percent
Valid
Yes 21 17.8 17.8 17.8
No 93 78.8 78.8 96.6
No Response 4 3.4 3.4 100.0
Total 118 100.0 100.0

UMASS report prepared for Cape Cod Cooperative Extension, Woods Hole Sea Grant & SEMAC Page 24
Question 10: Which of the following do you sell your shellfish to?
(Continued)
Fifty-nine percent of respondents sell their shellfish to small, local wholesalers/retailers,
48% sell their shellfish to larger, statewide/interstate wholesalers and 18% sell their shellfish
themselves as wholesale/retail dealers.
* Of those who act as wholesale/retail dealer 62% sold their shellfish within the state of
Massachusetts in 2013.
0%
10%
20%
30%
40%
50%
60%
70%
80%
90%
100%
Small, local
wholesalers/retailers
Larger, statewide/
interstate wholesalers
Myself, as a
wholesale/retail dealer
59%
48%
18%
Which of the following do you sell your shellfish to?
(% Yes)
UMASS report prepared for Cape Cod Cooperative Extension, Woods Hole Sea Grant & SEMAC Page 25
Question 11: Approximately, how much did you spend on each of the following in 2013?
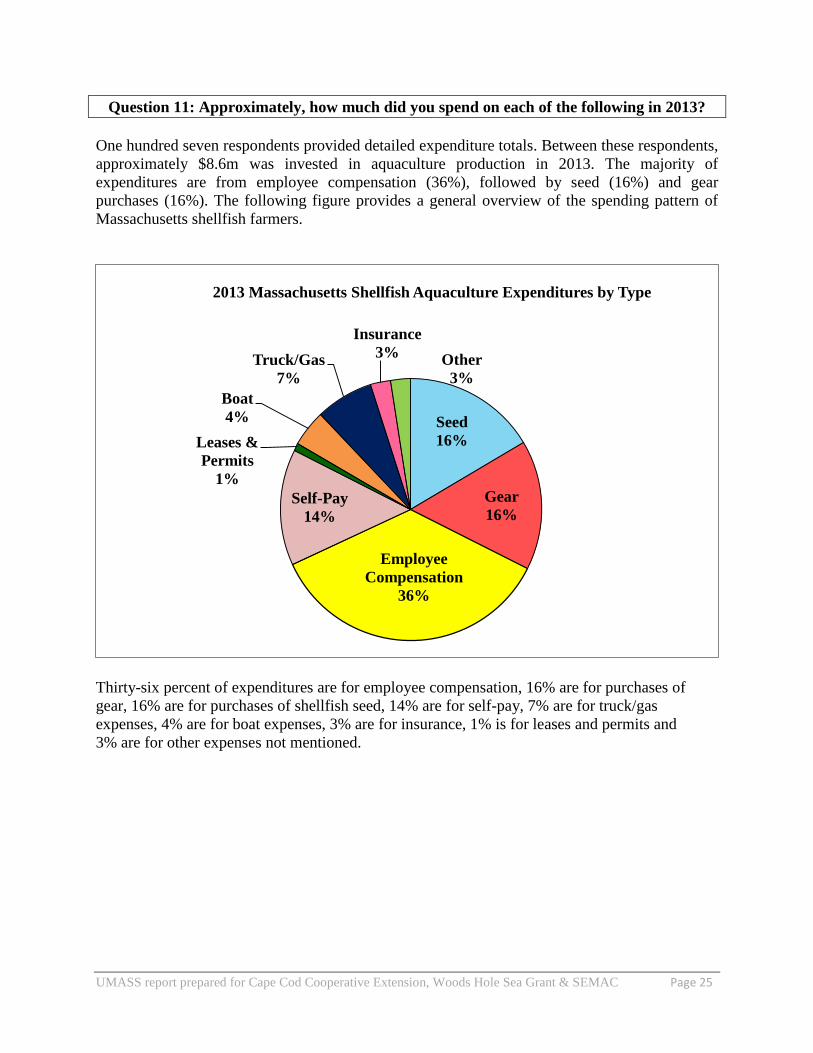
One hundred seven respondents provided detailed expenditure totals. Between these respondents,
approximately $8.6m was invested in aquaculture production in 2013. The majority of
expenditures are from employee compensation (36%), followed by seed (16%) and gear
purchases (16%). The following figure provides a general overview of the spending pattern of
Massachusetts shellfish farmers.
Thirty-six percent of expenditures are for employee compensation, 16% are for purchases of
gear, 16% are for purchases of shellfish seed, 14% are for self-pay, 7% are for truck/gas
expenses, 4% are for boat expenses, 3% are for insurance, 1% is for leases and permits and
3% are for other expenses not mentioned.
Seed
16%
Gear
16%
Employee
Compensation
36%
Self-Pay
14%
Leases &
Permits
1%
Boat
4%
Truck/Gas
7%
Insurance
3% Other
3%
2013 Massachusetts Shellfish Aquaculture Expenditures by Type
UMASS report prepared for Cape Cod Cooperative Extension, Woods Hole Sea Grant & SEMAC Page 26
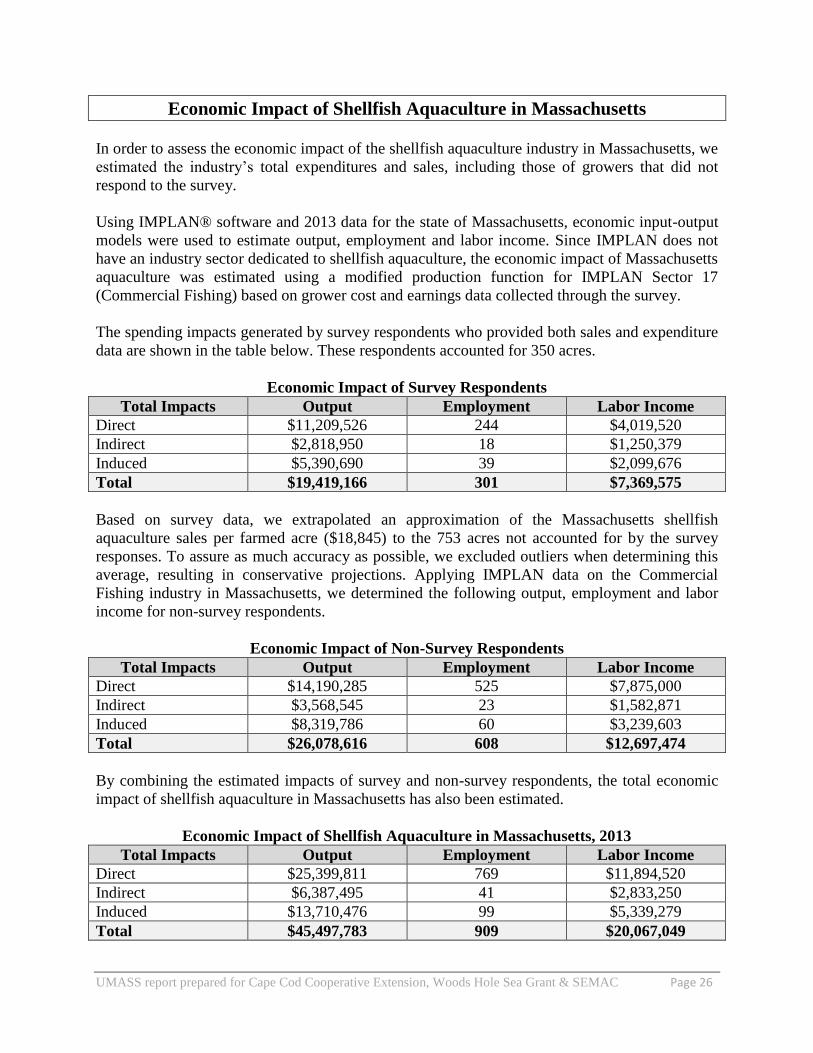
Economic Impact of Shellfish Aquaculture in Massachusetts
In order to assess the economic impact of the shellfish aquaculture industry in Massachusetts, we
estimated the industry’s total expenditures and sales, including those of growers that did not
respond to the survey.
Using IMPLAN® software and 2013 data for the state of Massachusetts, economic input-output
models were used to estimate output, employment and labor income. Since IMPLAN does not
have an industry sector dedicated to shellfish aquaculture, the economic impact of Massachusetts
aquaculture was estimated using a modified production function for IMPLAN Sector 17
(Commercial Fishing) based on grower cost and earnings data collected through the survey.
The spending impacts generated by survey respondents who provided both sales and expenditure
data are shown in the table below. These respondents accounted for 350 acres.
Economic Impact of Survey Respondents
Total Impacts Output Employment Labor Income
Direct $11,209,526 244 $4,019,520
Indirect $2,818,950 18 $1,250,379
Induced $5,390,690 39 $2,099,676
Total $19,419,166 301 $7,369,575
Based on survey data, we extrapolated an approximation of the Massachusetts shellfish
aquaculture sales per farmed acre ($18,845) to the 753 acres not accounted for by the survey
responses. To assure as much accuracy as possible, we excluded outliers when determining this
average, resulting in conservative projections. Applying IMPLAN data on the Commercial
Fishing industry in Massachusetts, we determined the following output, employment and labor
income for non-survey respondents.
Economic Impact of Non-Survey Respondents
Total Impacts Output Employment Labor Income
Direct $14,190,285 525 $7,875,000
Indirect $3,568,545 23 $1,582,871
Induced $8,319,786 60 $3,239,603
Total $26,078,616 608 $12,697,474
By combining the estimated impacts of survey and non-survey respondents, the total economic
impact of shellfish aquaculture in Massachusetts has also been estimated.
Economic Impact of Shellfish Aquaculture in Massachusetts, 2013
Total Impacts Output Employment Labor Income
Direct $25,399,811 769 $11,894,520
Indirect $6,387,495 41 $2,833,250
Induced $13,710,476 99 $5,339,279
Total $45,497,783 909 $20,067,049

UMASS report prepared for Cape Cod Cooperative Extension, Woods Hole Sea Grant & SEMAC Page 27
The economic multipliers generated through industry activity are summarized in the table below.
Output
(Per $)
Employment
(Per $ Million)
Labor Income
(Per $)
Multiplier
(From IMPLAN®) 1.79 35.78 0.93
For every dollar of output generated by the industry, an estimated total of $1.79 worth of
economic activity is generated in Massachusetts, every $1 spent by the industry generated $0.93
in wages in Massachusetts and approximately 36 jobs are generated for every $1m worth of
spending by the industry.
Summary of Findings
Based on this data, we estimate that the output of the shellfish aquaculture industry in
Massachusetts was valued at approximately $25.4m in 2013, which in turn generated
approximately $45.5m in the Massachusetts economy, or 1.79 times the activity.
Shellfish farmers were responsible for approximately 769 direct jobs in 2013. They also
generated an additional 140 jobs through indirect and induced activity, resulting in a total of 909
jobs in Massachusetts.
Shellfish farmers paid approximately $11.9m in wages in 2013. Their economic activity
generated additional labor income of $8.2m, for a total of approximately $20.1m in labor income
in Massachusetts.

UMASS report prepared for Cape Cod Cooperative Extension, Woods Hole Sea Grant & SEMAC Page 28
Conclusion
The purpose of this study was to investigate and quantify the economic impact that the shellfish
farming industry had in Massachusetts in 2013. The following conclusions, key takeaways and
recommendations are based on data collected from the survey with focus on specific variables.
1. Estimation of the economic impact of the shellfish aquaculture industry in
Massachusetts in 2013:
The output of the shellfish aquaculture industry in Massachusetts was valued at
approximately $25.4m in 2013, which in turn generated approximately $45.5m in
the Massachusetts economy, or 1.79 times the activity.
Shellfish farmers were responsible for approximately 909 jobs in Massachusetts.
Shellfish farmers paid approximately $11.9m in employee compensation in 2013.
Their economic activity generated additional labor income of $8.2m, for a total of
approximately $20.1m in labor income in Massachusetts.
2. Highlights of leaseholder and farm demographics:
Sixteen percent of the leaseholders surveyed are 25-39, 31% are 40-59, 31% are
55-64 and 23% are 65 and over.
In 2013, these leaseholders held a total of 256.11 acres in production located in
Cape Cod towns, 161.25 acres located on the South Coast, 70.74 acres located in
South Shore towns, 37.75 acres located on the Islands and 2 acres located in
North Shore towns.
Shellfish farming is the primary source of income for 48% of respondents and the
secondary source for 53%.
3. Insight on shellfish sales driven in-state versus out-of-state by farmers in MA:
Approximately fifty-nine percent of respondents sell to small, local
wholesalers/retailers; thus keeping their revenues and economic impact confined
to their local, more immediate, area.
About forty-eight percent of respondents sell to larger, statewide/interstate
wholesalers. These growers’ products are sold throughout Massachusetts and
across state and national lines. Out-of-state impacts are not taken into
consideration in this report.
Eighteen percent of respondents sell their harvests themselves as a
wholesale/retail dealer.
UMASS report prepared for Cape Cod Cooperative Extension, Woods Hole Sea Grant & SEMAC Page 29
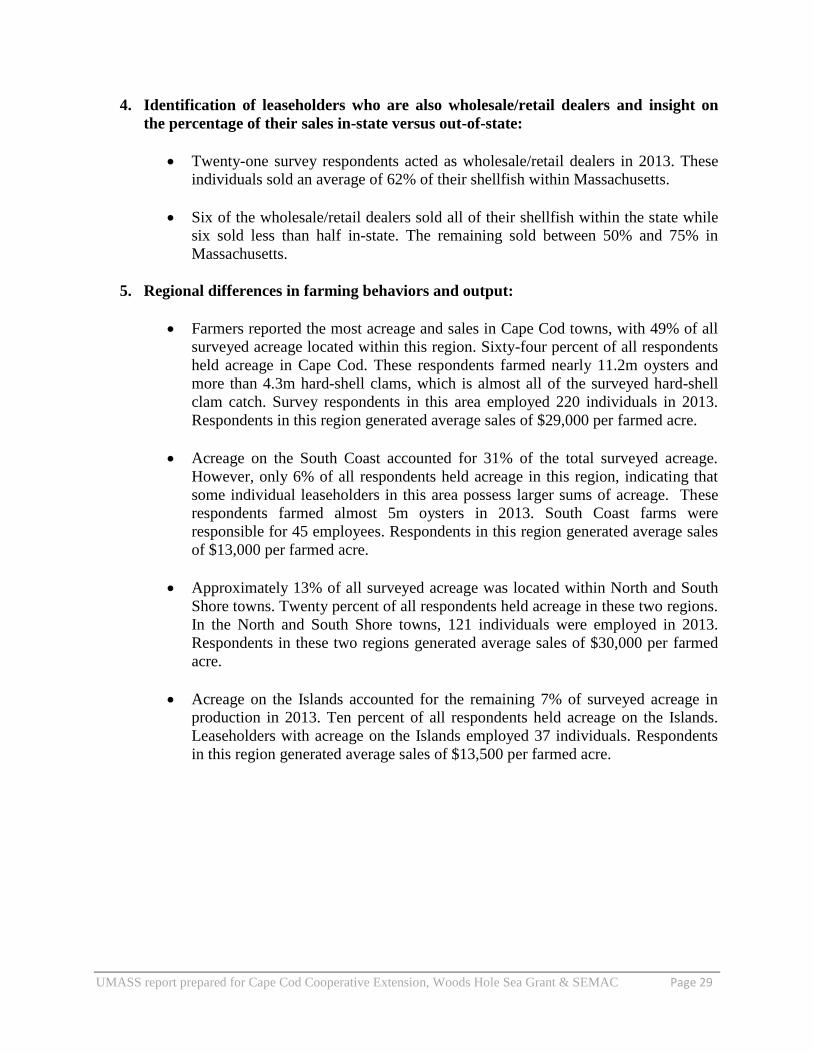
4. Identification of leaseholders who are also wholesale/retail dealers and insight on
the percentage of their sales in-state versus out-of-state:
Twenty-one survey respondents acted as wholesale/retail dealers in 2013. These
individuals sold an average of 62% of their shellfish within Massachusetts.
Six of the wholesale/retail dealers sold all of their shellfish within the state while
six sold less than half in-state. The remaining sold between 50% and 75% in
Massachusetts.
5. Regional differences in farming behaviors and output:
Farmers reported the most acreage and sales in Cape Cod towns, with 49% of all
surveyed acreage located within this region. Sixty-four percent of all respondents
held acreage in Cape Cod. These respondents farmed nearly 11.2m oysters and
more than 4.3m hard-shell clams, which is almost all of the surveyed hard-shell
clam catch. Survey respondents in this area employed 220 individuals in 2013.
Respondents in this region generated average sales of $29,000 per farmed acre.
Acreage on the South Coast accounted for 31% of the total surveyed acreage.
However, only 6% of all respondents held acreage in this region, indicating that
some individual leaseholders in this area possess larger sums of acreage. These
respondents farmed almost 5m oysters in 2013. South Coast farms were
responsible for 45 employees. Respondents in this region generated average sales
of $13,000 per farmed acre.
Approximately 13% of all surveyed acreage was located within North and South
Shore towns. Twenty percent of all respondents held acreage in these two regions.
In the North and South Shore towns, 121 individuals were employed in 2013.
Respondents in these two regions generated average sales of $30,000 per farmed
acre.
Acreage on the Islands accounted for the remaining 7% of surveyed acreage in
production in 2013. Ten percent of all respondents held acreage on the Islands.
Leaseholders with acreage on the Islands employed 37 individuals. Respondents
in this region generated average sales of $13,500 per farmed acre.
UMASS report prepared for Cape Cod Cooperative Extension, Woods Hole Sea Grant & SEMAC Page 30
Recommendations
Oysters are by far the most popular shellfish farmed in Massachusetts, with 96% of surveyed
farmers growing this species. Hard-shell clams were grown by 18%, soft-shell clams by 6% and
bay scallops by 1%. No one grew mussels. To help to ensure continued industry profitability,
which in turn causes a substantial impact on the local economy, SEMAC should focus its
resources on guaranteeing successful oyster harvest. Any possible slowing of or collapse of the
species due to disease or disaster would not only effect the farmers but those buyers downstream,
most notably their wholesalers and area retailers and restaurants.
SEMAC may also want to consider advocating for increasing the production of the other species,
while simultaneously developing and nurturing a local market and working with other state and
national organizations to do so nationwide and internationally.
As growers who sell within Massachusetts have a larger impact to the state’s economy and those
who sell locally have an even more substantial one on their immediate surroundings, we
recommend that SEMAC encourages growers to partner more with local wholesalers/retailers
and businesses. SEMAC may even consider creating a program that connects growers to local
wholesalers/retailers and encourages their business partnerships.