MASIMBA ANNUAL REPORT 2019 COVERS FINAL
76
ANNUAL REPORT INTEGRATED 2019 RESILIENT GROWTH
Transcript of MASIMBA ANNUAL REPORT 2019 COVERS FINAL

ANNUAL REPORTINTEGRATED
2019RESILIENT GROWTH

1Integrated Annual Report 2019
Masimba Holdings Limited
Group Overview 2
Corporate and Leadership 5
Governance 9
Financial Reporting 22
Administration 69
Group Profile and Nature of Business 2
Group Structure 3
Consolidated Financial Highlights 4
Chairman’s Statement 5
Strategic Foundations 7
Directorate 8
Corporate Governance 9
Record of Attendance 11
Five-Year Review 12
Ratios and Statistics 13
Sustainability Report 14
Directors’ Report 22
Independent Auditors’ Report 24
Consolidated Statement of Financial Position 27
Consolidated Statement of Profit or Loss and Other Comprehensive Income 28
Consolidated Statement of Changes in Equity 29
Consolidated Statement of Cashflows 30
Company Statement of Financial Position 31
Company Statement of Profit or Loss and Other Comprehensive Income 32
Company Statement of Changes in Equity 33
Company Statement of Cashflows 34
Accounting Policies 35
Notes to the Consolidated Financial Statements 50
Shareholders Analysis 69
Notice to Shareholders 70
Shareholders Diary 71
Proxy Form 72
Instructions for Signing and Lodging this Form of Proxy 73
Contents

2 Integrated Annual Report 2019
Masimba Holdings Limited
Masimba Holdings Limited is a well-established Zimbabwean contracting and industrial group, providing innovative engineering and infrastructure client solutions to the agriculture, commercial, communications, housing, mining, water and transport sectors.
More information is available on our website, www.masimbagroup.com.
Group Profile and Nature of Business
3Integrated Annual Report 2019
Masimba Holdings Limited
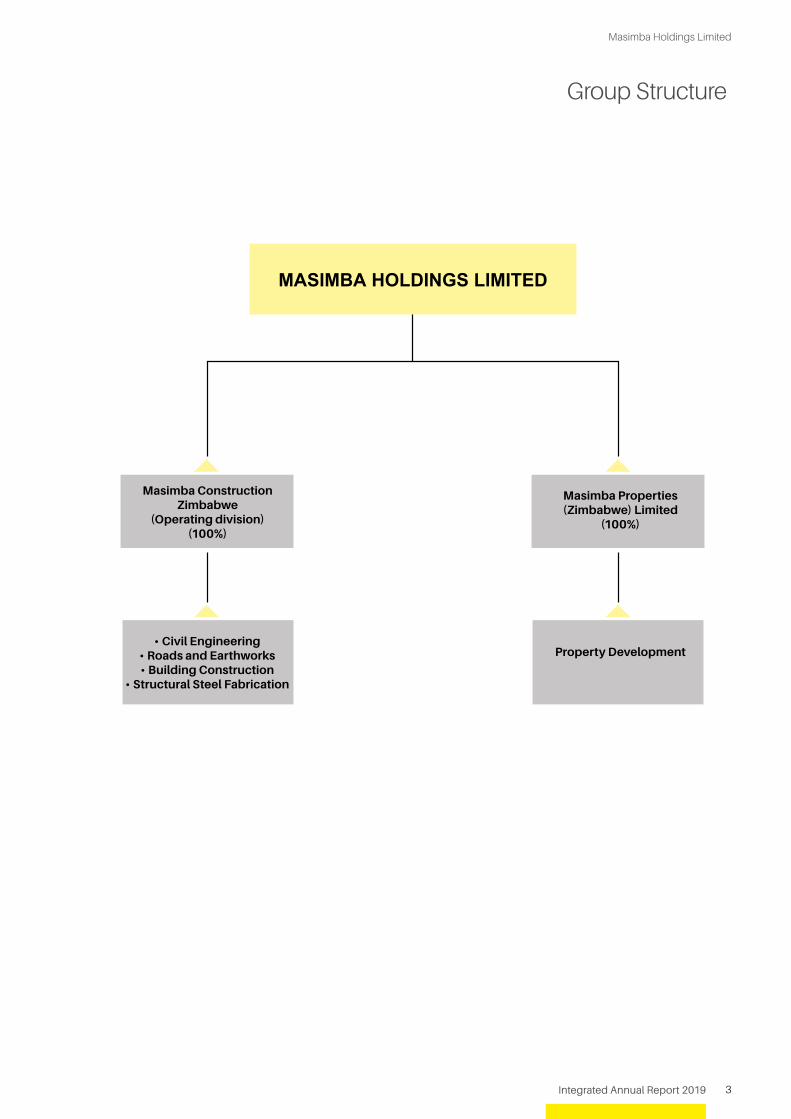
Group Structure
• Civil Engineering • Roads and Earthworks• Building Construction
• Structural Steel Fabrication
Masimba Properties (Zimbabwe) Limited
(100%)
Property Development
Masimba Construction Zimbabwe
(Operating division) (100%)
4 Integrated Annual Report 2019
Masimba Holdings Limited
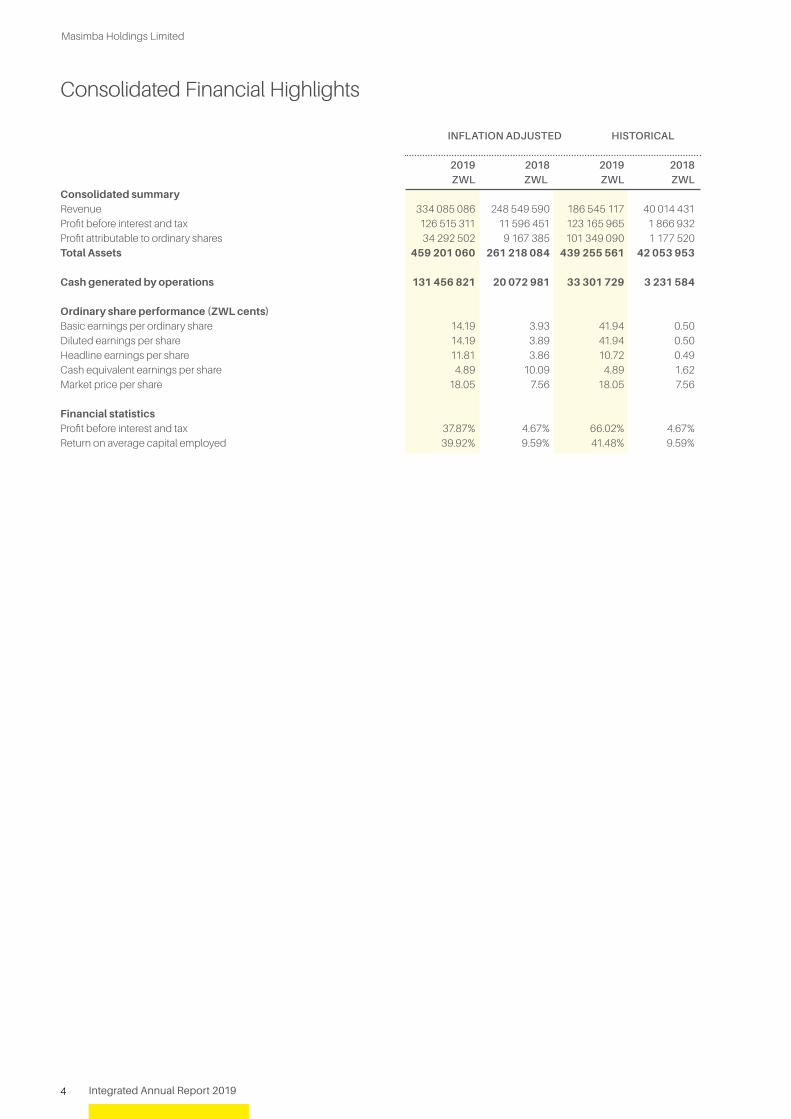
Consolidated Financial Highlights
INFLATION ADJUSTED HISTORICAL
2019 2018 2019 2018 ZWL ZWL ZWL ZWLConsolidated summary Revenue 334 085 086 248 549 590 186 545 117 40 014 431 Profit before interest and tax 126 515 311 11 596 451 123 165 965 1 866 932 Profit attributable to ordinary shares 34 292 502 9 167 385 101 349 090 1 177 520Total Assets 459 201 060 261 218 084 439 255 561 42 053 953
Cash generated by operations 131 456 821 20 072 981 33 301 729 3 231 584
Ordinary share performance (ZWL cents)Basic earnings per ordinary share 14.19 3.93 41.94 0.50Diluted earnings per share 14.19 3.89 41.94 0.50Headline earnings per share 11.81 3.86 10.72 0.49Cash equivalent earnings per share 4.89 10.09 4.89 1.62Market price per share 18.05 7.56 18.05 7.56 Financial statistics Profit before interest and tax 37.87% 4.67% 66.02% 4.67%Return on average capital employed 39.92% 9.59% 41.48% 9.59%

5Integrated Annual Report 2019
Masimba Holdings Limited
INTRODUCTIONI am pleased to present to you the audited consolidated financial results for the year ended 31 December 2019.
KEY ACCOUNTING DEVELOPMENTS
Changes in Functional Currency
The Minister of Finance and Economic Development, through Statutory Instruments 33 of 2019 and 142 of 2019 which were promulgated on 21 February 2019 and 24 June 2019 respectively, introduced the Zimbabwe Dollar as a mono-currency and abolished the multi-currency regime that had been in place since 2009. As a consequence of this change in functional currency, the Group restated its opening balances at an initial exchange rate of US$1: ZWL2.5, effective 1 March 2019.
The restatement resulted in a foreign currency translation reserve of ZWL115,406,473 which has been disclosed in the statement of changes in equity.
Reporting in Hyperinflationary Environments
The Public Accounting and Auditors Board (PAAB), in its circular 01/19 of 11 October 2019, advised stakeholders that the factors and characteristics to apply the International Accounting Standard (IAS) 29: Financial Reporting in Hyperinflationary Economies had been met. The Group has accordingly adopted IAS 29 with effect from 1 January 2019, which are reflected in the annual audited consolidated financial statements. The IAS 29 restated financial statements are therefore deemed to be the primary set of financial information and will form the basis of my report.
FINANCIAL PERFORMANCE OVERVIEW
The Group’s revenue at ZWL334,085,086 (2018: ZWL248,549,590) was ahead of the comparative period by 34% on the back of a solid order book. Profit before tax increased by 613% to ZWL75,005,902 (2018: ZWL10,526,235), mainly driven by operational efficiencies on contracting projects, fair value gains realised on the revaluation of investment properties, exchange gains arising from a net foreign currency asset position and net monetary loss arising from a net non-monetary asset.
The Roads, Mining, Retail & Commercial Buildings and Housing Infrastructure segments were the main revenue drivers for the period under review.
Chairman’s Statement
G. SebbornChairman
Profit before tax increased by 613% to ZWL75,005,902 (2018: ZWL10,526,235), mainly driven by operational efficiencies on contracting projects
6 Integrated Annual Report 2019
Masimba Holdings Limited
The Group’s EBITDFVA improved by 426% from the comparative period due to growth in revenue and operating efficiencies underpinned by technological innovations that were implemented in the current period.
The financial position of the Group strengthened to ZWL459,201,060 (2018: ZWL261,218,084) due to improved profitability and the Board’s deliberate decision to harden the financial position through the acquisition of property, plant and equipment. The Group’s net working capital improved to ZWL70,655,785 (2018: ZWL20,952,900), mainly driven by growth in business. Cash generated from operations improved to ZWL131,456,821 (2018: ZWL20,072,981), mainly attributable to business growth and improved profitability. Cash utilised in investing activities amounted to ZWL54,819,997 (2018: ZWL1,633,551) and this was mostly expended on capital expenditure. Resultantly, in line with the Board’s strategy to preserve value of positive cashflows, cash and cash equivalents declined by ZWL11,708,708.
The Group continues to prepare a set of financials in United States Dollars (US$) for internal measurement purposes only. The company’s performance in US$ terms marginally improved from the comparative period. As part of the strategy to preserve value, capital expenditure and work in progress for the year amounted to US$3,017,325, bringing the three-year cumulative capital expenditure to US$7,406,892.
OCCUPATIONAL HEALTH AND SAFETY ASSESSMENT SERIES (OHSAS)
The Group maintained all its three International Organisation of Standardisation certifications in the period under review, namely International Organisation for Standardisation (ISO) 9001:2015 Quality Management System, ISO 14001:2015 Environmental Management System and International Organisation for Standardisation (ISO) 45001:2018 Occupational Health and Safety Management System. In line with our Zero Harm programs, Lost Time Injury Frequency Rate (LTIFR) improved to 0.89 (2018:1.73).
OUTLOOK
Subsequent to the reporting period, there has been a worldwide COVID-19 pandemic and it is forecast that world economies will go into recession. The Board continues to assess the impact of this virus on its business operations and its human resource. While we will remain guided by the Government of Zimbabwe on the course of action, the Group has put in place a raft of best practice measures to mitigate the potential effects of this deadly virus.
Considering the above and the impact of drought and Cyclone Idai, the operating environment is likely to remain constrained as characterised by continued foreign currency, power, fuel shortages and inflationary pressures. The Group, as at reporting date, had a solid order book that included Roads, Housing and Mining infrastructure. The continued economic headwinds are likely to impact negatively on the execution of the order book. The Board remains alive to the current risks and opportunities and will maintain its Value and Growth strategy.
DIVIDEND
The Board, having considered the profitability of the Group, its future cashflows and the potential economic impact of COVID-19 on the Group’s operations, has proposed a nil dividend. Resultantly, inclusive of the interim dividend paid, the total dividend for the year ending 31 December 2019 will be ZWL0.83 cents (2018: ZWL0.35 cents).
DIRECTORATE
There were no changes to the Directorate in the period under review.
APPRECIATION
On behalf of the Board, I wish to express my sincere gratitude to our valued customers, suppliers and key stakeholders for the continued support in these difficult and challenging times, as well as to the executives and staff for their efforts.
G. SebbornChairman
29 April 2019
Chairman’s Statement / continued
Masimba Holdings Limited
7Integrated Annual Report 2019
Our VisionBuilding An African Legacy.
Why Do We Exist?To Create Value All The Time.
Our AspirationsTop of Clients’ Minds. Place of Great Ideas. Pioneering.
What Makes Us Different and Guides Our Long Term Strategy?Rich Heritage. Trusted Brand. High Performance. Game Changing Capability.
Scope of the GameCivil Engineering. Roads and Earthworks. Buildings Construction. Structural Steel. Fabrication. Property Development.
Strategic Foundations
Our Brand ExpressionExcellence Delivered.
Our Strategic PillarsValue. Growth. Governance.
Our BehavioursLearning. Caring. Performance Driven.Professionalism. Excellence. Team Masimba.
Our ValuesZero Harm. Integrity. Delivery. Communication. Innovation.

8 Integrated Annual Report 2019
Masimba Holdings Limited
Directorate
Gregory SebbornChairman, Non-Executive Director
Mark Mario Di NicolaNon-Executive Director
Malcolm William McCullochNon-Executive Director
Paddy Tongai ZhandaNon-Executive Director
Canada MalungaChief Executive Officer
Agnes MakamureFinance Director
Gregory is an independent Chairman of the Board. He is a former Managing Director of Zimbabwe & Southern African operations of the Rennies Group of Companies, a founding Director and former Group Managing Director of Zimplats Holdings Limited and Managing Director of Zimbabwe Platinum Mines. Gregory is a consultant for special mining projects and developments in Africa and serves as a Non-Executive Director of several companies including Stanbic Bank Zimbabwe Limited.
Mark has over 25 years of experience with companies listed on the Johannesburg Stock Exchange and is a former Chief Executive Officer of Beige Holdings Limited. He is a Director of several companies in Mauritius and the SADC region, including Kosto Holdings Limited and the Reinforcing Steel Contractors Group.
Malcolm is a Chartered Accountant and a past Group Chief Executive Officer of Murray & Roberts Limited in South Africa. He is a Director of several companies in Mauritius and the SADC region, including Kosto Holdings and the Reinforcing Steel Contractors Group.
Paddy holds a Bachelor of Commerce degree in Accounting Science from the University of South Africa. He completed his articles with Deloitte & Touché and is a Director of a number of companies including Aurora Agricultural Venture & Processors (Private) Limited, Inline (Private) Limited and Amalgamated African Ventures (Private) Limited.
Canada has held this position since March 2013, prior to which he served the company as a Non-Executive Director. From 2004 to 2010, he was at the helm of the Masimba Holdings Limited Group of Companies and is a past President of the Institute of Chartered Accountants of Zimbabwe. Canada is a Non-Executive Director at FBC Holdings Limited and African Distillers Limited.
Agnes joined Masimba Construction Zimbabwe in 2008 as a Finance Manager. She was appointed to the position of Finance Director for Masimba Holdings Limited in August 2015. Agnes is a Chartered Accountant (Zimbabwe) and currently sits on the Board of ZB Financial Holdings Limited as a Non-Executive Director.

9Integrated Annual Report 2019
Masimba Holdings Limited
The Board of DirectorsThe Board of Masimba Holdings Limited is committed to adhering to principles of good corporate governance in order to attain the goal of responsible corporate behaviour and full accountability to its shareholders and stakeholders. The Board has adopted the King IV report as its Governance framework. The matters are discussed as below:
Composition and AppointmentThe Board comprises of six Directors made up of four Non-Executives and two Executives. It is chaired by an independent Non-Executive Director, thus ensuring a separation of powers and authority.
The election of Non-Executive Directors is subject to confirmation by the Shareholders. In terms of the Company’s Articles of Association and the Companies and Other Business Entities Act (Chapter 24:31), at least one third of the Directors must retire at every Annual General Meeting and if eligible, can stand for re-election. Also, a Director appointed during the year must retire at the Annual General Meeting and, if eligible, stand for re-election.
Accountability and Delegated Functions The Board meets formally at least once every quarter to review the entity’s performance. There is an agenda of matters presented for its consideration and review, and where appropriate for decision making, so that it maintains full and effective control over strategic, financial, operational and compliance issues. The record of attendance by each Director at the Board Meetings, held during the period under review, is reflected in the table on page 11 of this report. There are procedures which allow Directors to avail themselves for independent professional advice in the furtherance of their duties and to select Non-Executive Directors.
Performance Management Reporting The entity operates regionally in regulated environments. Business is conducted within a well developed control framework, underpinned by procedures and control manuals. The Board has established a management structure with clearly defined roles, responsibilities and reporting lines.
The business performance of the Group is reported regularly to Management, the Executive Committee and the Board. Performance trends against budgets and prior periods are closely monitored. Financial information is prepared using appropriate accounting policies which are consistently applied, in all material respects, from year to year. Where a change in accounting policy occurs, the change is specifically noted in the financial statements.
The system of internal financial control is monitored regularly by Management, the Executive Committee and the Board.
The scope of the Internal Audit department includes an assessment of the risks and controls in each operating area and its findings are reported to Management. All adverse findings are reported to the Chief Executive Officer for immediate management action. Internal Audit also reports regularly to the Audit and Compliance Committee of the Board.
The External Auditors review the system of internal financial controls to the extent necessary for them to form the opinion they express on the financial statements. They also report to the Audit and Compliance Committee on matters arising from this review.
Changes to the BoardThere were no changes to the Board in the current year.
DirectorsThe following are the Directors who have served during the year under review:
• Mr Gregory Sebborn• Mr Canada Malunga• Mrs Agnes Makamure• Mr Mark Mario Di Nicola• Mr Malcolm William McCulloch• Mr Paddy Tongai Zhanda
Corporate Governance

10 Integrated Annual Report 2019
Masimba Holdings Limited
Board CommitteesThe Board has established and mandated a number of Committees to perform work on its behalf in various key areas affecting the business entity. The Committees are chaired by Non-Executive Directors and submit reports to the main Board on the respective deliberations and findings.
The Remuneration CommitteeThe Committee is chaired by a Non-Executive Director, Mr Malcolm William McCulloch. Its mandate is to set the remuneration of Executive Directors and to consider the appointment of new Directors and senior Executives before the final approval by the Board. The remuneration policies of the Committee are as follows:
• To ensure that individual rewards and incentives relate directly to the performance of the individuals, the operations and functions for which they are responsible and the Group as a whole.
• To maintain competitive rewards that enable the entity to attract and retain Executives of the highest quality.
In order to determine the competitiveness of the Executive remuneration, the Committee receives independent professional advice on remuneration packages and practices of comparable organisations within the region.
Audit and Compliance CommitteeMr Paddy Tongai Zhanda, a Non-Executive Director, chairs this Committee which deals with compliance, internal controls and risk management.
The Committee:
• considers changes to Company’s accounting policies and reviews its interim and annual financial statements, and• reviews the effectiveness of the system of internal controls during the period and reports thereon to the Board.
The Board is responsible for establishing systems of internal control which provide reasonable assurance that the entity’s assets are safeguarded, proper accounting records are maintained and that the financial information used in the business and for publication is reliable. They attach great importance to maintaining a strong and controlled environment. However, any system of internal control can provide only reasonable, not absolute, assurance against material misstatement of loss.
Code of ConductThe Board has approved a Code of Conduct which sets out the entity’s core values relating to lawful and ethical conduct of the business. All employees observe high standards of integrity and fair dealing in relation to customers, staff and regulators in the communities in which the business operates.
Going ConcernThe Board confirms that the Company has adequate resources to continue in business for the foreseeable future. Accordingly, the financial statements have been prepared on the basis that the Group is a going concern.
AuditorsA resolution will be proposed at the Annual General Meeting to appoint Grant Thornton as Auditors of the Group for the ensuing year.
The Group complied with all relevant laws and regulations and considers adherence to non-binding rules, codes and standards as an integral part of the Group’s risk management process.
__________________________________Paddy Tongai ZhandaChairman - Audit and Compliance Committee
29 April 2020
Corporate Governance / continued
11Integrated Annual Report 2019
Masimba Holdings Limited
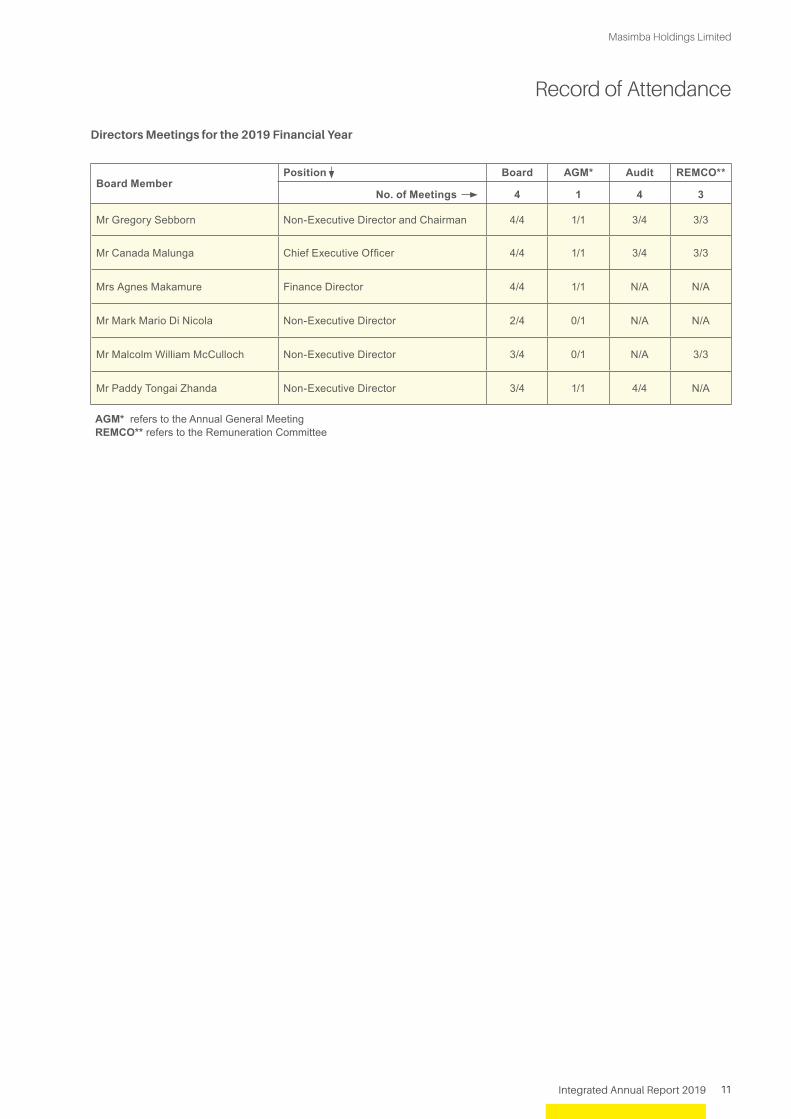
Directors Meetings for the 2019 Financial Year
Board Member Position Board AGM* Audit REMCO**
No. of Meetings 4 1 4 3
Mr Gregory Sebborn Non-Executive Director and Chairman 4/4 1/1 3/4 3/3
Mr Canada Malunga Chief Executive Officer 4/4 1/1 3/4 3/3
Mrs Agnes Makamure Finance Director 4/4 1/1 N/A N/A
Mr Mark Mario Di Nicola Non-Executive Director 2/4 0/1 N/A N/A
Mr Malcolm William McCulloch Non-Executive Director 3/4 0/1 N/A 3/3
Mr Paddy Tongai Zhanda Non-Executive Director 3/4 1/1 4/4 N/A
Record of Attendance
AGM* refers to the Annual General MeetingREMCO** refers to the Remuneration Committee
12 Integrated Annual Report 2019
Masimba Holdings Limited
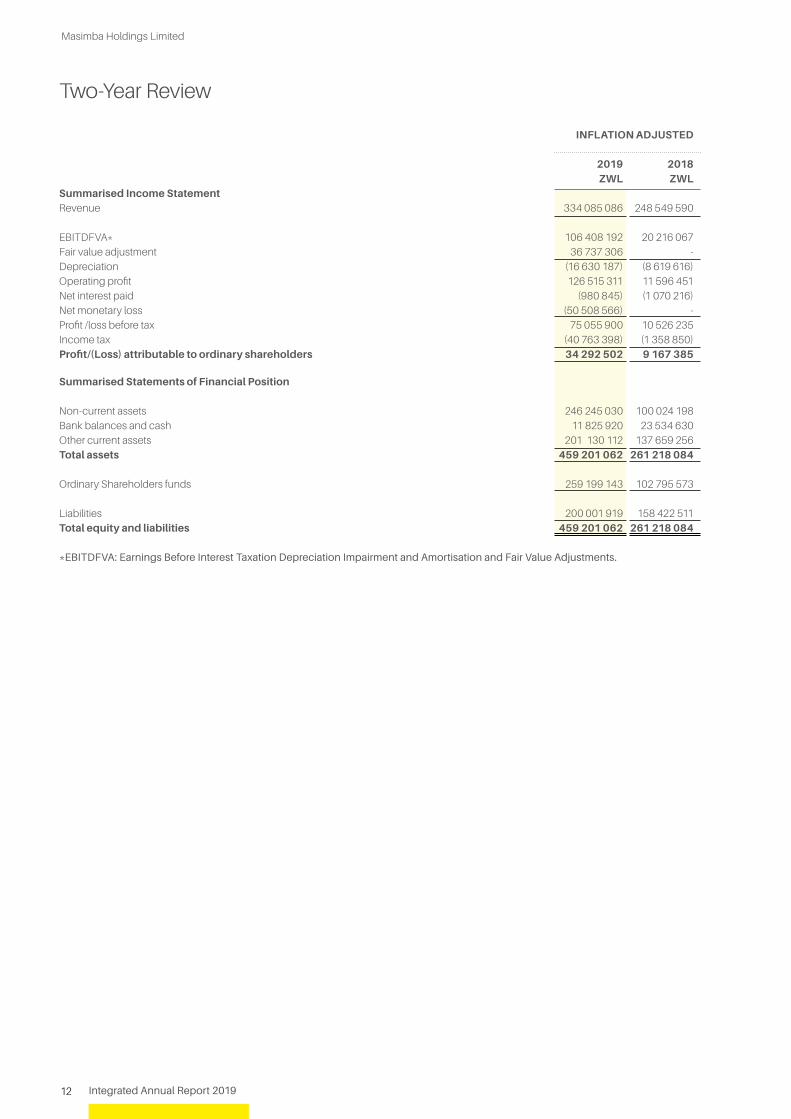
Two-Year Review
INFLATION ADJUSTED
2019 2018 ZWL ZWLSummarised Income Statement Revenue 334 085 086 248 549 590
EBITDFVA* 106 408 192 20 216 067 Fair value adjustment 36 737 306 - Depreciation (16 630 187) (8 619 616)Operating profit 126 515 311 11 596 451 Net interest paid (980 845) (1 070 216)Net monetary loss (50 508 566) - Profit /loss before tax 75 055 900 10 526 235 Income tax (40 763 398) (1 358 850)Profit/(Loss) attributable to ordinary shareholders 34 292 502 9 167 385
Summarised Statements of Financial Position Non-current assets 246 245 030 100 024 198 Bank balances and cash 11 825 920 23 534 630 Other current assets 201 130 112 137 659 256 Total assets 459 201 062 261 218 084 Ordinary Shareholders funds 259 199 143 102 795 573 Liabilities 200 001 919 158 422 511 Total equity and liabilities 459 201 062 261 218 084
*EBITDFVA: Earnings Before Interest Taxation Depreciation Impairment and Amortisation and Fair Value Adjustments.

13Integrated Annual Report 2019
Masimba Holdings Limited
Ratios and Statistics
Definitions: Average Arithmetic average between consecutive year ends.Capital employed Permanent capital, long term loans and deferred tax.Cash equivalent earnings Profit after tax (PAT) adjusted for the effects of non-cash items.Earnings per ordinary share Earnings after tax net of non-operating items, divided by the weighted average ordinary shares in issue.PAT Profit after tax attributable to ordinary shareholders.PBIT Profit before interest and tax.PBT Profit before taxation.Permanent capital Ordinary shareholders funds.Total liabilities Borrowings, finance lease and non-interest bearing debt.
*Non-operating items are excluded when computing this statistic.
INFLATION ADJUSTED HISTORICAL
2019 2018 2019 2018 ZWL ZWL ZWL ZWLEarnings (ZWL cents) Basic earnings per ordinary share 14.19 3.93 41.94 0.50Headline earnings per ordinary share 11.81 3.86 10.72 0.49Diluted earnings per ordinary share 14.19 3.89 41.94 0.50Cash equivalent earnings per ordinary share 13.52 1.62 13.52 1.62Dividends per ordinary share 2.24 0.93 1.18 0.35Dividend cover (times) 12.05 3.22 35.62 1.44 Profitability PBIT on revenue (%) 37.9% 4.7% 66.0% 4.67%PBIT on average capital employed excluding cash (%)* 39.9% 9.6% 41.5% 9.59%PBIT on average ordinary shareholders funds (%)* 48.8% 11.3% 51.5% 11.28% Productivity Overhead to revenue ratio (%) 0.12 0.11 0.12 11.47Payroll cost to turnover (cents) 0.06 0.06 0.06 6.24Total average assets (excluding bank balances and cash) 1.00 1.00 1.00 1.00 Finance Total liabilities as a percentage of permanent capital 77.16% 154.11% 83.59% 154.12%Current assets to current liabilities 1.50 1.15 1.36 1.15
Share performance Ordinary shares in issue (ZWL million) 2.417 2.332 2.417 2.332Share price at year end (ZWL cents) 18.05 7.56 18.05 7.56Market capitalisation (ZWL million) 43.63 17.63 43.63 17.63
Other Number of employees at year end 879 896 879 896
14 Integrated Annual Report 2019
Masimba Holdings Limited
StrategyOur sustainability strategy minimizes negative impact on the company, stakeholders and the environment, thus safeguarding a good balance between protection of the environment and economic success.
The company implements the Global Reporting Initiatives (GRI) Standards in identifying, measuring and managing material impacts within our operations and our control. Stakeholder engagement is fundamental in our identification of potential issues and how best to respond to them, which information becomes the bedrock of the reporting of our performance indicators.
Sustainability GovernanceGovernance processes enable us to achieve set goals and continuously improve on performance. Our Board, supported by the Audit and Compliance Committee, has overall responsibility for sustainability.
Managing Material Topics and Reporting PracticeTopics that reflect our significant economic, environmental and social impact or which substantively influence the assessment of decision makers and key stakeholders are material to the Company. Issues below were identified as material to the company and key stakeholders:
Area IssuesEconomic • Economic contributions
• Procurement practice
Social • Employment• Community relations• Occupational health and safety
Environmental • Water• Energy
Engaging our StakeholdersTo achieve our goal of sustainability we engage our key stakeholders in order to understand their needs, expectations and interests. Resultantly, we are better able to meet their expectations and strategically report on relevant matters. The Board is the main custodian for managing the Company’s brand, reputation and stakeholder relationships.
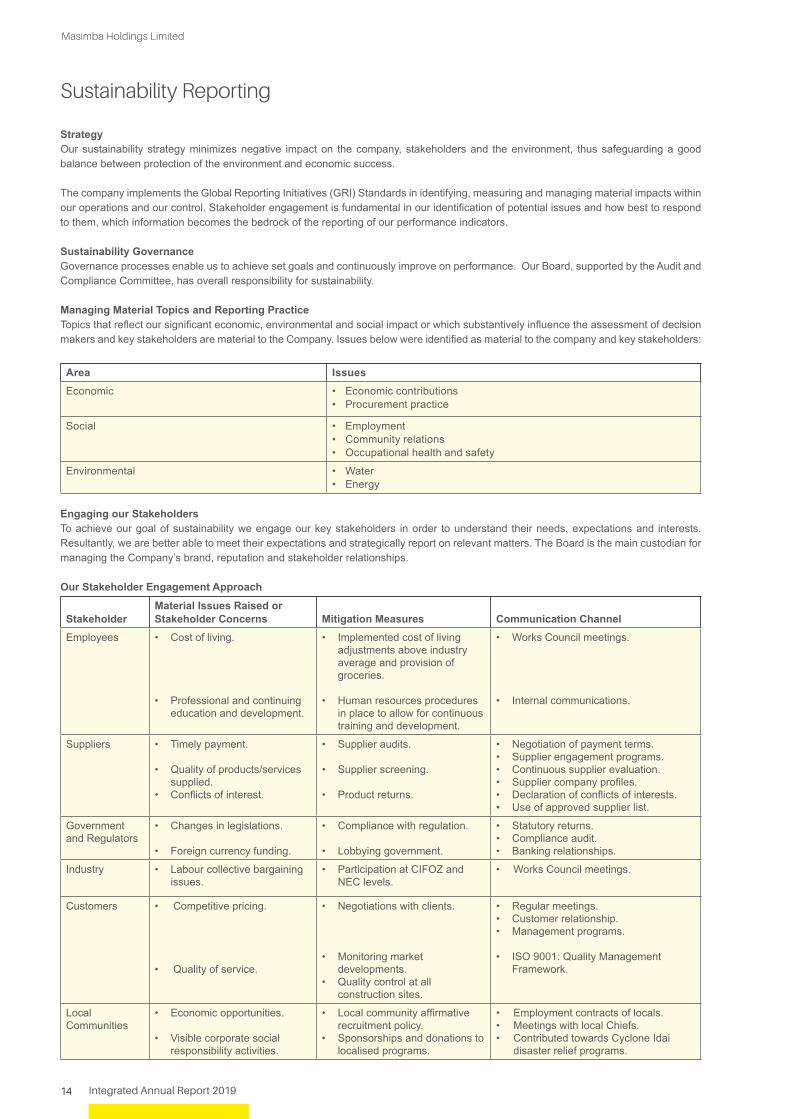
Our Stakeholder Engagement Approach
StakeholderMaterial Issues Raised or Stakeholder Concerns Mitigation Measures Communication Channel
Employees • Cost of living.
• Professional and continuing education and development.
• Implemented cost of living adjustments above industry average and provision of groceries.
• Human resources procedures in place to allow for continuous training and development.
• Works Council meetings.
• Internal communications.
Suppliers • Timely payment.
• Quality of products/services supplied.
• Conflicts of interest.
• Supplier audits.
• Supplier screening.
• Product returns.
• Negotiation of payment terms.• Supplier engagement programs.• Continuous supplier evaluation.• Supplier company profiles.• Declaration of conflicts of interests.• Use of approved supplier list.
Government and Regulators
• Changes in legislations.
• Foreign currency funding.
• Compliance with regulation.
• Lobbying government.
• Statutory returns.• Compliance audit.• Banking relationships.
Industry • Labour collective bargaining issues.
• Participation at CIFOZ and NEC levels.
• Works Council meetings.
Customers • Competitive pricing.
• Quality of service.
• Negotiations with clients.
• Monitoring market developments.
• Quality control at all construction sites.
• Regular meetings.• Customer relationship. • Management programs.
• ISO 9001: Quality Management Framework.
Local Communities
• Economic opportunities.
• Visible corporate social responsibility activities.
• Local community affirmative recruitment policy.
• Sponsorships and donations to localised programs.
• Employment contracts of locals.• Meetings with local Chiefs.• Contributed towards Cyclone Idai
disaster relief programs.
Sustainability Reporting
15Integrated Annual Report 2019
Masimba Holdings Limited
Our PrioritiesWe are committed to the continuous improvement of the overall Safety, Health, Environmental and Quality (SHEQ) performance through:
• Identifying and evaluating occupational hazards and environmental aspects resulting from all operations.• Setting objectives and targets to mitigate or eliminate risks and impacts of significant hazards and aspects.• Complying with applicable SHEQ legislation and international industry standards.• Managing processes and operations to protect biodiversity, conserve energy and to prevent pollution, injury, illness and damage to
equipment. • Developing a world class safety culture and achieving ZERO HARM through SHEQ awareness, training and behaviour modification.• Maintaining regular, open and honest communication with all stakeholders.• Defining responsibility and accountability to monitor performance against set objectives and targets for continual improvement
purposes.• Ensuring customer satisfaction.
Sustainability in our Procurement PracticeOur procurement strategy hinges on professionalism and transparency within prescribed standards and quality. This strategy ensures that our suppliers are key partners in the delivery of quality products to Clients.
Compliance to quality standards and proven track records are key selection benchmarks that we employ. We have a procurement policy that serves as a reference point in all decisions and practices. To ensure sustainability in our supply chain we vary the way we procure goods depending on value, complexity and risk involved.
The Company places responsibility on management to ensure sustainable supply chain management in the business operations. We also seek to ensure that our supply chain objectives are delivered in a sustainable manner.
Environmental ManagementBy nature of our business, contracting and civil building, the Company inadvertently has potential to damage the environment in the execution of its various contractual activities. It is in this vein that we adopted and are certified to ISO 14001:2015 Environmental Management System in order to track and effectively mitigate on the effects of harm to the environment.
Sustainability Reporting / continued
Our key environmental risks include:
• Increased regulatory requirements related to energy and climate change, which could lead to increased costs as well as opportunities in a low-carbon economy.
• Project disruptions due to extreme and unpredictable weather conditions, including floods and storm surges.• Undertaking activities without the correct environmental assessments or failure to abide by conditions set out in operating licences,
such as water and sand abstraction permits, on a project.
To ensure environmental sustainability, the organisation has across all its operations set objectives linked to sustainable environmental management. Furthermore, the 3R strategy which is premised on an approach to reduce the amount of solid waste through Reducing, Reusing and Recycling, was also adopted and is supported by relative activities inclusive of:
• On-site waste segregation. • Harnessing salvage value from waste streams such as cement bags, paper, used oils, to mention a few.• Ensuring controlled disposal of waste through licenced service providers.• Recycling of used vehicle tyres. • Migrating towards a paperless working environment through automation of essential processes.• Monitoring and measuring of vehicular and machinery exhaust emissions through planned monthly maintenance schedules.• Monitoring of resource utilisation such as electricity, water and fuel to promote efficient consumption patterns that reduce our overall
carbon footprint.• Land rehabilitation after completion of all projects.• Adoption of solar energy at our projects and sites.• Compliance and adherence to permits and licences.

16 Integrated Annual Report 2019
Masimba Holdings Limited
Sustainability Reporting / continued
Detailed below is our environmental footprint:
Resource Measurement Unit
2019 2018 2017 2016 2015
Diesel Litres 669 908 858 572 729 542 395 632 244 529
Petrol Litres 20 787 23 368 28 248 35 346 34 936
Oils Litres 8 452 13 977 9 737 5 377 3 058
Electricity KW/h 74 561 108 063 73 952 81 909 90 787
Water M3 63 186 30 292 6 475 7 291 8 226
Quality Management
• We are certified to ISO 9001:2015 Quality Management System which guides us in delivering quality infrastructure across all operations.• As an organisation, we believe that the customer is key. Customer satisfaction is our number one priority which is realised through delivering
projects on time and budgeting to specifications in a safe and environmentally sustainable manner.
Quality is ensured through:
• Implementing a culture of doing things right the first time.• Automation of processes for advanced management of projects
and operations. • Robust adherence to quarterly planned maintenance schedules
for all equipment and machinery.
Our PeopleOur people are responsible for the delivery of the Company’s tagline, “Excellence Delivered”.We believe the success of all systems depends on people as the organisation’s greatest asset asset. To that end, we strive to:√ Provide a safe working environment,√ Provide appropriate training and development.
In order for the business to retain a well engaged and skilled team, regular performance evaluations are conducted to provide feedback and implement corrective actions.
The Company provides employment opportunities through various forms that include project-based contracts, casual positions, fixed term contracts and full-time permanent contracts. The opportunities are managed through adherence to best labour practices. Our project-based contract employees are members of the Zimbabwe Construction and Allied Trade Workers Union. Detailed below is our employee database:
Employees by Nature of Contract
Financial YearNumber of
Active ProjectsPermanent Contracts
Project Based Contracts
Students on Attachment Total
2019 15 167 703 9 879
2018 15 160 730 6 896
Employees by Gender
Year Males Females Totals
Number Percentage Number Percentage Number2019 799 91% 80 9% 879
2018 841 94% 55 6% 896
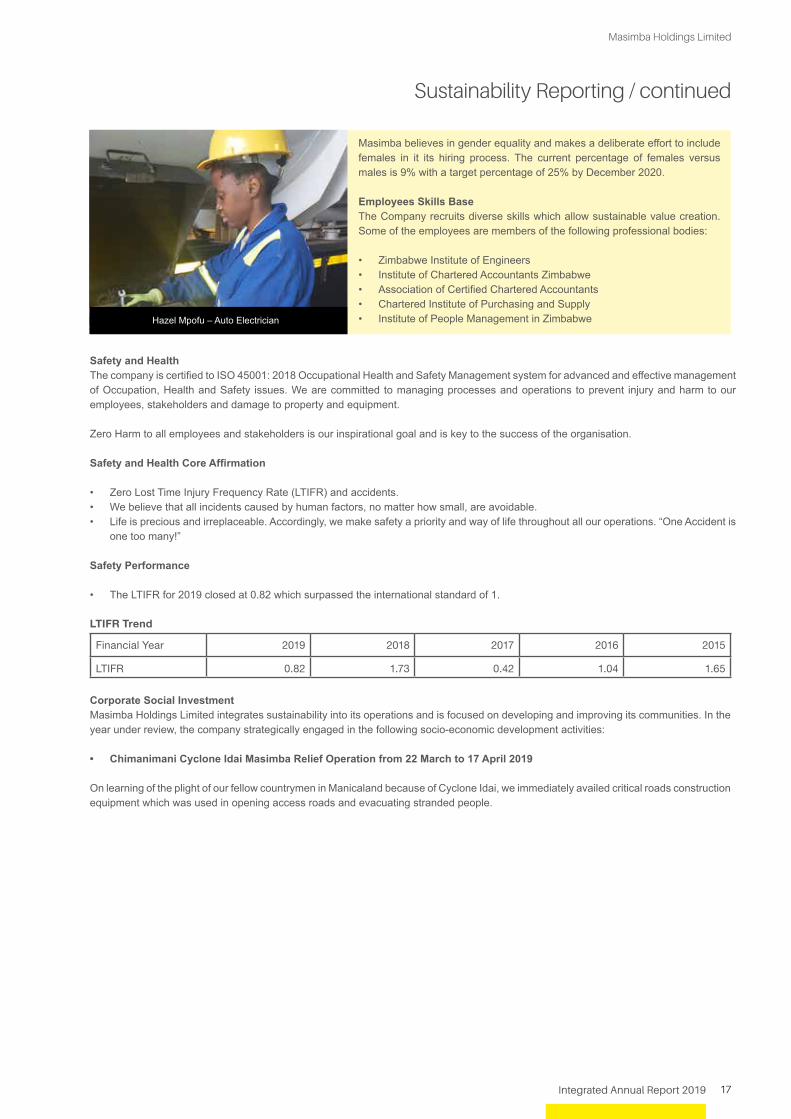
Hazel Mpoto – Auto Electrician
17Integrated Annual Report 2019
Masimba Holdings Limited
Sustainability Reporting / continued
Masimba believes in gender equality and makes a deliberate effort to include females in it its hiring process. The current percentage of females versus males is 9% with a target percentage of 25% by December 2020.
Employees Skills BaseThe Company recruits diverse skills which allow sustainable value creation. Some of the employees are members of the following professional bodies:
• Zimbabwe Institute of Engineers• Institute of Chartered Accountants Zimbabwe• Association of Certified Chartered Accountants• Chartered Institute of Purchasing and Supply• Institute of People Management in Zimbabwe
Corporate Social InvestmentMasimba Holdings Limited integrates sustainability into its operations and is focused on developing and improving its communities. In the year under review, the company strategically engaged in the following socio-economic development activities:
• Chimanimani Cyclone Idai Masimba Relief Operation from 22 March to 17 April 2019
On learning of the plight of our fellow countrymen in Manicaland because of Cyclone Idai, we immediately availed critical roads construction equipment which was used in opening access roads and evacuating stranded people.
Hazel Mpofu – Auto Electrician
Safety and HealthThe company is certified to ISO 45001: 2018 Occupational Health and Safety Management system for advanced and effective management of Occupation, Health and Safety issues. We are committed to managing processes and operations to prevent injury and harm to our employees, stakeholders and damage to property and equipment.
Zero Harm to all employees and stakeholders is our inspirational goal and is key to the success of the organisation.
Safety and Health Core Affirmation
• Zero Lost Time Injury Frequency Rate (LTIFR) and accidents. • We believe that all incidents caused by human factors, no matter how small, are avoidable. • Life is precious and irreplaceable. Accordingly, we make safety a priority and way of life throughout all our operations. “One Accident is
one too many!”
Safety Performance
• The LTIFR for 2019 closed at 0.82 which surpassed the international standard of 1.
LTIFR Trend
Financial Year 2019 2018 2017 2016 2015
LTIFR 0.82 1.73 0.42 1.04 1.65

C. Malunga (CEO) on the left, B. Shiri (TLB Operator), D. Denhere (DPF) and A. Makamure (FD) on the right
18 Integrated Annual Report 2019
Masimba Holdings Limited
Sustainability Reporting / continued
A Masimba excavator opening an access road while doing relief work in Chimanimani
The Manicaland province remains close to our heart, and is family, as we have and continue to execute several projects therein. Accordingly, it was a privilege and an honour to join the nation in action and solidarity as we worked to reduce the pain and suffering at this moment of need.
• National Ballet Centre – National Dance Trust Since 2004, we have been erecting an outdoor stage for the annual Starlight Dancing that is held each spring at the National Ballet
Centre by the National Dance Trust.
Capacitating dancers to their full potential
Welcoming and Saluting Part of the Masimba Cyclone Idai Relief Team
We were ably represented on the ground by our operators Messrs. B. Shiri, T. Mereki and D. Denhere whom we salute for their heroic contributions. While they were on the field, the rest of Team Masimba mobilized clothes and non-food items for the cyclone Idai victims in Chimanimani and Chipinge.

19Integrated Annual Report 2019
Masimba Holdings Limited
Sustainability Reporting / continued
Economic Contributions We are operating in an environment that is characterised by economic and inflationary pressure which constrain our value generation capability. Masimba Holdings Limited has remained resilient amid the economic pressures and continues to demonstrate exceptional performance in a difficult environment. Improved business performance enables the distribution of wealth across our stakeholders and on the other hand poor performance results in negative consequences on our respective stakeholders. To that end, Masimba is committed in seeking ways of improving business performance so that it adds value to its shareholders, society and government.
Value preservation is at the core of our strategic objectives as a business. That being the case, we have implemented a retooling exercise which has resulted in improved efficiencies and should enable the company to expand on its customer base.
Economic Value Generated and Distributed The wealth that we create through our business is subsequently distributed across to our stakeholders. The difference between the value generated and distributed is the economic value retained by Masimba Holdings Limited for further developing the business.
INFLATION ADJUSTED HISTORICAL COST 2019 2018 2019 2018 ZWL ZWL ZWL ZWL
Value generated as represented by Gross Profit 110 397 234 36 159 023 68 977 168 5 821 304 Other income and interest received 57 039 596 3 939 892 75 854 830 634 290 Equity accounted earnings 9 083 479 10 354 583 102 887 207 1 667 002 176 520 309 50 453 498 247 719 205 8 122 596 Economic Value Distribution Other operating costs 55 566 833 4 379 139 11 388 541 2 092 692 Staff costs and benefits 19 233 063 15 503 709 10 277 492 2 495 969 Depreciation and amortisation 16 630 187 8 619 616 6 898 201 1 291 125 Providers of capital 950 845 1 070 216 551 780 172 296 Provision for taxes - 65 221 - 10 500 Value Added 84 139 381 20 815 597 218 603 191 2 060 014
Payments to Government Masimba Holdings Limited generates revenue for the government through taxes paid to regulators and other government authorities. The payments made to government are as detailed in table below:
Description 2019 2018 ZWL ZWL
PAYE 3 922 881 1 008 383Aids Levy 121 326 31 187Intermediated Transfer Tax 2 358 848 75 740Value Added Tax (VAT) 2 696 909 1 410 734Import Duty and VAT 2 720 654 331 827Income Taxes - -
• Friday 20 September 2019 Golf Day A day out with our business partners at Royal Harare Golf Club.

20 Integrated Annual Report 2019
Masimba Holdings Limited
Chimanimani - after the effects of Cyclone Idai
Chimanimani - after relief work
Our Travel

21Integrated Annual Report 2019
Masimba Holdings Limited
The Future – Infinite Possibilities
22 Integrated Annual Report 2019
Masimba Holdings Limited
Directors’ Report
The Directors have pleasure in presenting their Audited Financial Statements of the Group for the year ended 31 December 2019.
In the report “Group” refers to Masimba Holdings Limited and its subsidiary companies.
Period’s Results Historical ZWL
Profit attributable to Shareholders 101 349 090
Dividend 2 844 930
Net transfer against reserves 98 504 160
Capital Expenditure Capital expenditure for the period to 31 December 2019 amounted to ZWL26,286,638 (2018: ZWL1,406,137).
Share CapitalThe authorised share capital of the Group was ZWL8,750,000 and comprising of 875,000,000 ordinary shares of a nominal value of ZWL0,01 each.
Issued share capital of the Group was ZWL2,416,537 as at December 2019 (2018: ZWL2,331,824) and comprised of 241,653,707 (2018: ZWL233,182,314) ordinary shares of the nominal amount of ZWL0,01 each.
The increase in issued share capital is attributable to 8,471,393 ordinary shares that were issued under a scrip dividend.
AuditorsThe Auditors of the Group are Grant Thornton Chartered Accountants Zimbabwe. Shareholders will be asked at the forthcoming Annual General Meeting to approve their remuneration in respect of the past audit and to appoint Auditors for the coming year.
ReservesThe movement in the Reserves of the Group is disclosed on the Consolidated Statement of Changes in Equity.
DirectorateThe following are the Directors of the Group that held office in the period under review:
• Mr Gregory Sebborn Independent Non-Executive Chairman• Mr Canada Malunga Chief Executive Officer• Mrs Agnes Makamure Finance Director• Mr Mark Mario Di Nicola Non-Executive Director• Mr Malcolm William McCulloch Non-Executive Director• Mr Paddy Tongai Zhanda Non-Executive Director
Mr Paddy Tongai Zhanda and Mr Malcolm William McCulloch retire by rotation on conclusion of the forthcoming Annual General Meeting. Both being eligible, have offered themselves for re-election and Shareholders will be asked to appoint Directors for the ensuing year.
Directors’ FeesShareholders will be asked to approve the remuneration of the Directors for their services as Directors during the past year. Your Board recommends that an amount of ZWL216,349 (2018: ZWL62,500) be paid, to be divided amongst themselves at their discretion.
The Masimba Holdings Limited Senior Executive Share Option Scheme 2003The Scheme was approved by Shareholders in October 2003, the purpose of which is to promote the retention of senior Executives responsible for the management of the Group. The details of the movement in the outstanding option during the year to 31 December 2019 are shown on note 11 of the consolidated financial statements.
Compliance with International Financial Reporting Standards (IFRSs)The financial statements are prepared with the aim of complying fully with IFRSs, which allows comparability with similar businesses and consistency in the interpretation of the financial statements.
While full compliance with IFRSs has been possible in previous reporting periods, only partial compliance has been achieved in 2019. The IFRS Conceptual Framework provides that, in applying fair presentation to the financial statements, entities should go beyond consideration of the legal form of transactions and other factors impacting on the financial statements to also consider the underlying economic substance therein. International Financial Reporting Standard 21: The Effects of Changes in Foreign Exchange Rates (IAS 21) requires an entity to apply certain parameters in determining the functional currency of an entity for use in preparing financial statements. IAS 21 also requires an entity to make certain judgements around appropriate exchange rates to be applied between currencies where exchangeability through a legal exchange mechanism (such as a formal currency market) is not achievable.
23Integrated Annual Report 2019
Masimba Holdings Limited
…………………………. ………….……..…….....
G. Sebborn C. Malunga
Chairman Chief Executive Officer
29 April 2020 29 April 2020
These consolidated financial statements were prepared under the supervision of:
………………………….
A. Makamure CA (Z)
Registered Public Accountant (PAAB No.: 03528)
Finance Director
Directors’ Report / continued
In Statutory Instrument 33 of 2019 which, based on our legal interpretation for accounting and other purposes, prescribes parity between the United States Dollar and local currency as at and up to the effective date of 22 February 2019, while also prescribing the manner in which certain balances in the financial statements should be treated as a consequence of the recognition of the RTGS Dollar as currency in Zimbabwe.
In our opinion, the requirement to comply with Statutory Instrument 33 of 2019 has created inconsistencies with IAS 21, as well as with the principles embedded in the IFRS Conceptual Framework as also enunciated in the guidance issued by the Public Accountants and Auditors Board on 21 March 2019. This has resulted in accounting treatment being adopted in the 2019 financial statements that is different from what would have been adopted if the Group had been able to fully comply with IFRSs. As such, the Board and management have been unable to produce financial statements which in their view would be true and fair and urge users of the financial statements to exercise due caution.
Effective 1 March 2019, the Group adopted the Zimbabwe Dollar as both the reporting and functional currency of the Group.
Statement of ComplianceThe Directors are responsible for the maintenance of adequate accounting records and the preparation and integrity of the financial statements.
The Group’s independent external auditors, Grant Thornton Zimbabwe, have audited the financial statements and their report is on page 24 of this Annual Report.
The Directors are also responsible for the systems of internal control. These systems of internal control are designed to provide reasonable, but not absolute, assurance as to the reliability of the financial statements and to adequately safeguard, verify and maintain accountability of assets. These systems of internal control also prevent and detect material misstatement and loss. The systems are implemented and monitored by suitably trained personnel with an appropriate segregation of authority and duties. Nothing has come to the attention of the Directors to indicate that any material breakdown in the functioning of these controls, procedures and systems has occurred during the period under review. The financial statements are prepared on an ongoing concern basis. Nothing has come to the attention of the Directors to indicate that the Group will not remain a going concern for the foreseeable future.
The Group’s financial statements which are set out on pages 27 to 68 were, in accordance with their responsibilities, approved by the Board of Directors on 29 April 2020 and signed on its behalf by:
24 Integrated Annual Report 2019
Independent Auditor’s Report
To the members of Masimba Holdings Limited
Report on the Audit of the Inflation Adjusted Consolidated Financial Statements
Adverse Opinion
We have audited the inflation adjusted consolidated financial statements of Masimba Holdings Limited set out on pages 27 to 68, which comprise the inflation adjusted consolidated statement of financial position as at 31 December 2019, and the inflation adjusted consolidated statement of profit or loss and other comprehensive income, the inflation adjusted consolidated statement of changes in equity and the inflation adjusted consolidated statement of cash flows for the year then ended, and the notes to the inflation adjusted consolidated financial statements, including a summary of significant group accounting policies.
In our opinion, because of the significance of the matters described in the Basis for Adverse Opinion section of our report, the inflation adjusted consolidated financial statements do not present fairly, in all material respects, the inflation adjusted financial position of Masimba Holdings Limited as at 31 December 2019, and its inflation adjusted financial performance and cash flows for the year then ended in accordance with International Financial Reporting Standards (IFRSs)
Basis for Adverse Opinion
Non-compliance with International Accounting Standard (IAS) 21 - The Effect of Changes in Foreign Exchange Rates for transactions for the accounting of opening balances and transactions for the period 1 January 2019 to 22 February 2019
As described in the note 1.2 to the consolidated financial statements, the economic environment during the year ended 31 December 2019 was characterised by ‘multi-tiered’ pricing, and the Group transacted predominantly in RTGS FCA (electronic payments), including mobile money, bond notes and coins.
On 20 February 2019, a Monetary Policy Statement was issued, denominating the existing RTGS balances, bond notes and coins in circulation as RTGS Dollars in order to establish an exchange rate between the existing monetary balances and foreign currency. The RTGS Dollars became part of the multi-currency system in Zimbabwe through the issuance of statutory instrument (S.I.) 33/2019, with an effective date of 22 February 2019. The statutory instrument provided that for accounting and other purposes, all assets and liabilities that were immediately before the effective date, valued and expressed in United States Dollars shall on and after the effective date be deemed to be values in RTGS Dollars at a rate of 1:1 to the United States Dollar. This was not consistent with IAS 21 – The Effects of Changes in Foreign Exchange Rates which requires that an assessment be made of the change in functional currency and that financial statements be presented at a rate that approximates the market rate. The Group had to be guided by S.I. 41/2019 which states that in the case of any inconsistency between a local pronouncement issued by the Board through a notice in the Government Gazette and any international standard, the local pronouncement shall take precedence to the extent of the inconsistency.
In compliance with SI 33/2019, the Group maintained its functional currency as the USD in the prior period and from 1 January 2019 to 22 February 2019 using an exchange rate of 1:1 between the RTGS FCA and Nostro FCA and changed to Zimbabwe Dollar as presented in the consolidated financial statements. This constitutes a departure from the requirements of IAS 21 – The Effects of Changes in Foreign Exchange Rates. Had the consolidated financial statements been prepared in accordance with the requirements of IAS 21, many elements would have been materially affected. As a result, the impact of the Group’s inability to comply with IAS 21 has been determined as significant. The effects on the consolidated financial statements of the non-compliance with IAS 21 are considered material and pervasive to the consolidated financial statements, taken as a whole.
Had the Group applied the requirements of IAS 21, many of the elements of the consolidated financial statements would have been materially impacted and therefore the departure from the requirements of these standards is considered to be pervasive. The financial effects on the inflation adjusted consolidated financial statements of this departure have not been determined.
Non-compliance with International Accounting Standard (IAS) 29 – Financial Reporting in Hyperinflationary Economies
On 11 October 2019, the Public Accountants and Auditors Board (PAAB) issued a pronouncement relating to the application of IAS 29 – Financial Reporting in Hyperinflationary Economies. The PAAB advised that there is broad market consensus within the accounting and auditing professions that the factors and characteristics to apply the Financial Reporting in Hyperinflationary Economies Standard (IAS 29), in Zimbabwe had been met. The Directors have applied the IAS 29 – Financial Reporting in Hyperinflationary Economies with effect from 1 January 2019. However, as a result of the need to comply with the requirements of S.I. 33 of 2019, the changes in the general pricing power of the functional currency were applied on amounts that were not restated to resolve the matters which resulted in an adverse report in the prior year. This approach resulted in a consequential departure from the requirements of IAS 29 – Financial Reporting in Hyperinflationary Economies.
Had the Group fully applied the requirements of IAS 29 on restated base numbers, many of the elements of the consolidated financial statements would have been materially impacted and therefore the departure from the requirements of these standards is considered to be pervasive. The financial effects on the inflation adjusted consolidated financial statements of this departure have not been determined.
Fair value determination for assets, transactions and liabilities
The determination of fair values for assets, transactions and liabilities presented in the consolidated financial statements is affected by the prevailing economic environment and may therefore be distorted. This may result in significant variations in fair values, depending on factors and assumptions used in the determination of the fair values.
25Integrated Annual Report 2019
Independent Auditors’ Report
Emphasis of matterWe draw attention to Note 36 of the financial statements, which describes the uncertainties related to the possible effects of the COVID-19 pandemic on the Group and its inability to quantify the possible impact. Our opinion is not modified in respect of this matter.
We conducted our audit in accordance with International Standards on Auditing (ISAs). Our responsibilities under those standards are further described in the Auditor’s Responsibilities for the Audit of the Consolidated Financial Statements section of our report. We are independent of the Group in accordance with the International Ethics Standards Board for Accountants’ Code of Ethics for Professional Accountants (IESBA Code), and we have fulfilled our other ethical responsibilities in accordance with the IESBA Code. We believe that the audit evidence we have obtained is sufficient and appropriate to provide a basis for our opinion.
Key Audit Matters
Key audit matters are those matters that, in our professional judgement, were of most significance in our audit of the financial statements of the current period. These matters were addressed in the context of our audit of the financial statements as a whole, and in forming our opinion thereon, and we do not provide a separate opinion on these matters. The key audit matters noted below relate to the financial statements.
Key Audit Matter How our audit addressed the Key Audit Matter
Revenue recognition and valuation of construction projects.
• The Group is involved in complex construction projects for which it applies the percentage of completion method. The amount of revenue and profit recognized in a year on projects is dependent, among other things, on the actual costs incurred, the assessment of the percentage of completion for contracts and the forecast contract revenue and costs to complete for each project.
• The amount of revenue and profit is influenced by the valuation of variation orders and claims.
• Reviewed whether the revenue recognition criteria is appropriate and in line with the requirements of IFRS 15.
• Evaluated the significant judgements made by management, amongst others based on an examination of the associated project documentation.
• Discussed with finance and technical staff of the Group on the status of projects under construction. In addition, we visited some projects under construction.
• Tested the controls that the Group has put in place over the process to record contract revenues, contract costs, and the calculation of the stage of completion.
• Based on our audit work performed and the assumptions used, we satisfied ourselves that the Group’s revenue recognition and valuation of construction projects is in accordance with IFRS 15, Revenue from Contracts with Customers.
Other information
The Directors are responsible for the other information. The other information comprises the Directors’ Report, Chairman’s Statement and Company Secretary’s Certificate, as required by the Companies Act (Chapter 24:03), which we obtained prior to the date of this auditors’ report. The other information does not include the financial statements and our auditor’s report thereon.
Our opinion on the consolidated financial statements does not cover the other information and we do not express any form of assurance or conclusion thereon.
In connection with our audit of the consolidated financial statements, our responsibility is to read the other information and, in doing so, consider whether the other information is materially inconsistent with the consolidated financial statements or our knowledge obtained in the audit, or otherwise appears to be materially misstated. If, based on the work we have performed on the other information that we obtained prior to the date of this auditor’s report, we conclude that there is a material misstatement of this other information, we are required to report that fact. We have nothing to report in this regard.
Responsibilities of Management and Those Charged with Governance for the Consolidated Financial Statements
Management is responsible for the preparation and fair presentation of the consolidated financial statements in accordance with International Financial Reporting Standards (IFRSs), and for such internal control as management determines is necessary to enable the preparation of consolidated financial statements that are free from material misstatement, whether due to fraud or error.
In preparing the consolidated financial statements, management is responsible for assessing the Group’s ability to continue as a going concern, disclosing, as applicable, matters related to going concern and using the going concern basis of accounting unless management either intends to liquidate the Group or to cease operations, or has no realistic alternative but to do so.
Those charged with governance are responsible for overseeing the Group’s financial reporting process.
26 Integrated Annual Report 2019
Independent Auditors’ Report / continued
Auditor’s Responsibilities for the Audit of the Consolidated Financial Statements
Our responsibility is to express an opinion on the consolidated financial statements based on our audit. We conducted our audit in accord-ance with International Standards on Auditing. Those standards require that we comply with ethical requirements and plan and perform the audit to obtain reasonable assurance whether the consolidated financial statements are free from material misstatement.
An audit involves performing procedures to obtain audit evidence about the amounts and disclosures in the annual consolidated financial statements. The procedures selected depend on our judgement, including the assessment of the risks of material misstatement of the annual consolidated financial statements, whether due to fraud or error. In making those risk assessments, we consider internal control rel-evant to the entity’s preparation and fair presentation of the annual consolidated financial statements in order to design audit procedures that are appropriate in the circumstances, but not for the purpose of expressing an opinion on the effectiveness of the entity’s internal con-trol. An audit also includes evaluating the appropriateness of accounting policies used and the reasonableness of accounting estimates made by management, as well as evaluating the overall presentation of the annual consolidated financial statements.
Report on other legal and regulatory requirements
In our opinion, except for the possible effects of the matters described in the Basis for Adverse Opinion paragraph, the consolidated finan-cial statements have been properly prepared in compliance with the requirements of the Companies Act (Chapter 24:03) and the relevant Statutory Instruments (SI 33/99 and SI 62/96).
The engagement partner on the audit resulting in this independent auditor’s report is Farai Chibisa.
Farai ChibisaPartner
Registered Public Auditor (PAAB No: 0547)
Grant ThorntonChartered Accountants (Zimbabwe)Registered Public Auditors
HARARE
29 April 2020

27Integrated Annual Report 2019
Masimba Holdings Limited
Consolidated Statement of Financial Positionas at 31 December 2019
INFLATION ADJUSTED HISTORICAL COST
2019 2018 2019 2018 Notes ZWL ZWL ZWL ZWLASSETS Non-current assets Property, plant and equipment 4 168 880 112 53 986 552 168 880 112 8 691 388 Investment property 5 65 409 584 28 672 278 65 409 584 4 616 000 Investments 6 11 955 332 17 365 368 11 955 332 2 795 681 246 245 028 100 024 198 246 245 028 16 103 069 Current assets Cash and cash equivalents 7 11 825 920 23 534 630 11 825 920 3 788 881 Contracts in progress and contracts receivables 8 98 368 245 92 485 335 98 368 245 14 889 375 Trade and other receivables 9 74 073 017 33 964 880 74 073 017 5 468 065 Inventories 10 28 688 850 10 720 948 8 743 351 1 725 984 Tax refundable - 488 093 - 78 579 212 956 032 161 193 886 193 010 533 25 950 884 Total assets 459 201 062 261 218 084 439 255 561 42 053 953 EQUITY AND LIABILITIES Capital and reserves Share capital 11 14 571 369 14 484 122 2 416 537 2 331 824 Share premium 5 484 782 2 518 315 1 006 892 405 428 Reserves 180 822 346 56 360 795 133 746 903 10 232 276 Retained earnings 58 320 646 29 432 341 102 083 310 3 579 150 259 199 143 102 795 573 239 253 642 16 548 678 Non-current liabilities Interest bearing borrowings 12 2 298 573 1 242 300 2 298 573 200 000 Finance lease liabilities 13 250 424 2 575 946 250 424 414 706 Deferred tax 15 55 152 675 14 363 279 55 152 675 2 312 928 57 701 672 18 181 525 57 701 672 2 927 634 Current liabilities Interest bearing borrowings 12 1 983 136 4 005 528 1 983 136 644 857 Finance lease liabilities 13 182 227 3 185 939 182 227 512 910 Trade and other payables 16 125 561 598 92 425 961 125 561 598 14 879 816 Current tax liabilities 139 952 - 139 952 - Subcontractors 17 14 433 334 40 623 558 14 433 334 6 540 058 142 300 247 140 240 986 142 300 247 22 577 641 Total equity and liabilities 459 201 062 261 218 084 439 255 561 42 053 953
G. Sebborn C. MalungaChairman Chief Executive Officer29 April 2020 29 April 2020
28 Integrated Annual Report 2019
Masimba Holdings Limited
Consolidated Statement of Profit or Loss and Other Comprehensive Income for the Year Ended 31 December 2019
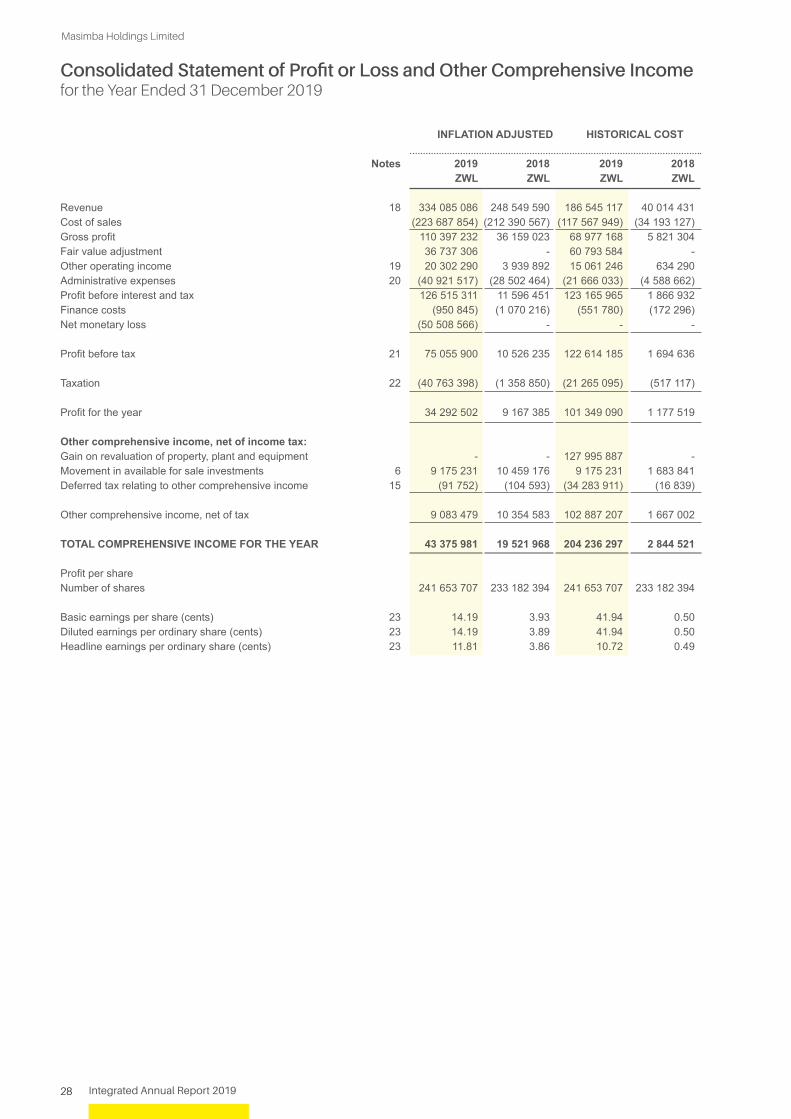
INFLATION ADJUSTED HISTORICAL COST Notes 2019 2018 2019 2018 ZWL ZWL ZWL ZWL Revenue 18 334 085 086 248 549 590 186 545 117 40 014 431 Cost of sales (223 687 854) (212 390 567) (117 567 949) (34 193 127)Gross profit 110 397 232 36 159 023 68 977 168 5 821 304 Fair value adjustment 36 737 306 - 60 793 584 - Other operating income 19 20 302 290 3 939 892 15 061 246 634 290 Administrative expenses 20 (40 921 517) (28 502 464) (21 666 033) (4 588 662)Profit before interest and tax 126 515 311 11 596 451 123 165 965 1 866 932 Finance costs (950 845) (1 070 216) (551 780) (172 296)Net monetary loss (50 508 566) - - - Profit before tax 21 75 055 900 10 526 235 122 614 185 1 694 636 Taxation 22 (40 763 398) (1 358 850) (21 265 095) (517 117) Profit for the year 34 292 502 9 167 385 101 349 090 1 177 519 Other comprehensive income, net of income tax: Gain on revaluation of property, plant and equipment - - 127 995 887 - Movement in available for sale investments 6 9 175 231 10 459 176 9 175 231 1 683 841 Deferred tax relating to other comprehensive income 15 (91 752) (104 593) (34 283 911) (16 839) Other comprehensive income, net of tax 9 083 479 10 354 583 102 887 207 1 667 002 TOTAL COMPREHENSIVE INCOME FOR THE YEAR 43 375 981 19 521 968 204 236 297 2 844 521 Profit per share Number of shares 241 653 707 233 182 394 241 653 707 233 182 394 Basic earnings per share (cents) 23 14.19 3.93 41.94 0.50 Diluted earnings per ordinary share (cents) 23 14.19 3.89 41.94 0.50 Headline earnings per ordinary share (cents) 23 11.81 3.86 10.72 0.49
29Integrated Annual Report 2019
Masimba Holdings Limited
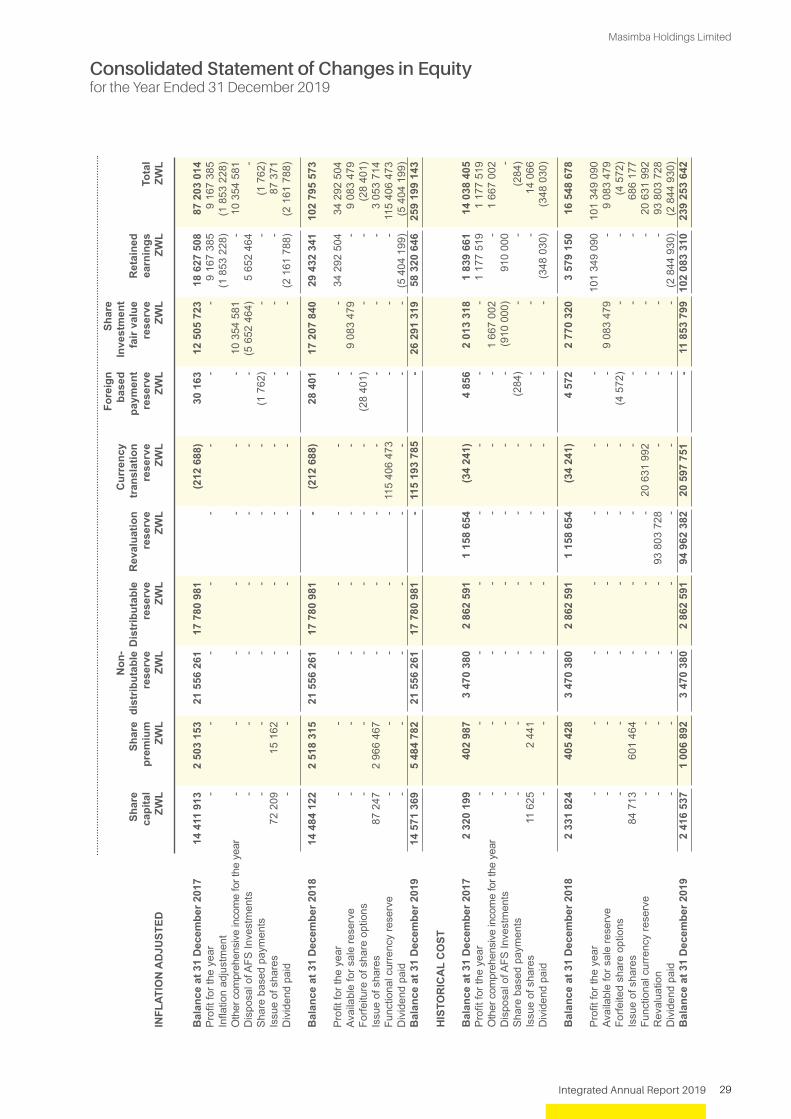
Consolidated Statement of Changes in Equityfor the Year Ended 31 December 2019
HIS
TOR
ICA
L C
OST
Bal
ance
at 3
1 D
ecem
ber 2
017
2
320
199
4
02 9
87
3 4
70 3
80
2 8
62 5
91
1 1
58 6
54
(34
241)
4
856
2
013
318
1
839
661
1
4 03
8 40
5 P
rofit
for t
he y
ear
-
-
-
-
-
-
-
-
1 1
77 5
19
1 1
77 5
19
Oth
er c
ompr
ehen
sive
inco
me
for t
he y
ear
-
-
-
-
-
-
-
1 6
67 0
02
-
1 6
67 0
02
Dis
posa
l of A
FS In
vest
men
ts
-
-
-
-
-
-
-
(910
000
) 9
10 0
00
-
Sha
re b
ased
pay
men
ts
-
-
-
-
-
-
(284
) -
-
(2
84)
Issu
e of
sha
res
11
625
2
441
-
-
-
-
-
-
-
1
4 06
6 D
ivid
end
paid
-
-
-
-
-
-
-
-
(3
48 0
30)
(348
030
) B
alan
ce a
t 31
Dec
embe
r 201
8 2
331
824
4
05 4
28
3 4
70 3
80
2 8
62 5
91
1 1
58 6
54
(34
241)
4
572
2
770
320
3
579
150
1
6 54
8 67
8
Pro
fit fo
r the
yea
r -
-
-
-
-
-
-
101
349
090
10
1 34
9 09
0 Av
aila
ble
for s
ale
rese
rve
-
-
-
-
-
-
-
9 0
83 4
79
- 9
083
479
Fo
rfeite
d sh
are
optio
ns
-
-
-
-
-
-
(4 5
72)
- -
(4 5
72)
Issu
e of
sha
res
84
713
6
01 4
64
-
-
-
-
-
- -
686
177
Fu
nctio
nal c
urre
ncy
rese
rve
-
-
-
-
-
20
631
992
-
-
- 2
0 63
1 99
2 R
eval
uatio
n -
-
-
-
9
3 80
3 72
8
-
-
- -
93
803
728
Div
iden
d pa
id
-
-
-
-
-
-
-
- (2
844
930
) (2
844
930
)B
alan
ce a
t 31
Dec
embe
r 201
9 2
416
537
1
006
892
3
470
380
2
862
591
9
4 96
2 38
2
20
597
751
-
1
1 85
3 79
9 1
02 0
83 3
10
239
253
642
Fo
reig
n Sh
are
N
on-
Cur
renc
y b
ased
In
vest
men
t
Shar
e Sh
are
dis
trib
utab
le D
istr
ibut
able
R
eval
uatio
n tr
ansl
atio
n pa
ymen
t fa
ir va
lue
Ret
aine
d
ca
pita
l pr
emiu
m
rese
rve
rese
rve
rese
rve
rese
rve
rese
rve
rese
rve
earn
ings
To
tal
INFL
ATIO
N A
DJU
STED
ZW
L ZW
L ZW
L ZW
L ZW
L ZW
L ZW
L ZW
L ZW
L ZW
L
B
alan
ce a
t 31
Dec
embe
r 201
7
14 4
11 9
13
2 5
03 1
53
21
556
261
1
7 78
0 98
1
(2
12 6
88)
30
163
1
2 50
5 72
3
18
627
508
8
7 20
3 01
4 P
rofit
for t
he y
ear
-
-
-
-
-
-
-
-
9 1
67 3
85
9 1
67 3
85
Infla
tion
adju
stm
ent
(1 8
53 2
28)
(1 8
53 2
28)
Oth
er c
ompr
ehen
sive
inco
me
for t
he y
ear
-
-
-
-
-
-
-
10
354
581
-
1
0 35
4 58
1 D
ispo
sal o
f AFS
Inve
stm
ents
-
-
-
-
-
-
-
(5
652
464
) 5
652
464
-
S
hare
bas
ed p
aym
ents
-
-
-
-
-
-
(1
762
) -
-
(1
762
)Is
sue
of s
hare
s 72
209
1
5 16
2
-
-
-
-
-
-
-
87
371
Div
iden
d pa
id
-
-
-
-
-
-
-
-
(2 1
61 7
88)
(2 1
61 7
88)
Bal
ance
at 3
1 D
ecem
ber 2
018
14 4
84 1
22
2 5
18 3
15
21
556
261
1
7 78
0 98
1
-
(212
688
) 2
8 40
1
17
207
840
2
9 43
2 34
1
102
795
573
Pro
fit fo
r the
yea
r -
-
-
-
-
-
-
-
3
4 29
2 50
4
34
292
504
Avai
labl
e fo
r sal
e re
serv
e -
-
-
-
-
-
-
9
083
479
-
9
083
479
Fo
rfeitu
re o
f sha
re o
ptio
ns
-
-
-
-
-
-
(28
401)
-
-
(2
8 40
1)Is
sue
of s
hare
s 8
7 24
7
2 9
66 4
67
-
-
-
-
-
-
-
3 0
53 7
14
Func
tiona
l cur
renc
y re
serv
e -
-
-
-
-
11
5 40
6 47
3
-
-
-
115
406
473
D
ivid
end
paid
-
-
-
-
-
-
-
-
(5
404
199
) (5
404
199
)B
alan
ce a
t 31
Dec
embe
r 201
9 14
571
369
5
484
782
2
1 55
6 26
1
17
780
981
-
11
5 19
3 78
5
-
26
291
319
5
8 32
0 64
6
259
199
143
30 Integrated Annual Report 2019
Masimba Holdings Limited
Consolidated Statement of cashflowsfor the Year Ended 31 December 2019
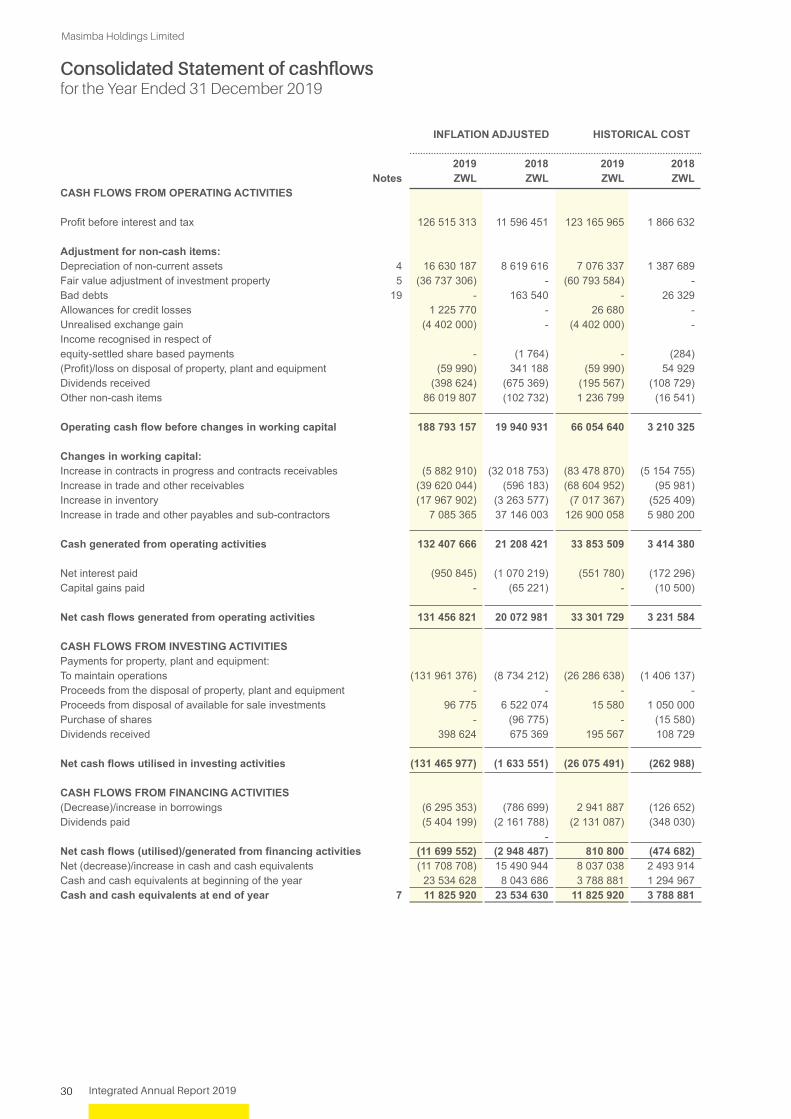
INFLATION ADJUSTED HISTORICAL COST 2019 2018 2019 2018 Notes ZWL ZWL ZWL ZWLCASH FLOWS FROM OPERATING ACTIVITIES Profit before interest and tax 126 515 313 11 596 451 123 165 965 1 866 632 Adjustment for non-cash items: Depreciation of non-current assets 4 16 630 187 8 619 616 7 076 337 1 387 689 Fair value adjustment of investment property 5 (36 737 306) - (60 793 584) - Bad debts 19 - 163 540 - 26 329 Allowances for credit losses 1 225 770 - 26 680 - Unrealised exchange gain (4 402 000) - (4 402 000) - Income recognised in respect of equity-settled share based payments - (1 764) - (284)(Profit)/loss on disposal of property, plant and equipment (59 990) 341 188 (59 990) 54 929 Dividends received (398 624) (675 369) (195 567) (108 729)Other non-cash items 86 019 807 (102 732) 1 236 799 (16 541) Operating cash flow before changes in working capital 188 793 157 19 940 931 66 054 640 3 210 325 Changes in working capital: Increase in contracts in progress and contracts receivables (5 882 910) (32 018 753) (83 478 870) (5 154 755)Increase in trade and other receivables (39 620 044) (596 183) (68 604 952) (95 981)Increase in inventory (17 967 902) (3 263 577) (7 017 367) (525 409)Increase in trade and other payables and sub-contractors 7 085 365 37 146 003 126 900 058 5 980 200 Cash generated from operating activities 132 407 666 21 208 421 33 853 509 3 414 380 Net interest paid (950 845) (1 070 219) (551 780) (172 296)Capital gains paid - (65 221) - (10 500) Net cash flows generated from operating activities 131 456 821 20 072 981 33 301 729 3 231 584 CASH FLOWS FROM INVESTING ACTIVITIES Payments for property, plant and equipment: To maintain operations (131 961 376) (8 734 212) (26 286 638) (1 406 137)Proceeds from the disposal of property, plant and equipment - - - - Proceeds from disposal of available for sale investments 96 775 6 522 074 15 580 1 050 000 Purchase of shares - (96 775) - (15 580)Dividends received 398 624 675 369 195 567 108 729 Net cash flows utilised in investing activities (131 465 977) (1 633 551) (26 075 491) (262 988) CASH FLOWS FROM FINANCING ACTIVITIES (Decrease)/increase in borrowings (6 295 353) (786 699) 2 941 887 (126 652)Dividends paid (5 404 199) (2 161 788) (2 131 087) (348 030) - Net cash flows (utilised)/generated from financing activities (11 699 552) (2 948 487) 810 800 (474 682)Net (decrease)/increase in cash and cash equivalents (11 708 708) 15 490 944 8 037 038 2 493 914 Cash and cash equivalents at beginning of the year 23 534 628 8 043 686 3 788 881 1 294 967 Cash and cash equivalents at end of year 7 11 825 920 23 534 630 11 825 920 3 788 881
31Integrated Annual Report 2019
Masimba Holdings Limited
Company Statement of Financial Positionas at 31 December 2019
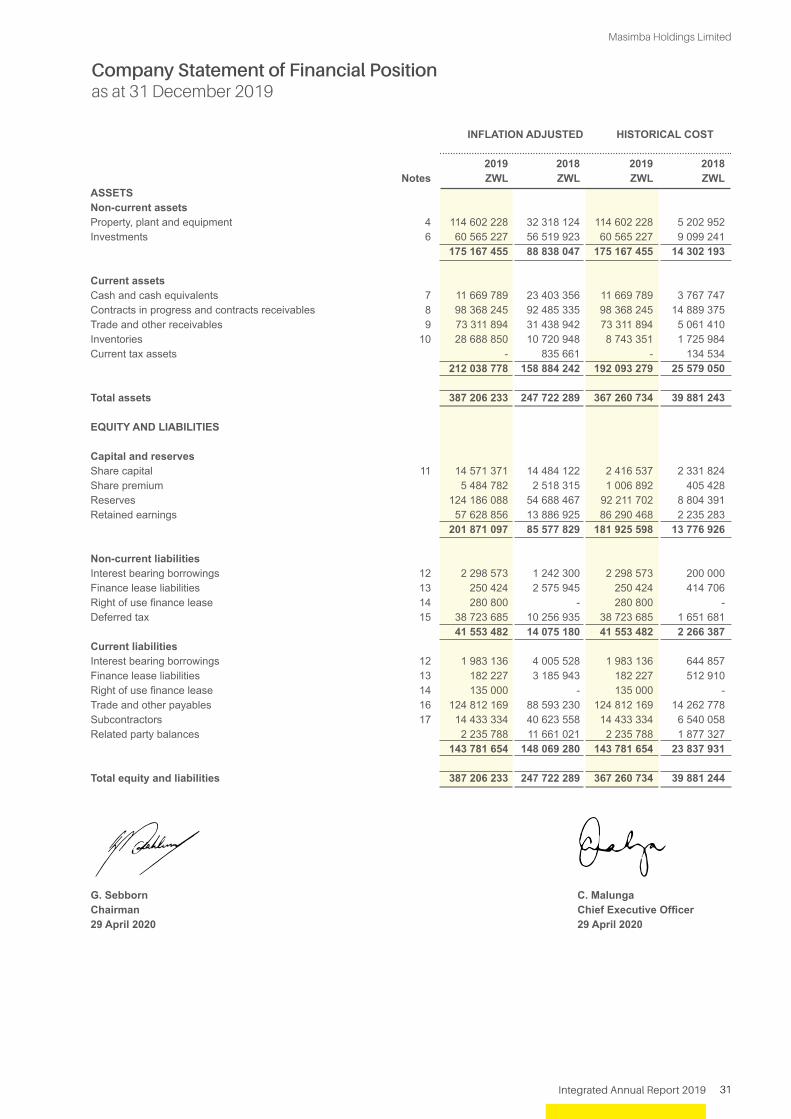
INFLATION ADJUSTED HISTORICAL COST 2019 2018 2019 2018 Notes ZWL ZWL ZWL ZWLASSETS Non-current assets Property, plant and equipment 4 114 602 228 32 318 124 114 602 228 5 202 952 Investments 6 60 565 227 56 519 923 60 565 227 9 099 241 175 167 455 88 838 047 175 167 455 14 302 193 Current assets Cash and cash equivalents 7 11 669 789 23 403 356 11 669 789 3 767 747 Contracts in progress and contracts receivables 8 98 368 245 92 485 335 98 368 245 14 889 375 Trade and other receivables 9 73 311 894 31 438 942 73 311 894 5 061 410 Inventories 10 28 688 850 10 720 948 8 743 351 1 725 984 Current tax assets - 835 661 - 134 534 212 038 778 158 884 242 192 093 279 25 579 050 Total assets 387 206 233 247 722 289 367 260 734 39 881 243 EQUITY AND LIABILITIES Capital and reserves Share capital 11 14 571 371 14 484 122 2 416 537 2 331 824 Share premium 5 484 782 2 518 315 1 006 892 405 428 Reserves 124 186 088 54 688 467 92 211 702 8 804 391 Retained earnings 57 628 856 13 886 925 86 290 468 2 235 283 201 871 097 85 577 829 181 925 598 13 776 926 Non-current liabilities Interest bearing borrowings 12 2 298 573 1 242 300 2 298 573 200 000 Finance lease liabilities 13 250 424 2 575 945 250 424 414 706 Right of use finance lease 14 280 800 - 280 800 - Deferred tax 15 38 723 685 10 256 935 38 723 685 1 651 681 41 553 482 14 075 180 41 553 482 2 266 387 Current liabilities Interest bearing borrowings 12 1 983 136 4 005 528 1 983 136 644 857 Finance lease liabilities 13 182 227 3 185 943 182 227 512 910 Right of use finance lease 14 135 000 - 135 000 - Trade and other payables 16 124 812 169 88 593 230 124 812 169 14 262 778 Subcontractors 17 14 433 334 40 623 558 14 433 334 6 540 058 Related party balances 2 235 788 11 661 021 2 235 788 1 877 327 143 781 654 148 069 280 143 781 654 23 837 931 Total equity and liabilities 387 206 233 247 722 289 367 260 734 39 881 244
G. Sebborn C. MalungaChairman Chief Executive Officer29 April 2020 29 April 2020
32 Integrated Annual Report 2019
Masimba Holdings Limited
Company Statement of Profit or Loss and Other Comprehensive Incomefor the Year Ended 31 December 2019
INFLATION ADJUSTED HISTORICAL COST
Notes 2019 2018 2019 2018 ZWL ZWL ZWL ZWL
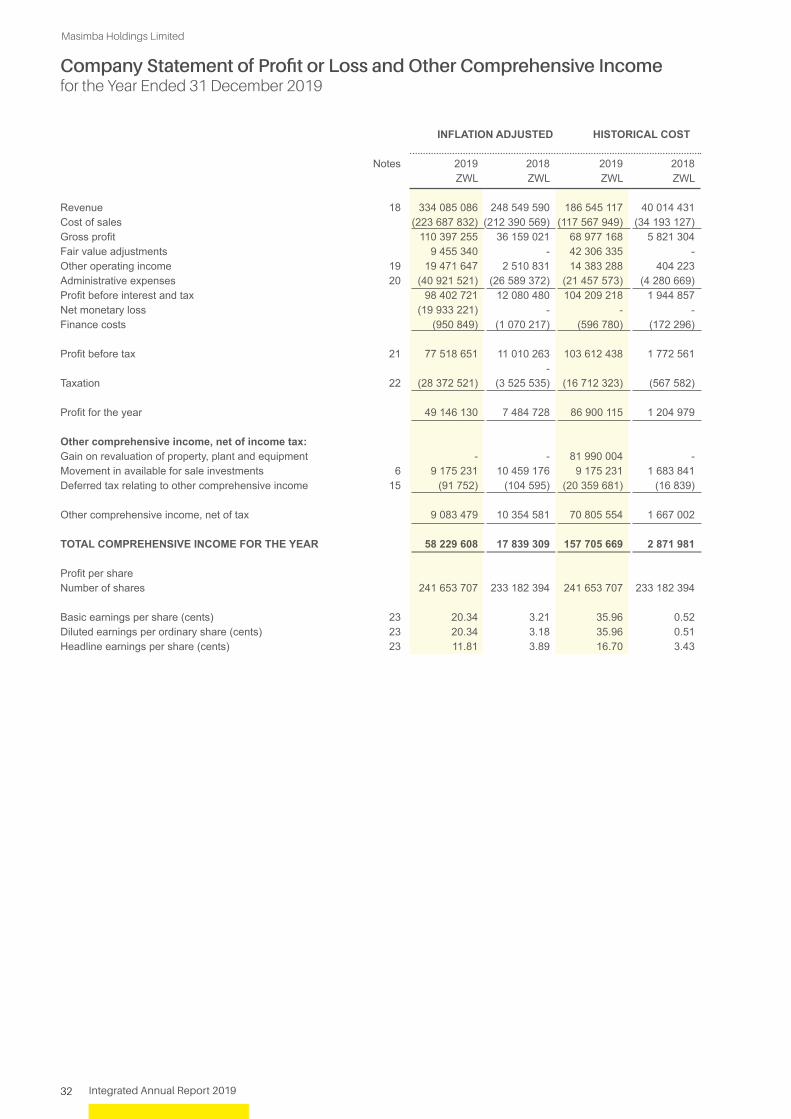
Revenue 18 334 085 086 248 549 590 186 545 117 40 014 431 Cost of sales (223 687 832) (212 390 569) (117 567 949) (34 193 127)Gross profit 110 397 255 36 159 021 68 977 168 5 821 304 Fair value adjustments 9 455 340 - 42 306 335 - Other operating income 19 19 471 647 2 510 831 14 383 288 404 223 Administrative expenses 20 (40 921 521) (26 589 372) (21 457 573) (4 280 669)Profit before interest and tax 98 402 721 12 080 480 104 209 218 1 944 857 Net monetary loss (19 933 221) - - - Finance costs (950 849) (1 070 217) (596 780) (172 296) Profit before tax 21 77 518 651 11 010 263 103 612 438 1 772 561 - Taxation 22 (28 372 521) (3 525 535) (16 712 323) (567 582) Profit for the year 49 146 130 7 484 728 86 900 115 1 204 979 Other comprehensive income, net of income tax: Gain on revaluation of property, plant and equipment - - 81 990 004 - Movement in available for sale investments 6 9 175 231 10 459 176 9 175 231 1 683 841 Deferred tax relating to other comprehensive income 15 (91 752) (104 595) (20 359 681) (16 839) Other comprehensive income, net of tax 9 083 479 10 354 581 70 805 554 1 667 002 TOTAL COMPREHENSIVE INCOME FOR THE YEAR 58 229 608 17 839 309 157 705 669 2 871 981 Profit per share Number of shares 241 653 707 233 182 394 241 653 707 233 182 394 Basic earnings per share (cents) 23 20.34 3.21 35.96 0.52 Diluted earnings per ordinary share (cents) 23 20.34 3.18 35.96 0.51 Headline earnings per share (cents) 23 11.81 3.89 16.70 3.43

33Integrated Annual Report 2019
Masimba Holdings Limited
Company Statement of Changes in Equityfor the Year Ended 31 December 2019
HIS
TOR
ICA
L C
OST
Bal
ance
at 1
Jan
uary
201
7
2
320
199
4
02 9
87
2 5
44 4
61
3 4
85 0
35
- 4
856
2
013
321
4
68 3
33
11
239
192
Pro
fit fo
r the
yea
r
-
-
-
-
- -
-
1
204
979
1
204
979
Av
aila
ble
for s
ale
rese
rve
-
-
-
-
-
-
1 6
67 0
02
-
1 6
67 0
02
Dis
posa
l of A
FS In
vest
men
ts
-
-
-
-
-
-
(910
000
) 9
10 0
00
-
Sha
re b
ased
pay
men
ts
-
-
-
-
-
(284
) -
-
(2
84)
Issu
e of
sha
res
1
1 62
5
2 4
41
-
-
- -
-
-
1
4 06
6 D
ivid
end
paid
-
-
-
-
- -
-
(3
48 0
30)
(348
030
)
Bal
ance
at 3
1 D
ecem
ber 2
018
2
331
824
4
05 4
28
2 5
44 4
61
3 4
85 0
35
-
4 5
72
2 7
70 3
23
2 2
35 2
83
13
776
926
Pro
fit fo
r the
yea
r
-
-
-
-
- -
-
8
6 90
0 11
5
86
900
115
Avai
labl
e fo
r sal
e re
serv
e
-
-
-
-
- -
9
083
479
-
9
083
479
Fo
rfeite
d sh
are
optio
ns
-
-
-
-
(4 5
72)
-
-
(4 5
72)
Issu
e of
sha
res
84
713
6
01 4
64
-
-
- -
-
-
6
86 1
77
Cur
renc
y tra
nsla
tion
-
-
-
1
2 60
6 32
9
-
-
-
-
12
606
329
Rev
alua
tion
surp
lus
-
-
-
-
6
1 72
2 07
5
-
-
-
61
722
075
Div
iden
d pa
id
-
-
-
-
-
-
-
(2 8
44 9
30)
(2 8
44 9
30)
Bal
ance
at 3
1 D
ecem
ber 2
019
2
416
537
1 0
06 8
92
2 5
44 4
61
16
091
364
6
1 72
2 07
5
-
11
853
802
8
6 29
0 46
8
181
925
598
Non
-dis
tribu
tabl
e re
serv
es a
rose
as
a re
sult
of th
e ch
ange
in fu
nctio
nal c
urre
ncy
from
RTG
S d
olla
rs to
Uni
ted
Sta
tes
Dol
lars
Fo
reig
n
Shar
e
N
on-
curr
ency
Bas
ed
Sh
are
Shar
e d
istr
ibut
able
tr
ansl
atio
n R
eval
uatio
n pa
ymen
t Fa
ir va
lue
Ret
aine
d
ca
pita
l pr
emiu
m
rese
rve
rese
rve
rese
rve
rese
rve
rese
rve
earn
ings
To
tal
INFL
ATIO
N A
DJU
STED
ZWL
ZWL
ZWL
ZWL
ZWL
ZWL
ZWL
ZWL
ZWL
Bal
ance
at 1
Jan
uary
201
7
1
4 41
1 91
3
2 5
03 1
53
15
804
916
2
1 64
7 29
1
-
30
163
1
2 50
5 74
1
2 9
11 5
21
69
814
698
Pro
fit fo
r the
yea
r
-
-
-
-
-
-
-
7 4
84 7
28
7 4
84 7
28
Avai
labl
e fo
r sal
e re
serv
e
-
-
-
-
-
-
10
354
584
-
1
0 35
4 58
4 D
ispo
sal o
f AFS
Inve
stm
ents
-
-
-
-
-
-
(5 6
52 4
64)
5 6
52 4
64
-
Sha
re b
ased
pay
men
ts
-
-
-
-
-
(1
764
) -
-
(1
764
)Is
sue
of s
hare
s
72
209
1
5 16
2
-
-
-
-
-
-
87
371
Div
iden
d pa
id
-
-
-
-
-
-
-
(2
161
788
) (2
161
788
)
Bal
ance
at 3
1 D
ecem
ber 2
018
14
484
122
2
518
315
1
5 80
4 91
6
21
647
291
-
2
8 39
9
17
207
861
1
3 88
6 92
5
85
577
829
Pro
fit fo
r the
yea
r
-
-
-
-
-
-
4
9 14
6 13
0
49
146
130
Forfe
iture
of s
hare
opt
ions
- -
- -
- (4
2 05
3)
- -
(42
053)
Issu
e of
sha
res
8
7 24
9
2 9
66 4
67
-
-
-
-
-
3
053
716
R
esta
tem
ent
-
-
-
6
9 53
9 67
4
-
-
-
-
69
539
674
Div
iden
d pa
id
-
-
-
-
-
-
(5 4
04 1
99)
(5 4
04 1
99)
Bal
ance
at 3
1 D
ecem
ber 2
019
1
4 57
1 37
1
5 4
84 7
82
15
804
916
9
1 18
6 96
5
-
(13
654)
1
7 20
7 86
1
57
628
856
20
1 87
1 09
7

34 Integrated Annual Report 2019
Masimba Holdings Limited
Company Statement of Cashflowsfor the Year Ended 31 December 2019 INFLATION ADJUSTED HISTORICAL COST 2019 2018 2019 2018 Notes ZWL ZWL ZWL ZWLCASH FLOWS FROM OPERATING ACTIVITIES
Profit before interest and tax 98 402 721 12 080 480 104 209 218 1 944 857 Adjustment for non-cash items: Depreciation of non-current assets 4 16 035 306 8 019 821 6 898 201 1 291 125 Bad debts 20 - 163 543 - 26 329 Unrealised exchange gain (4 402 000) - (4 402 000) - Fair Value adjustments (9 455 340) - (42 306 335) - Income recognised in respect of equity-settled share based payments - (1 764) - (284)(Profit)/Loss on disposal of property, plant and equipment (59 990) 341 191 (59 990) 54 929 Dividends received (398 624) (675 370) (195 567) (108 729)Other non-cash items 18 664 267 (10 956) 10 115 915 (1 762) Operating cash flow before changes in working capital 118 786 340 19 916 945 74 259 442 3 206 465 Changes in working capital: Increase in contracts in progress and contracts receivables (5 882 911) (32 018 753) (83 478 871) (5 154 755)(Increase)/decrease in trade and other receivables (41 872 952) 1 371 878 (68 250 484) 220 861 Increase in inventory (17 967 902) (3 263 577) (7 151 901) (525 409)(Increase)/decrease in related party balances (9 425 233) 498 659 358 460 80 280 Increase in trade and other payables and sub-contractors 10 028 715 34 926 264 118 442 667 5 622 840 Cash generated from operating activities 53 666 057 21 431 415 34 179 313 3 450 282 Net interest paid (950 849) (1 070 216) (596 780) (172 296)Capital gains tax paid - (65 221) - (10 500) Net cash flows generated from operating activities 52 715 208 20 295 978 33 582 533 3 267 486 CASH FLOWS FROM INVESTING ACTIVITIES Payments for property, plant and equipment: To maintain operations (98 319 502) (8 734 212) (26 702 438) (1 406 137)Proceeds from the disposal of property, plant and equipment - - - - Proceeds from disposal of available for sale investments 96 775 6 522 077 15 580 1 050 000 Purchase of shares - (96 775) - (15 580)Dividends received 398 624 675 370 195 567 108 729 Net cash flows utilised in investing activities (97 824 103) (1 633 540) (26 491 291) (262 988) CASH FLOWS FROM FINANCING ACTIVITIES (Decrease)/increase in in interest bearing borrowings (6 295 356) (786 699) 2 941 887 (126 652)Dividends paid (2 917 623) (2 161 788) (2 131 087) (348 030) Net cash flows utilised/received in financing activities (9 212 979) (2 948 487) 810 800 (474 682)Net (decrease)/increase in cash and cash equivalents (11 733 568) 15 713 951 7 902 042 2 529 816 Cash and cash equivalents at beginning of the year 23 403 356 7 689 405 3 767 747 1 237 931 Cash and cash equivalents at end of year 7 11 669 789 23 403 356 11 669 789 3 767 747

35Integrated Annual Report 2019
Masimba Holdings Limited
1 General Information
Masimba Holdings Limited (the Group) is a limited company incorporated in the Republic of Zimbabwe. The address of its registered office is 44 Tilbury Road, Willowvale, Harare, Zimbabwe.
1.1 Nature of Business
The principal activities of the Group are civil engineering, roads and earthworks, building contracting and property development. The Company operates under the trade name Masimba Construction Zimbabwe.
1.2 Functional and Presentation Currency
The consolidated financial statements are presented in Zimbabwe Dollars (ZWL), being the functional and reporting currency of the primary economic environment in which the Group operates. The Group adopted the ZWL as the new functional and reporting currency with effect from 1 March 2019.
In 2018, the economic environment had started to show signs of distortions wherein the economy was moving towards a ‘multi-tiered’ pricing regime, in which similar goods and services were being priced differently depending on the mode of payment, whether United Stated Dollar (US$) cash, electronic payment, mobile money or bond notes and coins. The 2018 to 2019 operating environment was characterised by significant monetary and fiscal policy reforms that commenced in October 2018.
The determination of fair values presented in the financial statements is affected by the prevailing economic environment. In February 2019, the Government of Zimbabwe issued Statutory Instrument SI 33 of 2019 which directed that balances and transactions that were in US$ before 20 February 2019 be deemed to be denominated in Real Time Gross Settlement (RTGS) Dollars at a rate of 1:1. This rate was used in the months of January and February 2020. The Group has complied with the requirements of SI 33 of 2019 as all balances were translated at a rate of 1:1 until 20 February 2020. Transactions done for the period January and February 2019 were not restated as they were translated at the prevailing exchange rate of 1:1.
These consolidated financial statements are presented in the ZWL which was designated as the sole transactional and functional currency through SI 33 of 2019 of 2019 and Statutory Instrument 142 of 2019 (SI 142) dated 24 June 2019.
1.3 Inflation Adjustment
These results have been prepared under the current cost basis in line with the provisions of International Financial Reporting Standards (IAS) 29: Financial Reporting in Hyperinflationary Economies. The Public Accountants and Auditors Board (PAAB) pronounced that the economy is trading under conditions of hyperinflation in line with IAS 29 (Pronouncement 1/2019). The Directors have applied the guidelines provided by the PAAB and made various assumptions to produce the inflation adjusted financials.
The Group adopted the Zimbabwe Consumer Price Index (CPI) as a general price index to restate transactions and balances as appropriate. Non-monetary assets and liabilities have been restated to reflect the changes in the general price index. Monetary assets and liabilities and non monetary assets and liabilities carried at revalued amounts have not been restated as they are presented at the measuring unit prevailing at the end of the reporting period. Items recognised in the statement of comprehensive income have been restated by applying the change in the general price index from the dates when the transactions were initially earned or incurred.
The conversion factors used to restate the Group’s financial results are as follows:
Date Indices Conversion Factor 31 December 2019 551.63 1.00 31 December 2018 88.81 6.21 31 December 2017 61.13 9.02
1.4 Use of Significant Judgements
In preparation of these consolidated financial statements management has made judgements, estimates and assumptions that affect the application of the Group’s accounting policies and the reported amount of assets, liabilities, income and expenses.
a) Valuation of Properties The valuation was undertaken using the appropriate methodology and professional judgement of the valuers.
For all the properties, that is investment properties and owner occupied properties, the Group engaged independent external valuers, Intergrated Properties (Private) Limited and Old Mutual Zimbabwe Properties (Private) Limited. Due to the lack of market evidence of the ZWL transactions in the transition period, the properties were valued in US$ and translated to ZWL at the closing interbank rate of 16.7734.
Statement of Accounting Policies for the Year Ended 31 December 2019
Masimba Holdings Limited
Statement of Accounting Policies / continued for the Year Ended 31 December 2019
36 Integrated Annual Report 2019
b) Valuation of Other Property, Plant and Equipment The Directors’ valuation was made at the end of the reporting period. The Group maintained a US$ asset register which was
translated to ZWL using the closing interbank rate of 16,7734.
c) The entity makes estimates and assumptions concerning the future The resulting accounting estimates will, by definition, seldom equal the related actual results. The most significant estimates
and assumptions made in the preparation of these consolidated financial statements are discussed below: Revenue recognition and contract accounting
The entity uses certain assumptions and key factors in the management of and reporting for its contracting arrangements.
These assumptions are material and relate to:
• The estimation of costs to completion and the determination of the percentage of completion, • The recoverability of under claims, • The recognition of penalties and claims on contracts, and • The recognition of contract incentives.
Management is satisfied that at year end the Company met its performance obligations under contracts and the recognition of
revenue is appropriate. Other estimates made:
The entity also makes estimates for:
• The calculation of the provision for credit losses. In determining recoverability of trade receivables, the Group considers any changes in the credit quality of the trade receivable from the date credit was initially granted up to the reporting date. The Group therefore recognises an allowance for credit losses against receivables on a case by case basis.
• The determination of useful lives and residual values of items of property, plant and equipment. • The determination of the fair value of share options.
2. Adoption of New and Revised International Financial Reporting Standards (IFRSs).
2.1 New and revised IFRS affecting amounts reported and/or disclosures in the financial statements.
In the current year, the Group applied a number of new and revised IFRSs issued by the International Accounting Standards Board (IASB) that are mandatorily effective for an accounting period that begins on or after 1 January 2019. The amended standards, described below, did not have a material impact on the financial position or performance of the Group:
2.1.1 IFRS 16 Leases, effective for financial years commencing on or after 1 January 2019. The IFRS replaced IAS 17 and related interpretations. It completes the IASB’s long running project to overhaul lease accounting.
Leases will be recorded on the statement of financial position in the form of a right-of-use asset and lease liability. The company has applied IFRS 16 using the modified retrospective approach and therefore the comparative information has not been restated and continues to be reported under IAS 17 and IFRIC 4.
2.2 New and revised IFRS in issue but not mandatorily effective and not adopted at the reporting date
2.2.1 Amendments to IFRS 9: Prepayments Features with Negative Compensation. The amendments to IFRS 9 clarify that for the purpose of assessing whether a prepayment feature meets the Solely Payments
of Principal and Interest (SSPI) condition, the party exercising the option may pay or receive reasonable compensation for the prepayment irrespective of the reason for prepayment, in other words prepayment features with negative compensation do not automatically fail SPPI. This standard is effective for periods beginning on or after 1 January 2018.
2.2.2 Amendments to IAS 28: Long term interests in associates and Joint Ventures. The amendment clarifies that IFRS 9, including its impairments requirements applies to long term interests. Furthermore, in
applying IFRS 9 to long term interests, an entity does not take into account adjustments to their carrying amount required by IAS 28 (thus adjustments to the carrying amount of long term interests arising from the allocation of losses of the investee or assessment of impairment in accordance with IAS 28). The amendments apply retrospectively to annual reporting periods beginning on or after 1 January 2019, with earlier adoption being permissible.
The amendments defer to the effective date of the September 2014 amendments of IFRS 10 and IAS 20 indefinitely until the research project on the equity method has been concluded.
The Directors do not anticipate that the application of the amendments in the future will have a material impact on the Group’s consolidated financial statements.
Masimba Holdings Limited
Statement of Accounting Policies / continued for the Year Ended 31 December 2019
37Integrated Annual Report 2019
2.3 New and revised IFRS standards in issue but not yet effective
2.3.1 IFRS 17: Insurance contracts, effective for periods beginning on or after 1 January 2021. The new standard establishes the principles for the recognition, measurement, presentation and disclosure of insurance contracts
and supersedes IFRS 4: Insurance contracts.
Adoption of this standard will not have a material impact on the Group’s performance in the future.
2.3.2 IFRS 10: Consolidated Financial Statements IFRS 10: Consolidated Financial Statements and IAS 28: (Amendments) Sale or Contribution of Assets between an Investor and
its Associate or Joint Venture. The amendments to IFRS 10 or IAS 28 deal with situations where there is a sale or contributions of assets between an investor and its associate or joint venture. Specifically, the amendment states that gains or losses resulting from the loss of control of a subsidiary that does not contain a business in a transaction with an associate or joint venture is accounted for using the equity method, are recognised in the parent’s profit or loss only to the extent of unrelated investor’s interests in that associate or joint venture. Similarly gains or losses resulting from the remeasurement of investment is retained in any former subsidiary that has become an associate or joint venture that is accounted for using the equity method to fair value are recognised in the former parent’s profit or loss only to the extent of the unrelated investors interests in the new associate or joint venture. Effective for periods beginning on or after 1 January 2019.
The amendments defer the effective dates of the September 2014 amendments of IFRS 10 and IAS 28 indefinitely until the research project on this equity method has been concluded.
Accordingly, the amendments to IFRS 10 and IAS 28 have been returned to the IFRSs issued but not yet effective section.
2.3.3 Amendments to IFRS 3: Definition of a business. The amendments clarify that while businesses usually have outputs, these are not required for an integrated set of activities and
assets to qualify as a business. To be considered a business an acquired set of activities and assets must include, at a minimum, an input and a substantive process that together significantly contribute to the ability to create outputs.
Additional guidance is provided that helps to determine whether a substantive process has been acquired. The amendments introduce an optional concentration test that permits a simplified assessment of whether an acquired set of activities and assets is not a business. Under the optional concentration test, the acquired set of activities and assets is not a business if substantially all of the fair value of the gross assets acquired is concentrated in a single identifiable asset or group of similar assets. The amendments are applied retrospectively to all business combinations and asset acquisitions for which the acquisition date is on or after the first annual reporting period beginning on or after 1 January 2020, with early application permitted.
2.3.4 Amendments to IAS 1 and IAS 8: Definition of material The amendments are intended to make the definition of material in IAS 1 easier to understand and are not intended to alter the
underlying concept of materiality in IFRS standards. The concept of ‘obscuring’ material information with immaterial information has been included as part of the new definition.
The threshold for materiality influencing users has been changed from “could influence” to could reasonably be expected to influence.
The definition of material in IAS 8 has been replaced by a reference to the definition of material in IAS1. In addition, the International Accounting Standards Board (IASB) amended other standards and the Conceptual Framework that contain a definition of material or refer to the term ‘material’ to ensure consistency.
The amendments are applied prospectively for annual periods beginning on or after 1 January 2020 with earlier application permitted.
3 Summary of significant accounting policies
3.1 Statement of compliance
These consolidated financial statements have been prepared in conformity with International Financial Reporting Standards, promulgated by the International Accounting Standards Board (IASB), which includes standards and interpretations approved by IASB.
3.2 Basis of preparation
The Group’s financial statements have been prepared in accordance with International Financial Reporting Standards (IFRSs), the International Financial Reporting Interpretations Committee (IFRIC) Interpretations and the Zimbabwe Companies and other Business Entities Act (Chapter 24:31) and related statutory instruments. With the exceptions noted as in policy 2.2 above,

Masimba Holdings Limited
Statement of Accounting Policies / continued for the Year Ended 31 December 2019
38 Integrated Annual Report 2019
“Application of new and revised IFRSs”, the accounting policies set out below have been consistently applied from the previous year and throughout the current year. These financial statements are presented in Zimbabwe Dollars (ZWL) being the functional and reporting currency of the primary economic environment in which the Company operates. The preparation of financial statements requires the use of estimates and assumptions that affect the reported amounts of assets and liabilities, disclosure of contingent assets and liabilities at the date of the financial statements and the reported amounts of revenues and expenses during the reported period. Although these estimates are based on managements’ best knowledge of current events and actions, actual results may ultimately differ from those estimates.
The estimates and underlying assumptions are reviewed on an ongoing basis. Revisions to accounting estimates are recognised in the period in which the estimate is revised if the revision affects only that period or in the period of the revision and future periods if the revision affects both current and future periods.
Judgements made by management in the application of International Financial Reporting Standards (IFRSs) that have a significant effect on the financial statements, and significant estimates made in the preparation of these consolidated financial statements are discussed in Note 1.4.
3.3 Basis of consolidation
The consolidated financial statements incorporate the financial statements of the Company (including structured entities) controlled by the Company and its subsidiaries. Control is achieved when the Company:
• has power over the investee;• is exposed, or has rights, to variable returns from its involvement with the investee; and • has the ability to use its power to affect its returns. The Company reassesses whether or not it controls an investee if facts
and circumstances indicate that there are changes to one or more of the three elements of control listed above.
When the Company has less than a majority of voting rights of an investee, it has power over the investee when the voting rights are sufficient to give it the practical ability to direct the relevant activities of the investee unilaterally. The Company considers all relevant facts and circumstances in assessing whether or not the Company’s voting rights in an investee are sufficient to give it power including:
• the size of the Company’s holding of voting rights relative to the size and dispersion of holdings of the other vote holders; • potential voting rights held by the Company, other vote holders or other parties; • rights arising from other contractual arrangements; and • any additional facts and circumstances that indicate that the Company has or does not have the current ability to direct
the relevant activities at the time that the decisions need to be made, including voting patterns at previous Shareholders’ meetings.
Consolidation of a subsidiary begins when the Company obtains control over the subsidiary and ceases when the Company loses control of the subsidiary. Specifically, income and expenses of a subsidiary acquired or disposed of during the year are included in the consolidated statement of profit or loss and other comprehensive income from the date the Company gains control until the date when the Company ceases to control the subsidiary.
Profit or loss and each component of other comprehensive income are attributable to the owners of the Company and to the non-controlling interests even if this results in the non-controlling interests having a deficient balance. When necessary, adjustments are made to the financial statements of subsidiaries to bring their accounting policies into line with the Group’s accounting policies. All intragroup assets and liabilities, equity, income, expenses and cash flows relating to transactions between members of the Group are eliminated in full on consideration.
3.3.1 Changes in the Group’s ownership interest in existing subsidiaries Changes in the Group’s ownership interests in subsidiaries that do not result in the Group losing control over the subsidiaries
are accounted for as equity transactions. The carrying amounts of the Group’s interest and the non-controlling interests are adjusted to reflect the changes in their relative interests in the subsidiaries. Any difference between the amount by which the non-controlling interests are adjusted and the fair value of the consideration paid or received is recognised directly in equity and attributed to owners of the Company.
When the Group loses control of a subsidiary, a gain or loss is recognised in profit or loss and is calculated as the difference between (i) the aggregate of the fair value of the consideration received and the fair value of any retained interest and (ii) the previous carrying amount of the assets (including goodwill) and liabilities of the subsidiary and any non-controlling interests. All amounts previously recognised in other comprehensive income in relation to that subsidiary are accounted for as if the Group had directly disposed of the related assets or liabilities of the subsidiary (i.e. reclassified to profit or loss or transferred to another category of equity as specified/permitted by applicable IFRSs). The fair value of any investment retained in the former subsidiary at the date when control is lost is regarded as the fair value on initial recognition for subsequent accounting under IAS 39, when applicable, the cost on initial recognition of an investment in an associate or a joint venture.

Masimba Holdings Limited
Statement of Accounting Policies / continued for the Year Ended 31 December 2019
39Integrated Annual Report 2019
3.4 Business combinations
Acquisitions of subsidiaries and businesses are accounted for using the acquisition method. The consideration transferred in a business combination is measured at fair value, which is calculated as the sum of the acquisition - date of fair values of the assets transferred by the Group, liabilities incurred by the Group to the former owners of the acquiree and the equity interests issued by the Group, in exchange for the control of the acquiree. Acquisition related costs are generally recognised in profit or loss as incurred.
At acquisition date, the identifiable assets acquired and the liabilities assumed are recognised at the fair value except that:
• deferred tax assets or liabilities and liabilities or assets related to employee benefit arrangements are recognized and measured in accordance with IAS 12 Income Taxes and IAS 19 Employee Benefits respectively;
• liabilities or equity instruments related to the replacement by the Group of an acquirer’s share- based payments awards are measured in accordance with IFRS 2 Share-based Payment; and
• Assets (or disposal groups) that are classified as held for sale in accordance with IFRS 5 Non- current Assets Held for Sale and Discontinued Operations are measured in accordance with that Standard.
3.5 Interests in joint ventures
When a Group entity undertakes its activities directly under joint arrangements, the Group’s share of jointly controlled assets and any liabilities incurred jointly with other ventures are recognised in the financial statements of the relevant entity and classified according to their nature. Liabilities and expenses incurred directly in respect of interests in jointly controlled assets are accounted for on an accrual basis. Income from the sale or use of the Group’s share of the output of jointly controlled assets, and its share of joint venture expenses, are recognised when it is probable that the economic benefits associated with the transaction will flow to/from the Group and their amount can be measured reliably.
Joint venture arrangements that involve the establishment of a separate entity, in which each venture has an interest, are referred to as jointly controlled entities.
The Group reports its interests in jointly controlled entities using proportionate consolidation, except when the investment is classified as held for sale, in which case it is accounted for in accordance with IFRS 5 Non-current Assets Held for Sale and Discontinued Operations. The Group’s share of the assets, liabilities, income and expenses of jointly controlled entities is combined with the equivalent items in the consolidated financial statements on a line-by-line basis.
Any goodwill arising on the acquisition of the Group’s interest in a jointly controlled entity is accounted for in accordance with the Group’s accounting policy for goodwill arising in a business combination (see note 3.4 above).
When a Group entity transacts with its jointly controlled entity, profits and losses resulting from the transactions with the jointly
controlled entity are recognised in the Group’s consolidated financial statements only to the extent of interest in the jointly controlled entity that are not related to the Group.
3.6 Revenue recognition
Revenue is measured based on the consideration to which the Group expects to be entitled in a contract with a customer. The Group recognises revenue when it transfers control to the customer.
3.6.1 Long-term and construction contracts Where the outcome of a long-term and construction contract can be measured reliably, revenue and costs are recognised by
reference to the stage of completion of the contract at the statement of financial position date, as measured by the proportion that contract costs incurred for work to date bear to the estimated total contract costs, except where this would not be representative of the stage of completion. Variations in contract work, claims and incentive payments are included to the extent that collection is probable and the amounts can be measured reliably. Anticipated losses to completion are recognised immediately as an expense in contract costs. This method is an appropriate measure of the progress towards complete satisfaction of these performance obligations under IFRS 15. The Group becomes entitled to invoice customers on long term construction contracts based on achieving a series of performance related milestones. When a particular milestone is achieved the customer is sent the relevant statement of work signed by a third party assessor and an invoice for the related milestone payment.
Where the outcome of the long-term and construction contracts cannot be reliably determined, contract revenues are recognised to the extent that the recoverability of incurred costs is probable. Contract costs are recognised as expenses in the period in which they are incurred.

Masimba Holdings Limited
Statement of Accounting Policies / continued for the Year Ended 31 December 2019
40 Integrated Annual Report 2019
When contract costs incurred to date plus recognised profit less recognised losses exceed progress billings, the surplus is shown as amounts due from customers for contract work. For contracts where progress billings exceed contract costs incurred to date plus recognised profit less recognized losses, the surplus is shown as the amount due to customers for contract work. Amounts received before the related work is performed are included in the consolidated statement of financial position, as a liability, as advances received. Amounts billed for work performed but not yet paid by the customer are included in the consolidated statement of financial position under contracts in progress and contracts receivables.
3.6.2 Dividend and interest revenue Dividend revenue from investments is recognised when the Shareholder’s right to receive payment has been established.
Interest income from financial assets is recognised when it is probable that the economic benefits will flow to the Group and the amount of income can be measured reliably. Interest revenue is accrued on a time basis, by reference to the principal outstanding and at the effective interest rate that exactly discounts estimated future cash receipts through the expected life of the financial asset to that asset’s net carrying amount.
3.6.3 Rental income Rental income from investment properties is recognised on a straight line basis over the term of the relevant lease.
3.7 Property, plant and equipment
Property, plant and equipment are tangible assets that the Group holds for its own use or for rental to others and which the Group expects to use for more than one period. The consumption of property, plant and equipment is reflected through a depreciation charge designed to reduce the asset to its residual value over its useful life.
3.7.1 Measurement Property, plant and equipment are shown at cost less the related depreciation. It is the policy of the Group to revalue its property,
plant and equipment frequently enough to ensure that the fair value of a revalued asset does not differ materially from its carrying amount. Any revaluation increase arising is recognised in other comprehensive income, except to the extent that it reverses a revaluation decrease for the same asset previously recognised in profit or loss, in which case the increase is credited to profit or loss to the extent of the decrease previously expensed. A decrease in the carrying amount arising on revaluation is recognised in profit or loss to the extent that it exceeds the balance, if any, held in the revaluation reserve of that asset.
3.7.2 Subsequent costs Subsequent costs are included in an asset’s carrying value only when it is probable that future economic benefits associated with
the item will flow to the Group and the cost of the item can be measured reliably.
3.7.3 Components The amount initially recognised in respect of an item of property, plant and equipment is allocated to its significant components
and where they have different useful lives, are recorded and depreciated separately. The remainder of the cost, being the parts of the item that are individually not significant or have similar useful lives, are grouped together and depreciated as one component.
3.7.4 Depreciation Depreciation is recognised so as to write off the cost or valuation of assets (other than freehold land and properties under
construction) less their residual values over their useful lives, using the straight-line method. The estimated useful lives, residual values and depreciation method are reviewed at the end of each reporting period, with the effect of any changes in estimate accounted for on a prospective basis.
The following average useful lives are used in the calculation of depreciation:
Land is not depreciated Buildings 40 years On a straight - line basis
Plant and equipment 4-10 years On a straight - line basis Motor vehicles 5 years On a straight - line basis
Other Assets 3-10 years On a straight - line basis
The property, plant and equipment’s residual values and useful lives are reviewed, and adjusted if appropriate, at each financial year end. The estimated useful life is based on expected usage of the asset and expected physical wear and tear, which depends on operational factors such as number of shifts for which the asset is to be used and the repair and maintenance program and technological obsolescence arising from changes and residual value.
At each statement of financial position date the Group assesses whether there is any indication that an asset may be impaired.
Masimba Holdings Limited
Statement of Accounting Policies / continued for the Year Ended 31 December 2019
41Integrated Annual Report 2019
If any such indication exists, the asset is tested for impairment by estimating the recoverable amount of the related asset. Irrespective of whether there is any indication of impairment, an intangible asset with an indefinite useful life, intangible assets not yet available for use and goodwill acquired in a business combination, are tested for impairment on an annual basis.
When performing impairment tests, the recoverable amount is determined for the individual asset for which an objective indication of impairment exists. If the asset does not generate cash flows from continuing use that are largely independent from other assets or group of assets, the recoverable amount is determined for the cash generating unit (CGU) to which the asset belongs.
Recoverable amount is the higher of fair value less costs to sell and value in use. In assessing value in use, the estimated future
cash flows are discounted to their present value using a pre-tax discount rate that reflects current market assessments of the time value of money and the risks specific to the asset for which the estimates of future cash flows have not been adjusted.
3.8 Taxation and deferred taxation
Income tax expense represents the sum of the tax currently payable and deferred tax.
3.8.1 Current taxation The tax currently payable is based on taxable profit for the year. Taxable profit differs from profit as reported in the income
statement because it excludes items of income or expense that are taxable or deductible in other years and it further excludes items that are never taxable or deductible. The liability for current tax is calculated using rates that have been enacted by the statement of financial position date.
3.8.2 Deferred taxation Deferred tax is recognised on temporary differences between the carrying amount of assets and liabilities in the financial
statements and the corresponding tax bases used in the computation of taxable profit, and is accounted for using the statement of financial position liability method. Deferred tax liabilities are generally recognised for all taxable temporary differences, and deferred tax assets are generally recognised for all deductible temporary differences to the extent that it is probable that taxable profits will be available against which those deductible temporary differences can be utilised. Such assets and liabilities are not recognised if the temporary difference arises from goodwill or from the initial recognition (other than in business combination) of other assets and liabilities in a transaction that affects neither the taxable profit nor the accounting profit.
Deferred tax liabilities are recognised for taxable temporary differences associated with investments in subsidiaries and associates, and interest in joint ventures, except where the Group is able to control the reversal of the temporary difference and it is probable that the temporary difference will not reverse in the foreseeable future. he carrying amount of deferred tax assets is reviewed at each statement of financial position date and reduced to the extent that it is no longer probable that sufficient taxable profits will be available to allow all or part of the asset to be recovered.
Deferred tax assets and liabilities are measured at the tax rates that are expected to apply in the period in which the liability is settled or the assets realised, based on tax rates (and tax laws) that have been enacted or substantively enacted by the statement of financial position date. The measurement of deferred tax liabilities and assets reflects the tax consequences that would follow from the manner in which the Group expects, at the reporting date, to recover or settle the carrying amount of its assets and liabilities. Deferred tax assets and liabilities are offset when there is a legally enforceable right to set off current tax assets against current tax liabilities and when they relate to income taxes levied by the same taxation authority and the Group intends to settle its current tax assets and liabilities on a net basis.
Current and deferred tax are recognised as an expense or income in profit or loss, except when they relate to items that are recognised outside profit or loss (whether in other comprehensive income or directly in equity), in which case the tax is also recognised outside profit or loss, or where they arise from the initial accounting for a business combination. In the case of a business combination, the tax effect is taken into account in the accounting for the business combination.
3.8.3 Value added tax (VAT) Revenues, expenses and assets are recognised net of the amount of value added tax except where the goods supplied are
exempted or zero rated. The net amount of VAT recoverable from or payable to the taxation authority is included as part of receivables or payables in the statement of financial position.
3.9 Contracts in progress and contract receivables
The valuation of contracts in progress takes account of all direct expenditure on contracts, less payment on account and provision for possible losses to completion. Profits or losses on contracts are recognised with reference to the stage of completion, which is determined by taking into account the proportion of work executed and the nature of each contract. Anticipated losses to completion are deducted.
Masimba Holdings Limited
Statement of Accounting Policies / continued for the Year Ended 31 December 2019
42 Integrated Annual Report 2019
3.9.1 Advance payments received Advance payments received are assessed on initial recognition to determine whether it is probable that they will be repaid in cash
or another financial asset. If it is probable that the advance payments will be repaid with goods or services, the liability is carried at historic cost.
3.10. Inventories
Inventories comprise finished goods and manufactured components. They are valued at the lower of cost or net realisable value generally determined on a moving average basis. Net realisable value is the estimated selling price in the ordinary course of business, less estimated costs of completion and the estimated costs necessary to make the sale.
3.11 Foreign currency translation
The individual financial statements of each Group entity are presented in the currency of the primary economic environment in which the entity operates (its functional currency). For the purpose of the consolidated financial statements, the results and financial position of each entity are expressed in United States Dollars, which is the functional currency of the Group and the presentation currency for the consolidated financial statements. In preparing the financial statements of the individual entities, transactions in currencies other than the entity’s functional currency (foreign currencies) are recorded at the rates of exchange prevailing at the dates of the transactions. At n each statement of financial position date, monetary items denominated in foreign currencies are re-translated at the rates prevailing at the statement of financial position date. Non-monetary items carried at fair value that are denominated in foreign currencies are re-translated at the rates prevailing at the date when the fair value was determined. Non-monetary items that are measured in terms of historical cost in foreign currency are not re-translated. Exchange differences are recognised in profit or loss in the period in which they arise except for:
• exchange differences which relate to assets under construction for future productive use,• exchange differences which are included in the cost of those assets where they are regarded as an adjustment to interest costs on
foreign currency borrowings,• exchange differences on transactions entered into in order to hedge certain foreign currency risks, and • exchange differences on monetary items receivable from or payable to a foreign operation for which settlement is neither planned
nor likely to occur, which form part of the net investment in a foreign operation, and which are recognised in the foreign currency translation reserve and recognised in profit or loss on disposal of the net investment.
For the purpose of presenting consolidated financial statements, the assets and liabilities of the Group’s foreign operations are expressed in United States Dollars(US$) using exchange rates prevailing at the statement of financial position date. Income and expense items are translated at the average exchange rates for the period, unless exchange rates fluctuated significantly during that period, in which case the exchange rates at the dates of the transactions are used. Exchange differences arising, if any, are classified as equity and transferred to the Group’s foreign currency translation reserve. Such exchange differences are recognised in profit or loss in the period in which the foreign operation is disposed of. Goodwill and fair value adjustments arising on the acquisition of a foreign operation are treated as assets and liabilities of the foreign operation and translated at the closing rate.
On the disposal of a foreign operation (i.e. disposal of a Group’s entire interest in a foreign operation, or a disposal involving loss of control over a subsidiary that includes a foreign operation, a disposal involving loss of joint control over a jointly controlled entity that includes a foreign operation), all of the exchange differences accumulated in equity in respect of that operation attributable to the owners of the Company are reclassified to profit and loss. n addition, in relation to a partial disposal of a subsidiary that does not result in the Group losing control over the subsidiary, the proportionate share of accumulated exchange differences are re-attributed to non-controlling interest and are not recognised in profit and loss. All partial disposals i.e. partial disposal of associates or jointly controlled entities that do not result in the Group losing significant influence or joint control), the proportionate share of the accumulated exchange differences is reclassified to profit or loss.
Goodwill and fair value adjustments on identifiable assets and liabilities acquired arising on the acquisition of a foreign operation are treated as assets and liabilities of the foreign operation and translated at the rate of exchange prevailing at the end of each reporting period. Exchange differences arising are recognized in equity.
3.12 Financial instruments
Financial assets and financial liabilities are recognised when a Group entity becomes a party to the contractual provisions of the instrument.
Financial assets and financial liabilities are initially measured at fair value. Transaction costs that are directly attributable to the acquisition or issue of financial assets and financial liabilities (other than financial assets and financial liabilities at fair value through profit or loss) are added to or deducted from the fair value of the financial assets or financial liabilities, as appropriate, on initial recognition. Transaction costs directly attributable to the acquisition of financial assets or financial liabilities at fair value through profit or loss are recognised immediately in profit or loss.

Masimba Holdings Limited
Statement of Accounting Policies / continued for the Year Ended 31 December 2019
43Integrated Annual Report 2019
3.12.1 Financial assets Financial assets are classified into the following specified categories: financial assets ‘at fair value through profit or loss’ (FVTPL),
‘held-to-maturity’ investments, ‘available-for-sale’ (AFS) financial assets and ‘loans and receivables’. The classification depends on the nature and purpose of the financial assets and is determined at the time of initial recognition. All regular way purchases or sales of financial assets are recognised and derecognised on a trade date basis. Regular way purchases or sales are purchases or sales of financial assets that require delivery of assets within the time frame established by regulation or convention in the marketplace.
Income is recognised on an effective interest basis for debt instruments other than those financial assets classified as at FVTPL.
Financial assets at FVTPL Financial assets are classified as at FVTPL when the financial asset is either held for trading or it is designated as at FVTPL. A
financial asset is classified as held for trading if:
• It has been acquired principally for the purpose of selling it in the near term; or• On initial recognition it is part of a portfolio of identified financial instruments that the Group manages together and has a
recent actual pattern of short-term profit-taking; or• It is a derivative that is not designated and effective as a hedging instrument.• A financial asset other than a financial asset held for trading may be designated as at FVTPL upon initial recognition if:• Such designation eliminates or significantly reduces a measurement or recognition inconsistency that would otherwise arise; or• The financial asset forms part of a group of financial assets or financial liabilities or both, which is managed and its performance
is evaluated on a fair value basis, in accordance with the Group’s documented risk management or investment strategy, and information about the grouping is provided internally on that basis; or
• It forms part of a contract containing one or more embedded derivatives, and IAS 39 Financial Instruments: Recognition and Measurement permits the entire combined contract (asset or liability) to be designated as at FVTPL.
Financial assets at FVTPL are stated at fair value, with any gains or losses arising on re-measurement recognised in profit or loss. The net gain or loss recognised in profit or loss incorporates any dividend or interest earned on the financial asset and is included in the ‘other gains and losses’ line item in the consolidated statement of profit or loss and other comprehensive income.
Held-to-maturity investments Held-to-maturity investments are non-derivative financial assets with fixed or determinable payments and fixed maturity dates
that the Group has the positive intent and ability to hold to maturity. Subsequent to initial recognition, held-to-maturity investments are measured at amortised cost using the effective interest method less any impairment.
Available-for-sale financial assets (AFS financial assets)
AFS financial assets are non-derivatives that are either designated as AFS or are not classified as (a) loans and receivables, (b) held-to-maturity investments or (c) financial assets at fair value through profit or loss. Listed redeemable notes held by the Group that are traded in an active market are classified as AFS and are stated at fair value at the end of each reporting period. Changes in the carrying amount of AFS monetary financial assets relating to changes in foreign currency rates, interest income calculated using the effective interest method and dividends on AFS equity investments are recognised in profit or loss. Other changes in the carrying amount of available-for-sale financial assets are recognised in other comprehensive income and accumulated under the heading of investments revaluation reserve. When the investment is disposed of or is determined to be impaired, the cumulative gain or loss previously accumulated in the investments revaluation reserve is reclassified to profit or loss.
Dividends on AFS equity instruments are recognised in profit or loss when the Group’s right to receive the dividends is established.
The fair value of AFS monetary financial assets denominated in a foreign currency is determined in that foreign currency and translated at the spot rate prevailing at the end of the reporting period. The foreign exchange gains and losses that are recognised in profit or loss are determined based on the amortised cost of the monetary asset. Other foreign exchange gains and losses are recognised in other comprehensive income.
AFS equity investments that do not have a quoted market price in an active market and whose fair value cannot be reliably measured and derivatives that are linked to and must be settled by delivery of such unquoted equity investments are measured at cost less any identified impairment losses at the end of each reporting period.
Loans and receivables
Loans and receivables are non-derivative financial assets with fixed or determinable payments that are not quoted in an active market. Loans and receivables (including trade and other receivables, bank balances and cash) are measured at amortised cost using the effective interest method, less any impairment.
Masimba Holdings Limited
Statement of Accounting Policies / continued for the Year Ended 31 December 2019
44 Integrated Annual Report 2019
Interest income is recognised by applying the effective interest rate, except for short-term receivables when the recognition of interest would be immaterial.
Impairment of financial assets
Financial assets, other than those at FVTPL, are assessed for indicators of impairment at the end of each reporting period. Financial assets are considered to be impaired when there is objective evidence that, as a result of one or more events that occurred after the initial recognition of the financial asset, the estimated future cash flows of the investment have been affected.
For AFS equity investments, a significant or prolonged decline in the fair value of the security below its cost is considered to be objective evidence of impairment. For AFS equity investments, a significant or prolonged decline in the fair value of the security below its cost is considered to be objective evidence of impairment.
For all other financial assets, objectives evidence of impairment could include:
• Significant financial difficulty of the issue or counterparty; or • Breach of contract, such as a default or delinquency in interest or principal payments; or • It becoming probable that the borrower will enter bankruptcy or financial re-organisation; or • The disappearance of an active market for that financial asset because of financial difficulties
For certain categories of financial assets, such as trade receivables, assets that are assessed not to be impaired individually are, in addition, assessed for impairment on a collective basis. Objective evidence of impairment for a portfolio of receivables could include the Group’s past experience of collecting payments, an increase in the number of delayed payments in the portfolio past the average credit period of sixty (60) days, as well as observable changes in national or local economic conditions that correlate with default on receivables.
For financial assets carried at amortised cost, the amount of the impairment loss recognised is the difference between the asset’s carrying amount and the present value of estimated future cash flows, discounted at the financial asset’s original effective interest rate.
For financial assets carried at cost, the amount of the impairment loss is measured as the difference between the asset’s carrying amount and the present value of the estimated future cash flows discounted at the current market rate of return for a similar financial asset. Such impairment loss will not be reversed in subsequent periods.
The carrying amount of the financial asset is reduced by the impairment loss directly for all financial assets with the exception of trade receivables, where the carrying amount is reduced through the use of an allowance account. When a trade receivable is considered uncollectible, it is written off against the allowance account. Subsequent recoveries of amounts previously written off are credited against the allowance account. Changes in the carrying amount of the allowance account are recognised in profit or loss.
When an AFS financial asset is considered to be impaired, cumulative gains or losses previously recognised in other comprehensive income are reclassified to profit or loss in the period.
For financial assets measured at amortised cost, if in a subsequent period, the amount of the impairment loss decreases and the decrease can be related objectively to an event occurring after the impairment was recognised, the previously recognised impairment loss is reversed through profit or loss to the extent that the carrying amount of the investment at the date the impairment is reversed does not exceed what the amortised cost would have been had the impairment not been recognised.
In respect of AFS equity securities, impairment losses previously recognised in profit or loss are not reversed through profit or loss. Any increase in fair value subsequent to an impairment loss is recognised in other comprehensive income and accumulated under the heading of investments revaluation reserve. In respect of AFS debt securities, impairment losses are subsequently reversed through profit or loss if an increase in the fair value of the investment can be objectively related to an event occurring after the recognition of the impairment loss.
De-recognition of financial assets
The Group de-recognises a financial asset only when the contractual rights to the cash flows from the asset expire, or when it transfers the financial asset and substantially all the risks and rewards of ownership of the asset to another entity. If the Group neither transfers nor retains substantially all the risks and rewards of ownership and continues to control the transferred asset, the Group recognises its retained interest in the asset and an associated liability for amounts it may have to pay. If the Group retains substantially all the risks and rewards of ownership of a transferred financial asset, the Group continues to recognise the financial asset and also recognises a collateralised borrowing for the proceeds received.
On de-recognition of a financial asset in its entirety, the difference between the asset’s carrying amount and the sum of the consideration received and receivable and the cumulative gain or loss that had been recognised in other comprehensive income and accumulated in equity is recognised in profit or loss.
Masimba Holdings Limited
Statement of Accounting Policies / continued for the Year Ended 31 December 2019
45Integrated Annual Report 2019
On de-recognition of a financial asset other than in its entirety (e.g. when the Group retains an option to repurchase part of a transferred asset), the Group allocates the previous carrying amount of the financial asset between the part it continues to recognise under continuing involvement, and the part it no longer recognises on the basis of the relative fair values of those parts on the date of the transfer. The difference between the carrying amount allocated to the part that is no longer recognised and the sum of the consideration received for the part no longer recognised and any cumulative gain or loss allocated to it that had been recognised in other comprehensive income is recognised in profit or loss. A cumulative gain or loss that had been recognised in other comprehensive income is allocated between the part that continues to be recognised and the part that is no longer recognised on the basis of the relative fair values of those parts.
3.12.2 Financial liabilities and equity instruments
Classification as debt or equity
Debt and equity instruments issued by a group entity are classified as either financial liabilities or as equity in accordance with the substance of the contractual arrangements and the definitions of a financial liability and an equity instrument.
Equity instruments An equity instrument is any contract that evidences a residual interest in the assets of an entity after deducting all of its liabilities.
Equity instruments issued by the Group are recognised as the proceeds received, net of direct issue costs.
Repurchase of the Group’s own equity instruments is recognised and deducted directly in equity. No gain or loss is recognised in profit or loss on the purchase, sale, issue or cancellation of the Group’s own equity instruments.
Compound instruments
The component parts of compound instruments (convertible notes) issued by the Group are classified separately as financial liabilities and equity in accordance with the substance of the contractual arrangements and the definitions of a financial liability and an equity instrument. A conversion option that will be settled by the exchange of a fixed amount of cash or another financial asset for a fixed number of the Group’s own equity instruments is an equity instrument.
At the date of issue, the fair value of the liability component is estimated using the prevailing market interest rate for similar non-convertible instruments. This amount is recorded as a liability on an amortised cost basis using the effective interest method until extinguished upon conversion or at the instrument’s maturity date.
The conversion option classified as equity is determined by deducting the amount of the liability component from the fair value of the compound instrument as a whole. This is recognised and included in equity, net of income tax effects, and is not subsequently re-measured. In addition, the conversion option classified as equity will remain in equity until the conversion option is exercised, in which case, the balance recognised in equity will be transferred to share premium/other equity. When the conversion option remains unexercised at the maturity date of the convertible note, the balance recognised in equity will be transferred to retained profits/other equity. No gain or loss is recognised in profit or loss upon conversion or expiration of the conversion option.
Transaction costs that relate to the issue of the convertible notes are allocated to the liability and equity components in proportion to the allocation of the gross proceeds. Transaction costs relating to the equity component are recognised directly in equity. Transaction costs relating to the liability component are included in the carrying amount of the liability component and are amortised over the lives of the convertible notes using the effective interest method.
Financial liabilities
Financial liabilities are classified as either financial liabilities ‘at FVTPL’ or ‘other financial liabilities’.
Financial liabilities are classified as at FVTPL when the financial liability is either held for trading or it is designated as at FVTPL. A financial liability is classified as held for trading if:
• it has been acquired principally for the purpose of repurchasing it in the near term; or• it is a derivative that is not designated and effective as a hedging instrument.• A financial liability other than a financial liability held for trading may be designated as at FVTPL upon initial recognition if: • Such designation eliminates or significantly reduces a measurement or recognition inconsistency would otherwise arise; or • The financial liability forms part of a group of financial assets or financial liabilities or both, which is managed and its
performance is evaluated on a fair value basis, in accordance with the Group’s documented risk management or investment strategy, and information about the grouping is provided internally on that basis; or
• It forms part of a contract containing one or more embedded derivatives, and IAS 39 Financial Instruments: Recognition and Measurement permits the entire combined contract (asset or liability) to be designated as at FVTPL.

Masimba Holdings Limited
Statement of Accounting Policies / continued for the Year Ended 31 December 2019
46 Integrated Annual Report 2019
Financial liabilities at FVTPL are stated at fair value, with any gains or losses arising on re-measurement recognised in profit or loss. The net gain or loss recognised in profit or loss incorporates any interest paid on the financial liability and is included in the ‘other gains and losses’ line item in the consolidated income statement.
Other financial liabilities
Other financial liabilities (including borrowings and trade and other payables) are subsequently measured at amortised cost using the effective interest method.
The effective interest method is a method of calculating the amortised cost of a financial liability and of allocating interest expense over the relevant period. The effective interest rate is the rate that exactly discounts estimated future cash payments (including all fees and points paid or received that form an integral part of the effective interest rate, transaction costs and other premiums or discounts) through the expected life of the financial liability, or (where appropriate) a shorter period, to the net carrying amount on initial recognition.
Financial guarantee contracts
A financial guarantee contract is a contract that requires the issuer to make specified payments to reimburse the holder for a loss it incurs because a specified debtor fails to make payments when due in accordance with the terms of a debt instrument.
Financial guarantee contracts issued by the Group are initially measured at their fair values and, if not designated as at FVTPL, are subsequently measured at the higher of:
• The amount of the obligation under the contract, as determined in accordance with IAS 37 Provisions, Contingent Liabilities and Contingent Assets; and the amount initially recognised less, where appropriate, cumulative amortisation recognised in accordance with the revenue recognition policies
De-recognition of financial liabilities
The Group de-recognises financial liabilities when, and only when, the Group’s obligations are discharged, cancelled or they expire. The difference between the carrying amount of the financial liability de-recognised and the consideration paid and payable is recognised in profit or loss.
3.13 Leases
The Group assesses whether a contract is or contains a base, at inception of the contract. The Group recognises a right-of-use asset and a corresponding lease liability with respect to all lease arrangements in which it is the lessee, except for short-term leases (defined as leases with a lease term of 12 months or less) and lease of low value assets. For these leases, the Group recognises the lease payments as an operating expense or sundry income on a straight line basis over the term of the lease unless another systematic basis is more representative of the time pattern in which economic benefits from the leased assets are consumed.
The Group as Lessor
The Group enters into lease agreements as a lessor with respect to some of its investment properties. Leases for which the Group is a lessor are classified as finance or operating leases. Whenever the terms of the lease transfer substantially all the risks and rewards of ownership to the lessee, the contract is classified as a finance lease. All other leases are classified as operating leases.
Rental income from operating leases is recognised on a straight-line basis over the term of the relevant lease. Initial direct costs incurred in negotiating and arranging an operating lease are added to carrying amount of the leased asset and recognised on a straight-line basis over the lease term.
Amounts due from lessees under finance lease are recognised as receivables at the amount of the Group’s net investment in the leases. Finance lease income is allocated to accounting periods so as to reflect a constant periodic rate of return on the Group’s net investment outstanding respect of the leases.
When a contract includes leases and non-lease components, the Group applies IFRS 15: Revenue from Contracts with Customers, to allocate the consideration under the contract to each component.
Masimba Holdings Limited
Statement of Accounting Policies / continued for the Year Ended 31 December 2019
47Integrated Annual Report 2019
The Group as Lessee
The lease liability is initially measured at the present value of the lease payments that are not paid at the commencement date, discounted using the rate implicit in the lease. If this rate cannot be readily determined, the Group uses its incremental borrowing rate. Lease payments included in the measurement of the lease liability comprises of:
• fixed lease payments (including in-substance fixed payments), less any lease incentives;• variable lease payments that depend on an index or rate, initially measured using the index or rate at the commencement date; • the amount expected to be payable by the lessee under residual value guarantees;• the exercise price of purchase options, if the lessee is reasonably certain to exercise the options; and • payments of penalties for terminating the lease, if the base term reflects the exercise of an option to terminate the lease.
The lease liability is presented as a separate line in the consolidated financial position. The lease liability is subsequently measured by increasing the carrying amount to reflect the lease payments made.
The Group remeasures the lease liability (and makes a corresponding adjustment to the related right-of-use asset) whenever:
• the lease term has changed change or there is a change in the assessment of exercise of a purchase option, in which case the lease liability is remeasured by discounting the revised lease payments using a revised rate.
• The lease payments change due to changes in an index or rate or a change in expected payments under a guaranteed residual value, in which cases the lease liability is remeasured by discounting the revised lease payments using the initial discount rate (unless the lease payments change is due to a change in a floating interest rate, in which case a revised discount rate is used).
• A lease contract is modified, and the lease modification is not accounted for as a separate lease, in which case the lease liability is remeasured by discounting the revised lease payments using a revised discount rate.
The Group did not make such adjustments during the periods presented.
• The right of use assets comprises the initial measurement of the corresponding lease liability, lease payments made at or before the commencement date and any initial direct costs. They are subsequently measured at cost less accumulated depreciation and impairment losses.
Whenever the Group incurs an obligation for costs to dismantle and remove a leased asset, restore the site on which it is located
or restore the underlying asset to the condition required by the terms and conditions of the lease, a provision is recognised and measured under IAS 37: Provisions” Contingent Liabilities and Contingent Assets. The costs are included in the related right-of-use asset, unless those costs are incurred to produce inventories.
Right-of-use assets are depreciated over the shorter period of lease term and useful life of the underlying asset. If a lessee transfers ownership of the underlying asset or the cost of the right-of-use asset reflects that the Group expects to exercise a purchase option, the related right-of-use asset is depreciated over the useful life of the underlying asset. The depreciation starts at the commencement date of the lease.
The right-of-use assets are presented as a separate line in the consolidated statement of the financial position.
The Group applies IAS36: Impairment of Assets to determine whether a right-of-use asset is impaired and accounts for any identified impairment loss as described in the Property, plant and equipment policy (3.7).
Variable rents that do not depend on an index or rate are not included in the measurement of the lease liability and the right-of-use asset. The related payments are recognised as an expense in the period in which the event or condition triggers those payments occurs and are included in the line administrative expenses in the statement of profit or loss.
As a practical expedient, IFRS 16: Leases permits a lessee not to separate non-lease components, and instead account for any lease and associated non-lease components as a single arrangement. The Group has not used this practical expedient.
3.14 Share based payments
Senior Executives of the Group receive remuneration in the form of share based payments, whereby they receive equity instruments as consideration for rendering services. The cost of equity settled transactions with employees is measured by reference to the fair value at the date on which they are granted. In valuing equity settled transactions, no account is taken of any performance conditions other than those linked to the price of the shares of the Group. The cost of equity settled transactions is recognised, together with corresponding increase in equity, over the period in which the performance and/or service conditions are fulfilled, ending on the date on which the relevant employees become fully entitled to the award (‘the vesting date’).
The dilutive effect of outstanding options is reflected as additional share dilution in the computation of diluted earnings per share.
Details regarding the determination of the fair value of equity settled share based transactions are set out in note 11.
Masimba Holdings Limited
Statement of Accounting Policies / continued for the Year Ended 31 December 2019
48 Integrated Annual Report 2019
The fair value determined at the grant date of the equity settled share based payments is expensed on a straight line basis over the vesting period, based on the Group’s estimate of equity instruments that will eventually vest, with a corresponding increase in equity. At the end of each reporting period, the Group revises its estimate of the number of equity instruments expected to vest. The impact of the revision of the original estimate, if any, is recognised in profit or loss such that the cumulative expense reflects the revised estimate, with a corresponding adjustment to the equity-settled employee benefits reserve (Share Based Payment reserve).
3.15 Investment properties
Investment property is property held to earn rentals and/or for capital appreciation rather than for use in the production or supply of goods or services, for administrative purposes, or sale in the ordinary course of business. This classification is performed on a property-by-property basis. Initially, investment property is measured at its cost, including transaction costs. Subsequent to initial measurement, investment property is measured at fair value. Gains or losses arising from changes in the fair value of investment property are included in profit or loss for the period in which they arise.
An investment property is de-recognised upon disposal or when the investment property is permanently withdrawn from use and no future economic benefits are expected from the disposal. Any gain or loss arising on de-recognition of the property (calculated as the difference between the net disposal proceeds and the carrying amount of the assets) is included in profit or loss in the period in which the property is de-recognised.
3.16 Capitalisation of borrowing costs
Borrowing costs directly attributable to the acquisition, construction or production of qualifying assets, which are assets that necessarily take a substantial period of time to get ready for their intended use or sale, are added to the cost of those assets, until such time as the assets are substantially ready for their intended use or sale. Investment income earned on the temporary investment of specific borrowings pending their expenditure on qualifying assets is deducted from the borrowing costs eligible for capitalisation. All other borrowing costs are recognised in profit or loss in the period in which they are incurred.
3.17 Provisions and contingencies
3.17.1 Provisions Provisions are recognised when the Group has a present obligation (legal or constructive) as a result of a past event, it is probable
that the Group will be required to settle the obligation, and a reliable estimate can be made of the amount of the obligation.
The amount recognised as a provision is the best estimate of the consideration required to settle the present obligation at the statement of financial position date, taking into account the risks and uncertainties surrounding the obligation. Where a provision is measured using the cash flows estimated to settle the present obligation, its carrying amount is the present value of those cash flows.
When some or all of the economic benefits required to settle a provision are expected to be recovered from a third party, the receivable is recognised as an asset if it is virtually certain that reimbursement will be received and the amount of the receivable can be measured reliably.
3.17.2 Restructurings A restructuring provision is recognised when the Group has developed a detailed formal plan for the restructuring and has raised
a valid expectation in those affected that it will carry out the restructuring by starting to implement the plan or announcing its main features to those affected by it. The measurement of a restructuring provision includes only the direct expenditures arising from the restructuring, which are those amounts that are both necessarily entailed by the restructuring and not associated with the ongoing activities of the entity.
3.17.3 Contingent liabilities A contingent liability is a possible obligation that arises from past events and existence will be confirmed only by the occurrence
or non-occurrence of one or more uncertain events not wholly within the control of the Group, or a present obligation that arises from past events but is not recognised because it is not probable that an outflow of resources embodying economic benefits will be required to settle the obligation; or the amount of the obligation cannot be measured with sufficient reliability. If the likelihood of an outflow of resources is remote, the possible obligation is neither a provision nor a contingent liability and no disclosure is made.
3.17.4 Contingent assets A contingent asset is a possible asset that arises from past events and existence will be confirmed only by the occurrence of one
or more uncertain future events not wholly within the control of the Group. In the ordinary course of business, the Group may pursue a claim against a subcontractor or client. Such contingent assets are only recognised in the financial statements where the realisation of income is virtually certain. If the flow of economic benefits is only probable, the contingent asset is disclosed as a claim in favour of the Group but not recognised on the statement of financial position.

Masimba Holdings Limited
Statement of Accounting Policies / continued for the Year Ended 31 December 2019
49Integrated Annual Report 2019
3.18 Employee benefits
3.18.1 Defined contribution plans The Group operates pension schemes in terms of the Pension and Provident Funds Act and current contributions to defined
contribution schemes are charged against income as incurred. The Group also participates in the National Social Security Authority scheme. Under defined contribution plans, the Group’s legal or constructive obligation is limited to the amount that it agrees to contribute to the fund. Consequently, the actuarial risk that benefits will be less than expected and the investment risk that assets invested will be insufficient to meet expected benefits is borne by the employee.
3.18.2 Short term employee benefits Wages, salaries, paid annual leave, bonuses and non-monetary benefits are recognised as employee benefit expenses and
accrued when the associated services are rendered by the employees of the Group.
3.18.3 Termination benefits Termination benefits are payable when employment is terminated by the Group before retirement date or whenever an employee
accepts voluntary redundancy in exchange for these benefits. The Group recognises termination benefits when it is demonstrably committed to either: terminating the employment of current employees according to a detailed formal plan without the possibility of withdrawal; or providing termination benefits as a result of an offer made to encourage voluntary redundancy. Benefits falling due more than twelve (12) months after the statement of financial position date are discounted to present value.
3.18.4 Retirement benefit costs Payments to defined contribution retirement benefit plans are recognised as an expense when employees have rendered service
entitling them to the contributions.
3.19 Related parties
Related parties are considered to be related if one party has the ability to control or jointly control the other party or exercise significant influence over the other party in making financial and operating decisions. Key management personnel are also regarded as related parties. Key management personnel are those persons having authority and responsibility for planning, directing and controlling the activities of the Group, directly or indirectly, including all Executive and non-Executive Directors.
Related party transactions are those where a transfer of resources or obligations between related parties occur, regardless of whether or not a price is charged.
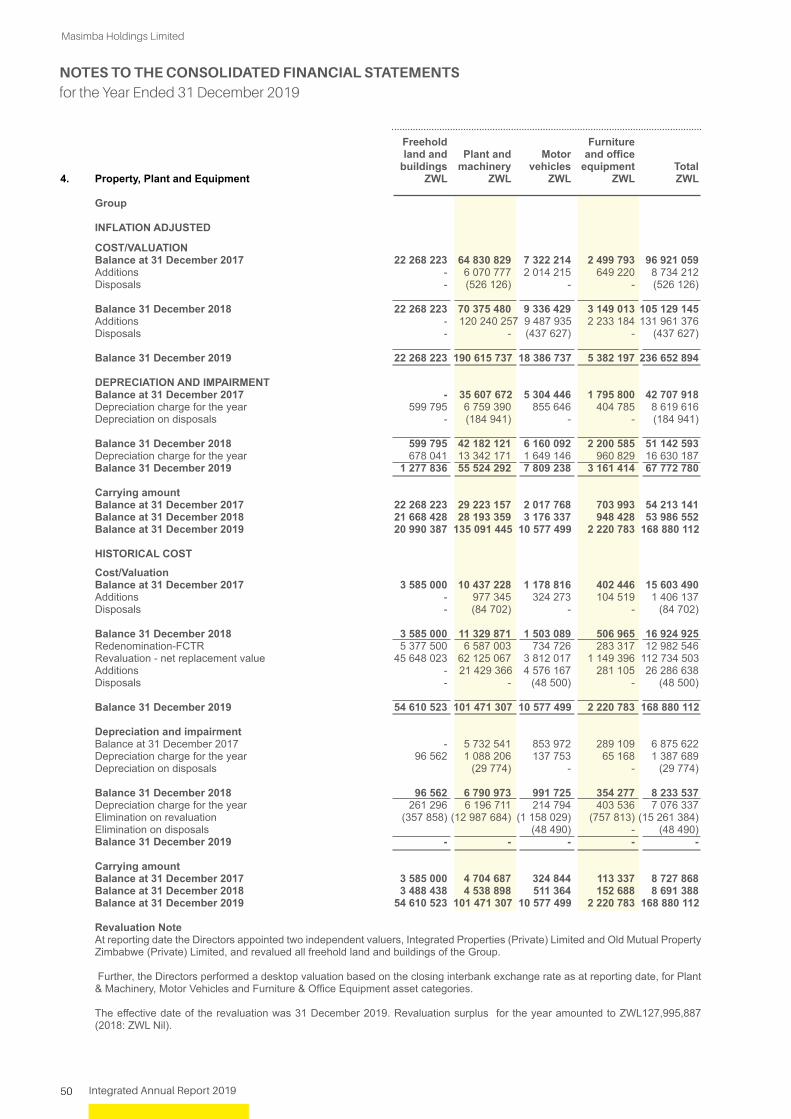
50 Integrated Annual Report 2019
Masimba Holdings Limited
Freehold Furniture land and Plant and Motor and office buildings machinery vehicles equipment Total4. Property, Plant and Equipment ZWL ZWL ZWL ZWL ZWL Group INFLATION ADJUSTED COST/VALUATION
Balance at 31 December 2017 22 268 223 64 830 829 7 322 214 2 499 793 96 921 059 Additions - 6 070 777 2 014 215 649 220 8 734 212 Disposals - (526 126) - - (526 126) Balance 31 December 2018 22 268 223 70 375 480 9 336 429 3 149 013 105 129 145 Additions - 120 240 257 9 487 935 2 233 184 131 961 376 Disposals - - (437 627) - (437 627) Balance 31 December 2019 22 268 223 190 615 737 18 386 737 5 382 197 236 652 894 DEPRECIATION AND IMPAIRMENT Balance at 31 December 2017 - 35 607 672 5 304 446 1 795 800 42 707 918 Depreciation charge for the year 599 795 6 759 390 855 646 404 785 8 619 616 Depreciation on disposals - (184 941) - - (184 941) Balance 31 December 2018 599 795 42 182 121 6 160 092 2 200 585 51 142 593 Depreciation charge for the year 678 041 13 342 171 1 649 146 960 829 16 630 187 Balance 31 December 2019 1 277 836 55 524 292 7 809 238 3 161 414 67 772 780 Carrying amount
Balance at 31 December 2017 22 268 223 29 223 157 2 017 768 703 993 54 213 141 Balance at 31 December 2018 21 668 428 28 193 359 3 176 337 948 428 53 986 552 Balance at 31 December 2019 20 990 387 135 091 445 10 577 499 2 220 783 168 880 112 HISTORICAL COST Cost/Valuation
Balance at 31 December 2017 3 585 000 10 437 228 1 178 816 402 446 15 603 490 Additions - 977 345 324 273 104 519 1 406 137 Disposals - (84 702) - - (84 702) Balance 31 December 2018 3 585 000 11 329 871 1 503 089 506 965 16 924 925 Redenomination-FCTR 5 377 500 6 587 003 734 726 283 317 12 982 546 Revaluation - net replacement value 45 648 023 62 125 067 3 812 017 1 149 396 112 734 503 Additions - 21 429 366 4 576 167 281 105 26 286 638 Disposals - - (48 500) - (48 500) Balance 31 December 2019 54 610 523 101 471 307 10 577 499 2 220 783 168 880 112
Depreciation and impairment Balance at 31 December 2017 - 5 732 541 853 972 289 109 6 875 622
Depreciation charge for the year 96 562 1 088 206 137 753 65 168 1 387 689 Depreciation on disposals (29 774) - - (29 774) Balance 31 December 2018 96 562 6 790 973 991 725 354 277 8 233 537 Depreciation charge for the year 261 296 6 196 711 214 794 403 536 7 076 337 Elimination on revaluation (357 858) (12 987 684) (1 158 029) (757 813) (15 261 384) Elimination on disposals (48 490) - (48 490) Balance 31 December 2019 - - - - - Carrying amount Balance at 31 December 2017 3 585 000 4 704 687 324 844 113 337 8 727 868 Balance at 31 December 2018 3 488 438 4 538 898 511 364 152 688 8 691 388 Balance at 31 December 2019 54 610 523 101 471 307 10 577 499 2 220 783 168 880 112 Revaluation Note At reporting date the Directors appointed two independent valuers, Integrated Properties (Private) Limited and Old Mutual Property
Zimbabwe (Private) Limited, and revalued all freehold land and buildings of the Group.
Further, the Directors performed a desktop valuation based on the closing interbank exchange rate as at reporting date, for Plant & Machinery, Motor Vehicles and Furniture & Office Equipment asset categories.
The effective date of the revaluation was 31 December 2019. Revaluation surplus for the year amounted to ZWL127,995,887
(2018: ZWL Nil).
NOTES TO THE CONSOLIDATED FINANCIAL STATEMENTS for the Year Ended 31 December 2019
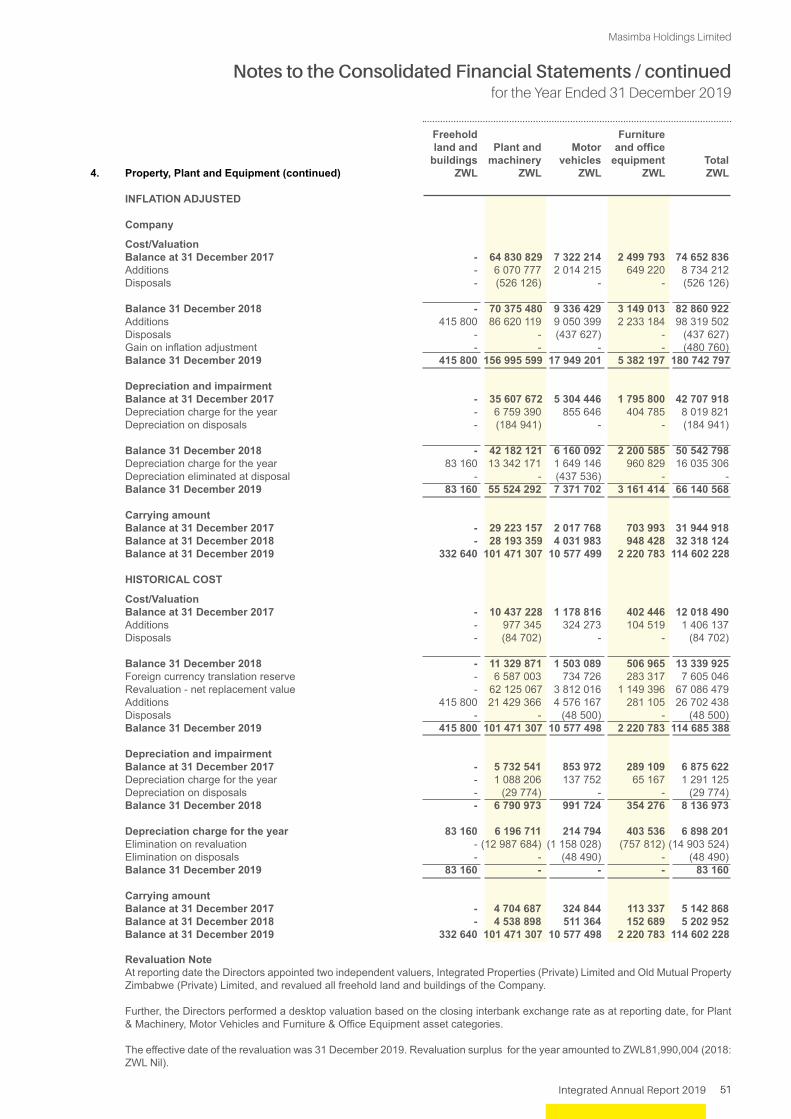
Masimba Holdings Limited
Notes to the Consolidated Financial Statements / continued for the Year Ended 31 December 2019
51Integrated Annual Report 2019
Freehold Furniture land and Plant and Motor and office buildings machinery vehicles equipment Total4. Property, Plant and Equipment (continued) ZWL ZWL ZWL ZWL ZWL INFLATION ADJUSTED
Company
Cost/Valuation Balance at 31 December 2017 - 64 830 829 7 322 214 2 499 793 74 652 836
Additions - 6 070 777 2 014 215 649 220 8 734 212 Disposals - (526 126) - - (526 126)
Balance 31 December 2018 - 70 375 480 9 336 429 3 149 013 82 860 922 Additions 415 800 86 620 119 9 050 399 2 233 184 98 319 502 Disposals - - (437 627) - (437 627) Gain on inflation adjustment - - - - (480 760) Balance 31 December 2019 415 800 156 995 599 17 949 201 5 382 197 180 742 797
Depreciation and impairment Balance at 31 December 2017 - 35 607 672 5 304 446 1 795 800 42 707 918
Depreciation charge for the year - 6 759 390 855 646 404 785 8 019 821 Depreciation on disposals - (184 941) - - (184 941) Balance 31 December 2018 - 42 182 121 6 160 092 2 200 585 50 542 798 Depreciation charge for the year 83 160 13 342 171 1 649 146 960 829 16 035 306 Depreciation eliminated at disposal - - (437 536) - - Balance 31 December 2019 83 160 55 524 292 7 371 702 3 161 414 66 140 568
Carrying amount Balance at 31 December 2017 - 29 223 157 2 017 768 703 993 31 944 918 Balance at 31 December 2018 - 28 193 359 4 031 983 948 428 32 318 124 Balance at 31 December 2019 332 640 101 471 307 10 577 499 2 220 783 114 602 228
HISTORICAL COST Cost/Valuation Balance at 31 December 2017 - 10 437 228 1 178 816 402 446 12 018 490 Additions - 977 345 324 273 104 519 1 406 137 Disposals - (84 702) - - (84 702) Balance 31 December 2018 - 11 329 871 1 503 089 506 965 13 339 925 Foreign currency translation reserve - 6 587 003 734 726 283 317 7 605 046 Revaluation - net replacement value - 62 125 067 3 812 016 1 149 396 67 086 479 Additions 415 800 21 429 366 4 576 167 281 105 26 702 438 Disposals - - (48 500) - (48 500) Balance 31 December 2019 415 800 101 471 307 10 577 498 2 220 783 114 685 388 Depreciation and impairment Balance at 31 December 2017 - 5 732 541 853 972 289 109 6 875 622 Depreciation charge for the year - 1 088 206 137 752 65 167 1 291 125 Depreciation on disposals - (29 774) - - (29 774) Balance 31 December 2018 - 6 790 973 991 724 354 276 8 136 973 Depreciation charge for the year 83 160 6 196 711 214 794 403 536 6 898 201 Elimination on revaluation - (12 987 684) (1 158 028) (757 812) (14 903 524) Elimination on disposals - - (48 490) - (48 490) Balance 31 December 2019 83 160 - - - 83 160 Carrying amount Balance at 31 December 2017 - 4 704 687 324 844 113 337 5 142 868 Balance at 31 December 2018 - 4 538 898 511 364 152 689 5 202 952 Balance at 31 December 2019 332 640 101 471 307 10 577 498 2 220 783 114 602 228
Revaluation Note At reporting date the Directors appointed two independent valuers, Integrated Properties (Private) Limited and Old Mutual Property
Zimbabwe (Private) Limited, and revalued all freehold land and buildings of the Company.
Further, the Directors performed a desktop valuation based on the closing interbank exchange rate as at reporting date, for Plant & Machinery, Motor Vehicles and Furniture & Office Equipment asset categories.
The effective date of the revaluation was 31 December 2019. Revaluation surplus for the year amounted to ZWL81,990,004 (2018:
ZWL Nil).
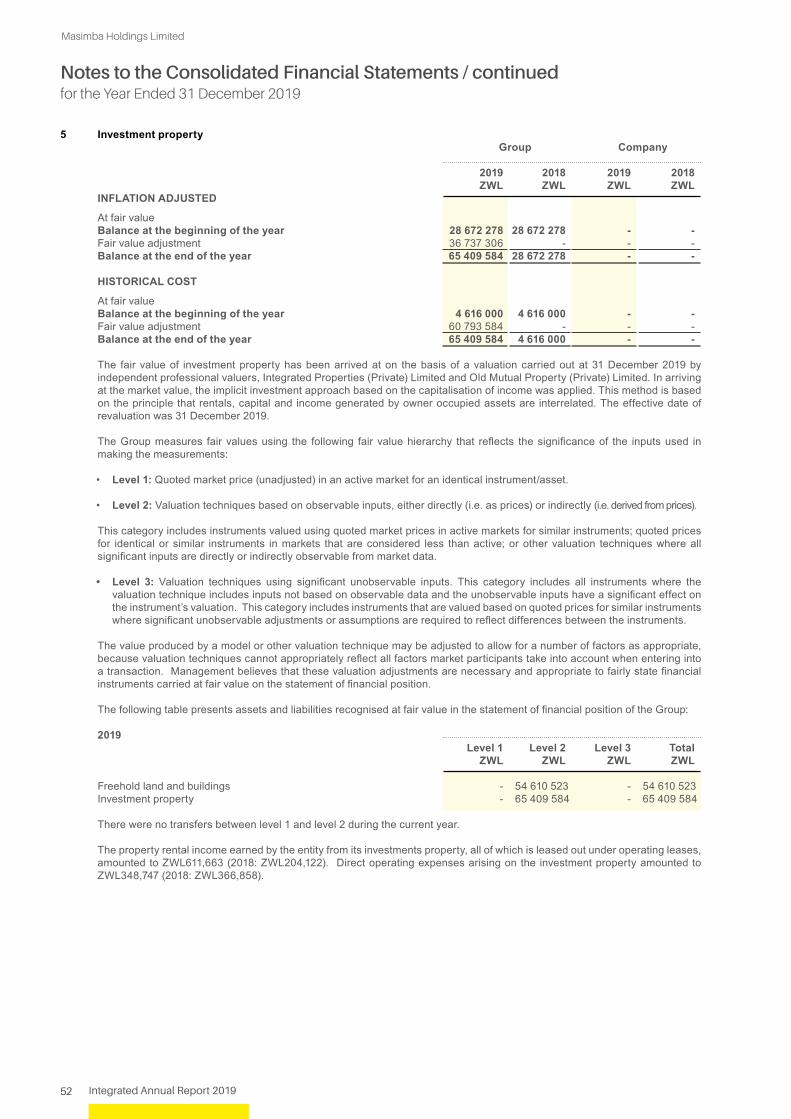
Masimba Holdings Limited
Notes to the Consolidated Financial Statements / continued for the Year Ended 31 December 2019
52 Integrated Annual Report 2019
5 Investment property Group Company
2019 2018 2019 2018 ZWL ZWL ZWL ZWL INFLATION ADJUSTED At fair value Balance at the beginning of the year 28 672 278 28 672 278 - - Fair value adjustment 36 737 306 - - - Balance at the end of the year 65 409 584 28 672 278 - - HISTORICAL COST At fair value Balance at the beginning of the year 4 616 000 4 616 000 - - Fair value adjustment 60 793 584 - - - Balance at the end of the year 65 409 584 4 616 000 - -
The fair value of investment property has been arrived at on the basis of a valuation carried out at 31 December 2019 by independent professional valuers, Integrated Properties (Private) Limited and Old Mutual Property (Private) Limited. In arriving at the market value, the implicit investment approach based on the capitalisation of income was applied. This method is based on the principle that rentals, capital and income generated by owner occupied assets are interrelated. The effective date of revaluation was 31 December 2019.
The Group measures fair values using the following fair value hierarchy that reflects the significance of the inputs used in making the measurements:
• Level 1: Quoted market price (unadjusted) in an active market for an identical instrument/asset.
• Level 2: Valuation techniques based on observable inputs, either directly (i.e. as prices) or indirectly (i.e. derived from prices).
This category includes instruments valued using quoted market prices in active markets for similar instruments; quoted prices for identical or similar instruments in markets that are considered less than active; or other valuation techniques where all significant inputs are directly or indirectly observable from market data.
• Level 3: Valuation techniques using significant unobservable inputs. This category includes all instruments where the valuation technique includes inputs not based on observable data and the unobservable inputs have a significant effect on the instrument’s valuation. This category includes instruments that are valued based on quoted prices for similar instruments where significant unobservable adjustments or assumptions are required to reflect differences between the instruments.
The value produced by a model or other valuation technique may be adjusted to allow for a number of factors as appropriate, because valuation techniques cannot appropriately reflect all factors market participants take into account when entering into a transaction. Management believes that these valuation adjustments are necessary and appropriate to fairly state financial instruments carried at fair value on the statement of financial position.
The following table presents assets and liabilities recognised at fair value in the statement of financial position of the Group: 2019 Level 1 Level 2 Level 3 Total ZWL ZWL ZWL ZWL Freehold land and buildings - 54 610 523 - 54 610 523 Investment property - 65 409 584 - 65 409 584
There were no transfers between level 1 and level 2 during the current year.
The property rental income earned by the entity from its investments property, all of which is leased out under operating leases, amounted to ZWL611,663 (2018: ZWL204,122). Direct operating expenses arising on the investment property amounted to ZWL348,747 (2018: ZWL366,858).
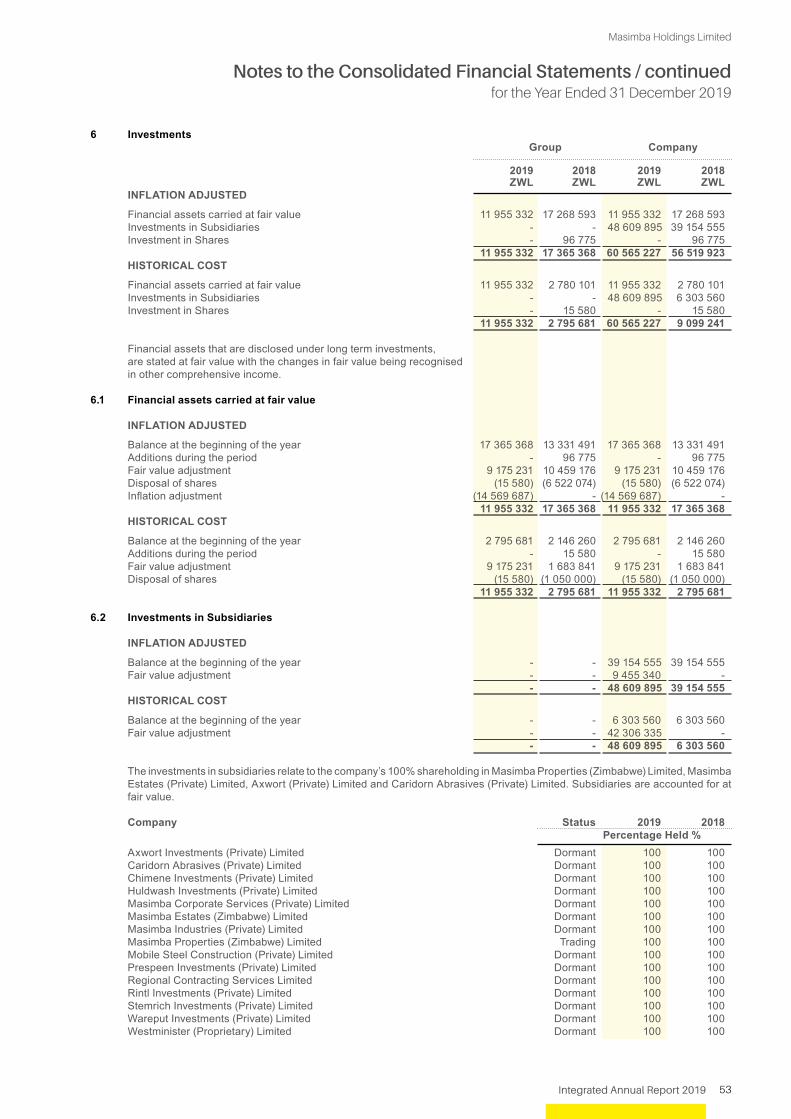
Masimba Holdings Limited
Notes to the Consolidated Financial Statements / continued for the Year Ended 31 December 2019
53Integrated Annual Report 2019
6 Investments Group Company 2019 2018 2019 2018 ZWL ZWL ZWL ZWL INFLATION ADJUSTED
Financial assets carried at fair value 11 955 332 17 268 593 11 955 332 17 268 593 Investments in Subsidiaries - - 48 609 895 39 154 555 Investment in Shares - 96 775 - 96 775 11 955 332 17 365 368 60 565 227 56 519 923 HISTORICAL COST
Financial assets carried at fair value 11 955 332 2 780 101 11 955 332 2 780 101 Investments in Subsidiaries - - 48 609 895 6 303 560 Investment in Shares - 15 580 - 15 580 11 955 332 2 795 681 60 565 227 9 099 241
Financial assets that are disclosed under long term investments, are stated at fair value with the changes in fair value being recognised in other comprehensive income.
6.1 Financial assets carried at fair value INFLATION ADJUSTED
Balance at the beginning of the year 17 365 368 13 331 491 17 365 368 13 331 491 Additions during the period - 96 775 - 96 775 Fair value adjustment 9 175 231 10 459 176 9 175 231 10 459 176 Disposal of shares (15 580) (6 522 074) (15 580) (6 522 074) Inflation adjustment (14 569 687) - (14 569 687) - 11 955 332 17 365 368 11 955 332 17 365 368 HISTORICAL COST Balance at the beginning of the year 2 795 681 2 146 260 2 795 681 2 146 260 Additions during the period - 15 580 - 15 580 Fair value adjustment 9 175 231 1 683 841 9 175 231 1 683 841 Disposal of shares (15 580) (1 050 000) (15 580) (1 050 000) 11 955 332 2 795 681 11 955 332 2 795 681 6.2 Investments in Subsidiaries
INFLATION ADJUSTED Balance at the beginning of the year - - 39 154 555 39 154 555 Fair value adjustment - - 9 455 340 - - - 48 609 895 39 154 555 HISTORICAL COST Balance at the beginning of the year - - 6 303 560 6 303 560 Fair value adjustment - - 42 306 335 - - - 48 609 895 6 303 560
The investments in subsidiaries relate to the company’s 100% shareholding in Masimba Properties (Zimbabwe) Limited, Masimba Estates (Private) Limited, Axwort (Private) Limited and Caridorn Abrasives (Private) Limited. Subsidiaries are accounted for at fair value.
Company Status 2019 2018 Percentage Held % Axwort Investments (Private) Limited Dormant 100 100 Caridorn Abrasives (Private) Limited Dormant 100 100 Chimene Investments (Private) Limited Dormant 100 100 Huldwash Investments (Private) Limited Dormant 100 100 Masimba Corporate Services (Private) Limited Dormant 100 100 Masimba Estates (Zimbabwe) Limited Dormant 100 100 Masimba Industries (Private) Limited Dormant 100 100 Masimba Properties (Zimbabwe) Limited Trading 100 100 Mobile Steel Construction (Private) Limited Dormant 100 100 Prespeen Investments (Private) Limited Dormant 100 100 Regional Contracting Services Limited Dormant 100 100 Rintl Investments (Private) Limited Dormant 100 100 Stemrich Investments (Private) Limited Dormant 100 100 Wareput Investments (Private) Limited Dormant 100 100 Westminister (Proprietary) Limited Dormant 100 100

Masimba Holdings Limited
Notes to the Consolidated Financial Statements / continued for the Year Ended 31 December 2019
54 Integrated Annual Report 2019
7 Cash and cash equivalents
Group Company 2019 2018 2019 2018 ZWL ZWL ZWL ZWL INFLATION ADJUSTED
Local Accounts 10 890 313 19 108 347 10 734 182 18 977 073 Exporters Nostro FCA Accounts 935 607 4 426 283 935 607 4 426 283 Bank and cash balances 11 825 920 23 534 630 11 669 789 23 403 356 HISTORICAL COST Local Accounts 10 890 313 3 076 286 10 734 182 3 055 152 Exporters Nostro FCA Accounts 935 607 712 595 935 607 712 595 Bank and cash balances 11 825 920 3 788 881 11 669 789 3 767 747
Cash and cash equivalents are recognised at fair value. For the purpose of the cash flow statement, cash and cash equivalents comprise cash and bank balances held with our bankers.
8 Contracts in progress and contract receivables Group Company 2019 2018 2019 2018 ZWL ZWL ZWL ZWL INFLATION ADJUSTMENT
Contracts receivables in respect of certified work 46 218 874 24 721 883 46 218 874 24 721 883 Contracts receivables in retentions 2 377 472 10 606 389 2 377 472 10 606 389 Contracts work in progress 49 771 899 57 157 063 49 771 899 57 157 063 98 368 245 92 485 335 98 368 245 92 485 335
HISTORICAL COST
Contracts receivables in respect of certified work 46 218 874 3 980 019 46 218 874 3 980 019 Contracts receivables in retentions 2 377 472 1 707 541 2 377 472 1 707 541 Contracts work in progress 49 771 899 9 201 815 49 771 899 9 201 815 98 368 245 14 889 375 98 368 245 14 889 375 9 Trade and other receivables
INFLATION ADJUSTED Trade 1 830 642 5 708 423 1 200 223 3 817 531 Other 72 242 375 28 256 456 72 111 671 27 621 411 74 073 017 33 964 880 73 311 894 31 438 942 Trade receivables Gross trade receivables 1 909 013 7 012 565 1 251 914 4 955 950 Less: allowance for credit losses (78 371) (1 304 141) (51 691) (1 138 419) 1 830 642 5 708 424 1 200 223 3 817 531 Other receivables Prepayments 71 250 099 27 442 967 71 107 228 26 555 524 Other receivables 992 276 813 489 1 004 443 1 065 887 72 242 375 28 256 456 72 111 671 27 621 411 74 073 017 33 964 880 73 311 894 31 438 942 HISTORICAL COST Trade 1 830 642 919 009 1 200 223 614 591 Other 72 242 375 4 549 056 72 111 671 4 446 819 74 073 017 5 468 065 73 311 894 5 061 410
Trade receivables Gross trade receivables 1 909 013 1 128 965 1 251 914 797 867 Less: allowance for credit losses (78 371) (209 956) (51 691) (183 276) 1 830 642 919 009 1 200 223 614 591 Other receivables Prepayments 71 250 099 4 418 091 71 107 228 4 275 220 Other receivables 992 276 130 965 1 004 443 171 599 72 242 375 4 549 056 72 111 671 4 446 819 74 073 017 5 468 065 73 311 894 5 061 410

Masimba Holdings Limited
Notes to the Consolidated Financial Statements / continued for the Year Ended 31 December 2019
55Integrated Annual Report 2019
9 Trade and other receivables (continued)
The average credit period for trade receivables is fourteen (14) days. No interest is charged on the overdue trade receivables. The entity has recognised an allowance for credit losses against all receivables on a case by case basis.
Trade receivables disclosed include amounts (see below for aged analysis) that are past due at the end of the reporting period but against which the Group has not recognised an allowance for credit losses because there has not been a significant change in the credit quality and the amounts are still considered recoverable. The Group does not hold any collateral or other credit enhancements over these balances nor does it have a legal right of offset against any amounts owed by it to the counterparty.
Ageing of past due but not impaired trade receivables
Group Company 2019 2018 2019 2018 ZWL ZWL ZWL ZWL
INFLATION ADJUSTED
61-90 days 419 301 2 205 579 419 301 1 731 449 91 days+ 1 411 346 3 502 844 780 927 2 086 082 1 830 647 5 708 423 1 200 228 3 817 531
2019 2018 2019 2018 days days days days
Debtor days 81 50 80 46
Group Company 2019 2018 2019 2018 ZWL ZWL ZWL ZWL
HISTORICAL COST
61-90 days 419 301 355 080 419 301 278 749 91 days+ 1 411 346 563 929 780 927 335 842 1 830 647 919 009 1 200 228 614 591 2019 2018 2019 2018 days days days days Debtor days 81 36 143 36
Group Company
2019 2018 2019 2018 INFLATION ADJUSTED ZWL ZWL ZWL ZWL Movement in the allowance for credit losses Balance at the beginning of the year 209 956 1 281 854 183 276 1 116 132 Net movement in provision for the year (131 585) 22 287 (131 585) 22 287 Bad debts written off - - Balance at the end of the year 78 371 1 304 141 51 691 1 138 419 HISTORICAL COST Movement in the allowance for credit losses Balance at the beginning of the year 209 956 206 368 183 276 179 688 Net movement in provision for the year (131 585) 3 588 (131 585) 3 588 Bad debts written off - - - - Balance at the end of the year 78 371 209 956 51 691 183 276 Book debtors are encumbered as shown in note 12.
In determining trade recoverability of trade receivables, the Group considers any changes in the credit quality of the trade
receivable from the date credit was initially granted up to the reporting date. The concentration of credit risks is limited due to the customer base being large and unrelated.
The Directors consider that the carrying amount of trade receivables approximates their fair values.
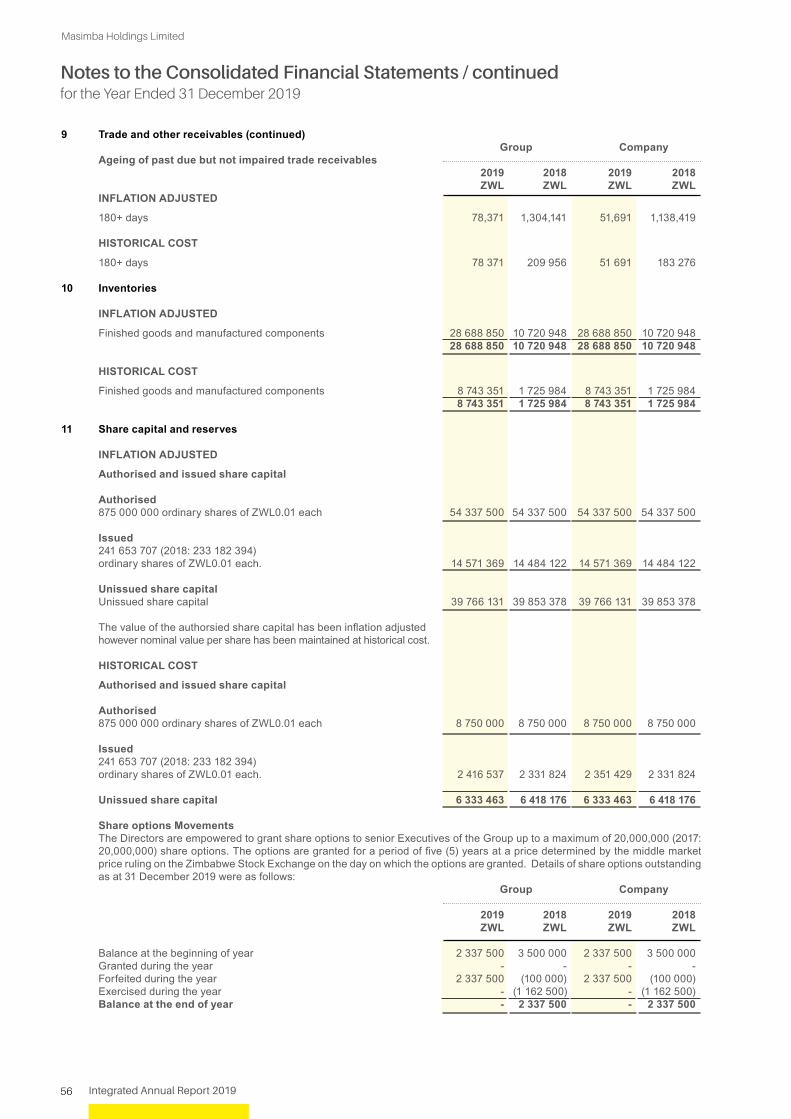
Masimba Holdings Limited
Notes to the Consolidated Financial Statements / continued for the Year Ended 31 December 2019
56 Integrated Annual Report 2019
9 Trade and other receivables (continued) Group Company Ageing of past due but not impaired trade receivables 2019 2018 2019 2018 ZWL ZWL ZWL ZWL INFLATION ADJUSTED
180+ days 78,371 1,304,141 51,691 1,138,419
HISTORICAL COST 180+ days 78 371 209 956 51 691 183 276 10 Inventories
INFLATION ADJUSTED
Finished goods and manufactured components 28 688 850 10 720 948 28 688 850 10 720 948 28 688 850 10 720 948 28 688 850 10 720 948 HISTORICAL COST Finished goods and manufactured components 8 743 351 1 725 984 8 743 351 1 725 984 8 743 351 1 725 984 8 743 351 1 725 984
11 Share capital and reserves
INFLATION ADJUSTED
Authorised and issued share capital Authorised 875 000 000 ordinary shares of ZWL0.01 each 54 337 500 54 337 500 54 337 500 54 337 500
Issued 241 653 707 (2018: 233 182 394) ordinary shares of ZWL0.01 each. 14 571 369 14 484 122 14 571 369 14 484 122
Unissued share capital Unissued share capital 39 766 131 39 853 378 39 766 131 39 853 378
The value of the authorsied share capital has been inflation adjusted however nominal value per share has been maintained at historical cost.
HISTORICAL COST
Authorised and issued share capital Authorised 875 000 000 ordinary shares of ZWL0.01 each 8 750 000 8 750 000 8 750 000 8 750 000 Issued 241 653 707 (2018: 233 182 394) ordinary shares of ZWL0.01 each. 2 416 537 2 331 824 2 351 429 2 331 824 Unissued share capital 6 333 463 6 418 176 6 333 463 6 418 176 Share options Movements The Directors are empowered to grant share options to senior Executives of the Group up to a maximum of 20,000,000 (2017:
20,000,000) share options. The options are granted for a period of five (5) years at a price determined by the middle market price ruling on the Zimbabwe Stock Exchange on the day on which the options are granted. Details of share options outstanding as at 31 December 2019 were as follows:
Group Company
2019 2018 2019 2018 ZWL ZWL ZWL ZWL
Balance at the beginning of year 2 337 500 3 500 000 2 337 500 3 500 000 Granted during the year - - - - Forfeited during the year 2 337 500 (100 000) 2 337 500 (100 000) Exercised during the year - (1 162 500) - (1 162 500) Balance at the end of year - 2 337 500 - 2 337 500

Masimba Holdings Limited
Notes to the Consolidated Financial Statements / continued for the Year Ended 31 December 2019
57Integrated Annual Report 2019
11 Share capital and reserves (continued)
A valuation was carried out by the Directors as at 31 December 2019. The estimated fair values of options granted were determined using Black Scholes model in accordance with IFRS 2 with the following inputs and assumptions:
Group Company
2019 2018 2019 2018 ZWL ZWL ZWL ZWL
Grant date share price (ZWL) 0.121 0.121 0.121 0.121 Exercise price (ZWL) 0.121 0.121 0.121 0.121 Expected volatility 48.85% 48.85% 48.85% 48.85% Dividend yield 0.000 0% 0.000 0% Risk-free interest rate 0.080 8% 0.080 8%
This is share capital which Directors may allot, grant options over or deal with at their discretion (in terms of the Articles of Association) subject to the limitations of the Companies and other Business Entities Act (Chapter 24:31) and the Zimbabwe Stock Exchange, without further restrictions.
Valuation Inputs
Exercise price The scheme rules state that the price for the shares comprised in an option shall be the middle market price ruling on the
Zimbabwe Stock Exchange on the day on which the options are granted.
Expected volatility Expected volatility is a measure of the amount by which the price is expected to fluctuate during a period, for example between
grant date and the exercise date.
Volatility was calculated as the standard deviation of log normal daily returns for the period starting 16 July 2013 to 15 July 2015.
Expected dividends When estimating the fair value of options, the projected valuation of shares is reduced by the present value of dividends
expected to be paid during the vesting period. This is because the payment of dividends reduces the value of a company.
Risk free rate of return A risk free rate of return is the interest rate an investor would expect to earn on an investment with no risk which is usually taken
to be a Government issued security. It is the interest rate earned on a riskless security over a specified time horizon. The risk free rate return is based on 8% Fixed Rate Infrastructure Development Bonds 2015 issued by the Infrastructure Development Bank of Zimbabwe.
All options expire, if not exercised five (5) years after the date of grant.
Non-distributable reserves This is the residual figure of assets and liabilities arising from the change in functional currency.
12 Borrowings Group Company 2019 2018 2019 2018 ZWL ZWL ZWL ZWL INFLATION ADJUSTED
Secured borrowings at amortised costs Non-current 2 298 573 1 242 300 2 298 573 1 242 300 Current 1 983 136 4 005 528 1 983 136 4 005 528 4 281 709 5 247 828 4 281 709 5 247 828 HISTORICAL COST
Secured borrowings at amortised costs Non-current 2 298 573 200 000 2 298 573 200 000 Current 1 983 136 644 857 1 983 136 644 857 4 281 709 844 857 4 281 709 844 857 The short term loans have a tenure of three (3) months and long term loans have a tenure of two (2) years. The loans accrue
interest at an effective rate of 32% (2018: 7%) per annum. These loans are fully secured against immovable property and a notarial general covering bond over movable assets, including a cession of book debts.
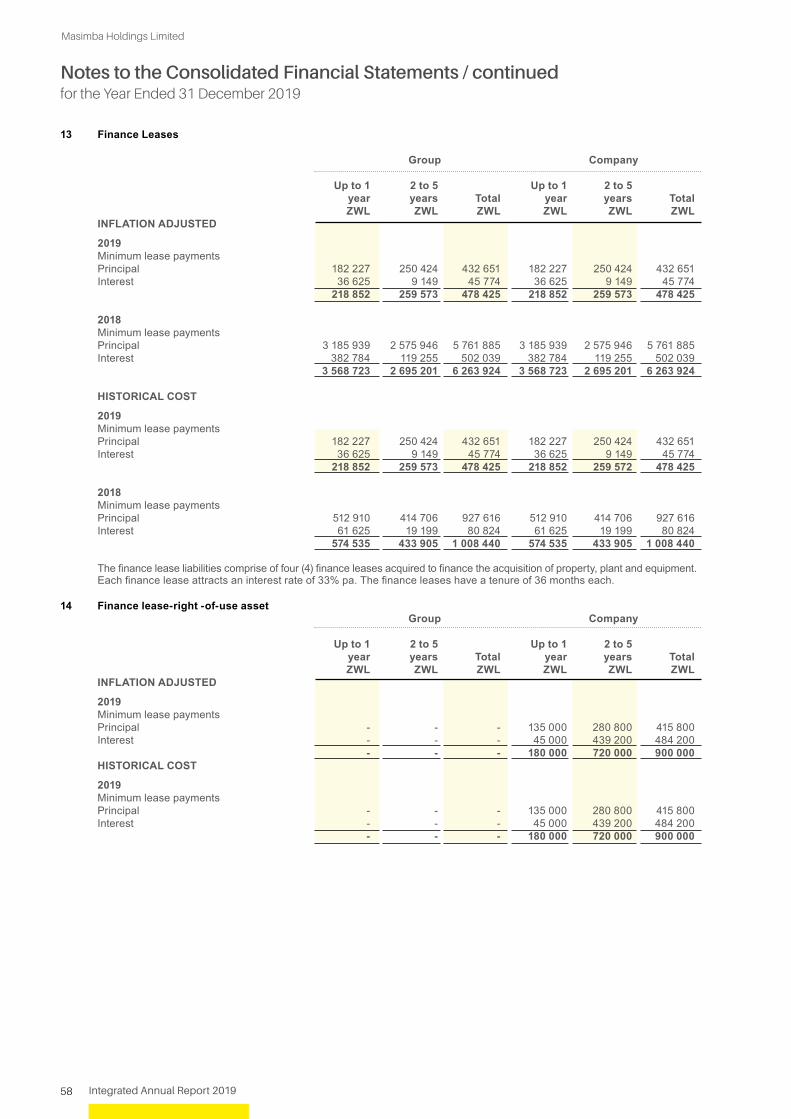
Masimba Holdings Limited
Notes to the Consolidated Financial Statements / continued for the Year Ended 31 December 2019
58 Integrated Annual Report 2019
13 Finance Leases
Group Company
Up to 1 2 to 5 Up to 1 2 to 5 year years Total year years Total ZWL ZWL ZWL ZWL ZWL ZWL INFLATION ADJUSTED
2019 Minimum lease payments
Principal 182 227 250 424 432 651 182 227 250 424 432 651 Interest 36 625 9 149 45 774 36 625 9 149 45 774 218 852 259 573 478 425 218 852 259 573 478 425
2018 Minimum lease payments Principal 3 185 939 2 575 946 5 761 885 3 185 939 2 575 946 5 761 885 Interest 382 784 119 255 502 039 382 784 119 255 502 039 3 568 723 2 695 201 6 263 924 3 568 723 2 695 201 6 263 924 HISTORICAL COST 2019 Minimum lease payments Principal 182 227 250 424 432 651 182 227 250 424 432 651 Interest 36 625 9 149 45 774 36 625 9 149 45 774 218 852 259 573 478 425 218 852 259 572 478 425 2018 Minimum lease payments
Principal 512 910 414 706 927 616 512 910 414 706 927 616 Interest 61 625 19 199 80 824 61 625 19 199 80 824 574 535 433 905 1 008 440 574 535 433 905 1 008 440
The finance lease liabilities comprise of four (4) finance leases acquired to finance the acquisition of property, plant and equipment. Each finance lease attracts an interest rate of 33% pa. The finance leases have a tenure of 36 months each.
14 Finance lease-right -of-use asset Group Company
Up to 1 2 to 5 Up to 1 2 to 5 year years Total year years Total ZWL ZWL ZWL ZWL ZWL ZWL INFLATION ADJUSTED 2019 Minimum lease payments
Principal - - - 135 000 280 800 415 800 Interest - - - 45 000 439 200 484 200 - - - 180 000 720 000 900 000 HISTORICAL COST 2019 Minimum lease payments Principal - - - 135 000 280 800 415 800 Interest - - - 45 000 439 200 484 200 - - - 180 000 720 000 900 000
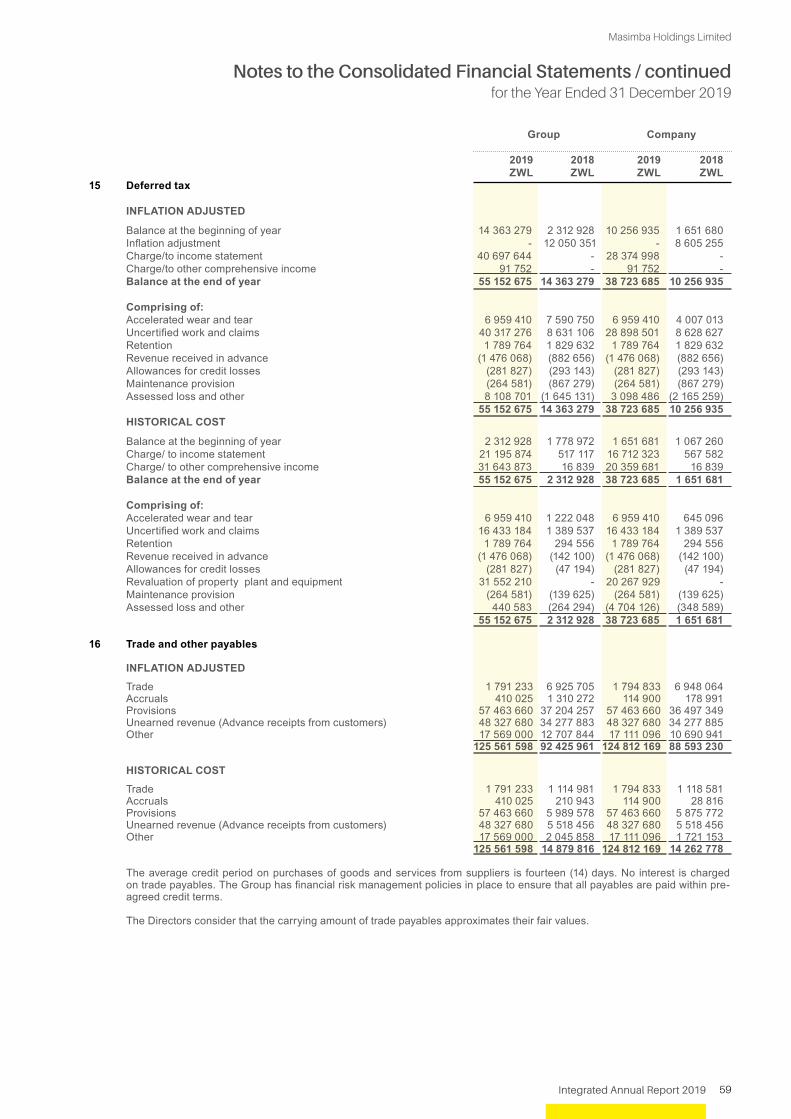
Masimba Holdings Limited
Notes to the Consolidated Financial Statements / continued for the Year Ended 31 December 2019
59Integrated Annual Report 2019
Group Company 2019 2018 2019 2018 ZWL ZWL ZWL ZWL15 Deferred tax
INFLATION ADJUSTED Balance at the beginning of year 14 363 279 2 312 928 10 256 935 1 651 680 Inflation adjustment - 12 050 351 - 8 605 255 Charge/to income statement 40 697 644 - 28 374 998 - Charge/to other comprehensive income 91 752 - 91 752 - Balance at the end of year 55 152 675 14 363 279 38 723 685 10 256 935 Comprising of:
Accelerated wear and tear 6 959 410 7 590 750 6 959 410 4 007 013 Uncertified work and claims 40 317 276 8 631 106 28 898 501 8 628 627 Retention 1 789 764 1 829 632 1 789 764 1 829 632 Revenue received in advance (1 476 068) (882 656) (1 476 068) (882 656) Allowances for credit losses (281 827) (293 143) (281 827) (293 143) Maintenance provision (264 581) (867 279) (264 581) (867 279) Assessed loss and other 8 108 701 (1 645 131) 3 098 486 (2 165 259) 55 152 675 14 363 279 38 723 685 10 256 935 HISTORICAL COST
Balance at the beginning of year 2 312 928 1 778 972 1 651 681 1 067 260 Charge/ to income statement 21 195 874 517 117 16 712 323 567 582 Charge/ to other comprehensive income 31 643 873 16 839 20 359 681 16 839 Balance at the end of year 55 152 675 2 312 928 38 723 685 1 651 681 Comprising of:
Accelerated wear and tear 6 959 410 1 222 048 6 959 410 645 096 Uncertified work and claims 16 433 184 1 389 537 16 433 184 1 389 537 Retention 1 789 764 294 556 1 789 764 294 556 Revenue received in advance (1 476 068) (142 100) (1 476 068) (142 100) Allowances for credit losses (281 827) (47 194) (281 827) (47 194) Revaluation of property plant and equipment 31 552 210 - 20 267 929 - Maintenance provision (264 581) (139 625) (264 581) (139 625) Assessed loss and other 440 583 (264 294) (4 704 126) (348 589) 55 152 675 2 312 928 38 723 685 1 651 681
16 Trade and other payables
INFLATION ADJUSTED Trade 1 791 233 6 925 705 1 794 833 6 948 064 Accruals 410 025 1 310 272 114 900 178 991 Provisions 57 463 660 37 204 257 57 463 660 36 497 349 Unearned revenue (Advance receipts from customers) 48 327 680 34 277 883 48 327 680 34 277 885 Other 17 569 000 12 707 844 17 111 096 10 690 941 125 561 598 92 425 961 124 812 169 88 593 230
HISTORICAL COST Trade 1 791 233 1 114 981 1 794 833 1 118 581 Accruals 410 025 210 943 114 900 28 816 Provisions 57 463 660 5 989 578 57 463 660 5 875 772 Unearned revenue (Advance receipts from customers) 48 327 680 5 518 456 48 327 680 5 518 456 Other 17 569 000 2 045 858 17 111 096 1 721 153 125 561 598 14 879 816 124 812 169 14 262 778
The average credit period on purchases of goods and services from suppliers is fourteen (14) days. No interest is charged on trade payables. The Group has financial risk management policies in place to ensure that all payables are paid within pre-agreed credit terms.
The Directors consider that the carrying amount of trade payables approximates their fair values.
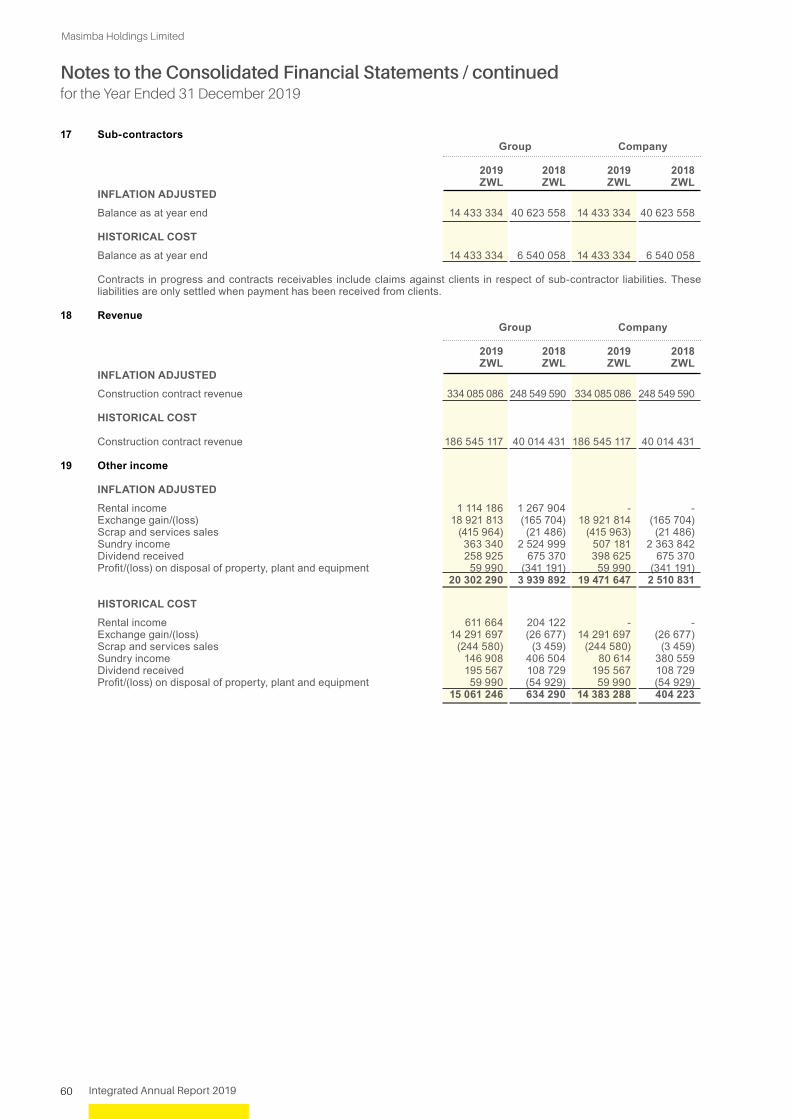
Masimba Holdings Limited
Notes to the Consolidated Financial Statements / continued for the Year Ended 31 December 2019
60 Integrated Annual Report 2019
17 Sub-contractors Group Company
2019 2018 2019 2018 ZWL ZWL ZWL ZWL INFLATION ADJUSTED Balance as at year end 14 433 334 40 623 558 14 433 334 40 623 558
HISTORICAL COST Balance as at year end 14 433 334 6 540 058 14 433 334 6 540 058 Contracts in progress and contracts receivables include claims against clients in respect of sub-contractor liabilities. These
liabilities are only settled when payment has been received from clients.
18 Revenue Group Company 2019 2018 2019 2018 ZWL ZWL ZWL ZWL INFLATION ADJUSTED Construction contract revenue 334 085 086 248 549 590 334 085 086 248 549 590
HISTORICAL COST Construction contract revenue 186 545 117 40 014 431 186 545 117 40 014 431
19 Other income
INFLATION ADJUSTED Rental income 1 114 186 1 267 904 - - Exchange gain/(loss) 18 921 813 (165 704) 18 921 814 (165 704) Scrap and services sales (415 964) (21 486) (415 963) (21 486) Sundry income 363 340 2 524 999 507 181 2 363 842 Dividend received 258 925 675 370 398 625 675 370 Profit/(loss) on disposal of property, plant and equipment 59 990 (341 191) 59 990 (341 191) 20 302 290 3 939 892 19 471 647 2 510 831
HISTORICAL COST Rental income 611 664 204 122 - - Exchange gain/(loss) 14 291 697 (26 677) 14 291 697 (26 677) Scrap and services sales (244 580) (3 459) (244 580) (3 459) Sundry income 146 908 406 504 80 614 380 559 Dividend received 195 567 108 729 195 567 108 729 Profit/(loss) on disposal of property, plant and equipment 59 990 (54 929) 59 990 (54 929) 15 061 246 634 290 14 383 288 404 223
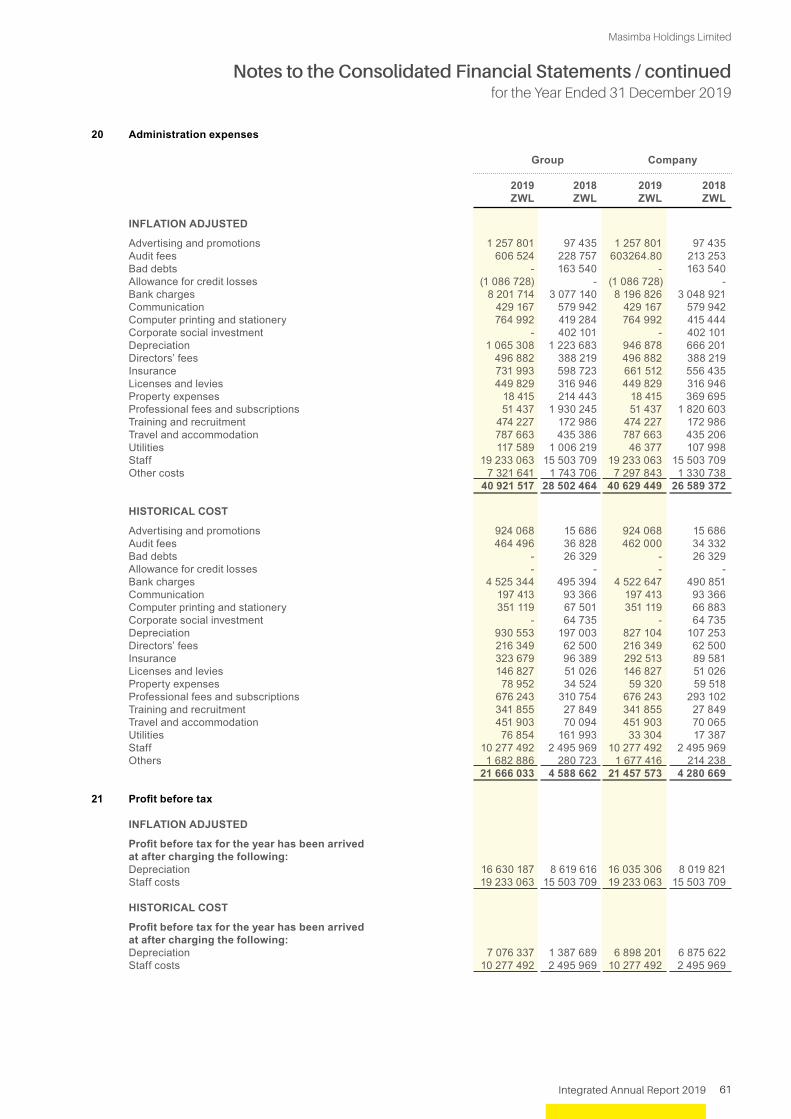
Masimba Holdings Limited
Notes to the Consolidated Financial Statements / continued for the Year Ended 31 December 2019
61Integrated Annual Report 2019
20 Administration expenses
Group Company 2019 2018 2019 2018 ZWL ZWL ZWL ZWL
INFLATION ADJUSTED
Advertising and promotions 1 257 801 97 435 1 257 801 97 435 Audit fees 606 524 228 757 603264.80 213 253 Bad debts - 163 540 - 163 540 Allowance for credit losses (1 086 728) - (1 086 728) - Bank charges 8 201 714 3 077 140 8 196 826 3 048 921 Communication 429 167 579 942 429 167 579 942 Computer printing and stationery 764 992 419 284 764 992 415 444 Corporate social investment - 402 101 - 402 101 Depreciation 1 065 308 1 223 683 946 878 666 201 Directors’ fees 496 882 388 219 496 882 388 219 Insurance 731 993 598 723 661 512 556 435 Licenses and levies 449 829 316 946 449 829 316 946 Property expenses 18 415 214 443 18 415 369 695 Professional fees and subscriptions 51 437 1 930 245 51 437 1 820 603 Training and recruitment 474 227 172 986 474 227 172 986 Travel and accommodation 787 663 435 386 787 663 435 206 Utilities 117 589 1 006 219 46 377 107 998 Staff 19 233 063 15 503 709 19 233 063 15 503 709 Other costs 7 321 641 1 743 706 7 297 843 1 330 738 40 921 517 28 502 464 40 629 449 26 589 372 HISTORICAL COST
Advertising and promotions 924 068 15 686 924 068 15 686 Audit fees 464 496 36 828 462 000 34 332 Bad debts - 26 329 - 26 329 Allowance for credit losses - - - - Bank charges 4 525 344 495 394 4 522 647 490 851 Communication 197 413 93 366 197 413 93 366 Computer printing and stationery 351 119 67 501 351 119 66 883 Corporate social investment - 64 735 - 64 735 Depreciation 930 553 197 003 827 104 107 253 Directors’ fees 216 349 62 500 216 349 62 500 Insurance 323 679 96 389 292 513 89 581 Licenses and levies 146 827 51 026 146 827 51 026 Property expenses 78 952 34 524 59 320 59 518 Professional fees and subscriptions 676 243 310 754 676 243 293 102 Training and recruitment 341 855 27 849 341 855 27 849 Travel and accommodation 451 903 70 094 451 903 70 065 Utilities 76 854 161 993 33 304 17 387 Staff 10 277 492 2 495 969 10 277 492 2 495 969 Others 1 682 886 280 723 1 677 416 214 238 21 666 033 4 588 662 21 457 573 4 280 669 21 Profit before tax INFLATION ADJUSTED
Profit before tax for the year has been arrived at after charging the following: Depreciation 16 630 187 8 619 616 16 035 306 8 019 821 Staff costs 19 233 063 15 503 709 19 233 063 15 503 709
HISTORICAL COST
Profit before tax for the year has been arrived at after charging the following: Depreciation 7 076 337 1 387 689 6 898 201 6 875 622 Staff costs 10 277 492 2 495 969 10 277 492 2 495 969
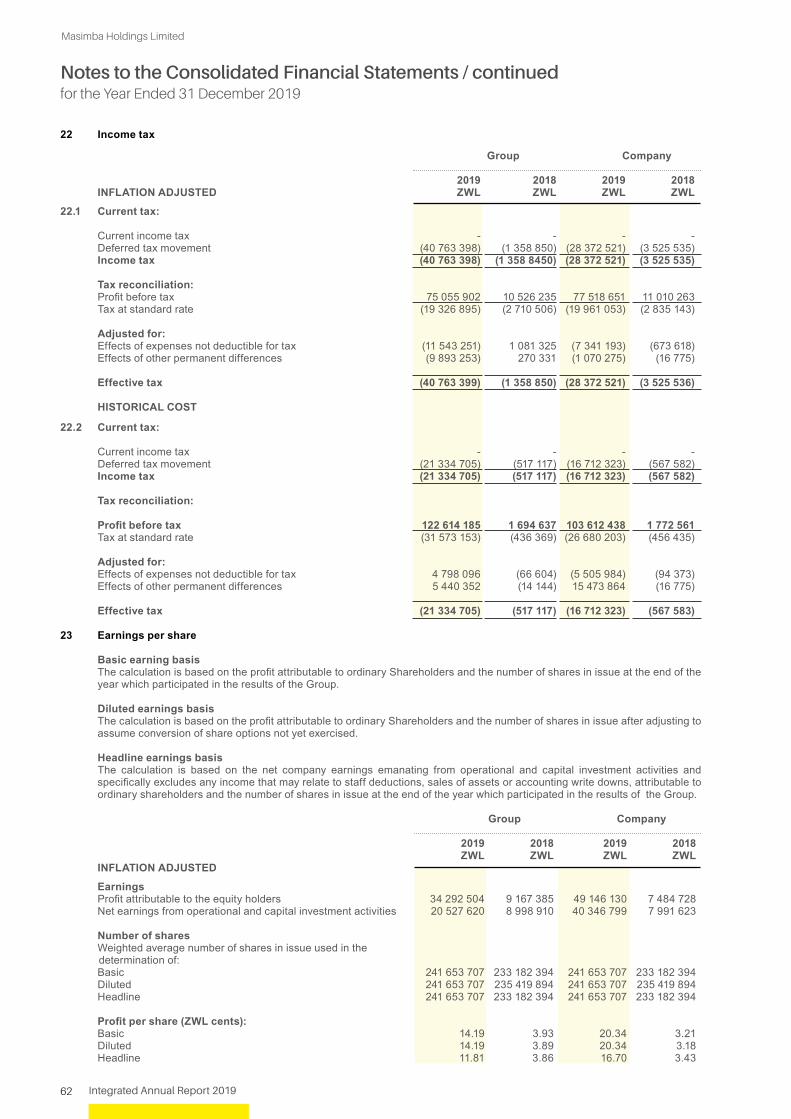
Masimba Holdings Limited
Notes to the Consolidated Financial Statements / continued for the Year Ended 31 December 2019
62 Integrated Annual Report 2019
22 Income tax Group Company 2019 2018 2019 2018 INFLATION ADJUSTED ZWL ZWL ZWL ZWL 22.1 Current tax:
Current income tax - - - - Deferred tax movement (40 763 398) (1 358 850) (28 372 521) (3 525 535) Income tax (40 763 398) (1 358 8450) (28 372 521) (3 525 535) Tax reconciliation: Profit before tax 75 055 902 10 526 235 77 518 651 11 010 263 Tax at standard rate (19 326 895) (2 710 506) (19 961 053) (2 835 143)
Adjusted for: Effects of expenses not deductible for tax (11 543 251) 1 081 325 (7 341 193) (673 618) Effects of other permanent differences (9 893 253) 270 331 (1 070 275) (16 775)
Effective tax (40 763 399) (1 358 850) (28 372 521) (3 525 536) HISTORICAL COST 22.2 Current tax:
Current income tax - - - - Deferred tax movement (21 334 705) (517 117) (16 712 323) (567 582) Income tax (21 334 705) (517 117) (16 712 323) (567 582)
Tax reconciliation: Profit before tax 122 614 185 1 694 637 103 612 438 1 772 561 Tax at standard rate (31 573 153) (436 369) (26 680 203) (456 435) Adjusted for: Effects of expenses not deductible for tax 4 798 096 (66 604) (5 505 984) (94 373) Effects of other permanent differences 5 440 352 (14 144) 15 473 864 (16 775) Effective tax (21 334 705) (517 117) (16 712 323) (567 583) 23 Earnings per share
Basic earning basis The calculation is based on the profit attributable to ordinary Shareholders and the number of shares in issue at the end of the
year which participated in the results of the Group.
Diluted earnings basis The calculation is based on the profit attributable to ordinary Shareholders and the number of shares in issue after adjusting to
assume conversion of share options not yet exercised.
Headline earnings basis The calculation is based on the net company earnings emanating from operational and capital investment activities and
specifically excludes any income that may relate to staff deductions, sales of assets or accounting write downs, attributable to ordinary shareholders and the number of shares in issue at the end of the year which participated in the results of the Group.
Group Company 2019 2018 2019 2018 ZWL ZWL ZWL ZWL INFLATION ADJUSTED
Earnings Profit attributable to the equity holders 34 292 504 9 167 385 49 146 130 7 484 728
Net earnings from operational and capital investment activities 20 527 620 8 998 910 40 346 799 7 991 623 Number of shares Weighted average number of shares in issue used in the determination of: Basic 241 653 707 233 182 394 241 653 707 233 182 394 Diluted 241 653 707 235 419 894 241 653 707 235 419 894 Headline 241 653 707 233 182 394 241 653 707 233 182 394 Profit per share (ZWL cents): Basic 14.19 3.93 20.34 3.21 Diluted 14.19 3.89 20.34 3.18 Headline 11.81 3.86 16.70 3.43
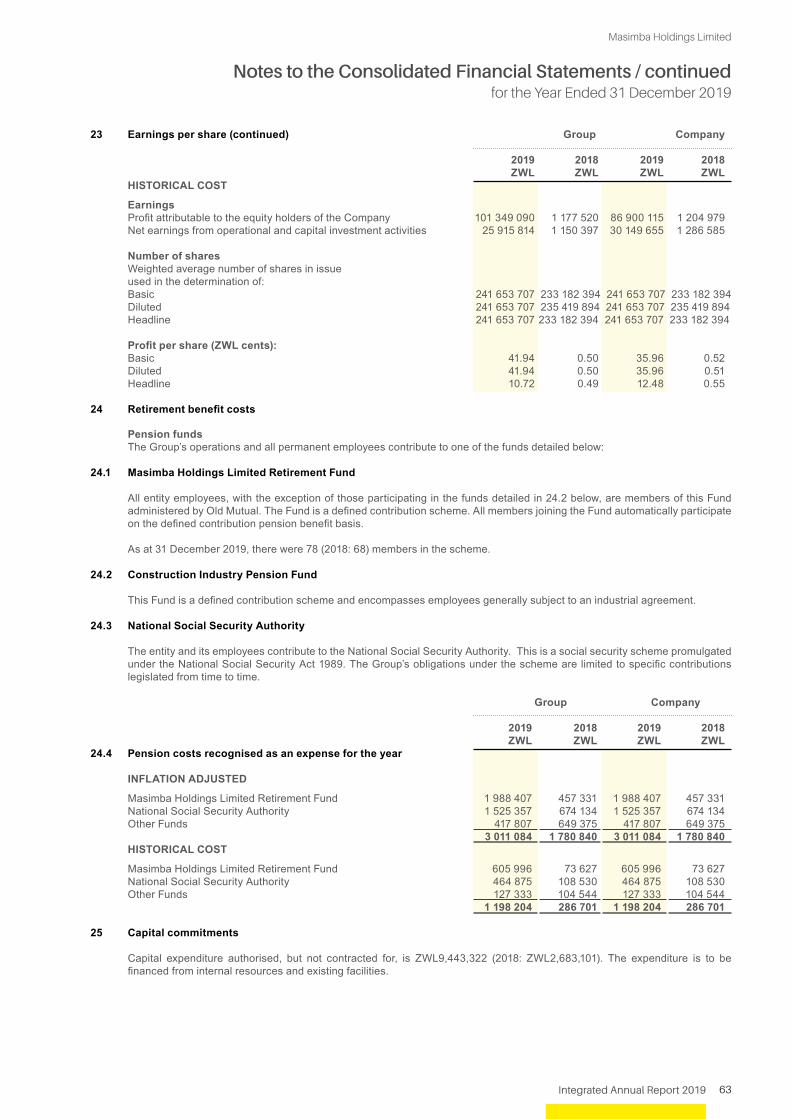
Masimba Holdings Limited
Notes to the Consolidated Financial Statements / continued for the Year Ended 31 December 2019
63Integrated Annual Report 2019
23 Earnings per share (continued) Group Company 2019 2018 2019 2018 ZWL ZWL ZWL ZWL HISTORICAL COST Earnings Profit attributable to the equity holders of the Company 101 349 090 1 177 520 86 900 115 1 204 979 Net earnings from operational and capital investment activities 25 915 814 1 150 397 30 149 655 1 286 585 Number of shares Weighted average number of shares in issue used in the determination of: Basic 241 653 707 233 182 394 241 653 707 233 182 394 Diluted 241 653 707 235 419 894 241 653 707 235 419 894 Headline 241 653 707 233 182 394 241 653 707 233 182 394
Profit per share (ZWL cents): Basic 41.94 0.50 35.96 0.52 Diluted 41.94 0.50 35.96 0.51 Headline 10.72 0.49 12.48 0.55
24 Retirement benefit costs
Pension funds The Group’s operations and all permanent employees contribute to one of the funds detailed below:
24.1 Masimba Holdings Limited Retirement Fund
All entity employees, with the exception of those participating in the funds detailed in 24.2 below, are members of this Fund administered by Old Mutual. The Fund is a defined contribution scheme. All members joining the Fund automatically participate on the defined contribution pension benefit basis.
As at 31 December 2019, there were 78 (2018: 68) members in the scheme.
24.2 Construction Industry Pension Fund
This Fund is a defined contribution scheme and encompasses employees generally subject to an industrial agreement.
24.3 National Social Security Authority
The entity and its employees contribute to the National Social Security Authority. This is a social security scheme promulgated under the National Social Security Act 1989. The Group’s obligations under the scheme are limited to specific contributions legislated from time to time.
Group Company 2019 2018 2019 2018 ZWL ZWL ZWL ZWL24.4 Pension costs recognised as an expense for the year INFLATION ADJUSTED Masimba Holdings Limited Retirement Fund 1 988 407 457 331 1 988 407 457 331 National Social Security Authority 1 525 357 674 134 1 525 357 674 134 Other Funds 417 807 649 375 417 807 649 375 3 011 084 1 780 840 3 011 084 1 780 840 HISTORICAL COST Masimba Holdings Limited Retirement Fund 605 996 73 627 605 996 73 627 National Social Security Authority 464 875 108 530 464 875 108 530 Other Funds 127 333 104 544 127 333 104 544 1 198 204 286 701 1 198 204 286 701 25 Capital commitments
Capital expenditure authorised, but not contracted for, is ZWL9,443,322 (2018: ZWL2,683,101). The expenditure is to be financed from internal resources and existing facilities.

Masimba Holdings Limited
Notes to the Consolidated Financial Statements / continued for the Year Ended 31 December 2019
64 Integrated Annual Report 2019
26 Directors’ interests
The Directors directly/indirectly hold the following number of shares in the Company: Group Company 31 Dec 31 Dec 31 Dec 31 Dec 2019 2018 2019 2018 Director’s Name shares shares shares shares
Canada Malunga Giona Capital (Private) Limited 19 341 960 18 540 814 19 341 960 18 540 814 Paddy Tongai Zhanda Amalgamated Ventures (Private) Limited 25 318 821 25 318 821 25 318 821 25 318 821 Malcom William McCulloch & Mark Mario Di Nicola Zumbani Capital (Private) Limited 68 309 081 65 479 711 68 309 081 65 479 711
27 Borrowing powers
Authority is granted in the Articles of Association for Directors to borrow a sum not exceeding 300% of the ordinary Shareholders’ funds without the prior sanction of an ordinary resolution of the Company.
28 Insurance cover
In the opinion of the Directors the Group’s assets are adequately insured at full replacement cost of current condition and age of the asset.
29 Contingent Liabilities and Contingent Assets
29.1 The Group is from time to time involved in various disputes claims and legal proceedings arising in the ordinary course of the business. The Board does not believe that adverse decisions in any pending proceedings or claims against the Group will have a material effect on the future financial conditions of the Group.
Group Company 2019 2018 2019 2018 ZWL ZWL ZWL ZWL29.2 Bank guarantees in issue as at year end:
Performance bonds 22 674 500 2 500 221 22 674 500 2 500 221 Advance payment bonds 37 872 787 5 617 712 37 872 787 5 617 712 Retention bonds 1 153 640 1 655 678 1 153 640 1 655 678 61 700 927 9 773 611 61 700 927 9 773 611
30 Related party disclosures
The Group’s related parties include joint ventures, common directorship and key management as described below:
30.1 Related party transactions Group Company
INFLATION ADJUSTED 2019ZWL
2018ZWL
2019ZWL
2018ZWL
Related party RelationshipNature of transactions
Reinforcing Steel Contractors Zimbabwe
Common directorship/Shareholding
Purchase of goods 6 540 193 852 317 6 540 193 852 317
Proplastics LimitedCommon directorship/Shareholding
Purchase of goods 3 196 143 1 355 498 3 196 143 1 355 498
Inline Trading (Private) Limited Common directorship
Consultancy services - 248 771 - 248 771
Total transactions reported under cost of sales 9 736 336 2 456 586 9 736 336 2 456 586
Proplastics LimitedCommon directorship/Shareholding
Construction services 68 876 654 35 786 004 68 876 654 35 786 004
Total transactions reported under revenue 68 876 654 35 786 004 68 876 654 35 786 004
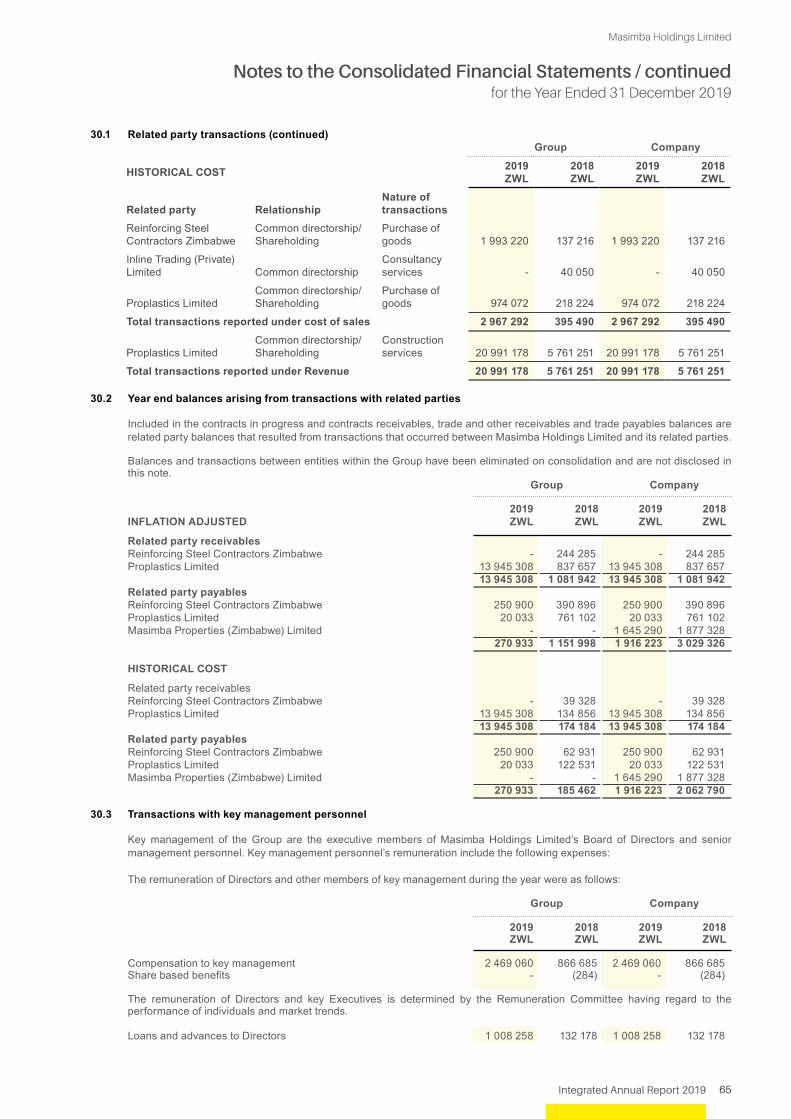
Masimba Holdings Limited
Notes to the Consolidated Financial Statements / continued for the Year Ended 31 December 2019
65Integrated Annual Report 2019
30.1 Related party transactions (continued) Group Company
HISTORICAL COST 2019ZWL
2018ZWL
2019ZWL
2018ZWL
Related party RelationshipNature of transactions
Reinforcing Steel Contractors Zimbabwe
Common directorship/Shareholding
Purchase of goods 1 993 220 137 216 1 993 220 137 216
Inline Trading (Private) Limited Common directorship
Consultancy services - 40 050 - 40 050
Proplastics LimitedCommon directorship/Shareholding
Purchase of goods 974 072 218 224 974 072 218 224
Total transactions reported under cost of sales 2 967 292 395 490 2 967 292 395 490
Proplastics LimitedCommon directorship/Shareholding
Construction services 20 991 178 5 761 251 20 991 178 5 761 251
Total transactions reported under Revenue 20 991 178 5 761 251 20 991 178 5 761 251
30.2 Year end balances arising from transactions with related parties Included in the contracts in progress and contracts receivables, trade and other receivables and trade payables balances are
related party balances that resulted from transactions that occurred between Masimba Holdings Limited and its related parties.
Balances and transactions between entities within the Group have been eliminated on consolidation and are not disclosed in this note.
Group Company 2019 2018 2019 2018 INFLATION ADJUSTED ZWL ZWL ZWL ZWL
Related party receivables Reinforcing Steel Contractors Zimbabwe - 244 285 - 244 285 Proplastics Limited 13 945 308 837 657 13 945 308 837 657 13 945 308 1 081 942 13 945 308 1 081 942 Related party payables Reinforcing Steel Contractors Zimbabwe 250 900 390 896 250 900 390 896 Proplastics Limited 20 033 761 102 20 033 761 102 Masimba Properties (Zimbabwe) Limited - - 1 645 290 1 877 328 270 933 1 151 998 1 916 223 3 029 326 HISTORICAL COST Related party receivables Reinforcing Steel Contractors Zimbabwe - 39 328 - 39 328 Proplastics Limited 13 945 308 134 856 13 945 308 134 856 13 945 308 174 184 13 945 308 174 184 Related party payables Reinforcing Steel Contractors Zimbabwe 250 900 62 931 250 900 62 931 Proplastics Limited 20 033 122 531 20 033 122 531 Masimba Properties (Zimbabwe) Limited - - 1 645 290 1 877 328 270 933 185 462 1 916 223 2 062 790
30.3 Transactions with key management personnel
Key management of the Group are the executive members of Masimba Holdings Limited’s Board of Directors and senior management personnel. Key management personnel’s remuneration include the following expenses:
The remuneration of Directors and other members of key management during the year were as follows:
Group Company 2019 2018 2019 2018 ZWL ZWL ZWL ZWL
Compensation to key management 2 469 060 866 685 2 469 060 866 685 Share based benefits - (284) - (284) The remuneration of Directors and key Executives is determined by the Remuneration Committee having regard to the
performance of individuals and market trends.
Loans and advances to Directors 1 008 258 132 178 1 008 258 132 178

Masimba Holdings Limited
Notes to the Consolidated Financial Statements / continued for the Year Ended 31 December 2019
66 Integrated Annual Report 2019
Terms and Conditions: The loan amount limit ranges from 100% to 130% of annual salary and is subject to cash flow and Remuneration Committee approval. The annual interest rate is the lower of 50% of minimum Bank lending rate and 150% of the income tax deemed interest rate. The repayment period is six (6) months to two (2) years.
31 Financial instruments
(a) Significant accounting policies
Details of the significant accounting policies and methods adopted including the criteria for recognition, the basis of measurement and the basis on which income and expenses are recognised in respect of each class of financial assets, financial liability and equity instruments, are disclosed per note 3.
(b) Categories of financial instruments Group Company 2019 2018 2019 2018 Financial Assets ZWL ZWL ZWL ZWL
Cash and cash equivalents 11 825 920 1 294 967 11 669 789 3 767 747 Loans and receivables and contract receivables 172 441 262 15 106 704 171 680 139 19 950 785 Financial assets carried at fair value 11 955 332 2 795 681 11 955 332 2 795 681 Financial liabilities Borrowings and payables 200 001 919 17 338 799 185 335 136 22 575 308 (c) Fair value of financial instruments
The fair value of financial assets and financial liabilities approximate the carrying values in the statement of financial position as at 31 December 2019.
32 Financial risk management The entity’s financial liabilities comprise bank loans and overdrafts and trade and other payables. The main purpose of
these financial instruments is to raise finance for the entity’s operations. The entity has various financial assets such as trade receivables, cash and short term deposits which arise directly from its operations. The entity does not use derivative financial instruments in its management of foreign currency risk. Derivative financial instruments are not held or issued for trading purposes.
The main risks arising from the entity’s financial instruments are cash flow risk, foreign currency risk, interest rate risk, credit risk and liquidity risk. Senior Executives of the Group meet on a regular basis to review and agree on policies to manage each of these risks. Treasury management strategies together with currency and interest rate exposures are re-evaluated against revised economic forecasts. Compliance with the Group policies and exposure limits are reviewed at Audit and Compliance Committee meetings.
32.1 Foreign exchange risk management
The Group undertakes certain transactions denominated in currencies other than the ZWL hence exposure to exchange rate fluctuations arises.
Currency (US$) Foreign 2019 Balance ZWL Equivalent
Bank Balances 57 280 960 780 Contracts receivables and other receivables 380 624 6 384 359 Payables (231 293) (3 879 570) 206 611 3 465 569
Given the amounts and types of currency held, the Group has no significant exposure to foreign currency risk at year end.
32.2 Fair values of financial instruments
The estimated net fair values of all financial instruments approximate the carrying amounts shown in the financial statements. Assets and liabilities denominated in currencies other than the ZWL which were on hand at the statement of financial position date have been valued for the purpose of these financial statements at official rates of exchange as the Directors are of the opinion that the official rate fairly reflects the value of such assets and liabilities for accounting purposes.
32.3 Interest risk
The entity’s treasury policy limits exposure to interest rate fluctuations by adopting a non-speculative approach to managing interest rate risk and only deals in approved financial instruments. Implementation of treasury policy ensures limited exposure to funding instruments while investment instruments are those which provide risk free returns at variable interest rates and mature within one year.
32.4 Credit risk Financial assets which potentially subject the entity to concentration of credit risk consist principally of cash, short-term
deposits and trade receivables. The entity’s surplus cash equivalents and short-term deposits are placed with high quality

Masimba Holdings Limited
Notes to the Consolidated Financial Statements / continued for the Year Ended 31 December 2019
67Integrated Annual Report 2019
creditworthy financial institutions. The trade receivables are presented net of the allowance for credit losses and comprise a large, widespread customer base and the Group monitors the performance and financial condition of its customers so that the exposure to bad debts is not significant.
32.5 Liquidity risk The entity monitors its risk of shortage of funds using a liquidity planning tool. The entity considers the maturity of both its
financial investments and financial assets (e.g. receivables) and projected cash flows from operations. The entity’s main object is to maintain short term bank loans at a manageable level.
32.6 Capital risk management
The entity manages its capital structure to ensure that it will be able to continue as a going concern, while maximising the return to stakeholders through the optimisation of debt and equity.
The capital structure of the entity consists of debt, which includes borrowings and finance leases as disclosed in Note 12 and 13 respectively, interest bearing borrowings and equity attributable to equity holders of the parent, comprising issued share capital, reserves and retained earnings.
The Group’s Audit and Complaince Committee reviews the capital structure on a quarterly basis. As part of this review, the Committee considers the cost of capital and the risks associated with each class of capital. Based on the recommendations of the Committee, the entity will balance its overall structure through payments of dividends, new share issues and share buy backs as well as the issue of new debt or the redemption of existing debt.
33. Joint Operations
Details of material joint operations
Principal Activity
Proportion of ownership interest voting rights held by Masimba
December 2019%
December 2018%
Masimba Construction Zimbabwe and Kuchi Construction (Private) Limited
NUST Library 50 50
Masimba Construction Zimbabwe and Tencraft (Private) Limited
Tuli River Bridge 50 50
The above joint operations are accounted for using the proportional consolidation method in these consolidated financial statements.
The summarised financial information in respect of the Group’s joint operations is set out below:
Group Company
2019 2018 2019 2018 INFLATION ADJUSTED ZWL ZWL ZWL ZWL Non-current assets Current assets - - - 315 371 Current liabilities (111 766) (111 766) (111 766) (111 766)
The above amounts of assets and liabilities include the following:
Cash and cash equivalent - - - - Short term investments - - - - Revenue - - - - Profit for the period - 383 288 - 383 288 The above profit/(loss) for the year includes the following items: Depreciation and amortisation - - - -
HISTORICAL COST
Non-current assets Current assets 315 371 315 371 315 371 315 371
Current liabilities (111 766) (111 766) (111 766) (111 766)
The above amounts of assets and liabilities include the following:
Cash and cash equivalent - - - - Short term investments - - - - Revenue - - - - Profit for the period - 61 706 - 61 706 The above profit/(loss) for the year includes the following items: Depreciation and amortisation - - - -

Masimba Holdings Limited
Notes to the Consolidated Financial Statements / continued for the Year Ended 31 December 2019
68 Integrated Annual Report 2019
34 Going Concern
The Directors have assessed the ability of the entity to continue operating as a going concern and believe that the preparation of these financial statements on a going concern basis is still appropriate. However, the Directors believe that under the current economic environment a continuous assessment of the ability of the entity to continue to operate as a going concern will need to be performed to determine the continued appropriateness of the going concern assumption that has been applied in the preparation of these financial statements.
The novel coronavirus, Covid 19 pandemic has been identified as a development that has potential to affect Group’s business operations. At the time of preparation of this report, the full extent of this threat on the Group’s operations was yet to be fully understood.
35 Approval of financial statements
The financial statements were approved by the Board of Directors and authorised for issue on 29 April 2020.
36 Events after reporting period
36.1 The Coronavirus pandemic (COVID-19)
In December 2019, a novel strain of the coronavirus was reported in Wuhan, China. The World Health Organisation has declared the outbreak to constitute a “Public Health Emergency of International Concern”. His Excellency President Emmerson Mnangagwa on 17 March 2020 declared the outbreak of the Coronavirus as a National Disaster. The Board believes that the Coronavirus is likely to negatively impact on the business performance, however its impact is likely dependent on certain developments which include, duration and spread of the outbreak, impact on our customers, suppliers and employees. The related financial impact cannot be reasonably estimated at this time.
36.2 Approval of Blocked Funds
On the 13th of February 2020, the Reserve Bank of Zimbabwe approved the Group’s Blocked Funds application amount of US$231,293.11 and these liabilities have been re-translated to RTGS Dollars based on the closing interbank rate as at 31 December 2019.

69Integrated Annual Report 2019
Masimba Holdings Limited
Shareholder Spread
Range Number of Shareholders % of Holders Holdings % of Issued Shares
1-500 189 19.59 43 804 0.02
501-1 000 115 11.92 101 755 0.04
1 001-5 000 295 30.57 897 666 0.37
5 001-10 000 116 12.02 920 070 0.38
10 001-50 000 132 13.67 3 323 016 1.38
50 001 and over 118 12.23 236 367 396 97.81
965 100 241 653 707 100
Major ShareholdersRank Shareholder Number of Shares % of Total
1 Zumbani Capital (Private) Limited 68 309 081 28.27
2 Old Mutual Life Assurance Company of Zimbabwe Limited 39 446 671 16.32
3 Amalgamated African Ventures 25 318 821 10.48
4 Giona Capital (Private) Limited 19 341 960 8.00
5 Stanbic Nominees (Private) Limited (NNR) 16 808 998 6.96
6 Mega Market (Private) Limited 16 400 971 6.79
7 Stanbic Nominees (Private) Limited 14 165 335 5.86
8 OMZIL Strategic Shareholder Trap Fund 8 046 331 3.33
9 Standard Chartered Nominees (Private) Limited 6 055 784 2.51
10 Old Mutual Zimbabwe Limited 2 743 915 1.14
216 637 873 89.65
Analysis by Category2019 2018
% %Bank insurance companies and nominees 21.02 25.44
Pension funds and Trust/Property companies 8.94 10.73
Resident individuals and other corporate companies 62.04 55.83
Foreign companies 8.00 8.00
100 100
Shareholders Analysis as at 31 December 2019

70 Integrated Annual Report 2019
Masimba Holdings Limited
29 June 2020 Forty-fifth Annual Report to be Published on the Company’s website
21 July 2020 Virtual Forty-fifth Annual General Meeting of Shareholders
September 2020 Interim Press Results
November 2020 Third Quarter Trading Update
March 2021 Preliminary Announcement to Shareholders
May 2021 Forty-sixth Annual Report to be Published on the Company’s website
May 2021 First Quarter Trading Update
June 2021 Virtual Forty-sixth Annual General Meeting
CORPORATE AND ADVISORY INFORMATION
Company Registration Number 278/74
Business Address and Registered OfficePostal AddressTelephoneEmail Website
44 Tilbury Road, Willowvale, Harare, ZimbabweP.O. Box CY490, Causeway, Harare, Zimbabwe+263 242 611 641-5 or 611 741-9+263 772 220 921/2 or 712 806 600/[email protected]
Share Transfer Secretaries
Telephone
First Transfer Secretaries1 Armagh Road, EastleaHarare, Zimbabwe
+263 242 782 864-72
Auditors Grant Thornton135 Enterprise RoadHighlandsHarare, Zimbabwe
Bankers Standard Chartered Bank Zimbabwe LimitedAfrica Unity Square BranchNelson Mandela AvenueHarare, Zimbabwe
FBC Banking Corporation LimitedFBC Centre, 45 Nelson Mandela AvenueHarare, Zimbabwe
Lawyers Atherstone & Cook Legal PractitionersPraetor House119 Josiah Chinamano AvenueHarare, Zimbabwe
Shareholders Diary

71Integrated Annual Report 2019
Masimba Holdings Limited
Notice to Shareholders
Notice is hereby given that the Forty-fifth Annual General Meeting of Members of Masimba Holdings Limited, for the year ended 31 December 2019, will be held virtually on Tuesday 21 July 2020 at 1200 hours for the purposes of transacting the following business:
1. SPECIAL BUSINESS
1.1 Resolution on Holding of Shareholders’ Meetings Electronically To approve the holding of the Annual General Meetings and other Shareholder Meetings by virtual/electronic means.
2. ORDINARY BUSINESS
2.1 Approval of Financial Statements and Reports To receive, consider and adopt the Annual Financial Statements for the year ended 31 December 2019, including the Directors’
and Independent Auditors’ reports thereon.2.2 Approval of Directors’ Fees Approval of Directors’ fees for the year ended 31 December 2019.2.3 Election of Directors In accordance with Articles 114 of the Company’s Articles of Association, Messrs. Paddy Tongai Zhanda and Malcolm William
McCulloch retire by rotation at the Company’s Annual General Meeting and being eligible offer themselves for re-election.2.4 Dividend To confirm the declaration of a final dividend of ZWL0.83 cents per share for the year ended 31 December 2019.2.5 Auditors
2.5.1 To approve the remuneration of auditors for the previous year.2.5.2 To consider the appointment of Messrs. Grant Thornton as auditors for the ensuing year.
Note: In terms of Section 69(6) of the Zimbabwe Stock Exchange Listing Requirements, Companies must change their audit partners every five years and their audit firm every ten years. Grant Thornton Chartered Accountants (Zimbabwe) has been the auditor for the Company for the past four years, therefore are still eligible to be the auditor for the Company.
3. SPECIAL BUSINESS
3.1 Share Buyback To consider, and if deemed fit, to pass with or without modification, the following special resolution, “That the Company, as
duly authorised by section 129 of the Companies and Other Business Entities Act (Chapter 24:31) and the Zimbabwe Stock Exchange listing requirements, may purchase its own ordinary shares in such manner or on such terms as the Directors may from time to time determine and provided that:
a) the repurchases are not made at a price greater than five percent (5%) above nor five percent (5%) below the weighted average of the market price at which such ordinary shares are traded on the Zimbabwe Stock Exchange as determined over the five (5) business days immediately preceding the date of the repurchase.
b) the maximum number of shares authorised to be acquired shall not exceed ten percent (10%) of the Company’s issued ordinary share capital.
c) This authority shall expire at the next Annual General Meeting and shall not extend beyond fifteen (15) months from the date of this resolution.’’
Directors’ StatementThe Directors, in considering the effect of any such repurchase, will duly take into account the ability of the Company for a period of twelve (12) months to pay its debts in the ordinary course of business, the maintenance of an excess of assets over liabilities, and the adequacy of ordinary capital and reserves as well as adequacy of working capital.
Details of the MeetingShareholders are advised that the details of the meeting will be available on the Company’s website, www.masimbagroup.com, on 6 July 2020. Alternatively, Shareholders may contact First Transfer Secretaries at 1 Armagh Road, Eastlea, Harare, Zimbabwe.
Audited Financial StatementsThe electronic copies of the Company’s 2019 Annual Report, the financial statements and the Directors’ and Independent Auditors’ reports for the financial year ended 31 December 2019 will be available on or before 6 July 2020. These documents, which will also be available on the Company’s website, www.masimbagroup.com, will be emailed to the Shareholders whose email addresses are on record.
By Order of the Board
MASIMBA CORPORATE SERVICES (PRIVATE) LIMITED(Secretaries)
29 June 2020
Note: A member entitled to attend and vote at the Annual General Meeting of Shareholders may appoint a proxy to attend and speak and, on poll, vote in his stead. A proxy need not to be a member of the Company. Forms of proxy must be lodged at the Registered Office of the Company or emailed to [email protected] not less than forty-eight (48) hours before the time of holding of the meeting.
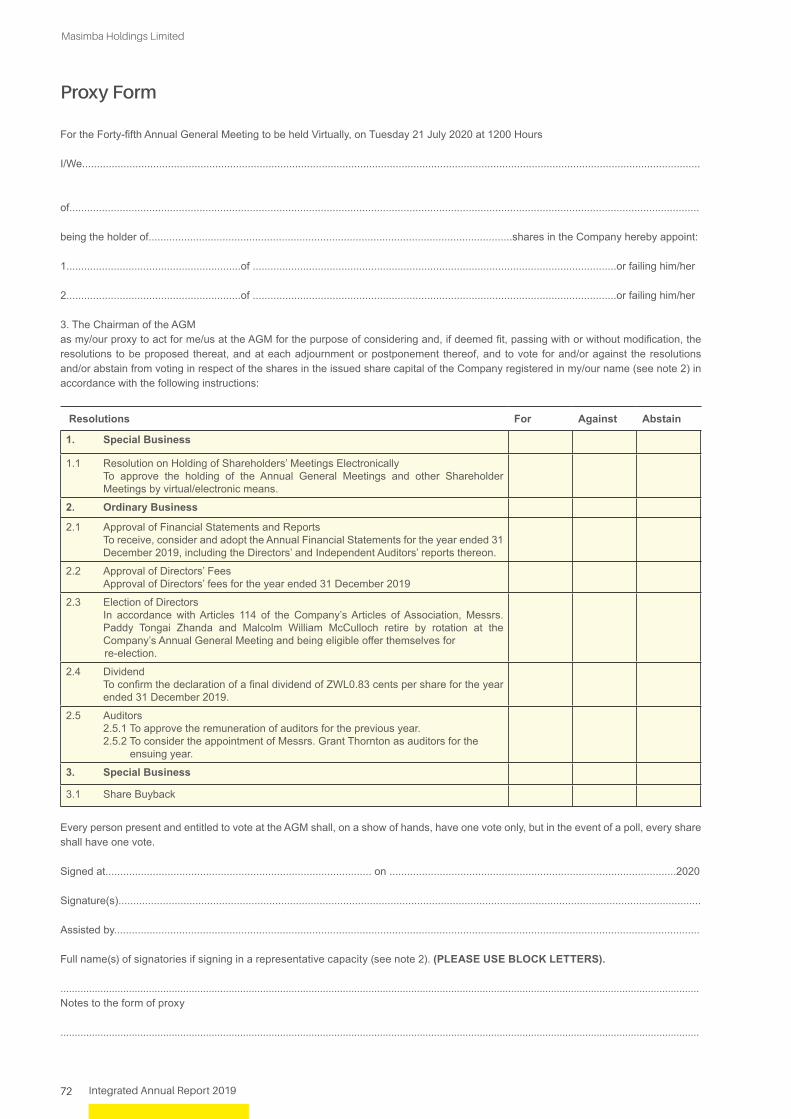
72 Integrated Annual Report 2019
Masimba Holdings Limited
For the Forty-fifth Annual General Meeting to be held Virtually, on Tuesday 21 July 2020 at 1200 Hours
I/We.................................................................................................................................................................................................................
of.....................................................................................................................................................................................................................
being the holder of...........................................................................................................................shares in the Company hereby appoint:
1...........................................................of ...........................................................................................................................or failing him/her
2...........................................................of ...........................................................................................................................or failing him/her
3. The Chairman of the AGMas my/our proxy to act for me/us at the AGM for the purpose of considering and, if deemed fit, passing with or without modification, the resolutions to be proposed thereat, and at each adjournment or postponement thereof, and to vote for and/or against the resolutions and/or abstain from voting in respect of the shares in the issued share capital of the Company registered in my/our name (see note 2) in accordance with the following instructions:
Resolutions For Against Abstain
1. Special Business
1.1 Resolution on Holding of Shareholders’ Meetings Electronically To approve the holding of the Annual General Meetings and other Shareholder
Meetings by virtual/electronic means.
2. Ordinary Business
2.1 Approval of Financial Statements and Reports To receive, consider and adopt the Annual Financial Statements for the year ended 31
December 2019, including the Directors’ and Independent Auditors’ reports thereon.
2.2 Approval of Directors’ Fees Approval of Directors’ fees for the year ended 31 December 2019
2.3 Election of Directors In accordance with Articles 114 of the Company’s Articles of Association, Messrs.
Paddy Tongai Zhanda and Malcolm William McCulloch retire by rotation at the Company’s Annual General Meeting and being eligible offer themselves for
re-election.
2.4 Dividend To confirm the declaration of a final dividend of ZWL0.83 cents per share for the year
ended 31 December 2019.
2.5 Auditors 2.5.1 To approve the remuneration of auditors for the previous year. 2.5.2 To consider the appointment of Messrs. Grant Thornton as auditors for the ensuing year.
3. Special Business
3.1 Share Buyback
Every person present and entitled to vote at the AGM shall, on a show of hands, have one vote only, but in the event of a poll, every share shall have one vote.
Signed at.......................................................................................... on .................................................................................................2020
Signature(s).....................................................................................................................................................................................................
Assisted by......................................................................................................................................................................................................
Full name(s) of signatories if signing in a representative capacity (see note 2). (PLEASE USE BLOCK LETTERS).
................................................................................................................................................................................................................................Notes to the form of proxy
................................................................................................................................................................................................................................
Proxy Form
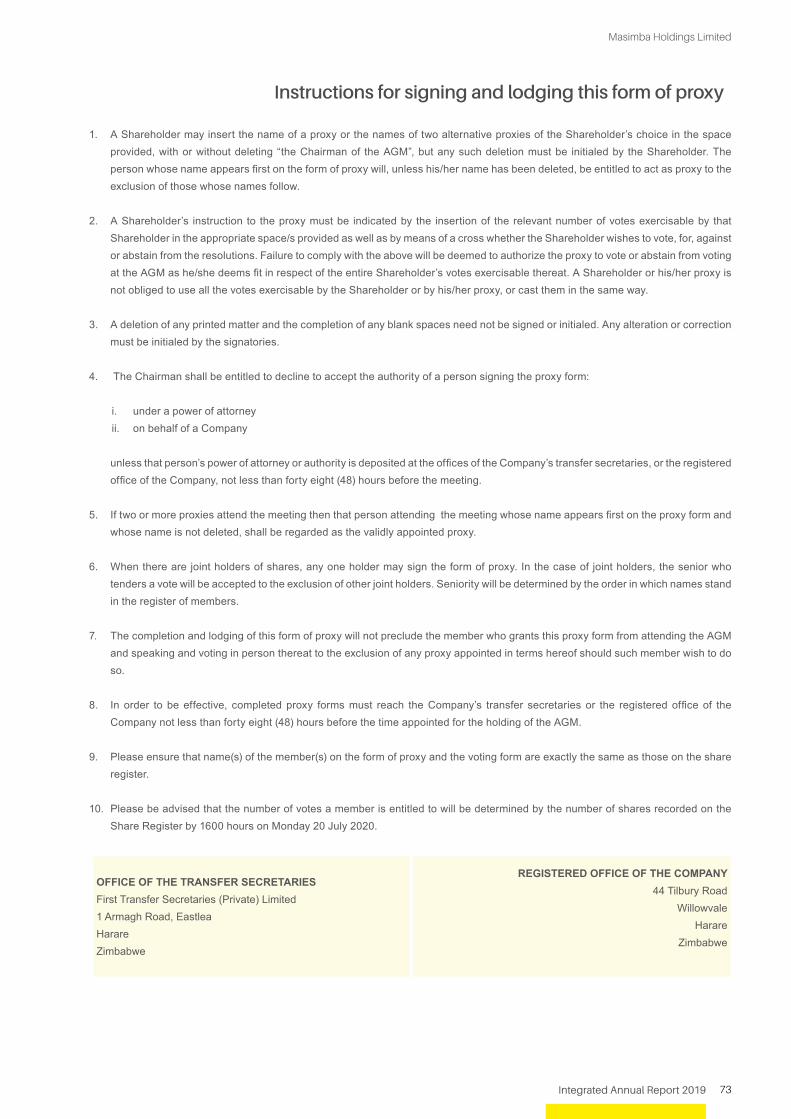
73Integrated Annual Report 2019
Masimba Holdings Limited
1. A Shareholder may insert the name of a proxy or the names of two alternative proxies of the Shareholder’s choice in the space provided, with or without deleting “the Chairman of the AGM”, but any such deletion must be initialed by the Shareholder. The person whose name appears first on the form of proxy will, unless his/her name has been deleted, be entitled to act as proxy to the exclusion of those whose names follow.
2. A Shareholder’s instruction to the proxy must be indicated by the insertion of the relevant number of votes exercisable by that Shareholder in the appropriate space/s provided as well as by means of a cross whether the Shareholder wishes to vote, for, against or abstain from the resolutions. Failure to comply with the above will be deemed to authorize the proxy to vote or abstain from voting at the AGM as he/she deems fit in respect of the entire Shareholder’s votes exercisable thereat. A Shareholder or his/her proxy is not obliged to use all the votes exercisable by the Shareholder or by his/her proxy, or cast them in the same way.
3. A deletion of any printed matter and the completion of any blank spaces need not be signed or initialed. Any alteration or correction must be initialed by the signatories.
4. The Chairman shall be entitled to decline to accept the authority of a person signing the proxy form:
i. under a power of attorney ii. on behalf of a Company
unless that person’s power of attorney or authority is deposited at the offices of the Company’s transfer secretaries, or the registered office of the Company, not less than forty eight (48) hours before the meeting.
5. If two or more proxies attend the meeting then that person attending the meeting whose name appears first on the proxy form and whose name is not deleted, shall be regarded as the validly appointed proxy.
6. When there are joint holders of shares, any one holder may sign the form of proxy. In the case of joint holders, the senior who tenders a vote will be accepted to the exclusion of other joint holders. Seniority will be determined by the order in which names stand in the register of members.
7. The completion and lodging of this form of proxy will not preclude the member who grants this proxy form from attending the AGM and speaking and voting in person thereat to the exclusion of any proxy appointed in terms hereof should such member wish to do so.
8. In order to be effective, completed proxy forms must reach the Company’s transfer secretaries or the registered office of the Company not less than forty eight (48) hours before the time appointed for the holding of the AGM.
9. Please ensure that name(s) of the member(s) on the form of proxy and the voting form are exactly the same as those on the share register.
10. Please be advised that the number of votes a member is entitled to will be determined by the number of shares recorded on the Share Register by 1600 hours on Monday 20 July 2020.
OFFICE OF THE TRANSFER SECRETARIESFirst Transfer Secretaries (Private) Limited1 Armagh Road, EastleaHarare Zimbabwe
REGISTERED OFFICE OF THE COMPANY 44 Tilbury Road
WillowvaleHarare
Zimbabwe
Instructions for signing and lodging this form of proxy
74 Integrated Annual Report 2019
Masimba Holdings Limited
Notes

www.masimbagroup.com