Field water balance of final landfill covers: The USEPA’s ... · Field water balance of final...
36
Field water balance of final landfill covers: The USEPA’s Alternative Cover Assessment Program (ACAP) William H. Albright Desert Research Institute, University of Nevada and Craig H. Benson University of Wisconsin-Madison
Transcript of Field water balance of final landfill covers: The USEPA’s ... · Field water balance of final...

Field water balance of final landfill covers: The USEPA’s Alternative Cover Assessment Program (ACAP)
William H. Albright Desert Research Institute, University of Nevada
and
Craig H. BensonUniversity of Wisconsin-Madison

Final covers - the issues
• Lack of field-scale performance data• Excessive uncertainty in modeled predictions• No specified design process
Presented here...
• Field data from ACAP• A suggestion for acceptable use of models• A design process for engineers and regulators

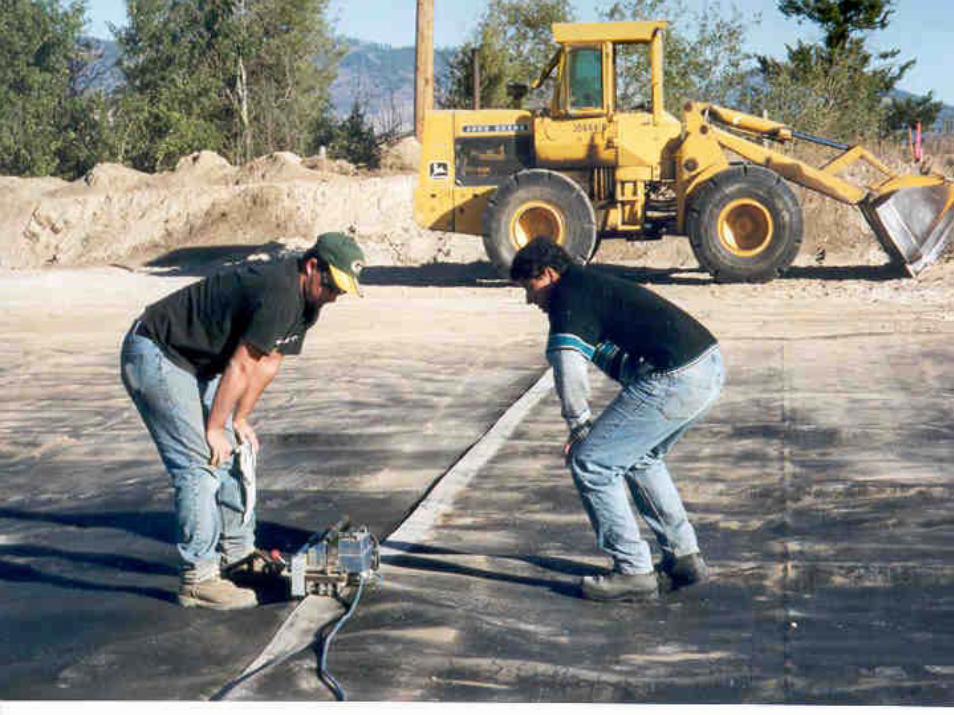
ACAP: The Field Program
• Nationwide: 11 sites, 7 states• Large (10 X 20 m) drainage lysimeters• Conventional covers
– Composite– Soil barrier
• Alternative covers– Evapotranspiration (ET)– Capillary barrier
• Side-by-side demonstration at most sites

ACAP Site Locations


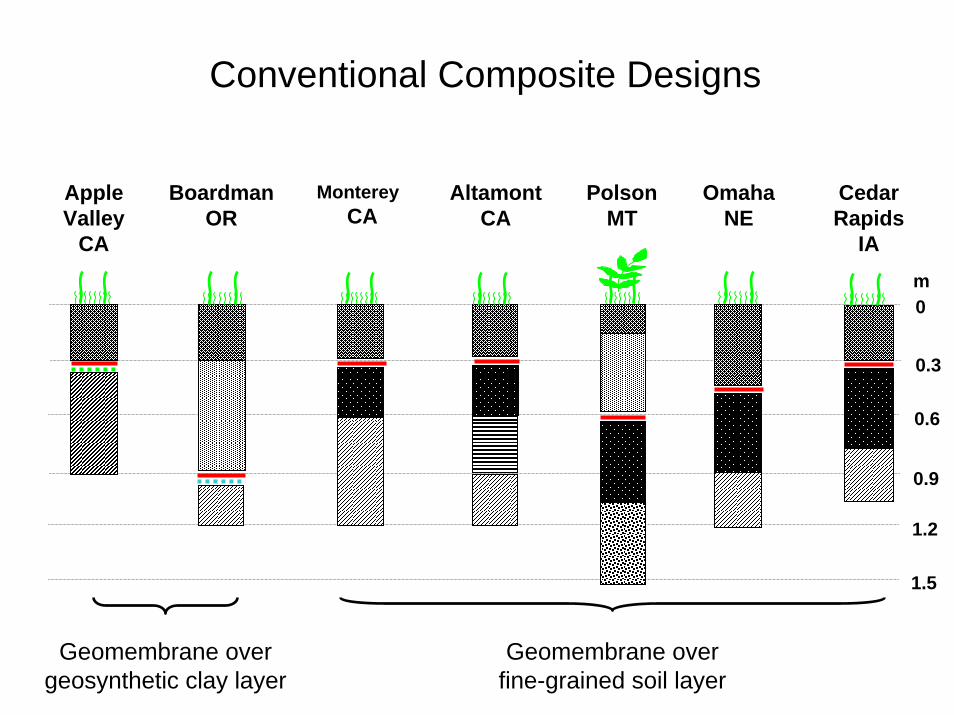
Conventional Composite Designs
0
0.3
0.6
0.9
1.2
1.5
m
OmahaNE
AltamontCA
MontereyCA
PolsonMT
Cedar Rapids
IA
BoardmanOR
Apple Valley
CA
Geomembrane over geosynthetic clay layer
Geomembrane over fine-grained soil layer
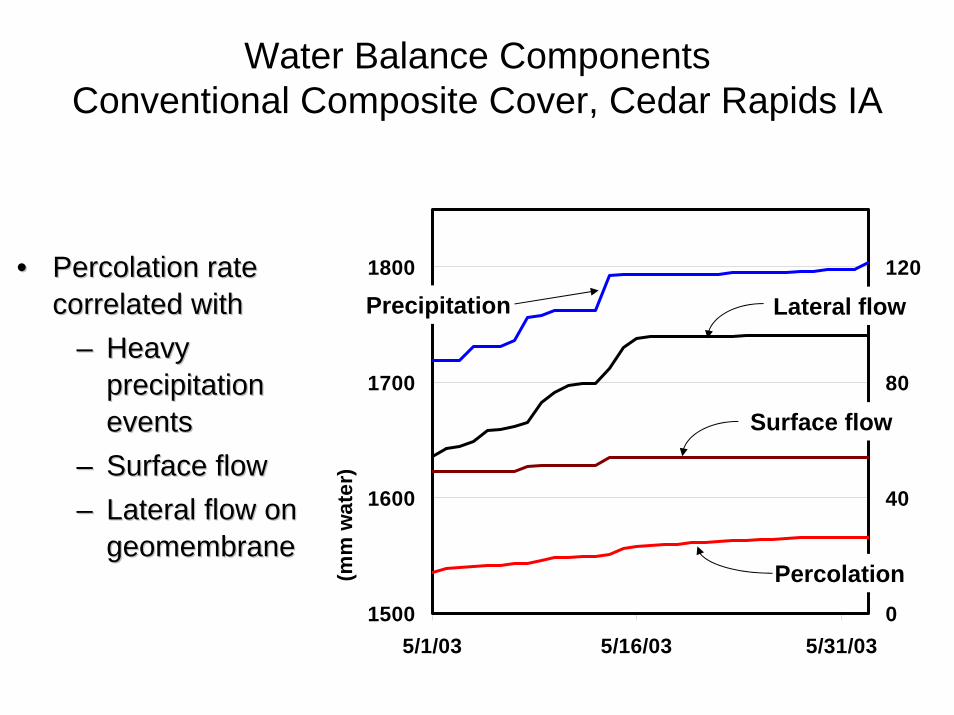
Water Balance ComponentsConventional Composite Cover, Cedar Rapids IA
1500
1600
1700
1800
5/1/03 5/16/03 5/31/03
(mm
wat
er)
0
40
80
120
Precipitation Lateral flow
Percolation
Surface flow
•• Percolation rate Percolation rate correlated withcorrelated with
–– Heavy Heavy precipitation precipitation eventsevents
–– Surface flowSurface flow–– Lateral flow on Lateral flow on
geomembranegeomembrane

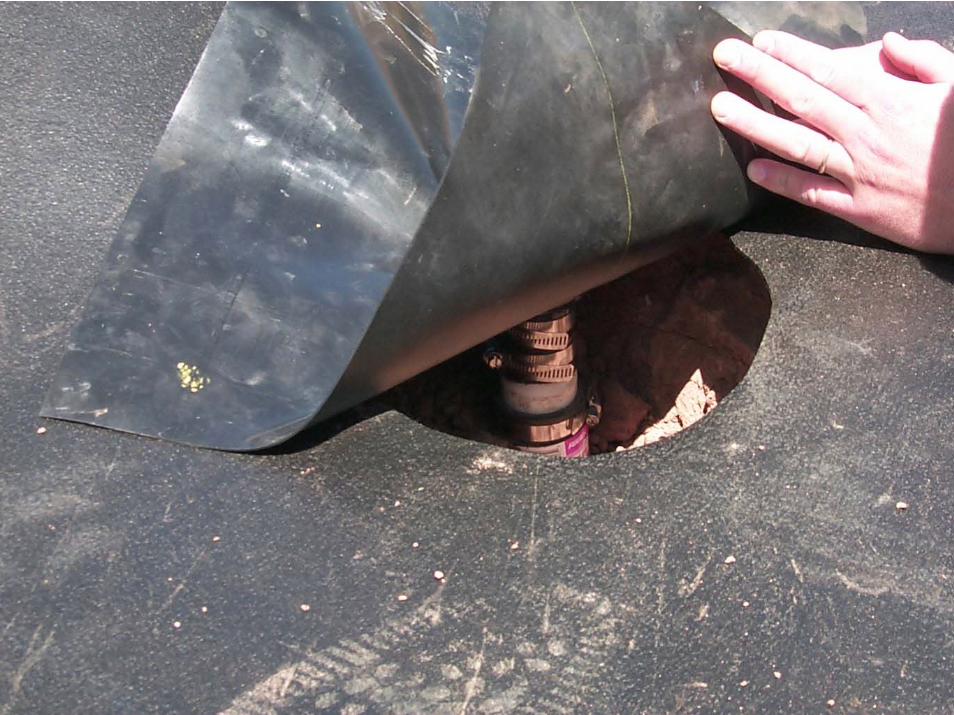
Water Balance ComponentsConventional Composite Cover, Marina CA
•• Percolation Percolation coincides with coincides with precipitation, surface precipitation, surface and lateral flowand lateral flow
•• Relatively high rate Relatively high rate of percolationof percolation
•• No cushion between No cushion between the geomembrane the geomembrane and the soil, and the soil, punctures likely in punctures likely in geomembranegeomembrane
600
700
800
900
8/22/02 10/11/02 11/30/02 1/19/03 3/10/030
50
100
150
Precipitation
Lateral flow
Percolation
Surface flow
•• Illustrates importance of careful geomembrane installationIllustrates importance of careful geomembrane installation

Conventional Composite CoversDiscussion
• Perform well at all locations• Average percolation typically <1.5% of
precipitation<1.5 mm/yr at arid/semi-arid/subhumid sites<12 mm/yr at humid locations
• Percolation often linked to heavy precipitation events and lateral flow
• Damage to geomembrane greatly increases percolation rate
• Construction practice and quality control are very important

Conventional Composite Cover Data
Percolation (Water Year: July 1– June 30)Total Precipitation(July 1– June 30)
(mm)Site Duration(Days)
Slope(%)
00-01 01-02 02-03
AltamontCA 781 5 NF 291.1 394.2 59.0
(6.5%)4.0
(0.4%)825.0(91%)
4.0(0.4%) NF 0.0
(0.0%)4.0
(1.0%)1.5
(0.4%)
Apple Valley
CA251 5 NA NF 148.0 6.8
(4.6%)0.0
(0.0%)134.14(91%)
0.0(0.0%) NA NF 0.0
(0.0%)0.0
(0.0%)
BoardmanOR 747 25 NF 134.4 125.5 0.0
(0.0%)0.2
(0.1%)366.4
(109%)0.0
(0.0%) NF 0.0(0.0%)
0.0(0.0%)
0.0(0.0%)
MarinaCA 947 25 288.0 335.0 343.7d 98.7
(10.%)47.4
(4.9%)789.6(82%)
71.0(7.3%)
9.0(3.1%)
25.3(7.6%)
36.2(10.5%)
23.1(7.3%)
PolsonMT 1137 5 350.0 292.1 290.6 17.7
(1.6%)40.5
(3.6%)1052.5(94%)
1.5(0.1%)
1.2(0.3%)
0.0(0.0%)
0.0(0.0%)
0.4(0.1%)
Cedar Rapids
IA621 5 NF NF 791.2 54.1
(2.8%)96.2
(5.0%)1725.5(91%)
26.9(1.4%) NF NF 21.0
(2.7%)12.2
(1.4%)
OmahaNE 815 25 NF 561.4 474.5 86.8
(5.8%)43.3
(2.9%)1266.0(85%)
16.5(1.1%)
8.5c
(1.4%)1.0
(0.2%)9.2
(1.9%)6.0
(1.1%)
Total(mm)
00-01(mm/yr)
01-02 (mm/yr)
02-03 (mm/yr)
Average(mm/yr)
Surface Runoff(mm)
Lateral Flow(mm)
ET(mm)
(% = percent of precipitation)

Conventional Soil Barrier Designs
0
0.3
0.6
0.9
1.2
1.5
m
Cedar Rapids
IA
AlbanyGA
Apple Valley
CA

Water Balance ComponentsConventional Soil Barrier Cover, Albany GA
50
300
550
800
7/1/00 9/1/00 11/2/00 1/3/010
75
150
225
Precipitation
Percolation
Soil water storageNo rain
3/4/02
mm
wat
er
•• Soil dried for first Soil dried for first time during 6time during 6--week droughtweek drought
•• Change in Change in response of response of percolation to percolation to precipitation precipitation eventsevents
–– QuantityQuantity–– “Stair step” “Stair step”
responseresponse
•• No evidence that defects in clay barrier healed when soil No evidence that defects in clay barrier healed when soil water increasedwater increased


Change in saturated hydraulic conductivity in a compacted clay barrier
77,5003.1x10-3TSB - 3
8003.2x10-5TSB - 2
13005.2x10-5TSB - 1
50002.0x10-4SDRI
1.04.0x10-8As-Built
Kf/Ko
Hydraulic Conductivity
(K)(cm/s)
Test•• Albany GAAlbany GA•• Cover installed Cover installed
March 2000March 2000•• Final sampling Final sampling
Feb. 2004Feb. 2004

Conventional Soil Barrier CoversDiscussion
• Percolation at humid locations52 - 195 mm/yr6 – 17 % of precipitation
• Percolation response to precipitation events changed at both humid sites– Percolation quantity increased – Temporal response increased
• Clay barrier properties changed significantly over a relatively short time

Conventional Soil Barrier Cover Data
Percolation (Water Year: July 1– June 30)
00-01 01-02 02-03
Apple Valley
CA251 5 NA NF 148.0 3.4
(2.3%)0.0
(0.0%)120
(81%)0.0
(0.0%) NA NF 0.0(0.0%)
0.0(0.0%)
AlbanyGA 985 5 909
(909b)798
(996b)1448
(1560b)359
(9.9%) NA 2683(74%)
624(17%)
292(32%)
238(24%)
52(3.4%)
195.2(17%)
Cedar Rapids
IA621 5 NF NF 791.2 79.6
(4.2%)29.5
(1.5%)1596(84%)
114(6.0%) NF NF 94
(12%)52
(6.0%)
Total(mm)
00-01(mm/yr)
01-02 (mm/yr)
02-03 (mm/y
r)
Average(mm/yr)
Total Precipitation(July 1– June 30)
(mm)Site Duration(Days)
Slope(%)
Surface Runoff(mm)
Lateral Flow(mm)
ET(mm)
(% = percent of precipitation)

2.4
2.7
0
0.3
0.6
0.9
1.2
1.5
1.8
2.1
m
SacramentoCA
BoardmanOR
PolsonMT
MonticelloUT
Alta-montCA
HelenaMT
Apple Valley
CA
MarinaCA
Alternative Designs: Arid/Semi-Arid/Sub-Humid Locations
Capillary barrier designs

Water Balance ComponentsAlternative Cover, Helena MT
•• Seasonal Seasonal precipitation precipitation patternpattern
•• Seasonal Seasonal fluctuations in soil fluctuations in soil water contentwater content
•• No percolationNo percolation
0
200
400
600
800
8/1/99 7/31/00 7/31/01 7/31/02 7/31/03
(mm
wat
er)
0
75
150
225
300
Precipitation
Soil water
Percolation
Surface Runoff
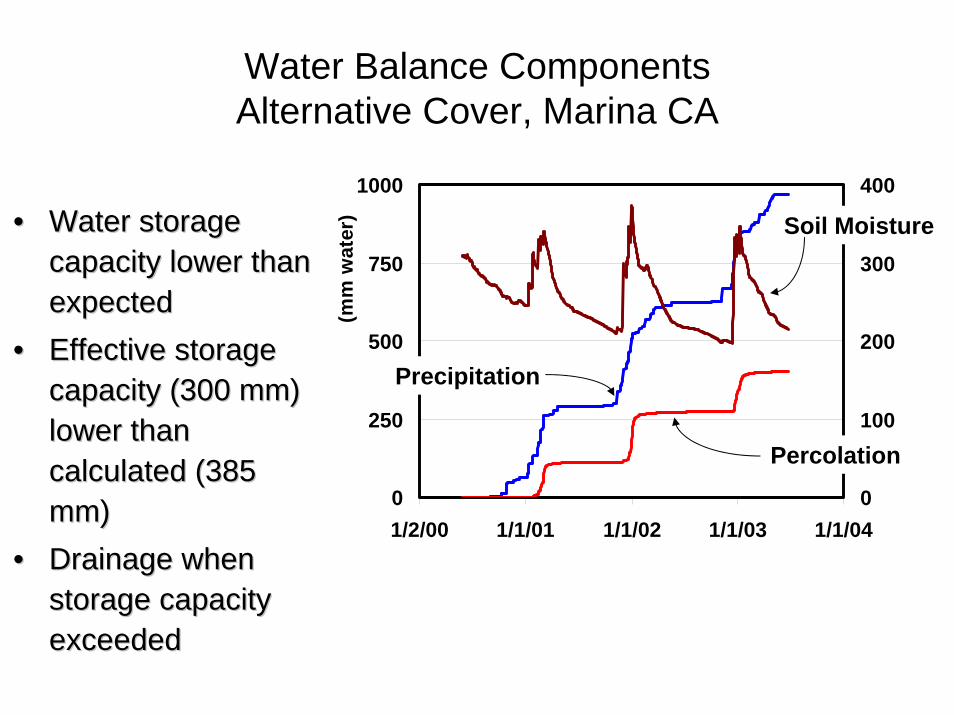
Water Balance ComponentsAlternative Cover, Marina CA
0
250
500
750
1000
1/2/00 1/1/01 1/1/02 1/1/03 1/1/04
(mm
wat
er)
0
100
200
300
400
Percolation
Soil Moisture
Precipitation
•• Water storage Water storage capacity lower than capacity lower than expectedexpected
•• Effective storage Effective storage capacity (300 mm) capacity (300 mm) lower than lower than calculated (385 calculated (385 mm) mm)
•• Drainage when Drainage when storage capacity storage capacity exceededexceeded

Alternative Designs: Humid Locations
0
0.3
0.6
0.9
1.2
1.5
m
OmahaNE
Cedar Rapids
IA
AlbanyGA

Water Balance ComponentsAlternative Cover, Omaha NE
0
400
800
1200
1600
10/1/00 10/1/01 10/1/02
(mm
wat
er)
0
150
300
450
600
Precipitation
Soil water
Percolation
•• Moderate Moderate precipitationprecipitation
•• Percolation occurs Percolation occurs late springlate spring
•• Improvements in Improvements in design and factordesign and factor--ofof--safety safety considerations may considerations may provide acceptable provide acceptable performanceperformance

Water Balance ComponentsAlternative Cover, Cedar Rapids IA
(mm
wat
er)
•• High precipitationHigh precipitation
•• Extended periods Extended periods when precipitation > when precipitation > ETET
•• Probably exceeds Probably exceeds capacity of soil/plant capacity of soil/plant system to achieve system to achieve low percolation rateslow percolation rates
0
500
1000
1500
2000
6/3/00 6/3/01 6/3/02 6/3/030
150
300
450
600
No data
Precipitation
Soil water
Percolation
Alternative DesignsDiscussion
• Very low (<2mm/yr) percolation rates at 7 of 10 covers at arid/semi-arid/sub-humid locations– Annual variation in transpiration capacity at Sacramento
CA cause of anomalous behavior– Insufficient soil water storage capacity at Marina CA
• Higher (33-160 mm/yr) percolation rates at humid locations.
• Preliminary calculations of water holding capacity can underestimate apparent capacity by 0-25%
• Successful design requires careful attention to:– Site characterization– Water balance mechanisms

Alternative cover data

The problem with models:excessive uncertainty in results
Sensitivity analysis as a design tool
• Design sensitivity analysis (DSA) is performed by comparing results from systematic variation of a single parameter
• DSA helps designer and regulator understand relative contribution of various design features or environmental stresses to cover performance
• DSA can provide valuable information for negotiations in a regulatory environment

DSA exampleEvaluate the effect of cover thickness
0
0.5
1
1.5
2
30 60 90 120Cover thickness (cm)
Avg
ann
ual p
erco
latio
n (c
m)

A design process from the Interstate Technology Regulatory Council (ITRC)
1. Define performance criteria• No flux• Bioreactor operation
2. Select and validate design concept• natural analogs• lysimeter data (ACAP)
3. Characterize site (soil, plants, climate)4. Model with DSA to understand important design
parameters and environmental stresses 5. Final design considerations (final land use, etc)• www.itrcweb.org