MARYLAND ASSOCIATION OF COUNTIES - Conduit … · Table 7.1 Recordation Tax Rates and Yields 43...
55
M ARYLAND A SSOCIATION OF C OUNTIES B UDGETS , T AX R ATES , & S ELECTED S TATISTICS F ISCAL Y EAR 2011
Transcript of MARYLAND ASSOCIATION OF COUNTIES - Conduit … · Table 7.1 Recordation Tax Rates and Yields 43...
MARYLAND ASSOCIATION OF COUNTIES
BUDGETS, TAX RATES,& SELECTED STATISTICS
FISCAL YEAR 2011
FISCAL YEAR 2011REPORT OF COUNTY
BUDGETS, TAX RATES&
SELECTED STATISTICS
PREPARED BYMARYLAND ASSOCIATION OF COUNTIES
(MACO)
169 CONDUIT STREETANNAPOLIS, MD 21401
(410) 269-0043 (BALTIMORE METRO)(301) 261-1140 (WASHINGTON METRO)
(410) 268-1775 (FAX)www.mdcounties.org
PUBLISHEDFEBRUARY 9, 2011
Acknowledgments
This report contains data assembled from survey responsesfrom the finance and budget offices of each Maryland county andBaltimore City. Without these county officials’ cooperation and hardwork, this report’s preparation would be impossible. MACoappreciates their assistance, and thanks each of them for theircontributions.
Several state agencies also provided information presentedherein. MACo thanks the Office of the Comptroller, the StateDepartment of Assessments and Taxation, the State EmergencyNumber Systems Board and the Maryland Department of Planning,Data and Product Development for their help and contributions.
This document was created by the staff of the MarylandAssociation of Counties in Annapolis, Maryland. Leslie Velasco andAndrea Mansfield served as project coordinators.
MACo strives to maintain the quality and utility of each of itspublications. Readers with corrections to the data contained in thisdocument, or suggestions for improvements in the content orpresentation of future publications are invited to contact theMaryland Association of Counties with any comments:
Maryland Association of CountiesAttn: Budget and Tax Rate Publication
169 Conduit StreetAnnapolis, Maryland 21401
www.mdcounties.org
MACo will make available any updates or corrections to theinformation in this publication, via its Internet web site. On our website, go to Publications and you will find a listing for Budget and Taxrates.
Maryland Association of Counties - Budget, Tax Rates, and Selected Statistics - FY 20117
Table of ContentsSECTION 1 - OVERVIEW AND SUMMARY DATA ........................................................................... 11
Table 1.1 County Tax Rates in Brief 12 Table 1.2 County Revenues in Brief 13
SECTION 2 – POPULATION DATA ............................................................................................ 14 Table 2.1 Estimated Population and Population Growth 15 Table 2.2 Estimated Population Density 16
SECTION 3 – COUNTY BUDGET DATA ...................................................................................... 17 Table 3.1 Total County Operating Budgets 18 Table 3.2 County Capital Budgets 19 Table 3.3 County Bond Ratings 20 Table 3.4 County General Fund Operating Budgets 21
SECTION 4 - PROPERTY TAXES .............................................................................................. 22 Table 4.1 County Property Tax Rates 25 Table 4.2 County Property Tax Rates & Constant Yield Tax Rates 26 Table 4.3 Assessed Value of Real and Personal Property 27 Table 4.4 Total Assessable Revenue Yields 28 Table 4.5 Assessed Value of Real Property 29 Table 4.6 Real Property Assessable Revenue Yields 30 Table 4.7 Taxation of Personal Property 31 Table 4.8 Assessed Value of Personal Property 32 Table 4.9 Personal Property Assessable Revenue Yields 33
SECTION 5 – PROPERTY TAX ADMINISTRATION ........................................................................... 34 Table 5.1 Payment Discounts, Penalties and Interest 35 Table 5.2 Revenue Effects of Discounts, Penalties and Interest 36 Table 5.3 County Homestead Credit Percentages 37
SECTION 6 – INCOME TAXES ................................................................................................. 38 Table 6.1 Local Income Tax Rates 39 Table 6.2 Local Income Tax Revenue Yields 40 Table 6.3 Net and Per Capita Taxable Income 41
SECTION 7 – RECORDATION AND TRANSFER TAXES ..................................................................... 42 Table 7.1 Recordation Tax Rates and Yields 43 Table 7.2 Transfer Tax Rates and Yields 44
SECTION 8 - OTHER COUNTY TAXES....................................................................................... 45 Table 8.1 Admissions and Amusement Taxes 47 Table 8.2 Cable Television Fees and Franchises 48 Table 8.3 Hotel and Motel Taxes 49 Table 8.4 Trailer Park Taxes 50 Table 8.5 Sales and Service Taxes 51
SECTION 9 – SERVICE FEES AND CHARGES ............................................................................... 53 Table 9.1 Impact Fees / Excise Taxes on New Development 55 Table 9.2 Emergency “911” Fees and System Information 56 Table 9.3 Solid Waste, Recycling, and Tipping Fees 57
Maryland Association of Counties - Budget, Tax Rates, and Selected Statistics - FY 20118
This page left blank intentionally
Maryland Association of Counties - Budget, Tax Rates, and Selected Statistics - FY 20119
Foreword
The data contained in this publication largely reflects the input received by MACofrom county budget and finance officers, through a survey conducted in November andDecember of 2010. Throughout the document, data is presented for years up to andincluding Fiscal Year 2011. Please note that in every case, the data presented for FiscalYear 2011 is estimated data, based on the best projections at the time of the survey.Unless otherwise indicated, figures presented for years prior to Fiscal Year 2011 are actualpast year data.

Maryland Association of Counties - Budget, Tax Rates, and Selected Statistics - FY 201110
This page left blank intentionally

Maryland Association of Counties - Budget, Tax Rates, and Selected Statistics - FY 201111
SECTION 1 - OVERVIEW AND SUMMARY DATA
This report contains a wide range of information on county taxes, tax rates, andrevenues. Each major area of revenue is detailed in its own section within thisdocument. To facilitate usage of current year data, Section 1 provides an overview ofthe current tax rates and revenue for each county’s major taxes.
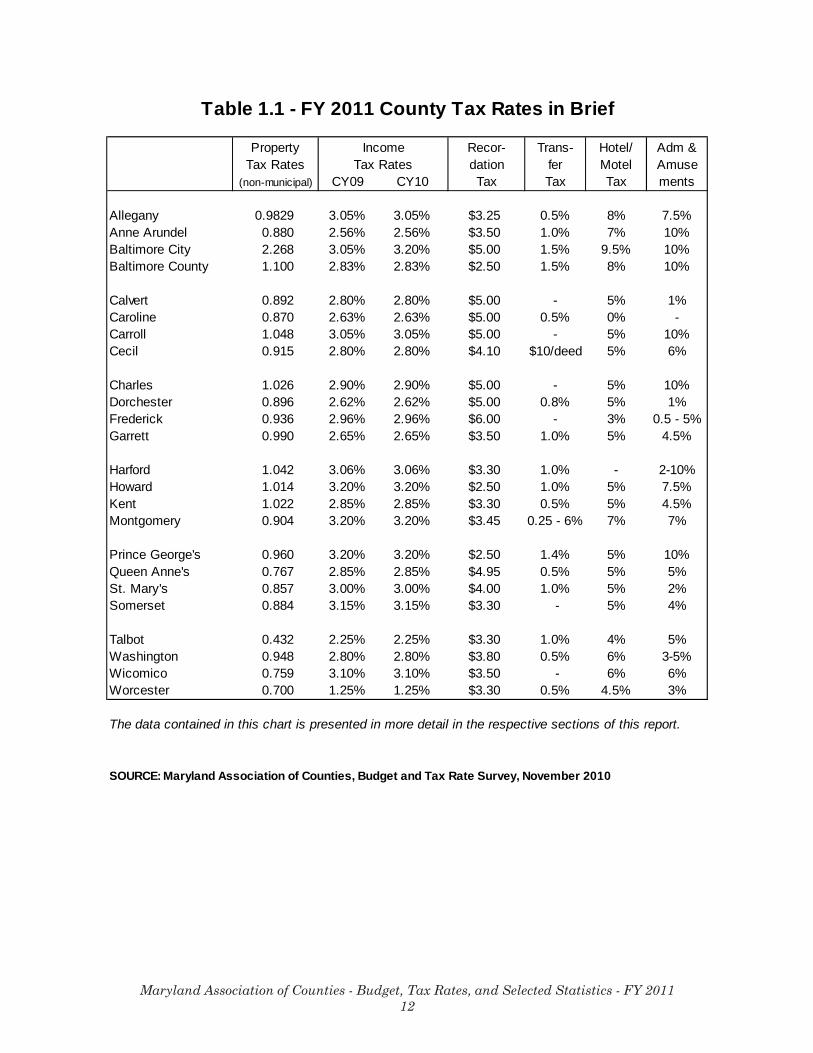
Table 1.1 shows each county’s FY 2011 rates for property taxes, income taxes,recordation taxes, transfer taxes, hotel/motel taxes, and admissions and amusementstaxes.
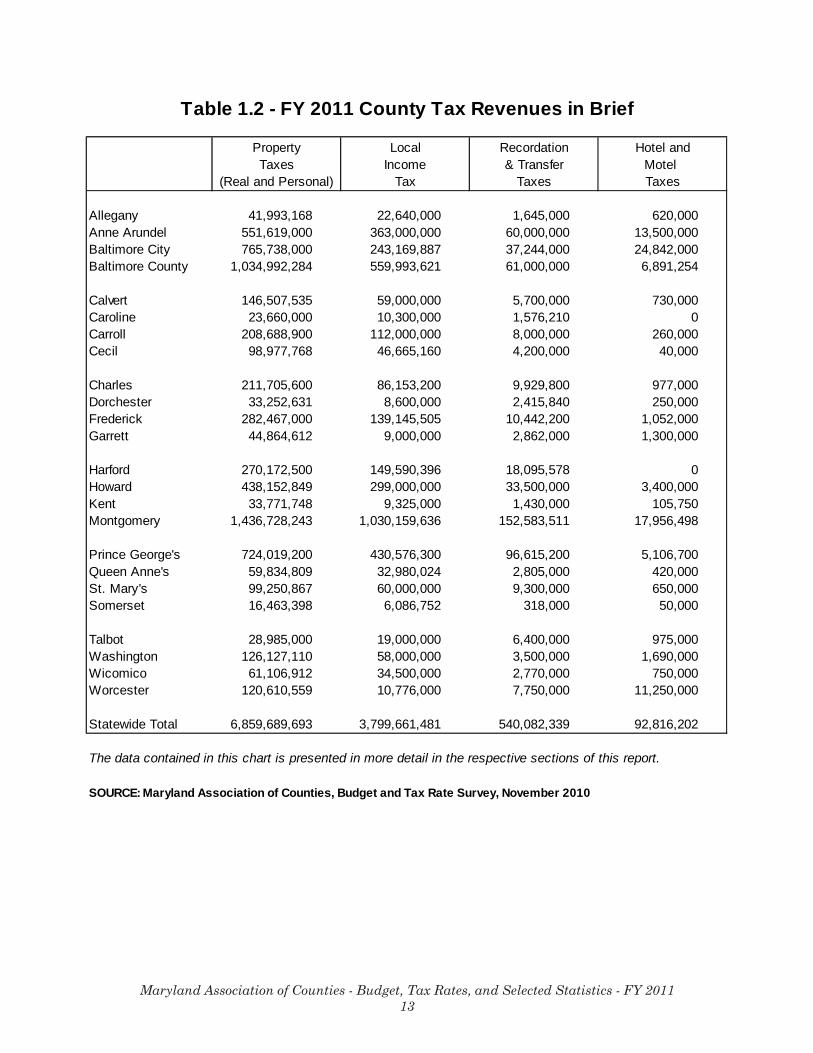
Table 1.2 shows each county’s FY 2011 revenue yield from its primary revenuesources—property taxes, income taxes, recordation and transfer taxes, and hotel/moteltaxes.
In each case, more detailed, comparative, and historical information is availablein the appropriate section of this report.
Maryland Association of Counties - Budget, Tax Rates, and Selected Statistics - FY 201112
Table 1.1 - FY 2011 County Tax Rates in Brief
Property Income Recor- Trans- Hotel/ Adm &Tax Rates Tax Rates dation fer Motel Amuse
(non-municipal) CY09 CY10 Tax Tax Tax ments
Allegany 0.9829 3.05% 3.05% $3.25 0.5% 8% 7.5%Anne Arundel 0.880 2.56% 2.56% $3.50 1.0% 7% 10%Baltimore City 2.268 3.05% 3.20% $5.00 1.5% 9.5% 10%Baltimore County 1.100 2.83% 2.83% $2.50 1.5% 8% 10%
Calvert 0.892 2.80% 2.80% $5.00 - 5% 1%Caroline 0.870 2.63% 2.63% $5.00 0.5% 0% -Carroll 1.048 3.05% 3.05% $5.00 - 5% 10%Cecil 0.915 2.80% 2.80% $4.10 $10/deed 5% 6%
Charles 1.026 2.90% 2.90% $5.00 - 5% 10%Dorchester 0.896 2.62% 2.62% $5.00 0.8% 5% 1%Frederick 0.936 2.96% 2.96% $6.00 - 3% 0.5 - 5%Garrett 0.990 2.65% 2.65% $3.50 1.0% 5% 4.5%
Harford 1.042 3.06% 3.06% $3.30 1.0% - 2-10%Howard 1.014 3.20% 3.20% $2.50 1.0% 5% 7.5%Kent 1.022 2.85% 2.85% $3.30 0.5% 5% 4.5%Montgomery 0.904 3.20% 3.20% $3.45 0.25 - 6% 7% 7%
Prince George's 0.960 3.20% 3.20% $2.50 1.4% 5% 10%Queen Anne's 0.767 2.85% 2.85% $4.95 0.5% 5% 5%St. Mary's 0.857 3.00% 3.00% $4.00 1.0% 5% 2%Somerset 0.884 3.15% 3.15% $3.30 - 5% 4%
Talbot 0.432 2.25% 2.25% $3.30 1.0% 4% 5%Washington 0.948 2.80% 2.80% $3.80 0.5% 6% 3-5%Wicomico 0.759 3.10% 3.10% $3.50 - 6% 6%Worcester 0.700 1.25% 1.25% $3.30 0.5% 4.5% 3%
The data contained in this chart is presented in more detail in the respective sections of this report.
SOURCE: Maryland Association of Counties, Budget and Tax Rate Survey, November 2010
Maryland Association of Counties - Budget, Tax Rates, and Selected Statistics - FY 201113
Table 1.2 - FY 2011 County Tax Revenues in Brief
Property Local Recordation Hotel andTaxes Income & Transfer Motel
(Real and Personal) Tax Taxes Taxes
Allegany 41,993,168 22,640,000 1,645,000 620,000Anne Arundel 551,619,000 363,000,000 60,000,000 13,500,000Baltimore City 765,738,000 243,169,887 37,244,000 24,842,000Baltimore County 1,034,992,284 559,993,621 61,000,000 6,891,254
Calvert 146,507,535 59,000,000 5,700,000 730,000Caroline 23,660,000 10,300,000 1,576,210 0Carroll 208,688,900 112,000,000 8,000,000 260,000Cecil 98,977,768 46,665,160 4,200,000 40,000
Charles 211,705,600 86,153,200 9,929,800 977,000Dorchester 33,252,631 8,600,000 2,415,840 250,000Frederick 282,467,000 139,145,505 10,442,200 1,052,000Garrett 44,864,612 9,000,000 2,862,000 1,300,000
Harford 270,172,500 149,590,396 18,095,578 0Howard 438,152,849 299,000,000 33,500,000 3,400,000Kent 33,771,748 9,325,000 1,430,000 105,750Montgomery 1,436,728,243 1,030,159,636 152,583,511 17,956,498
Prince George's 724,019,200 430,576,300 96,615,200 5,106,700Queen Anne's 59,834,809 32,980,024 2,805,000 420,000St. Mary's 99,250,867 60,000,000 9,300,000 650,000Somerset 16,463,398 6,086,752 318,000 50,000
Talbot 28,985,000 19,000,000 6,400,000 975,000Washington 126,127,110 58,000,000 3,500,000 1,690,000Wicomico 61,106,912 34,500,000 2,770,000 750,000Worcester 120,610,559 10,776,000 7,750,000 11,250,000
Statewide Total 6,859,689,693 3,799,661,481 540,082,339 92,816,202
The data contained in this chart is presented in more detail in the respective sections of this report.
SOURCE: Maryland Association of Counties, Budget and Tax Rate Survey, November 2010

Maryland Association of Counties - Budget, Tax Rates, and Selected Statistics - FY 201114
SECTION 2 – POPULATION DATA
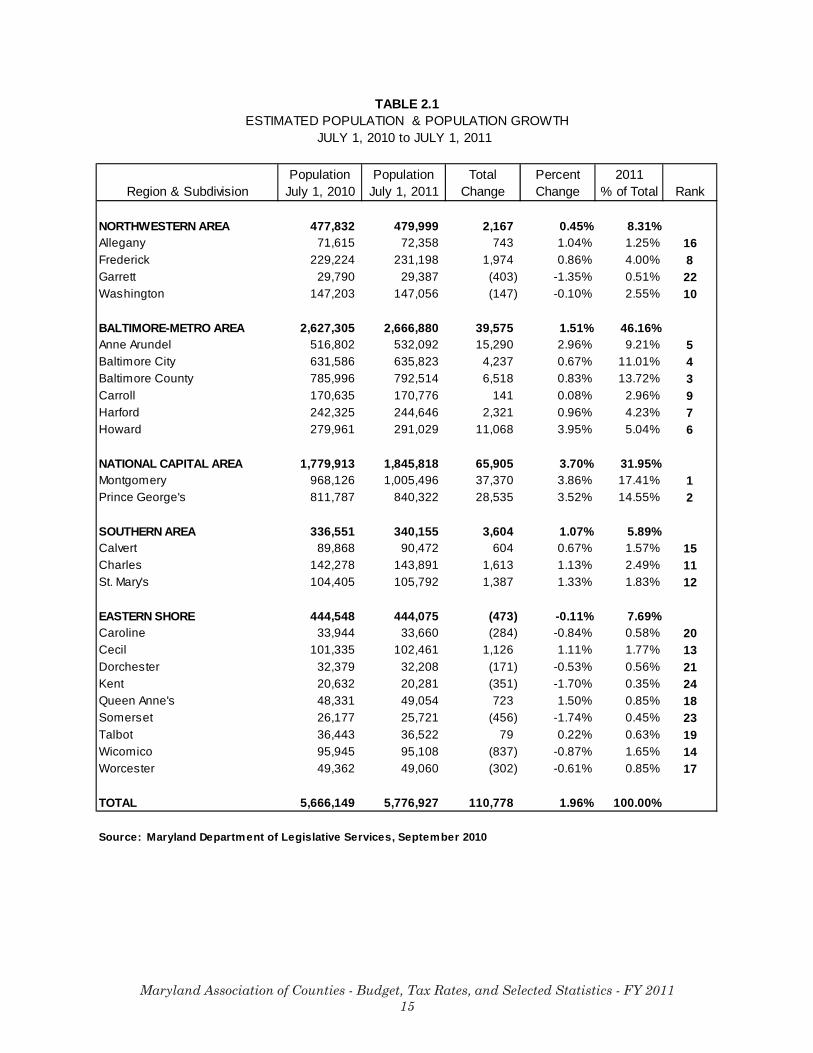
Table 2.1 displays the estimated population of the State as of July 1, 2011 bygeographic, regional, and political subdivisions. Montgomery County continues to be themost populous of the 24 subdivisions, followed by Prince George’s County, BaltimoreCounty and Baltimore City, respectively. Kent County remains the least populated Marylandcounty.
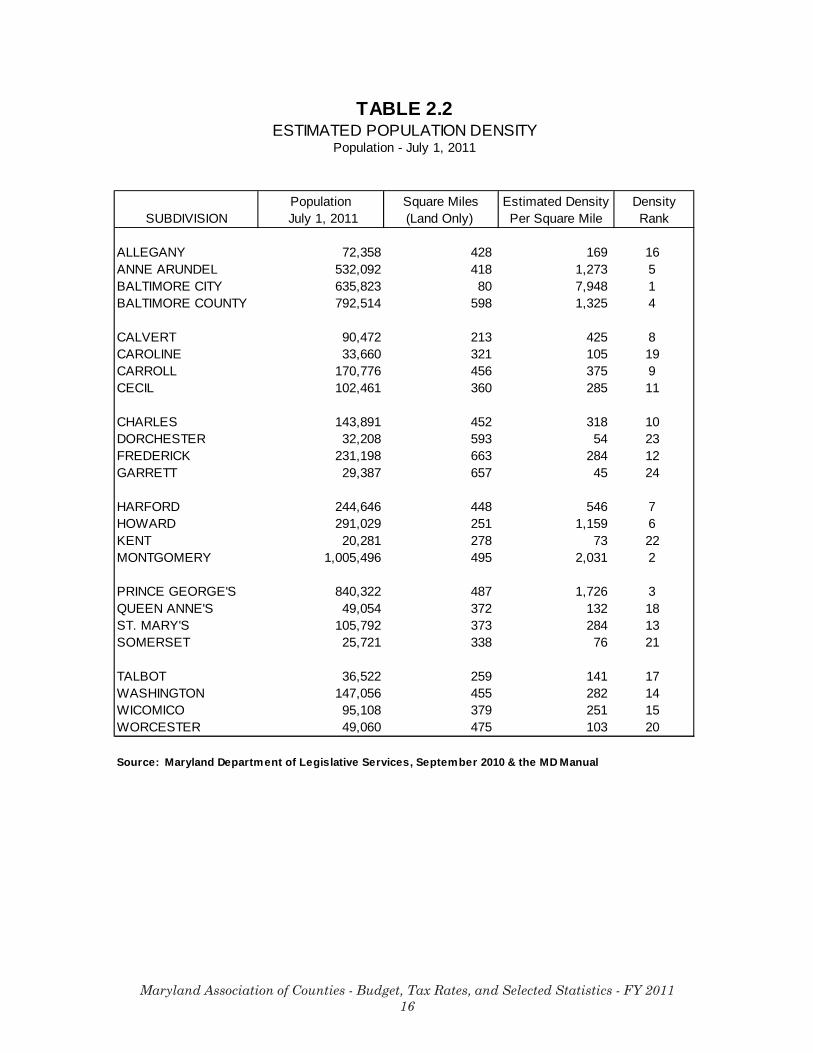
Table 2.2 records the estimated population density of each subdivision as ofJuly 1, 2011. Baltimore City is the most densely populated subdivision with 7,948 personsper square mile, followed by Montgomery County with 2,031 persons per square mile.Garrett County, with 45 persons per square mile, remains the least densely populatedcounty.
Maryland Association of Counties - Budget, Tax Rates, and Selected Statistics - FY 201115
TABLE 2.1ESTIMATED POPULATION & POPULATION GROWTH
JULY 1, 2010 to JULY 1, 2011
Population Population Total Percent 2011Region & Subdivision July 1, 2010 July 1, 2011 Change Change % of Total Rank
NORTHWESTERN AREA 477,832 479,999 2,167 0.45% 8.31%Allegany 71,615 72,358 743 1.04% 1.25% 16Frederick 229,224 231,198 1,974 0.86% 4.00% 8Garrett 29,790 29,387 (403) -1.35% 0.51% 22Washington 147,203 147,056 (147) -0.10% 2.55% 10
BALTIMORE-METRO AREA 2,627,305 2,666,880 39,575 1.51% 46.16%Anne Arundel 516,802 532,092 15,290 2.96% 9.21% 5Baltimore City 631,586 635,823 4,237 0.67% 11.01% 4Baltimore County 785,996 792,514 6,518 0.83% 13.72% 3Carroll 170,635 170,776 141 0.08% 2.96% 9Harford 242,325 244,646 2,321 0.96% 4.23% 7Howard 279,961 291,029 11,068 3.95% 5.04% 6
NATIONAL CAPITAL AREA 1,779,913 1,845,818 65,905 3.70% 31.95%Montgomery 968,126 1,005,496 37,370 3.86% 17.41% 1Prince George's 811,787 840,322 28,535 3.52% 14.55% 2
SOUTHERN AREA 336,551 340,155 3,604 1.07% 5.89%Calvert 89,868 90,472 604 0.67% 1.57% 15Charles 142,278 143,891 1,613 1.13% 2.49% 11St. Mary's 104,405 105,792 1,387 1.33% 1.83% 12
EASTERN SHORE 444,548 444,075 (473) -0.11% 7.69%Caroline 33,944 33,660 (284) -0.84% 0.58% 20Cecil 101,335 102,461 1,126 1.11% 1.77% 13Dorchester 32,379 32,208 (171) -0.53% 0.56% 21Kent 20,632 20,281 (351) -1.70% 0.35% 24Queen Anne's 48,331 49,054 723 1.50% 0.85% 18Somerset 26,177 25,721 (456) -1.74% 0.45% 23Talbot 36,443 36,522 79 0.22% 0.63% 19Wicomico 95,945 95,108 (837) -0.87% 1.65% 14Worcester 49,362 49,060 (302) -0.61% 0.85% 17
TOTAL 5,666,149 5,776,927 110,778 1.96% 100.00%
Source: Maryland Department of Legislative Services, September 2010
Maryland Association of Counties - Budget, Tax Rates, and Selected Statistics - FY 201116
TABLE 2.2ESTIMATED POPULATION DENSITY
Population - July 1, 2011
Population Square Miles Estimated Density DensitySUBDIVISION July 1, 2011 (Land Only) Per Square Mile Rank
ALLEGANY 72,358 428 169 16ANNE ARUNDEL 532,092 418 1,273 5BALTIMORE CITY 635,823 80 7,948 1BALTIMORE COUNTY 792,514 598 1,325 4
CALVERT 90,472 213 425 8CAROLINE 33,660 321 105 19CARROLL 170,776 456 375 9CECIL 102,461 360 285 11
CHARLES 143,891 452 318 10DORCHESTER 32,208 593 54 23FREDERICK 231,198 663 284 12GARRETT 29,387 657 45 24
HARFORD 244,646 448 546 7HOWARD 291,029 251 1,159 6KENT 20,281 278 73 22MONTGOMERY 1,005,496 495 2,031 2
PRINCE GEORGE'S 840,322 487 1,726 3QUEEN ANNE'S 49,054 372 132 18ST. MARY'S 105,792 373 284 13SOMERSET 25,721 338 76 21
TALBOT 36,522 259 141 17WASHINGTON 147,056 455 282 14WICOMICO 95,108 379 251 15WORCESTER 49,060 475 103 20
Source: Maryland Department of Legislative Services, September 2010 & the MD Manual
Maryland Association of Counties - Budget, Tax Rates, and Selected Statistics - FY 201117
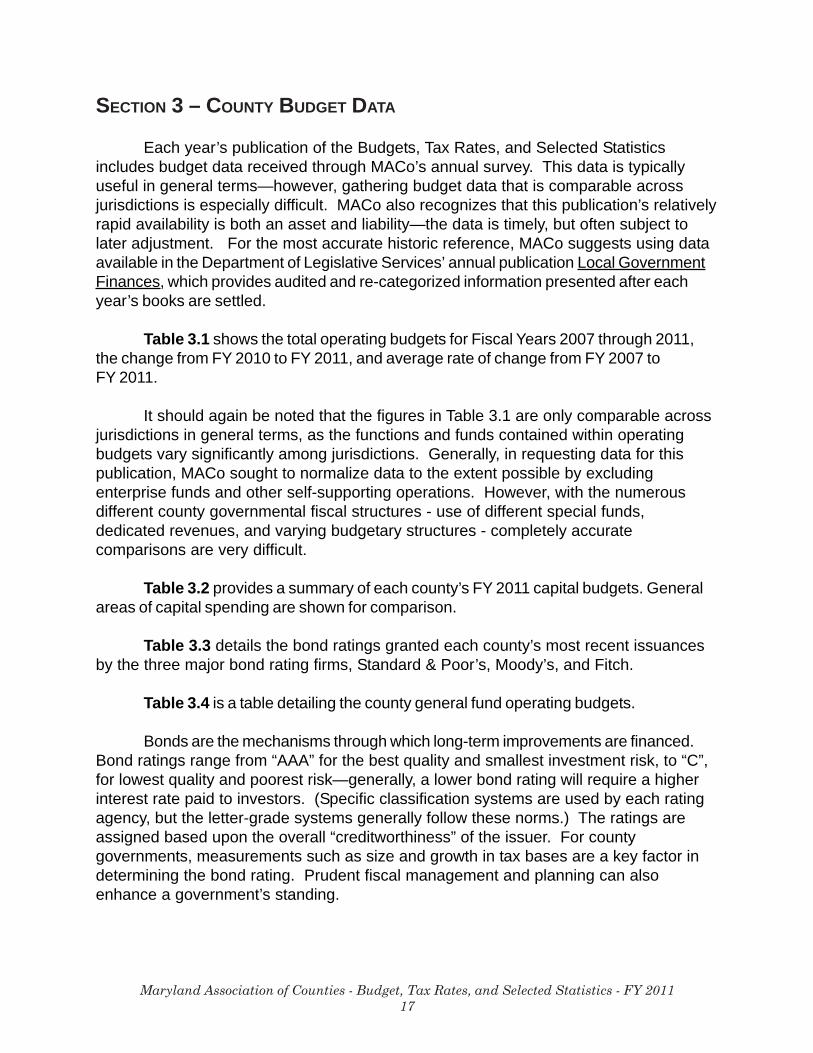
SECTION 3 – COUNTY BUDGET DATA
Each year’s publication of the Budgets, Tax Rates, and Selected Statisticsincludes budget data received through MACo’s annual survey. This data is typicallyuseful in general terms—however, gathering budget data that is comparable acrossjurisdictions is especially difficult. MACo also recognizes that this publication’s relativelyrapid availability is both an asset and liability—the data is timely, but often subject tolater adjustment. For the most accurate historic reference, MACo suggests using dataavailable in the Department of Legislative Services’ annual publication Local GovernmentFinances, which provides audited and re-categorized information presented after eachyear’s books are settled.
Table 3.1 shows the total operating budgets for Fiscal Years 2007 through 2011,the change from FY 2010 to FY 2011, and average rate of change from FY 2007 toFY 2011.
It should again be noted that the figures in Table 3.1 are only comparable acrossjurisdictions in general terms, as the functions and funds contained within operatingbudgets vary significantly among jurisdictions. Generally, in requesting data for thispublication, MACo sought to normalize data to the extent possible by excludingenterprise funds and other self-supporting operations. However, with the numerousdifferent county governmental fiscal structures - use of different special funds,dedicated revenues, and varying budgetary structures - completely accuratecomparisons are very difficult.
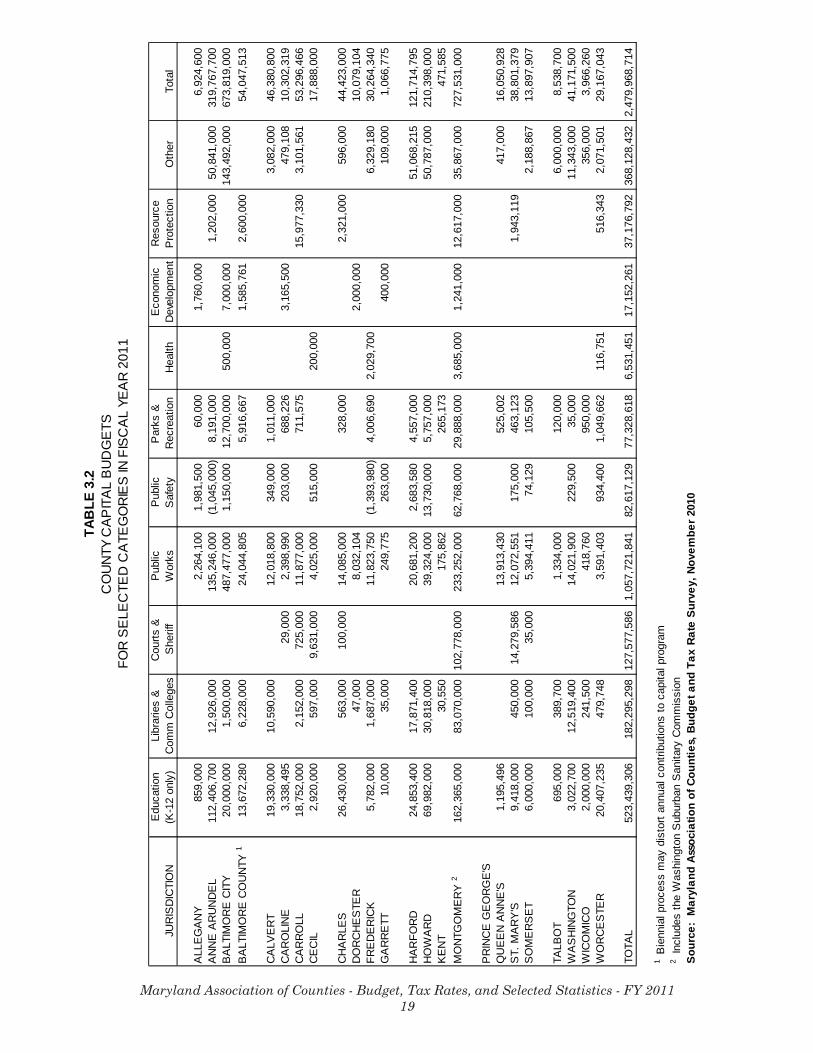
Table 3.2 provides a summary of each county’s FY 2011 capital budgets. Generalareas of capital spending are shown for comparison.
Table 3.3 details the bond ratings granted each county’s most recent issuancesby the three major bond rating firms, Standard & Poor’s, Moody’s, and Fitch.
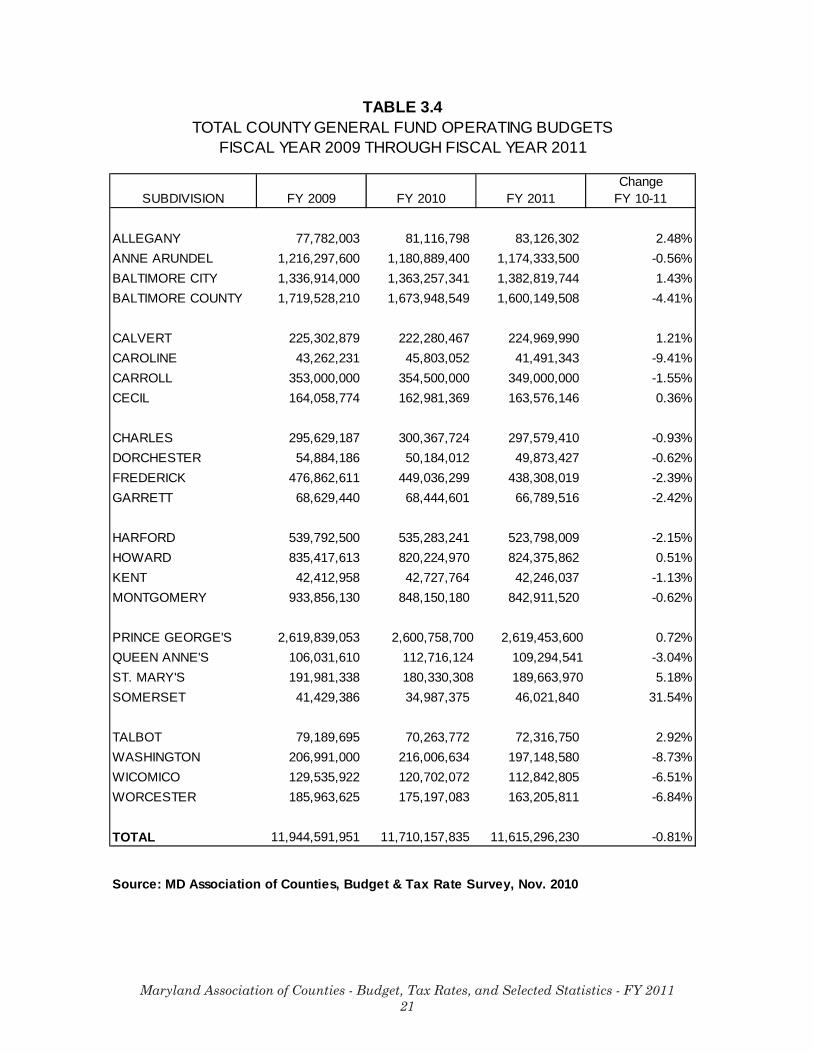
Table 3.4 is a table detailing the county general fund operating budgets.
Bonds are the mechanisms through which long-term improvements are financed.Bond ratings range from “AAA” for the best quality and smallest investment risk, to “C”,for lowest quality and poorest risk—generally, a lower bond rating will require a higherinterest rate paid to investors. (Specific classification systems are used by each ratingagency, but the letter-grade systems generally follow these norms.) The ratings areassigned based upon the overall “creditworthiness” of the issuer. For countygovernments, measurements such as size and growth in tax bases are a key factor indetermining the bond rating. Prudent fiscal management and planning can alsoenhance a government’s standing.

Maryland Association of Counties - Budget, Tax Rates, and Selected Statistics - FY 201118
TAB
LE 3
.1TO
TAL
CO
UN
TY O
PE
RA
TIN
G B
UD
GE
TSFI
SC
AL
YEA
R 2
007
THR
OU
GH
FIS
CA
L YE
AR
201
1
Cha
nge
Avg
Ann
ual C
hgS
UB
DIV
ISIO
NFY
200
7FY
200
8FY
200
9FY
201
0FY
201
1FY
10-
11FY
07-
11
ALL
EG
AN
Y87
,629
,834
97,0
85,2
9997
,233
,858
93,2
38,6
3992
,833
,839
-0.4
3%1.
45%
AN
NE
AR
UN
DE
L1,
670,
201,
100
1,82
6,05
2,50
01,
889,
994,
600
1,79
6,08
3,50
01,
883,
650,
800
4.88
%3.
05%
BA
LTIM
OR
E C
ITY
2,01
5,66
9,94
41,
773,
774,
698
1,85
4,22
6,88
91,
950,
508,
000
1,90
7,18
1,00
0-2
.22%
-1.3
7%B
ALT
IMO
RE
CO
UN
TY2,
378,
464,
390
2,53
8,84
0,82
72,
589,
214,
367
2,57
2,15
5,76
92,
578,
428,
672
0.24
%2.
04%
CA
LVE
RT
194,
055,
268
226,
005,
601
280,
130,
938
275,
526,
352
287,
515,
456
4.35
%10
.33%
CA
RO
LIN
E 1
47,4
02,5
7956
,544
,020
55,1
38,1
1777
,380
,576
53,5
08,9
80-3
0.85
%3.
08%
CA
RR
OLL
302,
636,
000
358,
107,
849
374,
555,
468
376,
650,
316
375,
213,
847
-0.3
8%5.
52%
CE
CIL
19
8,39
5,74
819
7,67
3,92
219
8,55
6,98
518
1,43
8,45
818
0,41
5,22
8-0
.56%
-2.3
5%
CH
AR
LES
363,
656,
184
442,
011,
945
398,
416,
239
384,
931,
086
385,
685,
883
0.20
%1.
48%
DO
RC
HE
STE
R57
,551
,863
56,7
14,3
5655
,678
,729
50,8
03,4
6050
,895
,426
0.18
%-3
.03%
FRE
DE
RIC
K43
6,71
2,71
682
7,46
0,23
383
3,35
4,25
283
1,76
5,64
983
9,67
3,69
90.
95%
17.7
5%G
AR
RE
TT
60,0
27,3
7765
,378
,991
68,6
29,4
4068
,444
,601
66,7
89,5
16-2
.42%
2.70
%
HA
RFO
RD
474,
889,
722
512,
465,
777
539,
792,
500
535,
283,
241
523,
798,
009
-2.1
5%2.
48%
HO
WA
RD
91
7,54
6,31
01,
023,
455,
582
1,00
3,81
5,45
81,
102,
561,
564
1,14
1,22
3,87
63.
51%
5.61
%K
EN
T36
,680
,947
49,1
39,2
4354
,506
,727
52,7
03,4
3449
,965
,062
-5.2
0%8.
03%
MO
NTG
OM
ER
Y 2
3,88
1,58
8,68
23,
868,
384,
132
4,34
2,17
3,77
64,
358,
217,
415
4,27
0,79
4,61
0-2
.01%
2.42
%
PR
INC
E G
EO
RG
E'S
22,
807,
122,
500
2,96
5,89
7,30
03,
030,
297,
600
2,98
5,12
5,60
02,
979,
126,
500
-0.2
0%1.
50%
QU
EE
N A
NN
E'S
99,2
66,6
6412
2,05
9,84
812
6,29
8,91
013
5,50
9,90
012
1,34
2,76
1-1
0.45
%5.
15%
ST.
MA
RY
'S17
5,44
5,37
518
1,59
6,30
519
3,58
1,46
418
2,12
3,53
919
1,85
0,35
15.
34%
2.26
%S
OM
ER
SE
T31
,955
,467
39,0
58,5
2341
,429
,386
34,9
87,3
7546
,021
,840
31.5
4%9.
55%
TALB
OT
171
,488
,758
81,2
95,6
3379
,189
,695
70,2
63,7
7272
,316
,750
2.92
%0.
29%
WA
SH
ING
TON
180,
551,
887
206,
990,
060
219,
533,
470
220,
143,
764
211,
196,
480
-4.0
6%4.
00%
WIC
OM
ICO
12
6,44
1,34
818
5,04
1,95
317
3,42
7,94
612
6,37
3,69
811
8,15
0,94
4-6
.51%
-1.6
8%W
OR
CE
STE
R16
5,21
5,09
217
6,69
3,08
818
5,96
3,62
517
5,19
7,08
316
3,20
5,81
1-6
.84%
-0.3
1%
TOTA
L16
,780
,595
,755
17,8
77,7
27,6
8518
,685
,140
,439
18,6
37,4
16,7
9118
,590
,785
,340
-0.2
5%2.
59%
1 B
udge
ts in
clud
e ca
pita
l pro
ject
s, p
ay-g
o tra
nsfe
r.2
Exc
lude
s op
erat
ing
budg
et fo
r bi-c
ount
y ag
enci
es M
NC
PP
C a
nd W
SS
CS
OU
RCE:
Mar
ylan
d As
soci
atio
n of
Cou
ntie
s, B
udge
t and
Tax
Rat
e S
urve
y, N
ovem
ber
2010
Maryland Association of Counties - Budget, Tax Rates, and Selected Statistics - FY 201119
TAB
LE 3
.2C
OU
NTY
CA
PIT
AL
BU
DG
ETS
FOR
SE
LEC
TED
CA
TEG
OR
IES
IN F
ISC
AL
YEA
R 2
011
Edu
catio
nLi
brar
ies
&C
ourts
&P
ublic
Pub
licP
arks
&E
cono
mic
Res
ourc
eJU
RIS
DIC
TIO
N(K
-12
only
)C
omm
Col
lege
sS
herif
fW
orks
Saf
ety
Rec
reat
ion
Hea
lthD
evel
opm
ent
Pro
tect
ion
Oth
erTo
tal
ALL
EG
AN
Y85
9,00
00
02,
264,
100
1,98
1,50
060
,000
01,
760,
000
00
6,92
4,60
0A
NN
E A
RU
ND
EL
112,
406,
700
12,9
26,0
000
135,
246,
000
(1,0
45,0
00)
8,19
1,00
00
01,
202,
000
50,8
41,0
0031
9,76
7,70
0B
ALT
IMO
RE
CIT
Y20
,000
,000
1,50
0,00
00
487,
477,
000
1,15
0,00
012
,700
,000
500,
000
7,00
0,00
00
143,
492,
000
673,
819,
000
BA
LTIM
OR
E C
OU
NTY
113
,672
,280
6,22
8,00
00
24,0
44,8
050
5,91
6,66
70
1,58
5,76
12,
600,
000
054
,047
,513
CA
LVE
RT
19,3
30,0
0010
,590
,000
012
,018
,800
349,
000
1,01
1,00
00
00
3,08
2,00
046
,380
,800
CA
RO
LIN
E3,
338,
495
029
,000
2,39
8,99
020
3,00
068
8,22
60
3,16
5,50
00
479,
108
10,3
02,3
19C
AR
RO
LL18
,752
,000
2,15
2,00
072
5,00
011
,877
,000
071
1,57
50
015
,977
,330
3,10
1,56
153
,296
,466
CE
CIL
2,92
0,00
059
7,00
09,
631,
000
4,02
5,00
051
5,00
00
200,
000
00
017
,888
,000
CH
AR
LES
26,4
30,0
0056
3,00
010
0,00
014
,085
,000
032
8,00
0
2,
321,
000
596,
000
44,4
23,0
00D
OR
CH
ES
TER
047
,000
08,
032,
104
00
02,
000,
000
00
10,0
79,1
04FR
ED
ER
ICK
5,78
2,00
01,
687,
000
011
,823
,750
(1,3
93,9
80)
4,00
6,69
02,
029,
700
00
6,32
9,18
030
,264
,340
GA
RR
ETT
10,0
0035
,000
024
9,77
526
3,00
00
040
0,00
00
109,
000
1,06
6,77
5
HA
RFO
RD
24,8
53,4
0017
,871
,400
020
,681
,200
2,68
3,58
04,
557,
000
00
051
,068
,215
121,
714,
795
HO
WA
RD
69,9
82,0
0030
,818
,000
039
,324
,000
13,7
30,0
005,
757,
000
00
050
,787
,000
210,
398,
000
KE
NT
030
,550
017
5,86
20
265,
173
00
00
471,
585
MO
NTG
OM
ER
Y 2
162,
365,
000
83,0
70,0
0010
2,77
8,00
023
3,25
2,00
062
,768
,000
29,8
88,0
003,
685,
000
1,24
1,00
012
,617
,000
35,8
67,0
0072
7,53
1,00
0
PR
INC
E G
EO
RG
E'S
00
00
00
00
00
0Q
UE
EN
AN
NE
'S1,
195,
496
00
13,9
13,4
300
525,
002
00
041
7,00
016
,050
,928
ST.
MA
RY
'S9,
418,
000
450,
000
14,2
79,5
8612
,072
,551
175,
000
463,
123
00
1,94
3,11
90
38,8
01,3
79S
OM
ER
SE
T6,
000,
000
100,
000
35,0
005,
394,
411
74,1
2910
5,50
00
00
2,18
8,86
713
,897
,907
TALB
OT
695,
000
389,
700
01,
334,
000
012
0,00
00
00
6,00
0,00
08,
538,
700
WA
SH
ING
TON
3,02
2,70
012
,519
,400
014
,021
,900
229,
500
35,0
000
00
11,3
43,0
0041
,171
,500
WIC
OM
ICO
2,00
0,00
024
1,50
00
418,
760
095
0,00
00
00
356,
000
3,96
6,26
0W
OR
CE
STE
R20
,407
,235
479,
748
03,
591,
403
934,
400
1,04
9,66
211
6,75
10
516,
343
2,07
1,50
129
,167
,043
TOTA
L52
3,43
9,30
618
2,29
5,29
812
7,57
7,58
61,
057,
721,
841
82,6
17,1
2977
,328
,618
6,53
1,45
117
,152
,261
37,1
76,7
9236
8,12
8,43
22,
479,
968,
714
1 B
ienn
ial p
roce
ss m
ay d
isto
rt an
nual
con
tribu
tions
to c
apita
l pro
gram
2 In
clud
es th
e W
ashi
ngto
n S
ubur
ban
San
itary
Com
mis
sion
Sour
ce:
Mar
ylan
d As
soci
atio
n of
Cou
ntie
s, B
udge
t and
Tax
Rat
e Su
rvey
, Nov
embe
r 201
0

Maryland Association of Counties - Budget, Tax Rates, and Selected Statistics - FY 201120
TABLE 3.3COUNTY BOND RATINGS
FISCAL YEAR 2011
COUNTY S&P MOODY'S FITCH
ALLEGANY * A- A1 -ANNE ARUNDEL AAA Aa1 AA+BALTIMORE CITY * AA- Aa2 A+BALTIMORE COUNTY AAA Aaa AAA
CALVERT AA+ Aa1 AAACAROLINE * A A3 -CARROLL AA+ Aa1 AAACECIL AA Aa2 -
CHARLES AA Aa1 AAADORCHESTER A+ A2 -FREDERICK AA+ Aa1 AAAGARRETT * AAA A1 -
HARFORD AA+ Aaa AAAHOWARD AAA Aaa AAAKENT * - - -MONTGOMERY AAA Aaa AAA
PRINCE GEORGE'S * AAA Aaa AAAQUEEN ANNE'S * A1 AAST. MARY'S AA Aa2 AA+SOMERSET - - -
TALBOT - Aa2 AAAWASHINGTON AA Aa2 AAWICOMICO ** AA- Aa3 AA-WORCESTER - Aa2 AA
* Purchases Bond Insurance** Purchases Bond Insurance on some bonds but not allSource: Maryland Association of Counties Budget and Tax Rate Survey, November 2010
Maryland Association of Counties - Budget, Tax Rates, and Selected Statistics - FY 201121
TABLE 3.4TOTAL COUNTY GENERAL FUND OPERATING BUDGETS
FISCAL YEAR 2009 THROUGH FISCAL YEAR 2011
ChangeSUBDIVISION FY 2009 FY 2010 FY 2011 FY 10-11
ALLEGANY 77,782,003 81,116,798 83,126,302 2.48%ANNE ARUNDEL 1,216,297,600 1,180,889,400 1,174,333,500 -0.56%BALTIMORE CITY 1,336,914,000 1,363,257,341 1,382,819,744 1.43%BALTIMORE COUNTY 1,719,528,210 1,673,948,549 1,600,149,508 -4.41%
CALVERT 225,302,879 222,280,467 224,969,990 1.21%CAROLINE 43,262,231 45,803,052 41,491,343 -9.41%CARROLL 353,000,000 354,500,000 349,000,000 -1.55%CECIL 164,058,774 162,981,369 163,576,146 0.36%
CHARLES 295,629,187 300,367,724 297,579,410 -0.93%DORCHESTER 54,884,186 50,184,012 49,873,427 -0.62%FREDERICK 476,862,611 449,036,299 438,308,019 -2.39%GARRETT 68,629,440 68,444,601 66,789,516 -2.42%
HARFORD 539,792,500 535,283,241 523,798,009 -2.15%HOWARD 835,417,613 820,224,970 824,375,862 0.51%KENT 42,412,958 42,727,764 42,246,037 -1.13%MONTGOMERY 933,856,130 848,150,180 842,911,520 -0.62%
PRINCE GEORGE'S 2,619,839,053 2,600,758,700 2,619,453,600 0.72%QUEEN ANNE'S 106,031,610 112,716,124 109,294,541 -3.04%ST. MARY'S 191,981,338 180,330,308 189,663,970 5.18%SOMERSET 41,429,386 34,987,375 46,021,840 31.54%
TALBOT 79,189,695 70,263,772 72,316,750 2.92%WASHINGTON 206,991,000 216,006,634 197,148,580 -8.73%WICOMICO 129,535,922 120,702,072 112,842,805 -6.51%WORCESTER 185,963,625 175,197,083 163,205,811 -6.84%
TOTAL 11,944,591,951 11,710,157,835 11,615,296,230 -0.81%
Source: MD Association of Counties, Budget & Tax Rate Survey, Nov. 2010
Maryland Association of Counties - Budget, Tax Rates, and Selected Statistics - FY 201122
SECTION 4 - PROPERTY TAXES
The property tax remains the largest single source of revenue for countygovernment. This section is divided into four parts—the first detailing property tax ratesin the counties, the second showing aggregate data for all property, followed by twosegments containing individual data for the two major classes of property—real andpersonal.
Tax Rates
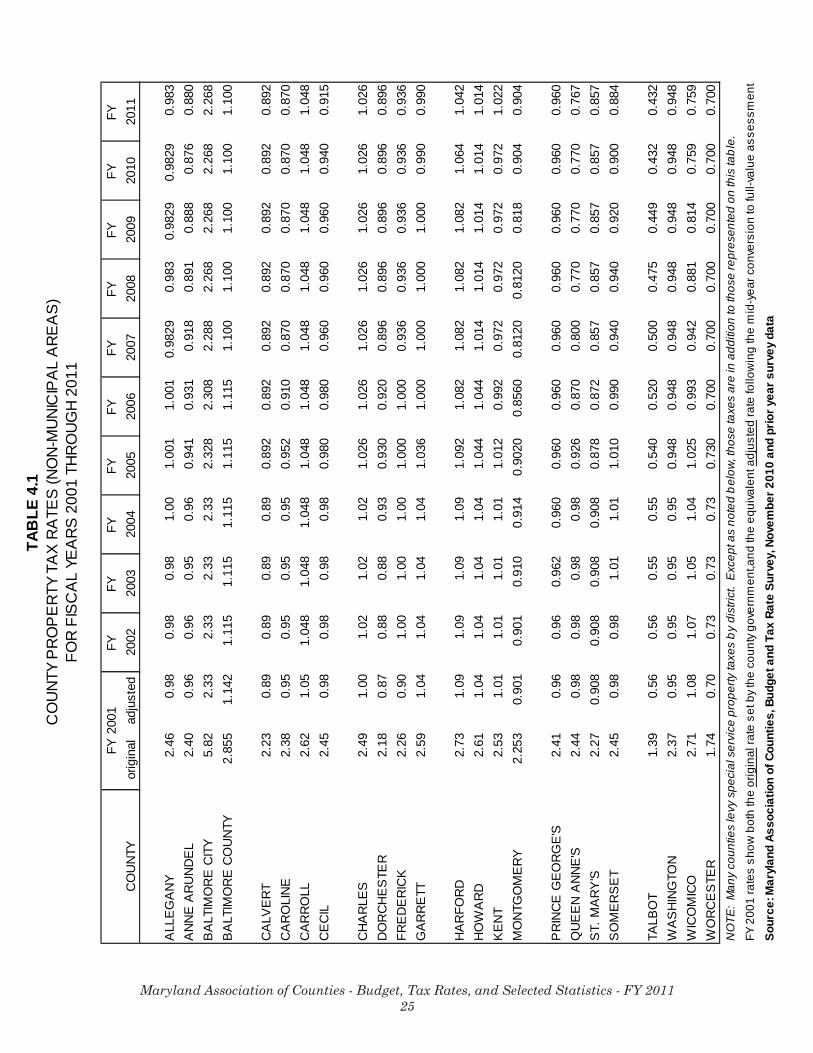
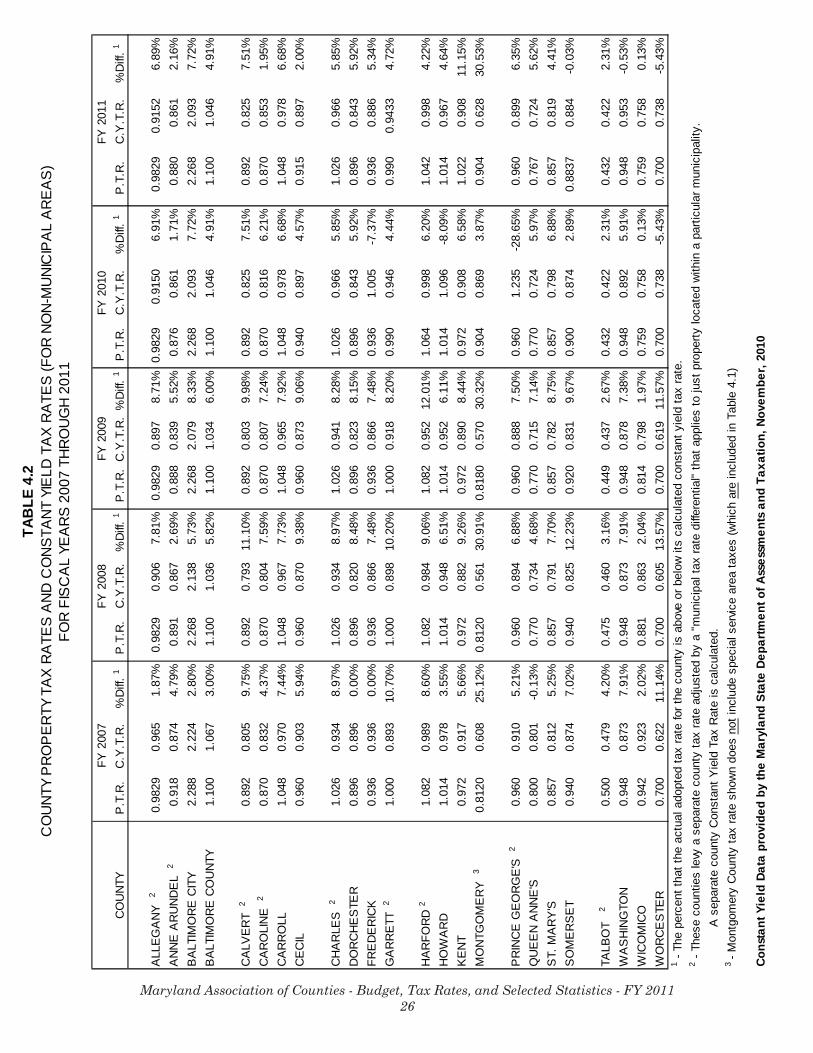
Table 4.1 shows a history of county property tax rates from FY 2001 to FY 2011.The rates shown are county-wide tax rates that apply to all non-municipal areas. In somecounties, municipal residents enjoy a “tax differential,” resulting in a lower county tax ratewithin the municipality to reflect services provided by the municipal government.
In many counties, there are special taxing districts that levy property taxes foridentified purposes—Table 4.1 reflects only special taxes that are “county-wide” innature, and does not include taxes levied only in special service areas. For MontgomeryCounty, which employs a variety of special service taxes, tax rates shown include county-wide special assessments, but do not include any of the district-wide taxes levied invarious parts of the county.
Table 4.2 compares property tax rates and constant yield tax rates for FiscalYears 2007 through 2011. Pursuant to Section 2-205 of the Tax-Property Article of theMaryland Annotated Code, on or before February 14 of each year, the State Departmentof Assessments and Taxation (SDAT) notifies each county and Baltimore City of its“constant yield tax rate.” This rate represents a tax rate sufficient to provide the sameproperty tax revenue as was generated in the previous taxable year. SDAT calculatesthe constant yield tax rate by using the estimated full assessable base as of the date offinality of the next taxable year, exclusive of properties appearing for the first time on theassessment records.
All Property (Real and Personal Combined)
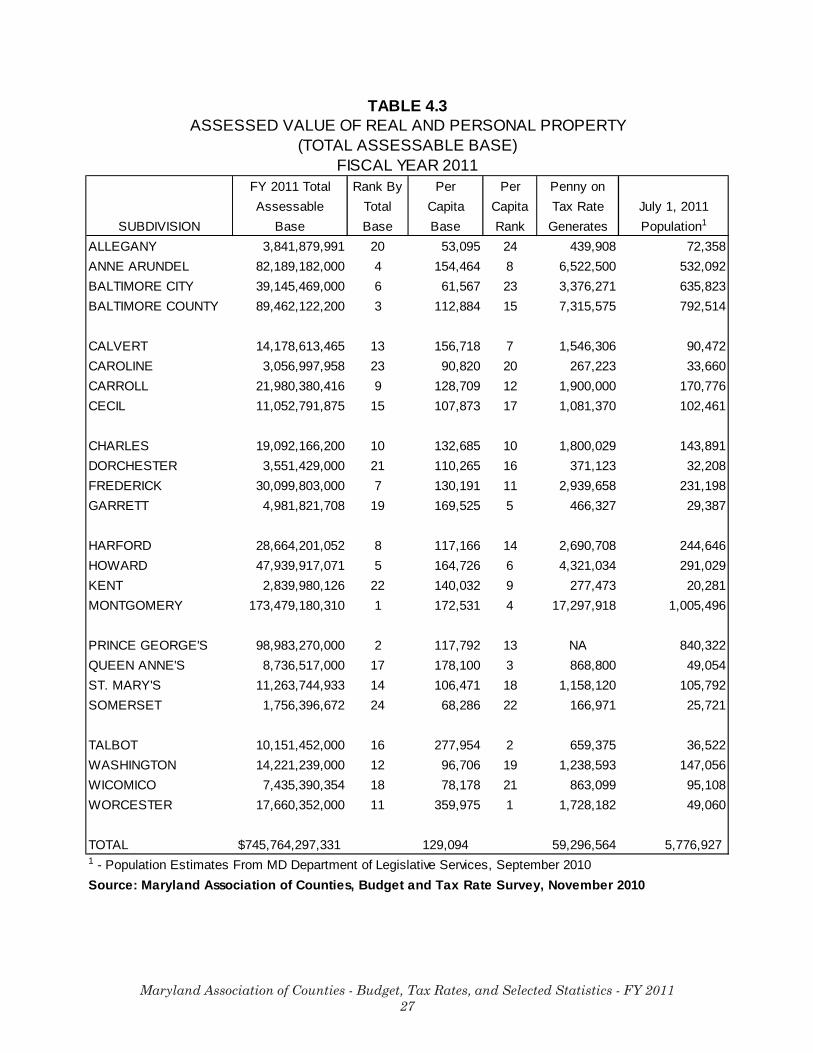
Table 4.3 shows the estimated Fiscal Year 2011 total assessable base for countytax purposes. Assessable base is the total assessed value of all taxable real and personalproperty in the county. By Maryland state law in place until October 1, 2000, the assessedvalue of real property was 40% of cash value, the assessed value of personal property is100% of cash value. The assessable base shown is the total of that amount.
Technically, real property assessments have been altered by recent legislationpassed by the General Assembly. The 2000 “Truth in Taxation” law required full-valueassessment of real property, abandoning the previous 40% assessment ratio. Datapresented has been adjusted to fairly reflect assessments before and after this change.
Maryland Association of Counties - Budget, Tax Rates, and Selected Statistics - FY 201123
Montgomery County, with a $173.5 billion base, has the largest property taxassessable base among the 24 subdivisions. It is followed by Prince George’s County,Baltimore County, Anne Arundel County, Howard County, and Baltimore City respectively.Somerset County’s assessable base, at $1.75 million, is the smallest of the subdivisions.
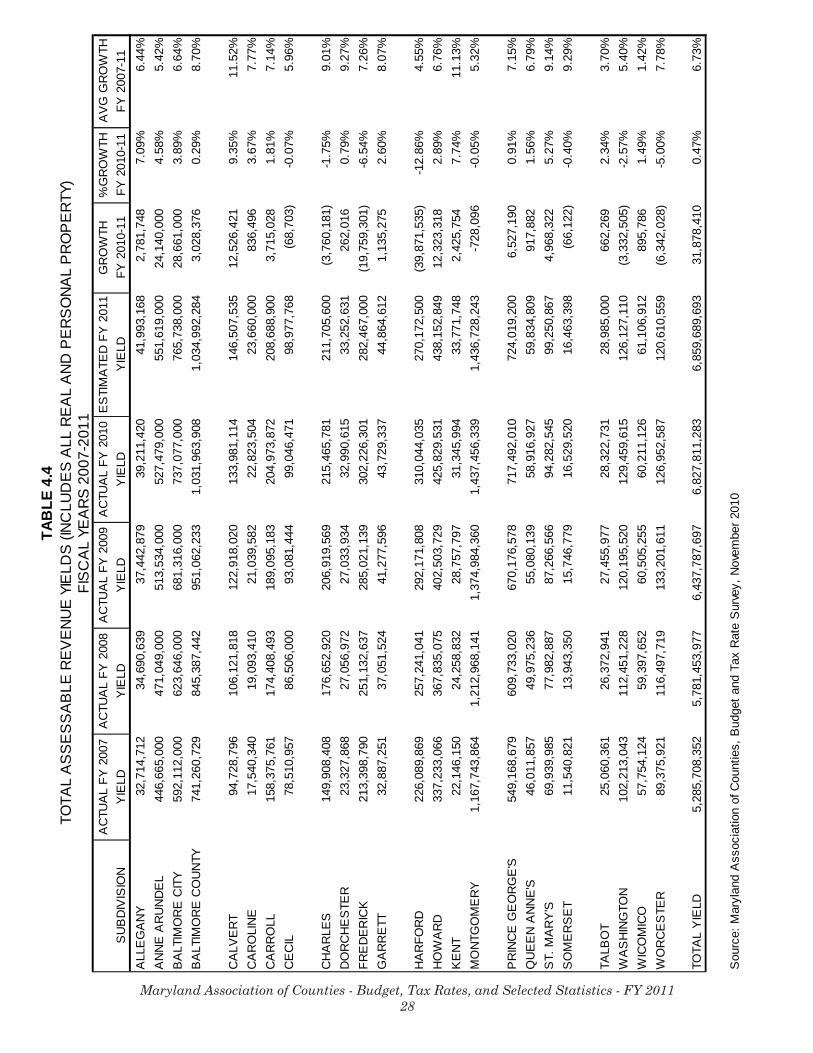
Table 4.4 shows each jurisdiction’s total assessable yield (real and personalproperty) and growth for Fiscal Years 2007 through 2011.
Real Property
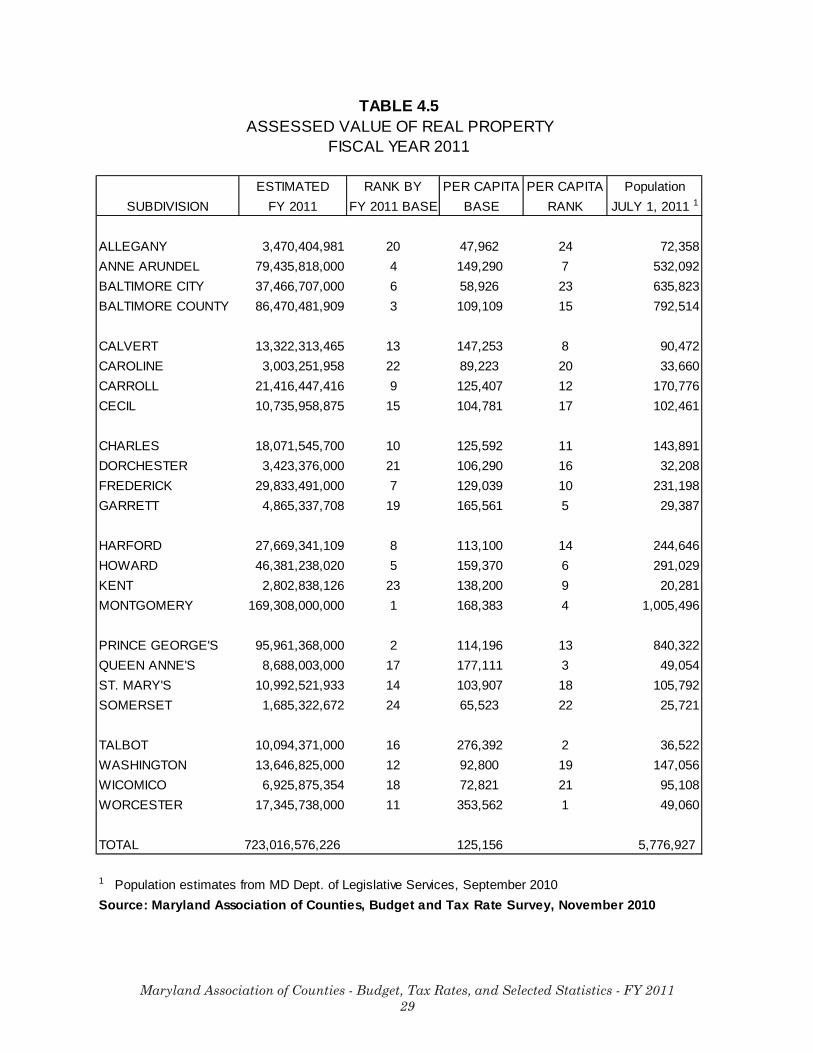
Table 4.5 compares each jurisdiction relative to the real property assessablebase in Fiscal Year 2011. Specifically, counties are ranked based upon their total FY 2011real property assessable base and their per capita base. Amounts representing the percapita real property assessable base in each jurisdiction are included. (see note aboveregarding the transition to full value assessment of real property)
Montgomery, Prince George’s and Baltimore Counties represent the top threejurisdictions (from largest to smallest) with respect to total real property assessable base.However, for per capita real property assessable base, the top two jurisdictions areWorcester County and Talbot County.
Table 4.6 reflects the net real property tax yields for Fiscal Years 2007 through2011. Highlighted is the change in total net revenues generated from each subdivision’sreal property from FY 2010 to FY 2011. Net indicates the estimate after adjustments foradditions and abatements, discounts, credits, penalties and interest, collections for prioryear, etc.
Personal Property
In accordance with legislation enacted during the 1967 Session of the GeneralAssembly, the political subdivisions are permitted to exempt personal property fromproperty taxation, either partially or completely.
Table 4.7 lists the current exempt status for three categories of personal propertyby subdivision. Not shown is the treatment of furniture, fixtures and equipment. Previousversions of this publication detailed the county exemptions for farm implements andlivestock—but both are exempted in every jurisdiction by current state law. Twenty onecounties offer 100% exemptions for all three categories shown. In addition, five counties(Frederick, Garrett, Kent, Queen Anne’s, and Talbot) levy no personal property tax. Thethree remaining subdivisions do not offer 100% exemption in all categories, but offerexemptions ranging from 0% to 65% for various commercial inventory, manufacturinginventory and machinery. No county taxes all categories of personal property at full value.
Maryland Association of Counties - Budget, Tax Rates, and Selected Statistics - FY 201124
Further, it should be noted that many of the subdivisions grant special exemptions orcredits to targeted, new and/or expanding industries, which are not reflected in thisanalysis.
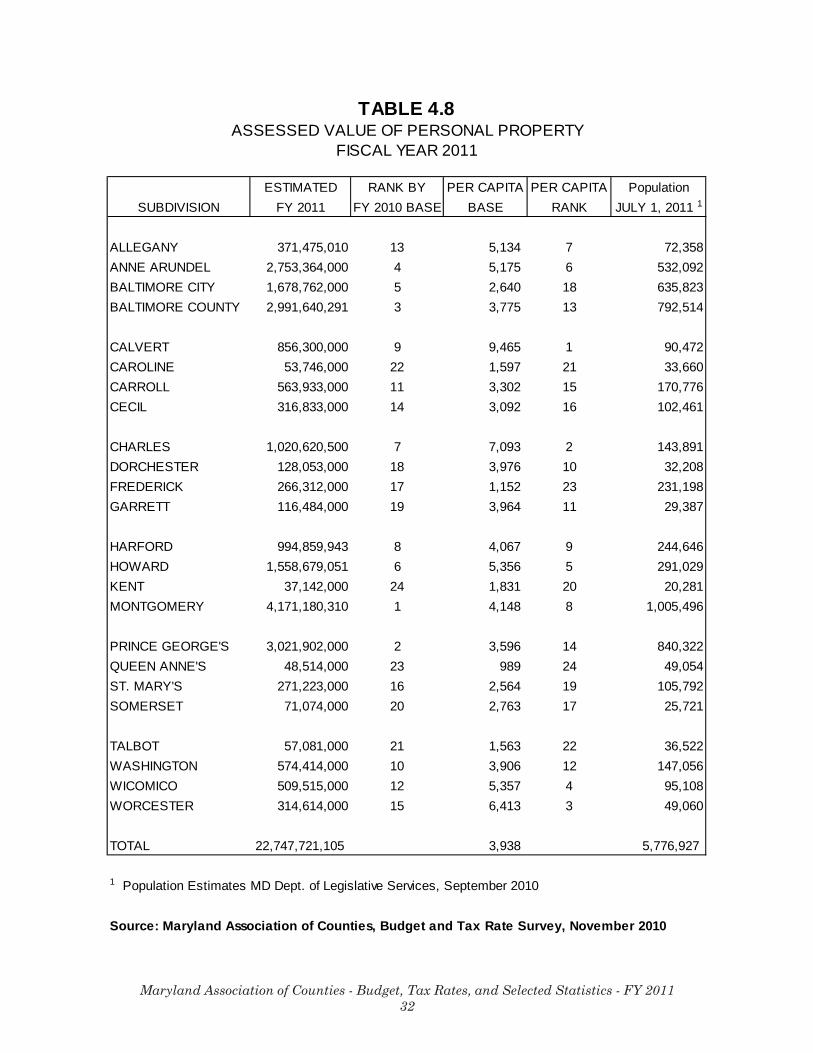
Table 4.8 compares jurisdictions relative to the personal property assessable basein FY 2010. Counties are ranked in this table with respect to total personal propertyassessable base and per capita base in FY 2011.
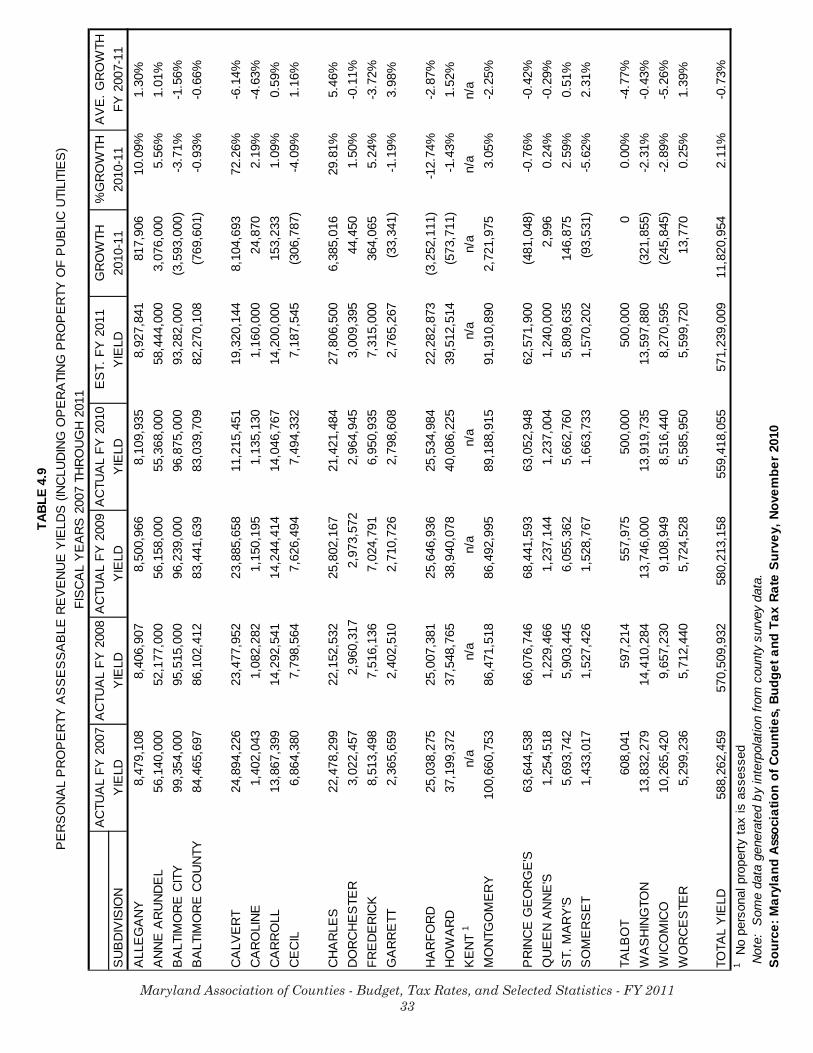
Table 4.9 shows the historic and estimated yields from personal property taxesfor each county. The personal property tax, is applied differently by different counties (seeTable 4.7), including counties levying no personal property tax at all, and some countieslevying no personal property tax on businesses, but applying the personal property tax rateto utility and railroad property. Yields from FY 2007 to FY 2010 are shown, along withestimated yields for FY 2011.
Maryland Association of Counties - Budget, Tax Rates, and Selected Statistics - FY 201125
TAB
LE 4
.1C
OU
NTY
PR
OP
ER
TY T
AX
RA
TES
(NO
N-M
UN
ICIP
AL
AR
EA
S)
FOR
FIS
CA
L YE
AR
S 2
001
THR
OU
GH
201
1
FYFY
FYFY
FYFY
FYFY
FYFY
CO
UN
TYor
igin
alad
just
ed20
0220
0320
0420
0520
0620
0720
0820
0920
1020
11
ALL
EG
AN
Y2.
460.
980.
980.
981.
001.
001
1.00
10.
9829
0.98
30.
9829
0.98
290.
983
AN
NE
AR
UN
DE
L2.
400.
960.
960.
950.
960.
941
0.93
10.
918
0.89
10.
888
0.87
60.
880
BA
LTIM
OR
E C
ITY
5.82
2.33
2.33
2.33
2.33
2.32
82.
308
2.28
82.
268
2.26
82.
268
2.26
8B
ALT
IMO
RE
CO
UN
TY2.
855
1.14
21.
115
1.11
51.
115
1.11
51.
115
1.10
01.
100
1.10
01.
100
1.10
0
CA
LVE
RT
2.23
0.89
0.89
0.89
0.89
0.89
20.
892
0.89
20.
892
0.89
20.
892
0.89
2C
AR
OLI
NE
2.38
0.95
0.95
0.95
0.95
0.95
20.
910
0.87
00.
870
0.87
00.
870
0.87
0C
AR
RO
LL2.
621.
051.
048
1.04
81.
048
1.04
81.
048
1.04
81.
048
1.04
81.
048
1.04
8C
EC
IL2.
450.
980.
980.
980.
980.
980
0.98
00.
960
0.96
00.
960
0.94
00.
915
CH
AR
LES
2.
491.
001.
021.
021.
021.
026
1.02
61.
026
1.02
61.
026
1.02
61.
026
DO
RC
HE
STE
R2.
180.
870.
880.
880.
930.
930
0.92
00.
896
0.89
60.
896
0.89
60.
896
FRE
DE
RIC
K2.
260.
901.
001.
001.
001.
000
1.00
00.
936
0.93
60.
936
0.93
60.
936
GA
RR
ETT
2.59
1.04
1.04
1.04
1.04
1.03
61.
000
1.00
01.
000
1.00
00.
990
0.99
0
HA
RFO
RD
2.73
1.09
1.09
1.09
1.09
1.09
21.
082
1.08
21.
082
1.08
21.
064
1.04
2H
OW
AR
D2.
611.
041.
041.
041.
041.
044
1.04
41.
014
1.01
41.
014
1.01
41.
014
KE
NT
2.53
1.01
1.01
1.01
1.01
1.01
20.
992
0.97
20.
972
0.97
20.
972
1.02
2M
ON
TGO
ME
RY
2.
253
0.90
10.
901
0.91
00.
914
0.90
200.
8560
0.81
200.
8120
0.81
80.
904
0.90
4
PR
INC
E G
EO
RG
E'S
2.41
0.96
0.96
0.96
20.
960
0.96
00.
960
0.96
00.
960
0.96
00.
960
0.96
0Q
UE
EN
AN
NE
'S2.
440.
980.
980.
980.
980.
926
0.87
00.
800
0.77
00.
770
0.77
00.
767
ST.
MA
RY
'S2.
270.
908
0.90
80.
908
0.90
80.
878
0.87
20.
857
0.85
70.
857
0.85
70.
857
SO
ME
RS
ET
2.45
0.98
0.98
1.01
1.01
1.01
00.
990
0.94
00.
940
0.92
00.
900
0.88
4
TALB
OT
1.39
0.56
0.56
0.55
0.55
0.54
00.
520
0.50
00.
475
0.44
90.
432
0.43
2W
AS
HIN
GTO
N2.
370.
950.
950.
950.
950.
948
0.94
80.
948
0.94
80.
948
0.94
80.
948
WIC
OM
ICO
2.71
1.08
1.07
1.05
1.04
1.02
50.
993
0.94
20.
881
0.81
40.
759
0.75
9W
OR
CE
STE
R1.
740.
700.
730.
730.
730.
730
0.70
00.
700
0.70
00.
700
0.70
00.
700
NO
TE:
Man
y co
untie
s le
vy s
peci
al s
ervi
ce p
rope
rty ta
xes
by d
istri
ct.
Exc
ept a
s no
ted
bel
ow, t
hose
taxe
s ar
e in
add
ition
to th
ose
repr
esen
ted
on th
is ta
ble.
FY 2
001
rate
s sh
ow b
oth
the
orig
inal
rate
set
by
the
coun
ty go
vern
men
t,and
the
equi
vale
nt a
djus
ted
rate
follo
win
g th
e m
id-y
ear c
onve
rsio
n to
full-
valu
e as
sess
men
t
Sour
ce: M
aryl
and
Asso
ciat
ion
of C
ount
ies,
Bud
get a
nd T
ax R
ate
Surv
ey, N
ovem
ber 2
010
and
prio
r yea
r sur
vey
data
FY 2
001
Maryland Association of Counties - Budget, Tax Rates, and Selected Statistics - FY 201126
TAB
LE 4
.2C
OU
NTY
PR
OP
ER
TY T
AX
RA
TES
AN
D C
ON
STA
NT
YIE
LD T
AX
RA
TES
(FO
R N
ON
-MU
NIC
IPA
L A
RE
AS
)FO
R F
ISC
AL
YEA
RS
200
7 TH
RO
UG
H 2
011
FY 2
007
FY 2
008
FY 2
009
FY 2
010
FY 2
011
CO
UN
TYP
.T.R
.C
.Y.T
.R.
%D
iff. 1
P.T
.R.
C.Y
.T.R
.%
Diff
. 1P
.T.R
.C
.Y.T
.R.
%D
iff. 1
P.T
.R.
C.Y
.T.R
.%
Diff
. 1P
.T.R
.C
.Y.T
.R.
%D
iff. 1
ALL
EG
AN
Y 2
0.98
290.
965
1.87
%0.
9829
0.90
67.
81%
0.98
290.
897
8.71
%0.
9829
0.91
506.
91%
0.98
290.
9152
6.89
%A
NN
E A
RU
ND
EL
20.
918
0.87
44.
79%
0.89
10.
867
2.69
%0.
888
0.83
95.
52%
0.87
60.
861
1.71
%0.
880
0.86
12.
16%
BA
LTIM
OR
E C
ITY
2.
288
2.22
42.
80%
2.26
82.
138
5.73
%2.
268
2.07
98.
33%
2.26
82.
093
7.72
%2.
268
2.09
37.
72%
BA
LTIM
OR
E C
OU
NTY
1.
100
1.06
73.
00%
1.10
01.
036
5.82
%1.
100
1.03
46.
00%
1.10
01.
046
4.91
%1.
100
1.04
64.
91%
C
ALV
ER
T 2
0.89
20.
805
9.75
%0.
892
0.79
311
.10%
0.89
20.
803
9.98
%0.
892
0.82
57.
51%
0.89
20.
825
7.51
%C
AR
OLI
NE
20.
870
0.83
24.
37%
0.87
00.
804
7.59
%0.
870
0.80
77.
24%
0.87
00.
816
6.21
%0.
870
0.85
31.
95%
CA
RR
OLL
1.04
80.
970
7.44
%1.
048
0.96
77.
73%
1.04
80.
965
7.92
%1.
048
0.97
86.
68%
1.04
80.
978
6.68
%C
EC
IL
0.96
00.
903
5.94
%0.
960
0.87
09.
38%
0.96
00.
873
9.06
%0.
940
0.89
74.
57%
0.91
50.
897
2.00
%
CH
AR
LES
21.
026
0.93
48.
97%
1.02
60.
934
8.97
%1.
026
0.94
18.
28%
1.02
60.
966
5.85
%1.
026
0.96
65.
85%
DO
RC
HE
STE
R0.
896
0.89
60.
00%
0.89
60.
820
8.48
%0.
896
0.82
38.
15%
0.89
60.
843
5.92
%0.
896
0.84
35.
92%
FRE
DE
RIC
K
0.93
60.
936
0.00
%0.
936
0.86
67.
48%
0.93
60.
866
7.48
%0.
936
1.00
5-7
.37%
0.93
60.
886
5.34
%G
AR
RE
TT 2
1.00
00.
893
10.7
0%1.
000
0.89
810
.20%
1.00
00.
918
8.20
%0.
990
0.94
64.
44%
0.99
00.
9433
4.72
%
HA
RFO
RD
21.
082
0.98
98.
60%
1.08
20.
984
9.06
%1.
082
0.95
212
.01%
1.06
40.
998
6.20
%1.
042
0.99
84.
22%
HO
WA
RD
1.
014
0.97
83.
55%
1.01
40.
948
6.51
%1.
014
0.95
26.
11%
1.01
41.
096
-8.0
9%1.
014
0.96
74.
64%
KE
NT
0.97
20.
917
5.66
%0.
972
0.88
29.
26%
0.97
20.
890
8.44
%0.
972
0.90
86.
58%
1.02
20.
908
11.1
5%M
ON
TGO
ME
RY
30.
8120
0.60
825
.12%
0.81
200.
561
30.9
1%0.
8180
0.57
030
.32%
0.90
40.
869
3.87
%0.
904
0.62
830
.53%
P
RIN
CE
GE
OR
GE
'S 2
0.96
00.
910
5.21
%0.
960
0.89
46.
88%
0.96
00.
888
7.50
%0.
960
1.23
5-2
8.65
%0.
960
0.89
96.
35%
QU
EE
N A
NN
E'S
0.
800
0.80
1-0
.13%
0.77
00.
734
4.68
%0.
770
0.71
57.
14%
0.77
00.
724
5.97
%0.
767
0.72
45.
62%
ST.
MA
RY
'S
0.85
70.
812
5.25
%0.
857
0.79
17.
70%
0.85
70.
782
8.75
%0.
857
0.79
86.
88%
0.85
70.
819
4.41
%S
OM
ER
SE
T0.
940
0.87
47.
02%
0.94
00.
825
12.2
3%0.
920
0.83
19.
67%
0.90
00.
874
2.89
%0.
8837
0.88
4-0
.03%
TA
LBO
T 2
0.50
00.
479
4.20
%0.
475
0.46
03.
16%
0.44
90.
437
2.67
%0.
432
0.42
22.
31%
0.43
20.
422
2.31
%W
AS
HIN
GTO
N
0.94
80.
873
7.91
%0.
948
0.87
37.
91%
0.94
80.
878
7.38
%0.
948
0.89
25.
91%
0.94
80.
953
-0.5
3%W
ICO
MIC
O
0.94
20.
923
2.02
%0.
881
0.86
32.
04%
0.81
40.
798
1.97
%0.
759
0.75
80.
13%
0.75
90.
758
0.13
%W
OR
CE
STE
R0.
700
0.62
211
.14%
0.70
00.
605
13.5
7%0.
700
0.61
911
.57%
0.70
00.
738
-5.4
3%0.
700
0.73
8-5
.43%
1 - Th
e pe
rcen
t tha
t the
act
ual a
dopt
ed ta
x ra
te fo
r the
cou
nty
is a
bove
or b
elow
its
calc
ulat
ed c
onst
ant y
ield
tax
rate
.2 -
Thes
e co
untie
s le
vy a
sep
arat
e co
unty
tax
rate
adj
uste
d by
a "
mun
icip
al ta
x ra
te d
iffer
entia
l" th
at a
pplie
s to
just
pro
perty
loca
ted
with
in a
par
ticul
ar m
unic
ipal
ity.
A
sep
arat
e co
unty
Con
stan
t Yie
ld T
ax R
ate
is c
alcu
late
d.3
- Mon
tgom
ery
Cou
nty
tax
rate
sho
wn
does
not
incl
ude
spec
ial s
ervic
e ar
ea ta
xes
(whi
ch a
rein
clud
ed in
Tab
le 4
.1)
Con
stan
t Yie
ld D
ata
prov
ided
by
the
Mar
ylan
d St
ate
Dep
artm
ent o
f Ass
essm
ents
and
Tax
atio
n, N
ovem
ber,
201
0
Maryland Association of Counties - Budget, Tax Rates, and Selected Statistics - FY 201127
TABLE 4.3ASSESSED VALUE OF REAL AND PERSONAL PROPERTY
(TOTAL ASSESSABLE BASE)FISCAL YEAR 2011
FY 2011 Total Rank By Per Per Penny onAssessable Total Capita Capita Tax Rate July 1, 2011
SUBDIVISION Base Base Base Rank Generates Population1
ALLEGANY 3,841,879,991 20 53,095 24 439,908 72,358ANNE ARUNDEL 82,189,182,000 4 154,464 8 6,522,500 532,092BALTIMORE CITY 39,145,469,000 6 61,567 23 3,376,271 635,823BALTIMORE COUNTY 89,462,122,200 3 112,884 15 7,315,575 792,514
CALVERT 14,178,613,465 13 156,718 7 1,546,306 90,472CAROLINE 3,056,997,958 23 90,820 20 267,223 33,660CARROLL 21,980,380,416 9 128,709 12 1,900,000 170,776CECIL 11,052,791,875 15 107,873 17 1,081,370 102,461
CHARLES 19,092,166,200 10 132,685 10 1,800,029 143,891DORCHESTER 3,551,429,000 21 110,265 16 371,123 32,208FREDERICK 30,099,803,000 7 130,191 11 2,939,658 231,198GARRETT 4,981,821,708 19 169,525 5 466,327 29,387
HARFORD 28,664,201,052 8 117,166 14 2,690,708 244,646HOWARD 47,939,917,071 5 164,726 6 4,321,034 291,029KENT 2,839,980,126 22 140,032 9 277,473 20,281MONTGOMERY 173,479,180,310 1 172,531 4 17,297,918 1,005,496
PRINCE GEORGE'S 98,983,270,000 2 117,792 13 NA 840,322QUEEN ANNE'S 8,736,517,000 17 178,100 3 868,800 49,054ST. MARY'S 11,263,744,933 14 106,471 18 1,158,120 105,792SOMERSET 1,756,396,672 24 68,286 22 166,971 25,721
TALBOT 10,151,452,000 16 277,954 2 659,375 36,522WASHINGTON 14,221,239,000 12 96,706 19 1,238,593 147,056WICOMICO 7,435,390,354 18 78,178 21 863,099 95,108WORCESTER 17,660,352,000 11 359,975 1 1,728,182 49,060
TOTAL $745,764,297,331 129,094 59,296,564 5,776,9271 - Population Estimates From MD Department of Legislative Services, September 2010Source: Maryland Association of Counties, Budget and Tax Rate Survey, November 2010
Maryland Association of Counties - Budget, Tax Rates, and Selected Statistics - FY 201128
TAB
LE 4
.4TO
TAL
AS
SE
SS
AB
LE R
EV
EN
UE
YIE
LDS
(IN
CLU
DE
S A
LL R
EA
L A
ND
PE
RS
ON
AL
PR
OP
ER
TY)
FIS
CA
L YE
AR
S 2
007-
2011
AC
TUA
L FY
200
7A
CTU
AL
FY 2
008
AC
TUA
L FY
200
9A
CTU
AL
FY 2
010
ES
TIM
ATE
D F
Y 2
011
GR
OW
TH%
GR
OW
THA
VG
GR
OW
THS
UB
DIV
ISIO
NY
IELD
YIE
LDY
IELD
YIE
LDY
IELD
FY 2
010-
11FY
201
0-11
FY 2
007-
11A
LLE
GA
NY
32,7
14,7
1234
,690
,639
37,4
42,8
7939
,211
,420
41,9
93,1
682,
781,
748
7.09
%6.
44%
AN
NE
AR
UN
DE
L44
6,66
5,00
047
1,04
9,00
051
3,53
4,00
052
7,47
9,00
055
1,61
9,00
024
,140
,000
4.58
%5.
42%
BA
LTIM
OR
E C
ITY
592,
112,
000
623,
646,
000
681,
316,
000
737,
077,
000
765,
738,
000
28,6
61,0
003.
89%
6.64
%B
ALT
IMO
RE
CO
UN
TY74
1,26
0,72
984
5,38
7,44
295
1,06
2,23
31,
031,
963,
908
1,03
4,99
2,28
43,
028,
376
0.29
%8.
70%
CA
LVE
RT
94,7
28,7
9610
6,12
1,81
812
2,91
8,02
013
3,98
1,11
414
6,50
7,53
512
,526
,421
9.35
%11
.52%
CA
RO
LIN
E17
,540
,340
19,0
93,4
1021
,039
,582
22,8
23,5
0423
,660
,000
836,
496
3.67
%7.
77%
CA
RR
OLL
158,
375,
761
174,
408,
493
189,
095,
183
204,
973,
872
208,
688,
900
3,71
5,02
81.
81%
7.14
%C
EC
IL78
,510
,957
86,5
06,0
0093
,081
,444
99,0
46,4
7198
,977
,768
(68,
703)
-0.0
7%5.
96%
CH
AR
LES
149,
908,
408
176,
652,
920
206,
919,
569
215,
465,
781
211,
705,
600
(3,7
60,1
81)
-1.7
5%9.
01%
DO
RC
HE
STE
R23
,327
,868
27,0
56,9
7227
,033
,934
32,9
90,6
1533
,252
,631
262,
016
0.79
%9.
27%
FRE
DE
RIC
K21
3,39
8,79
025
1,13
2,63
728
5,02
1,13
930
2,22
6,30
128
2,46
7,00
0(1
9,75
9,30
1)-6
.54%
7.26
%G
AR
RE
TT32
,887
,251
37,0
51,5
2441
,277
,596
43,7
29,3
3744
,864
,612
1,13
5,27
52.
60%
8.07
%
HA
RFO
RD
226,
089,
869
257,
241,
041
292,
171,
808
310,
044,
035
270,
172,
500
(39,
871,
535)
-12.
86%
4.55
%H
OW
AR
D33
7,23
3,06
636
7,83
5,07
540
2,50
3,72
942
5,82
9,53
143
8,15
2,84
912
,323
,318
2.89
%6.
76%
KE
NT
22,1
46,1
5024
,258
,832
28,7
57,7
9731
,345
,994
33,7
71,7
482,
425,
754
7.74
%11
.13%
MO
NTG
OM
ER
Y1,
167,
743,
864
1,21
2,96
8,14
11,
374,
984,
360
1,43
7,45
6,33
91,
436,
728,
243
-728
,096
-0.0
5%5.
32%
PR
INC
E G
EO
RG
E'S
549,
168,
679
609,
733,
020
670,
176,
578
717,
492,
010
724,
019,
200
6,52
7,19
00.
91%
7.15
%Q
UE
EN
AN
NE
'S46
,011
,857
49,9
75,2
3655
,080
,139
58,9
16,9
2759
,834
,809
917,
882
1.56
%6.
79%
ST.
MA
RY
'S69
,939
,985
77,9
82,8
8787
,266
,566
94,2
82,5
4599
,250
,867
4,96
8,32
25.
27%
9.14
%S
OM
ER
SE
T11
,540
,821
13,9
43,3
5015
,746
,779
16,5
29,5
2016
,463
,398
(66,
122)
-0.4
0%9.
29%
TALB
OT
25,0
60,3
6126
,372
,941
27,4
55,9
7728
,322
,731
28,9
85,0
0066
2,26
92.
34%
3.70
%W
AS
HIN
GTO
N10
2,21
3,04
311
2,45
1,22
812
0,19
5,52
012
9,45
9,61
512
6,12
7,11
0(3
,332
,505
)-2
.57%
5.40
%W
ICO
MIC
O57
,754
,124
59,3
97,6
5260
,505
,255
60,2
11,1
2661
,106
,912
895,
786
1.49
%1.
42%
WO
RC
ES
TER
89,3
75,9
2111
6,49
7,71
913
3,20
1,61
112
6,95
2,58
712
0,61
0,55
9(6
,342
,028
)-5
.00%
7.78
%
TOTA
L Y
IELD
5,28
5,70
8,35
25,
781,
453,
977
6,43
7,78
7,69
76,
827,
811,
283
6,85
9,68
9,69
331
,878
,410
0.47
%6.
73%
Sou
rce:
Mar
ylan
d A
ssoc
iatio
n of
Cou
ntie
s, B
udge
t and
Tax
Rat
e S
urve
y, N
ovem
ber 2
010
Maryland Association of Counties - Budget, Tax Rates, and Selected Statistics - FY 201129
TABLE 4.5ASSESSED VALUE OF REAL PROPERTY
FISCAL YEAR 2011
ESTIMATED RANK BY PER CAPITA PER CAPITA PopulationSUBDIVISION FY 2011 FY 2011 BASE BASE RANK JULY 1, 2011 1
ALLEGANY 3,470,404,981 20 47,962 24 72,358ANNE ARUNDEL 79,435,818,000 4 149,290 7 532,092BALTIMORE CITY 37,466,707,000 6 58,926 23 635,823BALTIMORE COUNTY 86,470,481,909 3 109,109 15 792,514
CALVERT 13,322,313,465 13 147,253 8 90,472CAROLINE 3,003,251,958 22 89,223 20 33,660CARROLL 21,416,447,416 9 125,407 12 170,776CECIL 10,735,958,875 15 104,781 17 102,461
CHARLES 18,071,545,700 10 125,592 11 143,891DORCHESTER 3,423,376,000 21 106,290 16 32,208FREDERICK 29,833,491,000 7 129,039 10 231,198GARRETT 4,865,337,708 19 165,561 5 29,387
HARFORD 27,669,341,109 8 113,100 14 244,646HOWARD 46,381,238,020 5 159,370 6 291,029KENT 2,802,838,126 23 138,200 9 20,281MONTGOMERY 169,308,000,000 1 168,383 4 1,005,496
PRINCE GEORGE'S 95,961,368,000 2 114,196 13 840,322QUEEN ANNE'S 8,688,003,000 17 177,111 3 49,054ST. MARY'S 10,992,521,933 14 103,907 18 105,792SOMERSET 1,685,322,672 24 65,523 22 25,721
TALBOT 10,094,371,000 16 276,392 2 36,522WASHINGTON 13,646,825,000 12 92,800 19 147,056WICOMICO 6,925,875,354 18 72,821 21 95,108WORCESTER 17,345,738,000 11 353,562 1 49,060
TOTAL 723,016,576,226 125,156 5,776,927
1 Population estimates from MD Dept. of Legislative Services, September 2010Source: Maryland Association of Counties, Budget and Tax Rate Survey, November 2010

Maryland Association of Counties - Budget, Tax Rates, and Selected Statistics - FY 201130
TAB
LE 4
.6R
EA
L P
RO
PE
RTY
AS
SE
SS
AB
LE R
EV
EN
UE
YIE
LDS
FIS
CA
L YE
AR
S 2
007
- 201
1G
RO
WTH
%G
RO
WTH
AV
E.G
RO
WTH
SU
BD
IVIS
ION
FY 2
007
FY 2
008
FY 2
009
FY 2
010
FY 2
011
FY 2
010-
11FY
201
0-11
FY 2
007-
11A
LLE
GA
NY
124
,235
,604
26,2
83,7
3228
,941
,913
31,1
01,4
8533
,065
,327
1,96
3,84
26.
31%
8.08
%A
NN
E A
RU
ND
EL
390,
525,
000
418,
872,
000
457,
376,
000
472,
111,
000
493,
175,
000
21,0
64,0
004.
46%
6.01
%B
ALT
IMO
RE
CIT
Y 1
492,
758,
000
528,
131,
000
585,
077,
000
640,
202,
000
672,
456,
000
32,2
54,0
005.
04%
8.08
%B
ALT
IMO
RE
CO
UN
TY 1
656,
795,
032
759,
285,
030
867,
620,
594
948,
924,
199
952,
722,
176
3,79
7,97
70.
40%
9.74
%
CA
LVE
RT
69,8
34,5
7082
,643
,866
99,0
32,3
6212
2,76
5,66
312
7,18
7,39
14,
421,
728
3.60
%16
.17%
CA
RO
LIN
E16
,138
,297
18,0
11,1
2819
,889
,387
21,6
88,3
7422
,500
,000
811,
626
3.74
%8.
66%
CA
RR
OLL
144,
508,
362
160,
115,
952
174,
850,
769
190,
927,
105
194,
488,
900
3,56
1,79
51.
87%
7.71
%C
EC
IL71
,646
,577
78,7
07,4
3685
,454
,950
91,5
52,1
3991
,790
,223
238,
084
0.26
%6.
39%
CH
AR
LES
127,
430,
109
154,
500,
388
181,
117,
401
194,
044,
298
183,
899,
100
(10,
145,
198)
-5.2
3%9.
60%
DO
RC
HE
STE
R20
,305
,411
24,0
96,6
5524
,060
,362
30,0
25,6
6930
,243
,236
217,
567
0.72
%10
.47%
FRE
DE
RIC
K20
4,88
5,29
224
3,61
6,50
127
7,99
6,34
829
5,27
5,36
627
5,15
2,00
0(2
0,12
3,36
6)-6
.82%
7.65
%G
AR
RE
TT30
,521
,592
34,6
49,0
1438
,566
,870
40,9
30,7
2942
,099
,345
1,16
8,61
62.
86%
8.37
%
HA
RFO
RD
201,
051,
594
232,
233,
660
266,
524,
872
284,
509,
051
247,
889,
627
(36,
619,
424)
-12.
87%
5.38
%H
OW
AR
D30
0,03
3,69
433
0,28
6,31
036
3,56
3,65
138
5,74
3,30
639
8,64
0,33
512
,897
,029
3.34
%7.
36%
KE
NT
21,3
07,8
0023
,362
,881
27,8
62,8
6430
,798
,660
32,8
22,7
702,
024,
110
6.57
%11
.41%
MO
NTG
OM
ER
Y1,
067,
083,
111
1,12
6,49
6,62
31,
288,
491,
365
1,34
8,26
7,42
41,
344,
817,
353
(3,4
50,0
71)
-0.2
6%5.
95%
PR
INC
E G
EO
RG
E'S
485,
524,
141
543,
656,
274
601,
734,
985
654,
439,
062
661,
447,
300
7,00
8,23
81.
07%
8.04
%Q
UE
EN
AN
NE
'S44
,757
,339
48,7
45,7
7053
,842
,995
57,6
79,9
2358
,594
,809
914,
886
1.59
%6.
97%
ST.
MA
RY
'S64
,246
,243
72,0
79,4
4281
,211
,204
88,6
19,7
8593
,441
,232
4,82
1,44
75.
44%
9.82
%S
OM
ER
SE
T10
,107
,804
12,4
15,9
2414
,218
,012
14,8
65,7
8714
,893
,196
27,4
090.
18%
10.1
7%
TALB
OT
24,4
52,3
2025
,775
,727
26,8
98,0
0227
,822
,731
28,4
85,0
0066
2,26
92.
38%
3.89
%W
AS
HIN
GTO
N88
,380
,764
98,0
40,9
4410
6,44
9,52
011
5,53
9,88
011
2,52
9,23
0(3
,010
,650
)-2
.61%
6.23
%W
ICO
MIC
O47
,488
,704
49,7
40,4
2251
,396
,306
54,9
52,9
9652
,836
,317
(2,1
16,6
79)
-3.8
5%2.
70%
WO
RC
ES
TER
84,0
76,6
8511
0,78
5,27
912
7,47
7,08
312
1,36
6,63
711
5,01
0,83
9(6
,355
,798
)-5
.24%
8.15
%
TOTA
L Y
IELD
4,68
8,09
4,04
55,
202,
531,
958
5,84
9,65
4,81
56,
264,
153,
269
6,28
0,18
6,70
616
,033
,437
7.58
%1 T
hese
am
ount
s do
not
incl
ude
tax
exem
pt p
rope
rty.
Sour
ce: M
aryl
and
Asso
ciat
ion
of C
ount
ies,
Bud
get a
nd T
ax R
ate
Surv
ey, N
ovem
ber 2
010

Maryland Association of Counties - Budget, Tax Rates, and Selected Statistics - FY 201131
TABLE 4.7TAXATION OF PERSONAL PROPERTY 1
(Expressed As The Percentage Exempt From Local Taxation)Fiscal Year 2011
COMMERCIAL MANUFACTURING and R&DSUBDIVISION INVENTORY INVENTORY MACHINERY
ALLEGANY 100 100 100ANNE ARUNDEL 100 100 100BALTIMORE CITY 2 100 100 100BALTIMORE COUNTY 100 100 100
CALVERT 100 100 100CAROLINE 100 100 100CARROLL 100 100 100CECIL 100 100 100
CHARLES 100 100 100DORCHESTER 3 100 100 100FREDERICK 4 100 100 100GARRETT 4 100 100 100
HARFORD 100 100 100HOWARD 100 100 100KENT 3 100 100 100MONTGOMERY 100 100 100
PRINCE GEORGE'S 2 100 100 100QUEEN ANNE'S 4 100 100 100ST. MARY'S 100 100 100SOMERSET 100 100 0
TALBOT 4 100 100 100WASHINGTON 100 100 100WICOMICO 65 100 0WORCESTER 100 100 0
1 State law has exempted all farm implements and livestock, therefore they are no longer presented here.
4 All other personal property is 100% exempt. Source: Department of Assessments and Taxation, July 1, 2010
2 Exemption for machinery includes pasteurizing & laundries.3 All other personal property 50% exempt; being phased out @10% per year.
Maryland Association of Counties - Budget, Tax Rates, and Selected Statistics - FY 201132
TABLE 4.8ASSESSED VALUE OF PERSONAL PROPERTY
FISCAL YEAR 2011
ESTIMATED RANK BY PER CAPITA PER CAPITA PopulationSUBDIVISION FY 2011 FY 2010 BASE BASE RANK JULY 1, 2011 1
ALLEGANY 371,475,010 13 5,134 7 72,358ANNE ARUNDEL 2,753,364,000 4 5,175 6 532,092BALTIMORE CITY 1,678,762,000 5 2,640 18 635,823BALTIMORE COUNTY 2,991,640,291 3 3,775 13 792,514
CALVERT 856,300,000 9 9,465 1 90,472CAROLINE 53,746,000 22 1,597 21 33,660CARROLL 563,933,000 11 3,302 15 170,776CECIL 316,833,000 14 3,092 16 102,461
CHARLES 1,020,620,500 7 7,093 2 143,891DORCHESTER 128,053,000 18 3,976 10 32,208FREDERICK 266,312,000 17 1,152 23 231,198GARRETT 116,484,000 19 3,964 11 29,387
HARFORD 994,859,943 8 4,067 9 244,646HOWARD 1,558,679,051 6 5,356 5 291,029KENT 37,142,000 24 1,831 20 20,281MONTGOMERY 4,171,180,310 1 4,148 8 1,005,496
PRINCE GEORGE'S 3,021,902,000 2 3,596 14 840,322QUEEN ANNE'S 48,514,000 23 989 24 49,054ST. MARY'S 271,223,000 16 2,564 19 105,792SOMERSET 71,074,000 20 2,763 17 25,721
TALBOT 57,081,000 21 1,563 22 36,522WASHINGTON 574,414,000 10 3,906 12 147,056WICOMICO 509,515,000 12 5,357 4 95,108WORCESTER 314,614,000 15 6,413 3 49,060
TOTAL 22,747,721,105 3,938 5,776,927
1 Population Estimates MD Dept. of Legislative Services, September 2010
Source: Maryland Association of Counties, Budget and Tax Rate Survey, November 2010
Maryland Association of Counties - Budget, Tax Rates, and Selected Statistics - FY 201133
TAB
LE 4
.9P
ER
SO
NA
L P
RO
PE
RTY
AS
SE
SS
AB
LE R
EV
EN
UE
YIE
LDS
(IN
CLU
DIN
G O
PE
RA
TIN
G P
RO
PE
RTY
OF
PU
BLI
C U
TILI
TIE
S)
FIS
CA
L Y
EA
RS
200
7 TH
RO
UG
H 2
011
AC
TUA
L FY
200
7A
CTU
AL
FY 2
008
AC
TUA
L FY
200
9A
CTU
AL
FY 2
010
ES
T. F
Y 2
011
GR
OW
TH%
GR
OW
THA
VE
. GR
OW
THS
UB
DIV
ISIO
NY
IELD
YIE
LDY
IELD
YIE
LDY
IELD
2010
-11
2010
-11
FY 2
007-
11A
LLE
GA
NY
8,47
9,10
88,
406,
907
8,50
0,96
68,
109,
935
8,92
7,84
181
7,90
610
.09%
1.30
%A
NN
E A
RU
ND
EL
56,1
40,0
0052
,177
,000
56,1
58,0
0055
,368
,000
58,4
44,0
003,
076,
000
5.56
%1.
01%
BA
LTIM
OR
E C
ITY
99,3
54,0
0095
,515
,000
96,2
39,0
0096
,875
,000
93,2
82,0
00(3
,593
,000
)-3
.71%
-1.5
6%B
ALT
IMO
RE
CO
UN
TY84
,465
,697
86,1
02,4
1283
,441
,639
83,0
39,7
0982
,270
,108
(769
,601
)-0
.93%
-0.6
6%
CA
LVE
RT
24,8
94,2
2623
,477
,952
23,8
85,6
5811
,215
,451
19,3
20,1
448,
104,
693
72.2
6%-6
.14%
CA
RO
LIN
E1,
402,
043
1,08
2,28
21,
150,
195
1,13
5,13
01,
160,
000
24,8
702.
19%
-4.6
3%C
AR
RO
LL13
,867
,399
14,2
92,5
4114
,244
,414
14,0
46,7
6714
,200
,000
153,
233
1.09
%0.
59%
CE
CIL
6,86
4,38
07,
798,
564
7,62
6,49
47,
494,
332
7,18
7,54
5(3
06,7
87)
-4.0
9%1.
16%
CH
AR
LES
22,4
78,2
9922
,152
,532
25,8
02,1
6721
,421
,484
27,8
06,5
006,
385,
016
29.8
1%5.
46%
DO
RC
HE
STE
R3,
022,
457
2,96
0,31
72,
973,
572
2,96
4,94
53,
009,
395
44,4
501.
50%
-0.1
1%FR
ED
ER
ICK
8,
513,
498
7,51
6,13
67,
024,
791
6,95
0,93
57,
315,
000
364,
065
5.24
%-3
.72%
GA
RR
ETT
2,36
5,65
92,
402,
510
2,71
0,72
62,
798,
608
2,76
5,26
7(3
3,34
1)-1
.19%
3.98
%
HA
RFO
RD
25,0
38,2
7525
,007
,381
25,6
46,9
3625
,534
,984
22,2
82,8
73(3
,252
,111
)-1
2.74
%-2
.87%
HO
WA
RD
37,1
99,3
7237
,548
,765
38,9
40,0
7840
,086
,225
39,5
12,5
14(5
73,7
11)
-1.4
3%1.
52%
KE
NT
1 n/
a
n/
a
n/
a
n/
a
n/
a
n/
a
n/
a
n/
a
M
ON
TGO
ME
RY
100,
660,
753
86,4
71,5
1886
,492
,995
89,1
88,9
1591
,910
,890
2,72
1,97
53.
05%
-2.2
5%
PR
INC
E G
EO
RG
E'S
63,6
44,5
3866
,076
,746
68,4
41,5
9363
,052
,948
62,5
71,9
00(4
81,0
48)
-0.7
6%-0
.42%
QU
EE
N A
NN
E'S
1,25
4,51
81,
229,
466
1,23
7,14
41,
237,
004
1,24
0,00
02,
996
0.24
%-0
.29%
ST.
MA
RY
'S5,
693,
742
5,90
3,44
56,
055,
362
5,66
2,76
05,
809,
635
146,
875
2.59
%0.
51%
SO
ME
RS
ET
1,43
3,01
71,
527,
426
1,52
8,76
71,
663,
733
1,57
0,20
2(9
3,53
1)-5
.62%
2.31
%
TALB
OT
608,
041
597,
214
557,
975
500,
000
500,
000
00.
00%
-4.7
7%W
AS
HIN
GTO
N13
,832
,279
14,4
10,2
8413
,746
,000
13,9
19,7
3513
,597
,880
(321
,855
)-2
.31%
-0.4
3%W
ICO
MIC
O10
,265
,420
9,65
7,23
09,
108,
949
8,51
6,44
08,
270,
595
(245
,845
)-2
.89%
-5.2
6%W
OR
CE
STE
R5,
299,
236
5,71
2,44
05,
724,
528
5,58
5,95
05,
599,
720
13,7
700.
25%
1.39
%
TOTA
L Y
IELD
588,
262,
459
570,
509,
932
580,
213,
158
559,
418,
055
571,
239,
009
11,8
20,9
542.
11%
-0.7
3%1 N
o pe
rson
al p
rope
rty ta
x is
ass
esse
d
N
ote:
Som
e da
ta g
ener
ated
by
inte
rpol
atio
n fro
m c
ount
y su
rvey
dat
a.S
ourc
e: M
aryl
and
Ass
ocia
tion
of C
ount
ies,
Bud
get a
nd T
ax R
ate
Sur
vey,
Nov
embe
r 20
10
Maryland Association of Counties - Budget, Tax Rates, and Selected Statistics - FY 201134
SECTION 5 – PROPERTY TAX ADMINISTRATION
Table 5.1 identifies subdivisions offering discounts for property tax paymentsreceived before the statewide due date in September. For those counties offering adiscount, the revenue impact of the discount is shown.
Twelve counties and Baltimore City grant a percentage discount for the payment ofproperty taxes prior to a particular date. The amount of discount ranges from 0.5% to 2%,depending on how early the payment is made.
Conversely, each subdivision levies a percentage penalty and/or interest rate forlate property tax payments. After October 1st, monthly interest charges vary. Penalties areimposed in a variety of ways including monthly surcharges or flat rates after a certain date.
Table 5.2 shows each subdivision’s penalty and/or interest charged for latepayment of property taxes. Also shown are the revenue effects of these charges forlate payments.
Table 5.3 details each county’s Homestead Property Tax Credit percentage. Thisis a statutory limit on the amount an assessment increase may affect a taxpayer’s taxburden. Since 1977, State law provided that owner-occupied dwellings were not taxedon annual assessment increases that exceed 15%. While the Homestead Credit is nottechnically a cap on assessment increases, the provision of a property tax credit againstlarge assessment increases functions much the same as a cap.
During the 1990 and 1991 Sessions of the General Assembly, significantchanges were made to the Homestead Property Tax Credit Program. For the first timethe credit was applied to the State property tax to limit taxable assessment increases forhomeowners to 10% annually. Additionally, each county was mandated to adopt a localordinance or resolution specifying a local percentage of 0% to 10% for purposes of localproperty taxation.
Table 5.3 lists the Homestead Credit Percentages set by each county for FY 2006through FY 2011. The Homestead Credit percentage selected by each county isexpressed as a percentage increase from the prior year’s assessment.
If a municipality disagrees with the Homestead Credit Percentage specified by itscounty, municipal officials may set their own limit between 0% and 10%. If a municipalitytakes no action, then the county percentage will apply to assessments used to computemunicipal taxes.
Local percentages (county and municipal) remain in effect until changed by localaction. County governments may, in the future, change their Homestead Creditpercentage, but must do so by November 15th preceding the year of the proposedchange. Municipalities may change the percentage before November 25th of thepreceding year.
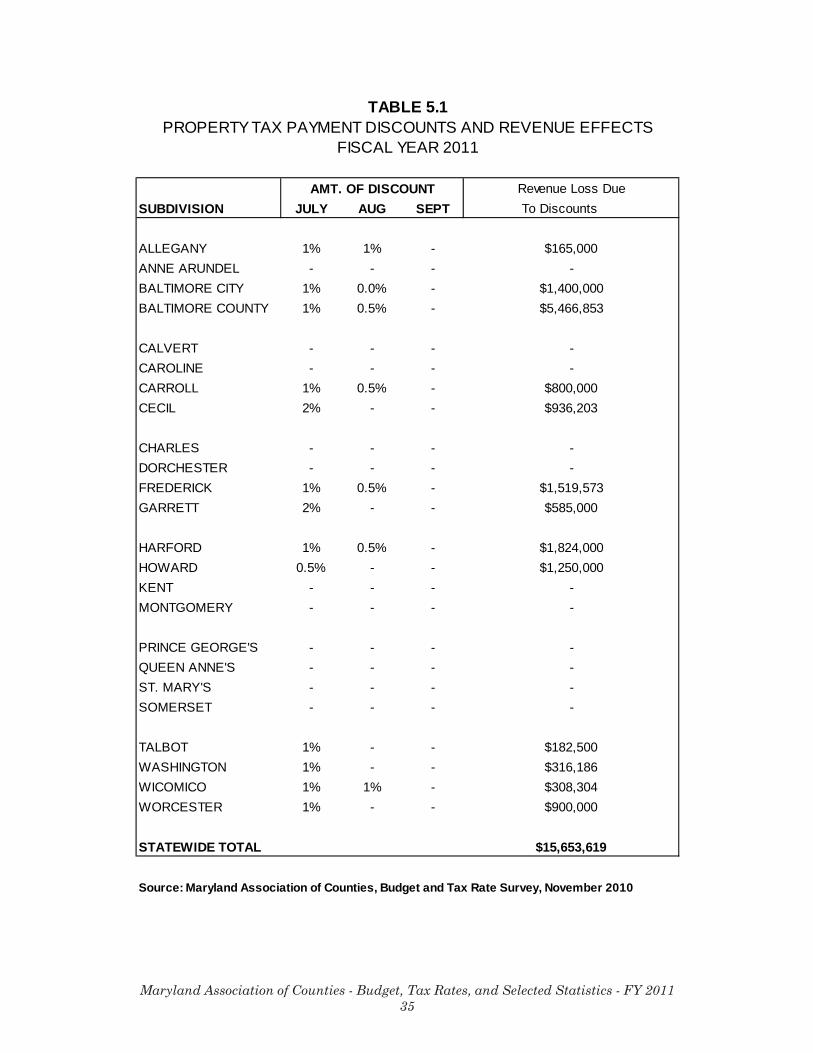
Maryland Association of Counties - Budget, Tax Rates, and Selected Statistics - FY 201135
TABLE 5.1PROPERTY TAX PAYMENT DISCOUNTS AND REVENUE EFFECTS
FISCAL YEAR 2011
Revenue Loss DueSUBDIVISION JULY AUG SEPT To Discounts
ALLEGANY 1% 1% - $165,000ANNE ARUNDEL - - - -BALTIMORE CITY 1% 0.0% - $1,400,000BALTIMORE COUNTY 1% 0.5% - $5,466,853
CALVERT - - - -CAROLINE - - - -CARROLL 1% 0.5% - $800,000CECIL 2% - - $936,203
CHARLES - - - -DORCHESTER - - - -FREDERICK 1% 0.5% - $1,519,573GARRETT 2% - - $585,000
HARFORD 1% 0.5% - $1,824,000HOWARD 0.5% - - $1,250,000KENT - - - -MONTGOMERY - - - -
PRINCE GEORGE'S - - - -QUEEN ANNE'S - - - -ST. MARY'S - - - -SOMERSET - - - -
TALBOT 1% - - $182,500WASHINGTON 1% - - $316,186WICOMICO 1% 1% - $308,304WORCESTER 1% - - $900,000
STATEWIDE TOTAL $15,653,619
Source: Maryland Association of Counties, Budget and Tax Rate Survey, November 2010
AMT. OF DISCOUNT
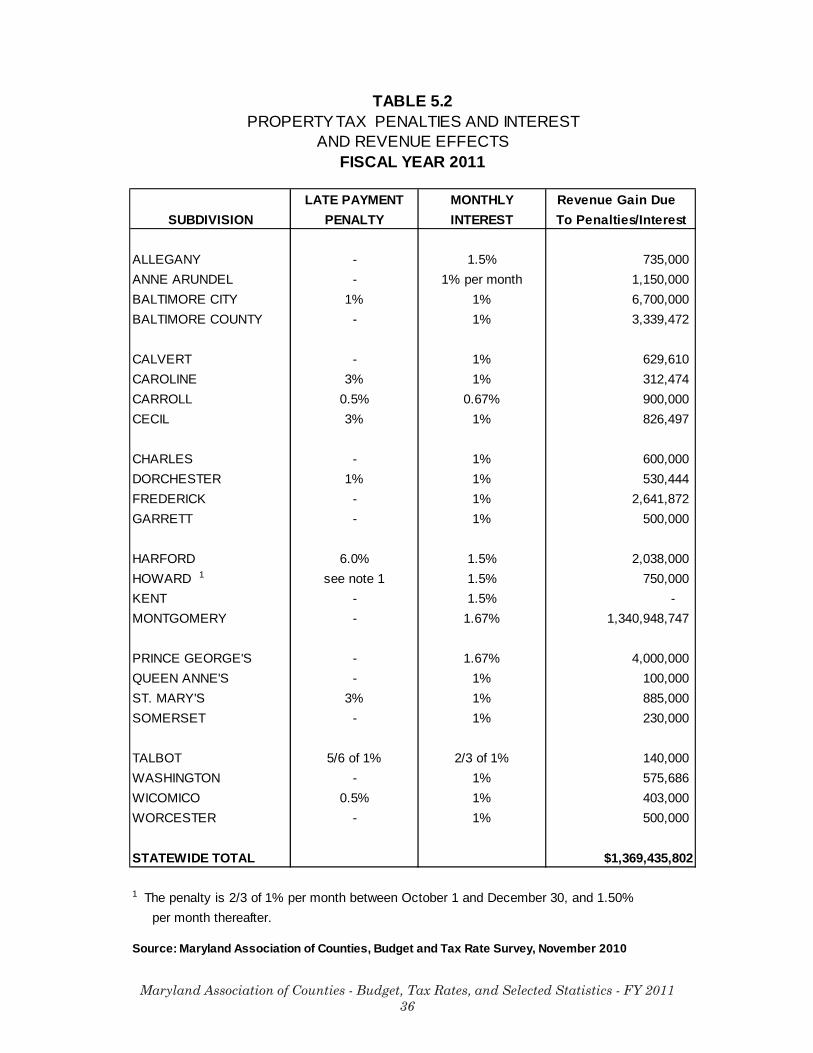
Maryland Association of Counties - Budget, Tax Rates, and Selected Statistics - FY 201136
TABLE 5.2PROPERTY TAX PENALTIES AND INTEREST
AND REVENUE EFFECTSFISCAL YEAR 2011
LATE PAYMENT MONTHLY Revenue Gain Due SUBDIVISION PENALTY INTEREST To Penalties/Interest
ALLEGANY - 1.5% 735,000 ANNE ARUNDEL - 1% per month 1,150,000 BALTIMORE CITY 1% 1% 6,700,000 BALTIMORE COUNTY - 1% 3,339,472
CALVERT - 1% 629,610 CAROLINE 3% 1% 312,474 CARROLL 0.5% 0.67% 900,000 CECIL 3% 1% 826,497
CHARLES - 1% 600,000 DORCHESTER 1% 1% 530,444 FREDERICK - 1% 2,641,872 GARRETT - 1% 500,000
HARFORD 6.0% 1.5% 2,038,000 HOWARD 1 see note 1 1.5% 750,000 KENT - 1.5% - MONTGOMERY - 1.67% 1,340,948,747
PRINCE GEORGE'S - 1.67% 4,000,000 QUEEN ANNE'S - 1% 100,000 ST. MARY'S 3% 1% 885,000 SOMERSET - 1% 230,000
TALBOT 5/6 of 1% 2/3 of 1% 140,000 WASHINGTON - 1% 575,686 WICOMICO 0.5% 1% 403,000 WORCESTER - 1% 500,000
STATEWIDE TOTAL $1,369,435,802
1 The penalty is 2/3 of 1% per month between October 1 and December 30, and 1.50% per month thereafter.
Source: Maryland Association of Counties, Budget and Tax Rate Survey, November 2010
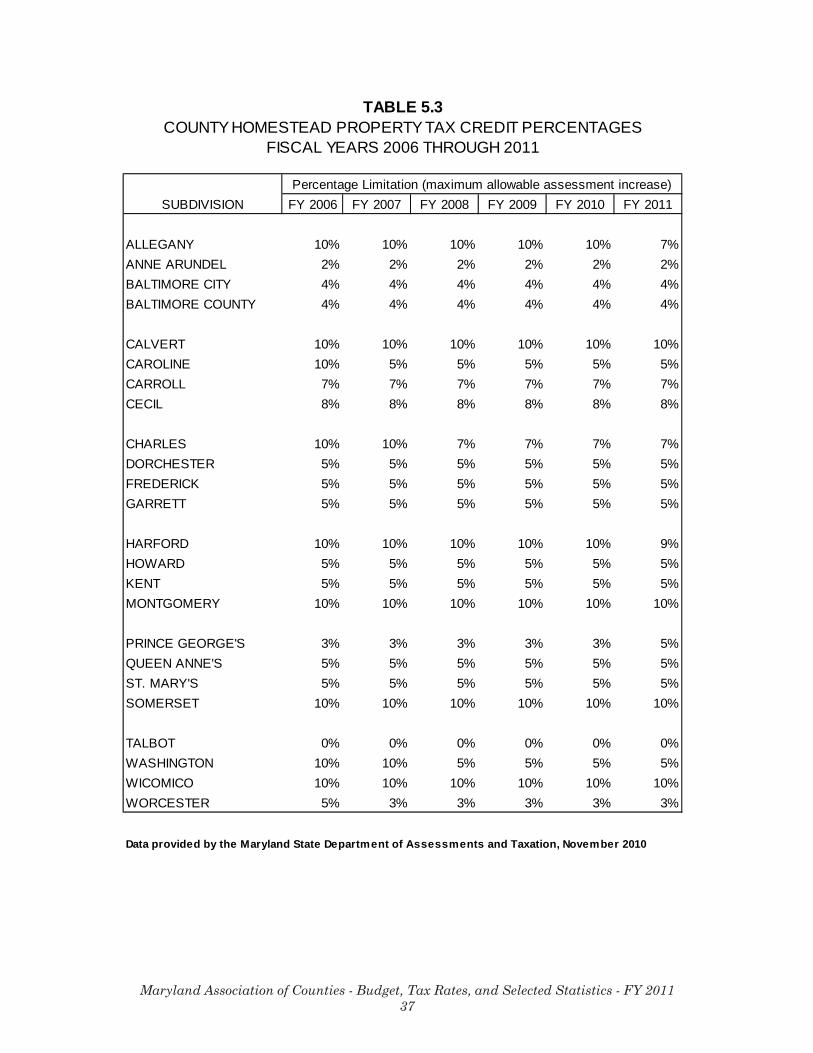
Maryland Association of Counties - Budget, Tax Rates, and Selected Statistics - FY 201137
TABLE 5.3COUNTY HOMESTEAD PROPERTY TAX CREDIT PERCENTAGES
FISCAL YEARS 2006 THROUGH 2011
Percentage Limitation (maximum allowable assessment increase)SUBDIVISION FY 2006 FY 2007 FY 2008 FY 2009 FY 2010 FY 2011
ALLEGANY 10% 10% 10% 10% 10% 7%ANNE ARUNDEL 2% 2% 2% 2% 2% 2%BALTIMORE CITY 4% 4% 4% 4% 4% 4%BALTIMORE COUNTY 4% 4% 4% 4% 4% 4%
CALVERT 10% 10% 10% 10% 10% 10%CAROLINE 10% 5% 5% 5% 5% 5%CARROLL 7% 7% 7% 7% 7% 7%CECIL 8% 8% 8% 8% 8% 8%
CHARLES 10% 10% 7% 7% 7% 7%DORCHESTER 5% 5% 5% 5% 5% 5%FREDERICK 5% 5% 5% 5% 5% 5%GARRETT 5% 5% 5% 5% 5% 5%
HARFORD 10% 10% 10% 10% 10% 9%HOWARD 5% 5% 5% 5% 5% 5%KENT 5% 5% 5% 5% 5% 5%MONTGOMERY 10% 10% 10% 10% 10% 10%
PRINCE GEORGE'S 3% 3% 3% 3% 3% 5%QUEEN ANNE'S 5% 5% 5% 5% 5% 5%ST. MARY'S 5% 5% 5% 5% 5% 5%SOMERSET 10% 10% 10% 10% 10% 10%
TALBOT 0% 0% 0% 0% 0% 0%WASHINGTON 10% 10% 5% 5% 5% 5%WICOMICO 10% 10% 10% 10% 10% 10%WORCESTER 5% 3% 3% 3% 3% 3%
Data provided by the Maryland State Department of Assessments and Taxation, November 2010
Maryland Association of Counties - Budget, Tax Rates, and Selected Statistics - FY 201138
SECTION 6 – INCOME TAXES
The local income tax, historically referred to as the “piggyback income tax,” wasmade available to political subdivisions in an effort to relieve the pressure and relianceon the local property tax.
Table 6.1 shows each county’s local income tax rate for Calendar Years 2006through 2011. The income tax has been an area of significant change in recent years, andthe basic nature and structure of the local income tax has been altered.
Prior to 1993, counties had the authority to set a local income tax rate between20% and 50% of state tax liability. During the 1992 Legislative Session, authority wasgranted to counties by the General Assembly to raise the maximum “piggyback” incometax rate to 60%. Eleven counties have elected to raise their rates above 50% since thattime, including Talbot County, which subsequently reduced the county income tax rateto 40% with an offsetting increase in the property tax rate.
Beginning in CY 1999, the local income tax was “decoupled” from certainprovisions of the State income tax. Tax reductions enacted by the General Assembly in1997, and revised in 1999, increased the State’s personal exemption amount andreduced the highest marginal tax rate. The tax reductions, intended to reduce incometaxes by 10%, were phased in over a five-year period. However, the county income taxwas “decoupled” from these changes—county taxes were calculated as though theState tax structure had not been changed.
In 1999, the General Assembly revisited the State and local income tax structureto seek further taxpayer simplicity and compliance. This legislation substantially alteredthe nature of the Maryland local income tax. For tax years 1999 and beyond, the taxesare applied as a flat percentage rate to the taxpayer’s entire Maryland taxable income.This modification required each county’s tax rates to be restated and adjusted to reflectthe new tax format (stating the tax rate as a percent of taxable income rather than as apercent of state taxes due). In essence, the “piggyback” tax (a tax based on an amountof the state tax) was abolished, and replaced with a simpler, flat-rate tax applied to alltaxable income.
Table 6.2 displays estimated yields and property tax equivalents by subdivisionfor Fiscal Years 2007 through 2011. The table also reflects the increase or (decrease) inpiggyback tax revenues between Fiscal Years 2010 and 2011 for each subdivision.
Table 6.3 compares and ranks counties based upon their CY 2009 net taxableincome and per capita taxable income. Data from 2009 is the most recently compiled dataavailable from the Office of the Comptroller.
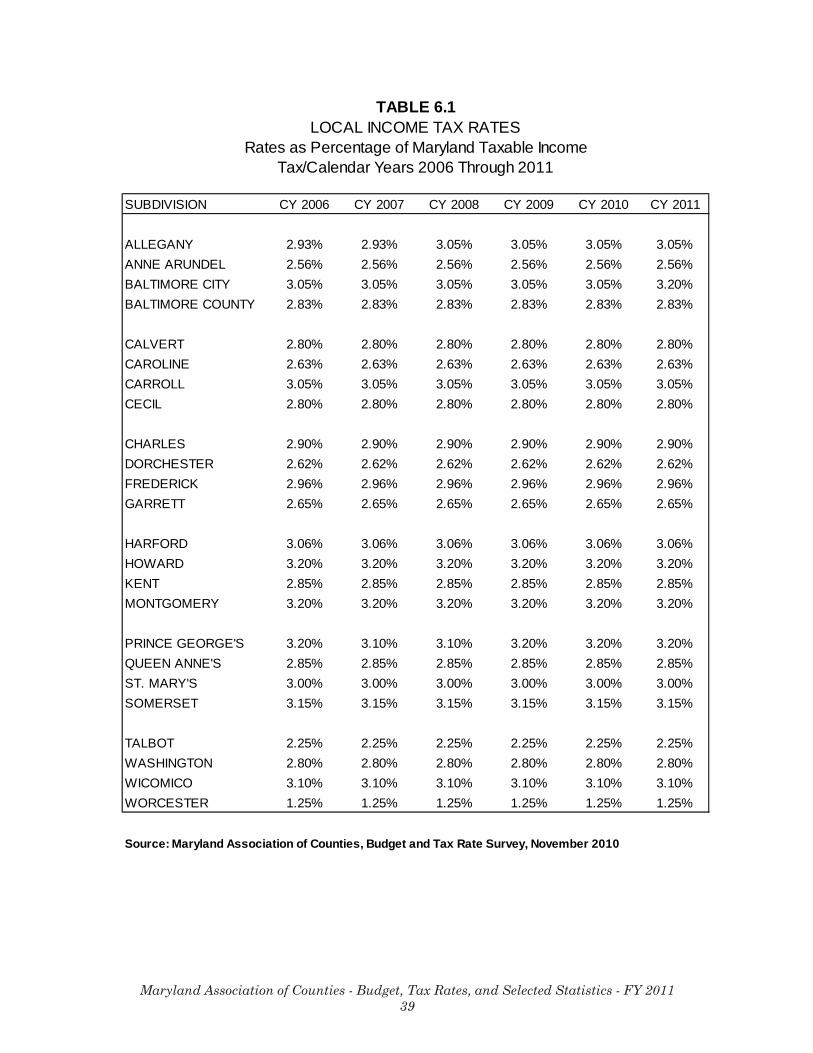
Maryland Association of Counties - Budget, Tax Rates, and Selected Statistics - FY 201139
TABLE 6.1LOCAL INCOME TAX RATES
Rates as Percentage of Maryland Taxable IncomeTax/Calendar Years 2006 Through 2011
SUBDIVISION CY 2006 CY 2007 CY 2008 CY 2009 CY 2010 CY 2011
ALLEGANY 2.93% 2.93% 3.05% 3.05% 3.05% 3.05%ANNE ARUNDEL 2.56% 2.56% 2.56% 2.56% 2.56% 2.56%BALTIMORE CITY 3.05% 3.05% 3.05% 3.05% 3.05% 3.20%BALTIMORE COUNTY 2.83% 2.83% 2.83% 2.83% 2.83% 2.83%
CALVERT 2.80% 2.80% 2.80% 2.80% 2.80% 2.80%CAROLINE 2.63% 2.63% 2.63% 2.63% 2.63% 2.63%CARROLL 3.05% 3.05% 3.05% 3.05% 3.05% 3.05%CECIL 2.80% 2.80% 2.80% 2.80% 2.80% 2.80%
CHARLES 2.90% 2.90% 2.90% 2.90% 2.90% 2.90%DORCHESTER 2.62% 2.62% 2.62% 2.62% 2.62% 2.62%FREDERICK 2.96% 2.96% 2.96% 2.96% 2.96% 2.96%GARRETT 2.65% 2.65% 2.65% 2.65% 2.65% 2.65%
HARFORD 3.06% 3.06% 3.06% 3.06% 3.06% 3.06%HOWARD 3.20% 3.20% 3.20% 3.20% 3.20% 3.20%KENT 2.85% 2.85% 2.85% 2.85% 2.85% 2.85%MONTGOMERY 3.20% 3.20% 3.20% 3.20% 3.20% 3.20%
PRINCE GEORGE'S 3.20% 3.10% 3.10% 3.20% 3.20% 3.20%QUEEN ANNE'S 2.85% 2.85% 2.85% 2.85% 2.85% 2.85%ST. MARY'S 3.00% 3.00% 3.00% 3.00% 3.00% 3.00%SOMERSET 3.15% 3.15% 3.15% 3.15% 3.15% 3.15%
TALBOT 2.25% 2.25% 2.25% 2.25% 2.25% 2.25%WASHINGTON 2.80% 2.80% 2.80% 2.80% 2.80% 2.80%WICOMICO 3.10% 3.10% 3.10% 3.10% 3.10% 3.10%WORCESTER 1.25% 1.25% 1.25% 1.25% 1.25% 1.25%
Source: Maryland Association of Counties, Budget and Tax Rate Survey, November 2010

Maryland Association of Counties - Budget, Tax Rates, and Selected Statistics - FY 201140
TAB
LE 6
.2ES
TIM
ATED
LO
CAL
INC
OM
E TA
X YI
ELD
S &
PR
OPE
RTY
TAX
EQ
UIV
ALEN
TFI
SCAL
YEA
RS
2007
TH
RO
UG
H 2
011
Prop
erty
Tax
Equ
iv.
LOC
AL IN
COM
E TA
X YI
ELDS
Chan
ge F
Y 10
to 1
1of
Tot
al In
com
e Ta
xSU
BDI
VISI
ON
FY 2
007
FY 2
008
FY 2
009
FY 2
010
FY 2
011
Amou
ntPe
rcen
tYi
eld
for F
Y 20
11
ALL
EG
AN
Y23
,977
,520
24,8
59,1
2425
,429
,319
23,8
24,2
6822
,640
,000
(1,1
84,2
68)
-4.9
7%$0
.51
AN
NE
AR
UN
DE
L36
1,95
6,04
337
1,36
9,46
037
2,44
1,15
535
3,41
7,00
036
3,00
0,00
09,
583,
000
2.71
%$0
.56
BA
LTIM
OR
E C
ITY
214,
780,
000
267,
624,
939
262,
901,
249
223,
433,
661
243,
169,
887
19,7
36,2
268.
83%
$0.7
2B
ALT
IMO
RE
CO
UN
TY57
7,39
2,43
963
1,77
2,15
462
1,28
4,31
847
9,17
0,31
955
9,99
3,62
180
,823
,302
16.8
7%$0
.77
C
ALV
ER
T59
,064
,889
62,1
53,0
0058
,370
,205
56,1
36,1
2859
,000
,000
2,86
3,87
25.
10%
$0.3
8C
AR
OLI
NE
11,2
60,7
9911
,646
,302
10,8
50,7
6110
,020
,333
10,3
00,0
0027
9,66
72.
79%
$0.3
9C
AR
RO
LL10
0,27
2,97
611
7,97
6,99
411
2,76
3,10
310
8,38
5,44
411
2,00
0,00
03,
614,
556
3.33
%$0
.59
CE
CIL
46,8
64,5
4650
,192
,279
48,8
51,1
8646
,816
,208
46,6
65,1
60(1
51,0
48)
-0.3
2%$0
.43
C
HA
RLE
S80
,001
,338
81,8
23,0
9682
,314
,487
86,5
13,3
1686
,153
,200
(360
,116
)-0
.42%
$0.4
8D
OR
CH
ES
TER
10,2
29,4
9911
,523
,663
12,5
61,7
898,
636,
162
8,60
0,00
0(3
6,16
2)-0
.42%
$0.2
3FR
ED
ER
ICK
154,
536,
579
161,
633,
784
158,
356,
951
146,
332,
338
139,
145,
505
(7,1
86,8
33)
-4.9
1%$0
.47
GA
RR
ETT
10,7
77,7
5111
,110
,742
10,4
23,1
099,
867,
543
9,00
0,00
0(8
67,5
43)
-8.7
9%$0
.19
H
AR
FOR
D16
3,12
1,92
316
4,33
7,26
016
1,36
4,85
515
4,18
1,03
914
9,59
0,39
6(4
,590
,643
)-2
.98%
$0.5
6H
OW
AR
D29
3,30
6,90
031
6,06
0,76
731
7,21
3,17
829
4,04
2,53
829
9,00
0,00
04,
957,
462
1.69
%$0
.69
KE
NT
10,4
00,0
0012
,100
,529
12,1
00,7
699,
306,
233
9,32
5,00
018
,767
0.20
%$0
.34
MO
NTG
OM
ER
Y1,
265,
377,
139
1,29
1,33
9,61
31,
291,
716,
935
1,04
2,10
6,67
91,
030,
159,
636
(11,
947,
043)
-1.1
5%$0
.60
P
RIN
CE
GE
OR
GE
'S 1
388,
008,
161
404,
188,
793
435,
409,
723
428,
141,
810
430,
576,
300
2,43
4,49
00.
57%
NA
QU
EE
N A
NN
E'S
34,9
80,6
6334
,767
,725
35,9
88,3
3429
,647
,125
32,9
80,0
243,
332,
899
11.2
4%$0
.38
ST.
MA
RY
'S58
,521
,923
62,8
29,6
6561
,471
,674
65,1
15,9
0160
,000
,000
(5,1
15,9
01)
-7.8
6%$0
.52
SO
ME
RS
ET
6,98
8,69
67,
082,
322
6,67
6,02
26,
222,
301
6,08
6,75
2(1
35,5
49)
-2.1
8%$0
.36
TA
LBO
T28
,794
,974
31,6
26,3
0731
,635
,555
19,2
60,5
0319
,000
,000
(260
,503
)-1
.35%
$0.2
9W
AS
HIN
GTO
N66
,488
,879
66,2
57,0
7463
,033
,878
57,0
25,0
4658
,000
,000
974,
954
1.71
%$0
.47
WIC
OM
ICO
44,8
16,9
7945
,077
,614
41,1
98,0
9637
,206
,314
34,5
00,0
00(2
,706
,314
)-7
.27%
$0.4
0W
OR
CE
STE
R15
,842
,045
13,6
84,6
0013
,062
,134
10,9
21,1
1810
,776
,000
(145
,118
)-1
.33%
$0.0
6
TOTA
L4,
027,
762,
661
4,25
3,03
7,80
64,
247,
418,
785
3,70
5,72
9,32
73,
799,
661,
481
93,9
32,1
542.
53%
1 P
rince
Geo
rge'
s nu
mbe
rs d
o no
t inc
lude
dis
parit
y gr
ant.
Sour
ce: M
aryl
and
Asso
ciat
ion
of C
ount
ies,
Bud
get a
nd T
ax R
ate
Surv
ey, N
ovem
ber 2
010
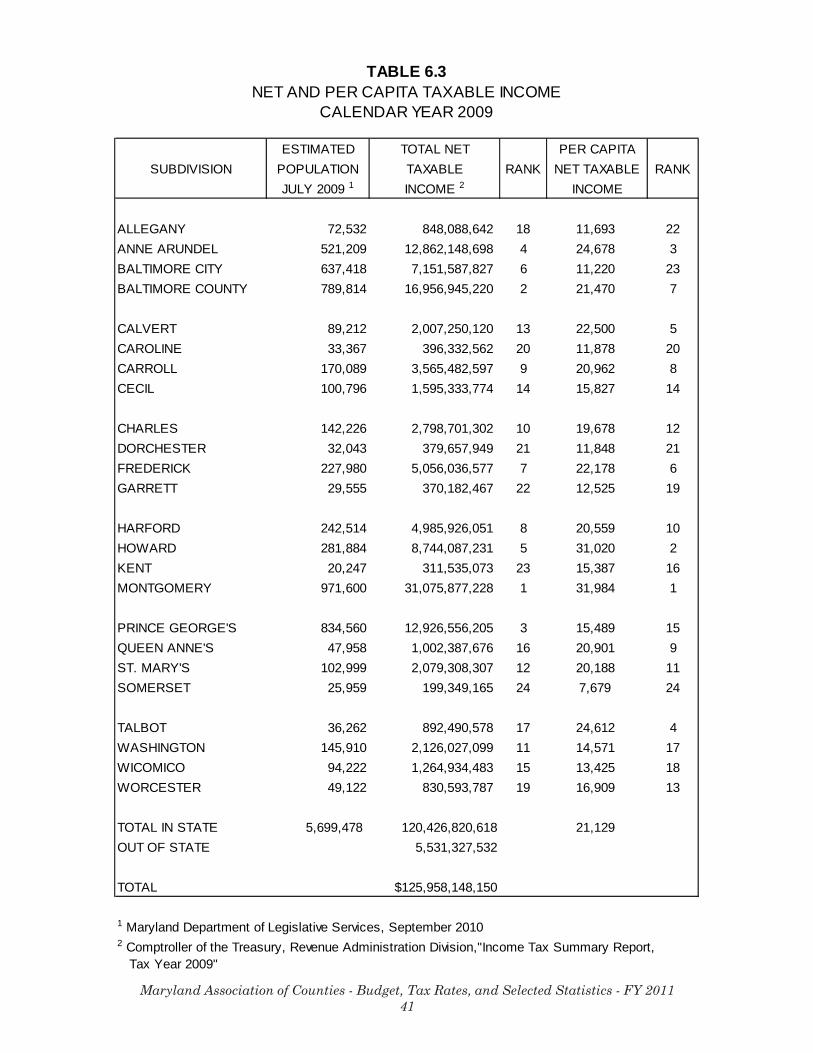
Maryland Association of Counties - Budget, Tax Rates, and Selected Statistics - FY 201141
TABLE 6.3NET AND PER CAPITA TAXABLE INCOME
CALENDAR YEAR 2009
ESTIMATED TOTAL NET PER CAPITASUBDIVISION POPULATION TAXABLE RANK NET TAXABLE RANK
JULY 2009 1 INCOME 2 INCOME
ALLEGANY 72,532 848,088,642 18 11,693 22ANNE ARUNDEL 521,209 12,862,148,698 4 24,678 3BALTIMORE CITY 637,418 7,151,587,827 6 11,220 23BALTIMORE COUNTY 789,814 16,956,945,220 2 21,470 7
CALVERT 89,212 2,007,250,120 13 22,500 5CAROLINE 33,367 396,332,562 20 11,878 20CARROLL 170,089 3,565,482,597 9 20,962 8CECIL 100,796 1,595,333,774 14 15,827 14
CHARLES 142,226 2,798,701,302 10 19,678 12DORCHESTER 32,043 379,657,949 21 11,848 21FREDERICK 227,980 5,056,036,577 7 22,178 6GARRETT 29,555 370,182,467 22 12,525 19
HARFORD 242,514 4,985,926,051 8 20,559 10HOWARD 281,884 8,744,087,231 5 31,020 2KENT 20,247 311,535,073 23 15,387 16MONTGOMERY 971,600 31,075,877,228 1 31,984 1
PRINCE GEORGE'S 834,560 12,926,556,205 3 15,489 15QUEEN ANNE'S 47,958 1,002,387,676 16 20,901 9ST. MARY'S 102,999 2,079,308,307 12 20,188 11SOMERSET 25,959 199,349,165 24 7,679 24
TALBOT 36,262 892,490,578 17 24,612 4WASHINGTON 145,910 2,126,027,099 11 14,571 17WICOMICO 94,222 1,264,934,483 15 13,425 18WORCESTER 49,122 830,593,787 19 16,909 13
TOTAL IN STATE 5,699,478 120,426,820,618 21,129OUT OF STATE 5,531,327,532
TOTAL $125,958,148,150
1 Maryland Department of Legislative Services, September 20102 Comptroller of the Treasury, Revenue Administration Division,"Income Tax Summary Report, Tax Year 2009"
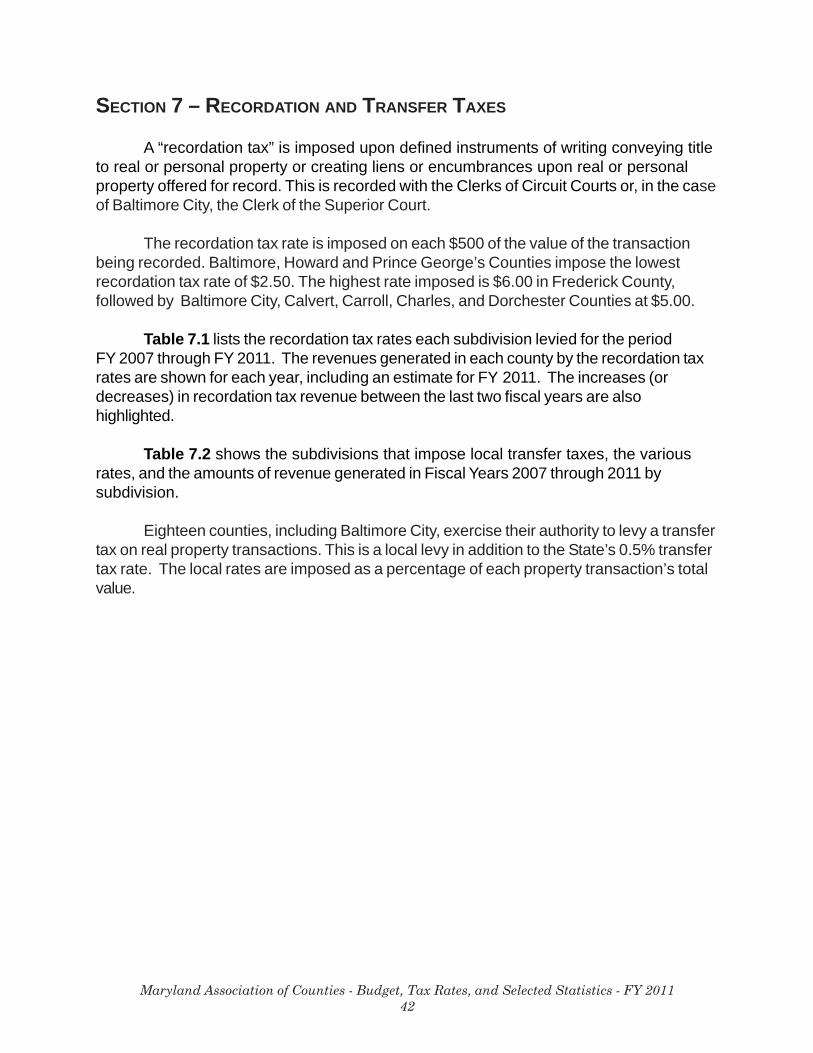
Maryland Association of Counties - Budget, Tax Rates, and Selected Statistics - FY 201142
SECTION 7 – RECORDATION AND TRANSFER TAXES
A “recordation tax” is imposed upon defined instruments of writing conveying titleto real or personal property or creating liens or encumbrances upon real or personalproperty offered for record. This is recorded with the Clerks of Circuit Courts or, in the caseof Baltimore City, the Clerk of the Superior Court.
The recordation tax rate is imposed on each $500 of the value of the transactionbeing recorded. Baltimore, Howard and Prince George’s Counties impose the lowestrecordation tax rate of $2.50. The highest rate imposed is $6.00 in Frederick County,followed by Baltimore City, Calvert, Carroll, Charles, and Dorchester Counties at $5.00.
Table 7.1 lists the recordation tax rates each subdivision levied for the periodFY 2007 through FY 2011. The revenues generated in each county by the recordation taxrates are shown for each year, including an estimate for FY 2011. The increases (ordecreases) in recordation tax revenue between the last two fiscal years are alsohighlighted.
Table 7.2 shows the subdivisions that impose local transfer taxes, the variousrates, and the amounts of revenue generated in Fiscal Years 2007 through 2011 bysubdivision.
Eighteen counties, including Baltimore City, exercise their authority to levy a transfertax on real property transactions. This is a local levy in addition to the State’s 0.5% transfertax rate. The local rates are imposed as a percentage of each property transaction’s totalvalue.
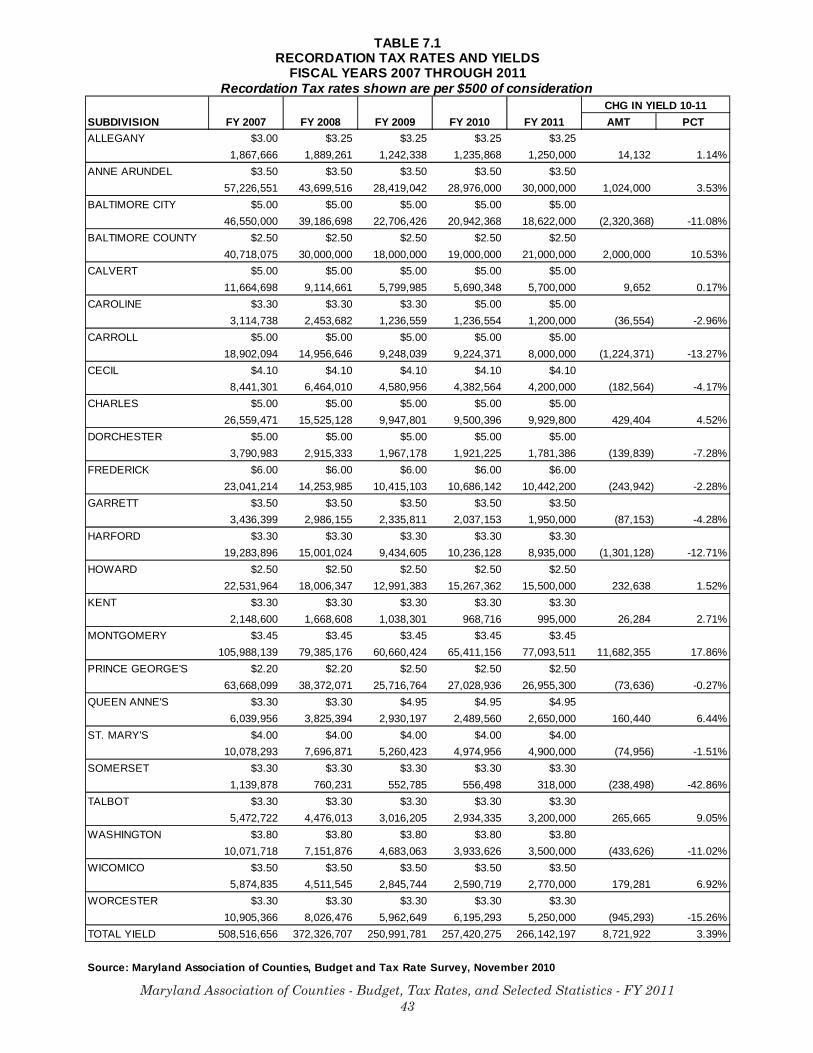
Maryland Association of Counties - Budget, Tax Rates, and Selected Statistics - FY 201143
TABLE 7.1RECORDATION TAX RATES AND YIELDS
FISCAL YEARS 2007 THROUGH 2011Recordation Tax rates shown are per $500 of consideration
CHG IN YIELD 10-11SUBDIVISION FY 2007 FY 2008 FY 2009 FY 2010 FY 2011 AMT PCTALLEGANY $3.00 $3.25 $3.25 $3.25 $3.25
1,867,666 1,889,261 1,242,338 1,235,868 1,250,000 14,132 1.14%ANNE ARUNDEL $3.50 $3.50 $3.50 $3.50 $3.50
57,226,551 43,699,516 28,419,042 28,976,000 30,000,000 1,024,000 3.53%BALTIMORE CITY $5.00 $5.00 $5.00 $5.00 $5.00
46,550,000 39,186,698 22,706,426 20,942,368 18,622,000 (2,320,368) -11.08%BALTIMORE COUNTY $2.50 $2.50 $2.50 $2.50 $2.50
40,718,075 30,000,000 18,000,000 19,000,000 21,000,000 2,000,000 10.53%CALVERT $5.00 $5.00 $5.00 $5.00 $5.00
11,664,698 9,114,661 5,799,985 5,690,348 5,700,000 9,652 0.17%CAROLINE $3.30 $3.30 $3.30 $5.00 $5.00
3,114,738 2,453,682 1,236,559 1,236,554 1,200,000 (36,554) -2.96%CARROLL $5.00 $5.00 $5.00 $5.00 $5.00
18,902,094 14,956,646 9,248,039 9,224,371 8,000,000 (1,224,371) -13.27%CECIL $4.10 $4.10 $4.10 $4.10 $4.10
8,441,301 6,464,010 4,580,956 4,382,564 4,200,000 (182,564) -4.17%CHARLES $5.00 $5.00 $5.00 $5.00 $5.00
26,559,471 15,525,128 9,947,801 9,500,396 9,929,800 429,404 4.52%DORCHESTER $5.00 $5.00 $5.00 $5.00 $5.00
3,790,983 2,915,333 1,967,178 1,921,225 1,781,386 (139,839) -7.28%FREDERICK $6.00 $6.00 $6.00 $6.00 $6.00
23,041,214 14,253,985 10,415,103 10,686,142 10,442,200 (243,942) -2.28%GARRETT $3.50 $3.50 $3.50 $3.50 $3.50
3,436,399 2,986,155 2,335,811 2,037,153 1,950,000 (87,153) -4.28%HARFORD $3.30 $3.30 $3.30 $3.30 $3.30
19,283,896 15,001,024 9,434,605 10,236,128 8,935,000 (1,301,128) -12.71%HOWARD $2.50 $2.50 $2.50 $2.50 $2.50
22,531,964 18,006,347 12,991,383 15,267,362 15,500,000 232,638 1.52%KENT $3.30 $3.30 $3.30 $3.30 $3.30
2,148,600 1,668,608 1,038,301 968,716 995,000 26,284 2.71%MONTGOMERY $3.45 $3.45 $3.45 $3.45 $3.45
105,988,139 79,385,176 60,660,424 65,411,156 77,093,511 11,682,355 17.86%PRINCE GEORGE'S $2.20 $2.20 $2.50 $2.50 $2.50
63,668,099 38,372,071 25,716,764 27,028,936 26,955,300 (73,636) -0.27%QUEEN ANNE'S $3.30 $3.30 $4.95 $4.95 $4.95
6,039,956 3,825,394 2,930,197 2,489,560 2,650,000 160,440 6.44%ST. MARY'S $4.00 $4.00 $4.00 $4.00 $4.00
10,078,293 7,696,871 5,260,423 4,974,956 4,900,000 (74,956) -1.51%SOMERSET $3.30 $3.30 $3.30 $3.30 $3.30
1,139,878 760,231 552,785 556,498 318,000 (238,498) -42.86%TALBOT $3.30 $3.30 $3.30 $3.30 $3.30
5,472,722 4,476,013 3,016,205 2,934,335 3,200,000 265,665 9.05%WASHINGTON $3.80 $3.80 $3.80 $3.80 $3.80
10,071,718 7,151,876 4,683,063 3,933,626 3,500,000 (433,626) -11.02%WICOMICO $3.50 $3.50 $3.50 $3.50 $3.50
5,874,835 4,511,545 2,845,744 2,590,719 2,770,000 179,281 6.92%WORCESTER $3.30 $3.30 $3.30 $3.30 $3.30
10,905,366 8,026,476 5,962,649 6,195,293 5,250,000 (945,293) -15.26%TOTAL YIELD 508,516,656 372,326,707 250,991,781 257,420,275 266,142,197 8,721,922 3.39%
Source: Maryland Association of Counties, Budget and Tax Rate Survey, November 2010
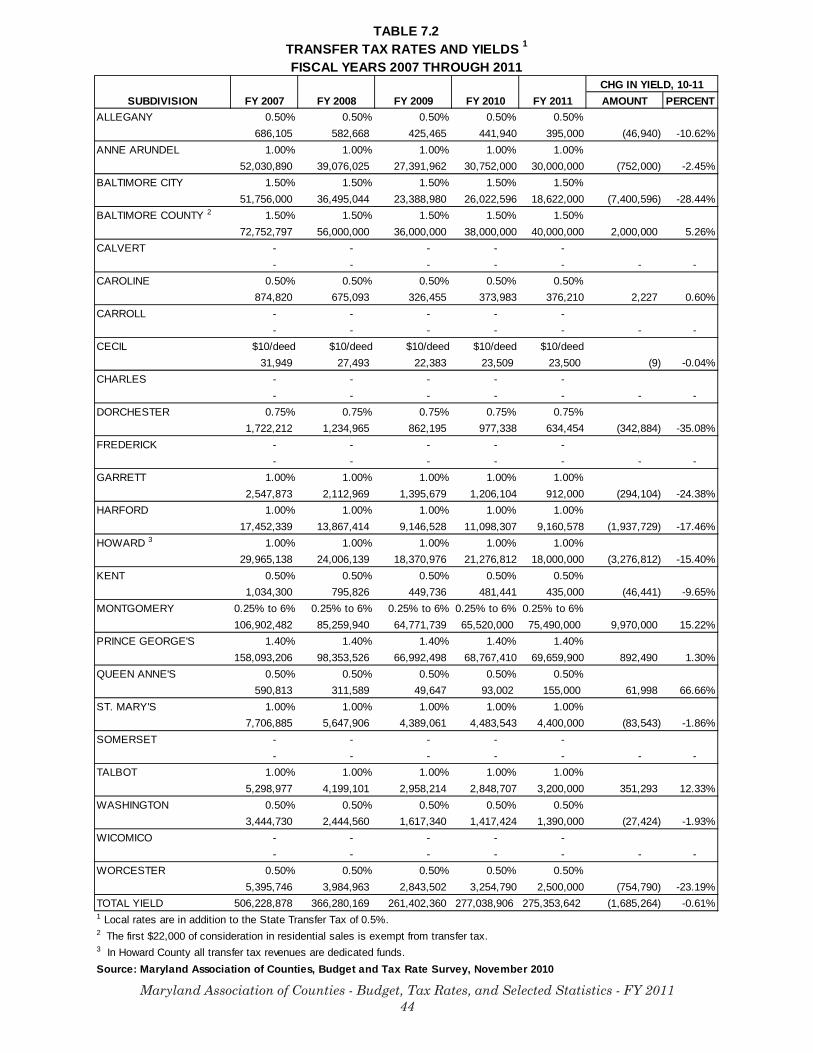
Maryland Association of Counties - Budget, Tax Rates, and Selected Statistics - FY 201144
TABLE 7.2TRANSFER TAX RATES AND YIELDS 1
FISCAL YEARS 2007 THROUGH 2011
SUBDIVISION FY 2007 FY 2008 FY 2009 FY 2010 FY 2011 AMOUNT PERCENTALLEGANY 0.50% 0.50% 0.50% 0.50% 0.50%
686,105 582,668 425,465 441,940 395,000 (46,940) -10.62%ANNE ARUNDEL 1.00% 1.00% 1.00% 1.00% 1.00%
52,030,890 39,076,025 27,391,962 30,752,000 30,000,000 (752,000) -2.45%BALTIMORE CITY 1.50% 1.50% 1.50% 1.50% 1.50%
51,756,000 36,495,044 23,388,980 26,022,596 18,622,000 (7,400,596) -28.44%BALTIMORE COUNTY 2 1.50% 1.50% 1.50% 1.50% 1.50%
72,752,797 56,000,000 36,000,000 38,000,000 40,000,000 2,000,000 5.26%CALVERT - - - - -
- - - - - - - CAROLINE 0.50% 0.50% 0.50% 0.50% 0.50%
874,820 675,093 326,455 373,983 376,210 2,227 0.60%CARROLL - - - - -
- - - - - - - CECIL $10/deed $10/deed $10/deed $10/deed $10/deed
31,949 27,493 22,383 23,509 23,500 (9) -0.04%CHARLES - - - - -
- - - - - - - DORCHESTER 0.75% 0.75% 0.75% 0.75% 0.75%
1,722,212 1,234,965 862,195 977,338 634,454 (342,884) -35.08%FREDERICK - - - - -
- - - - - - - GARRETT 1.00% 1.00% 1.00% 1.00% 1.00%
2,547,873 2,112,969 1,395,679 1,206,104 912,000 (294,104) -24.38%HARFORD 1.00% 1.00% 1.00% 1.00% 1.00%
17,452,339 13,867,414 9,146,528 11,098,307 9,160,578 (1,937,729) -17.46%HOWARD 3 1.00% 1.00% 1.00% 1.00% 1.00%
29,965,138 24,006,139 18,370,976 21,276,812 18,000,000 (3,276,812) -15.40%KENT 0.50% 0.50% 0.50% 0.50% 0.50%
1,034,300 795,826 449,736 481,441 435,000 (46,441) -9.65%MONTGOMERY 0.25% to 6% 0.25% to 6% 0.25% to 6% 0.25% to 6% 0.25% to 6%
106,902,482 85,259,940 64,771,739 65,520,000 75,490,000 9,970,000 15.22%PRINCE GEORGE'S 1.40% 1.40% 1.40% 1.40% 1.40%
158,093,206 98,353,526 66,992,498 68,767,410 69,659,900 892,490 1.30%QUEEN ANNE'S 0.50% 0.50% 0.50% 0.50% 0.50%
590,813 311,589 49,647 93,002 155,000 61,998 66.66%ST. MARY'S 1.00% 1.00% 1.00% 1.00% 1.00%
7,706,885 5,647,906 4,389,061 4,483,543 4,400,000 (83,543) -1.86%SOMERSET - - - - -
- - - - - - - TALBOT 1.00% 1.00% 1.00% 1.00% 1.00%
5,298,977 4,199,101 2,958,214 2,848,707 3,200,000 351,293 12.33%WASHINGTON 0.50% 0.50% 0.50% 0.50% 0.50%
3,444,730 2,444,560 1,617,340 1,417,424 1,390,000 (27,424) -1.93%WICOMICO - - - - -
- - - - - - - WORCESTER 0.50% 0.50% 0.50% 0.50% 0.50%
5,395,746 3,984,963 2,843,502 3,254,790 2,500,000 (754,790) -23.19%TOTAL YIELD 506,228,878 366,280,169 261,402,360 277,038,906 275,353,642 (1,685,264) -0.61%1 Local rates are in addition to the State Transfer Tax of 0.5%.2 The first $22,000 of consideration in residential sales is exempt from transfer tax.3 In Howard County all transfer tax revenues are dedicated funds.
CHG IN YIELD, 10-11
Source: Maryland Association of Counties, Budget and Tax Rate Survey, November 2010
Maryland Association of Counties - Budget, Tax Rates, and Selected Statistics - FY 201145
SECTION 8 - OTHER COUNTY TAXES
Counties have varying authority to levy a variety of different taxes in addition tothose already detailed. This Section contains a summary of other significant taxeslevied by counties in Maryland.
Admissions and Amusements Tax
Admissions and Amusement taxes are levied on numerous activities and items inevery subdivision with the exception of Caroline County. In accordance with legislationenacted during the 1972 Session of the General Assembly, the rates cannot exceed10%, and administration and collection of the tax is handled by a division of the StateComptroller’s Office. Administrative expenses are deducted from the proceeds.
Twenty counties employ a single rate, ranging from 2% in St. Mary’s County to 10%in Anne Arundel, Baltimore City, Baltimore County, Carroll, Charles and Prince George’sCounties. Harford County imposes the maximum 10% rate in certain instances.
In some instances, the admissions and amusements tax is levied on items thatare also subject to the Maryland sales and use tax, which is levied at 6% of sales price. Ifgross receipts subject to the admissions and amusement tax are also subject to the salesand use tax, a county or a municipal corporation may not set a rate so that, when combinedwith the sales and use tax, the total tax rate will exceed 11% of the gross receipts.
Table 8.1 lists each subdivision’s admissions and amusement tax rates andcompares the estimated revenues generated by the taxes for Fiscal Years 2006 through2011.
Cable Television Fees
Table 8.2 provides a listing of the various rates charged by counties to cablecompanies. The estimated yield from this source is included for FY 2010 and FY 2011 asis the number of cable companies in each county and whether a franchise agreementexists with the county. Some counties not indicating a resident cable company have areaswithin the county served by out-of-county companies.
Hotel/Motel Taxes
Table 8.3 details county taxes on hotel and motel accommodations. Hotel/moteltaxes (levied in 22 counties, including Baltimore City) are in addition to the State’s 6%Sales and Use Tax. Many counties have arrangements with municipalities to remit to themunicipal government all or part of hotel/motel tax revenues generated on facilities withinthe municipality.
Maryland Association of Counties - Budget, Tax Rates, and Selected Statistics - FY 201146
Trailer Park Taxes
Table 8.4 details county taxation of trailer parks, and the yields from these taxes forFiscal Years 2006 through 2011. The county authority for taxation of trailer parks is inSection 9-401 of Article 24 of the Annotated Code of Maryland, which was recodified in1989 from the former Article 81.
In accordance with the provisions of Section 12C of Article 81, enacted in 1963,local governments are authorized to tax the rental, leasing, or use of any space,facilities, accommodations in, or service rendered by, mobile home courts or parks. Theland on which the improvements are located is taxed in the same manner as all realproperty.
Under a 1978 amendment to Section 12C of Article 81, the county may not taxspaces used by “recreational vehicles or temporary camping shelters” so long as theyare rented to the same individual for less than 30 days. In 1989, Section 9-401 of Article24 was amended to enable county governments to impose the local tax on “recreationalvehicles and camping shelters,” regardless of the period of occupancy. If a countyexercises its authority under that provision, then the overall trailer park rate may notexceed 3% of the amounts subject to the tax.
The tax rates shown in Table 8.4 will continue to be charged on the rental of“permanent” mobile home spaces or on spaces rented to the same person for morethan 30 days. Nineteen subdivisions are presently imposing the tax on trailer parks. The taxrate is either a flat charge per space over a certain time period (anywhere from $5/monthto $20/month) or a percentage of the rent charged (ranging from 7% to 20%).
Other Sales and Service Taxes
Many counties and Baltimore City presently impose a tax on additional sales andservices. Among these subdivisions, the items most commonly taxed locally includetelephone, energy utilities or fuels, parking lots, and boat slips. In most instances, the localrates imposed are a percentage of the item’s selling price or rental price.
Table 8.5 shows the items taxed in the subdivisions, the rates currently imposed,and the FY 2010 and estimated FY 2011 revenue yields.
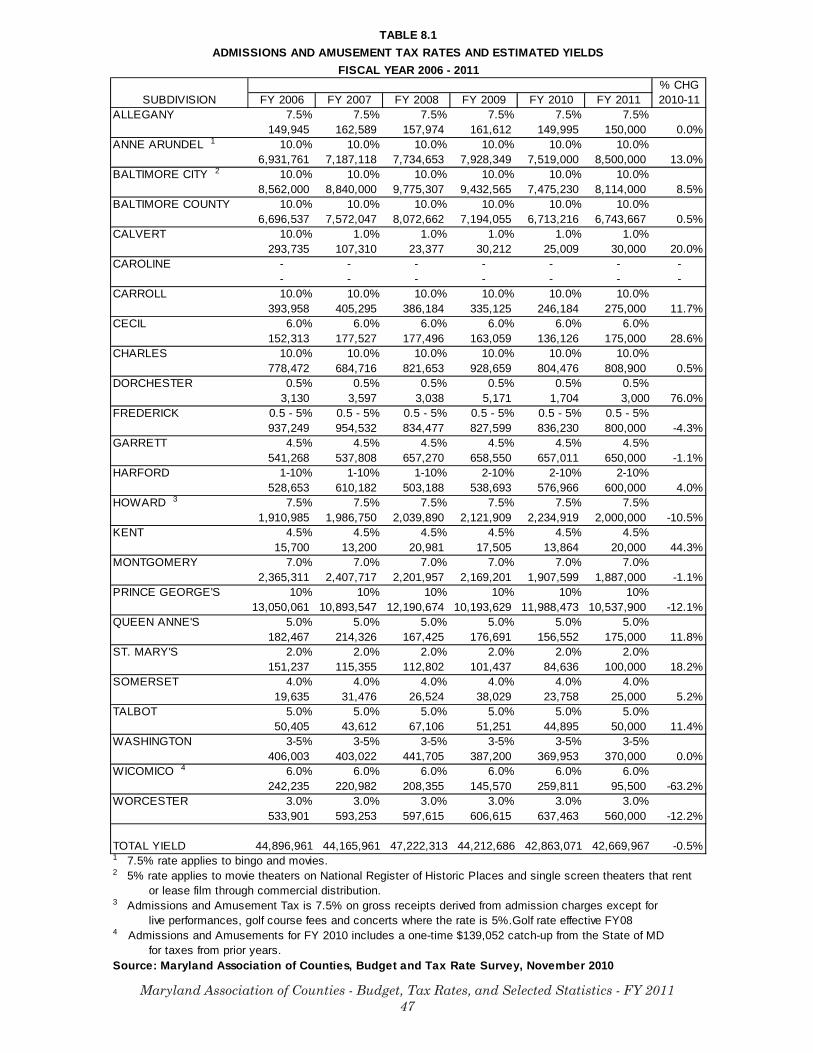
Maryland Association of Counties - Budget, Tax Rates, and Selected Statistics - FY 201147
TABLE 8.1ADMISSIONS AND AMUSEMENT TAX RATES AND ESTIMATED YIELDS
FISCAL YEAR 2006 - 2011% CHG
SUBDIVISION FY 2006 FY 2007 FY 2008 FY 2009 FY 2010 FY 2011 2010-11ALLEGANY 7.5% 7.5% 7.5% 7.5% 7.5% 7.5%
149,945 162,589 157,974 161,612 149,995 150,000 0.0%ANNE ARUNDEL 1 10.0% 10.0% 10.0% 10.0% 10.0% 10.0%
6,931,761 7,187,118 7,734,653 7,928,349 7,519,000 8,500,000 13.0%BALTIMORE CITY 2 10.0% 10.0% 10.0% 10.0% 10.0% 10.0%
8,562,000 8,840,000 9,775,307 9,432,565 7,475,230 8,114,000 8.5%BALTIMORE COUNTY 10.0% 10.0% 10.0% 10.0% 10.0% 10.0%
6,696,537 7,572,047 8,072,662 7,194,055 6,713,216 6,743,667 0.5%CALVERT 10.0% 1.0% 1.0% 1.0% 1.0% 1.0%
293,735 107,310 23,377 30,212 25,009 30,000 20.0%CAROLINE - - - - - - -
- - - - - - -CARROLL 10.0% 10.0% 10.0% 10.0% 10.0% 10.0%
393,958 405,295 386,184 335,125 246,184 275,000 11.7%CECIL 6.0% 6.0% 6.0% 6.0% 6.0% 6.0%
152,313 177,527 177,496 163,059 136,126 175,000 28.6%CHARLES 10.0% 10.0% 10.0% 10.0% 10.0% 10.0%
778,472 684,716 821,653 928,659 804,476 808,900 0.5%DORCHESTER 0.5% 0.5% 0.5% 0.5% 0.5% 0.5%
3,130 3,597 3,038 5,171 1,704 3,000 76.0%FREDERICK 0.5 - 5% 0.5 - 5% 0.5 - 5% 0.5 - 5% 0.5 - 5% 0.5 - 5%
937,249 954,532 834,477 827,599 836,230 800,000 -4.3%GARRETT 4.5% 4.5% 4.5% 4.5% 4.5% 4.5%
541,268 537,808 657,270 658,550 657,011 650,000 -1.1%HARFORD 1-10% 1-10% 1-10% 2-10% 2-10% 2-10%
528,653 610,182 503,188 538,693 576,966 600,000 4.0%HOWARD 3 7.5% 7.5% 7.5% 7.5% 7.5% 7.5%
1,910,985 1,986,750 2,039,890 2,121,909 2,234,919 2,000,000 -10.5%KENT 4.5% 4.5% 4.5% 4.5% 4.5% 4.5%
15,700 13,200 20,981 17,505 13,864 20,000 44.3%MONTGOMERY 7.0% 7.0% 7.0% 7.0% 7.0% 7.0%
2,365,311 2,407,717 2,201,957 2,169,201 1,907,599 1,887,000 -1.1%PRINCE GEORGE'S 10% 10% 10% 10% 10% 10%
13,050,061 10,893,547 12,190,674 10,193,629 11,988,473 10,537,900 -12.1%QUEEN ANNE'S 5.0% 5.0% 5.0% 5.0% 5.0% 5.0%
182,467 214,326 167,425 176,691 156,552 175,000 11.8%ST. MARY'S 2.0% 2.0% 2.0% 2.0% 2.0% 2.0%
151,237 115,355 112,802 101,437 84,636 100,000 18.2%SOMERSET 4.0% 4.0% 4.0% 4.0% 4.0% 4.0%
19,635 31,476 26,524 38,029 23,758 25,000 5.2%TALBOT 5.0% 5.0% 5.0% 5.0% 5.0% 5.0%
50,405 43,612 67,106 51,251 44,895 50,000 11.4%WASHINGTON 3-5% 3-5% 3-5% 3-5% 3-5% 3-5%
406,003 403,022 441,705 387,200 369,953 370,000 0.0%WICOMICO 4 6.0% 6.0% 6.0% 6.0% 6.0% 6.0%
242,235 220,982 208,355 145,570 259,811 95,500 -63.2%WORCESTER 3.0% 3.0% 3.0% 3.0% 3.0% 3.0%
533,901 593,253 597,615 606,615 637,463 560,000 -12.2%
TOTAL YIELD 44,896,961 44,165,961 47,222,313 44,212,686 42,863,071 42,669,967 -0.5%1 7.5% rate applies to bingo and movies.2 5% rate applies to movie theaters on National Register of Historic Places and single screen theaters that rent or lease film through commercial distribution.3 Admissions and Amusement Tax is 7.5% on gross receipts derived from admission charges except for live performances, golf course fees and concerts where the rate is 5%.Golf rate effective FY084 Admissions and Amusements for FY 2010 includes a one-time $139,052 catch-up from the State of MD for taxes from prior years.Source: Maryland Association of Counties, Budget and Tax Rate Survey, November 2010
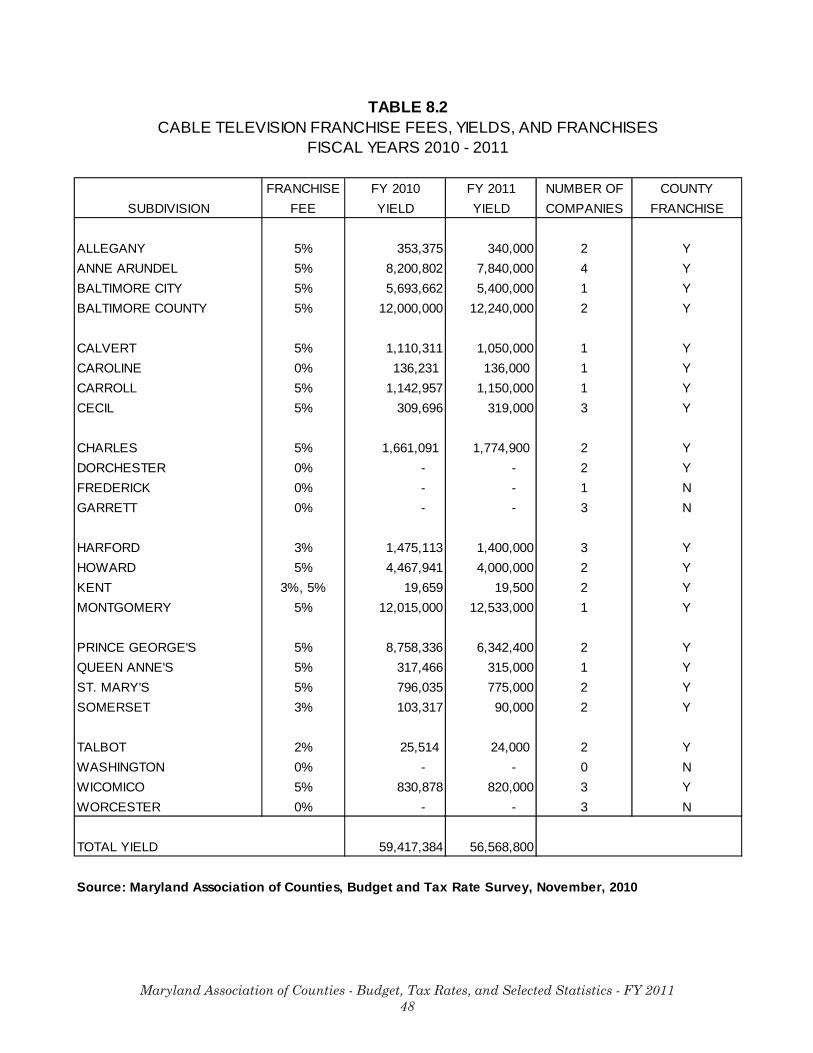
Maryland Association of Counties - Budget, Tax Rates, and Selected Statistics - FY 201148
TABLE 8.2CABLE TELEVISION FRANCHISE FEES, YIELDS, AND FRANCHISES
FISCAL YEARS 2010 - 2011
FRANCHISE FY 2010 FY 2011 NUMBER OF COUNTYSUBDIVISION FEE YIELD YIELD COMPANIES FRANCHISE
ALLEGANY 5% 353,375 340,000 2 YANNE ARUNDEL 5% 8,200,802 7,840,000 4 YBALTIMORE CITY 5% 5,693,662 5,400,000 1 YBALTIMORE COUNTY 5% 12,000,000 12,240,000 2 Y
CALVERT 5% 1,110,311 1,050,000 1 YCAROLINE 0% 136,231 136,000 1 YCARROLL 5% 1,142,957 1,150,000 1 YCECIL 5% 309,696 319,000 3 Y
CHARLES 5% 1,661,091 1,774,900 2 YDORCHESTER 0% - - 2 YFREDERICK 0% - - 1 NGARRETT 0% - - 3 N
HARFORD 3% 1,475,113 1,400,000 3 YHOWARD 5% 4,467,941 4,000,000 2 YKENT 3%, 5% 19,659 19,500 2 YMONTGOMERY 5% 12,015,000 12,533,000 1 Y
PRINCE GEORGE'S 5% 8,758,336 6,342,400 2 YQUEEN ANNE'S 5% 317,466 315,000 1 YST. MARY'S 5% 796,035 775,000 2 YSOMERSET 3% 103,317 90,000 2 Y
TALBOT 2% 25,514 24,000 2 YWASHINGTON 0% - - 0 NWICOMICO 5% 830,878 820,000 3 YWORCESTER 0% - - 3 N
TOTAL YIELD 59,417,384 56,568,800
Source: Maryland Association of Counties, Budget and Tax Rate Survey, November, 2010

Maryland Association of Counties - Budget, Tax Rates, and Selected Statistics - FY 201149
TABLE 8.3HOTEL/MOTEL ROOM TAXES
FISCAL YEARS 2010-2011
SUBDIVISION RATE
ALLEGANY 8% 588,204 620,000ANNE ARUNDEL 7% 12,812,000 13,500,000BALTIMORE CITY 9.5% 19,919,000 24,842,000BALTIMORE COUNTY 8% 6,752,965 6,891,254
CALVERT 5% 693,265 730,000CAROLINE 0% 0 0CARROLL 5% 287,850 260,000CECIL 5% 42,126 40,000
CHARLES 5% 958,717 977,000DORCHESTER 5% 236,075 250,000FREDERICK 3% 1,068,105 1,052,000GARRETT 5% 1,442,463 1,300,000
HARFORD - 0 0HOWARD 5% 2,822,361 3,400,000KENT 5% 105,578 105,750MONTGOMERY 7% 17,064,493 17,956,498
PRINCE GEORGE'S 5% 4,882,625 5,106,700QUEEN ANNE'S 5% 397,141 420,000ST. MARY'S 5% 730,992 650,000SOMERSET 5% 53,820 50,000
TALBOT 4% 938,476 975,000WASHINGTON 6% 1,551,939 1,690,000WICOMICO 1 6% 719,392 750,000WORCESTER 4.5% 11,808,110 11,250,000
County Total $85,875,697 $92,816,202
Source: Maryland Association of Counties, Budget and Tax Rate Survey, November 2010
FY 10 Revenue FY 11 Revenue
1 Wicomico County - moved to an enterprise fund begin FY2005 - not in General Fund
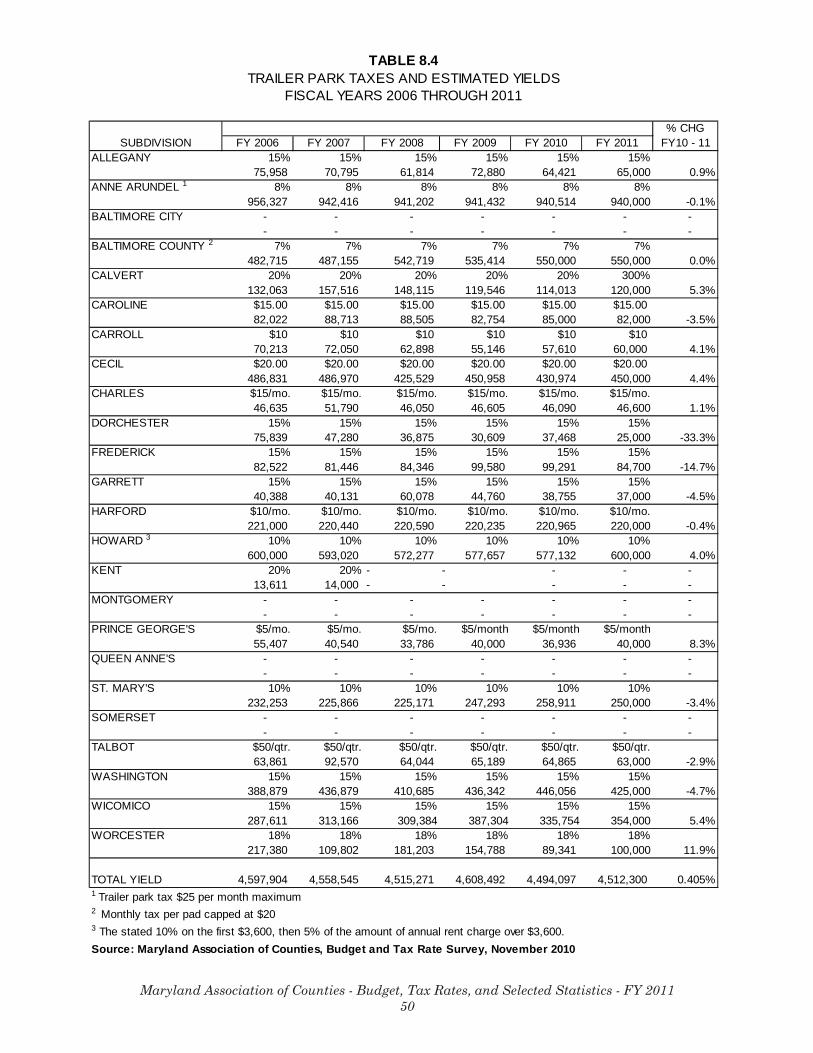
Maryland Association of Counties - Budget, Tax Rates, and Selected Statistics - FY 201150
TABLE 8.4TRAILER PARK TAXES AND ESTIMATED YIELDS
FISCAL YEARS 2006 THROUGH 2011
% CHGSUBDIVISION FY 2006 FY 2007 FY 2008 FY 2009 FY 2010 FY 2011 FY10 - 11
ALLEGANY 15% 15% 15% 15% 15% 15%75,958 70,795 61,814 72,880 64,421 65,000 0.9%
ANNE ARUNDEL 1 8% 8% 8% 8% 8% 8%956,327 942,416 941,202 941,432 940,514 940,000 -0.1%
BALTIMORE CITY - - - - - - - - - - - - - -
BALTIMORE COUNTY 2 7% 7% 7% 7% 7% 7%482,715 487,155 542,719 535,414 550,000 550,000 0.0%
CALVERT 20% 20% 20% 20% 20% 300%132,063 157,516 148,115 119,546 114,013 120,000 5.3%
CAROLINE $15.00 $15.00 $15.00 $15.00 $15.00 $15.0082,022 88,713 88,505 82,754 85,000 82,000 -3.5%
CARROLL $10 $10 $10 $10 $10 $1070,213 72,050 62,898 55,146 57,610 60,000 4.1%
CECIL $20.00 $20.00 $20.00 $20.00 $20.00 $20.00486,831 486,970 425,529 450,958 430,974 450,000 4.4%
CHARLES $15/mo. $15/mo. $15/mo. $15/mo. $15/mo. $15/mo.46,635 51,790 46,050 46,605 46,090 46,600 1.1%
DORCHESTER 15% 15% 15% 15% 15% 15%75,839 47,280 36,875 30,609 37,468 25,000 -33.3%
FREDERICK 15% 15% 15% 15% 15% 15%82,522 81,446 84,346 99,580 99,291 84,700 -14.7%
GARRETT 15% 15% 15% 15% 15% 15%40,388 40,131 60,078 44,760 38,755 37,000 -4.5%
HARFORD $10/mo. $10/mo. $10/mo. $10/mo. $10/mo. $10/mo.221,000 220,440 220,590 220,235 220,965 220,000 -0.4%
HOWARD 3 10% 10% 10% 10% 10% 10%600,000 593,020 572,277 577,657 577,132 600,000 4.0%
KENT 20% 20% - - - - - 13,611 14,000 - - - - -
MONTGOMERY - - - - - - - - - - - - - -
PRINCE GEORGE'S $5/mo. $5/mo. $5/mo. $5/month $5/month $5/month55,407 40,540 33,786 40,000 36,936 40,000 8.3%
QUEEN ANNE'S - - - - - - - - - - - - - -
ST. MARY'S 10% 10% 10% 10% 10% 10%232,253 225,866 225,171 247,293 258,911 250,000 -3.4%
SOMERSET - - - - - - - - - - - - - -
TALBOT $50/qtr. $50/qtr. $50/qtr. $50/qtr. $50/qtr. $50/qtr.63,861 92,570 64,044 65,189 64,865 63,000 -2.9%
WASHINGTON 15% 15% 15% 15% 15% 15%388,879 436,879 410,685 436,342 446,056 425,000 -4.7%
WICOMICO 15% 15% 15% 15% 15% 15%287,611 313,166 309,384 387,304 335,754 354,000 5.4%
WORCESTER 18% 18% 18% 18% 18% 18%217,380 109,802 181,203 154,788 89,341 100,000 11.9%
TOTAL YIELD 4,597,904 4,558,545 4,515,271 4,608,492 4,494,097 4,512,300 0.405%1 Trailer park tax $25 per month maximum2 Monthly tax per pad capped at $203 The stated 10% on the first $3,600, then 5% of the amount of annual rent charge over $3,600.Source: Maryland Association of Counties, Budget and Tax Rate Survey, November 2010
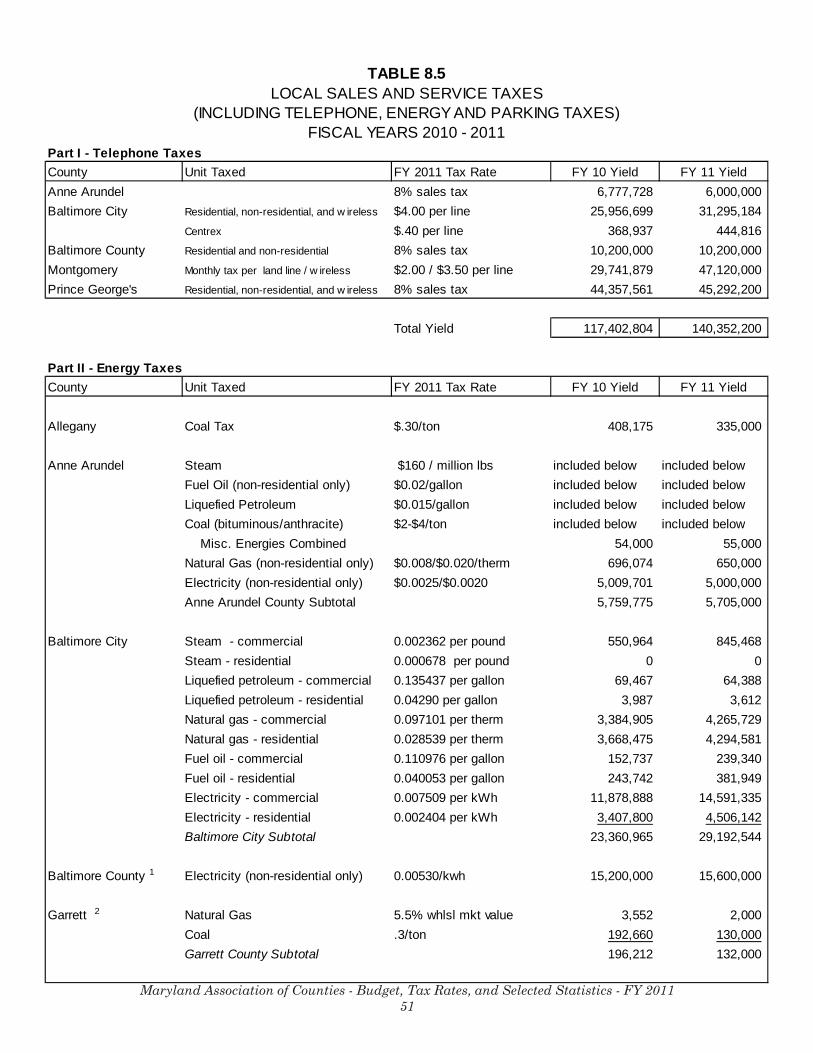
Maryland Association of Counties - Budget, Tax Rates, and Selected Statistics - FY 201151
TABLE 8.5LOCAL SALES AND SERVICE TAXES
(INCLUDING TELEPHONE, ENERGY AND PARKING TAXES)FISCAL YEARS 2010 - 2011
Part I - Telephone TaxesCounty Unit Taxed FY 2011 Tax Rate FY 10 Yield FY 11 YieldAnne Arundel 8% sales tax 6,777,728 6,000,000Baltimore City Residential, non-residential, and w ireless $4.00 per line 25,956,699 31,295,184
Centrex $.40 per line 368,937 444,816Baltimore County Residential and non-residential 8% sales tax 10,200,000 10,200,000Montgomery Monthly tax per land line / w ireless $2.00 / $3.50 per line 29,741,879 47,120,000Prince George's Residential, non-residential, and w ireless 8% sales tax 44,357,561 45,292,200
Total Yield 117,402,804 140,352,200
Part II - Energy TaxesCounty Unit Taxed FY 2011 Tax Rate FY 10 Yield FY 11 Yield
Allegany Coal Tax $.30/ton 408,175 335,000
Anne Arundel Steam $160 / million lbs included below included belowFuel Oil (non-residential only) $0.02/gallon included below included belowLiquefied Petroleum $0.015/gallon included below included belowCoal (bituminous/anthracite) $2-$4/ton included below included below Misc. Energies Combined 54,000 55,000Natural Gas (non-residential only) $0.008/$0.020/therm 696,074 650,000Electricity (non-residential only) $0.0025/$0.0020 5,009,701 5,000,000Anne Arundel County Subtotal 5,759,775 5,705,000
Baltimore City Steam - commercial 0.002362 per pound 550,964 845,468Steam - residential 0.000678 per pound 0 0Liquefied petroleum - commercial 0.135437 per gallon 69,467 64,388Liquefied petroleum - residential 0.04290 per gallon 3,987 3,612Natural gas - commercial 0.097101 per therm 3,384,905 4,265,729Natural gas - residential 0.028539 per therm 3,668,475 4,294,581Fuel oil - commercial 0.110976 per gallon 152,737 239,340Fuel oil - residential 0.040053 per gallon 243,742 381,949Electricity - commercial 0.007509 per kWh 11,878,888 14,591,335Electricity - residential 0.002404 per kWh 3,407,800 4,506,142Baltimore City Subtotal 23,360,965 29,192,544
Baltimore County 1 Electricity (non-residential only) 0.00530/kwh 15,200,000 15,600,000
Garrett 2 Natural Gas 5.5% whlsl mkt value 3,552 2,000Coal .3/ton 192,660 130,000Garrett County Subtotal 196,212 132,000
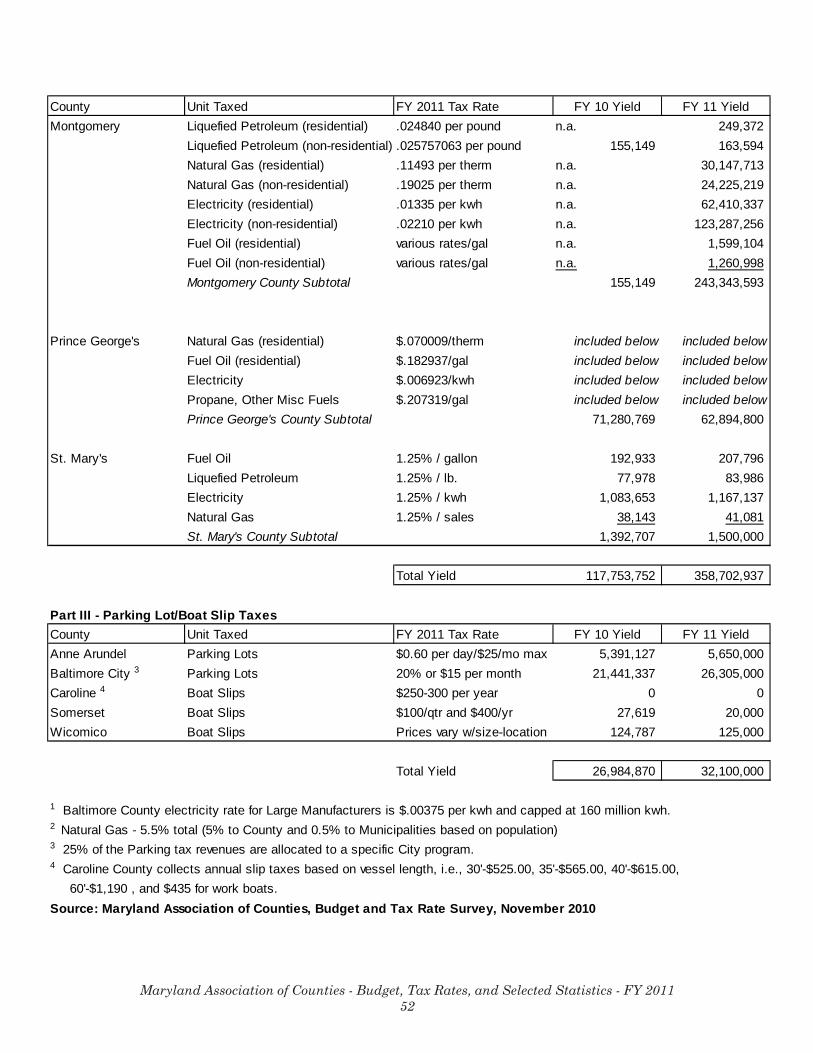
Maryland Association of Counties - Budget, Tax Rates, and Selected Statistics - FY 201152
County Unit Taxed FY 2011 Tax Rate FY 10 Yield FY 11 YieldMontgomery Liquefied Petroleum (residential) .024840 per pound n.a. 249,372
Liquefied Petroleum (non-residential) .025757063 per pound 155,149 163,594Natural Gas (residential) .11493 per therm n.a. 30,147,713Natural Gas (non-residential) .19025 per therm n.a. 24,225,219Electricity (residential) .01335 per kwh n.a. 62,410,337Electricity (non-residential) .02210 per kwh n.a. 123,287,256Fuel Oil (residential) various rates/gal n.a. 1,599,104Fuel Oil (non-residential) various rates/gal n.a. 1,260,998Montgomery County Subtotal 155,149 243,343,593
Prince George's Natural Gas (residential) $.070009/therm included below included belowFuel Oil (residential) $.182937/gal included below included belowElectricity $.006923/kwh included below included belowPropane, Other Misc Fuels $.207319/gal included below included belowPrince George's County Subtotal 71,280,769 62,894,800
St. Mary's Fuel Oil 1.25% / gallon 192,933 207,796Liquefied Petroleum 1.25% / lb. 77,978 83,986Electricity 1.25% / kwh 1,083,653 1,167,137Natural Gas 1.25% / sales 38,143 41,081St. Mary's County Subtotal 1,392,707 1,500,000
Total Yield 117,753,752 358,702,937
Part III - Parking Lot/Boat Slip TaxesCounty Unit Taxed FY 2011 Tax Rate FY 10 Yield FY 11 YieldAnne Arundel Parking Lots $0.60 per day/$25/mo max 5,391,127 5,650,000Baltimore City 3 Parking Lots 20% or $15 per month 21,441,337 26,305,000Caroline 4 Boat Slips $250-300 per year 0 0Somerset Boat Slips $100/qtr and $400/yr 27,619 20,000Wicomico Boat Slips Prices vary w/size-location 124,787 125,000
Total Yield 26,984,870 32,100,000
1 Baltimore County electricity rate for Large Manufacturers is $.00375 per kwh and capped at 160 million kwh.2 Natural Gas - 5.5% total (5% to County and 0.5% to Municipalities based on population)3 25% of the Parking tax revenues are allocated to a specific City program.4 Caroline County collects annual slip taxes based on vessel length, i.e., 30'-$525.00, 35'-$565.00, 40'-$615.00, 60'-$1,190 , and $435 for work boats.Source: Maryland Association of Counties, Budget and Tax Rate Survey, November 2010

Maryland Association of Counties - Budget, Tax Rates, and Selected Statistics - FY 201153
SECTION 9 – SERVICE FEES AND CHARGES
In addition to general “taxing” authority, many counties also assess various feesor charges for certain activities or services. These additional sources of county revenueare detailed on the following tables.
Impact Fees / Excise Taxes on New Development
Impact fees and excise taxes are levied by local governments to offset or coversome portion of the cost of new off-site infrastructure needs that result from growth.Current impact fee applications can include water, sewer, roads, parks, schools andsolid waste.
Table 9.1 identifies the subdivisions that are granted the authority to levy impactfees and development excise taxes. Rates and rate schedules vary from county tocounty, as does the application of revenues generated. The table shows the level of thefee or tax applied to a single dwelling unit, for purposes of comparison. Table 9.1 alsoshows the estimated revenue generated in the 11 counties currently levying these fees ortaxes. Fiscal Year 2010 and 2011 estimates are included.
Emergency “911” Fees
Table 9.2 details each county’s “911” fee, revenues generated, and system type.
Legislation enacted during the 1979 Session of the General Assemblyestablished “911” as the primary telephone number for persons seeking the emergencyassistance of police, fire or ambulance anywhere in Maryland. The original legislationcreated a ten cent ($0.10) monthly fee to be collected from all telephone subscribers fora three year period from July 1, 1980 through June 30, 1983. This fee was divided anddisbursed to counties according to population.
While this provided a source of funding for counties to initiate and implement a“911” emergency system or enhance existing systems, the distribution to counties wasdiscontinued. The General Assembly addressed this issue in 1983 by amending the lawto allow each county to impose an additional fee, not to exceed $0.30 per month, tocover necessary “911” operational and upgrade costs to the county.
All 23 counties and Baltimore City have “911” emergency systems in operation asrequired. Table 9.2 lists the local monthly “911” fee schedules by subdivision, as well asthe type of system provided. The estimated revenue generated in each county by thefees in Fiscal Years 2008 and 2009 are also reported.
During the 1990 Session of the General Assembly legislation (Senate Bill 822,Chapter 510) was passed enabling subdivisions to raise the cap on local emergency
Maryland Association of Counties - Budget, Tax Rates, and Selected Statistics - FY 201154
“911” monthly charges from $0.30 to $0.50. Under the same 1990 legislation, the State’s$0.10 monthly fee ceased being remitted to the counties after January 1, 1991. After thatdate, the revenues from the State’s fee have only been used to reimburse subdivisions forenhancements to their “911” systems.
In 1995 the General Assembly added “wireless telephone service” to the ratebase, recognizing the rapid growth of this segment of the telephone economy whichalso uses “911” services.
In 2003, Maryland enacted HB 780 (Chapter 451), a MACo initiative bill, tosupplement the 9-1-1 Trust Fund to augment services for wireless callers. Thatlegislation increased the state monthly fee from 10 to 25 cents, and enabled counties toadjust their local charge to a new maximum of 75 cents.
Solid Waste, Recycling, and Tipping Fees
Table 9.3 lists selected solid waste, recycling and tipping fees by jurisdiction.Also shown are anticipated yields from these sources for FY 2010 and FY 2011.
Each county and Baltimore City provides waste collection, recycling, and disposalservices through a variety of means. Some counties provide public collection, otherscontract for private services to be available to citizens. The variety of services availableand complexity of fee structures permits only a sampling of indicator fees for purposesof comparison.
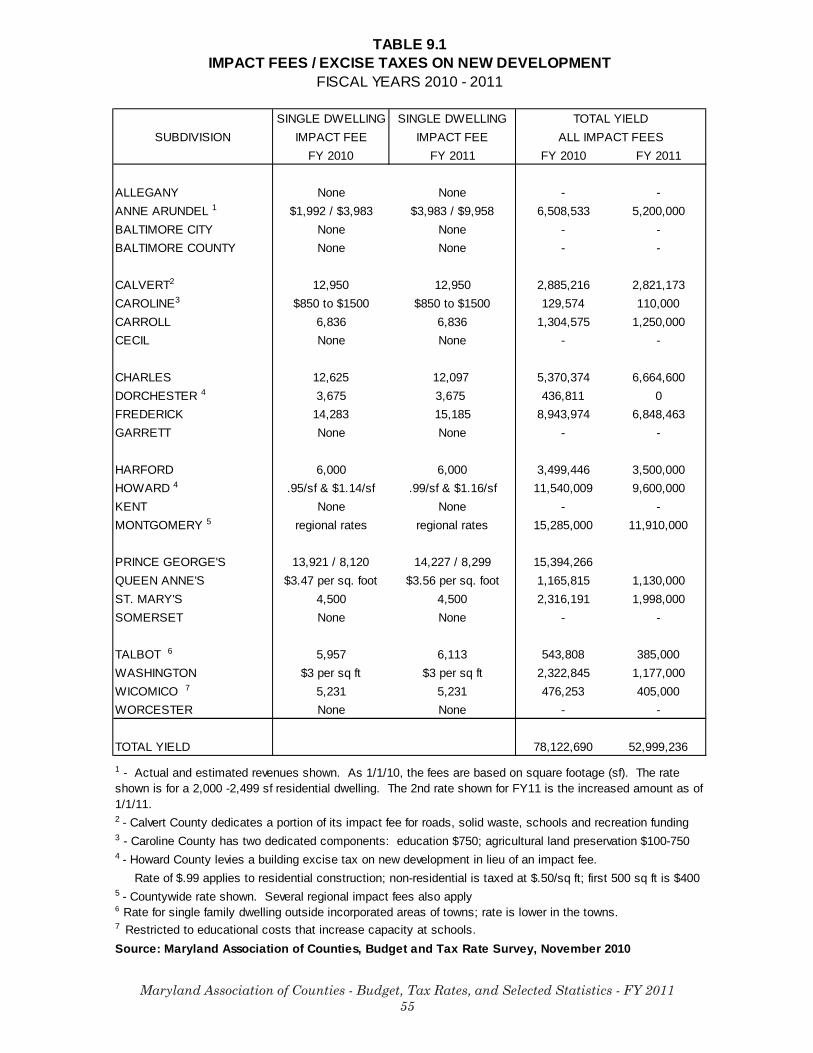
Maryland Association of Counties - Budget, Tax Rates, and Selected Statistics - FY 201155
TABLE 9.1
SINGLE DWELLING SINGLE DWELLINGSUBDIVISION IMPACT FEE IMPACT FEE
FY 2010 FY 2011 FY 2010 FY 2011
ALLEGANY None None - -ANNE ARUNDEL 1 $1,992 / $3,983 $3,983 / $9,958 6,508,533 5,200,000BALTIMORE CITY None None - -BALTIMORE COUNTY None None - -
CALVERT2 12,950 12,950 2,885,216 2,821,173CAROLINE3 $850 to $1500 $850 to $1500 129,574 110,000CARROLL 6,836 6,836 1,304,575 1,250,000CECIL None None - -
CHARLES 12,625 12,097 5,370,374 6,664,600DORCHESTER 4 3,675 3,675 436,811 0FREDERICK 14,283 15,185 8,943,974 6,848,463GARRETT None None - -
HARFORD 6,000 6,000 3,499,446 3,500,000HOWARD 4 .95/sf & $1.14/sf .99/sf & $1.16/sf 11,540,009 9,600,000KENT None None - -MONTGOMERY 5 regional rates regional rates 15,285,000 11,910,000
PRINCE GEORGE'S 13,921 / 8,120 14,227 / 8,299 15,394,266 QUEEN ANNE'S $3.47 per sq. foot $3.56 per sq. foot 1,165,815 1,130,000ST. MARY'S 4,500 4,500 2,316,191 1,998,000SOMERSET None None - -
TALBOT 6 5,957 6,113 543,808 385,000WASHINGTON $3 per sq ft $3 per sq ft 2,322,845 1,177,000WICOMICO 7 5,231 5,231 476,253 405,000WORCESTER None None - -
TOTAL YIELD 78,122,690 52,999,236
2 - Calvert County dedicates a portion of its impact fee for roads, solid waste, schools and recreation funding3 - Caroline County has two dedicated components: education $750; agricultural land preservation $100-7504 - Howard County levies a building excise tax on new development in lieu of an impact fee. Rate of $.99 applies to residential construction; non-residential is taxed at $.50/sq ft; first 500 sq ft is $4005 - Countywide rate shown. Several regional impact fees also apply
7 Restricted to educational costs that increase capacity at schools.Source: Maryland Association of Counties, Budget and Tax Rate Survey, November 2010
6 Rate for single family dwelling outside incorporated areas of towns; rate is lower in the towns.
TOTAL YIELDALL IMPACT FEES
IMPACT FEES / EXCISE TAXES ON NEW DEVELOPMENTFISCAL YEARS 2010 - 2011
1 - Actual and estimated revenues shown. As 1/1/10, the fees are based on square footage (sf). The rate shown is for a 2,000 -2,499 sf residential dwelling. The 2nd rate shown for FY11 is the increased amount as of 1/1/11.
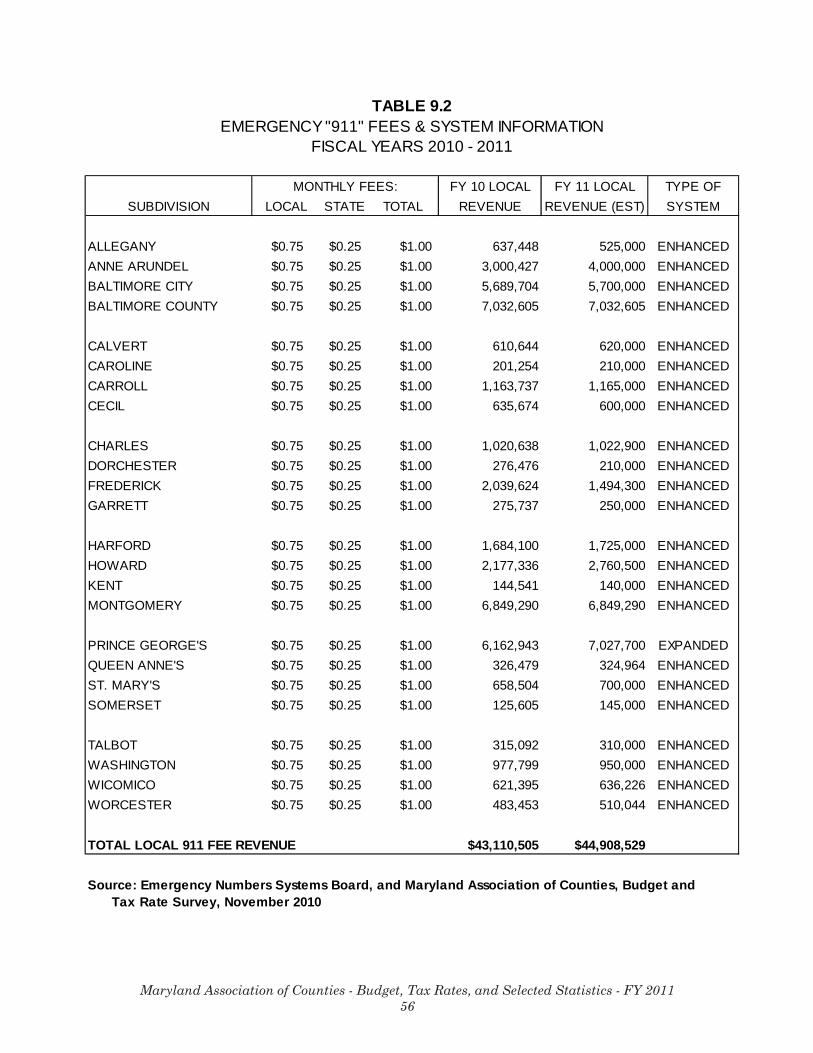
Maryland Association of Counties - Budget, Tax Rates, and Selected Statistics - FY 201156
TABLE 9.2EMERGENCY "911" FEES & SYSTEM INFORMATION
FISCAL YEARS 2010 - 2011
MONTHLY FEES: FY 10 LOCAL FY 11 LOCAL TYPE OFSUBDIVISION LOCAL STATE TOTAL REVENUE REVENUE (EST) SYSTEM
ALLEGANY $0.75 $0.25 $1.00 637,448 525,000 ENHANCEDANNE ARUNDEL $0.75 $0.25 $1.00 3,000,427 4,000,000 ENHANCEDBALTIMORE CITY $0.75 $0.25 $1.00 5,689,704 5,700,000 ENHANCEDBALTIMORE COUNTY $0.75 $0.25 $1.00 7,032,605 7,032,605 ENHANCED
CALVERT $0.75 $0.25 $1.00 610,644 620,000 ENHANCEDCAROLINE $0.75 $0.25 $1.00 201,254 210,000 ENHANCEDCARROLL $0.75 $0.25 $1.00 1,163,737 1,165,000 ENHANCEDCECIL $0.75 $0.25 $1.00 635,674 600,000 ENHANCED
CHARLES $0.75 $0.25 $1.00 1,020,638 1,022,900 ENHANCEDDORCHESTER $0.75 $0.25 $1.00 276,476 210,000 ENHANCEDFREDERICK $0.75 $0.25 $1.00 2,039,624 1,494,300 ENHANCEDGARRETT $0.75 $0.25 $1.00 275,737 250,000 ENHANCED
HARFORD $0.75 $0.25 $1.00 1,684,100 1,725,000 ENHANCEDHOWARD $0.75 $0.25 $1.00 2,177,336 2,760,500 ENHANCEDKENT $0.75 $0.25 $1.00 144,541 140,000 ENHANCEDMONTGOMERY $0.75 $0.25 $1.00 6,849,290 6,849,290 ENHANCED
PRINCE GEORGE'S $0.75 $0.25 $1.00 6,162,943 7,027,700 EXPANDEDQUEEN ANNE'S $0.75 $0.25 $1.00 326,479 324,964 ENHANCEDST. MARY'S $0.75 $0.25 $1.00 658,504 700,000 ENHANCEDSOMERSET $0.75 $0.25 $1.00 125,605 145,000 ENHANCED
TALBOT $0.75 $0.25 $1.00 315,092 310,000 ENHANCEDWASHINGTON $0.75 $0.25 $1.00 977,799 950,000 ENHANCEDWICOMICO $0.75 $0.25 $1.00 621,395 636,226 ENHANCEDWORCESTER $0.75 $0.25 $1.00 483,453 510,044 ENHANCED
TOTAL LOCAL 911 FEE REVENUE $43,110,505 $44,908,529
Source: Emergency Numbers Systems Board, and Maryland Association of Counties, Budget and Tax Rate Survey, November 2010
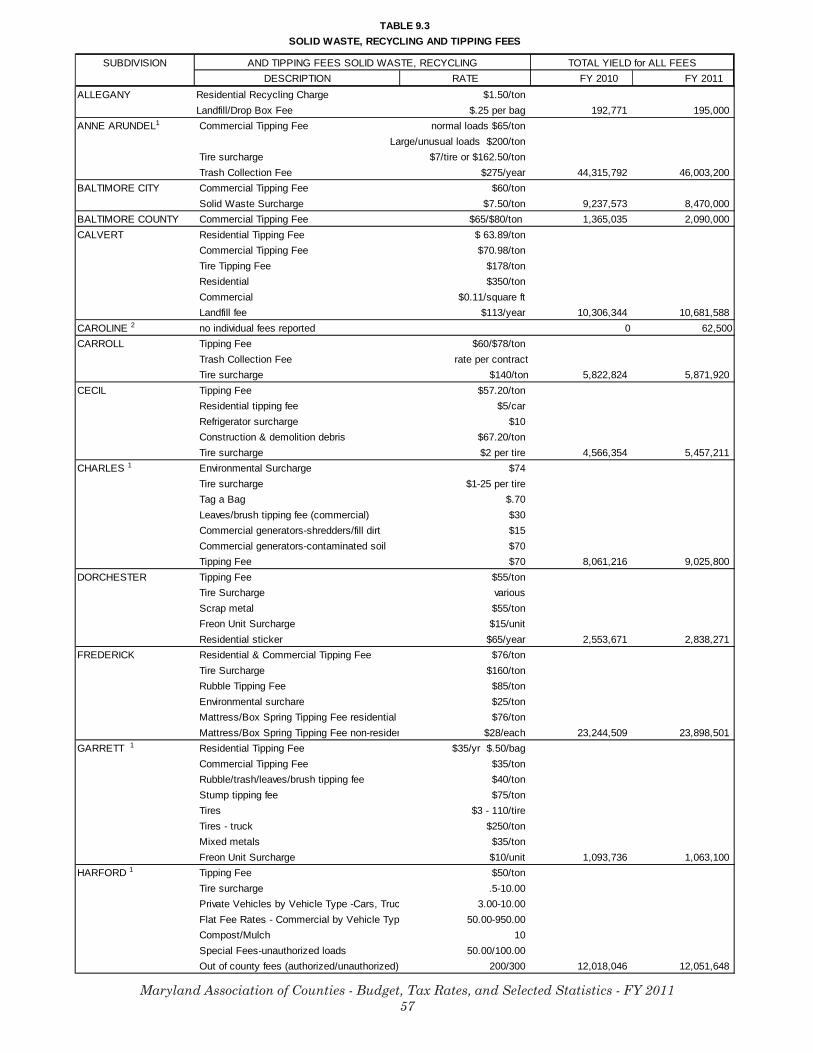
Maryland Association of Counties - Budget, Tax Rates, and Selected Statistics - FY 201157
TABLE 9.3SOLID WASTE, RECYCLING AND TIPPING FEES
SUBDIVISIONDESCRIPTION RATE FY 2010 FY 2011
ALLEGANY Residential Recycling Charge $1.50/tonLandfill/Drop Box Fee $.25 per bag 192,771 195,000
ANNE ARUNDEL1 Commercial Tipping Fee normal loads $65/tonLarge/unusual loads $200/ton
Tire surcharge $7/tire or $162.50/tonTrash Collection Fee $275/year 44,315,792 46,003,200
BALTIMORE CITY Commercial Tipping Fee $60/tonSolid Waste Surcharge $7.50/ton 9,237,573 8,470,000
BALTIMORE COUNTY Commercial Tipping Fee $65/$80/ton 1,365,035 2,090,000CALVERT Residential Tipping Fee $ 63.89/ton
Commercial Tipping Fee $70.98/tonTire Tipping Fee $178/tonResidential $350/tonCommercial $0.11/square ftLandfill fee $113/year 10,306,344 10,681,588
CAROLINE 2 no individual fees reported 0 62,500CARROLL Tipping Fee $60/$78/ton
Trash Collection Fee rate per contractTire surcharge $140/ton 5,822,824 5,871,920
CECIL Tipping Fee $57.20/tonResidential tipping fee $5/carRefrigerator surcharge $10Construction & demolition debris $67.20/tonTire surcharge $2 per tire 4,566,354 5,457,211
CHARLES 1 Environmental Surcharge $74Tire surcharge $1-25 per tireTag a Bag $.70Leaves/brush tipping fee (commercial) $30Commercial generators-shredders/fill dirt $15Commercial generators-contaminated soil $70Tipping Fee $70 8,061,216 9,025,800
DORCHESTER Tipping Fee $55/tonTire Surcharge variousScrap metal $55/tonFreon Unit Surcharge $15/unitResidential sticker $65/year 2,553,671 2,838,271
FREDERICK Residential & Commercial Tipping Fee $76/ton Tire Surcharge $160/tonRubble Tipping Fee $85/tonEnvironmental surchare $25/tonMattress/Box Spring Tipping Fee residential $76/tonMattress/Box Spring Tipping Fee non-residen $28/each 23,244,509 23,898,501
GARRETT 1 Residential Tipping Fee $35/yr $.50/bagCommercial Tipping Fee $35/tonRubble/trash/leaves/brush tipping fee $40/tonStump tipping fee $75/tonTires $3 - 110/tireTires - truck $250/tonMixed metals $35/tonFreon Unit Surcharge $10/unit 1,093,736 1,063,100
HARFORD 1 Tipping Fee $50/tonTire surcharge .5-10.00Private Vehicles by Vehicle Type -Cars, Truc 3.00-10.00Flat Fee Rates - Commercial by Vehicle Typ 50.00-950.00Compost/Mulch 10 Special Fees-unauthorized loads 50.00/100.00Out of county fees (authorized/unauthorized) 200/300 12,018,046 12,051,648
TOTAL YIELD for ALL FEESAND TIPPING FEES SOLID WASTE, RECYCLING
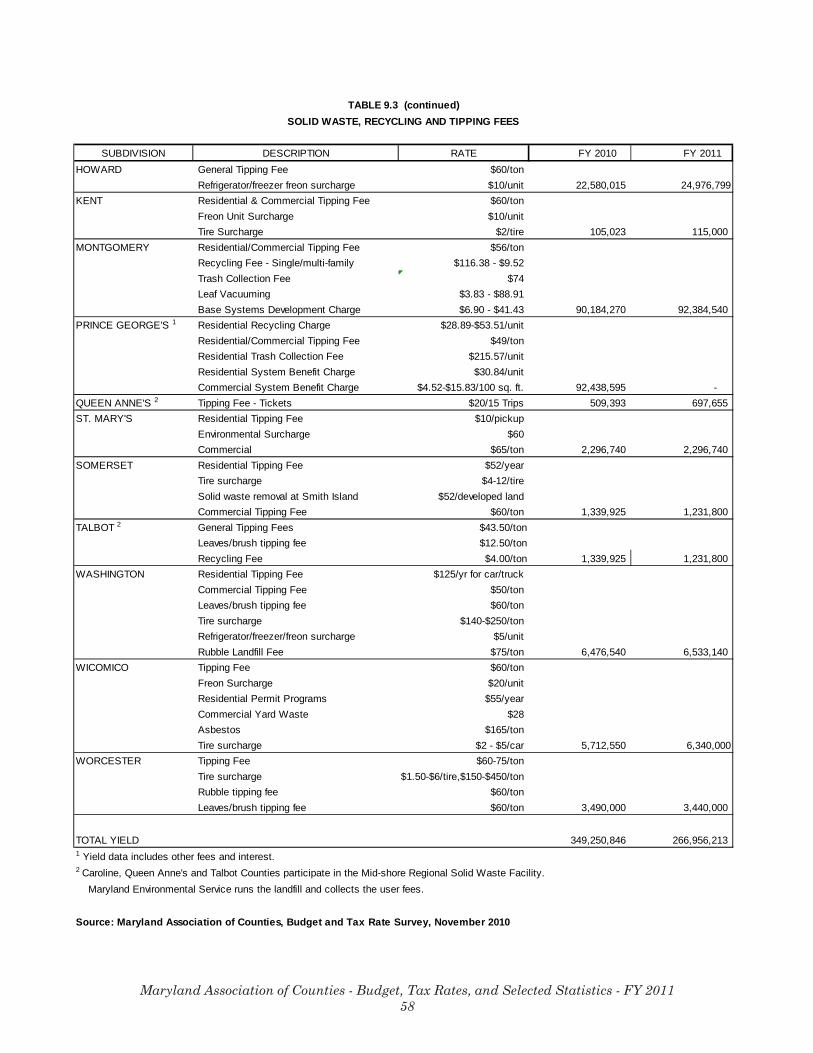
Maryland Association of Counties - Budget, Tax Rates, and Selected Statistics - FY 201158
TABLE 9.3 (continued)SOLID WASTE, RECYCLING AND TIPPING FEES
SUBDIVISION DESCRIPTION RATE FY 2010 FY 2011 HOWARD General Tipping Fee $60/ton
Refrigerator/freezer freon surcharge $10/unit 22,580,015 24,976,799KENT Residential & Commercial Tipping Fee $60/ton
Freon Unit Surcharge $10/unitTire Surcharge $2/tire 105,023 115,000
MONTGOMERY Residential/Commercial Tipping Fee $56/tonRecycling Fee - Single/multi-family $116.38 - $9.52Trash Collection Fee $74Leaf Vacuuming $3.83 - $88.91Base Systems Development Charge $6.90 - $41.43 90,184,270 92,384,540
PRINCE GEORGE'S 1 Residential Recycling Charge $28.89-$53.51/unitResidential/Commercial Tipping Fee $49/tonResidential Trash Collection Fee $215.57/unitResidential System Benefit Charge $30.84/unitCommercial System Benefit Charge $4.52-$15.83/100 sq. ft. 92,438,595 -
QUEEN ANNE'S 2 Tipping Fee - Tickets $20/15 Trips 509,393 697,655 ST. MARY'S Residential Tipping Fee $10/pickup
Environmental Surcharge $60Commercial $65/ton 2,296,740 2,296,740
SOMERSET Residential Tipping Fee $52/yearTire surcharge $4-12/tireSolid waste removal at Smith Island $52/developed landCommercial Tipping Fee $60/ton 1,339,925 1,231,800
TALBOT 2 General Tipping Fees $43.50/tonLeaves/brush tipping fee $12.50/tonRecycling Fee $4.00/ton 1,339,925 1,231,800
WASHINGTON Residential Tipping Fee $125/yr for car/truckCommercial Tipping Fee $50/tonLeaves/brush tipping fee $60/tonTire surcharge $140-$250/tonRefrigerator/freezer/freon surcharge $5/unitRubble Landfill Fee $75/ton 6,476,540 6,533,140
WICOMICO Tipping Fee $60/tonFreon Surcharge $20/unitResidential Permit Programs $55/yearCommercial Yard Waste $28Asbestos $165/tonTire surcharge $2 - $5/car 5,712,550 6,340,000
WORCESTER Tipping Fee $60-75/tonTire surcharge $1.50-$6/tire,$150-$450/tonRubble tipping fee $60/ton Leaves/brush tipping fee $60/ton 3,490,000 3,440,000
TOTAL YIELD 349,250,846 266,956,213 1 Yield data includes other fees and interest.2 Caroline, Queen Anne's and Talbot Counties participate in the Mid-shore Regional Solid Waste Facility. Maryland Environmental Service runs the landfill and collects the user fees.
Source: Maryland Association of Counties, Budget and Tax Rate Survey, November 2010