Martini,Pareto,Bosch A model for visualizing inter-team ... · Agile Software Development to be...
12
A model for visualizing inter-team interaction patterns influencing speed development in large software companies employing Agile Software Development Antonio Martini, Lars Pareto, Jan Bosch Software Engineering Division Chalmers University of Technology | University of Gothenburg Göteborg, Sweden {antonio.martini, pareto, jan.bosch}@chalmers.se Abstract. To achieve successful business, large software companies employ Agile Software Development to be fast and responsive in addressing customer needs. However, a large number of small, independent and fast teams suffer from excessive inter-team interactions, which may lead to paralysis. We provide a model of such interactions to give information to the teams in order to react upon it, and we find a major challenge in ASD to collect data for an effective visualization of the information. Keywords: Agile software development, inter-team interaction, speed, large scale software engineering, model, information, visualization. 1. Introduction Large software industries strive to make their development processes fast and more responsive with respect to customer needs, minimizing the time between the identification of a customer need and the delivery of a solution. An open issue is how to scale Agile Software Development (ASD) from successful small software projects [1] to large software companies. One successful approach is to split the products in components and features and to parallelize the development using small, fast teams [3]. However, such approach brings the drawback that a team requires interaction with many other teams [19]. The support for such interactions with a high number of teams or with the surrounding organization in Agile methods is weak and not well explored [13]. Some studies highlighted how interaction issues often cause inefficiencies [2],[6],[25],[22], and hinder the speed benefits gained by the parallelization of the development [25]. Also, delays in interaction due to synchronization may turn fast individual teams into slow and frustrated teams constantly forced to wait for others, hindering the fast release of features [3]. There may be several reasons why the teams lose time to interact and to carry out tasks related to such interaction. This speed waste decreases their interaction speed and therefore their overall speed. How could the teams visualize such interaction speed in order to react? What interaction patterns are influencing speed?
Transcript of Martini,Pareto,Bosch A model for visualizing inter-team ... · Agile Software Development to be...
A model for visualizing inter-team interaction patterns influencing speed development in large software
companies employing Agile Software Development
Antonio Martini, Lars Pareto, Jan Bosch
Software Engineering Division Chalmers University of Technology | University of Gothenburg
Göteborg, Sweden {antonio.martini, pareto, jan.bosch}@chalmers.se
Abstract. To achieve successful business, large software companies employ Agile Software Development to be fast and responsive in addressing customer needs. However, a large number of small, independent and fast teams suffer from excessive inter-team interactions, which may lead to paralysis. We provide a model of such interactions to give information to the teams in order to react upon it, and we find a major challenge in ASD to collect data for an effective visualization of the information.
Keywords: Agile software development, inter-team interaction, speed, large scale software engineering, model, information, visualization.
1. Introduction
Large software industries strive to make their development processes fast and more responsive with respect to customer needs, minimizing the time between the identification of a customer need and the delivery of a solution. An open issue is how to scale Agile Software Development (ASD) from successful small software projects [1] to large software companies. One successful approach is to split the products in components and features and to parallelize the development using small, fast teams [3]. However, such approach brings the drawback that a team requires interaction with many other teams [19]. The support for such interactions with a high number of teams or with the surrounding organization in Agile methods is weak and not well explored [13]. Some studies highlighted how interaction issues often cause inefficiencies [2],[6],[25],[22], and hinder the speed benefits gained by the parallelization of the development [25]. Also, delays in interaction due to synchronization may turn fast individual teams into slow and frustrated teams constantly forced to wait for others, hindering the fast release of features [3].
There may be several reasons why the teams lose time to interact and to carry out tasks related to such interaction. This speed waste decreases their interaction speed and therefore their overall speed. How could the teams visualize such interaction speed in order to react? What interaction patterns are influencing speed?

2 Antonio Martini, Lars Pareto, Jan Bosch
The purpose of this study is to identify the key properties to model the interaction patterns in order to visualize interaction speed.
The research questions addressed in this paper are the following: RQ1 How can we model interaction patterns to visualize inter-team interaction speed in large software organizations? RQ2 What instruments could we use to reveal interaction patterns in ASD?
The paper investigates these questions through a multiple-case case-study with three software companies employing large scale ASD. We conducted exploratory group interviews, followed by qualitative data analysis, and member checking sessions.
Our contributions are: • We define interaction patterns and key properties of interaction. • We highlight major challenges in ASD to reveal interaction patterns.
In section 2 we explored the literature, in section 3 we describes our theoretical framework that defines our notion of interaction speed. Section 4 describes our research design, section 5 our results. Then we discuss the applicability of our results (Section 6) and the limitations of the study (section 7). The paper ends with our conclusions, in Section 8.
2. Literature review
When surveying the literature, we have found a constant dilemma between, on the one hand, the need to create fast and independent Agile teams [3] and, on the other hand, the need to increase inter-team communications [12]. We found important to understand what interactions are affecting speed and what the causes are. Researchers in Global Software Development have studied interaction problems with the focus on geographically distributed teams [13,12,18,19]. Recommendations found in [12] (Optimally Splitting Work across Sites, Increasing Communication, Finding Experts, Awareness) have shown to be important also in large organizations that are considered co-located. This suggests that in large software organizations, even if co-located, the size of the project creates some of the effects as the geographically distributed teams. Therefore, our research may be of value for GSD and vice-versa. In [7] the authors studies how knowledge management affects the coordination of teams. A critical characteristic of ASD in interactions is the informal communication: it has been considered of value for managing volatile requirements, which makes the development flexible but creates challenges for inter-team communication and coordination [17]. In [18] informal communication is suggested as working well for XP with a strong bridgehead between the teams.
A socio-technical framework for evaluating technical and work dependencies has been studied in [4]. However, such framework heavily relies on artifacts representing the ongoing interactions among the employees, which requires reliable artifacts. Such artifacts are not available and are not representative in an informal ASD environment. Thus we found important to understand the interactions in such an environment.
Most of the abovementioned works study only parts of the problem from several perspectives. In [25] the focus is similar to ours, but the studied impact of Agile

A model for visualizing inter-team interaction patterns influencing speed development in large software companies employing Agile Software Development 3
practices in communication is not related to speed and business goals. Our framework provides a set of factors-effects affecting speed, and recommendations to handle such factors that we haven’t found in literature. The research in social psychology presents an opposite perspective on speed and interactions, in which time boundaries are claimed to influence group performance and interaction process [15].
3. Theoretical framework
Our theoretical framework is based on an initial a priori framework, which has been continuously updated during the study and the analysis of the data [5]. We define speed (borrowing the concept from kinematics) as the amount of the delivered value (DV) divided by the value delivery time (VDT): the time between the perception of a need and delivery of value by some external party. (See fig. 1). VDT is divisible into the time to identify the party (tN), time until call for action (tA), the time to commitment (tC), and the time to delivery of value by the external party (tD). We recognize the special case of end-to-end speed, where the need is perceived by a customer and the value delivered by a supplier.
Fig. 1. The definition of speed
A company that seeks to optimize its return of investment of R&D (ROI of R&D) must manage three end-to-end speeds (Fig. 2). The speed with which customer needs lead to new product offers (1st Deployment speed), the speed with which new features are replicated in new products (Replication speed), and the speed with which change request to an existing product are realized (Evolution speed).
End-to-end speeds, in turn, depend on interaction speed: how fast teams (or other organizational units), resolve each others’ needs. (Fig 3).
Interaction speed relates to both inter-organizational interaction (e.g., between teams at the customers and the client side) and intra organizational interactions (e.g., between a product management team and a team in a design unit). Each interaction involves several sub-interactions that address sub-needs, and also third party teams.

4 Antonio Martini, Lars Pareto, Jan Bosch
Fig. 2. Three kinds of end-to-end speed and their dependency on interaction speed.
Fig. 3. Interactions, sub-interactions, and interaction speed
Fig. 4. Factors creating or influencing interactions generating Speed Waste
Interaction speed depends on a number of organizational, architectural, and individual factors that may or may not be managed (Fig. 2). To optimize ROI of R&D we must 1) understand what these factors are, and 2) find strategies to manage them.
In this paper we focus on recognizing the interaction patterns affecting on VDT (we assume to have a fixed DV to be delivered, i.e. a set of features). We say that a factor (1…m) generates speed waste if it is either causing one or more interaction patterns (1…p), which in turn increment VDT decreasing speed (Fig 4). The total speed waste (W) is the sum of all such speed wastes.
A model for visualizing inter-team interaction patterns influencing speed development in large software companies employing Agile Software Development 5
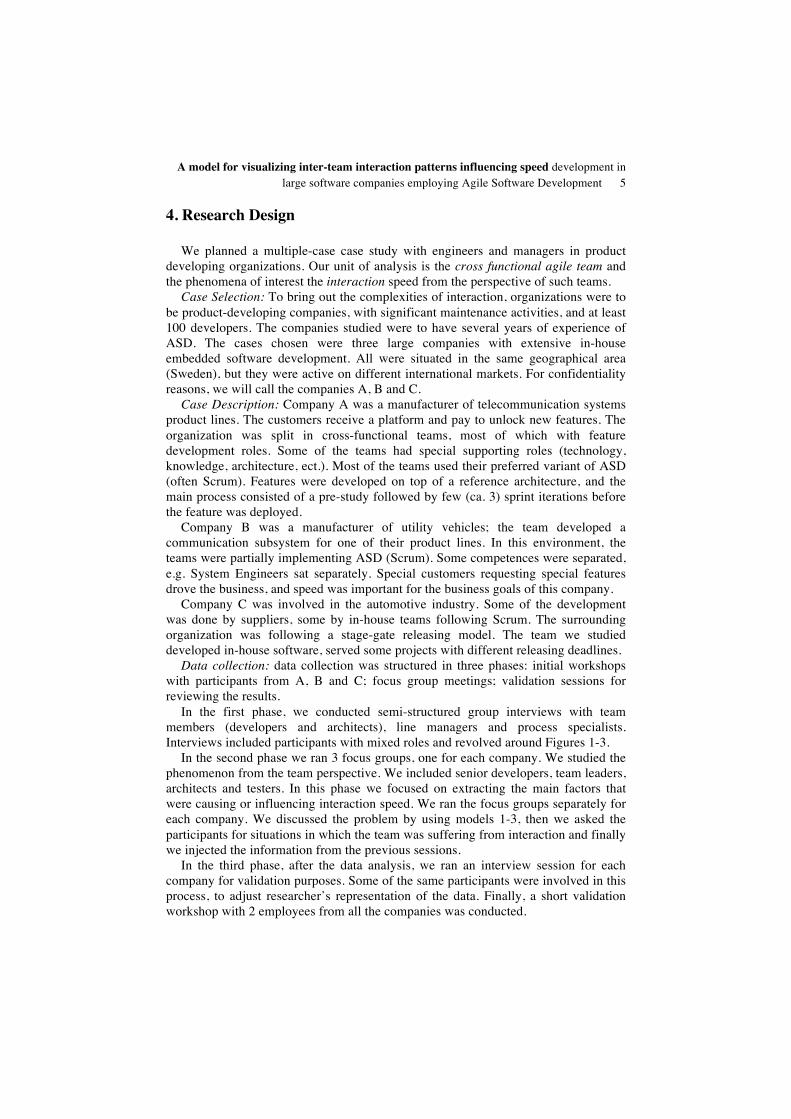
4. Research Design
We planned a multiple-case case study with engineers and managers in product developing organizations. Our unit of analysis is the cross functional agile team and the phenomena of interest the interaction speed from the perspective of such teams.
Case Selection: To bring out the complexities of interaction, organizations were to be product-developing companies, with significant maintenance activities, and at least 100 developers. The companies studied were to have several years of experience of ASD. The cases chosen were three large companies with extensive in-house embedded software development. All were situated in the same geographical area (Sweden), but they were active on different international markets. For confidentiality reasons, we will call the companies A, B and C.
Case Description: Company A was a manufacturer of telecommunication systems product lines. The customers receive a platform and pay to unlock new features. The organization was split in cross-functional teams, most of which with feature development roles. Some of the teams had special supporting roles (technology, knowledge, architecture, ect.). Most of the teams used their preferred variant of ASD (often Scrum). Features were developed on top of a reference architecture, and the main process consisted of a pre-study followed by few (ca. 3) sprint iterations before the feature was deployed.
Company B was a manufacturer of utility vehicles; the team developed a communication subsystem for one of their product lines. In this environment, the teams were partially implementing ASD (Scrum). Some competences were separated, e.g. System Engineers sat separately. Special customers requesting special features drove the business, and speed was important for the business goals of this company.
Company C was involved in the automotive industry. Some of the development was done by suppliers, some by in-house teams following Scrum. The surrounding organization was following a stage-gate releasing model. The team we studied developed in-house software, served some projects with different releasing deadlines.
Data collection: data collection was structured in three phases: initial workshops with participants from A, B and C; focus group meetings; validation sessions for reviewing the results.
In the first phase, we conducted semi-structured group interviews with team members (developers and architects), line managers and process specialists. Interviews included participants with mixed roles and revolved around Figures 1-3.
In the second phase we ran 3 focus groups, one for each company. We studied the phenomenon from the team perspective. We included senior developers, team leaders, architects and testers. In this phase we focused on extracting the main factors that were causing or influencing interaction speed. We ran the focus groups separately for each company. We discussed the problem by using models 1-3, then we asked the participants for situations in which the team was suffering from interaction and finally we injected the information from the previous sessions.
In the third phase, after the data analysis, we ran an interview session for each company for validation purposes. Some of the same participants were involved in this process, to adjust researcher’s representation of the data. Finally, a short validation workshop with 2 employees from all the companies was conducted.

6 Antonio Martini, Lars Pareto, Jan Bosch
Data Analysis: After each session we analyzed the recorded interviews to develop models and first results to be discussed in the following sessions. The analysis of the data was carried out between the phase 2 and 3 and also afterwards, to refine the results. We inductively further developed the initial theoretical frameworks and we populated them with interaction patterns and properties.
Synthesis: On the basis of this analysis and suggestions by the informants in interview data, we created a model for representing important interactions.
5. Findings
In this section we present our results: we describe a model to characterize interaction patterns and we highlight the lack of documents in ASD to track interactions among teams.
Interaction patterns
In Fig. 5 we show the general model for interaction between two teams. We relate the interactions to time, which is the main variable to measure speed.
Fig. 5. Interactions, sub-interactions, and interaction speed
An interaction starts when one or more members of a team (Team 1 in the picture) experience a need (at a time t’) that cannot be satisfied using the resources within the team. One or more member of Team 1 establishes a contact (interaction i1 in the picture) with another member of Team 2 (for simplicity we will mention Team 1 and Team 2 instead of citing a specific member). The interaction ends with the delivery of a value (see below for more details about values) from the other team (Team 2), which is represented by ik at a time t’’ in the picture. We refer to these two interactions (i1 and ik) as main interactions. Between the time span defined by t’ and t’’, the teams may have other interactions, for example to agree on the final delivery of the value. We call these interactions secondary interactions, since they are

A model for visualizing inter-team interaction patterns influencing speed development in large software companies employing Agile Software Development 7
necessary to adjust the main one. The granularity of main and secondary interactions may vary depending on what we consider to be the need and value delivered: for example, the interactions i2 and i3 in the picture may be considered recursively as need and delivery of a sub-value which would be necessary for the value delivered through ik. In the same way, the need and delivery (i1 and ik) may be considered as secondary interaction when considering the integration of more values as a whole. An example may be the need and delivery of a set of functionalities included in a feature (someone, for example a management or business team, needed the feature in the first instance and communicated a need to the team).
Values delivered can be of various natures, anything that is needed by the team for continuous working on the current development of a specific feature or component. We provide an example mentioned during the interviews: • A feature f1 developed by Team 1 has a dependency to another feature f2
developed by Team 2. For example, Team 1 has to change something in a component that will change the behavior of the feature f2. In order to agree on the change, Team 1 contacts Team 2 expressing the need to change the shared component (i1). After some agreement steps (i2 – ik-1) on how to change it (for example, negotiating the change of an interface), Team 2 approves the change (in the picture, the delivery ik).
Fig. 6. Interactions, sub-interactions, and interaction speed
The model in Fig. 5 can be combined multiple time involving different interactions between other teams, for example in Fig. 6 we have added the interactions between Team 2 and Team 3 to the model showing the interaction between Team 1 and Team 2. The resulting model could show the indirect interaction between two teams (in this case, the interactions between Team 1 and Team 3). Indirect interactions are often hidden, causing frustration for complex communication causing delays without the team being aware of the root cause. If all the teams were included in the model, the final display would highlight a complete landscape of the interactions going on among the teams, which could be used to reveal multi-interactions patterns and therefore to understand where the bottlenecks and the unnecessary complicated communications are. The combination with tagging would also show which activity is critical for interaction. In our case, the tagging could be combined with the identified

8 Antonio Martini, Lars Pareto, Jan Bosch
factors [12]. Finally, tasks generated by interactions can be considered as additional time spent on the interaction itself and therefore contributing to the final delay.
In the following, we will use special cases (or instances) of this generic model to represent interaction patterns that may occur in practice.
Interaction properties
The interactions among the teams may have different properties, which may have an impact on time:
• Synchronous/asynchronous: interaction between teams can be synchronous or asynchronous. In the former case, both the teams (or members of the teams) are participating in the interaction simultaneously, from the (sub-) need to the (sub-) delivery. An example of this kind of interaction is a phone call, (some) instant messaging conversation, a meeting or a workshop. An asynchronous interaction takes place when the need is communicated and the answer is received later, but the time in between is not part of the interaction. An example would be an e-mail conversation, a change request, etc., but also a request for more interaction. Even though we can’t associate a time span for the asynchronous interaction itself, we can safely assume that some amount of time is still required to carry out an asynchronous interaction (for example the activity of writing an e-mail or to fill in a document).
• Blocking interaction: an important kind of interaction is the blocking interaction. This is due to a critical need that has to be satisfied in order to continue the task at hand for Team 1 (Fig. 7). Although the team could probably (but not necessary) work on something else during the waiting time, the total length spent on the task will be increased, delaying a related release. When the interaction is synchronous, it becomes automatically blocking since both the involved teams are actively and continuously participating in the interaction until the need is delivered (for example, a workshop ends).
Fig. 7. Blocking interactions
• Interaction frequency: the interactions may consist of just one with a lot of time spent on a single delivery and a single value, or it may consist of many (smaller) interactions. In fact, a huge delay may be easily recognized as a long waiting time, while many shorter interactions are more difficult to

A model for visualizing inter-team interaction patterns influencing speed development in large software companies employing Agile Software Development 9
catch, and in the end the time spent (and therefore the delays) could be equivalent to a single, long interaction. For this reason, we introduce the interaction frequency, which can be calculated as k/(t’’ – t’) in two ways, depending on the kind of interaction:
o by considering each interaction as independent, which would include all the interactions (Fig. 5);
o by considering a need nj and a delivery dj as a whole interaction (1≤j≤k in Fig. 8). This frequency makes sense in case we have synchronous interactions (since every need cannot be separated from the delivery).
Fig. 8. Interactions, sub-interactions, and interaction speed
• Interaction density: it represents the amount of time spent in interactions over time. It is calculated by summing up the various lengths of interaction divided by the time span. This property is relevant when considering blocking interactions (and thus also synchronous interactions). However, we can suppose that for each asynchronous interaction some small amount of time is spent on the activity of interacting, and therefore intensity can be approximately calculated.
Challenges in monitoring interaction in ASD environment
We have found very difficult to keep track of the actual interactions going on in the companies. The means to track communications, coordination and other sources of interaction were not present in the organizations, or they were not representative of the real events. This means that the observation of artifacts such as documentation couldn’t be used to understand the actual behavior of the teams. This status was confirmed in all the 4 units (3 cases) studied, which is quite strong evidence. Moreover the introduction of ASD, supporting the practice of informal communications over documents, sustained this situation. We cannot claim, though, that it is the root cause, since we don’t know about the situation previous to this change in the processes.

10 Antonio Martini, Lars Pareto, Jan Bosch
6. Discussion
In this section we explain why our results are relevant for the software business, how the factors can be discovered and how recommendations can be applied by practitioners (managers or teams).
As explained in [22] and in Fig. 2, there are three end-to-end speeds influencing Return of Investment: 1st deployment speed, replication speed and evolutions speed. Interaction speed affects all of them, as explained in the following paragraphs. • 1st Deployment Speed: when a set of features is released for the first time, the speed
is affected by the interaction speed among the teams that have to integrate the features. This kind of speed helps hitting the market fast to anticipate the competitors. Fast deployment speed also shortens the loop in market testing.
• Replication Speed: when a feature is embedded in a previous release, interactions are needed between the team responsible for the new features and the teams that had developed the former ones. Replication increases ROI when the effort made for the 1st deployment speed is spread on the release of new products and services based on the existing software.
• Evolution Speed: when a feature needs to be changed after its release, such changes will affect other features, requiring interactions again. The speed in reacting upon a change request can be critical for gaining the trust of the customers. Managers want to reach the abovementioned business goals. Delays over the
schedules may be due to speed wasted in interactions. Managers may recognize it but they need the team(s) to observe the effects. The effects can be visualized in form of interaction patterns. Since each effect is related to one or more root factors, managers can immediately investigate the status of such factors in the teams to find which one is the cause for the effect. In Table 2, the connections between factors and effects reduce the solution space for the investigating manager, who saves time and resources. In case the factors are recognized, both the team and the manager (depending on the factor) may decide to react. This process is outlined in Fig. 5.
Fig. 9. How the practitioner can use our results.
The importance of the model that we have described should be used in order to measure speed. The main purpose, would be the creation of a tool for digitally visualizing interaction patterns among the teams, which could therefore act upon the shown information. In [23] we have listed factors producing effects and causing speed

A model for visualizing inter-team interaction patterns influencing speed development in large software companies employing Agile Software Development 11
waste. To recognize such effects, though, the team and the managers need a suitable tool for the visualization. We have listed the properties for such model: however, there exist challenges in an ASD environment that hinder the collection of informative artifacts.
7. Threats to Validity and Limitations
In this section we list and explain the limitations for this study. The information is based on employees’ statements and may be biased. One possible threat to validity is the evaluation apprehension: the employees were interviewed usually in groups, which helped balancing statements. To handle the mono-operation bias we collected data from three companies and in some cases from more the one site. As for background influence, we interviewed various roles, from managers to programmers. We limited the threats to conclusion validity (such as influence posed on the subjects) by injecting the preliminary results only after the respondents gave their statements. The threat to external validity (generalizability) has been limited (but not completely solved) by studying three cases with common attributes: size, development domain (i.e. embedded systems) and introducing ASD. We highlighted the differences in the section about their contexts.
8. Conclusions
The effective implementation of ASD in large software companies may be the way for the successful achievement of business goals depending on speed. However, Agile teams need to recognize interactions and act upon such information. We have defined interaction speed through a set of models, to frame it with respect to large organizations employing ASD. We have created a generic model and listed properties of interactions (RQ1). We have highlighted what problems there might be in an ASD environment to measure interaction speed (RQ2).
Acknowledgement This research has been carried out in Software Centre, by Chalmers and University of Gothenburg, and
Industry Partners.
References
1. B Beck, K., 2000. Extreme Programming Explained: Embrace Change. Addison-Wesley Professional. 2. Bosch, J., Bosch-Sijtsema, P., 2010. From integration to composition: On the impact of software
product lines, global development and ecosystems. Journal of Systems and Software 83 3. Bosch, J., Bosch-Sijtsema, P.M., 2011. Introducing agile customer-centered development in a legacy
software product line. Software: Practice and Experience 41 4. Cataldo, M., Herbsleb, J.D., Carley, K.M., 2008. Socio-technical congruence: a framework for
assessing the impact of technical and work dependencies on software development productivity, International Symposium on Empirical Software Engineering and Measurement, ESEM ’08. ACM

12 Antonio Martini, Lars Pareto, Jan Bosch
5. Dubois, A., Gadde, L.-E., 2002. Systematic combining: an abductive approach to case research. Journal of Business Research 55, 553–560.
6. Dybå, T., Dingsøyr, T., 2008. Empirical studies of agile software development: A systematic review. Information and Software Technology 50, 833–859.
7. Espinosa, J.A., Slaughter, S.A., Kraut, R.E., Herbsleb, J.D., 2007. Team knowledge and coordination in geographically distributed software development. Journal of Management Information Systems 24
8. Giuffrida, R., Dittrich, Y., n.d. Empirical studies on the use of social software in global software development – A systematic mapping study. Information and Software Technology.
9. Greve, A., Benassi, M., Sti, A.D., 2010. Exploring the contributions of human and social capital to productivity. International Review of Sociology 20, 35–58.
10. Gobeli, D.H., Koenig, H.F., Bechinger, I., 1998. Managing conflict in software development teams: a multilevel analysis. Journal of Product Innovation Management 15, 423–435.
11. Gotel, O., Kulkarni, V., Say, M., Scharff, C., Sunetnanta, T., 2012. Quality indicators on global software development projects: does “getting to know you” really matter? Journal of Software: Evolution and Process 24, 169–184.
12. Herbsleb, J.D., Mockus, A., 2003. An empirical study of speed and communication in globally distributed software development. IEEE Transactions on Software Engineering 29.
13. Hossain, E., Babar, M.A., Paik, H., 2009. Using Scrum in Global Software Development: A Systematic Literature Review, in: Fourth IEEE International Conference on Global Software Engineering, 2009. ICGSE 2009. ICGSE 2009
14. Kahkonen, T., 2004. Agile methods for large organizations - building communities of practice, in: Agile Development Conference, 2004. Presented at the Agile Development Conference, 2004,
15. Karau, S.J., Kelly, J.R., 1992. The effects of time scarcity and time abundance on group performance quality and interaction process. Journal of Experimental Social Psychology 28
16. Karlstrom, D., Runeson, P., 2005. Combining agile methods with stage-‐gate project management. IEEE Software 22, 43 – 49.
17. Korkala, M., Abrahamsson, P., 2007b. Communication in Distributed Agile Development: A Case Study, in: 33rd EUROMICRO Conference on Software Engineering and Advanced Applications, 2007.
18. Layman, L., Williams, L., Damian, D., Bures, H., 2006. Essential communication practices for Extreme Programming in a global software development team. Information and Software Technology
19. Lindvall, M., Muthig, D., Dagnino, A., Wallin, C., Stupperich, M., Kiefer, D., May, J., Kahkonen, T., 2004. Agile software development in large organizations. Computer 37
20. Liu, J.Y.-C., Chen, H.-G., Chen, C.C., Sheu, T.S., 2011. Relationships among interpersonal conflict, requirements uncertainty, and software project performance. International Journal of Project Management 29, 547–556.
21. Loureiro-Koechlin, C., 2008. A theoretical framework for a structuration model of social issues in software development in information systems. Systems Research and Behavioral Science 25, 99–109.
22. Martini, A., Pareto, L., Bosch, J., 2012. Enablers and inhibitors for speed with reuse, in: Proceedings of the 16th International Software Product Line Conference - SPLC ’12. ACM
23. Martini, A., Pareto, L. & Bosch, J., 2013 Improving Businesses Success by Managing Interactions among Agile Teams in Large Organizations, accepted for publication at 4th international conference in software business (ICSOB 2013).
24. Pawar, K.S., Sharifi, S., 2000. Virtual collocation of design teams: coordinating for speed. International Journal of Agile Management Systems 2, 104–113.
25. Pikkarainen, M., Haikara, J., Salo, O., Abrahamsson, P., Still, J., 2008. The impact of agile practices on communication in software development. Empirical Software Engineering 13
26. Saldaña-Ramos, J., Sanz-Esteban, A., García, J., Amescua, A., 2013. Skills and abilities for working in a global software development team: a competence model. Journal of Software: Evolution and Process
27. Strode, D.E., Huff, S.L., Hope, B., Link, S., 2012. Coordination in co-located agile software development projects. Journal of Systems and Software 85, 1222–1238.