Martin Lundstedt, President and CEO - Volvo Group
30
Martin Lundstedt, President and CEO FOURTH QUARTER 2020
Transcript of Martin Lundstedt, President and CEO - Volvo Group

Martin Lundstedt, President and CEO
FOURTH QUARTER 2020
Volvo Group
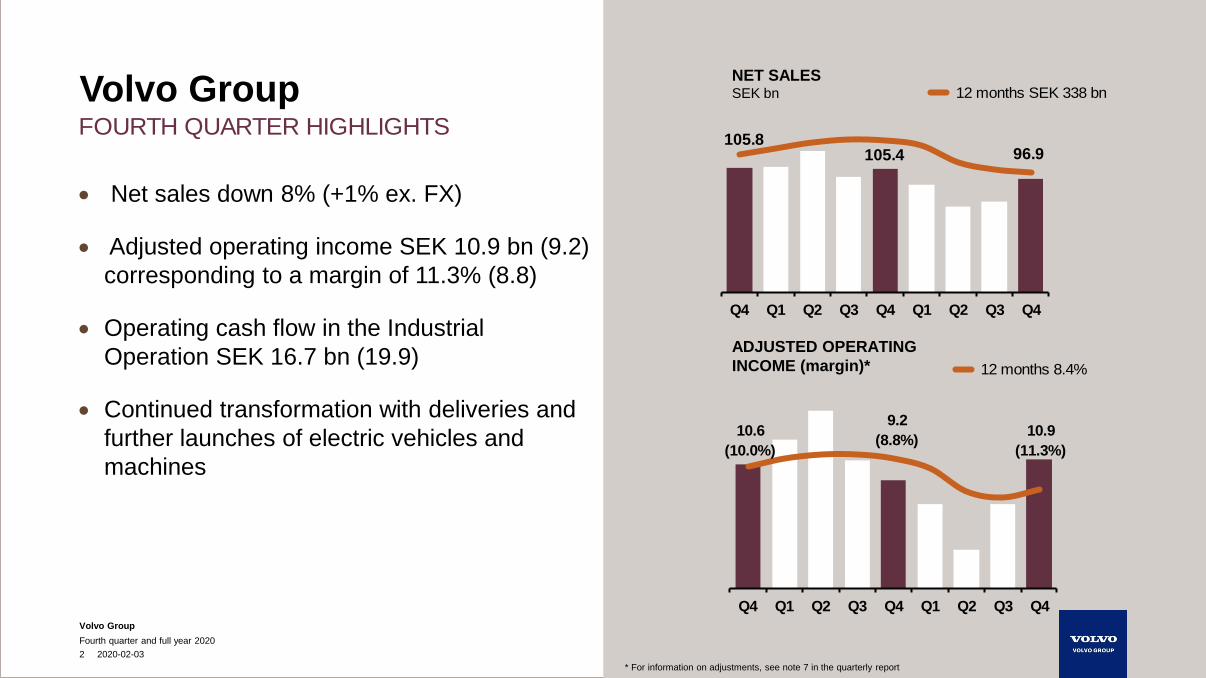
105.8105.4 96.9
Q4 Q1 Q2 Q3 Q4 Q1 Q2 Q3 Q4
Q4 Q1 Q2 Q3 Q4 Q1 Q2 Q3 Q4
Fourth quarter and full year 2020
2 2020-02-03
• Net sales down 8% (+1% ex. FX)
• Adjusted operating income SEK 10.9 bn (9.2)
corresponding to a margin of 11.3% (8.8)
• Operating cash flow in the Industrial
Operation SEK 16.7 bn (19.9)
• Continued transformation with deliveries and
further launches of electric vehicles and
machines
Volvo GroupNET SALESSEK bn
ADJUSTED OPERATING
INCOME (margin)*
12 months SEK 338 bn
12 months 8.4%
10.6
(10.0%)
9.2
(8.8%)10.9
(11.3%)
FOURTH QUARTER HIGHLIGHTS
* For information on adjustments, see note 7 in the quarterly report
Volvo Group
Fourth quarter and full year 2020
3 2020-02-03
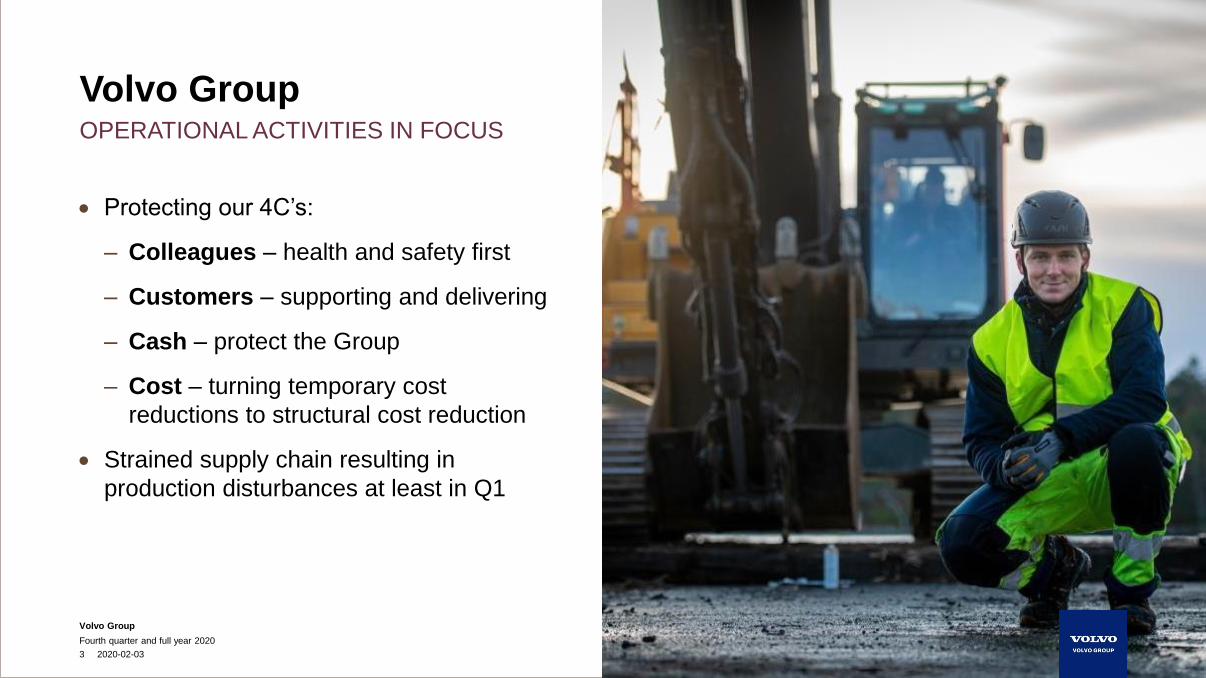
• Protecting our 4C’s:
– Colleagues – health and safety first
– Customers – supporting and delivering
– Cash – protect the Group
– Cost – turning temporary cost
reductions to structural cost reduction
• Strained supply chain resulting in
production disturbances at least in Q1
OPERATIONAL ACTIVITIES IN FOCUS
Volvo Group
Volvo Group
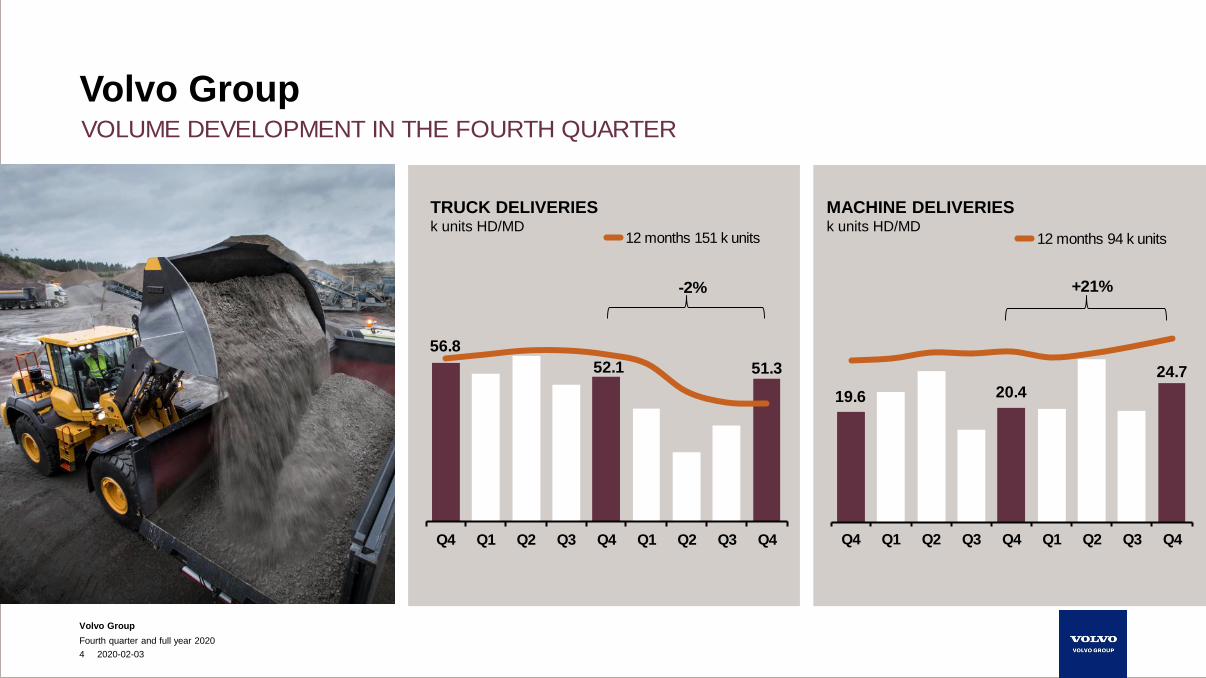
56.8
52.1 51.3
Q4 Q1 Q2 Q3 Q4 Q1 Q2 Q3 Q4
19.6 20.4
24.7
Q4 Q1 Q2 Q3 Q4 Q1 Q2 Q3 Q4
Fourth quarter and full year 2020
4 2020-02-03
Volvo Group
TRUCK DELIVERIESk units HD/MD
MACHINE DELIVERIESk units HD/MD
12 months 151 k units 12 months 94 k units
VOLUME DEVELOPMENT IN THE FOURTH QUARTER
-2% +21%
Volvo Group
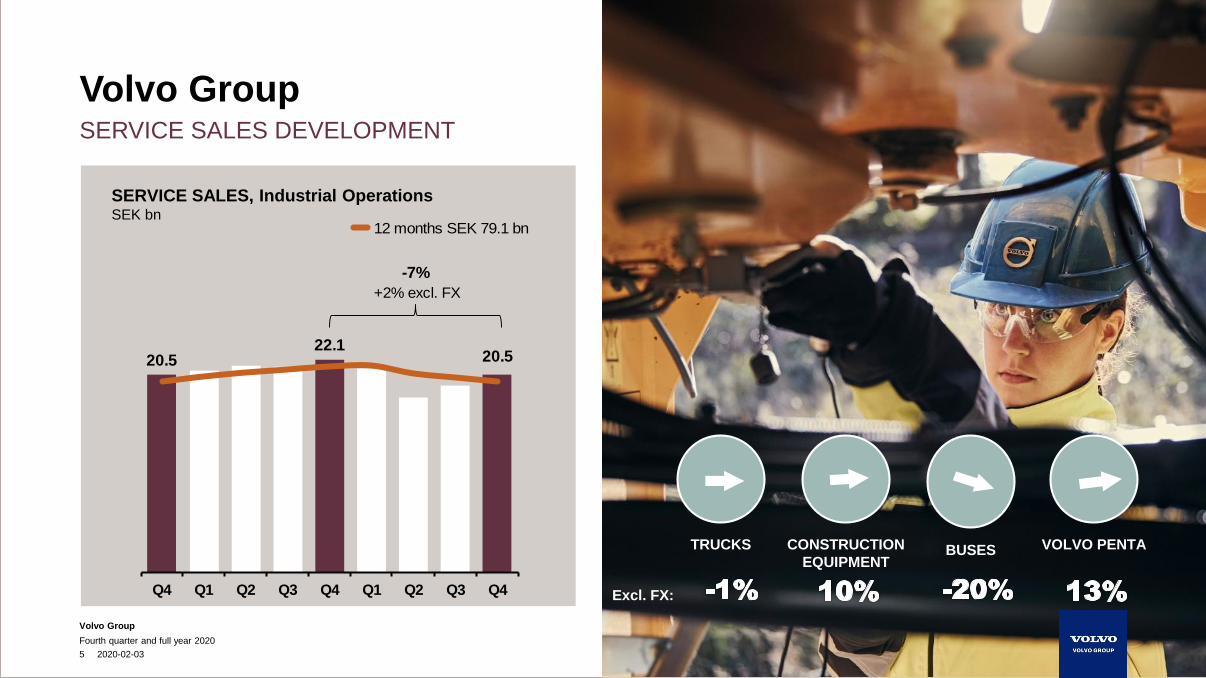
-7%
+2% excl. FX
Fourth quarter and full year 2020
5 2020-02-03
SERVICE SALES DEVELOPMENT
Volvo Group
SERVICE SALES, Industrial OperationsSEK bn
TRUCKS BUSES VOLVO PENTACONSTRUCTION
EQUIPMENT
Excl. FX:
20.522.1
20.5
Q4 Q1 Q2 Q3 Q4 Q1 Q2 Q3 Q4
12 months SEK 79.1 bn

Trucks
Volvo Group
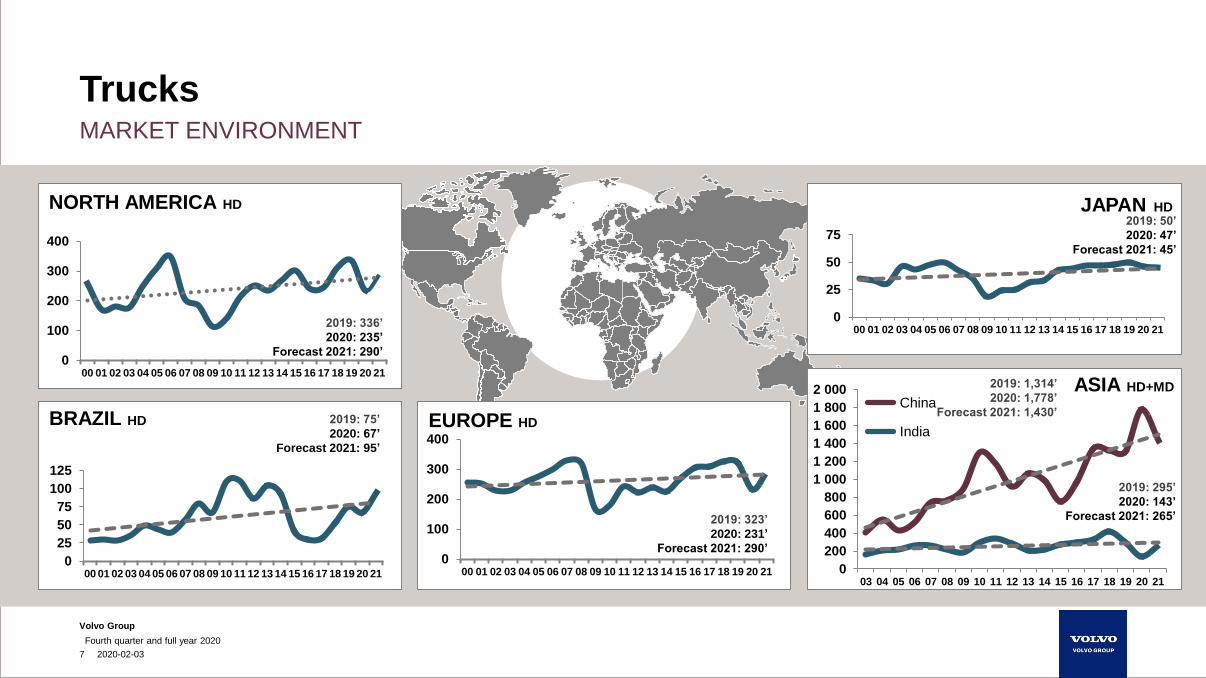
JAPAN HD
EUROPE HDBRAZIL HD
ASIA HD+MD
NORTH AMERICA HD
0
200
400
600
800
1 000
1 200
1 400
1 600
1 800
2 000
03 04 05 06 07 08 09 10 11 12 13 14 15 16 17 18 19 20 21
China
India
2019: 295’
2020: 143’
Forecast 2021: 265’
0
25
50
75
00 01 02 03 04 05 06 07 08 09 10 11 12 13 14 15 16 17 18 19 20 21
2019: 50’
2020: 47’
Forecast 2021: 45’
MARKET ENVIRONMENT
Fourth quarter and full year 2020
7 2020-02-03
Trucks
0
25
50
75
100
125
00 01 02 03 04 05 06 07 08 09 10 11 12 13 14 15 16 17 18 19 20 21
2019: 75’
2020: 67’
Forecast 2021: 95’
0
100
200
300
400
00 01 02 03 04 05 06 07 08 09 10 11 12 13 14 15 16 17 18 19 20 21
2019: 336’
2020: 235’
Forecast 2021: 290’
0
100
200
300
400
00 01 02 03 04 05 06 07 08 09 10 11 12 13 14 15 16 17 18 19 20 21
2019: 323’
2020: 231’
Forecast 2021: 290’
2019: 1,314’
2020: 1,778’
Forecast 2021: 1,430’
Volvo Group
Q4 Q1 Q2 Q3 Q4 Q1 Q2 Q3 Q4
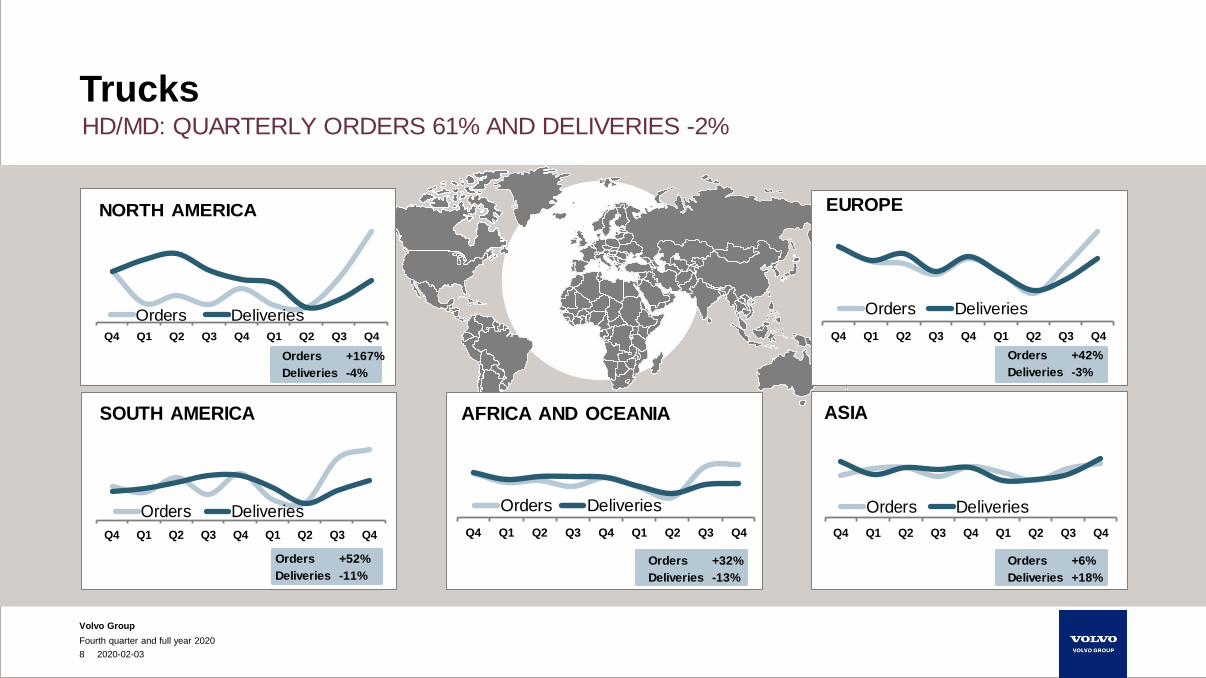
EUROPE
Orders Deliveries
Q4 Q1 Q2 Q3 Q4 Q1 Q2 Q3 Q4
ASIA
Orders Deliveries
Q4 Q1 Q2 Q3 Q4 Q1 Q2 Q3 Q4
AFRICA AND OCEANIA
Orders Deliveries
Q4 Q1 Q2 Q3 Q4 Q1 Q2 Q3 Q4
SOUTH AMERICA
Orders Deliveries
Q4 Q1 Q2 Q3 Q4 Q1 Q2 Q3 Q4
NORTH AMERICA
Orders Deliveries
Fourth quarter and full year 2020
8 2020-02-03
Trucks
Orders +167%
Deliveries -4%
Orders +52%
Deliveries -11%
Orders +32%
Deliveries -13%
Orders +42%
Deliveries -3%
Orders +6%
Deliveries +18%
HD/MD: QUARTERLY ORDERS 61% AND DELIVERIES -2%
Volvo Group
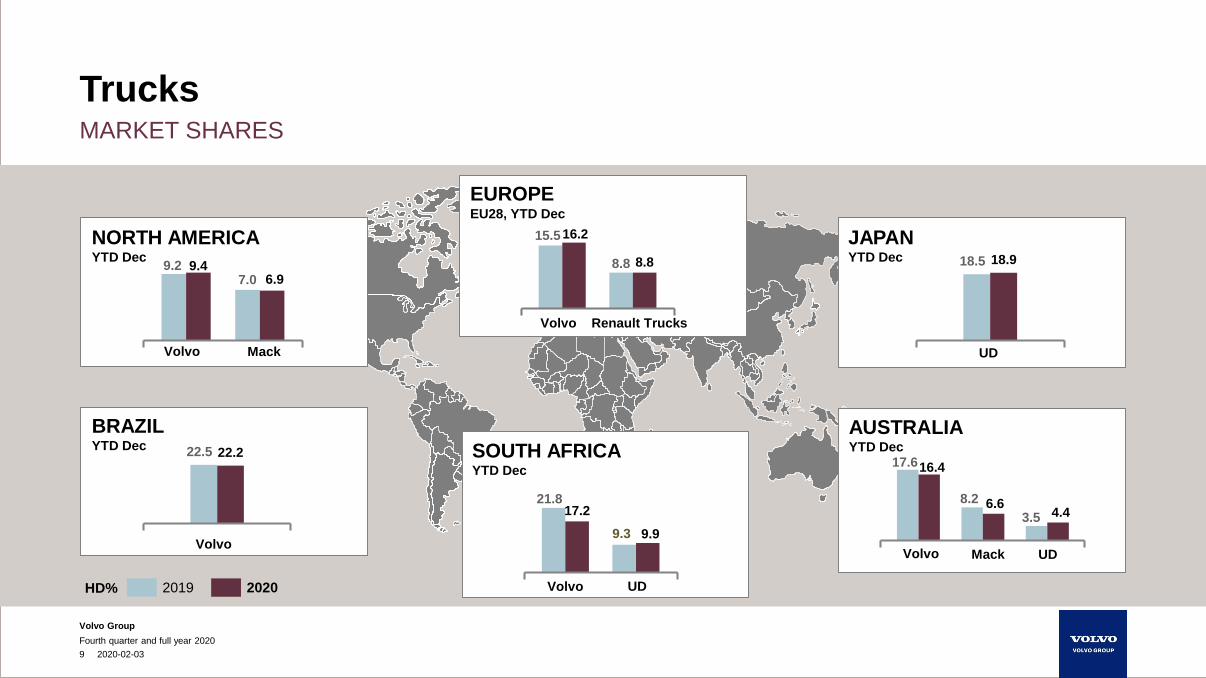
NORTH AMERICAYTD Dec
BRAZILYTD Dec
JAPANYTD Dec
AUSTRALIAYTD Dec
EUROPEEU28, YTD Dec
SOUTH AFRICAYTD Dec
9.2 9.47.0 6.9
18.5 18.9
17.616.4
8.2 6.63.5 4.4
21.817.2
9.3 9.9
15.516.2
8.8 8.8
MARKET SHARES
Fourth quarter and full year 2020
9 2020-02-03
Trucks
Volvo Mack
Volvo
Volvo Renault Trucks
UD
Volvo UD
MackVolvo UD
22.5 22.2
20202019HD%
Volvo Group
Fourth quarter and full year 2020
10 2020-02-03
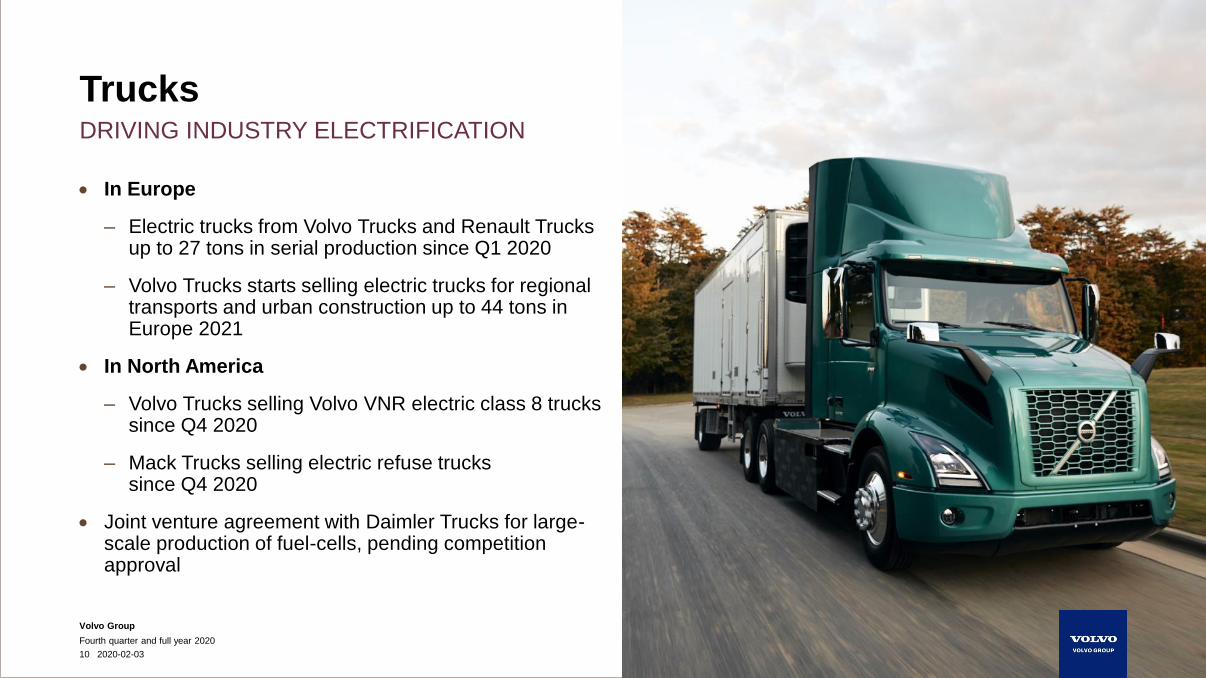
• In Europe
– Electric trucks from Volvo Trucks and Renault Trucks up to 27 tons in serial production since Q1 2020
– Volvo Trucks starts selling electric trucks for regional transports and urban construction up to 44 tons in Europe 2021
• In North America
– Volvo Trucks selling Volvo VNR electric class 8 trucks since Q4 2020
– Mack Trucks selling electric refuse trucks since Q4 2020
• Joint venture agreement with Daimler Trucks for large-scale production of fuel-cells, pending competition approval
DRIVING INDUSTRY ELECTRIFICATION
Trucks
Volvo Group
Fourth quarter and full year 2020
11 2020-02-03
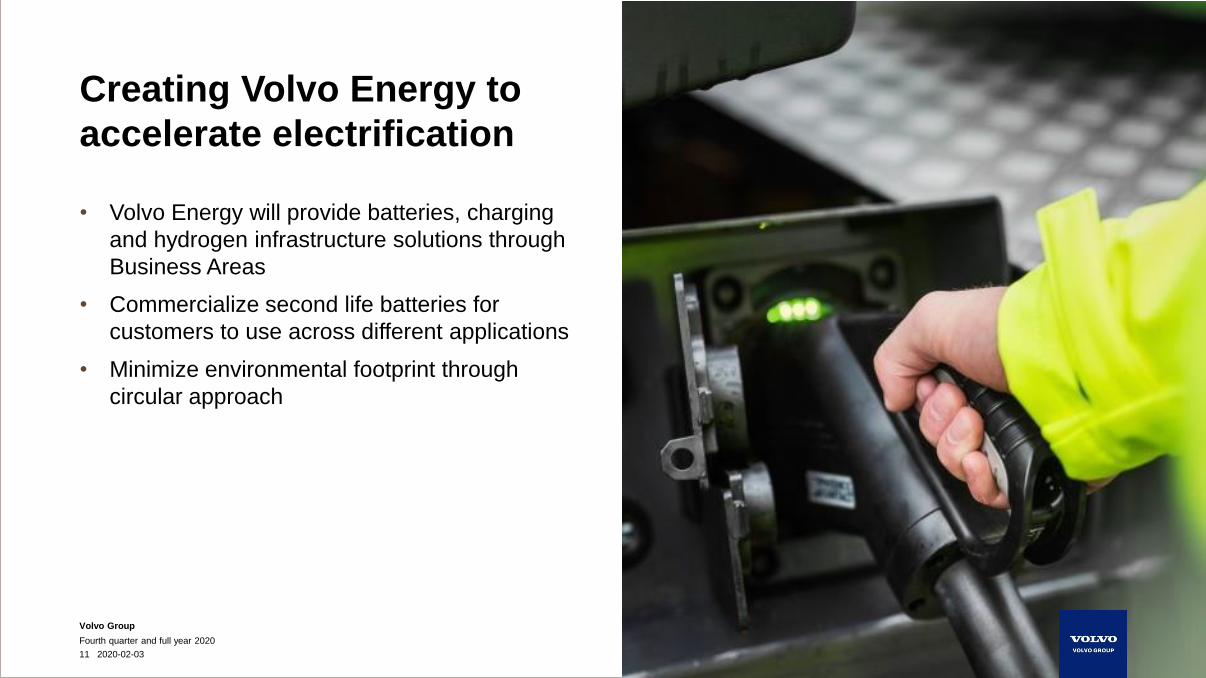
• Volvo Energy will provide batteries, charging
and hydrogen infrastructure solutions through
Business Areas
• Commercialize second life batteries for
customers to use across different applications
• Minimize environmental footprint through
circular approach
Creating Volvo Energy to
accelerate electrification
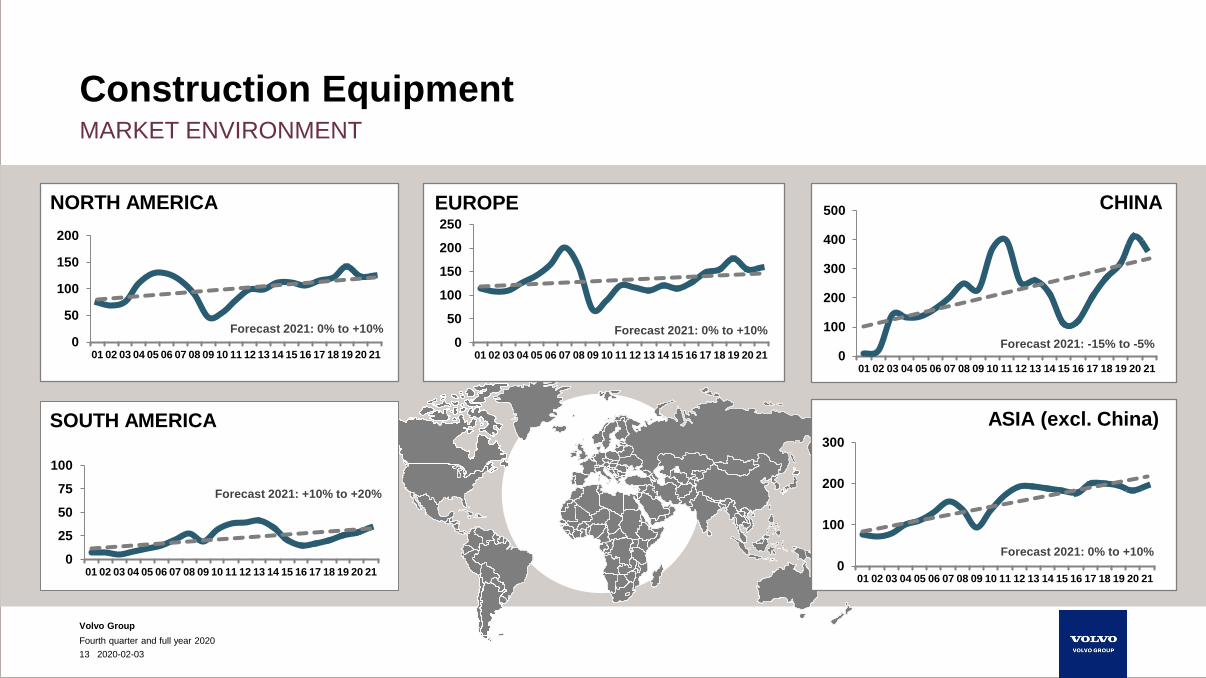
Construction Equipment
Volvo Group
0
50
100
150
200
01 02 03 04 05 06 07 08 09 10 11 12 13 14 15 16 17 18 19 20 21
Forecast 2021: 0% to +10%
MARKET ENVIRONMENT
Fourth quarter and full year 2020
13 2020-02-03
Construction Equipment
SOUTH AMERICA
0
25
50
75
100
01 02 03 04 05 06 07 08 09 10 11 12 13 14 15 16 17 18 19 20 21
Forecast 2021: +10% to +20%
0
100
200
300
400
500
01 02 03 04 05 06 07 08 09 10 11 12 13 14 15 16 17 18 19 20 21
Forecast 2021: -15% to -5%
CHINA
0
100
200
300
01 02 03 04 05 06 07 08 09 10 11 12 13 14 15 16 17 18 19 20 21
Forecast 2021: 0% to +10%
ASIA (excl. China)
0
50
100
150
200
250
01 02 03 04 05 06 07 08 09 10 11 12 13 14 15 16 17 18 19 20 21
Forecast 2021: 0% to +10%
EUROPENORTH AMERICA
Volvo Group
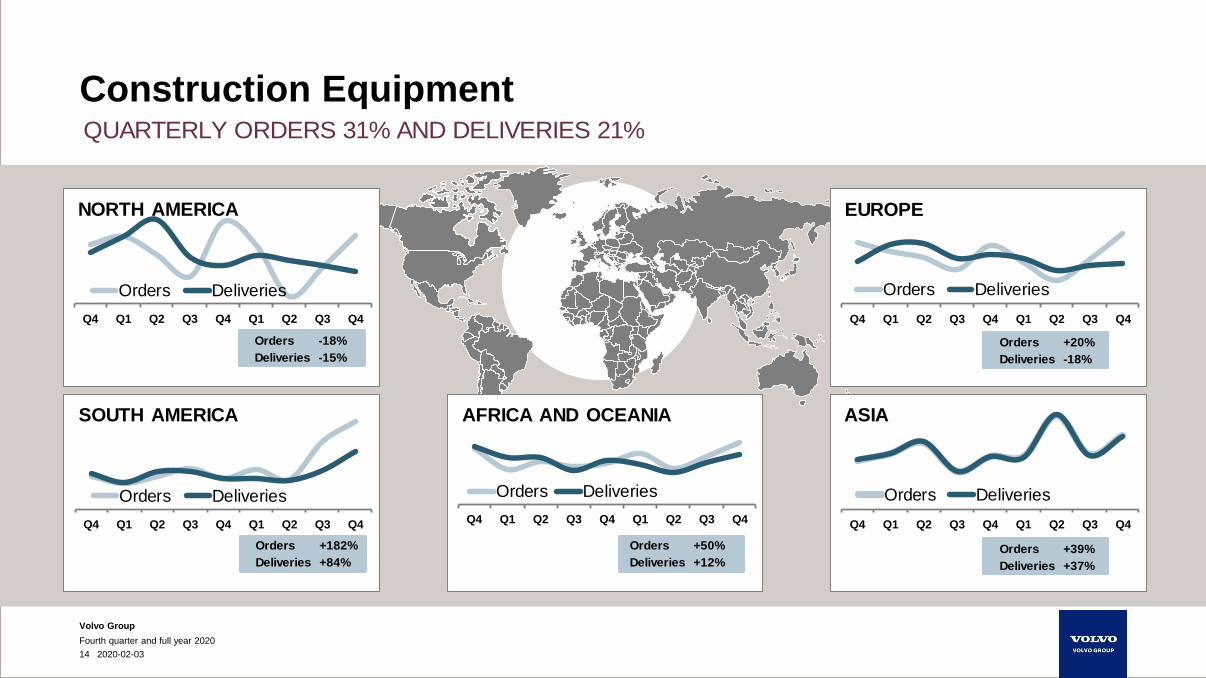
Q4 Q1 Q2 Q3 Q4 Q1 Q2 Q3 Q4
ASIA
Orders Deliveries
Orders +39%
Deliveries +37%
Q4 Q1 Q2 Q3 Q4 Q1 Q2 Q3 Q4
EUROPE
Orders Deliveries
Q4 Q1 Q2 Q3 Q4 Q1 Q2 Q3 Q4
AFRICA AND OCEANIA
Orders Deliveries
Q4 Q1 Q2 Q3 Q4 Q1 Q2 Q3 Q4
SOUTH AMERICA
Orders Deliveries
Q4 Q1 Q2 Q3 Q4 Q1 Q2 Q3 Q4
NORTH AMERICA
Orders Deliveries
Fourth quarter and full year 2020
14 2020-02-03
Construction Equipment
Orders -18%
Deliveries -15%
Orders +182%
Deliveries +84%
Orders +50%
Deliveries +12%
Orders +20%
Deliveries -18%
QUARTERLY ORDERS 31% AND DELIVERIES 21%
Volvo Group
Fourth quarter and full year 2020
15 2020-02-03
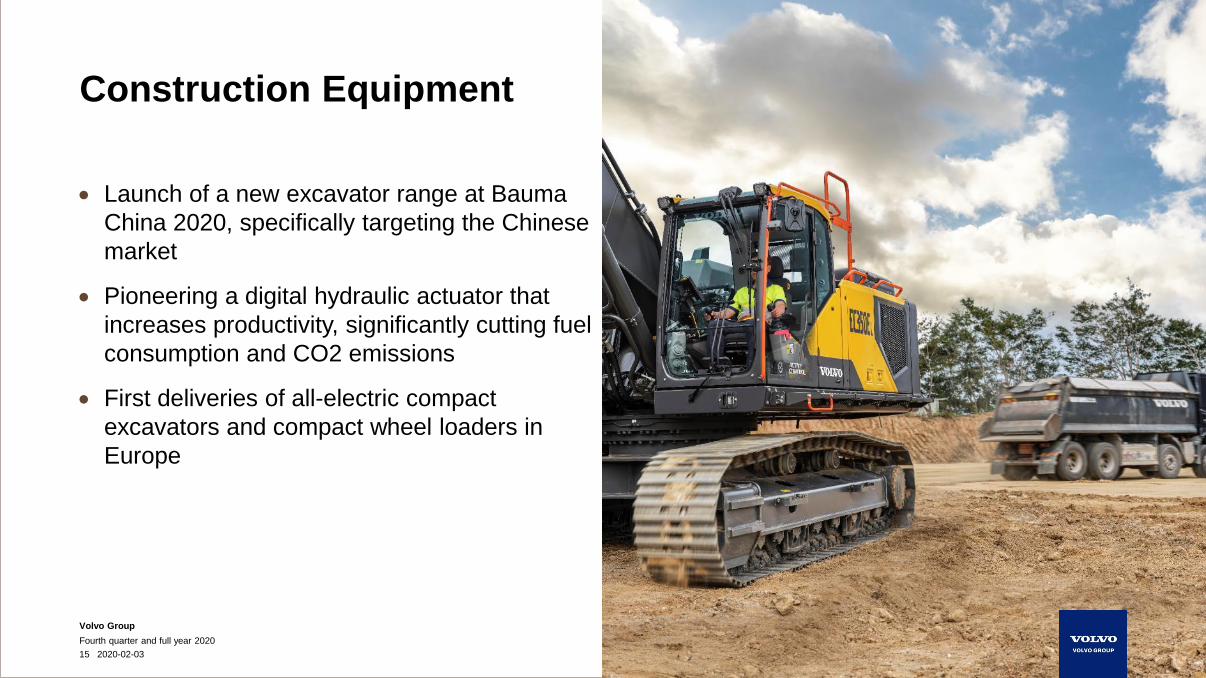
Construction Equipment
• Launch of a new excavator range at Bauma
China 2020, specifically targeting the Chinese
market
• Pioneering a digital hydraulic actuator that
increases productivity, significantly cutting fuel
consumption and CO2 emissions
• First deliveries of all-electric compact
excavators and compact wheel loaders in
Europe
Volvo Group
Fourth quarter and full year 2020
16 2020-02-03
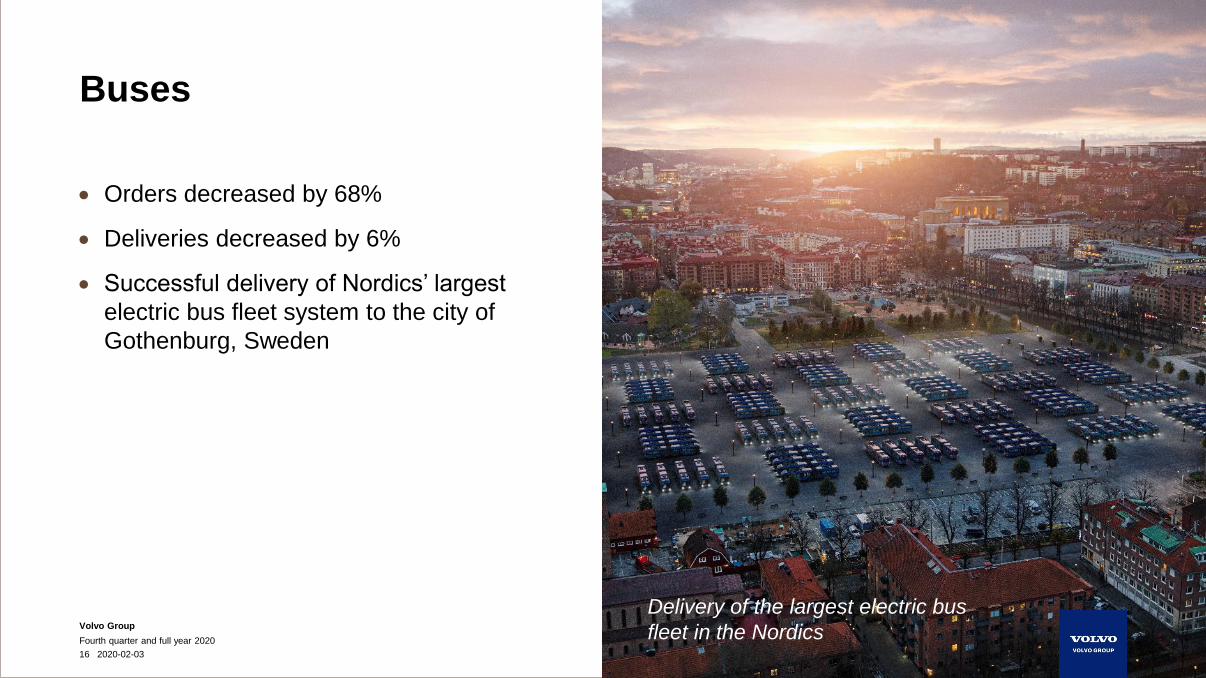
Buses
• Orders decreased by 68%
• Deliveries decreased by 6%
• Successful delivery of Nordics’ largest
electric bus fleet system to the city of
Gothenburg, Sweden
The largest order ever in terms of
value for Prevost. Delivery of the largest electric bus
fleet in the Nordics
Volvo Group
Fourth quarter and full year 2020
17 2020-02-03
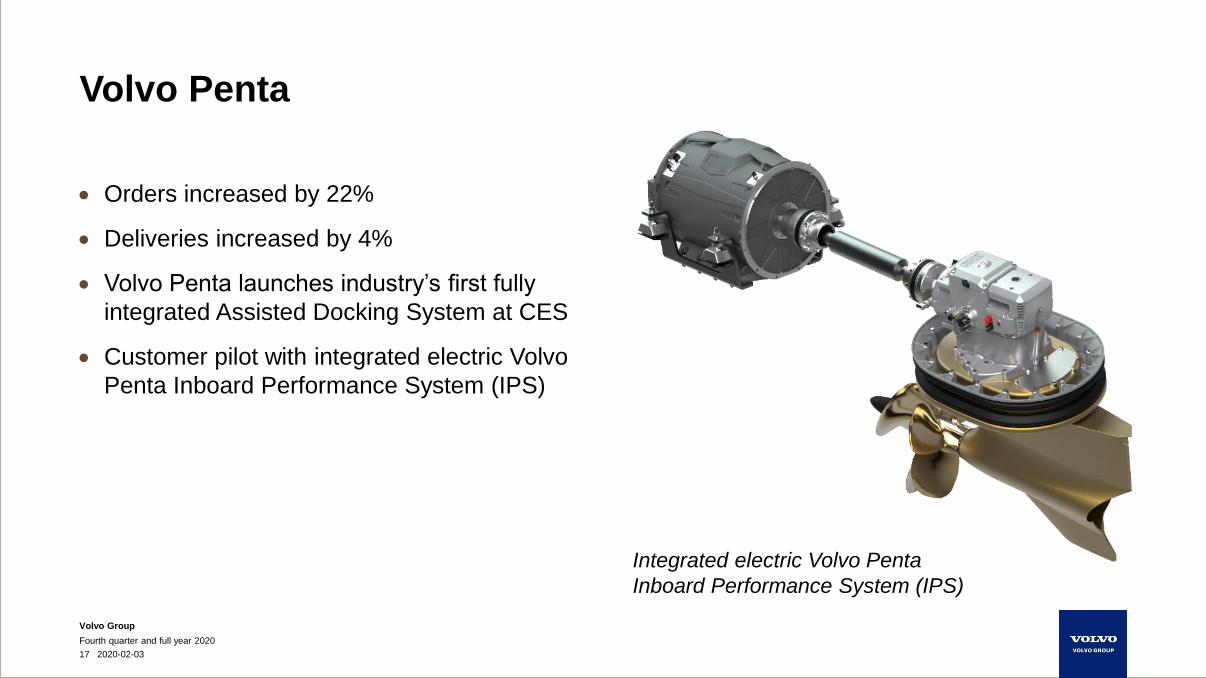
Volvo Penta
• Orders increased by 22%
• Deliveries increased by 4%
• Volvo Penta launches industry’s first fully
integrated Assisted Docking System at CES
• Customer pilot with integrated electric Volvo
Penta Inboard Performance System (IPS)
Integrated electric Volvo Penta
Inboard Performance System (IPS)
Volvo Group
Fourth quarter and full year 2020
18 2020-02-03
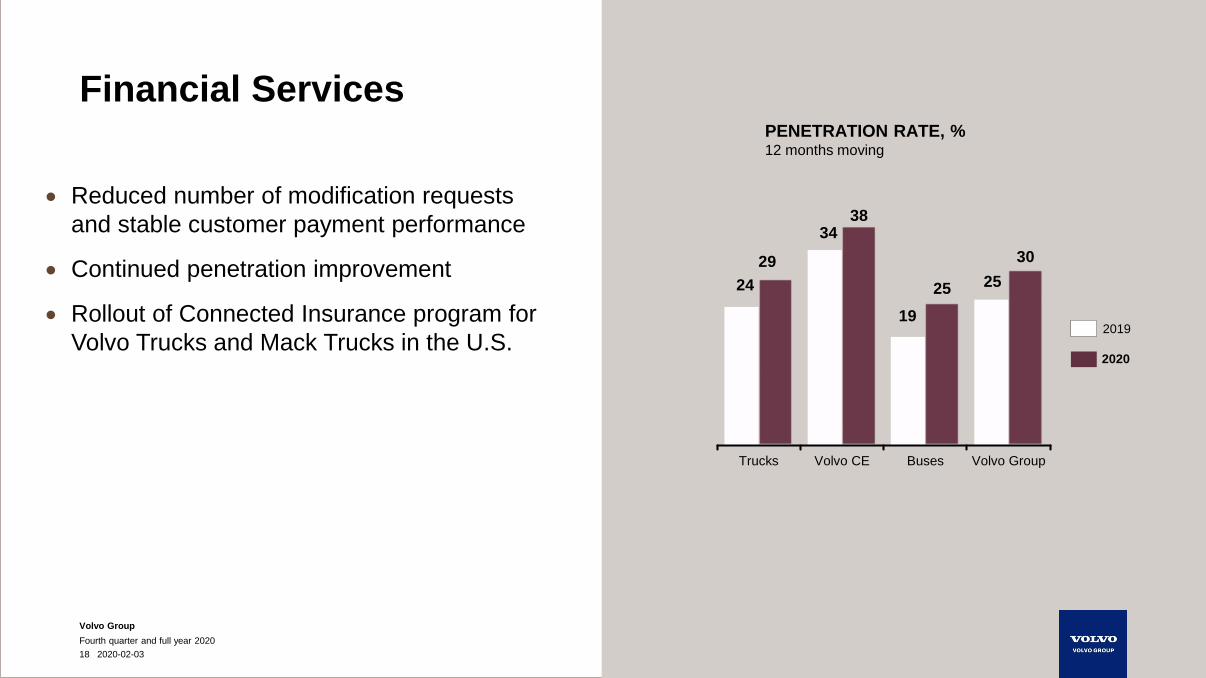
Financial Services
• Reduced number of modification requests
and stable customer payment performance
• Continued penetration improvement
• Rollout of Connected Insurance program for
Volvo Trucks and Mack Trucks in the U.S.
PENETRATION RATE, % 12 months moving
Trucks Volvo CE Buses Volvo Group
29
19
25 25
30
24
3834
2020
2019
Jan Ytterberg, CFO
FOURTH QUARTER 2020
Volvo Group
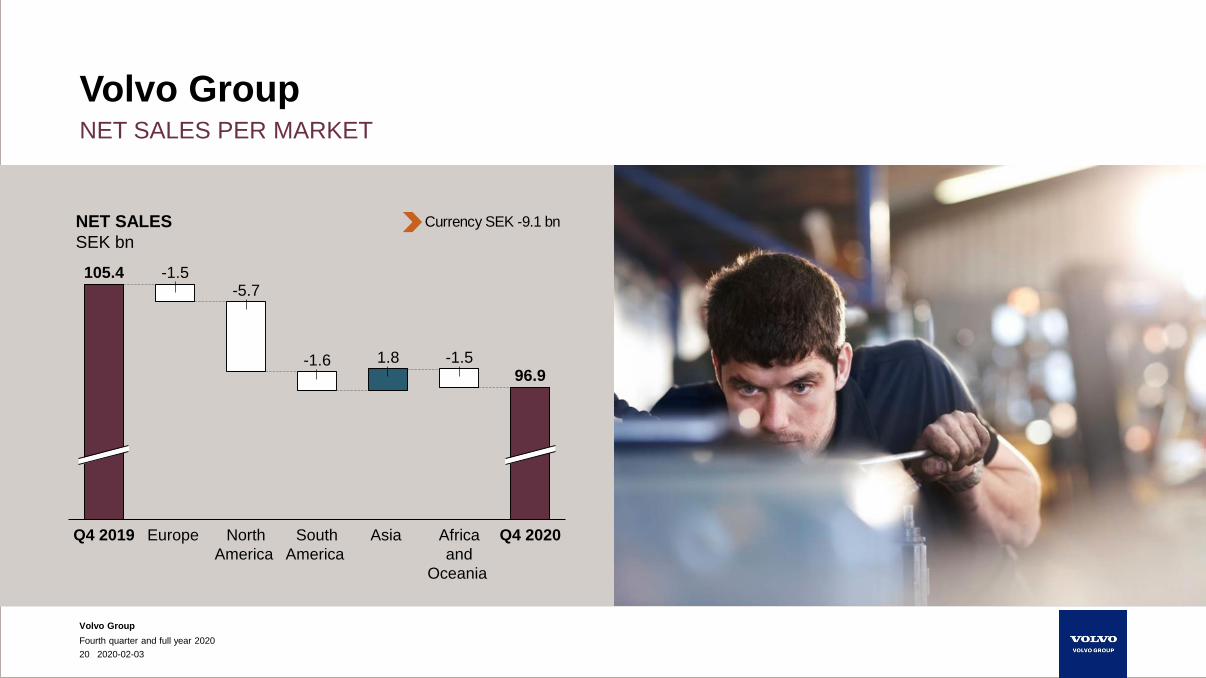
NET SALES PER MARKET
Fourth quarter and full year 2020
20 2020-02-03
Volvo Group
NET SALES
SEK bn
Q4 2019 Africa
and
Oceania
-1.5105.4
Europe
-5.7
Q4 2020North
America
-1.6
South
America
Asia
-1.596.9
1.8
Currency SEK -9.1 bn
Volvo Group
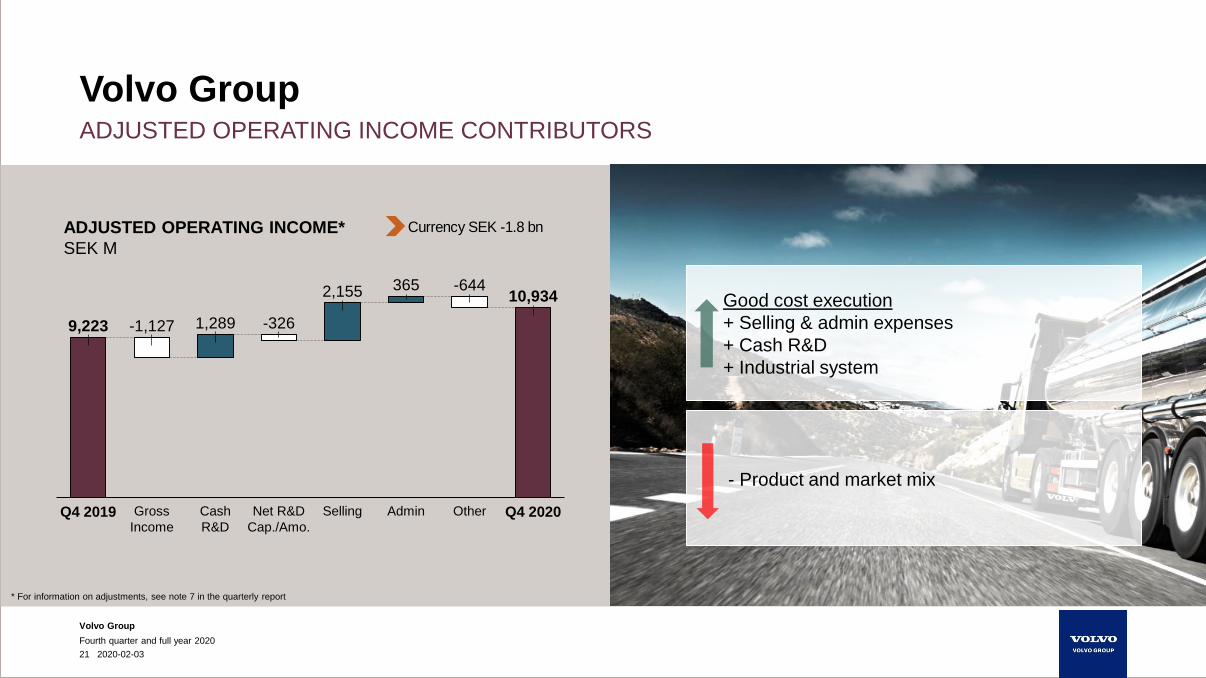
ADJUSTED OPERATING INCOME CONTRIBUTORS
Fourth quarter and full year 2020
21 2020-02-03
Volvo Group
ADJUSTED OPERATING INCOME*
SEK M
Good cost execution
+ Selling & admin expenses
+ Cash R&D
+ Industrial system
- Product and market mix
365
-1,127
Q4 2019 Cash
R&D
Gross
Income
-326
Net R&D
Cap./Amo.
Selling Admin
-644
Other Q4 2020
9,223 1,289
10,9342,155
Currency SEK -1.8 bn
* For information on adjustments, see note 7 in the quarterly report
Volvo Group
15.5
19.9 16.7
Q4 Q1 Q2 Q3 Q4 Q1 Q2 Q3 Q4
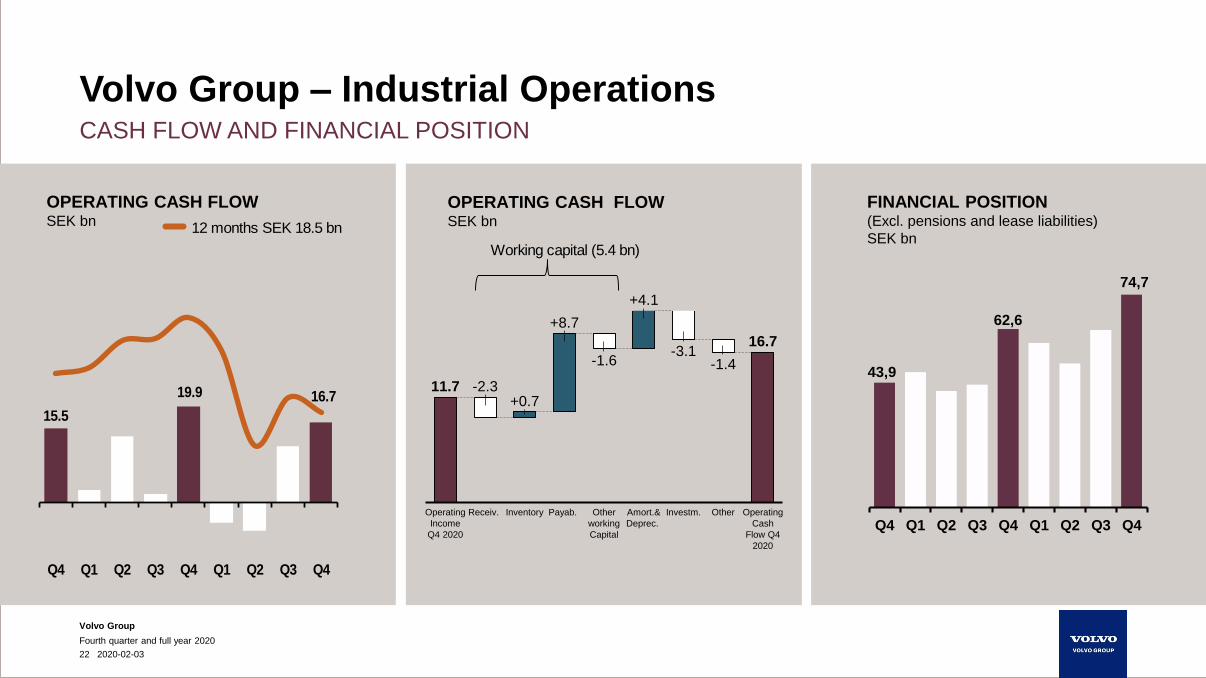
CASH FLOW AND FINANCIAL POSITION
Fourth quarter and full year 2020
22 2020-02-03
Volvo Group – Industrial Operations
OPERATING CASH FLOW SEK bn
OPERATING CASH FLOWSEK bn
-1.6
Other
working
Capital
Amort.&
Deprec.
11.7
Operating
Cash
Flow Q4
2020
-3.1
+8.7
+0.7
Operating
Income
Q4 2020
Other
-1.4
Payab.Inventory Investm.
-2.3
+4.1
Receiv.
16.7
12 months SEK 18.5 bn
Working capital (5.4 bn)
43,9
62,6
74,7
Q4 Q1 Q2 Q3 Q4 Q1 Q2 Q3 Q4
FINANCIAL POSITION (Excl. pensions and lease liabilities)
SEK bn
Volvo Group
6.2
8.0
Q4 2019 Q4 2020 Q4 Q1 Q2 Q3 Q4 Q1 Q2 Q3 Q4
ADJUSTED OPERATING INCOME
(margin)*SEK bn
68.5 68.2
61.9
Q4 Q1 Q2 Q3 Q4 Q1 Q2 Q3 Q4
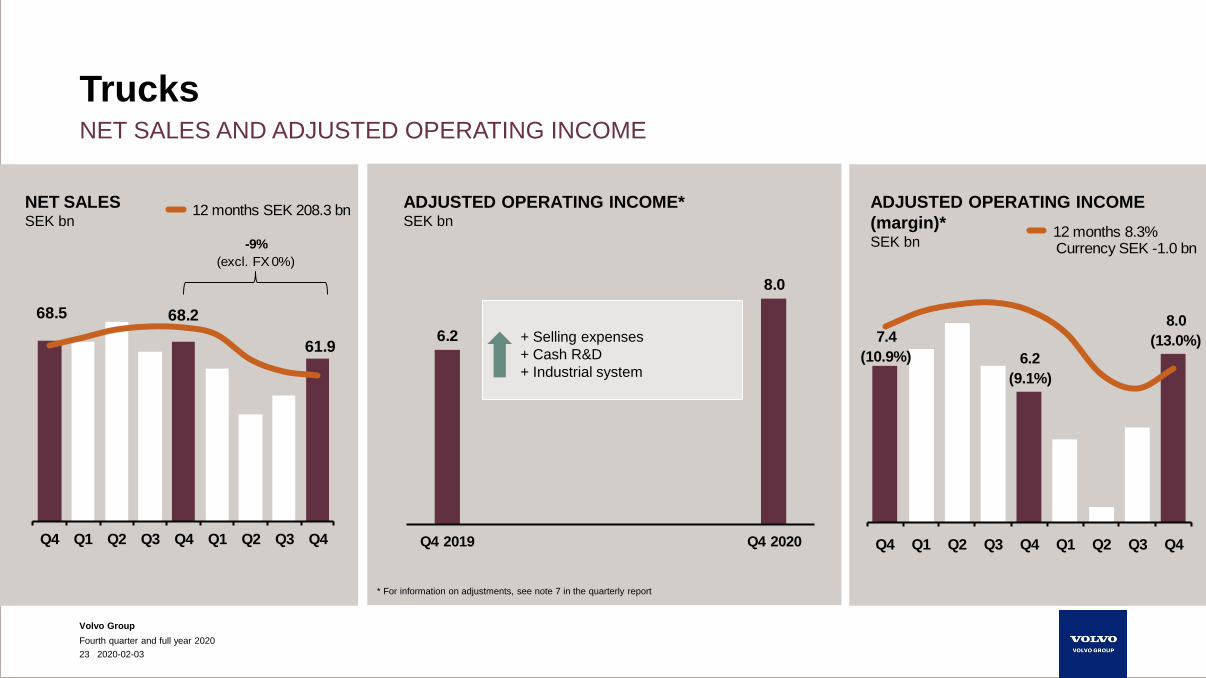
NET SALES AND ADJUSTED OPERATING INCOME
Fourth quarter and full year 2020
23 2020-02-03
Trucks
ADJUSTED OPERATING INCOME*SEK bn
+ Selling expenses
+ Cash R&D
+ Industrial system
NET SALESSEK bn
12 months SEK 208.3 bn
7.4
(10.9%) 6.2
(9.1%)
8.0
(13.0%)
12 months 8.3%Currency SEK -1.0 bn-9%
(excl. FX 0%)
* For information on adjustments, see note 7 in the quarterly report
Volvo Group
1.9
2.3
Q4 2019 Q4 2020 Q4 Q1 Q2 Q3 Q4 Q1 Q2 Q3 Q4
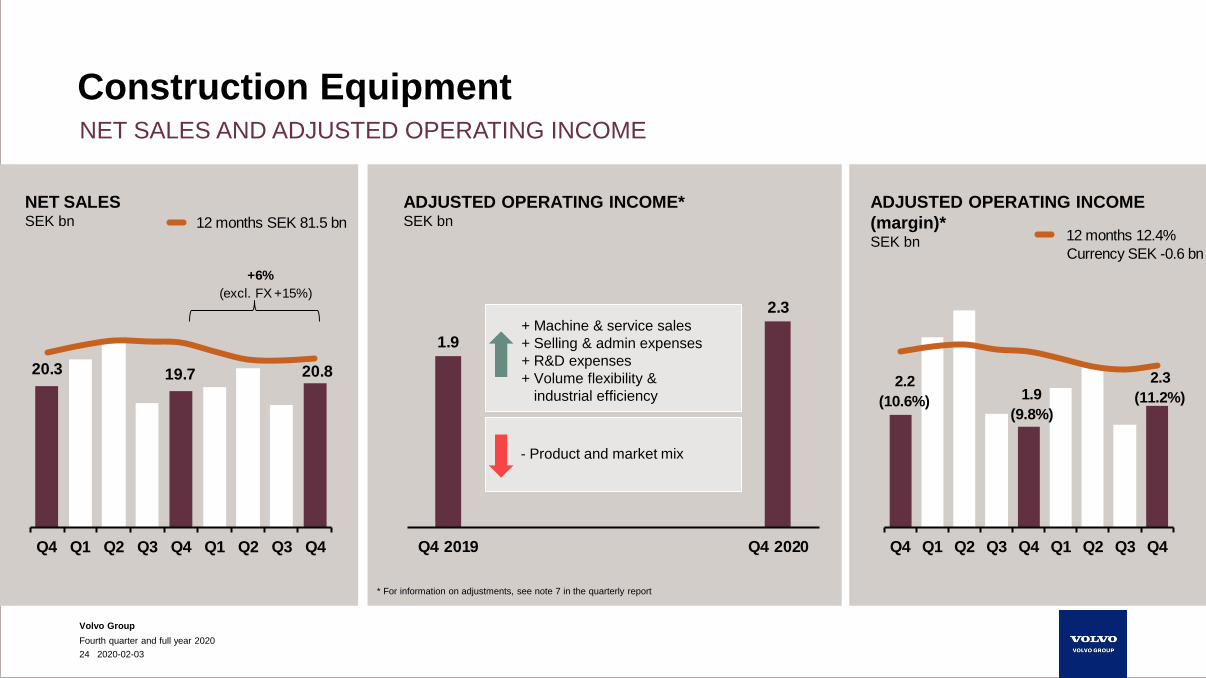
20.3 19.7 20.8
Q4 Q1 Q2 Q3 Q4 Q1 Q2 Q3 Q4
NET SALES AND ADJUSTED OPERATING INCOME
Fourth quarter and full year 2020
24 2020-02-03
Construction Equipment
12 months SEK 81.5 bn
2.2
(10.6%) 1.9
(9.8%)
2.3
(11.2%)
12 months 12.4%
Currency SEK -0.6 bn
+6%
(excl. FX +15%)
+ Machine & service sales
+ Selling & admin expenses
+ R&D expenses
+ Volume flexibility &
industrial efficiency
- Product and market mix
ADJUSTED OPERATING INCOME
(margin)*SEK bn
ADJUSTED OPERATING INCOME*SEK bn
NET SALESSEK bn
* For information on adjustments, see note 7 in the quarterly report
Volvo Group
Q4 Q1 Q2 Q3 Q4 Q1 Q2 Q3 Q4
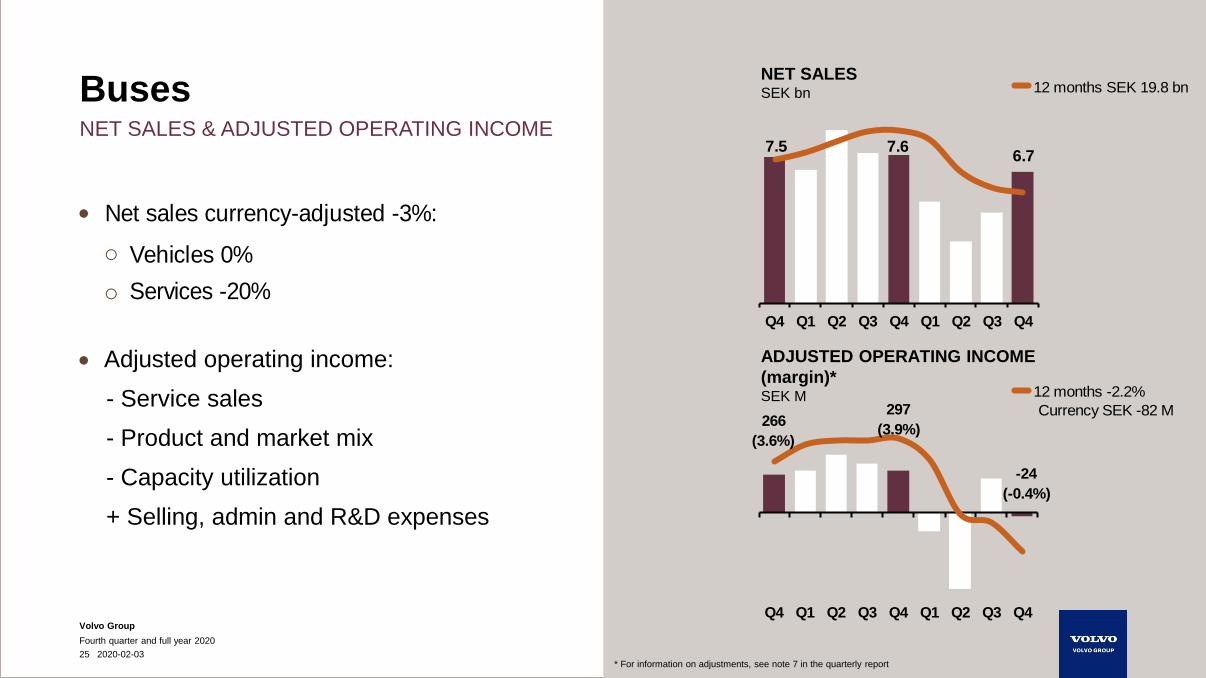
7.5 7.66.7
Q4 Q1 Q2 Q3 Q4 Q1 Q2 Q3 Q4
Fourth quarter and full year 2020
25 2020-02-03
•
o
o
• Adjusted operating income:
- Service sales
- Product and market mix
- Capacity utilization
+ Selling, admin and R&D expenses
NET SALES & ADJUSTED OPERATING INCOME
Buses
ADJUSTED OPERATING INCOME
(margin)*SEK M
NET SALES SEK bn
Net sales currency-adjusted -3%:
Vehicles 0%
Services -20%
12 months SEK 19.8 bn
266
(3.6%)
297
(3.9%)
-24
(-0.4%)
12 months -2.2%
Currency SEK -82 M
* For information on adjustments, see note 7 in the quarterly report
Volvo Group Q4 Q1 Q2 Q3 Q4 Q1 Q2 Q3 Q4
Fourth quarter and full year 2020
26 2020-02-03
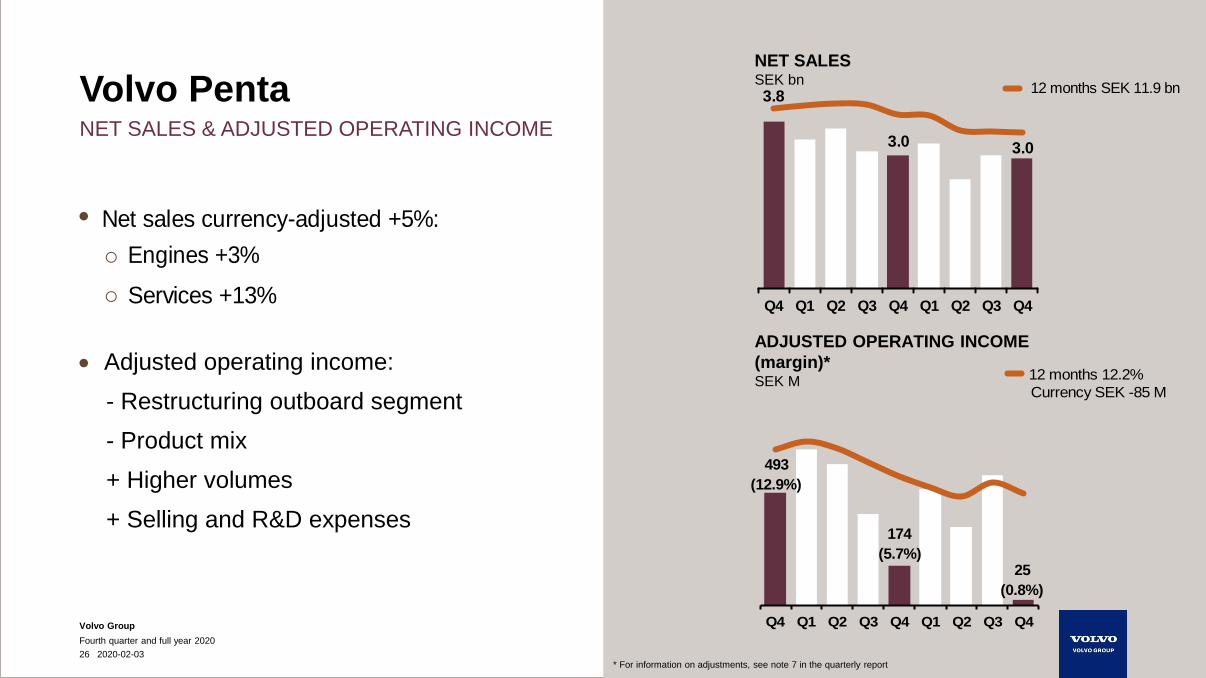
•
o
o
• Adjusted operating income:
- Restructuring outboard segment
- Product mix
+ Higher volumes
+ Selling and R&D expenses
NET SALES & ADJUSTED OPERATING INCOME
Volvo PentaNET SALES SEK bn
ADJUSTED OPERATING INCOME
(margin)* SEK M
Net sales currency-adjusted +5%:
Engines +3%
Services +13%
12 months SEK 11.9 bn
12 months 12.2%
Currency SEK -85 M
493
(12.9%)
174
(5.7%)25
(0.8%)
3.8
3.0 3.0
Q4 Q1 Q2 Q3 Q4 Q1 Q2 Q3 Q4
* For information on adjustments, see note 7 in the quarterly report
Volvo Group
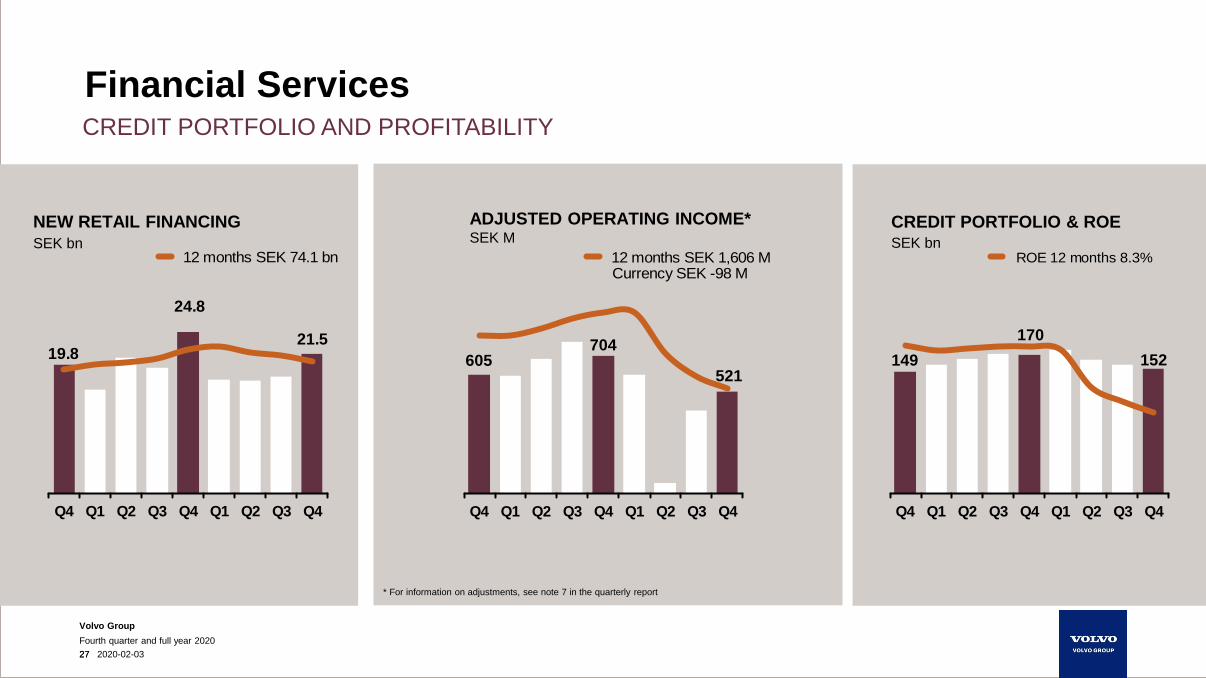
NEW RETAIL FINANCING
SEK bn
ADJUSTED OPERATING INCOME*SEK M
CREDIT PORTFOLIO & ROE
Financial ServicesCREDIT PORTFOLIO AND PROFITABILITY
SEK bn
27 2020-02-0327
Fourth quarter and full year 2020
19.8
24.8
21.5
Q4 Q1 Q2 Q3 Q4 Q1 Q2 Q3 Q4
605704
521
Q4 Q1 Q2 Q3 Q4 Q1 Q2 Q3 Q4
149
170
152
Q4 Q1 Q2 Q3 Q4 Q1 Q2 Q3 Q4
12 months SEK 74.1 bn 12 months SEK 1,606 MCurrency SEK -98 M
* For information on adjustments, see note 7 in the quarterly report
ROE 12 months 8.3%
Full year 2020
Volvo Group
Fourth quarter and full year 2020
29 2020-02-03
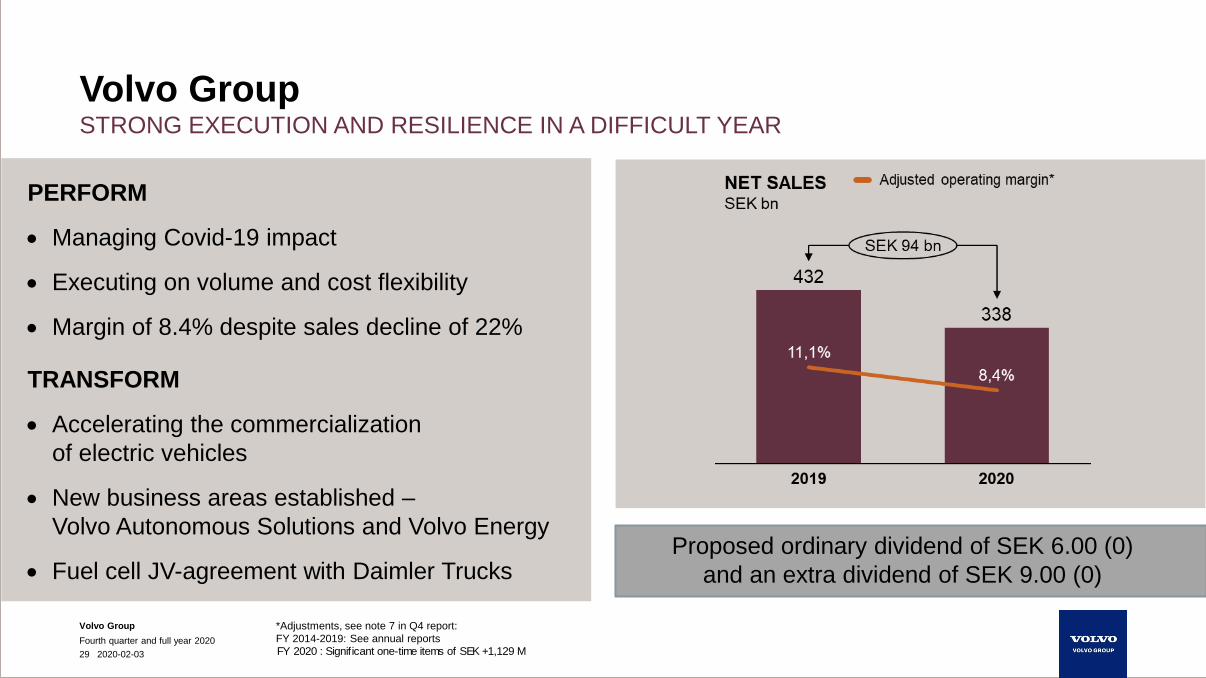
Volvo GroupSTRONG EXECUTION AND RESILIENCE IN A DIFFICULT YEAR
PERFORM
• Managing Covid-19 impact
• Executing on volume and cost flexibility
• Margin of 8.4% despite sales decline of 22%
TRANSFORM
• Accelerating the commercialization
of electric vehicles
• New business areas established –
Volvo Autonomous Solutions and Volvo Energy
• Fuel cell JV-agreement with Daimler TrucksProposed ordinary dividend of SEK 6.00 (0)
and an extra dividend of SEK 9.00 (0)
*Adjustments, see note 7 in Q4 report:
FY 2014-2019: See annual reports
FY 2020 : Significant one-time items of SEK +1,129 M
Volvo Group
Fourth quarter and full year 2020
30 2020-02-03
Q&A
Electrifying news from the
Volvo Group