Markov Chain Monte Carlo - Texas A&M University
43
Markov Chain Monte Carlo Debdeep Pati 1 / 43
Transcript of Markov Chain Monte Carlo - Texas A&M University

Markov Chain Monte Carlo
Debdeep Pati
1 / 43

knitr::opts_chunk$set(cache=TRUE)
2 / 43

Agenda
I MotivationI Markov chain Monte Carlo (MCMC)I Hard Discs in a Box ExampleI Metropolis AlgorithmI Example Applied to Normal-Normal
3 / 43

Intro to Markov chain Monte Carlo (MCMC)
Goal: sample from f (x), or approximate Ef [h(X )].
Recall that f (x) is very complicated and hard to sample from.
How to deal with this?
1. What’s a simple way?2. What are two other ways?3. What happens in high dimensions?
4 / 43

High dimensional spacesI In low dimensions, IS and RS works pretty well.I But in high dimensions, a proposal g(x) that worked in 2-D,
often doesn’t mean that it will work in any dimension.I Why? It’s hard to capture high dimensional spaces!
Figure 1: A high dimensional space (many images).
We turn to Markov chain Monte Carlo (MCMC).5 / 43

Intuition
Figure 2: Example of a Markov chain and red starting point
6 / 43

Intuition
Figure 3: Example of a Markov chain and red starting point
7 / 43

Intuition
Figure 4: Example of a Markov chain and moving from the starting pointto a high probability region.
8 / 43

What is Markov Chain Monte Carlo
I Markov Chain – where we go next only depends on our laststate (the Markov property).
I Monte Carlo – just simulating data.
9 / 43
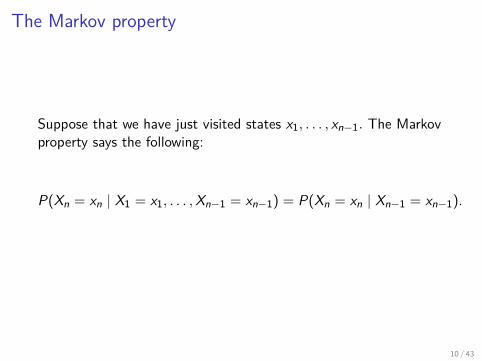
The Markov property
Suppose that we have just visited states x1, . . . , xn−1. The Markovproperty says the following:
P(Xn = xn | X1 = x1, . . . ,Xn−1 = xn−1) = P(Xn = xn | Xn−1 = xn−1).
10 / 43

Why MCMC?
(a) the region of high probability tends to be “connected”I That is, we can get from one point to another without going
through a low-probability region, and(b) we tend to be interested in the expectations of functions that
are relatively smooth and have lots of “symmetries”I That is, one only needs to evaluate them at a small number of
representative points in order to get the general picture.
11 / 43

Advantages/Disadvantages of MCMC:Advantages:
I applicable even when we can’t directly draw samplesI works for complicated distributions in high-dimensional spaces,
even when we don’t know where the regions of high probabilityare
I relatively easy to implementI fairly reliable
Disadvantages:
I slower than simple Monte Carlo or importance sampling (i.e.,requires more samples for the same level of accuracy)
I can be very difficult to assess accuracy and evaluateconvergence, even empirically
12 / 43

Hard Discs in a Box Example
Figure 5: Example of a phase diagram in chemistry.
Many materials have phase diagrams that look like the pictureabove. 13 / 43

Hard Discs in a Box ExampleTo understand this phenoma, a theoretical model was proposed:Metropolis, Rosenbluth, Rosenbluth, and Teller, 1953
Figure 6: Example of N molecules (hard discs) bouncing around in a box.
Called hard discs because the molecules cannot overlap.14 / 43

Hard Discs in a Box ExampleHave an X = (x , y) coordinate for each molecule. - Remark: Forthe rest of the lecture, X will denote the two coordinate vectors ofthe molecule.
The total dimension of the space is R2N .
Figure 7: Example of N molecules (hard discs) bouncing around in a box.
15 / 43

Hard Discs in a Box Example
X ∼ f (x) (Boltzman distribution).
Goal: compute Ef [h(x)].
Since X is high dimensional, they proposed “clever moves" of themolecules.
16 / 43

Hard Discs in a Box Example
Metropolis algorithm: For iterations i = 1, . . . , n, do:
1. Consider a molecule and a box around the molecule.2. Uniformly draw a point in the box.3. According to a “rule", you accept or reject the point.4. If it’s accepted, you move the molecule.
Uniformly = pick a point at random with equal probability to allother points in the box
17 / 43

Example of one iteration of algorithm
Consider a molecule and a box around the molecule.
Figure 8: This illustrates step 1 of the algorithm.
18 / 43

Example of one iteration of algorithm
Uniformly draw a point in the box.
Figure 9: This illustrates step 2 of the algorithm.
19 / 43

Example of one iteration of algorithmAccording to a “rule“, you accept or reject the point.
Here, it was accepted, so we move the molecule.
Figure 10: This illustrates step 3 and 4 of the algorithm.
20 / 43

Example of one iteration of algorithmHere, we show one entire iteration of the algorithm.
Figure 11: This illustrates one iteration of the algorithm.
After running many iterations n (not N), we have an approximationfor Ef (h(X )), which is 1
n∑
i h(Xi ).We will talk about the details later of why this is a “goodapproximation." 21 / 43

Some food for thought
We just covered the Metropolis algorithm (1953 paper).
I We did not cover the exact procedure for accepting or rejecting(to come).
I Are the Xi ’s independent?I Our approximation holds by The Ergodic Theorem
for those that want to learn more about it.I The ergodic theorem says: “if we start at a point xo and we
keeping moving around in our high dimensional space, then weare guaranteed to eventually reach all points in that space withprobability 1."
22 / 43

Metropolis Algorithm
Setup: Assume pmf π on X (countable).
Have f : X → R.
Goal:
a) sample/approximate from π
b) approximate Eπ[f (x)],X ∼ π.
The assumption is that π and or f (X ) are complicated!
23 / 43

Why things work!
Big idea and why it works: we apply the ergodic theorem.
“If we take samples X = (X0,X1, . . . , ) then by the ergodic theorem,they will eventually reach π, which is known as the stationarydistribution (the true pmf)."
24 / 43

Metropolis Algorithm
The approach is to apply the ergodic theorem.
1. If we run the Markov chain long enough, then the last state isapproximately from π.
2. Under some regularity conditions,
1n
n∑i=1
f (Xi )a.s−→ Eπ[f (x)].
25 / 43

Terminology
1. Proposal matrix = stochastic matrix (row sum is 1).
LetQ = (Qab : a, b ∈ X ).
Note: I will use Qab = Q(a, b) at times.2. Interpretation: X0,X1,X2, ... is a Markov Chain with
"transition density Q, if Q(a, b) = P(Xi+1 = b|Xi = a).3. Note:
π(x) = π̃(x)/z , z > 0.
What is known and unknown above? (Think back to rejectionsampling)
26 / 43

Metropolis Algorithm
I Choose a symmetric proposal matrix Q. So, Qab = Qba.
I Initialize xo ∈ X .I for i ∈ 0, 1, 2, . . . , n − 1:
I Sample proposal x from Q(xi , x).I Sample r from Uniform(0, 1).I If
r < π̃(x)π̃(xi )
,
accept and xi+1 = x .I Otherwise, reject and xi+1 = xi .
Output: xo, x1, . . . , xn
Comment: r is the rule for uniformly drawing a point in the box inthe.
You do not need to know the general proof of this.
27 / 43

Metropolis within a Bayesian setting
Goal: We want to sample from
p(θ | y) = p(y | θ)p(θ)m(y) .
Typically, we don’t know m(y) =∫
p(y | θ)p(θ)dθ.
The notation is a bit more complicated, but the set up is the same.
We’ll approach it a bit differently, but the idea is exactly the same.
28 / 43

Building a Metropolis sampler
Similar to before we assume a symmetric proposal distribution,which we call J(θ∗ | θ(s)).
I What does symmetry mean here? J(θa | θb) = J(θb | θa).I That is, the probability of proposing θ∗ = θa given thatθ(s) = θb is equal to the probability of proposing θ∗ = θb giventhat θ(s) = θa.
I Symmetric proposals include:
J(θ∗ | θ(s)) = Uniform(θ(s) − δ, θ(s) + δ)
andJ(θ∗ | θ(s)) = Normal(θ(s), δ2).
29 / 43

Metropolis algorithmThe Metropolis algorithm proceeds as follows:
1. Sample θ∗ ∼ J(θ | θ(s)).2. Compute the acceptance rule (r):
r = p(θ∗|y)p(θ(s)|y)
= p(y | θ∗)p(θ∗)p(y | θ(s))p(θ(s))
.
3. Let
θ(s+1) ={θ∗ with prob min(r,1)θ(s) otherwise.
Remark: Step 3 can be accomplished by sampling u ∼ Uniform(0, 1)and setting θ(s+1) = θ∗ if u < r and setting θ(s+1) = θ(s) otherwise.
Exercise: Convince yourselves that step 3 is the same as the remark!
30 / 43

A Toy Example of MetropolisLet’s test out the Metropolis algorithm for the conjugateNormal-Normal model with a known variance situation.
X1, . . . ,Xn | θiid∼ Normal(θ, σ2)
θ ∼ Normal(µ, τ2).
Recall that the posterior of θ | X1, . . . ,Xn is Normal(µn, τ2n ), where
µn = x̄ n/σ2
n/σ2 + 1/τ2 + µ1/τ2
n/σ2 + 1/τ2
andτ2
n = 1n/σ2 + 1/τ2 .
31 / 43

Toy Example
In this example: σ2 = 1, τ2 = 10, µ = 5, n = 5, and
x = (9.37, 10.18, 9.16, 11.60, 10.33).
For these data, µn = 10.03 and τ2n = 0.20.
Note: this is a toy example for illustration.
32 / 43

Toy example
We need to compute the acceptance rule r .
r = p(θ∗|x)p(θ(s)|x)
(1)
= p(x |θ∗)p(θ∗)p(x |θ(s))p(θ(s))
(2)
=( ∏
i dnorm(xi , θ∗, σ)∏
i dnorm(xi , θ(s), σ)
)( dnorm(θ∗, µ, τ)dnorm(θ(s), µ, τ)
)(3)
33 / 43

Toy example
In many cases, computing the rule r directly can be numericallyunstable, however, this can be modified by taking log r .
This results in
log r =∑
i
[log dnorm(xi , θ
∗, σ)− log dnorm(xi , θ(s), σ)
]+ [log dnorm(θ∗, µ, τ)]− log dnorm(θ(s), µ, τ).
Then a proposal is accepted if log u < log r , where u is sampledfrom the Uniform(0,1).
34 / 43

Toy example
We generate 500 iterations of the Metropolis algorithm starting atθ(0) = 0 and using a normal proposal distribution, where
θ(s+1) ∼ Normal(θ(s), 1).
We will then generate 10,000 iterations since 500 will not besufficient.
Figure~13 shows a traceplot for this run as well as a histogram forthe Metropolis algorithm compared with a draw from the truenormal density.
35 / 43

Code
# setting valuesset.seed(1)s2<-1t2<-10mu<-5;n<-5
# defining the datax<-c(9.37, 10.18, 9.16, 11.60, 10.33)# mean of the normal posteriormu.n<-( mean(x)*n/s2 + mu/t2 )/( n/s2+1/t2)# variance of the normal posteriort2.n<-1/(n/s2+1/t2)
36 / 43

Code (continued)####metropolis part######S = total num of simulationstheta<-0 ; delta<-1 ; S<-500 ; THETA<-NULLset.seed(1)
for(s in 1:S){## simulating our proposaltheta.star<-rnorm(1,theta,sqrt(delta))##taking the log of the ratio rlog.r<-( sum(dnorm(x,theta.star,sqrt(s2),log=TRUE)) +dnorm(theta.star,mu,sqrt(t2),log=TRUE) ) -( sum(dnorm(x,theta,sqrt(s2),log=TRUE)) +dnorm(theta,mu,sqrt(t2),log=TRUE) )if(log(runif(1))<log.r) {
theta<-theta.star}THETA<-c(THETA,theta) ##updating THETA## contains theta's that are accepted and rejected}
37 / 43

Code (continued)
## pdf## 2
38 / 43

Code (continued)
## pdf## 2
39 / 43

Traceplot and Histogram
0 100 200 300 400 500
56
78
910
11
iteration
θ
θ
dens
ity
8.5 9.0 9.5 10.0 11.0
0.0
0.2
0.4
0.6
0.8
1.0
1.2
Figure 12: Left: trace plot of the Metropolis sampler. Right: Histogramversus true normal density for 500 iterations.
40 / 43

Traceplot and Histogram
0 2000 4000 6000 8000
56
78
910
11
iteration
θ
θ
dens
ity
8.5 9.0 9.5 10.5 11.5
0.0
0.2
0.4
0.6
0.8
Figure 13: Left: trace plot of the Metropolis sampler. Right: Histogramversus true normal density for 10,000 iterations.
41 / 43

Traceplot
Given that we have looked at n = 500 iterations of the Metroplissampler, does it seem that our approximation is a good one?
What about n = 10, 000 iterations?
42 / 43

Questions you should be able to answer!
I What is the goal of Metropolis?I What is known and unknown?I What are good proposals?I What does the ergodic theorem say in words?I Are good proposals always easy to choose?I When would we use Metropolis over Importance sampling and
Rejection sampling?I What is a simple diagnostic of a Markov chain?I Are we guaranteed convergence of the Markov chain?
43 / 43