Marketing Research Proposal for Alaska Airlines/Virgin ... fileproposal will help assist in the...
43
Running head: MARKETING RESEARCH PROPOSAL FOR ALASKA AIRLINES 1 Marketing Research Proposal for Alaska Airlines/Virgin America IMC611 – Marketing Research & Analysis West Virginia University Dr. Robin Cobbey July 5 th , 2016
Transcript of Marketing Research Proposal for Alaska Airlines/Virgin ... fileproposal will help assist in the...

Running head: MARKETING RESEARCH PROPOSAL FOR ALASKA AIRLINES 1
Marketing Research Proposal for Alaska Airlines/Virgin America
IMC611 – Marketing Research & Analysis
West Virginia University
Dr. Robin Cobbey
July 5th, 2016

MARKETING RESEARCH PROPOSAL FOR ALASKA AIRLINES/VIRGIN AMERICA 2
TABLE OF CONTENTS
Introduction………………………………………………………………………............... 4
Background Information…………………………………………………………………... 4-7
The Industry……….…………………………………………………………………… 4-5
The Merger………………………………………………………………….…………. 5-6
Alaska Airlines…………………………………………………………......………...... 6
Virgin America…………………………………………………………………….…… 7
Research Problems, Questions, and Objectives………......………...…….........………….. 8-9
Study Design: Recommended Methodology………......………......……......………........... 9-10
Ethnographic Research Methodology…………………………………………............... 10-11
Survey Research Methodology ………………………………………………………... 11-12
Focus Group Methodology ……….…………………………………………………… 12-14
Sampling Plan………………………………………………………………….………….. 14-15
Data Collection Method and Processing ……………………………………......……….... 15-17
Proposed Marketing Research Facilities………………………………………………….. 18
Research Design: Data Analysis Plan………......………......………........………..……… 18-20
Deliverables………......………......………......………......………......……….................... 20-21
Timetable ………......………......………......………......………......………......………. 21
Appendix A……......………...……......………...……......………...……......……………... 22-24

MARKETING RESEARCH PROPOSAL FOR ALASKA AIRLINES/VIRGIN AMERICA 3
TABLE OF CONTENTS (Cont.)
Appendix B………......………......………......………..................................................... 25
Appendix C…..……………………………………………………….............................. 26-37
Ethnographic Research Screening Survey 26-29
Group A: Survey Screening Questions/Questionnaire 30-33
Group B: Survey Screening Questions/Questionnaire 33-37
Appendix D………………...…………………………………………….………........... 37
References………...………………………………………………………………......…
28-42

MARKETING RESEARCH PROPOSAL FOR ALASKA AIRLINES/VIRGIN AMERICA 4
Marketing Research Proposal for Alaska Airlines/Virgin America
A marketing research proposal such as this “presents the research objectives, research
design, timeline, and cost of a project" in regards to the solicitation's important objectives
(McDaniel & Gates, 2014, p. 59). It basically "offers a justification for the study, indicating why
the research is worth doing and how it will be carried out" and it's a "useful discipline for
clarifying early ideas and thoughts and drawing them (Heath, 2010, p. 148)." The purpose of this
document in particular is to understand the target demographic and preferences of Alaska and
Virgin America's frequent customers and non-customers when it comes to booking on e-
servicespaces or airline websites. The parties involved will be both airlines since it has been
announced that Virgin America has agreed to be bought by Alaska.
The first part of the study will entail cooperation between both airlines as an exploratory
ethnographic research involving two of their flights—one for each—will take place by switching
airline preferences of their preferred customers for first-time testing. We shall cast a wide net on
customers of different ages and backgrounds who frequently fly between San Francisco and Los
Angeles on Virgin America and Alaska Airlines. Secondly, internal CRM databases will be data
mined in order to acquire and sample respondents to participate in an online survey and first-time
user website testing. Finally, those still interested and available to join the focus group
discussions to take place in San Francisco and Los Angeles' Plaza Research Network facilities
will be assigned a date and time. Insight from qualitative and quantitative methods in this
proposal will help assist in the potential redesign of Alaska Airline's booking portal and
perfecting Virgin America's. Further insight on the customers' perceptions, feelings, and
judgments of both airlines' brand equity will also assist in their joint re-branding and future
marketing studies.
Background Information
The Industry. Commercial aviation takes on 5.1% of the entire US GDP and it
surmounts about $807.1 billion USD, with the total of "attributable" employment of 1,170,526
jobs in California alone (Airlines.org, 2012). According to Schmidt (2015) at Market Realist,
Alaska (ALK) is at the top of those airlines that meet the growing demand of traffic increasing

MARKETING RESEARCH PROPOSAL FOR ALASKA AIRLINES/VIRGIN AMERICA 5
by 10.4%, having right behind its close competitor JetBlue (JBLU), which met the increasing
demand by 8.4%. Virgin America covers the important routes of San Francisco, Los Angeles,
New York, Las Vegas, Dallas, and others (as Figure 4 shows on page 5), but is constantly
coming into troubles when finding new traffic routes and gates.
Figure1:RetrievedfromMarketRealist.com(2015)
The Merger. Virgin America agreed to be valued as US $4 billion worth in a buyout deal
with Alaska (Klick & Orszag, 2015). According to Walker (2016), the main implication of this
merger is that it will make it even harder for East coast brands like JetBlue to compete on the
West Coast (p. 14). The deal has been given the green light and Virgin's brand "name lender"
Richard Branson has actually little share in Virgin America.
The Alaska and Virgin America merger has fans and loyalists wonder if there will be a
loss of their "cool" when this happens. Krupnick (2016) mentions the case of a 29-year-old
Silicon Valley marketing manager Mrs. Bansal who describes why she loves Virgin America: “I
think of it as a young, hip airline. Alaska is more of a friendly aunt." As we can see, the
Millennial can attest to one of Alaska’s issues when compared to its past competitor. Either way,
when it comes “Diffusion of Innovations” learning curve—which is the rate in which technology
is adopted—demographics don’t matter as much as they could be across the board—which is
significant to our study.

MARKETING RESEARCH PROPOSAL FOR ALASKA AIRLINES/VIRGIN AMERICA 6
As Leff (2016) comments about an email communication to Virgin America's employees
by Alaska Airlines’ CEO Brad Tilden, Alaska actually has no intention of dropping the Virgin
label because it may be critical to keep the loyal customers. To understand the chosen timeline
for this marketing research proposal (shown in-depth the Time Table section), the merger's
timeline of becoming one single operating ticket can be shown on Figure 2 shown below.
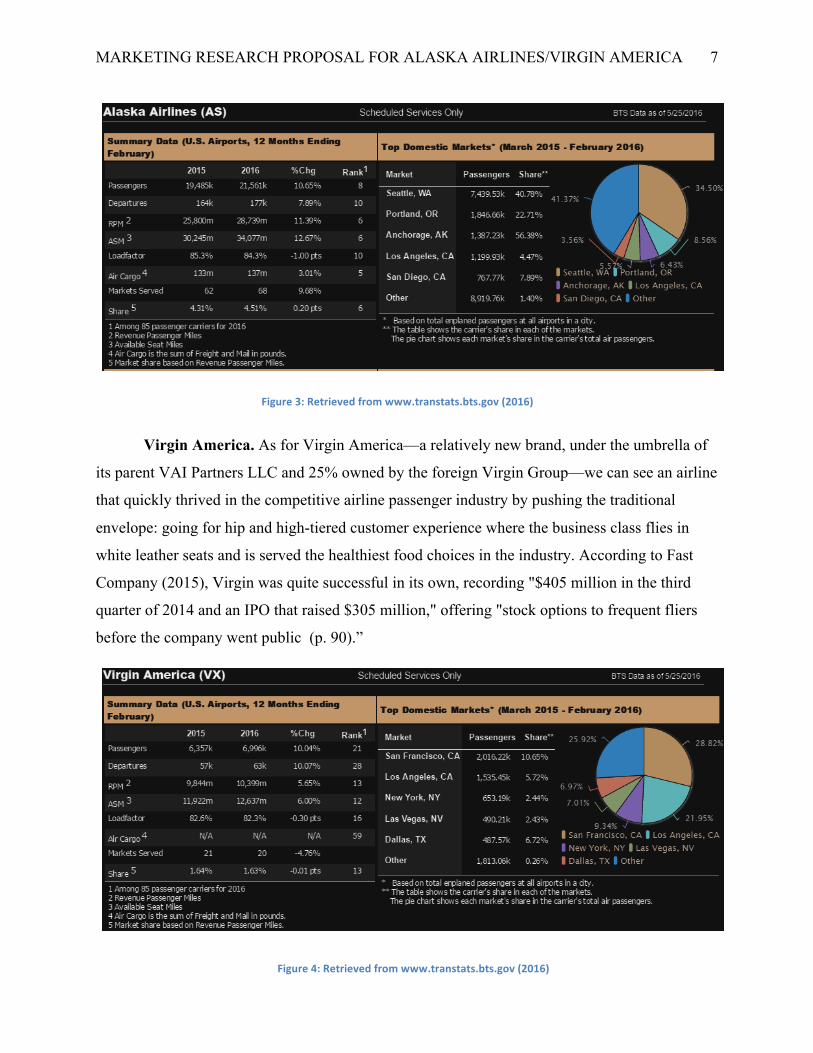
Alaska Airlines. Alaska Air Group—the holding company for Alaska Airlines and
Horizon Air—is a reputable domestic airline that has been in business since 1932. They focus on
service and catering to frequent flyers, providing air transportation services to 29 million
passengers in more than 100 cities in the United States, Canada, and Mexico—mainly in
Washington, Oregon, Idaho, and California. As Fitzpatrick (2015) mentions, it's isn't exactly a
"global megacarrier" nor an "ultra-low-cost carrier like Spirit," but it’s definitely known for its
"on-time ratings" as well as their airbuses which "tend to be newer, with an average age of 9.6
years (p. 108)." According to Schmidt (2015) at Market Realist, Alaska (ALK) is at the top of
those airlines that meet the growing demand of traffic increasing by 10.4%, having right behind
its close competitor JetBlue (JBLU), which met the increasing demand by 8.4%. Alaska recorded
revenues of $5,368 million in the financial year of 2014, an increase of 4.1% over FY2013
(MarketLine Company Profile, 2015, p. 3). Its domestic market share is significant in markets
such as: Seattle, Portland, Anchorage, Los Angeles, and San Diego (as shown by Figure 3).
Figure2:RetrievedfromBoardingArea.com(2015)
MARKETING RESEARCH PROPOSAL FOR ALASKA AIRLINES/VIRGIN AMERICA 7
Virgin America. As for Virgin America—a relatively new brand, under the umbrella of
its parent VAI Partners LLC and 25% owned by the foreign Virgin Group—we can see an airline
that quickly thrived in the competitive airline passenger industry by pushing the traditional
envelope: going for hip and high-tiered customer experience where the business class flies in
white leather seats and is served the healthiest food choices in the industry. According to Fast
Company (2015), Virgin was quite successful in its own, recording "$405 million in the third
quarter of 2014 and an IPO that raised $305 million," offering "stock options to frequent fliers
before the company went public (p. 90).”
Figure3:Retrievedfromwww.transtats.bts.gov(2016)
Figure4:Retrievedfromwww.transtats.bts.gov(2016)

MARKETING RESEARCH PROPOSAL FOR ALASKA AIRLINES/VIRGIN AMERICA 8
Research Problems, Questions, and Objectives
Management Decision Problem:
Should we keep both brand perceptions independent from each other as they grow under
one house (i.e., Alaska as the simple-looking choice and Virgin America as the slick, modern
one)?
The Research Question:
What is the perception of Alaska and Virgin America's e-servicespace and how does it
affect their purchase intent?
Marketing Research Problem:
• What are the pros and cons of making Alaska Airlines more like Virgin America, or vice
versa?
• Why do people choose Alaska Airlines and why do they choose Virgin America?
• Should the marketing decision be to market both brands "as is" in order to secure a
smooth transition?
Ethnographic Study Research Objectives:
• Find out what word associations and attributes go with each brand
• Draw out analogies—i.e., comparisons between Virgin America and Alaska
• With in-depth interviews, record and track how brand fans, advocates, and influencers
react to the opposite brand and find which characteristics are they willing to compromise
or trade in order to accept this brand as if it were their own.
Survey Research Objectives:
• Understand the website’s e-booking performance for first-time users
• Determine brand awareness, satisfaction level, purchase intent, and perception to both
brands independent from each other

MARKETING RESEARCH PROPOSAL FOR ALASKA AIRLINES/VIRGIN AMERICA 9
• Create a demographic study customers and non-customers
• With quantitative methods, record and track how brand fans, advocates, and influencers
react to the opposite brand and find which characteristics are they willing to compromise
or trade in order to accept this brand as if it were their own.
Focus Group Research Objectives:
• Dig deep into what the customer is willing to compromise from their preferred brands
(e.g., what enhancements do current Alaska users want? What adjustments do Virgin
America users are willing to accept?)
• Determine the best way to target each airline's customers according to their preferences
and see which aspects of both can be intermingled and strategically applied for improved
service.
Study Design: Recommended Methodology
Alaska’s most important domestic markets are in: Seattle, Portland, Anchorage, Los
Angeles, and San Diego; while Virgin covers: San Francisco, Los Angeles, New York, Las
Vegas, Dallas, Los Angeles, and San Diego, CA. If one were to create a focus group and
ethnographic study, the two converging places to do it would be Los Angeles and San Francisco.
For the first qualitative study, we will choose Alaska Airlines customers who will fly via Virgin
America, and vice versa (basically changing the preferred airline). They will be pre-screened
with a survey, witched of the airline of preference, and debriefed of the merger during the post-
flight in-depth interviews.
The quantitative aspect of the study will deal with website testing, questionnaire
surveying, and focus group discussions which will be transcribed and recorded to complement
the prior qualitative ethnographic study and posterior focus group. Quantitative methodical
research is a term “used loosely to refer to research whose findings are not subject to
quantification or quantitative analysis,” and even though it’s more costly and requires higher
samples, “there is no better way to understand the in-depth motivations and feelings of
consumers (McDaniel & Gates, 2014, p. 93-94).” Qualitative information is an exploratory
research approach that is useful when it comes providing insights in the understanding of the

MARKETING RESEARCH PROPOSAL FOR ALASKA AIRLINES/VIRGIN AMERICA 10
problem setting and focus groups are one of the most used qualitative research methods
(Malhotra, 2012, p. 149). McDaniel and Gates (2014) explain them further: they are "in-depth
discussions, usually consisting of 8 to 12 participants, which are led by a moderator and are
generally limited to one particular concept, idea, or theme" and are primarily "used for tactical
issues--reactions to stimuli such as ads, visuals, concepts, etc. (p. 95, 174).”
Ethnographic studies are very important qualitative methods as they help unveil new
questions and directions to take in further research. As Desai (2010) mentions, ethnographic
studies give insight into: retail navigation, product development, lifestyles and cultures, urban
ethnography, and habitual actions (p. 136-137). For the case of the Alaska-Virgin America
merger, ethnographic research part of the study will help produce a preliminary exploratory of
the chosen subjects and the narrative that follows their flight experience going from San
Francisco-LAX. The in-depth interviews with participants will take about 1.5-2 hours.
Ethnographic Research Methodology
The subjects for this explorative qualitative study in particular will be chosen after an 18
question screening survey (found on Appendix C) will single out those significant to the
research. They will basically go through the whole experience of flying from Los Angeles to San
Francisco, as in: checking in, going through TSA, hang out at the designated gate, access to the
business class lounge, etc. An A/B split test will look after the Alaska experience (for those
Virgin America loyalists) and the Virgin America experience (for those Alaska Airlines
loyalists). In-flight undercover moderators/ethnographers—who will be intertwined with normal
passengers—will record these brand advocates and fans' behaviors, reactions and interactions to
the opposite brand experience (e.g., Alaska loyalists will be asked to fly via Virgin America and
vice versa). For their time, these people will be compensated with $300 dollars, free miles, and
perks in the airline of their preference. Confidentiality agreements and ethnographic consent
forms will be signed by the participating subjects.
Ethnographic Research Criteria:
1. Male or Female

MARKETING RESEARCH PROPOSAL FOR ALASKA AIRLINES/VIRGIN AMERICA 11
2. Demographic: 18-54 year old, $30-200K household income, who work or live in San
Francisco and fly to Los Angeles frequently
3. Consumer: with authority in a particular field
4. Any traveler type: Budget, Standard, Customer Service Focused, Comfort Focused
5. Frequency of service: 2+ times a month
6. Available for the 1.5-2 hour post-flight interview session
Survey Research Methodology
Pre-screening Email Survey. The pre-screening survey should be short and will be sent
soon after a transaction has been placed, annexed to a follow-up booking notification email in
order to save time and money. The logic of the screening questions is to pick: male and female,
age group 25-35, frequent flyers (who fly 2+ times a month), disqualify those who work for
either airline, and also disqualify those who would not choose the either Virgin or Alaska as their
second choice. After the cluster sampling has be performed—dividing the two groups into four
clusters according to ages 18-24, 25-34, 35-44, 45-54—we will terminate those who: have
participated in a focus group within 6 months, work for either airline, would "definitely not"
choose the other airline as their second choice, and if they have participated in a focus group, to
make sure it had nothing to do with flying or airline booking. These potential respondents will be
cluster sampled from Alaska’s or Virgin America’s in-house CRM optimization and records
systems that match people who live in San Francisco or Los Angeles.
Website Testing. A week prior to the designated focus group date, the participants will
be asked to do a domestic flight "mock" booking by switching the airline of their choice via the
links provided in an email communication. No purchase is necessary, but participation is
imperative prior to attending the focus group. A working computer with the minimum requiring
application requirements may be necessary as well as disabling: AdBlocker, cookie-blocker,
Pop-up blockers, and enabling the latest version of Flash. A special cookie will track their moves
on the website until about the purchasing moment, when they will be prompted the web survey
questionnaire. Surveying companies like Quask, EZSurvey, and PollPro create some of the
survey software that can be used. We can view both portals on the Appendix A, which covers
secondary research.

MARKETING RESEARCH PROPOSAL FOR ALASKA AIRLINES/VIRGIN AMERICA 12
The Survey. The actual survey is carefully designed to have similar types of questions
close to each other for better understanding and flow. Questions 1-3 deal with the loyalty to their
preferred airline, questions 4-17 deal with their perception of the other airline, and questions 18-
23 are demographic and classifying. Question 24 would deal with the potential participation in
the focus group. It will have several types of questions: interval (dealing with loyalty index,
recommendation, satisfaction, happiness, and rating), ordinal, qualitative, explorative, and a few
demographic. More information on the terminology of the types of questions asked on the survey
is included on Appendix B (page 25 of this document). The participants will be compensated
with a $50 USD Amazon.com gift card.
Survey Research Criteria:
1. Male or Female
2. No Virgin/Alaska employees
3. Demographic: 18-54 year old, $30-200K household annual income
4. Consumer: with authority in a particular field
5. Any traveler type: Budget, Standard, Customer Service Focused, Comfort Focused
6. Frequency of service: 2+ times a month
7. Disqualify those who have participated in an airline-related survey in general or any
survey with the company in the last 6 months
8. Disqualify those who would not choose either Virgin or Alaska as their second choice.
Focus Group Methodology
Telephone Follow-up. The telephone follow-up will be short and just as another
screening method to corroborate participation in the study. Computer-assisted telephone
interviewing (CATI) will be of help to go through the questions in the screening survey again
with those who have shown continued interest after finishing the website test and survey. This
follow-up call will also coordinate further selection criteria which depends on time and
availability, considering: place of residence and work, working hours, available transportation to-
and-fro, and/or child care needs.

MARKETING RESEARCH PROPOSAL FOR ALASKA AIRLINES/VIRGIN AMERICA 13
Confirmation Letter. Focus group respondents should expect a confirmation letter in the
mail addressing their participation, time, place, date, parking instructions, public transportation
intersections, and length of stay in the focus group facility. Plaza Research Network has facilities
in San Francisco as well as in several Los Angeles’ locations, where the focus group study will
take place.
The Focus Group. The focus groups to be performed taking 1.5-3 hours in three
locations in Los Angeles and San Francisco via Plaza Research Network will be comfortable to
those attending and provide beverages and light snacks as well as full meal. There will be an
introduction to the session—as Figure shows—and a discussion outline will be followed.
Questioning the Focus Group. The Focus group discussion guide is found on Appendix
D of this document. The questions will include: deeper classifying and demographic, warm-ups,
transitions, and open-ended discussions. In addition, there will be questions with word
associations (i.e., when the "interviewer says a word and the respondent must mention the first
thing that comes to mind") and analogies that draw comparisons in terms of similarities
(McDaniel & Gates, 2014, p. 110-113). All notes will be formatted for data entry (i.e., according
Figure5:RetrievedfromElliot&Associates(2005)
MARKETING RESEARCH PROPOSAL FOR ALASKA AIRLINES/VIRGIN AMERICA 14
to proper coding so that it can be analyzed and reported). The assistant moderator will make sure
there is running video tape throughout the session, the consent forms are signed, and make sure
all participants participated in the mock e-booking experience with their submitted survey. It will
be important to uncover the brand loyalty level of the specific brand they usually use, whether
they are: fans, advocates, or potential influencers. This may give clue on the likelihood for them
recommend the brand they just tested among their friends, family, and social media followers.
Sampling Plan
Ethnographic Studies Sample
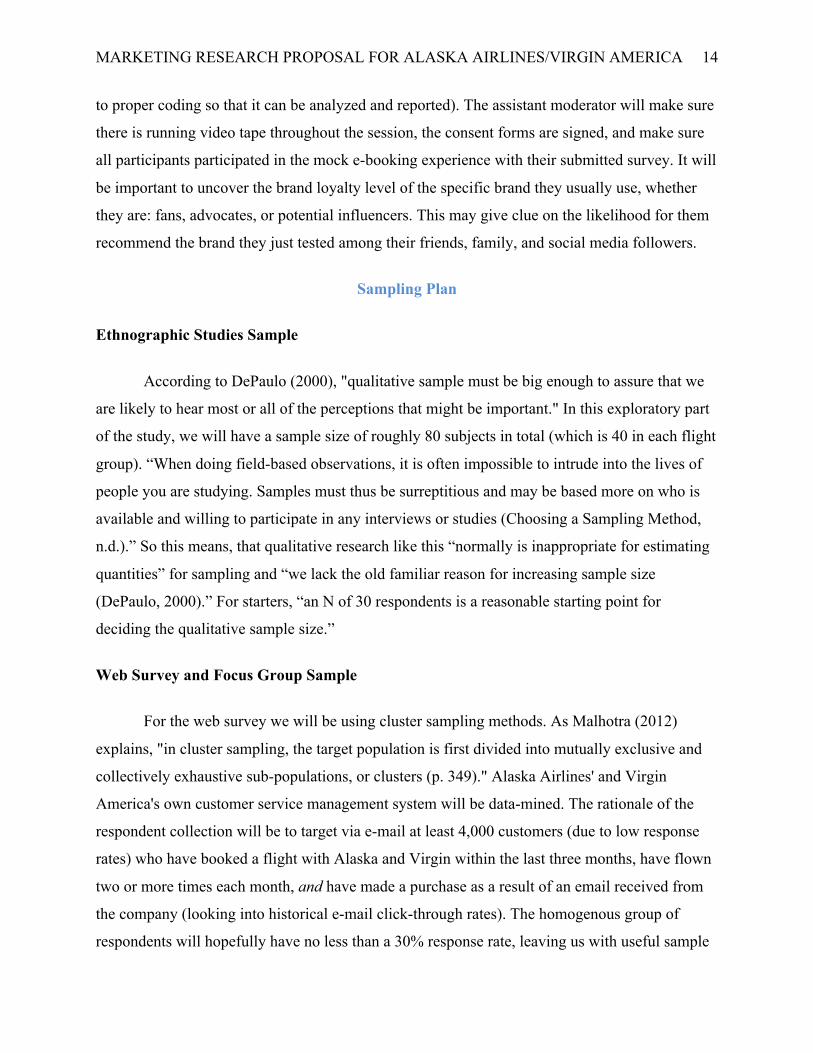
According to DePaulo (2000), "qualitative sample must be big enough to assure that we
are likely to hear most or all of the perceptions that might be important." In this exploratory part
of the study, we will have a sample size of roughly 80 subjects in total (which is 40 in each flight
group). “When doing field-based observations, it is often impossible to intrude into the lives of
people you are studying. Samples must thus be surreptitious and may be based more on who is
available and willing to participate in any interviews or studies (Choosing a Sampling Method,
n.d.).” So this means, that qualitative research like this “normally is inappropriate for estimating
quantities” for sampling and “we lack the old familiar reason for increasing sample size
(DePaulo, 2000).” For starters, “an N of 30 respondents is a reasonable starting point for
deciding the qualitative sample size.”
Web Survey and Focus Group Sample
For the web survey we will be using cluster sampling methods. As Malhotra (2012)
explains, "in cluster sampling, the target population is first divided into mutually exclusive and
collectively exhaustive sub-populations, or clusters (p. 349)." Alaska Airlines' and Virgin
America's own customer service management system will be data-mined. The rationale of the
respondent collection will be to target via e-mail at least 4,000 customers (due to low response
rates) who have booked a flight with Alaska and Virgin within the last three months, have flown
two or more times each month, and have made a purchase as a result of an email received from
the company (looking into historical e-mail click-through rates). The homogenous group of
respondents will hopefully have no less than a 30% response rate, leaving us with useful sample

MARKETING RESEARCH PROPOSAL FOR ALASKA AIRLINES/VIRGIN AMERICA 15
size group of 1200 respondents (N=600, one for each group: Virgin America and Alaska).
According to Malhotra (2012), the samples sizes used in marketing research studies like this that
deals with “product tests,” should have a minimum size of 200 (p. 340).
Sampling Units for the Focus Group. Alaska Airline's and Virgin America's customers
who fly frequently between Los Angeles and San Francisco will be divided into two separate
focus groups. The ideal size of a focus group is 8-10 subjects when they have minor knowledge
in the subject, in addition to the mediator and someone taking notes (Krueger & Casey, 2008, p.
68). The 200 participants will be divided according to the airline of preference (i.e., 100 for each
group), according to the four selected age groups, and finally making three groups out of those
25 people (i.e., which makes a total of 24 focus groups with the 8-10 subjects).
Execution. With a sampling error of 5% and confidence level of 95%, we can surely pick
a representative population for the product test and survey that will be done for the Alaska
Airlines’ and Virgin America’s website.
Data Collection Method and Processing
Presenting Ethnographic Studies Data
§ Coding: According Trochim (2006), it's the "process for both categorizing qualitative
data and for describing the implications and details of these categories" starting with
"open coding" to "selective coding." For example, relevant coding for our study would be
to follow: Booking Method - Ease of Transaction, Appearance of Comfort, Interaction
with Amenities, Interaction with Staff, and Appearance of Satisfaction. According to
Chambliss & Schutt (2012), "a well-designed chart, or matrix, can facilitate the coding
and categorization process (p. 212)." It can be a matrix of relationships with stakeholders
and the stakes
§ Memoing: Without discrimination or judgment, the ethnographers scattered in the flight
will take note of the flow of the events in their natural setting. Same goes to the in-depth
structured interviews post-flight where the two groups of 20-25 people each (for
budgetary purposes) will be asked general explorative questions about: the airline they

MARKETING RESEARCH PROPOSAL FOR ALASKA AIRLINES/VIRGIN AMERICA 16
just tested, sentiment towards it, their preferred booking method, purpose of the flight,
their thoughts on e-ticketing, and flying in general.
Presenting Focus Group Data
Each focus group should have its own file in synthesized spreadsheet data format,
preferably on Excel. Transcription involves getting rid of unnecessary words and arranging them
within a spreadsheet: One column for coding, one column for the participant ID#, one column
for responses (Elliot & Associates, 2005, p. 11). It is important to emphasize on powerful quotes
by arranging, re-arranging, and synthesizing several times, just as Figure 6 shows. A formal
focus group report includes: an "executive summary, background section, methods used, major
findings, conclusions, and recommendations (p. 13)."
Processing the Web-based Survey
Results from the online survey will be processed automatically and internally in the
system. It will save time, money, and the respondents will be already pre-selected. The data
collected will automatically be entered into the processing computer mode of coding after error-
checking and will be centralized under one Excel file. There will be five types of data:
categorical data (unordered labels), ordinal data (noncomparative scales), interval data
(predetermined set of ranges), ratio data (precise measurements), and website metadata (such as:
Figure6:RetrievedfromKrosnick&Presser(2010)

MARKETING RESEARCH PROPOSAL FOR ALASKA AIRLINES/VIRGIN AMERICA 17
location, time, idling time on each section, click road map until the final purchase, and other
website browsing). The questionnaire will target key issues that are of interest to Alaska Airlines,
such as: e-booking and technology adoption. As we know, airlines depend on reliable landing
websites where incoming loyal and new customers can purchase without difficulties airline
tickets of their choosing.
Proposed Marketing Research Facilities
The ethnographic study participants will be transferred to Plaza Research Network
research facility near LAX to be interviewed individually as part of the fieldwork part of the
study. Plaza Research Network is a high-end fully equipped focus group facility located minutes
from LAX with several conference rooms and observation rooms. This is a professional
environment that is conveniently located and has a professional presentation that will be
comforting to those who will participate in the ethnographic and focus group study. It has
facilities in San Francisco as well as in several Los Angeles’ locations that will be used for the
focus group section of the study. Also, a shuttle service will be provided and/or travel expenses.
PLAZA RESEARCH NETWORK
http://www.plazaresearch.com/
6053 West Century Boulevard Suite #100
Los Angeles, California, 90045
Phone: (310) 645-1700
55 Stockton St #400, San Francisco, CA 94108
Phone: (415) 984-0400
Figure7:RetrievedfromGreenbook.org(2016)

MARKETING RESEARCH PROPOSAL FOR ALASKA AIRLINES/VIRGIN AMERICA 18
Research Design: Data Analysis Plan
§ H1: Millennials are well-adapted to technological and design changes and Alaska’s
website would benefit from it.
Differences Analysis. This type of statistical analysis method in crosstab form can help to
make comparisons between populations. As Burns & Bush (2003) mention, the comparisons
should be: significant, meaningful, stable, and actionable in marketing and management decision
terms (p. 489-491). Sometimes, people can categorize as “frequent flyers,” but are not members
of particular loyalty plan. With this method, it would be useful to compare the four segments of
the sample population according to age group (i.e., 18-24, 25-34, 35-44, and 45-54) and their
subscription to frequent flying plans. Also, it would be good to visually see in crosstab format
the importance of aesthetics vs. functionality of servicespaces (mentioned in the Likert scale and
Stapel scale questions) according to age group. This way, the actionable thing to do after seeing
the results would be to decide if making changes to Alaska Airline's booking platform is
necessary or not according to each demographic.
§ H2: Satisfaction with airline's servicescapes can be explained in terms of the “quality of
experience” (significant: scoring high in five elements of the Stapel scale).
§ H3: Low satisfaction with airline's servicescapes can be explained in terms of the
“quality of experience” quality (not significant: scoring low in the five elements of the
Stapel scale).
§ H4: Purchase intent is related to airline's servicescape satisfaction (i.e., significant:
scoring high on purchase intent questions = with probably & definitely answers).
Descriptive Statistics. These are simple statistic analyses that take on measures of central
tendency and dispersion, which can be: range, variance, standard deviation, mode, median, and
mean. The Likert scale data in our survey is composed of a series of four or more Likert-type
questions that combine into a one score/variable that measure one trait, which is website
aesthetic importance in this survey; for this reason, not only mean and standard deviation can be
used, but also: "Pearson's r, t-test, ANOVA, and regression procedures (Boone & Boone, 2012)."
As for the Likert-type questions in the survey, these can be studied "standalone" by using simple

MARKETING RESEARCH PROPOSAL FOR ALASKA AIRLINES/VIRGIN AMERICA 19
descriptive statistics of central tendency, variability, and associations with: “median/mode,
frequencies, Kendall tau B or C, and Chi-square.”
Chi-square Statistic: Proportions. Chi-square analysis (χ2) tests the statistical significance
of the observed association in a crosstabulation (describing two or more variables
simultaneously). It demonstrates if a systematic association exists between two variables. In this
case, we’d like to know if there is a positive relationship between the combined statistic for the
website's “quality of experience” Stapel scale (which measures: Aesthetic, Ease of Navigation,
Site Organization, Clarity of Information Provided, and eTrust) and the combined statistic of
“website preferences” of the Likert scale. The formula is:
𝑥! =!"" !"##$
𝑜 − 𝑒 !
𝑒
§ H5: Purchase intent is positively related to the website’s “quality of experience” (i.e.,
significant: scoring high on purchase intent questions = with probably & definitely
answers; scoring high on quality of experience Stapel scale).
§ H6: Purchase intent is positively related to the website’s “quality of experience” and
“website’s preferences” (i.e., significant: scoring high on purchase intent questions;
scoring high on quality of experience Stapel scale; scoring high on website’s preferences
Likert scale).
Coefficient of Determination. With the coefficient of determination, r2 one can measure the
strength and significance of association between price sensitivity and those achieving a high
value coefficient in the “quality of experience.” The formula is:
𝑅! = SSyy − SSESSyy
=!!"" !!""
− !!"!!""
−1- !!"!!""
Linear Regression Analysis. This is a test that involves associating a single metric-
dependent variable (i.e., purchase intent, discriminating "probably" and "definitely would"
answers) and one independent variables (i.e., combined statistic for the website's “quality of

MARKETING RESEARCH PROPOSAL FOR ALASKA AIRLINES/VIRGIN AMERICA 20
experience” in terms of Aesthetic, Ease of Navigation, Site Organization, Clarity of Information
Provided, and eTrust). The formula is:
Y = a + b1X1
Multiple Regression Analysis. This procedure for examines the differences one single
metric-dependent variable of purchase intent i.e., purchase intent, discriminating "probably" and
"definitely would" answers) and two or more independent variables (i.e., the combined statistic
of “website preferences” of the Likert scale and combined score of the “quality of experience” of
the Stapel Scale). The formula is:
Y = a + b1X1 + b2X2.
Deliverables
• Diagrams for the Ethnographic Studies: These can be made by the researchers after
the interview sessions in order to record key responses and sequence of actions that are
commonly seen by different passengers. This can help perfecting the survey questions.
For example, diagrams can go from: ticketing, TSA check, gate arrival, boarding, flight
prepping, departure, in-flight, arrival.
• Ethnographic Study Conclusions: A final thing to ask about the ethnographic study and
its respondents is the credibility, authenticity, spontaneity of their reactions and
comments, also putting to question their reactions to being observed and being part of the
ethnography.
• Crosstabs and Banners. Cross-tabulations and contingency table matrices are useful
when comparing two or more parameters for better visual and understanding purposes.
As a sample table shows below, these can help produce a good picture of differences
analysis and other statistical inferences.

MARKETING RESEARCH PROPOSAL FOR ALASKA AIRLINES/VIRGIN AMERICA 21
Timetable
Considering the timetable released by Alaska Airlines’ CEO shown on page 5, Figure 2
(which mentions how Q1 2017 will be the period of adjustment until Q2 2018), this is the list of
projected dates with respect to this MRP:
1. July 8, 2016 - Ethnographic Research Pre-screening
2. August 3rd 2016 Ethnographic Research Chosen Shortlist
3. August 10 2016 - Ethnographic Research Confirmation Letter Sent
4. August 18-20 2016 - Ethnographic Research Tentative Dates
5. August 25 2016 - Ethnographic Research Transcription and Synthesis
6. August 31 2016 - Ethnographic Research Report
7. September 2nd Marketing Team Reconvenes To Consider Ethnographic Research Insight
8. September 6th 2016 - Survey Pre-screener is Sent
9. September 10-15 2016 - Website and Survey Tests are sent and finalized
10. September 18-21 2016 - Focus Group Telephone Follow-up Calls
11. September 24 2016 - Focus Group Groups Confirmation Letter Sent
12. October 3-27 2016 - Focus Groups Tentative Dates
13. November 30 2016 - Ethnographic and Focus Group Finalized Report Due Date
Figure8:DataStar,Inc.CrosstabRetrievedfromGreenbook.org(2011)

MARKETING RESEARCH PROPOSAL FOR ALASKA AIRLINES/VIRGIN AMERICA 22
Appendix A
Secondary Research
Digital and Social Media Reach. Digital media and social media-wise, both brands
record high online traffic. According to Quantcast—a tech company that specializes in audience
measurement and advertising—Virgin America’s website reaches about 410.1K U.S. monthly
people while Alaska’s website reaches over 1.8 million U.S. monthly people (Quantcast.com,
2016). Alaska’s Twitter and Facebook reach 183K followers and 673K likes, while Virgin
America’s Facebook and Twitter reaches 774K followers and 683K likes. While Alaska Airlines
may be quite savvy in social media customer relations management—aided by Sparkcentral, a
social media platform—Virgin Airlines has been able to reinvent social media ROI in all social
media technologies, including Instagram and Youtube by reaching out to those influencers and
fans who actually end up doing the work for them (Sparkcentral, 2014; Nash, 2014).
Airline Ratings. Virgin America and Alaska rank low in cancellations and delays,
targeting low-cost customers all the way to high-paying business class loyalists. According to a
mid-2012 Air Travel Consumer Report, Alaska Airlines had the second-to-highest percent of
arrivals on time at 88.5%, Virgin America being at 81.7% (AirConsumer.Dot.Gov, 2012). In
addition, according to a survey among domestic coach passengers and first-class passengers by
Consumer Reports National Research Center (with questions about "width and comfort, legroom,
Figure9:RetrievedfromFacebook.com(2016) Figure10:RetrievedfromFacebook.com(2016)

MARKETING RESEARCH PROPOSAL FOR ALASKA AIRLINES/VIRGIN AMERICA 23
room for carry-on bags, cabin and restroom cleanliness, check-in ease, service from the airline
staff, in-flight entertainment, and transparency about fees") it was found that Virgin America had
favorable scores for "their check-in, their staff service, and upfront disclosure about their fees"
and both Virgin America and Alaska earned exceptional overall score in first-class, except for
Alaska's entertainment aspect (Walker, 2015). This means that Alaska may have to work on its
entertainment offerings, but overall it performs pretty well across the board when it comes to
coach and first-class ratings. Virgin America’s highest ratings come from first-class customers
and may need to work on its coach perceptions. Conjoining the best of both airlines will only
help both in the long run.
Booking Portals Comparison
Alaska Airlines’ Booking Portal. As we can see on Figure 11, Alaska's landing page
goes straight to the pricing appeal, the nitty-gritty booking form, and the welcoming phrase and
picture. It's more about the destination and the deal and less about the sophisticated design. The
Masthead contains the logo and just a few yet very legible options: SIGN IN, CART,
CONTACT US, and ESPAÑOL. The top navigation contains critical few links to easily navigate
the website: Book - Explore - Travel info - Mileage Plan™ - Ask Jenn. The content area shows
off "Deals from $62 one way" that stands out in bold and size, utilizing a welcoming phrase that
says: "Welcome. Let's go somewhere," and that contains a standard fill-out form widget to book,
check-in, check flight status, and manage reservations. All is according to the standards of
functional and responsive web design. Then, the rest is inundated with images of attractive
destinations. The call-to-action section is pretty straightforward: sign up for email updates, chat
with a rep, download mobile app, and apply for the credit card (which is repeated twice). The
contact section at the bottom shows in a very clear fashion the: About section, Customer Service
(Ask Jenn), Products and Services, and Social Media links.
Virgin America’s Booking Portal. On Figure 12, we can clearly see that Virgin
America’s landing page is simpler, fun, and colorful and is more about the appeal of the airline
as a commodity (with all its added features) and secondly, about the destination. It seems like it
makes "the way" of getting to the final destination more appealing than the actual destination.
The masthead contains the logo and it too many options next to it: BOOK, CHECK IN,

MARKETING RESEARCH PROPOSAL FOR ALASKA AIRLINES/VIRGIN AMERICA 24
MANAGE (in caps), Deals, Flying With Us, Where We Fly, Fees, Flight Status, Flight Alerts,
Sign In, and Sign Up (it doesn't contain the ESPAÑOL option). The content area goes right into
booking with the question: Where would you like to go? As Johnson (2015) truthfully mentions,
"the copywriting is friendly" but its "simple interface" deceives because it is "so simple that it
might be frustrating." Then the part B of the content area goes into travel deals, partnerships, and
credit card options (that have a cool caricature design, but aren't too clear). The call-to-action
section is confusing and it's mixed with About Us, Corporate Rewards, Points, News and
Updates. The contact section is way at the bottom, just as Alaska's, but it's rather hard to skim
through with the poor arrangement and typography. Both websites like to teach about their
products and services by using "learn more”.
Figure11:RetrievedfromAlaskaAir.com(2016)
Figure12:RetrievedfromVirginAmerica.com(2016)

MARKETING RESEARCH PROPOSAL FOR ALASKA AIRLINES/VIRGIN AMERICA 25
Appendix B
Types of Survey Questions
• Screening questions “rule out” those who won’t be significant to our study and will only
increase the margin of error. It’s important to ask if they have participated in a focus
group within the last six months as “fresh participants (McDaniel & Gates, 2014, p.
102).”
• Interval questions let us statistically measure frequencies, percentages, range, means,
variance and standard deviation of opinions and attitudes, plus "they can measure how
much of a trait one consumer has (or does not have) over another (McDaniel & Gates,
2014, p. 228)." Each point in the 5-point scale covers 20%, the middle being neutral. In
this questionnaire, we use itemized rating scales that measure: attitude, satisfaction,
score, loyalty, familiarity, ease of use, etc.
• The Rensis Likert scale is a noncomparative monadic method that measures the degree
of agreement with a statement having end points typically as “strongly disagree” and
“strongly agree" (Malhotra, 2012, p. 276-279). Statistically speaking, Likert scale data
can have the parametric analysis of variance techniques that include: t-test, ANOVA, and
regression procedures (Analyzing Likert Scale/Type Data, n.d.).
• The Stapel scale, a noncomparative monadic method named after Jan Stapel, is
presented vertically, with one adjective appearing at the midpoint of a scale ranging from
+5 to –5. It doesn’t allow neutral responses, so this forces the respondent to have either
negative or positive values which in turn will show clear review scores.
• Ordinal questions help give a rank and help create the “transitivity postulate”
assumption that the first chosen “is preferred to, is stronger than, and precedes (McDaniel
& Gates, 2014, p. 227).” Statistically speaking, it can help measure median, mean, and
variance.
• Nominal questions—such as the demographic section—can help classify the
respondents and measure: frequency counts, percentages, and modes.
• Qualitative questions are open-ended questions that help build more towards the case in
question during focus groups and can lead towards further study.

MARKETING RESEARCH PROPOSAL FOR ALASKA AIRLINES/VIRGIN AMERICA 26
Appendix C
Ethnographic Research Screening Survey
Greetings! This is Randall Research Partners with Alaska Airlines (or Virgin America for
that matter). We are conducting fieldwork ethnographic study about brand revitalization. We are
not selling anything. In fact, your participation is optional. Your opinions will be kept
confidential and will be greatly appreciated. If chosen, you will receive $300 for your time or sky
miles, VIP lounge access and perks, and your upcoming trip San Francisco-Los Angeles will be
completely covered (with return flight). It will be simple: the ethnographic study will entail
flying to your frequent destination of Los Angeles as normal and then being quickly transferred
to Plaza Research Network research facility near LAX to be interviewed individually as part of
the in-depth interviews section of the study. They will take 1.5-2 hours long after the flight's
completion and will take place minutes from LAX. Please fill out the pre-screener to see if you
qualify...
Click-Through Questionnaire
A) Alaska Airlines Customers or B) Virgin America Customers
First Name
Last Name
Mobile Phone Number
Email Address
Zip Code
1. Do you or anyone in your family work for the Virgin America (or option B: Alaska
Airlines)? Yes / No (If yes, disqualify)
2. Select the age group that describes you (Pick only age group 25-35).
3. Are you a Mileage Plan member (for Alaska) or Elevate Frequent Flying Program
member (for Virgin America)?
4. What type of Alaska/Virgin America traveler would you consider yourself? Choose all
that Apply.
Business

MARKETING RESEARCH PROPOSAL FOR ALASKA AIRLINES/VIRGIN AMERICA 27
Leisure
Family
Special Needs
5. If you answered leisure, how do you travel? Choose all that apply.
Alone
Couples
Family
6. Are you? Male or Female
7. What is your race or ethnic background? Select one.
Hispanic/Latino
White or Caucasian (Non-Hispanic)
Black or African American
Asian or Asian-American
American Indian, Alaska Native, Native Hawaiian or other Pacific Islander
Other:
8. Which of the following best describes your employment status? Select one.
Unemployed
Employed part-time
Employed full-time
Self-employed
Homemaker
Retired
Full-time student
Part-time student, employed
In the military
9. When you fly, you usually choose (choose all that apply):
Budget (Coach)
Standard (Coach+)
Customer Service Focused (Business class)
Comfort Focused (Business Class+)
10. What is your highest level of education completed? Select one.

MARKETING RESEARCH PROPOSAL FOR ALASKA AIRLINES/VIRGIN AMERICA 28
Grade school 8 years or less
Some high school
High school diploma or GED
Some college
Associate's degree
Bachelor's degree
Some graduate school
Master's degree or other advanced degree
11. What is your total household’s annual income before taxes? Select one.
Less than $10,000
$10,000 - $24,999
$25,000 - $49,999
$50,000 - $74,999
$75,000 - $99,999
$100,000 - $124,999
$125,000 - $149,999
$150,000 or over
12. For this study we would like to talk to people with in different occupations. In which of
the following industries have you worked in the last 6 months? Select all that apply
Business
Tech
Science
Law
Marketing/Advertising/Public Relations
Hospitality
Music
Film
Consumer packaged goods
Construction
Grocery store or mass retail
Mobile phone manufacturing or sales

MARKETING RESEARCH PROPOSAL FOR ALASKA AIRLINES/VIRGIN AMERICA 29
Restaurant or food service company
None of these
13. What’s your occupation, employer and industry?
Occupation
Employer
Industry
14. What best describes your primary residence? Select one.
Live in a home that I own
Rent
Live with someone and don’t pay for housing
15. Which of the following best describes who makes the purchasing decisions in your
household? Select one
I make the decisions
My significant other makes the decisions
We make them together
I don't know
16. Imagine that you had to make a choice whether to choose Alaska/Virgin America
because your airline wasn't available, How LIKELY would you be to CONSIDER
Alaska (or Virgin America for that matter)? Select One.
Extremely Likely
Very Likely
Somewhat Likely
Not Very Likely
Not at All
17. In social media terms, do consider yourself:
Casual User
Influencer
Expert
18. Will you be available for 1.5-2 hours after your flight on (input here date of next San
Francisco to LAX flight) for an in-depth interview about your flight with us? Yes or No.

MARKETING RESEARCH PROPOSAL FOR ALASKA AIRLINES/VIRGIN AMERICA 30
Group A: Survey Screening Questions (Virgin America customers)
1. Are you… • Male • Female
2. Do you or anyone in your family work for Virgin America or Alaska Airlines? (If yes, disqualify)
• Yes • No
3. How often do you fly Virgin America? (If 1x a month or less, disqualify) • 1x a month or less • 2x+ a month
4. Have you participated in a focus group within the last six months?” (If yes, disqualify) 5. If it came to choosing a flight that is not Virgin America’s, how likely are you to pick
Alaska Airlines as your second choice? (If no opinion, somewhat likely, and very unlikely, disqualify) • Likely • Somewhat likely • No Opinion • Somewhat unlikely • Very unlikely
Group A: Questionnaire
1. How loyal are you to Virgin America? • Very Loyal • Somewhat Loyal • Neither • Somewhat Unloyal • Very Unloyal
2. How likely are you to recommend Virgin America to a friend? • Highly Likely • Very Likely • Neither • Unlikely • Very Unlikely
3. How would you feel if Virgin America were to redesign its website? • Very Happy • Pretty Happy • Neither • Somewhat Unhappy • Very Unhappy
4. How familiar are you with Alaska Airlines? • Very familiar • Somewhat familiar

MARKETING RESEARCH PROPOSAL FOR ALASKA AIRLINES/VIRGIN AMERICA 31
• Neither • Somewhat unfamiliar • Very unfamilar
5. What is your attitude toward Alaska Airlines? • Love • Like • Neither • Dislike • Hate
6. How satisfied are you after testing Alaska’s booking experience? • Very Satisfied • Satisfied • Neither • Unsatisfied • Very Unsatisfied
7. How intuitive do you feel Alaska’s booking experience is for a first-time user? • Very intuitive • Intuitive • Neither • Not intuitive • Very unintuitive
8. Indicate how the Alaska Airline/Virgin America merger will affect your preferred brand? • Very Positively • Somewhat Positively • Neither • Somewhat Negatively • Very Negatively
9. Please evaluate how accurately each phrase describes AlaskaAir.com. Select a plus number by placing an (X) beside it for the phrases you think describe us accurately. Select a negative number by placing and (X) beside the least accurate descriptions.
+5 +5 +5 +5 +5 +4 +4 +4 +4 +4 +3 +3 +3 +3 +3 +2 +2 +2 +2 +2 +1 +1 +1 +1 +1
Aesthetic Navigation Ease Site Organization Clarity of
Information eTrust
-1 -1 -1 -1 -1 -2 -2 -2 -2 -2 -3 -3 -3 -3 -3 -4 -4 -4 -4 -4 -5 -5 -5 -5 -5

MARKETING RESEARCH PROPOSAL FOR ALASKA AIRLINES/VIRGIN AMERICA 32
10. Which is your preferred booking method? Please order in order of preference and/or usage. Begin by picking out tone medium that you like most and assign it a rank “1.” The least preferred should have a ranking of “3.”
Booking Medium Rank Order Official Website or Mobile Third Party Website Booking Agent
11-15: Please mark an X next to the desired preference
Strongly disagree Disagree
Neither agree nor disagree Agree
Strongly agree
11. Booking an Alaska Airlines flight is easy 1 2 3 4 5
12. Booking an Alaska Airlines flight takes no time 1 2 3 4 5
13. Booking on Alaska Airlines can be improved 1 2 3 4 5
14. I like booking on an
website that is simple and easy 1 2 3 4 5
15. I like booking on a website that is cool-looking and hip 1 2 3 4 5
16. Do you have any other suggestions about the booking experience with Alaska Airlines? 17. What is the first word that comes to mind when you think of Alaska Airlines? 18. Are you a Virgin America “Elevate” member? Please answer Yes or No 19. Please choose your flight preference
• Business Class • Standard (Coach+) • Budget (Coach)
20. Are you… • Male • Female
21. Which of the following best describes your current income bracket?

MARKETING RESEARCH PROPOSAL FOR ALASKA AIRLINES/VIRGIN AMERICA 33
• Less than $50,000 • $50,000 to $74,999 • $75,000 to $99,999 • $100,000 to $149,999 • $150,000 to $174,999 • $175,000 to $199,999 • Over $200,000
22. Which of the following best describes your ethnicity? • Caucasian • Asian • African American • Hispanic • Middle Eastern • Samoan/Pacific Islander • Other
23. What is your highest level of education completed? Select one. • Grade school 8 years or less • Some high school • High school diploma or GED • Some college • Associate's degree • Bachelor's degree • Some graduate school • Master's degree or other advanced degree
24. We are conducting focus group sessions for further brand research. Your opinions will be kept confidential and will be greatly appreciated. If chosen, you will receive $350 for your time or its equal in sky miles, and VIP lounge passes to four future flights. The focus group will take 2-3 hours long and will take place and will take place at Plaza Network Research facilities (in San Francisco or Los Angeles). Would you like to participate? Answer: Yes or No.
Group B: Survey Screening Questions (Alaska Airline’s Customers)
1. Are you… • Male • Female
2. Do you or anyone in your family work for Virgin America or Alaska Airlines? (If yes, disqualify)
• Yes • No
3. How often do you fly Alaska Airlines? (If 1x a month or less, disqualify) • 1x a month or less • 2x+ a month
4. Have you participated in a focus group within the last six months?” (If yes, disqualify)

MARKETING RESEARCH PROPOSAL FOR ALASKA AIRLINES/VIRGIN AMERICA 34
5. If it came to choosing a flight that is not Alaska’s, how likely are you to pick Virgin America as your second choice? (If no opinion, somewhat likely, and very unlikely, disqualify) • Likely • Somewhat likely • No Opinion • Somewhat unlikely • Very unlikely
Questionnaire
1. How loyal are you to Alaska Airlines? • Very Loyal • Somewhat Loyal • Neither • Somewhat Unloyal • Very Unloyal
2. How likely are you to recommend Alaska Airlines to a friend? • Highly Likely • Very Likely • Neither • Unlikely • Very Unlikely
3. How would you feel if Alaska Airlines were to redesign its website? • Very Happy • Pretty Happy • Neither • Somewhat Unhappy • Very Unhappy
4. How familiar are you with Virgin America? • Very familiar • Somewhat familiar • Neither • Somewhat unfamiliar • Very unfamilar
5. What is your attitude toward Virgin America? • Love • Like • Neither • Dislike • Hate
6. How satisfied are you after testing Virgin America’s booking experience? • Very Satisfied • Satisfied

MARKETING RESEARCH PROPOSAL FOR ALASKA AIRLINES/VIRGIN AMERICA 35
• Neither • Unsatisfied • Very Unsatisfied
7. How intuitive do you feel Virgin America’s booking experience is for a first-time user? • Very intuitive • Intuitive • Neither • Not intuitive • Very unintuitive
8. Indicate how the Alaska Airline/Virgin America merger will affect your preferred brand? • Very Positively • Somewhat Positively • Neither • Somewhat Negatively • Very Negatively
9. Please evaluate how accurately each phrase describes VirginAmerica.com. Select a plus number by placing an (X) beside it for the phrases you think describe us accurately. Select a negative number by placing and (X) beside the least accurate descriptions.
+5 +5 +5 +5 +5 +4 +4 +4 +4 +4 +3 +3 +3 +3 +3 +2 +2 +2 +2 +2 +1 +1 +1 +1 +1
Aesthetic Navigation Ease Site Organization Clarity of
Information eTrust
-1 -1 -1 -1 -1 -2 -2 -2 -2 -2 -3 -3 -3 -3 -3 -4 -4 -4 -4 -4 -5 -5 -5 -5 -5
10. Which is your preferred booking method? Please order in order of preference and/or usage. Begin by picking out tone medium that you like most and assign it a rank “1.” The least preferred should have a ranking of “3.”
Booking Medium Rank Order Official Website or Mobile Third Party Website Booking Agent
11-15:

MARKETING RESEARCH PROPOSAL FOR ALASKA AIRLINES/VIRGIN AMERICA 36
Please mark an X next to the desired preference
Strongly disagree Disagree
Neither agree nor disagree Agree
Strongly agree
11. Booking an Alaska Airlines flight is easy 1 2 3 4 5
12. Booking an Alaska Airlines flight takes no time 1 2 3 4 5
13. Booking on Alaska needs no improvement 1 2 3 4 5
14. I like booking on an
website that is simple and easy 1 2 3 4 5
15. I like booking on a website that is cool-looking and hip 1 2 3 4 5
16. Do you have any other suggestions about the booking experience with Virgin Airlines? 17. What is the first word that comes to mind when you think of Alaska Airlines? 18. Are you an “Elevate” Virgin America loyalty member? Please answer Yes or No. 19. Please choose your flight preference
• Business Class • Standard (Coach+) • Budget (Coach)
20. Are you… • Male • Female
21. Which of the following best describes your current income bracket? • Less than $50,000 • $50,000 to $74,999 • $75,000 to $99,999 • $100,000 to $149,999 • $150,000 to $174,999 • $175,000 to $199,999 • Over $200,000
22. Which of the following best describes your ethnicity? • Caucasian • Asian

MARKETING RESEARCH PROPOSAL FOR ALASKA AIRLINES/VIRGIN AMERICA 37
• African American • Hispanic • Middle Eastern • Samoan/Pacific Islander • Other
23. What is your highest level of education completed? Select one. • Grade school 8 years or less • Some high school • High school diploma or GED • Some college • Associate's degree • Bachelor's degree • Some graduate school • Master's degree or other advanced degree
24. We are conducting focus group sessions for further brand research. Your opinions will be kept confidential and will be greatly appreciated. If chosen, you will receive $350 for your time or its equal in sky miles, and VIP lounge passes to four future flights. The focus group will take 2-3 hours long and will take place and will take place at Plaza Network Research facilities (in San Francisco or Los Angeles). Would you like to participate? Answer: Yes or No.
Appendix D
Focus Group Discussion Guide
According to Elliot & Associates (2005), focus groups should start with an ice-breaking
question, and the moderator should follow the questions for flow, staying neutral, without
showcasing any agreement or praise (p. 10). The moderator should not only ask the key
questions, but also promote debate between the respondents. These are some of the questions that
can be asked: "Respondent A, Do you agree with what Respondent B said? Do you think that the
aesthetic of the website is a factor as an attribute of the brand? What is so appealing about Virgin
America that Alaska Airlines doesn't have? Discuss among yourselves if website functionality or
website aesthetic is more important in your booking decisions."

MARKETING RESEARCH PROPOSAL FOR ALASKA AIRLINES/VIRGIN AMERICA 38
References
Airlines for America (2016). Data. Retrieved June 29, 2016 from
http://airlines.org/data/
Alaska Air Group, Inc. (2015). Alaska Air Group, Inc. MarketLine Company Profile, 1-27.
Alaska couples with Virgin America. (2016). Dow Theory Forecasts,72(15), 6-7.
Analyzing the Data (n.d.). Surveymonkey.com. Retrieved June 23, 2016 from
https://www.surveymonkey.com/mp/how-to-analyze-survey-data/
Analyzing Likert Scale/Type Data (n.d). University of St. Andrews. Retrieved June 18, 2016
from
https://www.st-andrews.ac.uk/media/capod/students/mathssupport/Likert.pdf
Birmingham, A. (2015). Chapter 1: Marketing Technology. B&T Magazine, 65(2811), 3-11.
Boone, H. N., & Boone, D. A. (2012). Analyzing likert data. Journal of Extension, 50(2), 1-5.
Burns, A., Bush, R., (2003) Chapter 17: Testing for differences between groups or among more
than two groups, Marketing Research: Online Research Applications, Pearson Prentice
Hall.
Cayla, J., & Arnould, E. (2013). Ethnographic Stories for Market Learning. Journal Of
Marketing, 77(4), 1-16.
Chambliss, D.F., & Schutt, R. K. (2012). Making Sense of the Social World: Methods of
Investigation (4th ed.). New York City, NY: Sage Publications.
DataStar, Inc. (2011, April 28). Anatomy of a Crosstab. Greenbook.org. Retrieved from
http://www.greenbook.org/marketing-research/anatomy-of-a-crosstab-03377
Dent, J. (2013). A Customer Journey Mapping: A Walk In Customers’ Shoes. Retrieved June
1st, 2016 from

MARKETING RESEARCH PROPOSAL FOR ALASKA AIRLINES/VIRGIN AMERICA 39
http://www.ascendforairlines.com/2013-issue-no-2/customer-journey-mapping-walk-
customers%E2%80%99-shoes
DePaulo, P. (2000). Sample Size for Qualitative Research. Quirks.com. Retrieved June 25, 2016
from
http://www.quirks.com/articles/a2000/20001202.aspx
Desai, P. (2010) Get Real: from the Viewing Facility to the Real World. International Journal of
Market Research, 52(1), 136-138.
Dupre, E. (2013, February 7). For Virgin America, the Sky's the Limit. DMNews.com. Retrieved
from
http://www.dmnews.com/direct-line-blog/for-virgin-america-the-skys-the-
limit/article/279599/
Eliot & Associates (2005). Guidelines for Conducting a Focus Group. Duke.edu. Retrieved June
22, 2016
from
https://assessment.trinity.duke.edu/documents/How_to_Conduct_a_Focus_Group.pdf
Fast Company (2015/16). Most Innovative Companies: Virgin America for Perfecting Customer
Service for an Innovative Clientele. Retrieved May 25th from
https://issuu.com/fastcompanysa/docs/fc_dec_2015-jan_2016_issue_13
Fitzpatrick, A. (2015). A Tale of Two Airlines. Time, 186(22/23), 106.
Heath, M. (2010). Crafting a Research Proposal. The Marketing Review, 10(2), 147 - 168
Keller, K. L. (2013). Strategic Brand Management: Building, Measuring, and Managing Brand
Equity (4th Ed.). Upper Saddle River, NJ: Pearson-Prentice Hall.
Klick, J., & Orszag, J (2015. June 19). Merger of US Airways and American Airlines.

MARKETING RESEARCH PROPOSAL FOR ALASKA AIRLINES/VIRGIN AMERICA 40
FTIConsulting.com. Retrieved from
http://www.fticonsulting.com/~/media/Files/us-files/insights/case-studies/us-airways-
american-airlines-merger-case-study.pdf
Krupnick, M. (2016, April 11). Virgin America Fans Ask if Alaska Airlines Takeover Will Mean
Loss of Cool. NyTimes.com. Retrieved from
http://www.nytimes.com/2016/04/12/business/virgin-america-fansaskif-alaska-airlines-
takeover-will-mean-loss-ofcool.html
Leff, G. (2015, April 15). What Alaska Airlines is Telling Virgin America's Employees.
ViewfromtheWing.BoardingArea.com. Retrieved July 3rd, 2015 from
http://viewfromthewing.boardingarea.com/2016/04/15/what-alaska-airlines-is-telling-
virgin-americas-employees-about-the-merger/
Malhotra, N. (2012). Basic Marketing Research (4th ed.). Upper Saddle River, NJ: Pearson
Education, Inc.
Maxon, T (2014, December 6). A year into its merger with US Airways, American Airlines is
flying high. DallasNews.com. Retrieved from
http://www.dallasnews.com/business/airline-industry/20141206-a-year-into-its-merger-
with-us-airways-american-airlines-is-flying-high.ece
McCarthy, M. J. (2011). Improving the United States airline industry's capacity to provide safe
and dignified services to travelers with disabilities: focus group findings. Disability &
Rehabilitation, 33(25/26), 2612-2619.
McCartney, S. (2016, May 4). Alaska Airlines-Virgin America Merger Tests What Fliers Really
Want. The Wall Street Journal.
McDaniel, C., & Gates, R. (2014). Marketing Research Essentials (10th ed.). New York: Wiley
MARKETING RESEARCH PROPOSAL FOR ALASKA AIRLINES/VIRGIN AMERICA 41
& Sons.
NASH, K. S. (2014). Doing Social Right. (cover story). Cio, 28(1), 30-37.
Peters, C. (n.d.). How to Design and Analyze a Survey. Zapier.com. Retrieved June 23, 2016
from
https://zapier.com/learn/ultimate-guide-to-forms-and-surveys/design-analyze-
survey/#canalyze
PR, N. (2013, February 27). Virgin America Takes Top Prize For Innovative Campaign At
Global Loyalty Event. PR Newswire US.
Quantcast (2016 a). Query: Alaskaair.com. Retrieved June 4, 2016 from
https://www.quantcast.com/alaskaair.com
Quantcast (2016 b). Query: Virginamerica.com. Retrieved June 4, 2016 from
https://www.quantcast.com/virginamerica.com
Schmidt, Ally (2015, Jun 24). US Airlines Increase Capacity in May 2015 to Meet Growing
Demand. MarketRealist.com. Retrieved from
http://marketrealist.com/2015/06/us-airline-industry-overview-may-2015/
Sparkcentral (2014). Global Airlines Adopt Sparkcentral for Customer-First Approach. Business
Wire (English).
Trochim, W. M.K. (2006, October 20). Research Methods Knowledge Base.
SocialResearchMethods.Net. Retrieved from
http://www.socialresearchmethods.net/kb/qualapp.php
Krosnick, J. A., & Presser, S. (2010). Question and Questionnaire Design. Handbook of Survey
Research, 2, 263-314. Retrieved from
https://studysites.sagepub.com/kumar4e/study/Chapter%209/Questionnaires.pdf

MARKETING RESEARCH PROPOSAL FOR ALASKA AIRLINES/VIRGIN AMERICA 42
Krueger, R.A. & Casey, M.A. (2008). Focus groups: A Practical Guide for Applied Research.
(4th ed.). New York: Sage Publications.
United States Department of Transportation (2016, February). Virgin America Query. Retrieved
June 1, 2016 from
http://www.transtats.bts.gov/carriers.asp?pn=1&Sel=C&Carrier=VX&Carrier_Name=Vir
gin%20America
United States Department of Transportation (2016, February). Alaska Airlines Query. Retrieved
June 1, 2016 from
http://www.transtats.bts.gov/carriers.asp?pn=1
U.S. Department of Transportation (2012) Air Travel Consumer Report. Retrieved June 5, 2016
from
http://airconsumer.dot.gov/reports/2012/September/2012SeptATCR.PDF
Vault Rankings & Reviews (2016). ALASKA AIRLINES, INC. Retrieved June 19, 2016 from
http://www.vault.com/company-profiles/travel-leisure/alaska-airlines,-inc/company-
overview.aspx
Walker, K. (2016). Fewer & Fewer. Air Transport World, 53(5), 14.
Walker, M. (2015, November 3). Best and Worst Airlines: Find Out Which Carrier to Fly.
ConsumerReports.Org. Retrieved from
http://www.consumerreports.org/airline-travel/best-and-worst-airlines/
Wharton University of Pennsylvania (2014, January 14). Virgin America Beat Odds: US Airline
Market. Retrieved June 20, 2016 from
http://knowledge.wharton.upenn.edu/article/virgin-america-beat-odds-u-s-airline-market/

MARKETING RESEARCH PROPOSAL FOR ALASKA AIRLINES/VIRGIN AMERICA 43
Overall good job on your proposal. You have a lot of good detail in applying the concepts you learned in this class but there are a few areas that are confusing and may need additional clarification. I appreciate that you are doing a multi-methodstudy as you can cover a lot of ground and collect some very good data. Some better organization in the proposal would help. If you have three different methodologies, discuss each separately and address all the required elements of the Design, data collection method and analysis. Just a few specific comments: Introduction: Background: Statement of the Problem: Research Objectives: Recommended Methodology: You say that quantitative methods refer to research who's findings are not subject to quantification or quantitative analysis. Is there a typo here? Quantitative methods are so you can quantify. Focus groups are an exploratory method and are qualitative. Research Design: How is the A/B split test being used? Is this being used to collect data on the trip experience? For the ethnographic research, how will the observations be made. Will they be seated next to one of the passengers? How will they know who is in the test? Data Collection Method: Sample Plan: You say, "after cluster sampling has been performed". Why and how are you using this probability method? You need to give the sampling frame and size. Website testing prior to focus group: Make sure that you over recruit because some people may not do this. You could also include this test in the focus group itself and then debrief the group. You don't really have a "sample" for focus groups because they are begin specifically selecting according to your recruitment criteria. Sampling error only applies if you have a probability sample. It doesn't apply to a focus group. Analytical Plan: Typically a focus group uses a content analysis. The data analysis you are describing is used with quantitative studies. For these higher level statistics, you need to have interval or ratio data in your questionnaire. Deliverables: Optional Sections Time Table: Budget: Appendix: Good use of secondary research. You might include a basic outline of the focus group discussion topics.