Personal and familial crisis communication before and during
Upload
phunghuongCategory
view
213download
0
Question Data Descriptive Analytical References
Market Value Before and After the Global FinancialCrisis
IPDSM 2017 - Mexico
Antanina Garanasvili & Georg von Graevenitz
University of Padua Queen Mary, University of London
14.11.2017
1 Georg von Graevenitz @ IPSDM 2017
Question Data Descriptive Analytical References
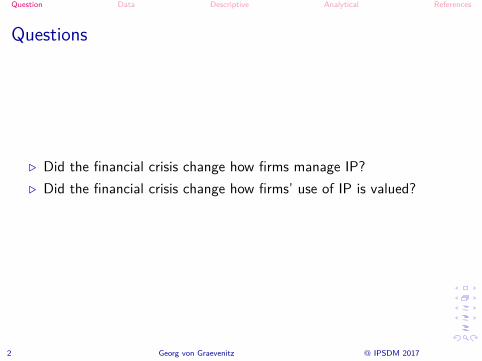
Questions
. Did the financial crisis change how firms manage IP?
. Did the financial crisis change how firms’ use of IP is valued?
2 Georg von Graevenitz @ IPSDM 2017
Question Data Descriptive Analytical References
Literature
. Trends: Corrado and Hulten (2010) - intangibles matterArora et al. (2015) - focus on D at expense of R
. Shock: Bloom (2009), Baker et al. (2016) - extended uncertainty
. Previous evidence: Nabar and Nicholas (2010) - Great Depression
. Framework: Hall et al. (2005) - decomposing impact of patents,citations
. Methods: Bloom et al. (2013) - IV approach to market valueregression
3 Georg von Graevenitz @ IPSDM 2017
Question Data Descriptive Analytical References
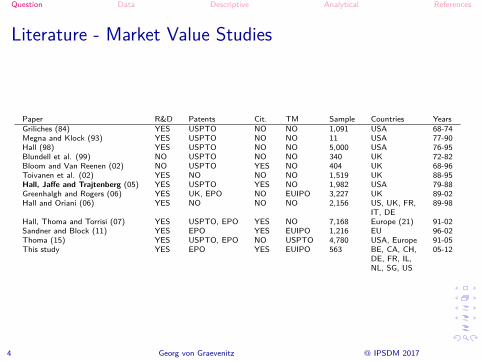
Literature - Market Value Studies
Paper R&D Patents Cit. TM Sample Countries YearsGriliches (84) YES USPTO NO NO 1,091 USA 68-74Megna and Klock (93) YES USPTO NO NO 11 USA 77-90Hall (98) YES USPTO NO NO 5,000 USA 76-95Blundell et al. (99) NO USPTO NO NO 340 UK 72-82Bloom and Van Reenen (02) NO USPTO YES NO 404 UK 68-96Toivanen et al. (02) YES NO NO NO 1,519 UK 88-95Hall, Jaffe and Trajtenberg (05) YES USPTO YES NO 1,982 USA 79-88Greenhalgh and Rogers (06) YES UK, EPO NO EUIPO 3,227 UK 89-02Hall and Oriani (06) YES NO NO NO 2,156 US, UK, FR, 89-98
IT, DEHall, Thoma and Torrisi (07) YES USPTO, EPO YES NO 7,168 Europe (21) 91-02Sandner and Block (11) YES EPO YES EUIPO 1,216 EU 96-02Thoma (15) YES USPTO, EPO NO USPTO 4,780 USA, Europe 91-05This study YES EPO YES EUIPO 563 BE, CA, CH, 05-12
DE, FR, IL,NL, SG, US
4 Georg von Graevenitz @ IPSDM 2017

Question Data Descriptive Analytical References
Did the financial crisis change use of IP?
. During crisis it was quickly apparent that applications werefalling, what about renewals?
1993
1994
19951997
1998
19992000
2001
2002
0
.005
.01
.015
(Pat
ents
laps
ing
/ all
pate
nts
at ri
sk) b
y co
hort
1995 2000 2005 2010 2015year of lapse
Quarterly filings relative to 1996 peak
Lehman Bros. collapse
Share of quarterly filingsexpiring this quarter
0
.2
.4
.6
.8
1
1995q1 2000q1 2005q1 2010q1 2015q1quarter
Patents lapsing Trademarks lapsing
5 Georg von Graevenitz @ IPSDM 2017

Question Data Descriptive Analytical References
Sources of Data
. Firms:Basis: COR&DIP (2009-2012)Extended: COMPUSTAT & AMADEUS
. Patents: PATSTAT via Dietmar Harhoff
. Trademarks: Direct from EUIPO via Nathan Wajsman & MichalKazimierczak
6 Georg von Graevenitz @ IPSDM 2017

Question Data Descriptive Analytical References
Constructing the data
Problems:1) Matching data (IP and firm information)2) Selecting the sample
What we did:1) Matching partly solved by COR&DIP, but we expand this
backwards using Derwent names (long do file) and manual checks.2) Included all firms with at least 5 years of data on R&D and
operating expenditure before 2009.
7 Georg von Graevenitz @ IPSDM 2017
Question Data Descriptive Analytical References
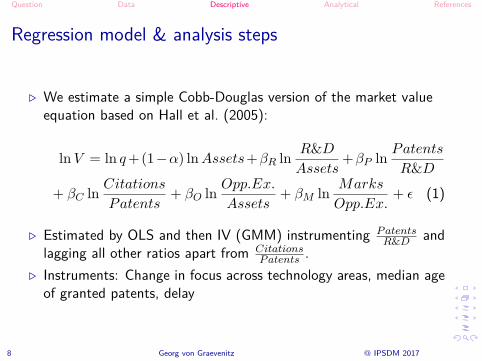
Regression model & analysis steps
. We estimate a simple Cobb-Douglas version of the market valueequation based on Hall et al. (2005):
lnV = ln q+(1−α) lnAssets+βR ln R&DAssets
+βP ln PatentsR&D
+ βC ln CitationsPatents
+ βO ln Opp.Ex.Assets
+ βM ln Marks
Opp.Ex.+ ε (1)
. Estimated by OLS and then IV (GMM) instrumenting P atentsR&D and
lagging all other ratios apart from CitationsP atents .
. Instruments: Change in focus across technology areas, median ageof granted patents, delay
8 Georg von Graevenitz @ IPSDM 2017
Question Data Descriptive Analytical References
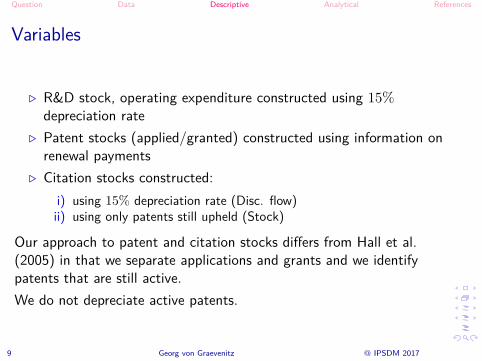
Variables
. R&D stock, operating expenditure constructed using 15%depreciation rate
. Patent stocks (applied/granted) constructed using information onrenewal payments
. Citation stocks constructed:i) using 15% depreciation rate (Disc. flow)ii) using only patents still upheld (Stock)
Our approach to patent and citation stocks differs from Hall et al.(2005) in that we separate applications and grants and we identifypatents that are still active.We do not depreciate active patents.
9 Georg von Graevenitz @ IPSDM 2017

Question Data Descriptive Analytical References
Table 1: Descriptive Statistics
Variable N Mean Median Min. Max. Std. Dev.Market value (eM) 3, 945 9, 292.48 1, 662.19 −142.54 388, 596.31 24, 222.36Book value (eM) 3, 945 8, 053.69 1, 388.89 4.01 217, 634 20, 535.51Market-to-book value 3, 945 1.73 1.28 −0.38 38.92 1.69R&D stock (eM) 3, 945 928.68 165.13 −2, 898.83 32, 909.61 2, 847.32Op. exp. stock (eM) 3, 945 17, 214.10 2, 961.85 28.30 705, 362.81 51, 560.13Granted patents 3, 139 253.47 33 1 11, 876 753.50Applied patents 3, 347 333.58 61 1 11, 986 916.11Validated patents 2, 859 2, 265.96 182 1 135, 452 8, 470.82Trademarks 3, 043 67.47 19 0 1, 922 139.18D (R&D =0) 3, 945 0 0 0 0 0D (Op. exp. =0) 3, 945 0 0 0 1 0.04R&D/Assets 3, 945 0.23 0.13 −1.30 3.70 0.32Op. exp./Assets 3, 945 2.79 2.26 0.17 20.93 2.12Granted p./R&D ×1000 3, 139 0.44 0.17 −0.18 18.38 0.91Applied p./R&D ×1000 3, 347 0.66 0.32 −0.23 19.84 1.22Validated p./R&D ×1000 2, 859 2.58 0.94 −2.18 106.31 5.36Trademarks/Opp. exp. ×1000 3, 043 0.01 0.00 0.00 0.56 0.02Citations PI (EP)/Patents (app.) 3, 347 0.96 0.67 0 19.27 1.05Citations (US)/Patents (app.) 2, 844 2.45 1.14 0 68.94 4.61Citations (EP)/Patents (app.) 2, 844 0.35 0.21 0 10 0.52Citations PI (EP)/Patents (gr.) 3, 139 1.64 0.56 0 73.35 4.58Citations (US)/Patents (gr.) 2, 840 6.10 2.26 0 172 11.80Citations (EP)/Patents (gr.) 2, 840 0.76 0.38 0 14.71 1.25Citations PI (EP, app.) 3, 945 267.81 28.59 0 16, 063.22 906.66Citations PI (EP, val.) 3, 945 128.30 12.49 0 5, 202.35 407.37Citations (EP, app.) 2, 851 60.54 20 0 655 95.34Citations (US, app.) 2, 851 319.87 124 0 6, 019 498.81Citations (EP, val.) 2, 848 64.25 22 0 688 100.07Citations (US, val.) 2, 848 340.60 132 0 6, 863 554.48
10 Georg von Graevenitz @ IPSDM 2017
Question Data Descriptive Analytical References
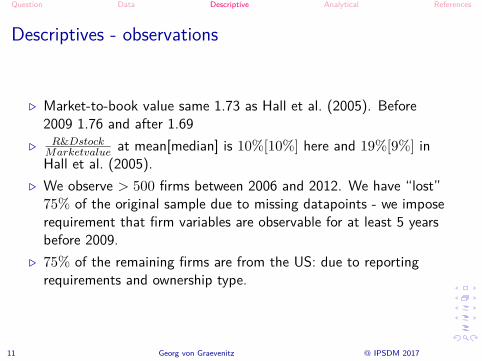
Descriptives - observations
. Market-to-book value same 1.73 as Hall et al. (2005). Before2009 1.76 and after 1.69
. R&DstockMarketvalue at mean[median] is 10%[10%] here and 19%[9%] inHall et al. (2005).
. We observe > 500 firms between 2006 and 2012. We have “lost”75% of the original sample due to missing datapoints - we imposerequirement that firm variables are observable for at least 5 yearsbefore 2009.
. 75% of the remaining firms are from the US: due to reportingrequirements and ownership type.
11 Georg von Graevenitz @ IPSDM 2017

Question Data Descriptive Analytical References
Sample: R&D and Applications
0
.5
1
1.5
Loga
rithm
of R
&D/A
sset
s
2004 2006 2008 2010 2012YEAR
R&D/Assets
0
1
2
3
Loga
rithm
of A
pplic
atio
ns/R
&D2004 2006 2008 2010 2012
YEAR
Applications/R&D
12 Georg von Graevenitz @ IPSDM 2017
Question Data Descriptive Analytical References
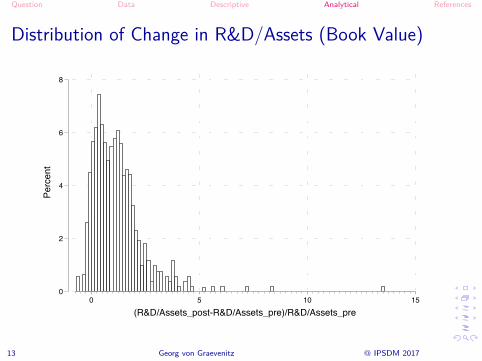
Distribution of Change in R&D/Assets (Book Value)
0
2
4
6
8
Percent
0 5 10 15(R&D/Assets_post-R&D/Assets_pre)/R&D/Assets_pre
13 Georg von Graevenitz @ IPSDM 2017
Question Data Descriptive Analytical References
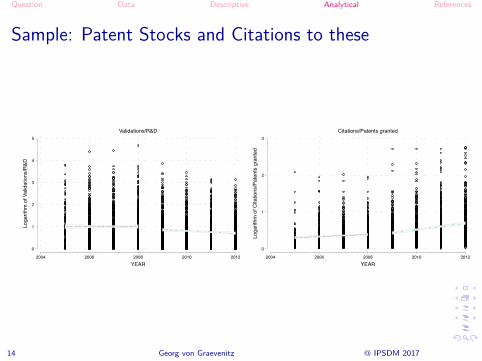
Sample: Patent Stocks and Citations to these
0
1
2
3
4
5
Loga
rithm
of V
alid
atio
ns/R
&D
2004 2006 2008 2010 2012YEAR
Validations/R&D
0
1
2
3
Loga
rithm
of C
itatio
ns/P
aten
ts g
rant
ed2004 2006 2008 2010 2012
YEAR
Citations/Patents granted
14 Georg von Graevenitz @ IPSDM 2017
Question Data Descriptive Analytical References
Table 2: Market Value as a function of R&D, Patents, Marks, Citations2005-2012 2005-2008 2009-2012
US cit. EPO cit. US cit. EPO cit.Assets -0.0381∗∗∗ -0.0301∗∗ -0.0287∗ -0.0457∗∗∗ -0.0435∗∗∗
(0.0046) (0.0111) (0.0113) (0.0101) (0.0104)R&D/Assets 0.3300∗∗∗ 0.0956 0.1296 0.4548∗∗∗ 0.4569∗∗∗
(0.0583) (0.1387) (0.1428) (0.1081) (0.1083)Patents app./R&D 0.2075∗∗∗ 0.2530∗∗∗ 0.2627∗∗∗ 0.1111 0.1081
(0.0309) (0.0576) (0.0591) (0.0864) (0.0865)Patents val./R&D -0.0738∗∗∗ -0.1044∗∗ -0.1025∗∗ -0.0419 -0.0365
(0.0157) (0.0319) (0.0329) (0.0358) (0.0366)Citations app./Applied -0.0277 0.0287 0.0542 -0.0131 -0.0804
(0.0380) (0.0411) (0.0908) (0.0309) (0.0704)Citations gr./Granted 0.1195∗∗∗ 0.0451 0.0900 0.0513∗ 0.1339∗∗
(0.0279) (0.0305) (0.0684) (0.0227) (0.0512)Opp. ex. /Assets -0.1759∗∗∗ -0.0952∗ -0.0966∗ -0.2472∗∗∗ -0.2450∗∗∗
(0.0199) (0.0469) (0.0467) (0.0440) (0.0440)Marks/Opp. exp. 0.0172∗∗ 0.0125 0.0128 0.0199 0.0212
(0.0060) (0.0137) (0.0139) (0.0137) (0.0138)Industry dummies Yes Yes Yes Yes YesYear dummies Yes Yes Yes Yes YesCountry dummies Yes Yes Yes Yes YesObservations 3916 1770 1770 2146 2146Adjusted R2 0.3597 0.3693 0.3640 0.3636 0.3635
Standard errors in parentheses + p < 0.10, ∗ p < 0.05, ∗∗ p < 0.01, ∗∗∗ p < 0.001
15 Georg von Graevenitz @ IPSDM 2017
Question Data Descriptive Analytical References
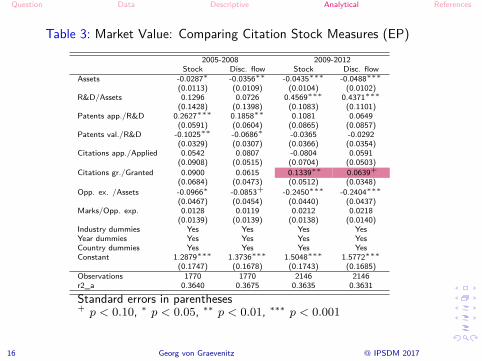
Table 3: Market Value: Comparing Citation Stock Measures (EP)
2005-2008 2009-2012Stock Disc. flow Stock Disc. flow
Assets -0.0287∗ -0.0356∗∗ -0.0435∗∗∗ -0.0488∗∗∗
(0.0113) (0.0109) (0.0104) (0.0102)R&D/Assets 0.1296 0.0726 0.4569∗∗∗ 0.4371∗∗∗
(0.1428) (0.1398) (0.1083) (0.1101)Patents app./R&D 0.2627∗∗∗ 0.1858∗∗ 0.1081 0.0649
(0.0591) (0.0604) (0.0865) (0.0857)Patents val./R&D -0.1025∗∗ -0.0686∗ -0.0365 -0.0292
(0.0329) (0.0307) (0.0366) (0.0354)Citations app./Applied 0.0542 0.0807 -0.0804 0.0591
(0.0908) (0.0515) (0.0704) (0.0503)Citations gr./Granted 0.0900 0.0615 0.1339∗∗ 0.0639+
(0.0684) (0.0473) (0.0512) (0.0348)Opp. ex. /Assets -0.0966∗ -0.0853+ -0.2450∗∗∗ -0.2404∗∗∗
(0.0467) (0.0454) (0.0440) (0.0437)Marks/Opp. exp. 0.0128 0.0119 0.0212 0.0218
(0.0139) (0.0139) (0.0138) (0.0140)Industry dummies Yes Yes Yes YesYear dummies Yes Yes Yes YesCountry dummies Yes Yes Yes YesConstant 1.2879∗∗∗ 1.3736∗∗∗ 1.5048∗∗∗ 1.5772∗∗∗
(0.1747) (0.1678) (0.1743) (0.1685)Observations 1770 1770 2146 2146r2_a 0.3640 0.3675 0.3635 0.3631
Standard errors in parentheses+ p < 0.10, ∗ p < 0.05, ∗∗ p < 0.01, ∗∗∗ p < 0.001
16 Georg von Graevenitz @ IPSDM 2017

Question Data Descriptive Analytical References
Table 4: Market Value: Instrumental Variables - Robustness
2005-2008 2009-2012OLS Lags IV OLS Lags IV
Assets -0.0268∗ -0.0233∗ -0.0155 -0.0436∗∗∗ -0.0434∗∗∗ -0.0808∗∗∗
(0.0115) (0.0111) (0.0176) (0.0104) (0.0103) (0.0240)R&D/Assets 0.2003 0.2393 0.2673+ 0.4618∗∗∗ 0.4560∗∗∗ 0.3533∗
(0.1666) (0.1562) (0.1597) (0.1082) (0.1052) (0.1384)Patents app./R&D 0.2818∗∗∗ 0.2934∗∗∗ 0.5438∗ 0.1319 0.1467+ -0.4234
(0.0626) (0.0626) (0.2499) (0.0874) (0.0870) (0.4970)Patents val./R&D -0.1131∗∗ -0.1197∗∗∗ -0.1827 -0.0472 -0.0542 0.4256
(0.0348) (0.0347) (0.1469) (0.0366) (0.0368) (0.2663)Citations app./Applied 0.0706 0.0709 0.1817 -0.0756 -0.0679 -0.4508+
(0.0908) (0.0917) (0.1950) (0.0705) (0.0715) (0.2321)Citations gr./Granted 0.0692 0.0683 -0.0248 0.1261∗ 0.1262∗ 0.2303∗
(0.0697) (0.0694) (0.0912) (0.0523) (0.0530) (0.0965)Opp. ex. /Assets -0.1078∗ -0.0409 -0.0281 -0.2455∗∗∗ -0.2011∗∗∗ -0.2334∗∗∗
(0.0493) (0.0492) (0.0510) (0.0442) (0.0436) (0.0484)Marks/Opp. exp. 0.0097 0.0109 0.0053 0.0205 0.0244+ 0.0212
(0.0143) (0.0137) (0.0144) (0.0137) (0.0136) (0.0146)Industry dummies Yes Yes Yes Yes Yes YesYear dummies Yes Yes Yes Yes Yes YesCountry dummies Yes Yes Yes Yes Yes YesConstant 1.6732∗∗∗ 1.4925∗∗∗ 1.2327∗∗∗ 1.2320∗∗∗
(0.2189) (0.2093) (0.2127) (0.2088)Observations 1689 1689 1689 2119 2119 2119Likelihood -6.9e+02 -7.0e+02 -7.3e+02 -7.3e+02 -7.5e+02 -9.9e+02Kleibergen-Paap rk LM 41.2397 20.4725p value 0.0000 0.0000Kleibergen-Paap rk Wald F 16.0671 7.5281Hansen J statistic 0.0011 1.4794p value 0.9737 0.2239
Standard errors in parentheses + p < 0.10, ∗ p < 0.05, ∗∗ p < 0.01, ∗∗∗ p < 0.00117 Georg von Graevenitz @ IPSDM 2017

Question Data Descriptive Analytical References
Conclusion & Questions
Results suggest:. The financial crisis pushed companies to reduce patent portfolios
and to increase R&D investments. The financial crisis changed how stock markets value companies -
less focus on portfolio size, more on portfolio “quality”
What else can we do to test the robustness of these findings?→ Further splitting of the data hits limits rather quickly.
18 Georg von Graevenitz @ IPSDM 2017
Question Data Descriptive Analytical References
References
Arora, A., S. Belenzon, and A. Patacconi (2015): “Killing the golden goose? The decline of science in corporateR&D,” Tech. rep., National Bureau of Economic Research.
Baker, S. R., N. Bloom, and S. J. Davis (2016): “Measuring economic policy uncertainty,” The Quarterly Journal ofEconomics, 131, 1593–1636.
Bloom, N. (2009): “The impact of uncertainty shocks,” econometrica, 77, 623–685.Bloom, N., M. Schankerman, and J. Van Reenen (2013): “Identifying technology spillovers and product market
rivalry,” Econometrica, 81, 1347–1393.Corrado, C. A. and C. R. Hulten (2010): “How Do You Measure a" Technological Revolution?” The American
Economic Review, 99–104.Hall, B. H., A. B. Jaffe, and M. Trajtenberg (2005): “Market Value and Patent Citations,” Rand Journal of
Economics, 36, 16–38.Nabar, M. and T. Nicholas (2010): “Uncertainty and Innovation During the Great Depression,” Tech. rep., Harvard
Business School Working Paper,[online] Available at< http://people. hbs. edu/tnicholas/UI. pdf.
19 Georg von Graevenitz @ IPSDM 2017