Agricultural Crisis and Biological Well-Being in Mexico ...
24
Received: 2008-08-15 ■ Revised: 2008-11-18 ■ Accepted: 2009-01-23 Amílcar Challú is Assistant Professor of History, Bowling Green State University. Postal Address: Depart- ment of History, Bowling Green State University, Bowling Green, OH 43403, Ohio (USA). E-mail: [email protected] Agricultural Crisis and Biological Well-Being in Mexico, 1730-1835 AMÍLCAR CHALLÚ 1. INTRODUCTION Agricultural crises are a critical aspect in the course of Mexican history in the eighteenth and early nineteenth century. As social processes, changes in socioeconomic structure and political power affect the capacity of different sectors to devise strategies to react and adapt to climatic disasters, shortages, and food insecurity (García Acosta, 2006). This is espe- cially apparent in the swift political-economic transformations experienced in Mexico in the last century of colonial domination and the first decades of the national era. These transformations included the increasing specialization of the economy, a more commer- cialized agricultural sector, political and economic reforms, and rising agricultural prices. As generalized rural insurrection broke out in 1810, and independence was gained in 1821, fights intensified for the autonomy of peasant communities, the definition of property rights, and the overall organization of economic and political life. Over this period, the bal- ance of economic and political power between cities and countryside was dramatically changing, and trade became an increasingly important way to distribute the allocation of resources—and the means of subsistence. By examining long-run trends in biological well- 21 Historia Agraria, 47 ■ Abril 2009 ■ pp. 21-44 ■ ISSN: 1139-1472 © 2009 SEHA
Transcript of Agricultural Crisis and Biological Well-Being in Mexico ...

Received: 2008-08-15 ■ Revised: 2008-11-18 ■ Accepted: 2009-01-23
Amílcar Challú is Assistant Professor of History, Bowling Green State University. Postal Address: Depart-ment of History, Bowling Green State University, Bowling Green, OH 43403, Ohio (USA). E-mail:[email protected]
Agricultural Crisis and BiologicalWell-Being in Mexico, 1730-1835
AMÍLCAR CHALLÚ
1. INTRODUCTION
Agricultural crises are a critical aspect in the course of Mexican history in the eighteenthand early nineteenth century. As social processes, changes in socioeconomic structure andpolitical power affect the capacity of different sectors to devise strategies to react and adaptto climatic disasters, shortages, and food insecurity (García Acosta, 2006). This is espe-cially apparent in the swift political-economic transformations experienced in Mexico inthe last century of colonial domination and the first decades of the national era. Thesetransformations included the increasing specialization of the economy, a more commer-cialized agricultural sector, political and economic reforms, and rising agricultural prices.As generalized rural insurrection broke out in 1810, and independence was gained in 1821,fights intensified for the autonomy of peasant communities, the definition of propertyrights, and the overall organization of economic and political life. Over this period, the bal-ance of economic and political power between cities and countryside was dramaticallychanging, and trade became an increasingly important way to distribute the allocation ofresources—and the means of subsistence. By examining long-run trends in biological well-
21
Historia Agraria, 47 ■ Abril 2009 ■ pp. 21-44 ■ ISSN: 1139-1472 © 2009 SEHA
HA47_:Maquetaci n HA 25/02/2009 17:21 PÆgina 21

being, cost of food, and climatic conditions, I seek to shed light on the unequal capaci-ties of cities and the countryside to face food shortages and agricultural crises.
Agricultural crises were a common and regular presence well documented in the co-lonial period (Florescano, 1969; García Acosta, Pérez Zevallos & Molina del Villar, 2003).About every ten years, grain shortages were palpable, prices soared, and grain stocks wereremoved from poor districts to be sold in the cities with rich municipal granaries. From1741 to 1810, eight such crises broke out in the Valley of Mexico and other areas fol-lowing a decadal cycle, resulting in hunger, disease, and increased mortality (Florescano,1969: 139, 161). The events of 1749-50, 1785-86, and 1809-10 were so harsh and wide -spread that they became known as años de hambre (famine years), but even in events ofsmaller dimension the outbreak of epidemics was common (Endfield, 2007). After1780, food prices started an inflationary trend, while official documents show a risingaware ness of food supply problems. Regular food shortages engendered a more systemiclong-run subsistence crisis that constantly threatened the life of lower-class Mexicans.The documentary record of agricultural crises in the 1810s and after independence issparser (Escobar Ohmstede, 2004), and may be perceived as a real improvement inliving conditions (McCaa, 1993: 618). Still, we know of two strong but more regionallycontained shortages in 1819 and 1828 that match Florescano’s decadal sequence (Cha-llú, 2007: 278-283).
While periodic disasters provide an insight into how nature, economic constraints, andpolicies and politics affected thousands of lives, I take a long-term look at chronic con-ditions. I traced annual variations in climate and the cost of food, found years in whichconditions were harsher than normal, and assessed through statistical techniques how theclimate-constrained availability and market-driven affordability of food affected both ur-ban and rural populations. My analysis relies on datasets of human height, climate, andreal food prices that span the colonial and national periods. Soldiers’ heights serve as anindicator of the biological well-being of the population. If access to food declined signif-icantly, then the nutritional status suffered, resulting in a lower adult stature for those whoendured these conditions in their early years of life. The real cost of grain products in Mex-ico City became a key issue for the increasing number of Mexicans who depended on ex-change entitlements (that is, on their income to procure food in the market)1. An estab-lished chronology of El Niño climatic events and three local tree-ring series from centralMexico help reconstruct the global events and local climatic conditions that affected agri-cultural output. In the statistical analysis, individual height is the variable to be explained,
pp. 21-44 ■ Abril 2009 ■ Historia Agraria, 4722
Amílcar Challú
1. A good overview on the entitlements approach can be found in SEN (1990).
HA47_:Maquetaci n HA 25/02/2009 17:21 PÆgina 22

2. The collections from the AGN holding the records are as follows: Indiferente de Guerra, Archivode Guerra y Marina, Archivo Histórico de Hacienda, Filipinas, Operaciones de Guerra, and Archivode Guerra. A few records were located in the Archivo del Estado de San Luis Potosí, Gobernacióncollection.
3. For a complete description of the dataset, sources, recruitment rules, height requirements, andconversion units, see CHALLÚ (2007: 36-63).
4. On recruitment, see ARCHER (1977: 231-253) and DEPALO (1997: 31-33 and 74-80). On the re-sistance and lack of effectiveness of recruitment of indigenous peasants, see GUARDINO (2005: 253-4).
23
while harsh climatic conditions and high real food prices at the time of birth of the indi-vidual are the independent explanatory factors. I discriminate the results in the urban andrural population to see how the reliance on markets and the territorial power of large citiesinfluenced their vulnerability to agricultural crises vis-à-vis the rest of the country.
2. DATA AND METHODS
2.1. Heights
The height of adult men is the indicator I used to gauge changes in the biological well-being of the Mexican popular classes. I calculated average height through multivariatetechniques from the measurements of soldiers enrolled in the late colonial and early na-tional armies. The sources are the filiaciones (recruitment forms) found in Mexico’sArchivo General de la Nación2. The dataset also includes socio-demographic descriptorssuch as family name, birthplace and residence, date of recruitment, age, and complex-ion; occupation, signature, and (to a lesser degree) racial categories were available in manycases3.
Soldiers are an imperfect sample of the society at large. The source obviously ex cludeswomen and children, but also within the adult male population it over-represents somegroups and under-represents others. First, people with noticeable health problems andwho were shorter than the minimum standard were legally excluded; if recruited they wererejected in large proportions or could appeal to be removed from service. Second, somegroups were excluded. In the colonial period, Indians were not allowed in the army, andthe Spanish-descendent were preferred. Recruitment was also more intensive in urban ar-eas. After independence, soldiers were more often dark skinned, less literate, and from ru-ral areas, reflecting a more ample social basis of the army. However, there is no evidencein the dataset or the literature that suggests that the national army systematically tappednew types of recruits previously not present (albeit in smaller proportions) in the colo-nial army4.
Historia Agraria, 47 ■ Abril 2009 ■ pp. 21-44
Agricultural Crisis and Biological Well-Being in Mexico, 1730-1835
HA47_:Maquetaci n HA 25/02/2009 17:21 PÆgina 23

5. Less than a half of the records provided a height measurement in lines (the subunit of an inch).This abnormal concentration of cases (known as heaping) tended to be more present after 1810, butit did not affect certain groups more than others.
6. The Paris foot or «pied de roi» was the equivalent of 32.45 centimeters. Its use as the measure-ment standard in Spain and Mexico is documented in CÁMARA-HUESO (2005) and CHALLÚ (2007:51-53), respectively. As in Spain, it was gradually replaced with the Burgos (locally known as theMexican) foot in the 1840s, which was equivalent to 27.86 cm.
7. The minimum height for most Paris-foot units was 162 cm (5 Paris feet). In some units of the1760s and 1770s, the number of five-feet cases was low enough to warrant shifting the lower bound-ary one inch to 164.7 cm; and in the 1850s the only military unit using Paris feet did not enforce aminimum requirement. With the adoption of the Burgos foot, there was no minimum height enforcedin practice. The lower boundary was set to 66 inches (153.1 cm) in order to avoid any confusion withcases measured in Paris feet.
All height measurements were rounded to the inch to avoid the substantial heapingin more detailed measurements5, and were converted to centimeters. Most of the mili-tary units used the Paris foot to measure height; after 1842, army units gradually switchedto Burgos feet6. Soldiers included in the dataset were enrolled in an infantry unit of thepermanent army or the militia, older than eighteen years, born in central Mexico, and tallerthan the observed minimum height requirement determined for the army unit7. Out ofmore than seven thousand originally collected, 3,236 cases met those standards. The av-erage height by decade of birth of the resulting dataset is presented in Table 1.
TABLE 1Average Height by Decade of Birth Central Mexico, 1732-1837 (in cm)
Burgos-foot units Paris-foot units Truncated regression
Average Frequency Average Frequency Average Frequency
1730s 171.1 23 167.2 23
1740s 170.2 285 165.2 285
1750s 168.6 348 160.0 348
1760s 169.0 113 165.2 113
1770s 167.8 154 162.4 154
1780s 168.2 209 163.7 209
1790s 167.8 148 162.8 148
1800s 161.8 59 167.5 193 161.2 252
1810s 162.2 329 167.5 372 161.0 701
1820s 161.6 580 166.7 225 159.5 805
1830s 161.2 193 159.0 198Note: Burgos-foot units have a lower truncation point of 153 cm; Paris-foot units have a minimum of 162cm, and 164.7 cm among those recruited before 1780. The truncated regression column reports fitted val-ues of a truncated regression using the three truncation points; no control variables were used. Source: See footnote 2.
Amílcar Challú
24 pp. 21-44 ■ Abril 2009 ■ Historia Agraria, 47
HA47_:Maquetaci n HA 25/02/2009 17:21 PÆgina 24

8. Examples of frequent family names are Fernández, García, Hernández, Morales, Romero, andVázquez.
9. On regional differences, see MORENO TOSCANO (1998) and MIÑO GRIJALVA (2001: 119-245).
I used truncated regression models to estimate the effect of climatic, price, and period var -iables on height, controlling for the changing socioeconomic and geographic compositionof the population. Truncated regression is a maximum-likelihood technique to estimateunbiased coefficients assuming a normal distribution of heights that can only be partiallyobserved (Komlos, 2004). Without the use of this or a similar technique, the coefficientsare biased given that the height sample does not contain the whole range of heights of thepopulation. Following A’Hearn (2004), the dispersion term was constrained at 6.86 cm(the well-known standard deviation of height in human populations) in order to improvethe accuracy of the estimation. Stata 9’s truncreg routine was used to calculate the mo-dels (StataCorp, 2005).
I used complexion and family names to control for socioeconomic variations. Com-plexion serves as an imperfect indicator of opportunities (or lack thereof) based on per-ceived race, and naming conventions were related to wealth, social prestige, and ethnicidentification (Cope, 1994: 55-67). I simplified both in binary categories in order to havea high frequency of cases in each category and increase the reliability of the results. Com-plexion became white and dark skin, and family name was coded as frequent and infre-quent occurrences8.
Birth cohorts are used to trace height changes over time. In order to have a relativelylarge number of cases per group and hence gain more reliable insights about changes overgenerations, I classified cohorts as follows (number of cases in parentheses): 1732-1750(392), 1751-1780 (554), 1781-1810 (635), 1811-1821 (853), 1822-1837 (802). An «age»variable was created to account for lineal height gain in puberty: age 18 is set to three, 19to two, 20 to one, and 21 or older is set to zero. The reconstructed standard deviationsof height among young and adult soldiers were not significantly different; the equal var -iance assumption of regression analysis thus holds.
I summarized the place of origin in three geographic areas based on John Tutino’s re-gionalization. The North Central Plateau region includes the present-day states of Za-catecas, Aguascalientes, San Luis Potosí, Nayarit, Jalisco, Colima, Michoacán, and Gua-najuato. The Central Highlands region includes Querétaro, Hidalgo, Mexico, Morelos andGuerrero, as well as the Federal District. The South encompasses Puebla, Oaxaca, andVeracruz. Around 1800, these regions had 30 percent, 55 percent, and 14 percent of thepopulation of the viceroyalty (Tutino, 1986: 394-395), but soldiers in this dataset tendedto come in larger numbers from the north central region9.
Agricultural Crisis and Biological Well-Being in Mexico, 1730-1835
Historia Agraria, 47 ■ Abril 2009 ■ pp. 21-44 25
HA47_:Maquetaci n HA 25/02/2009 17:21 PÆgina 25

Amílcar Challú
26 pp. 21-44 ■ Abril 2009 ■ Historia Agraria, 47
Separate analyses were conducted for the entire population and for the urban and ru-ral groups. Soldiers whose place of birth was a large city constitute what is loosely re ferredto as the urban population (count: 1,166 cases). All state and intendancy capitals are con-sidered large cities. Their populations ranged from San Luis Potosí’s 12,000 inhabitantsto over 150,000 in Mexico City circa 1800. Population in these centers added up to about10 percent of the total population of central Mexico10. The second subset, referred as therural population, contains the rest of the cases (count: 2,070 cases), and includes soldiersfrom haciendas, villages, towns, and small cities.
TABLE 2Truncated Regression Models of Height in Centimeters, by Rural and Urban Origin.
Central Mexico, 1732-1837(1) (2) (3)
Entire sample Countryside and towns Large Cities
1732-1750 Ref. Ref. Ref.
1751-1780 -2.41** -2.12 * -2.34 **
1781-1810 -1.93** -1.97 ** -1.86
1811-1821 -3.77** -4.45 ** -2.27 **
1822-1837 -4.67** -5.19 ** -3.71 **
Large city 0.79** — —
Central Highlands Ref. Ref. Ref.
North Central Plateau 0.76* 1.15 ** -0.16
South -0.02 0.06 0.10
Dark skin -2.19** -2.06 ** -2.21 **
Infrequent family name 0.55 0.17 1.06 *
Young age -1.06** -0.72 * -1.54 **
Constant 165.03** 165.16 ** 165.39 **
Sigma 6.86 6.86 6.86
Obs. 3,236 2,070 1,166Notes: The constant represents a soldier 21 years of age or older, from the Central Highlands region, bornon or before 1750, of white skin and a common surname, from a small town or countryside. One star de-notes significance at the 10% level; two stars at the 5% level.Source: See footnote 2.
Table 2 reports the results of the truncated regression models of height in centimeters forthe entire population, as well as for the urban and rural subsets. Some well-known factsof the distribution of human height and some relationships demonstrated in previous work
10. The cities are: Guadalajara, Guanajuato, Mexico City, Oaxaca, Puebla, Querétaro, San Luis Po-tosí, Valladolid-Morelia, Veracruz and Zacatecas.
HA47_:Maquetaci n HA 25/02/2009 17:21 PÆgina 26

Agricultural Crisis and Biological Well-Being in Mexico, 1730-1835
Historia Agraria, 47 ■ Abril 2009 ■ pp. 21-44 27
with the Mexican population provide a first check of the consistency of the results. Sol-diers younger than 21 were shorter, and grew about a centimeter every year. Social andregional height gaps follow expected patterns: there is north-south gradient in height, al-though there is no height penalty in the southern region, as came to be expected later.Whiter skin and, to a lesser degree, uncommon family names were associated withhigher stature. This correlation between social differentiation and height is expectedgiven what we know of the Mexican population and others in this period. The estimatedaverage height (ranging from 165 to 160 cm) is also within the range found in other stud-ies of Mexico and Europe (Cámara-Hueso, 2007: 6-14; Kelly, 1947: 18; López-Alonso,2007: 100)11.
The most remarkable finding in Table 2 is the steep decline in height that points to along-lived subsistence crisis. Using the estimates of the entire sample, height declined 4.67cm from the second quarter of the eighteenth century to the 1820s and 1830s. The dropwas steepest around the mid-1700s. Between 1780 and 1810, height recovered someground against our expectation—epidemics and famines were more frequent in this pe-riod. The downward trend resumed in the 1810s and continued in the early national era.
Another finding is that there is no urban «penalty», as is commonly found in Europeand the United States, but the opposite. Comparing the changes across cohorts (columns2 and 3), it is clear that cities and countryside started on similar levels and both experi-enced decline; after 1780 and more pronouncedly after 1810, the urban population didnot lose height as much as its rural counterpart. Other variables show similarities and dif-ferences among the urban and rural population. Socioeconomic inequality is similar, inparticular the 2-cm effect on height of a bright skin tone points to racial inequality. Fam-ily name has a stronger effect (1 cm) in large urban areas; this finding resonates well withwhat we know about social differentiation in urban plebeian groups. The urban popula-tion had no regional differences in height, while rural dwellers from the North CentralPlateau were almost 1 cm taller than soldiers from the Central Highlands and the South.The regional gap in rural areas was likely related to more land availability in the NorthCentral Plateau, even if population growth and diminishing returns were outstripping theresource advantage (Morin, 1979). One final difference is that height gain before adult-hood was steeper in urban areas and flatter in the rural population. This fact suggests thata short child would have more opportunities to catch up during late puberty in urban ar-eas than in rural environments.
11. CARSON (2005: 413-5) reports a higher average stature, 167cm, among Mexican nationals im-prisoned in the American Southwest in the late nineteenth century; although this population was lar-gely based in the Northern states bordering with the United States.
HA47_:Maquetaci n HA 25/02/2009 17:21 PÆgina 27

12. For other work that also rely on unskilled construction wages to estimate popular earnings, seeHASLIP-VIERA (1999: 27-29), and VANYOUNG (1987).13. See Appendix, Figure A.1 and Table A.1.14. The Pearson correlations of these products with each other ranged from 0.72 to 0.96.
The decline was noticeable in both subsets, but it was strongest among rural dwellers(steady decline of more than six centimeters, see column 3 of Table 2). The major dif-ference is that in large cities there was a more pronounced recovery in the cohorts from1781 to 1821, while among the rural dwellers height deteriorated faster in that time span.As a result of these diverging trends, the rural-urban height gap was reversed in the pe-riod. Up to 1780, rural soldiers were taller, but in the following generations they becameshorter than their urban counterparts.
2.2. Real Food Prices, 1730-1835
A real food price index stands for food prices divided by wage earnings. While other workshave delved into the study of real prices and wages (Dobado, Gómez Galvarriato, & Wi-lliamson, 2008; Garner, 1993: 48; Van Young, 1987), this article is the first one to pro-vide a real food price series that spans the late colonial and early national periods. Theindex relies on corn, wheat, and bean prices from Mexico City, as well as on male uns-killed construction wages. These three grain products are the most representative of theMexican lower-class diet, while unskilled construction is representative of a lower-classmale urban occupation12.
Corn was the quintessential Mesoamerican grain, and the single most important itemin the consumer basket. Despite its higher price, wheat products were widely consumedas well, especially in the cities (Haslip-Viera, 1999: 32; Suárez Argüello, 1985: 124; VanYoung, 1981: 62). Frijol beans complemented corn and were typically eaten with corntortillas; together they provided the full range of proteins and hence made a diet feasibleand healthy without the need of animal protein. Frijol and corn were grown inter spersedin the same lot, and had similar environmental constraints (Ouweneel, 1996: 72-100; Su-per & Vargas, 2000). Several sources of price data informed the index: Corn and wheatprices before 1814 come from published sources using granary (alhóndiga) and bakers’periodical reports (Florescano, 1969; García-Acosta, 1988). Bean prices for 1801 and1810-1835 were obtained from the weekly purchase receipts of Franciscan institutions;the same source provided scattered corn and flour observations in the 1810s and 1820s13.The lacunae in coverage were resolved by imputing the missing years from available in-formation of related products, including some not used in the index such as chile, lard,rice, and flour14. Weights were established at 50 percent, 30 percent, and 20 percent for
pp. 21-44 ■ Abril 2009 ■ Historia Agraria, 4728
Amílcar Challú
HA47_:Maquetaci n HA 25/02/2009 17:21 PÆgina 28

15. See Appendix, Figure A.1 and Table A.1.16. Whether the food purchasing power of Mexican wages stood in international standards is ano-ther discussion, see DOBADO (2007).
corn, wheat and bean respectively, based on existing qualitative and quantitative evidence.Because the three products functioned as a market and a productive system (Challú, 2007:156-160). the imputation and the choice of relative weights do not alter the index in anyremarkable way. Information on construction wages is abundant in receipts, budgets, andreports of repairs and new construction of municipal buildings, convents, garrisons, hos-pitals, jails, and temples15.
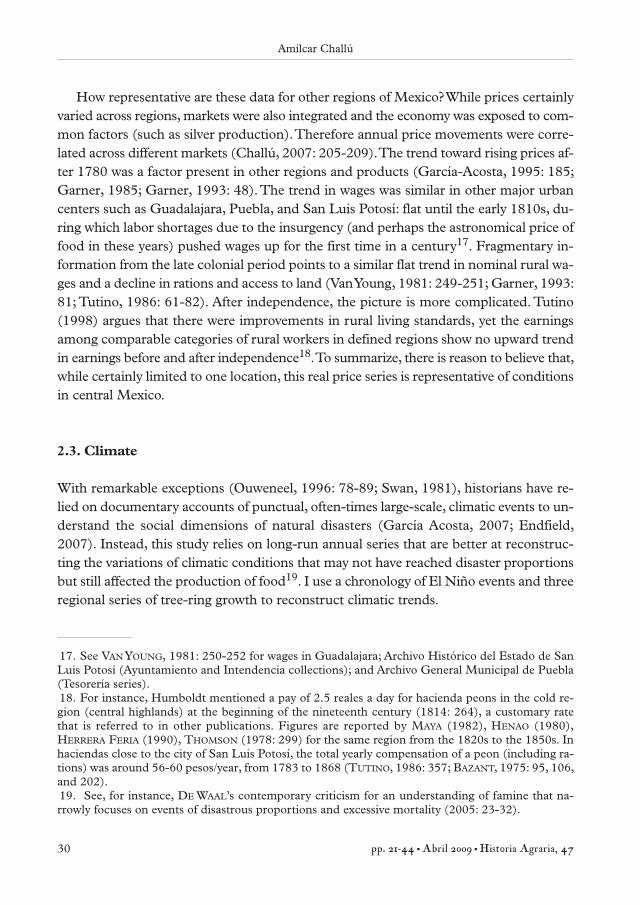
FIGURE 1Real Grain Price Index. Mexico City, 1730-1835
Notes: Vertical dashed lines mark the boundaries of birth cohorts used in the anthropometric analysis. Sour-ces: See Appendix, Figure A.1 and Table A.1.
Figure 1 shows that real food prices were stable from the 1730s until the early 1780s, withremarkable spikes in certain years such as 1742 and 1750, both years of known short-ages. In 1785, real prices peaked to the second highest point in the series, and afterwardprices continued to climb into the 1810s. They went down in the 1820s and 1830s, buton average they were higher than the levels of the 1800s. The decadal cycle movementsnoted by Florescano in his corn price series (1720-1814), can be seen in this study’s realprice index as well. Its coverage into the 1830s show two more spikes in real prices in 1818and 1829. Besides the cyclical spikes in prices, it is apparent that the inflationary trendin the price of food did not end at the end of the late colonial period, but extended intothe early national era16.
29Historia Agraria, 47 ■ Abril 2009 ■ pp. 21-44
Agricultural Crisis and Biological Well-Being in Mexico, 1730-1835
HA47_:Maquetaci n HA 25/02/2009 17:21 PÆgina 29
Amílcar Challú
30 pp. 21-44 ■ Abril 2009 ■ Historia Agraria, 47
17. See VANYOUNG, 1981: 250-252 for wages in Guadalajara; Archivo Histórico del Estado de SanLuis Potosí (Ayuntamiento and Intendencia collections); and Archivo General Municipal de Puebla(Tesorería series). 18. For instance, Humboldt mentioned a pay of 2.5 reales a day for hacienda peons in the cold re-gion (central highlands) at the beginning of the nineteenth century (1814: 264), a customary ratethat is referred to in other publications. Figures are reported by MAYA (1982), HENAO (1980),HERRERA FERIA (1990), THOMSON (1978: 299) for the same region from the 1820s to the 1850s. Inhaciendas close to the city of San Luis Potosí, the total yearly compensation of a peon (including ra-tions) was around 56-60 pesos/year, from 1783 to 1868 (TUTINO, 1986: 357; BAZANT, 1975: 95, 106,and 202).19. See, for instance, DE WAAL’s contemporary criticism for an understanding of famine that na-rrowly focuses on events of disastrous proportions and excessive mortality (2005: 23-32).
How representative are these data for other regions of Mexico? While prices certainlyvaried across regions, markets were also integrated and the economy was exposed to com-mon factors (such as silver production). Therefore annual price movements were corre-lated across different markets (Challú, 2007: 205-209). The trend toward rising prices af-ter 1780 was a factor present in other regions and products (García-Acosta, 1995: 185;Garner, 1985; Garner, 1993: 48). The trend in wages was similar in other major urbancenters such as Guadalajara, Puebla, and San Luis Potosí: flat until the early 1810s, du-ring which labor shortages due to the insurgency (and perhaps the astronomical price offood in these years) pushed wages up for the first time in a century17. Fragmentary in-formation from the late colonial period points to a similar flat trend in nominal rural wa-ges and a decline in rations and access to land (Van Young, 1981: 249-251; Garner, 1993:81; Tutino, 1986: 61-82). After independence, the picture is more complicated. Tutino(1998) argues that there were improvements in rural living standards, yet the earningsamong comparable categories of rural workers in defined regions show no upward trendin earnings before and after independence18. To summarize, there is reason to believe that,while certainly limited to one location, this real price series is representative of conditionsin central Mexico.
2.3. Climate
With remarkable exceptions (Ouweneel, 1996: 78-89; Swan, 1981), historians have re-lied on documentary accounts of punctual, often-times large-scale, climatic events to un-derstand the social dimensions of natural disasters (García Acosta, 2007; Endfield,2007). Instead, this study relies on long-run annual series that are better at reconstruc-ting the variations of climatic conditions that may not have reached disaster proportionsbut still affected the production of food19. I use a chronology of El Niño events and threeregional series of tree-ring growth to reconstruct climatic trends.
HA47_:Maquetaci n HA 25/02/2009 17:21 PÆgina 30

Agricultural Crisis and Biological Well-Being in Mexico, 1730-1835
Historia Agraria, 47 ■ Abril 2009 ■ pp. 21-44
El Niño-Southern Oscillation (ENSO) is one of the most important and well studiedglobal climatic circulation changes that affects rainfall and temperature—and as aconsequence agricultural conditions over the world. El Niño is followed by La Niña, awestward shift in circulation patterns that typically produces the contrary effects. Amongthe most tried and methodologically straightforward reconstructions is Quinn and Neal’schronology based on circumstantial historical accounts that are consistent with the oc-currence of El Niño (Quinn & Neal, 1992). The series is a benchmark in studies of El Niñoevents and has been corroborated with other data sources (e.g., tree-ring series, pressuredifferentials). Events are classified according to severity in an ordinal rank ranging fromzero to six (where zero is no event and four and greater are events of strong magnitude).
Climate scientists and economists are providing insight into El Niño’s general influenceon climatic conditions and agricultural output in Mexico20. For instance, recent El Niñoevents were found to lower corn production by ten percent in the present-day state ofMexico and by five percent in Jalisco, and negatively impact bean production in Guerreroand Zacatecas (Tiscareño López et al., 2003: 335). Precipitation is more concentrated inbig storms in the El Niño phase, increasing the risk of erosion. Concentrated precipita-tion coexists with a tendency for drought in the summer during El Niño years (Magañaet al., 2003) In strong events, the summer drought is followed by temperature declinesin the spring (Tiscareño López et al., 2003: 333), implying a greater risk of hail and frostslethal for the corn and bean harvest (Ouweneel, 1996: 72-87).
Recent tree-ring measurements in Mexico have led to a new understanding of long-term climatic patterns and their connection with historical events such as cycles of epi-demic disease and famine (Acuña-Soto et al., 2002; Therrell, 2005; Villanueva-Díaz et al.,2006). The annual growth of a tree is related to local ecological and climatic conditions.For this reason, tree ring series have been used to reconstruct regional drought indicesfor the last five centuries, as well as rainfall and temperature (Villanueva-Díaz et al., 2007).The latewood component of a ring is a darker section formed in late spring and summer,which makes it sensitive to the climatic conditions that influence the growth of corn andfrijol beans. Recent work has used the Douglas-fir’s latewood component in tree ring se-ries to reconstruct warm-season precipitation and agricultural yields over long periods oftime (Therrell et al., 2002: 6.1; Therrell et al., 2006: 497-498). Here I rely on series oflatewood ring growth based on Douglas-fir trees from three sites: El Salto, Durango; Pi-
31
20. In the historical literature, references to El Niño in Mexico are not unusual, but specific studiesare very limited; see, for instance, DAVIS (2001: 260-261), and GROVE (2007: 85).
HA47_:Maquetaci n HA 25/02/2009 17:21 PÆgina 31

21. The chronologies, constructed by Stahle, Therrell, Cleaveland, Villanueva-Díaz and Burns, areavailable in the International Tree Ring Database, World Data Center for Paleoclimatology,NOAA/NCDC Paleoclimatology Program, <http://www.ncdc.noaa.gov/paleo/treering.html> as da-tasets MEXI027, MEXI033, and MEXI037.
nal de Amole, in the boundary of Hidalgo and Mexico; and Villarreal, Veracruz21. The siteselection loosely matches the regionalization of the anthropometric dataset; the use of acommon tree species makes the data series more consistent.
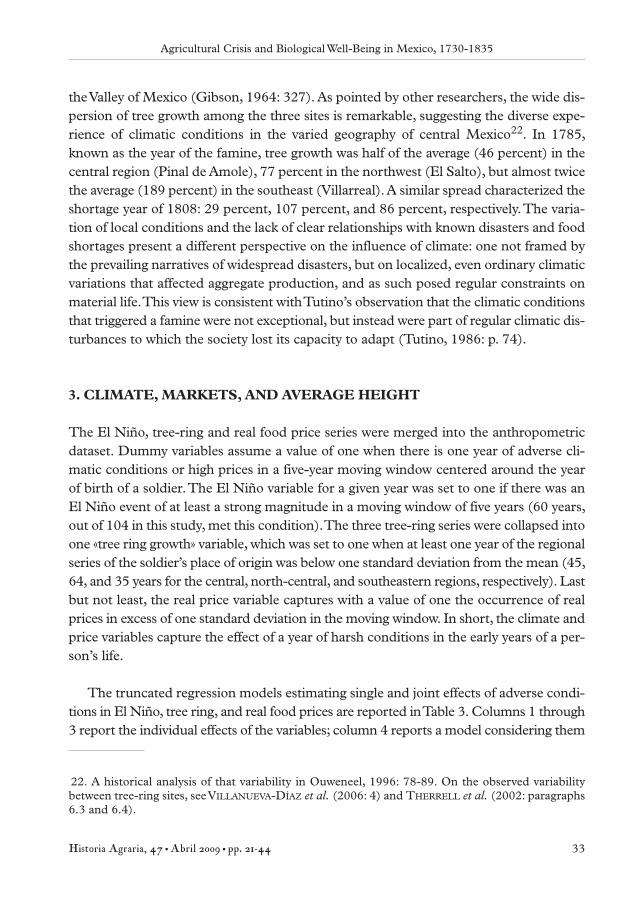
FIGURE 2El Niño Strength Index and Latewood Tree-Ring Growth. Central Mexico, 1730-1840
Notes: An El Niño index of six translates into a very strong event in Quinn & Neal’s chronology; two is anevent of moderate strength. Tree-ring growth is expressed as a range between the minimum and the maxi-mum value of the three regional series used in the analysis. Vertical dashed lines mark the boundaries of birthcohorts used in the anthropometric analysis. Sources: Quinn and Neal (1992); International Tree Ring Database, World Data Center for Paleoclimato-logy, NOAA/NCDC Paleoclimatology Program, <http://www.ncdc.noaa.gov/paleo/treering.html>.
Figure 2 plots the El Niño chronology and the range of the three tree ring series (whereone hundred is the average annual growth). El Niño events of varying strengths were morefrequent from 1803 to 1821 (nine in total, or about one every two years). However, ENSOevents are not correlated to well-known agricultural crises. If the 1749-50, 1785-86, 1808-09, and the 1819 crises were surrounded or pointed by El Niño (and likely La Niña fol-low-ups), events of a similar or greater magnitude failed to produce similar catastrophes.Similarly, the tree-ring series do not point to any clear-cut relations with known episodesof agricultural crisis. For instance, the 1750s and 1760s were a lapse of slow tree growthin the warm season, yet this period is known for the relatively good harvests, at least in
pp. 21-44 ■ Abril 2009 ■ Historia Agraria, 4732
Amílcar Challú
HA47_:Maquetaci n HA 25/02/2009 17:21 PÆgina 32
22. A historical analysis of that variability in Ouweneel, 1996: 78-89. On the observed variabilitybetween tree-ring sites, seeVILLANUEVA-DÍAZ et al. (2006: 4) and THERRELL et al. (2002: paragraphs6.3 and 6.4).
33
the Valley of Mexico (Gibson, 1964: 327). As pointed by other researchers, the wide dis-persion of tree growth among the three sites is remarkable, suggesting the diverse expe-rience of climatic conditions in the varied geography of central Mexico22. In 1785,known as the year of the famine, tree growth was half of the average (46 percent) in thecentral region (Pinal de Amole), 77 percent in the northwest (El Salto), but almost twicethe average (189 percent) in the southeast (Villarreal). A similar spread characterized theshortage year of 1808: 29 percent, 107 percent, and 86 percent, respectively. The varia-tion of local conditions and the lack of clear relationships with known disasters and foodshortages present a different perspective on the influence of climate: one not framed bythe prevailing narratives of widespread disasters, but on localized, even ordinary climaticvariations that affected aggregate production, and as such posed regular constraints onmaterial life. This view is consistent with Tutino’s observation that the climatic conditionsthat triggered a famine were not exceptional, but instead were part of regular climatic dis-turbances to which the society lost its capacity to adapt (Tutino, 1986: p. 74).
3. CLIMATE, MARKETS, AND AVERAGE HEIGHT
The El Niño, tree-ring and real food price series were merged into the anthropometricdataset. Dummy variables assume a value of one when there is one year of adverse cli-matic conditions or high prices in a five-year moving window centered around the yearof birth of a soldier. The El Niño variable for a given year was set to one if there was anEl Niño event of at least a strong magnitude in a moving window of five years (60 years,out of 104 in this study, met this condition). The three tree-ring series were collapsed intoone «tree ring growth» variable, which was set to one when at least one year of the regionalseries of the soldier’s place of origin was below one standard deviation from the mean (45,64, and 35 years for the central, north-central, and southeastern regions, respectively). Lastbut not least, the real price variable captures with a value of one the occurrence of realprices in excess of one standard deviation in the moving window. In short, the climate andprice variables capture the effect of a year of harsh conditions in the early years of a per-son’s life.
The truncated regression models estimating single and joint effects of adverse condi-tions in El Niño, tree ring, and real food prices are reported in Table 3. Columns 1 through3 report the individual effects of the variables; column 4 reports a model considering them
Historia Agraria, 47 ■ Abril 2009 ■ pp. 21-44
Agricultural Crisis and Biological Well-Being in Mexico, 1730-1835
HA47_:Maquetaci n HA 25/02/2009 17:21 PÆgina 33

Amílcar Challú
jointly. In all cases, the sign of the coefficients is negative as expected: harsh conditionsin the early years of life had negative effects on height. The effects, however, varied andthe estimation lacks statistical significance in some cases. El Niño had a more limited (andnot statistically significant) effect, while the occurrence of an adverse year in tree-ringgrowth and real prices had a more significant and pronounced penalty on height of around0.8 to 1 cm. In all the specifications, the effects of the birth cohort periods follow the de-clining trajectory pointed out in Table 2, suggesting that, despite their measurable and re-markable impact, climate and prices do not explain the overall trajectory of height in thetime period under study.
TABLE 3Effects of Climate and Prices on Heights in Centimeters(Truncated Regression Model) Central Mexico, 1732-1837
(1) (2) (3) (4)
El Niño -0.41 — — -0.51
Tree ring growth — -0.85 ** — -1.12 **
Real food prices — — -0.83 * -1.06 **
1732-1750 Ref. Ref. Ref. Ref.
1751-1780 -2.56 ** -1.97 ** -2.69 ** -2.37 **
1781-1810 -1.93 ** -1.49 ** -1.77 ** -1.15
1811-1821 -3.83 ** -3.60 ** -3.28 ** -2.99 **
1822-1837 -4.76 ** -4.52 ** -4.68 ** -4.62 **
Large city 0.80 ** 0.76 * 0.79 ** 0.77 **
Central Highlands Ref. Ref. Ref. Ref.
North Central Plateau 0.74 * 1.10 ** 0.80 ** 1.25 **
South 0.00 0.09 0.07 0.24
Dark skin -2.20 ** -2.16 ** -2.19 ** -2.16 **
Infrequent surname 0.54 0.55 0.55 0.53
Age (21-age) -1.04 ** -1.08 ** -0.99 ** -0.98 **
Constant 165.26 ** 165.00 ** 165.34 ** 165.67 **
Sigma 6.86 6.86 6.86 6.86
Observations 3,236 3,236 3,236 3,236Notes: The constant represents a soldier 21 years of age or older, from the Central Highlands region, bornon or before 1750, of white skin and a common surname, from a small town or countryside, who has notexperienced adverse climatic conditions in the early years of life. One star denotes significance at the tenpercent level; two stars at the five percent level. Source: see text.
The model using the three variables (column 4) calculates the effects jointly and is keyto gauging the importance of distributive factors affecting access to food against the im-
34 pp. 21-44 ■ Abril 2009 ■ Historia Agraria, 47
HA47_:Maquetaci n HA 25/02/2009 17:21 PÆgina 34

Agricultural Crisis and Biological Well-Being in Mexico, 1730-1835
Historia Agraria, 47 ■ Abril 2009 ■ pp. 21-44
portance of aggregate food availability. It isolates the macro- and micro-climatic effectsholding price changes constant, and vice versa. Climatic variables reflect real and expectedchanges in the supply of food. El Niño increases the volatility of conditions and affectsregions differently; while it may not have impacted local production, it affected produc-tion elsewhere and could raise the expectation of a shortage. Tree ring growth in the warmseason (as measured in the latewood component) approximates how much the climateaffects yields in a region. If market entitlements are marginal in the way to secure food,then the expectation is that the climatic variables have a stronger, negative effect on heightholding real prices constant. By contrast, if real prices still have a strong effect, it impliesthat the allocation of food via the market is a significant factor affecting people’s livingconditions. The effects in the combined model are similar to the individual-effect mod-els, with no co-linearity affecting the results. Tree ring growth and real food prices hadcomparable significant effects, both slightly higher than one centimeter. In conclusion, cli-matic shocks and high food prices exacted a measurable toll in biological well-being, evenif they did not explain the long-run trajectory of heights over time.
Climate and price effects are broken down by the rural or urban origin of the soldiersto assess different vulnerabilities and responses to agricultural crises. Table 4 reports theresults of the combined model of climatic and price effects for the urban and rural pop-ulation as defined previously in Table 2. The breakdown is meant to identify how muchterritorial power over agricultural hinterlands could have cushioned or further exposedlarge city dwellers to climatic shocks compared to the rest of the country; it is also meantto gauge the importance of market access to food in the two environments and hence gaina better appreciation of the importance of aggregate food availability and distributionalfactors in nutritional status.
The effects of adverse climatic and price conditions on height have all the expectednegative signs, although the magnitude and statistical significance vary notably. In the largecity population, the effects of tree ring growth is noticeable but not significant (-0.6 cm).El Niño and real food prices, by contrast, had a stronger effect, -1.1 and -1.3 cm, re-spectively. Conversely, the effects of regional climatic conditions were pronounced andsignificant in the rural areas, reaching -1.3 cm, while El Niño events had a much morereduced effect in rural areas. Real food prices had a noticeable effect of -0.88 cm, but theestimation lacks statistical significance (z=1.49, p=0.137). Despite the difference inmagnitude, the importance of real prices in the two groups is remarkable and highlightsthe bearing of the market in shaping access to food. As found in the entire sample, theuse of climate and price variables only slightly change the coefficients of the birth cohorts,suggesting that these variables do little to explain the overall decline in height.
35
HA47_:Maquetaci n HA 25/02/2009 17:21 PÆgina 35

Amílcar Challú
TABLE 4Effects of Climatic Factors and Food Prices on Large City and Rural Dwellers
(1) (2)
Towns and Rural Large Cities
El Niño -0.19 -1.09 *
Tree growth -1.34 ** -0.61
Real food prices -0.88 -1.32 *
1732-1750 Ref. Ref.
1751-1780 -1.82 -2.90 **
1781-1810 -1.07 -1.30
1811-1821 -3.60 ** -1.55
1822-1837 -4.89 ** -3.94 **
North Central Plateau 1.81 ** 0.10
Central Highlands Ref. Ref.
South 0.40 0.24
Dark skin -2.02 ** -2.22 **
Infrequent surname 0.17 0.99 *
Age (21-age) -0.72 * -1.32 **
Constant 165.44 ** 166.53 **
Sigma 6.86 6.86
Obs. 2,070 1,166Notes: The constant represents a soldier 21 years of age or older, from the CentralHighlands region, born on or before 1750, of white skin and a common surname,who has not experienced adverse climatic conditions in the early years of life. Onestar denotes significance at the ten percent level; two stars at the five percent level. Source: See text.
4. DISCUSSION AND CONCLUSIONS
Trends in biological well-being, real food prices, and climatic trends help to more pre-cisely draw the boundaries of the well-documented decline in living conditions of the latecolonial era, and bring new elements to the assessment of living conditions in the first twodecades after independence, a period marked by very limited data sources. The histori-cal literature shows a consensus in assessing the last decades of the colonial period as oneof decline in living standards, if not in general economic conditions. The assessment ofthe early national period (and even the decade of rural insurrection, the 1810s) is a morecontentious matter, ranging from pessimistic views (Coatsworth, 1978) to a more opti-mistic revisionism that has suggested that production and access to food improved as theeconomy reoriented toward subsistence agriculture (McCaa, 2000: 288; Tutino, 1998:406-407).
36 pp. 21-44 ■ Abril 2009 ■ Historia Agraria, 47
HA47_:Maquetaci n HA 25/02/2009 17:21 PÆgina 36
23. In contrast with SWAN’s conclusion (1981: 645).
The long-run decline in height and the rise in the cost of food both point to an ero-sion in the living standards of the popular sectors that extends into the early national era.By the end of the period, real food prices were higher than those paid in the late eighteenthcentury and almost fifty percent more than the prices before 1780. Height decline beganearlier, in the 1750s and extended into the 1830s. This decline in living standards standsin contrast to the optimistic view of the post-independence period, and is consistent withthe idea of a century of stagnation, extending to the 1850s or 1860s, as outlined in Brad-ing and Wu (1973).
The general decline corresponded with a widening gap between the stature of urbanand rural dwellers. Over the several birth cohorts under study, the height of soldiers fromlarge cities declined less than those from rural areas. On average, the population from largecities was taller than their counterparts from the countryside and small towns, in contrastwith the usual finding of an urban penalty in eighteenth and nineteenth century Europeand the United States. Other research dealing with the population in northern Mexicoin the mid and late nineteenth century, however, has found no significant difference be-tween farmers and the rest, in contrast with more pronounced differences among Amer-icans from western states (Carson, 2005: 414).
Climatic trends are not part of the erosion in living standards. In fact, climatic con-ditions were not harsher in any particular lapse of the period under study23. Moreover,the wide spread of local climatic conditions attests to the regional variability of climaticexperiences, highlighting that regions could complement each other in response to locallocal food shortages. Hence the there was an ample range of societal response to climaticdisasters. The lack of correlation between the increase in real grain prices and climatic con-ditions suggests that social and economic causes underlay the decline in market entitle-ments to food more than did climatic conditions. Among those causes, the increasing de-mand of marketable food by the enlarging urban, mining, and non-agricultural sector (atleast until 1810) and by rural dwellers who had more precarious access to land (Garner,1993; Miño, 2001; Tutino, 1986).
Finally, this work sheds light on the debates about the importance of climate, entitle-ments, and markets in the access to food that historical peasant societies (and in Mexicoin particular) had. The occurrence of adverse climatic conditions in the first years of lifehad measurable negative effects on biological well-being, as gauged by human height, giv-ing credence to the idea that shocks in aggregate availability of food were significant fac-
Agricultural Crisis and Biological Well-Being in Mexico, 1730-1835
Historia Agraria, 47 ■ Abril 2009 ■ pp. 21-44 37
HA47_:Maquetaci n HA 25/02/2009 17:21 PÆgina 37

Amílcar Challú
tors (Arnold, 1988; Tauger, 2003; Tilly, 1983). The shock of local climatic conditions,measured by the tree ring variable, was more important to the native populations of ru-ral areas and small towns. This likely reflects the nature of the entitlements of this group,which was more closely tied to land access. By contrast, in the large cities this factor is ofsmaller importance. The impact on height of strong El Niño events experienced in theearly years of life is, overall, smaller and less significant, but it is more pronounced in largecities. This suggests that cities cast a wider net to secure their supply, and while their pop-ulation was not as vulnerable to local harvest conditions, the macro conditions affectedits supply. The finding of a significant effect of real food prices on height is even more rel-evant. It counters entrenched views that markets were too fragmentary or matter little asa way to access food (Ouweneel, 1996: 118-9). The effect is certainly stronger in the largecity sample, but it is also pronounced in the rest of the population albeit with a higher un-certainty due to its lower statistical significance). In connection to structural changes inthe society that pointed to a greater importance of the division of labor, commercializa-tion, and urbanization (at least until independence), the affordability of food, along withits aggregate availability, became then a key factor in biological well-being in eighteenthand early nineteenth century Mexico.
By relying on anthropometric data to gauge the impact of agricultural crisis, and bring-ing new evidence to the record of agricultural crisis in the form of real food prices andannual climatic series, this article has sought to move away from the most well-knownevents of agricultural crisis, and instead shifted attention to the more regular occurrencesof regional and macro climatic anomalies, and grain price hikes that, while they may nothave triggered massive starvation and death, still shaped nutritional conditions andstrongly affected the material well-being of the Mexican popular classes.
ACKNOWLEDGEMENTS
The author would like to thank the careful review and suggestions of the journal’s re-viewers and editors. Rafael Dobado, Amy Robinson, Sergio Silva-Castañeda, and par-ticipants of the Historia Antropométrica Iberoamericana session at the Tercer CongresoInternacional de Historia Económica (Cuernavaca, 29 October 2007) commented themanuscript at different stages of its preparation. Amina Sharma copyedited the final ver-sion. The research was made possible by doctoral research funding from Harvard Uni-versity’s David Rockefeller Center for Latin American Studies, the Economic History As-sociation, and the Mellon Latin American History Fellowship at Harvard University.
38 pp. 21-44 ■ Abril 2009 ■ Historia Agraria, 47
HA47_:Maquetaci n HA 25/02/2009 17:21 PÆgina 38

REFERENCES
ACUÑA-SOTO, R., STAHLE, D. W., CLEVELAND, M. K., & THERRELL, M. D. (2002): «Me-gadrought and Megadeath in Sixteenth-Century Mexico», Emerging Infectious Dise-ases, 8(4), pp. 360-362.
A’HEARN, B. (2004): «A Restricted Maximum Likelihood Estimator for TruncatedHeight Samples», Economics and Human Biology, 2, pp.5-19.
ARCHER, C. I. (1977): The Army in Bourbon Mexico, 1760-1810, Albuquerque, Univer-sity of New Mexico Press.
ARNOLD, D. (1988): Famine: Social Crisis and Historical Change, Oxford, BlackwellPublishers.
BAZANT, J. (1975): Cinco haciendas mexicanas. Tres siglos de vida rural en San Luis Po-tosí (1600-1910), Mexico City, El Colegio de México.
BRADING, D. & WU, C. (1973): «Population Growth and Crisis: León, 1720-1860», Jour-nal of Latin American Studies, 5(1), pp. 1-36.
CÁMARA-HUESO, A. D. (2006): «Fuentes antropométricas en España: problemas meto-dológicos para los siglos XVIII y XIX», Historia Agraria, 38, pp. 105-118.
CÁMARA-HUESO, A. D. (2007): «La paradoja de la modernización en España: el descensode la estatura en el medio rural durante la fase expansiva del primer capitalismo agra-rio (1840-1880)», Paper presented at the Tercer Congreso Internacional de Historia Eco-nómica de la AMHE, Cuernavaca, 29 October.
CARSON, S. A. (2005): «The Biological Standard of Living in 19th century Mexico and inthe American West», Economics and Human Biology, 3(3), pp. 405-419.
CHALLÚ, A. (2007): Grain Markets, Food Supply Policies and Living Standards in LateColonial Mexico, PhD diss., Harvard University.
COATSWORTH, J. H. (1978): «Obstacles to Economic Growth in Nineteenth-CenturyMexico», American Historical Review, 83(1), pp. 80-100.
COPE, R. D. (1994): The Limits of Racial Domination: Plebeian Society in ColonialMexico City, 1660-1720, Madison, The University of Wisconsin Press.
DAVIS, M. (2001): Late Victorian Holocausts: El Niño Famines and the Making of the ThirdWorld, London, Verso.
DEWAAL, A. (2005): Famine that Kills: Darfur, Sudan, Oxford, Oxford University Press.DEPALO, J. and WILLIAM, A. (1997): The Mexican National Army, 1822-1852, College
Station, Texas, A&M University Press.DITELLA, T. (1973): «The Dangerous Classes in Early Nineteenth-Century Mexico», Jour-
nal of Latin American Studies, 5(1), pp. 79-105.DOBADO, R. (2007): «Precios y salarios en la Nueva España borbónica en perspectiva in-
ternacional comparada», Paper presented at the Tercer Congreso Internacional de His-toria Económica de la AMHE, Cuernavaca, 29 October.
Agricultural Crisis and Biological Well-Being in Mexico, 1730-1835
Historia Agraria, 47 ■ Abril 2009 ■ pp. 21-44 39
HA47_:Maquetaci n HA 25/02/2009 17:21 PÆgina 39
Amílcar Challú
DOBADO, R., GÓMEZ GALVARRIATO, A., & WILLIAMSON, J. G. (2008): «Globalization, De-Industrialization and Mexican Exceptionalism 1750-1879», Journal of Economic His-tory, 68(3), pp. 758-811.
ENDFIELD, G. H. (2007): «Climate and Crisis in Eighteenth Century Mexico», The Me-dieval History Journal, 10(1-2), pp. 99-125.
ESCOBAR OHMSTEDE, A. (2004): Desastres agrícolas en México. Catálogo histórico, siglo XIX
(1822-1900), Mexico City, CIESAS, Fondo de Cultura Económica.FLORESCANO, E. & SANVICENTE, V. (1985): Fuentes documentales para el estudio de la cri-
sis agrícola de 1809-1811, Mexico City, Universidad Nacional Autónoma de México.FLORESCANO, E. (1969): Precios del maíz y crisis agrícolas en México (1708-1810),
Mexico City, El Colegio de México.GARCÍA ACOSTA, V. (1988): Los precios del trigo en la historia colonial de México, Mexico
City, Ediciones de la Casa Chata.GARCÍA ACOSTA, V. (1995): «Comparación entre el movimiento de los precios del trigo y
del maíz y el alza generalizada de precios a fines de la época colonial», in GARCÍA
ACOSTA, V. (ed.), Los precios de alimentos y manufacturas novohispanos, Mexico City,Centro de Investigaciones y Estudios Superiores en Antropología Social and InstitutoMora, pp. 173-194.
GARCÍA ACOSTA, V. (2006): «Estrategias adaptativas y amenazas climáticas», in URBINA SO-RIA, J. & MARTÍNEZ, J. (eds.), Mas allá del Cambio Climático: las dimensiones psicoso-ciales del cambio ambiental global, Mexico City, Instituto Nacional de Ecología, Uni-versidad Nacional Autónoma de México, pp. 29-46.
GARCÍA ACOSTA, V. (2007): «Risks and Disasters in the History of the Mexico Basin: Arethey Climatic or Social?», The Medieval History Journal, 10(1-2), pp. 127-142.
GARCÍA ACOSTA, V., PÉREZ ZEVALLOS, J.M., & MOLINA DEL VILLAR, A. (2003): Desastresagrícolas en México: Catálogo histórico, Mexico City, Centro de Investigaciones y Es-tudios Superiores en Antropología Social and Fondo de Cultura Económica.
GARNER, R. (1985): «Price Trends in Eighteenth-Century Mexico», Hispanic AmericanHistorical Review, 65(2), pp. 279-326.
GARNER, R. (1993): Economic Growth and Change in Bourbon Mexico, Gainesville, FL,University Press of Florida.
GIBSON, C. (1964): The Aztecs Under Spanish Rule, Stanford, CA, Stanford UniversityPress.
GROVE, R. (2007): «The Great El Niño of 1789-93 and its Global Consequences: Re-constructing an Extreme Climate Event in World Environmental History», The Me-dieval History Journal, 10(1-2), pp. 75-98.
GUARDINO, P. F. (2005): The Time of Liberty: Popular Political Culture in Oaxaca, 1750-1850, Durham, Duke University Press.
40 pp. 21-44 ■ Abril 2009 ■ Historia Agraria, 47
HA47_:Maquetaci n HA 25/02/2009 17:21 PÆgina 40

Agricultural Crisis and Biological Well-Being in Mexico, 1730-1835
Historia Agraria, 47 ■ Abril 2009 ■ pp. 21-44 41
HASLIP-VIERA, G. (1999): Crime and Punishment in Late Colonial Mexico City, 1692-1810, Albuquerque, University of New Mexico Press.
HENAO, L. E. (1980): Tehuacán. Campesinado e Irrigación, Mexico City, Edicol.HERRERA FERIA, M. D. L. (1990): «Trabajadores prófugos y endeudados en la región de
Atlixco, durante la Segunda mitad del siglo XIX», in JARQUÍN ORTEGA, M. T. (ed.), Sim-posio Origen y Evolución de la Hacienda en México: siglos XVI al XX, El Colegio Me-xiquense, A.C., pp. 143-150.
HUMBOLDT, A. V. (1814): Political Essay on the Kingdom of New Spain, London, Long-man, Hurst, Rees, Orme, and Brown.
KELLY, A. R. (1947): Physical Anthropology of a Mexican Population in Texas; a Study inRace-Mixture, New Orleans, Middle American Research Institute, Tulane Universityof Louisiana.
KOMLOS, J. (2004): «How to (and How Not to) Analyze Deficient Height Samples», His-torical Methods, 37(1), pp. 160-173.
LÓPEZ-ALONSO, M. (2007): «Growth with Inequality: Living Standards in Mexico, 1850-1950», Journal of Latin American Studies, 39(1), pp. 81-105.
MAGAÑA, V., VÁZQUEZ, J. L., PÉREZ, J. L., & PÉREZ, J. B. (2003): «Impact of El Niño onPrecipitation in Mexico», Geofísica Internacional, 42(3), pp. 313-330.
MAYA, C. (1982): «Estructura y funcionamiento de una hacienda jesuita: San José Acol-man (1740-1840)», Ibero-Amerikanisches Archiv, 8(4), pp. 328-359.
MCCAA, R. (1993): «The Peopling of Nineteenth-Century Mexico: Critical Scrutiny ofa Censured Century», Statistical Abstract of Latin America, 30(1), pp. 602-633.
MCCAA, R. (2000): «The Peopling of Mexico from the Origins to Revolution», in M. R.HAINES & R. H. STECKEL (eds.), A Population History of North America, Cambridge,Cambridge University Press, pp. 241-304.
MIÑO GRIJALVA, M. (2001): El mundo novohispano: Población, ciudades y economía, siglosXVII y XVIII, Mexico City, El Colegio de México and Fondo de Cultura Económica.
MORENO TOSCANO, A. (1998): «Economía regional y urbanización: ciudades y regionesen Nueva España», in SILVA RIQUER, J. & LÓPEZ MARTÍNEZ, J. (coords.), MercadoInterno en México. Siglos XVIII-XIX, Mexico City, Instituto Mora, pp. 64-93.
MORIN, C. (1979): «Techniques et productivité sur les haciendas mexicaines au XVIIIe siè-cle», North-South/Nord-Sud: Canadian Journal of Latin American Studies/Revue ca-nadienne des études latino-américaines, 4(7), pp. 1-20.
OUWENEEL, A. (1996): Shadows over Anáhuac: An Ecological Interpretation of Crisis andDevelopment in Central Mexico, 1730-1800, Alburquerque, University of New MexicoPress.
QUINN, W. H. & NEAL, V. T. (1992): «The historical record of El Niño events», in BRA-DLEY, R. S. & JONES, P.D. (eds.), Climate since AD 1500, London, Routledge, pp. 623-648.
HA47_:Maquetaci n HA 25/02/2009 17:21 PÆgina 41

Amílcar Challú
42 pp. 21-44 ■ Abril 2009 ■ Historia Agraria, 47
SEN, A. (1990): «Food, Economics and Entitlements», in SEN, A. & DREZE, J. (eds.),ThePolitical Economy of Hunger, Oxford, Oxford University Press, pp. 34-52.
STATACORP (2005): Stata Statistical Software: Release 9, College Station, TX, StataCorpLP.
SUÁREZ ARGÜELLO, C. E. (1985): La política cerealera en la economía novohispana: el casodel trigo, Mexico City, Centro de Investigaciones y Estudios Superiores en Antropo-logía Social.
SUPER, J. C. & VARGAS, L. A. (2000): «Mexico and Highland Central America», in KIPLE,K. F. & ORNELAS, K. C. (eds.), The Cambridge World History of Food, Cambridge, UK,Cambridge University Press, pp. 1248-1254.
SWAN, S. L. (1981): «Mexico in the Little Ice Age», Journal of Interdisciplinary History,11(4), pp. 633-648.
TAUGER, M. (2003): «Entitlement, Shortage and the 1943 Bengal Famine: AnotherLook», The Journal of Peasant Studies, 31(1), pp. 45-72.
THERRELL, M. D. (2005): «Tree rings and ‘El Año del Hambre’ in Mexico», Dendroch-ronologia, 22(3), pp. 203-207.
THERRELL, M. D., STAHLE, D. W., DIAZ, J. V., OVIEDO, E. H. C., & CLEAVELAND, M. K.(2006): «Tree-Ring Reconstructed Maize Yield in Central Mexico: 1474-2001», Cli-matic Change, 74(4), pp. 493-504.
THERRELL, M., STAHLE, D. W., CLEAVELAND, M. K., & VILLANUEVA-DIAZ, J. (2002):«Warm Season, Tree Growth and Precipitation Over Mexico», Journal of GeophysicalResearch, 107(D14), ACL, pp. 6.1-6.8.
THOMSON, G. (1978): Puebla de los Angeles, 1800-1850, PhD diss., Oxford University.TILLY, L. A. (1983): «Food Entitlement, Famine, and Conflict», Journal of Interdiscipli-
nary History, 14(2), pp. 333-349.TISCAREÑO LÓPEZ, M., IZAURRALDE, C., ROSENBERG, N., BÁEZ GONZÁLEZ, A. D. & SA-
LINAS GARCÍA, J. (2003): «Modeling El Niño Southern Oscillation climate impact onMexican agriculture», Geofísica Internacional, 42(3), pp. 331-339.
TUTINO, J. (1986): From Insurrection to Revolution in Mexico: Social Bases of AgrarianViolence, 1750-1940, Princeton, NJ, Princeton University Press.
TUTINO, J. (1998): «The Revolution in Mexican Independence: Insurgency and the Re-negotiation of Property, Production, and Patriarchy in the Bajío, 1800-1855», Hispa-nic American Historical Review, 78(3), pp. 367-418.
VANYOUNG, E. (1981): Hacienda and Market in Eighteenth-Century Mexico: The RuralEconomy of the Guadalajara Region, 1675-1820, Berkeley, CA, University of CaliforniaPress.
VANYOUNG, E. (1987): «The Rich Get Richer and the Poor Get Skewed: Real Wages andPopular Living Standards in Late Colonial Mexico», Paper presented at the All-UC
HA47_:Maquetaci n HA 25/02/2009 17:21 PÆgina 42

Agricultural Crisis and Biological Well-Being in Mexico, 1730-1835
Historia Agraria, 47 ■ Abril 2009 ■ pp. 21-44
Group in Economic History, California Institute of Technology/ Huntington Library, LosAngeles.
VILLANUEVA-DÍAZ, J., CERANO-PAREDES, J., STAHLE, D. W., LUCKMAN, B. H., & THERRELL,M. (2006): «Historical Droughts in North-Central Mexico», North AmericanDrought Monitor Workshop, http://www.ncdc.noaa.gov/oa/climate/research/2006/nadm-workshop /20061018/1161201000-abstract.pdf.
VILLANUEVA-DÍAZ, J., STAHLE, D. W., LUCKMAN, B. H., CERANO-PAREDES, J., THERRELL,M., CLEAVELAND, M. K. et al. (2007): «Winter-Spring Precipitation Reconstructionsfrom Tree Rings for Northeast Mexico», Climatic Change, 83, pp. 117-131.
APPENDIX
FIGURE A.1Nominal Wage and Grain Price Indices. Mexico City, 1730-1838.
Sources: Grain prices were obtained from Florescano (1969), Florescano and San Vicente (1985: 305-306),García-Acosta (1988), and Convento Grande de San Francisco, «Libro de recibo y gasto de enfermería 1810-1836», and Hospital de San Pedro, «Libro de recibos y gastos del mismo 1824-1853», in Biblioteca Nacio-nal, Fondo Reservado, Manuscritos, Ms 1038 and 1562, respectively. The wage sources were scattered acrosscollections of different archives: Archivo General de la Nación (collections Bienes Nacionales, Hospital deJesús, Hospitales, Policía y Empedrados, Templos y Conventos), Archivo Histórico del Distrito Federal (sec-tion Ayuntamiento), Archivo de la Secretaría de Salubridad del Distrito Federal, and Fondo Reservado dela Biblioteca Nacional (Manuscritos collection).
43
HA47_:Maquetaci n HA 25/02/2009 17:21 PÆgina 43

Amílcar Challú
TABLE A.1Annual Wage and Grain Price Indices (Base average = 100). Mexico City, 1730-1838
Year NCW NGP RGP Year NCW NGP RGP Year NCW NGP RGP1730 95 68 71 1767 95 61 65 1804 95 85 891731 95 79 83 1768 95 61 64 1805 95 98 1031732 95 71 74 1769 95 66 69 1806 95 117 1231733 95 68 72 1770 95 86 90 1807 95 104 1091734 95 55 58 1771 95 83 87 1808 95 117 1231735 95 64 67 1772 95 94 99 1809 95 133 1391736 95 62 65 1773 95 88 92 1810 95 157 1651737 95 73 77 1774 95 87 91 1811 98 162 1651738 95 81 85 1775 95 71 75 1812 100 160 1601739 108 80 75 1776 95 78 82 1813 108 161 1491740 108 86 80 1777 95 58 61 1814 108 137 1271741 95 109 115 1778 95 57 60 1815 122 155 1271742 95 104 109 1779 95 69 73 1816 117 159 1361743 95 68 72 1780 95 90 94 1817 128 183 1441744 95 68 72 1781 95 104 110 1818 128 148 1161745 95 73 77 1782 95 86 91 1819 105 199 1901746 95 85 90 1783 101 86 85 1820 133 137 1031747 95 81 85 1784 95 75 79 1821 114 136 1191748 95 83 87 1785 95 137 144 1822 114 114 1001749 95 105 110 1786 95 172 180 1823 114 139 1221750 95 122 129 1787 95 124 131 1824 117 105 901751 95 92 97 1788 95 89 93 1825 117 135 1151752 95 88 93 1789 95 85 89 1826 115 140 1221753 95 66 69 1790 92 94 102 1827 120 139 1161754 95 66 70 1791 95 78 82 1828 120 130 1081755 95 62 66 1792 95 82 86 1829 102 148 1461756 95 68 72 1793 95 88 92 1830 121 122 1011757 95 84 89 1794 85 87 102 1831 112 125 1111758 95 84 88 1795 83 92 111 1832 112 143 1271759 95 72 76 1796 95 78 82 1833 112 127 1131760 95 85 89 1797 95 98 103 1834 112 133 1191761 95 79 83 1798 95 112 117 1835 112 165 1471762 95 70 74 1799 95 108 114 1836 1151763 95 59 62 1800 95 109 115 1837 1111764 95 58 61 1801 95 104 109 1838 951765 95 57 60 1802 95 122 1281766 95 59 62 1803 95 91 96Notes: NCW stands for the nominal construction wage index, NGP for the nominal grain price index. Forboth, the base is average = 100. RGP stands for real grain price index and is the division of NCW and NGP. Source: See Figure A.1.
44 pp. 21-44 ■ Abril 2009 ■ Historia Agraria, 47
HA47_:Maquetaci n HA 25/02/2009 17:21 PÆgina 44