Market Share Expansion Financing (Msef)Diaporama
28
-
Upload
business-3g -
Category
Documents
-
view
689 -
download
0
Transcript of Market Share Expansion Financing (Msef)Diaporama
Market Share Market Share Expansion Financing Expansion Financing
(MSEF(MSEF®®))
An NFC/ Northern Finance Corporation An NFC/ Northern Finance Corporation ProductProduct
To maximizeTo maximizeYourYour
Financial Performance and ProfitFinancial Performance and Profit
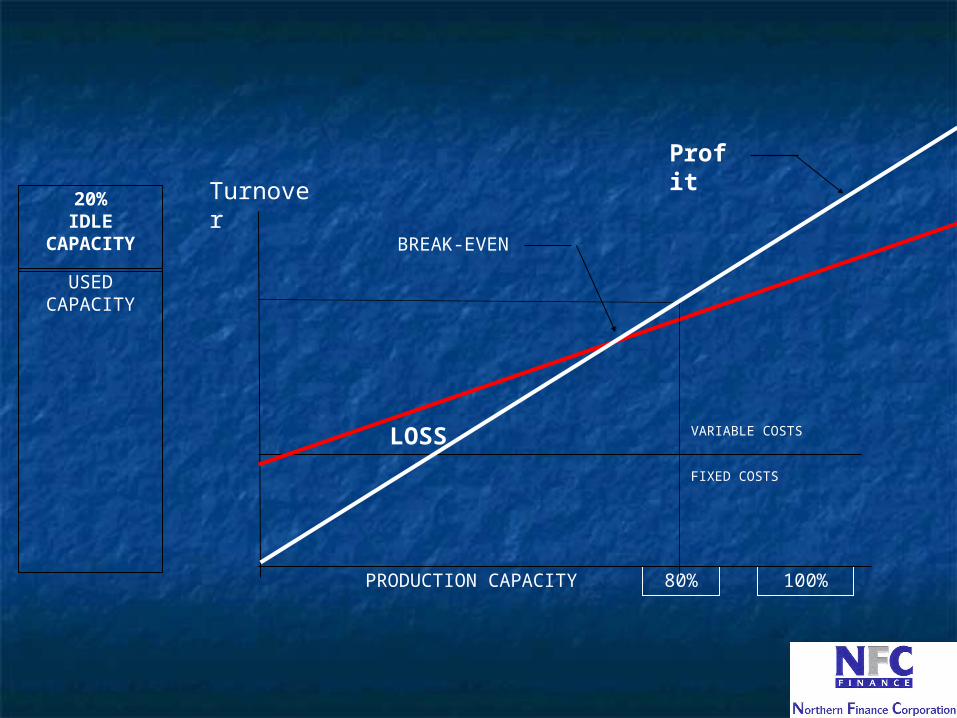
100%80%
USED CAPACITY
20%IDLE
CAPACITY BREAK-EVEN
LOSS
PRODUCTION CAPACITY
FIXED COSTS
VARIABLE COSTS
Profit
Turnover
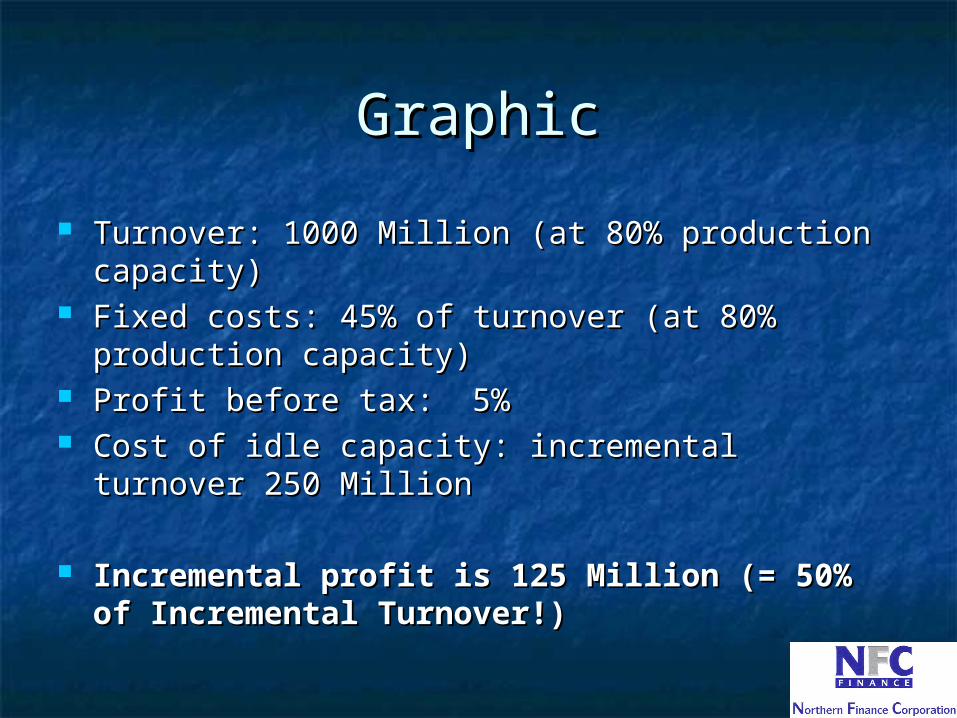
GraphicGraphic
Turnover: 1000 Million (at 80% production Turnover: 1000 Million (at 80% production capacity)capacity)
Fixed costs: 45% of turnover (at 80% production Fixed costs: 45% of turnover (at 80% production capacity)capacity)
Profit before tax:Profit before tax: 5%5% Cost of idle capacity: incremental turnover 250 Cost of idle capacity: incremental turnover 250
MillionMillion
Incremental profit is 125 Million (= 50% of Incremental profit is 125 Million (= 50% of Incremental Turnover!)Incremental Turnover!)
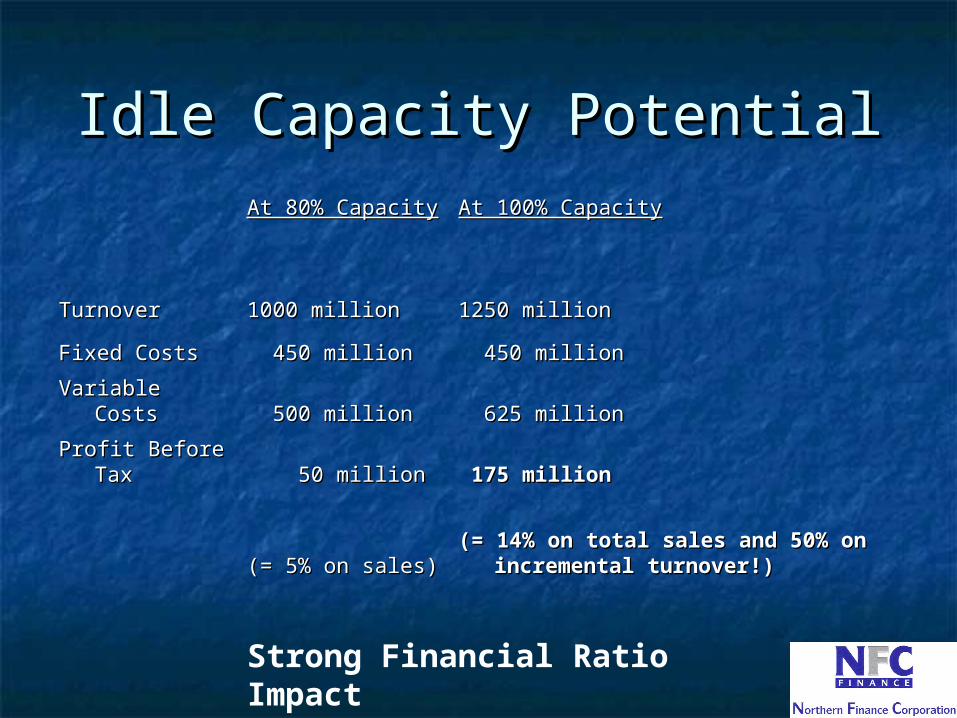
Idle Capacity PotentialIdle Capacity PotentialAt 80% CapacityAt 80% Capacity At 100% CapacityAt 100% Capacity
TurnoverTurnover 1000 million1000 million 1250 million1250 million
Fixed CostsFixed Costs 450 million450 million 450 million450 million
Variable CostsVariable Costs 500 million500 million 625 million625 million
Profit Before Profit Before TaxTax 50 million50 million 175 million175 million
(= 5% on sales)(= 5% on sales)(= 14% on total sales and 50% on (= 14% on total sales and 50% on
incremental turnover!)incremental turnover!)
Strong Financial Ratio Impact
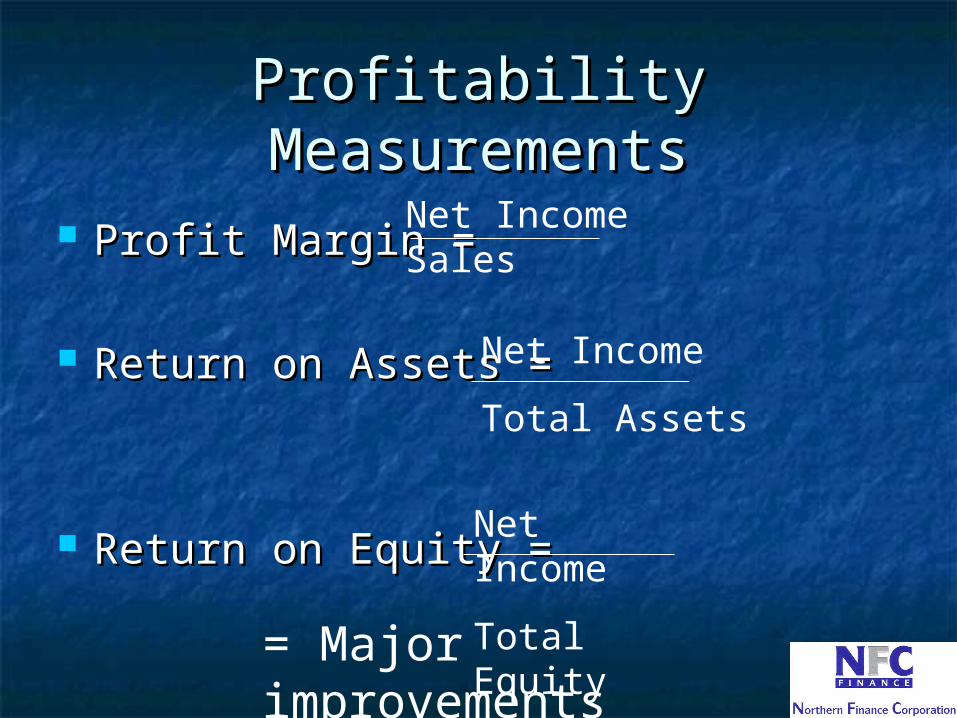
Profitability MeasurementsProfitability Measurements
Profit Margin =Profit Margin =
Return on Assets =Return on Assets =
Return on Equity = Return on Equity =
Net IncomeSales
Net Income
Total Assets
Net Income
Total Equity
= Major improvements
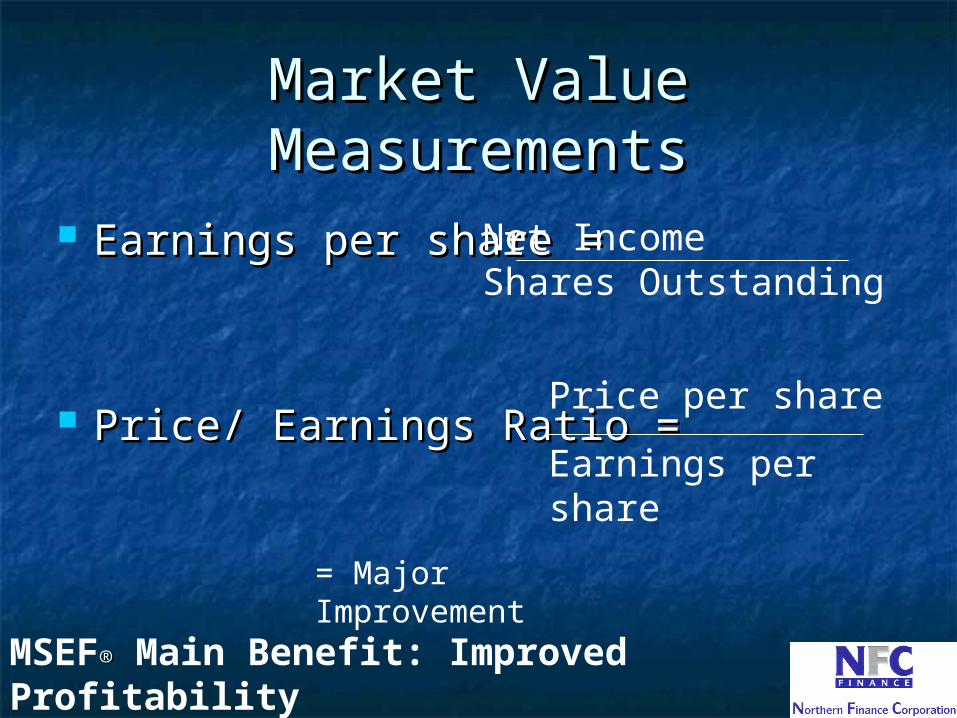
Market Value MeasurementsMarket Value Measurements
Earnings per share = Earnings per share =
Price/ Earnings RatioPrice/ Earnings Ratio = =
Net IncomeShares Outstanding
Price per share
Earnings per share
MSEF®® Main Benefit: Improved Profitability
= Major Improvement
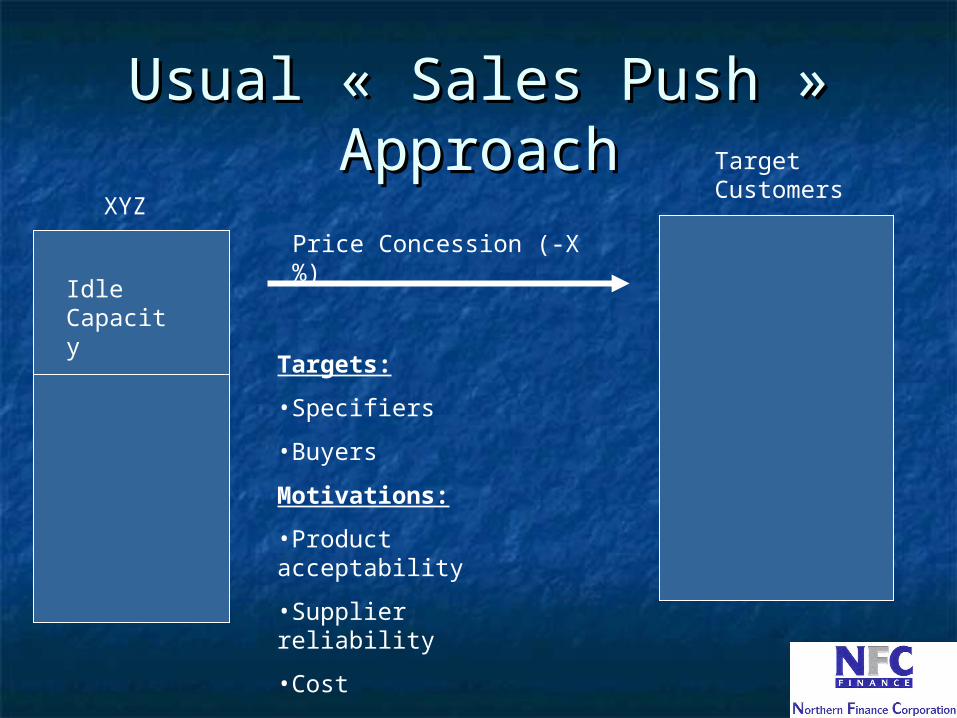
Usual « Sales Push » Usual « Sales Push » ApproachApproach
XYZ
Idle Capacity
Target Customers
Price Concession (-X%)
Targets:
•Specifiers
•Buyers
Motivations:
•Product acceptability
•Supplier reliability
•Cost
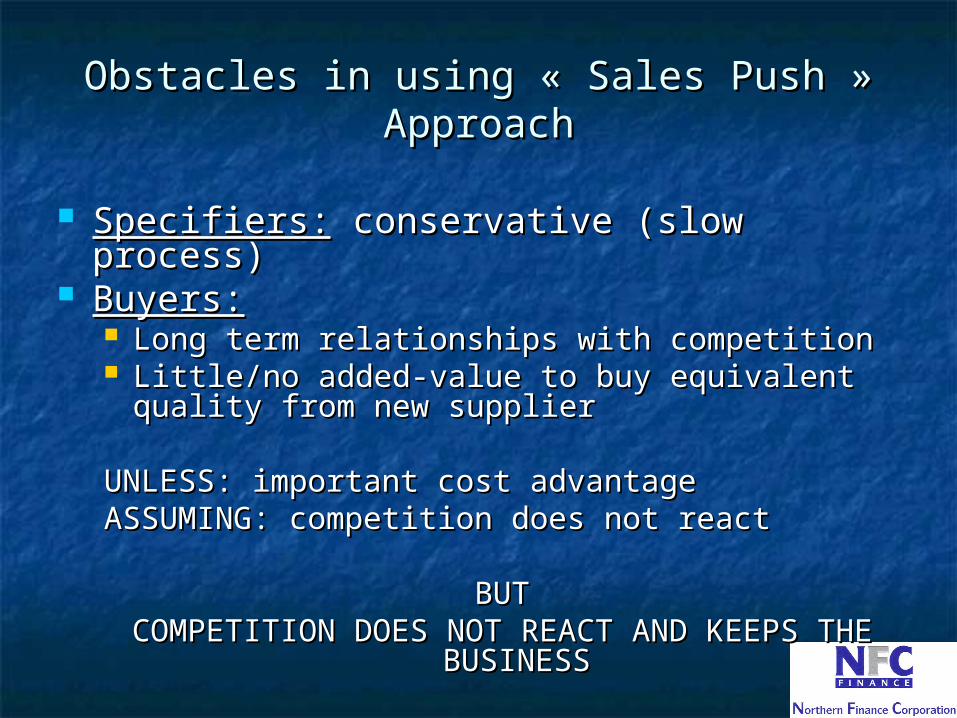
Obstacles in using « Sales Push » Obstacles in using « Sales Push » ApproachApproach
Specifiers:Specifiers: conservative (slow process) conservative (slow process) Buyers:Buyers:
Long term relationships with competitionLong term relationships with competition Little/no added-value to buy equivalent quality Little/no added-value to buy equivalent quality
from new supplierfrom new supplier
UNLESS: important cost advantageUNLESS: important cost advantageASSUMING: competition does not reactASSUMING: competition does not react
BUTBUTCOMPETITION DOES NOT REACT AND KEEPS THE COMPETITION DOES NOT REACT AND KEEPS THE
BUSINESSBUSINESS
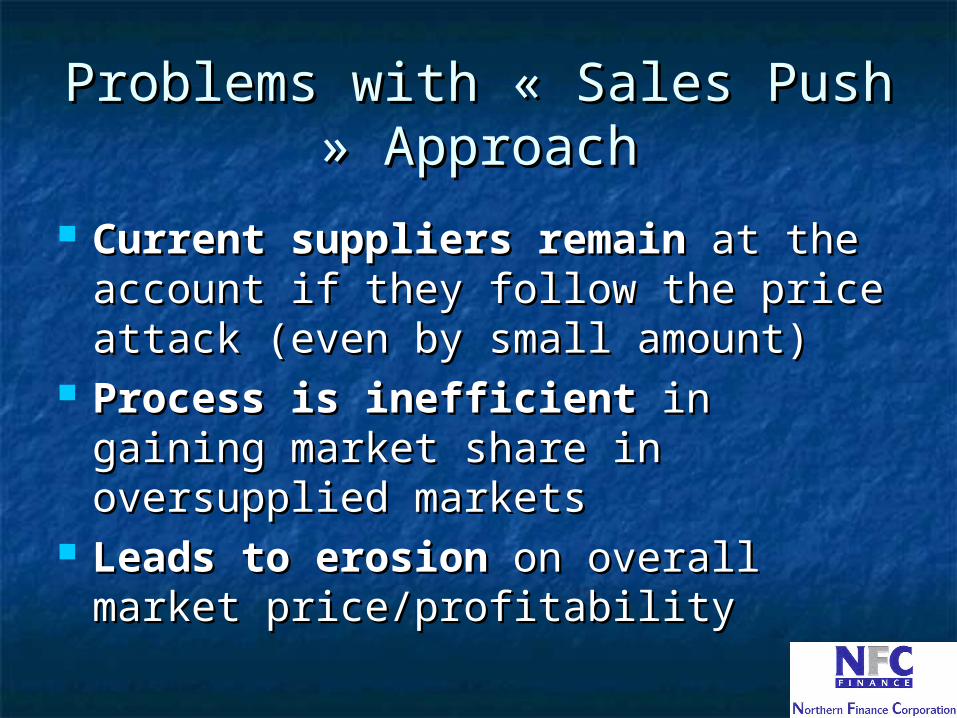
Problems with « Sales Push » Problems with « Sales Push » ApproachApproach
Current suppliers remainCurrent suppliers remain at the at the account if they follow the price account if they follow the price attack (even by small amount)attack (even by small amount)
Process is inefficientProcess is inefficient in gaining in gaining market share in oversupplied market share in oversupplied marketsmarkets
Leads to erosionLeads to erosion on overall market on overall market price/profitabilityprice/profitability
The « Sales Push » ApproachThe « Sales Push » Approachis is
A DEAD END!A DEAD END!
What is the REAL solution?What is the REAL solution?
The MSEF® MethodThe MSEF® Method
What IF….What IF….
Instead of sellingInstead of selling
……We buy?We buy?
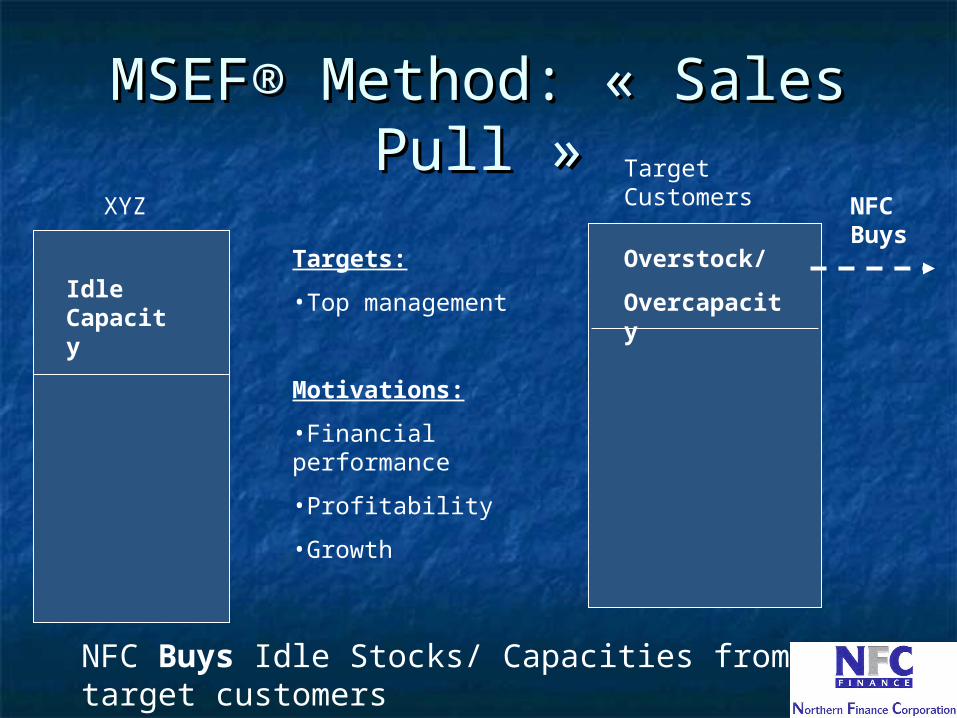
MSEF® Method: « Sales PullMSEF® Method: « Sales Pull »»
XYZ
Idle Capacity
Targets:
•Top management
Motivations:
•Financial performance
•Profitability
•Growth
Target Customers
Overstock/
Overcapacity
NFC Buys
NFC Buys Idle Stocks/ Capacities from target customers
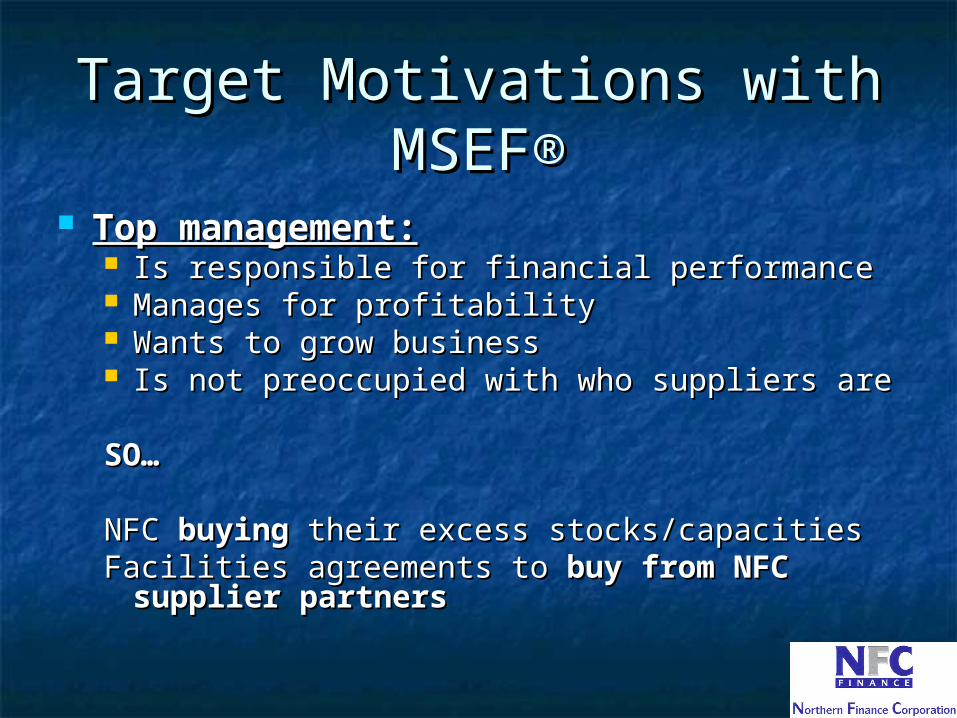
Target Target Motivations withMotivations with MSEFMSEF®®
Top management:Top management: Is responsible for financial performanceIs responsible for financial performance Manages for profitabilityManages for profitability Wants to grow businessWants to grow business Is not preoccupied with who suppliers areIs not preoccupied with who suppliers are
SO…SO…
NFC NFC buyingbuying their excess stocks/capacities their excess stocks/capacitiesFacilities agreements to Facilities agreements to buy from NFC buy from NFC
supplier partnerssupplier partners
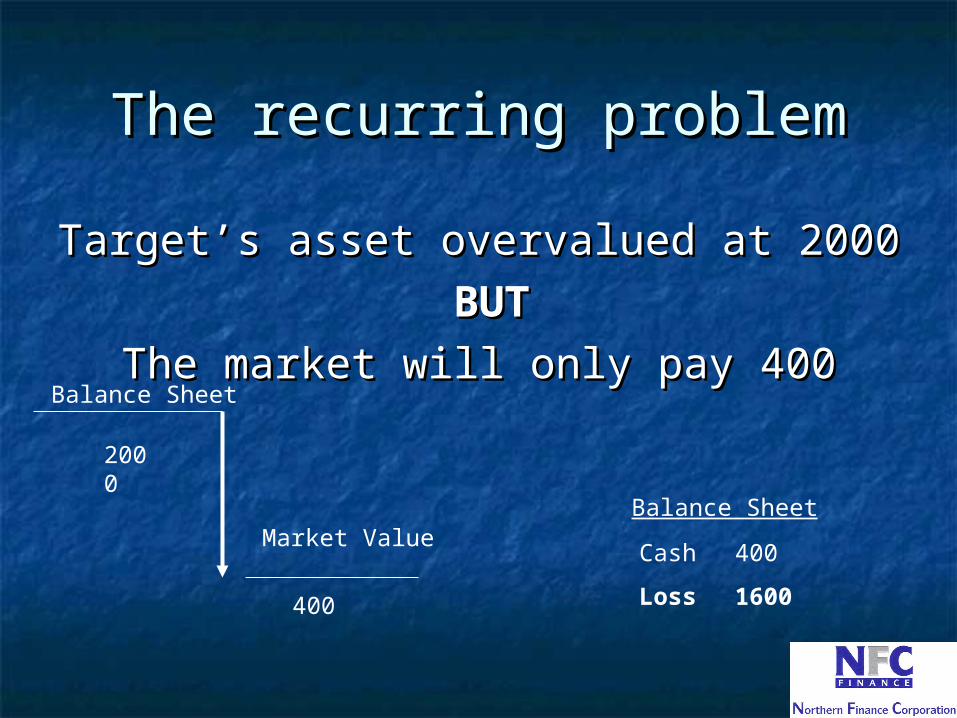
The recurring problemThe recurring problem
Target’s asset overvalued at 2000Target’s asset overvalued at 2000
BUTBUT
The market will only pay 400The market will only pay 400Balance Sheet
Market ValueBalance Sheet
Cash 400
Loss 1600400
2000
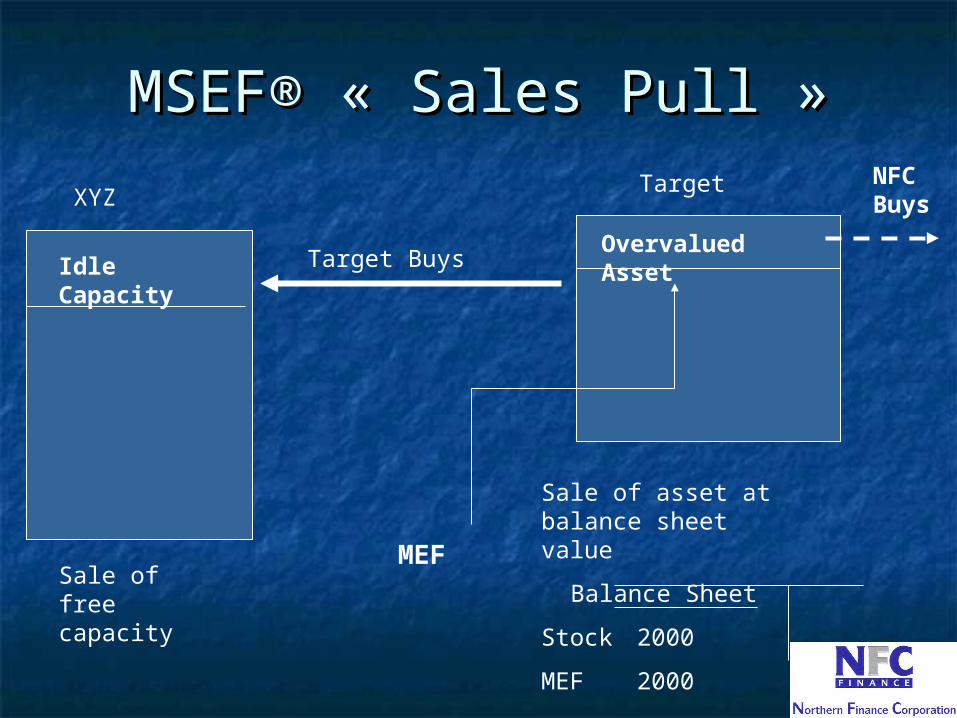
MSEFMSEF®® « Sales Pull » « Sales Pull »
Idle Capacity
XYZ
Overvalued Asset
Target
Target Buys
Sale of free capacity
MEF
Sale of asset at balance sheet value
Balance Sheet
Stock 2000
MEF 2000
NFC Buys
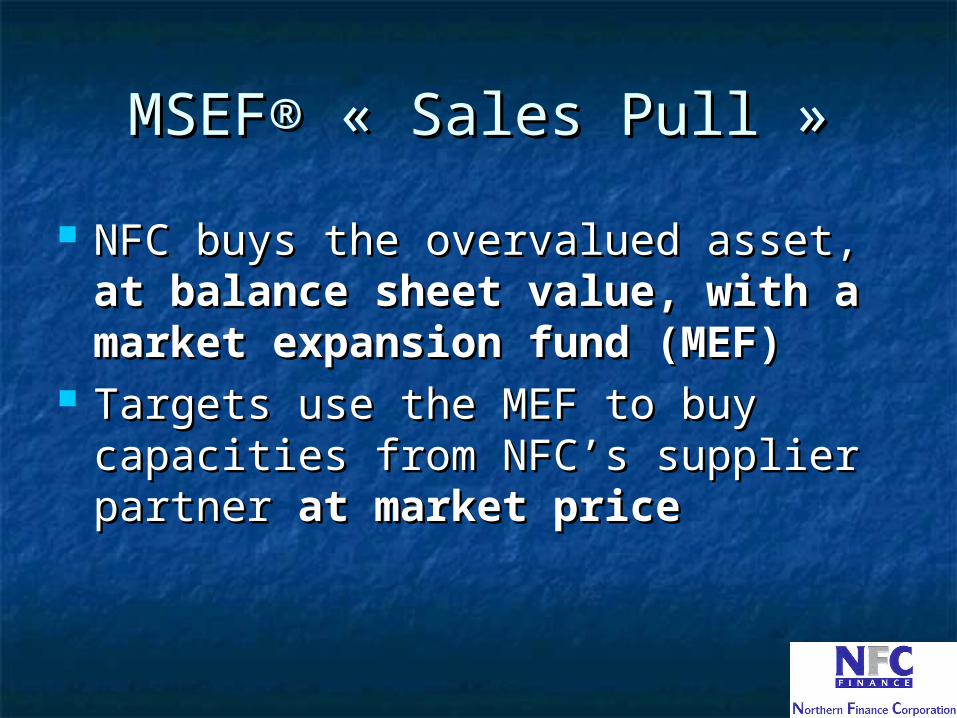
MSEFMSEF®® « Sales Pull » « Sales Pull »
NFC buys the overvalued asset, NFC buys the overvalued asset, at at balance sheet value, with a balance sheet value, with a market expansion fund (MEF)market expansion fund (MEF)
Targets use the MEF to buy Targets use the MEF to buy capacities from NFC’s supplier capacities from NFC’s supplier partner partner at market priceat market price
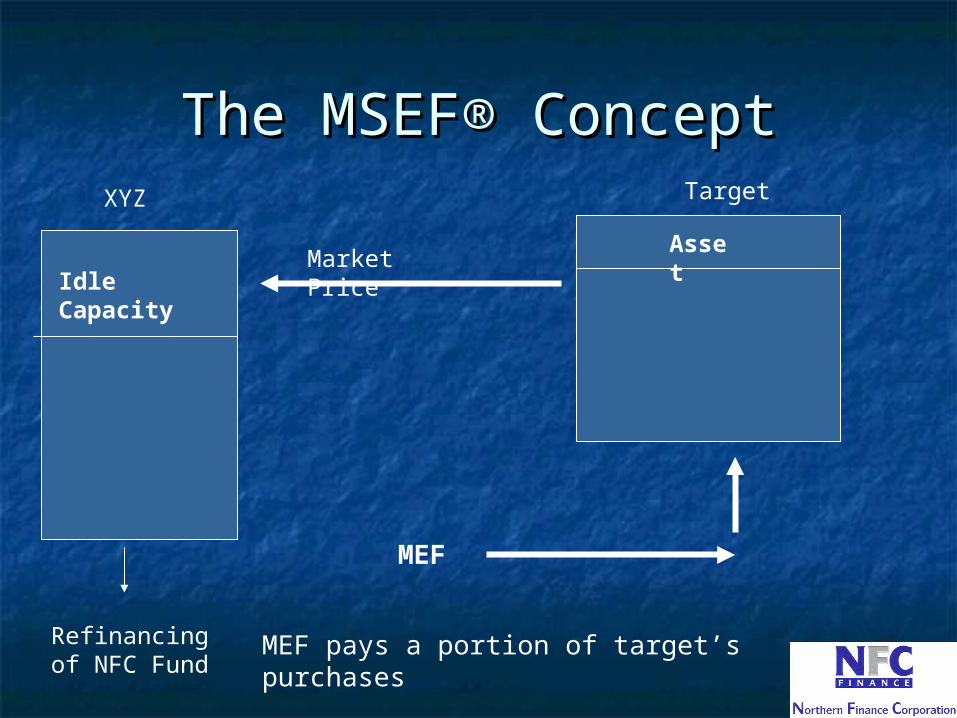
The MSEF® ConceptThe MSEF® ConceptXYZ
Asset
Target
Market Price
Refinancing of NFC Fund
MEF
Idle Capacity
MEF pays a portion of target’s purchases
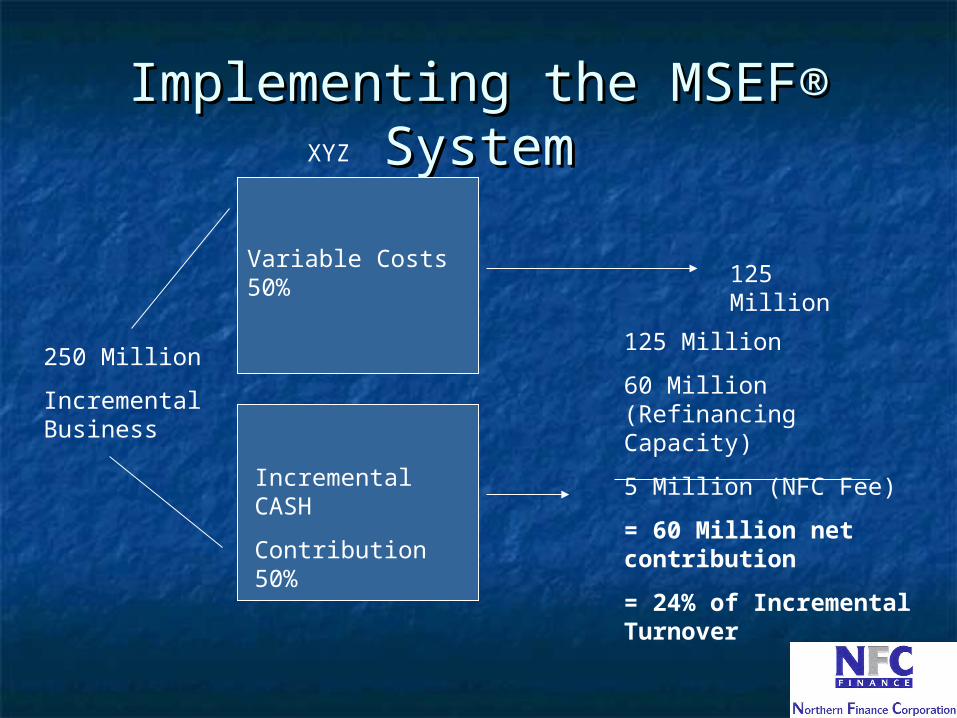
Implementing the MSEF® Implementing the MSEF® SystemSystemXYZ
Variable Costs 50%
Incremental CASH
Contribution 50%
250 Million
Incremental Business
125 Million
125 Million
60 Million (Refinancing Capacity)
5 Million (NFC Fee)
= 60 Million net contribution
= 24% of Incremental Turnover
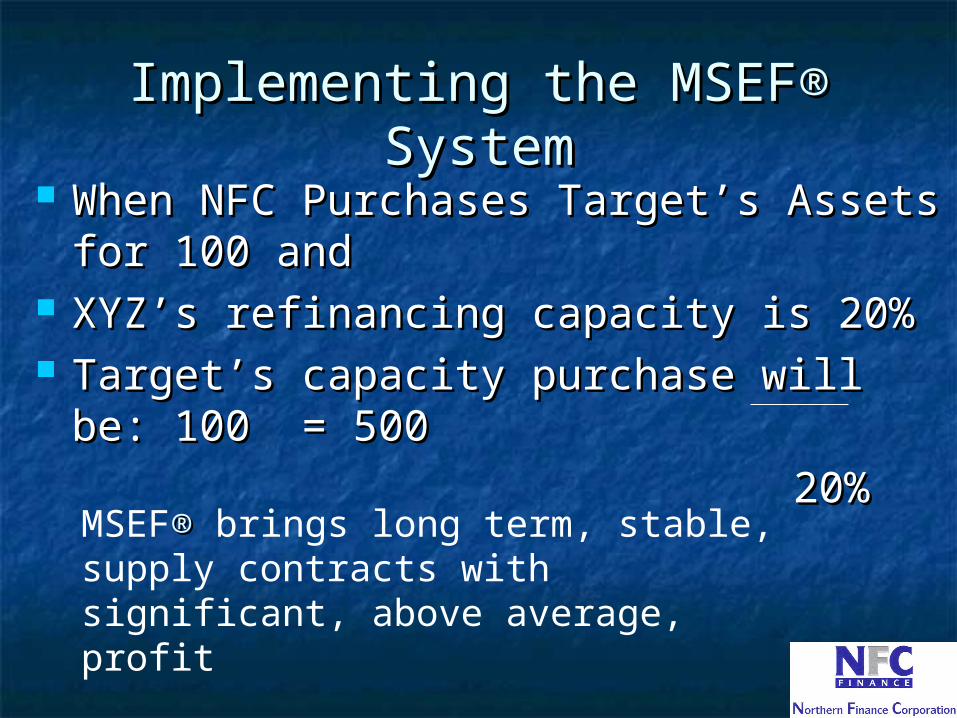
Implementing the MSEF® Implementing the MSEF® SystemSystem
When NFC Purchases Target’s Assets for When NFC Purchases Target’s Assets for 100 and100 and
XYZ’s refinancing capacity is 20%XYZ’s refinancing capacity is 20% Target’s capacity purchase will be: 100 Target’s capacity purchase will be: 100
= 500= 500
20% 20% MSEF®® brings long term, stable, supply contracts with significant, above average, profit
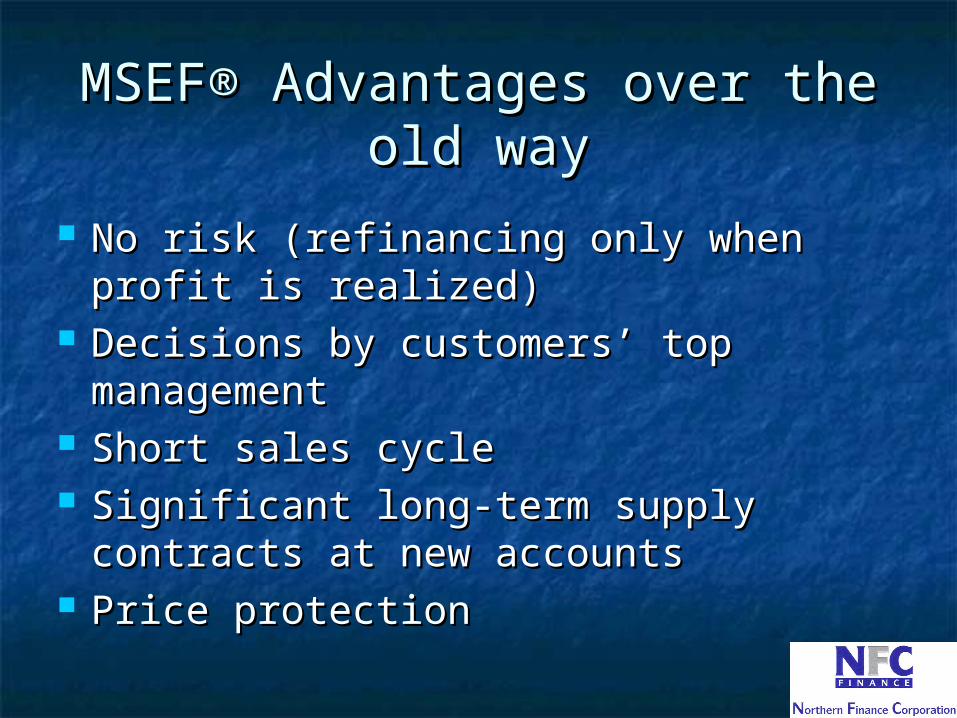
MSEF® Advantages over the MSEF® Advantages over the old wayold way
No risk (refinancing only when profit is No risk (refinancing only when profit is realized)realized)
Decisions by customers’ top Decisions by customers’ top managementmanagement
Short sales cycleShort sales cycle Significant long-term supply contracts Significant long-term supply contracts
at new accountsat new accounts Price protectionPrice protection
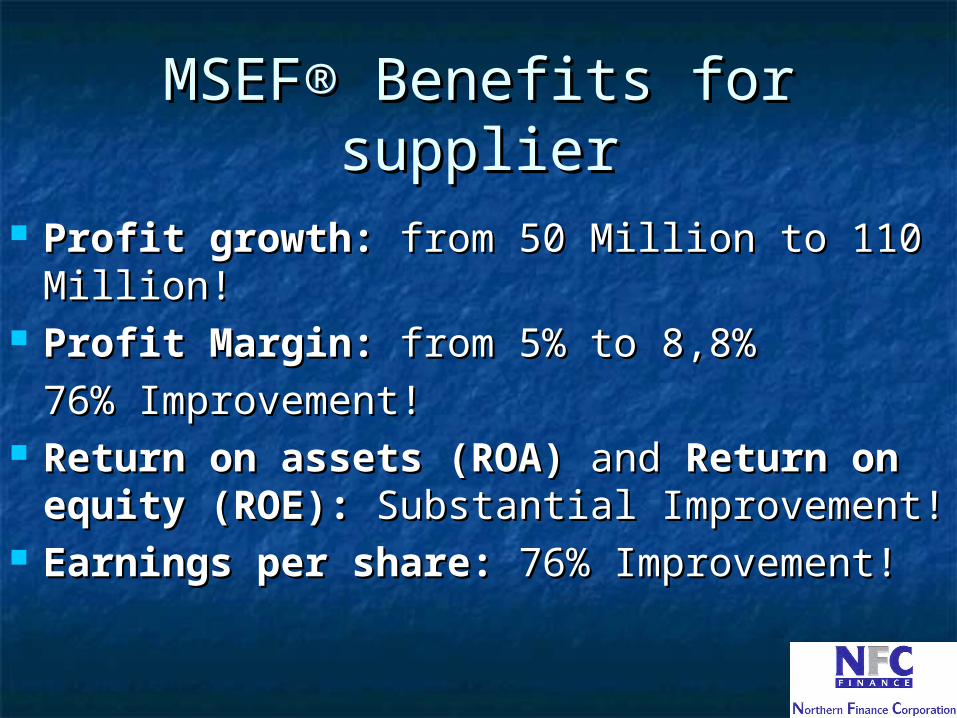
MSEF® Benefits for supplierMSEF® Benefits for supplier
Profit growth:Profit growth: from 50 Million to 110 from 50 Million to 110 Million!Million!
Profit Margin:Profit Margin: from 5% to 8,8% from 5% to 8,8%
76% Improvement!76% Improvement! Return on assets (ROA)Return on assets (ROA) and and Return onReturn on
equity (ROE):equity (ROE): Substantial Improvement! Substantial Improvement! Earnings per share:Earnings per share: 76% Improvement! 76% Improvement!
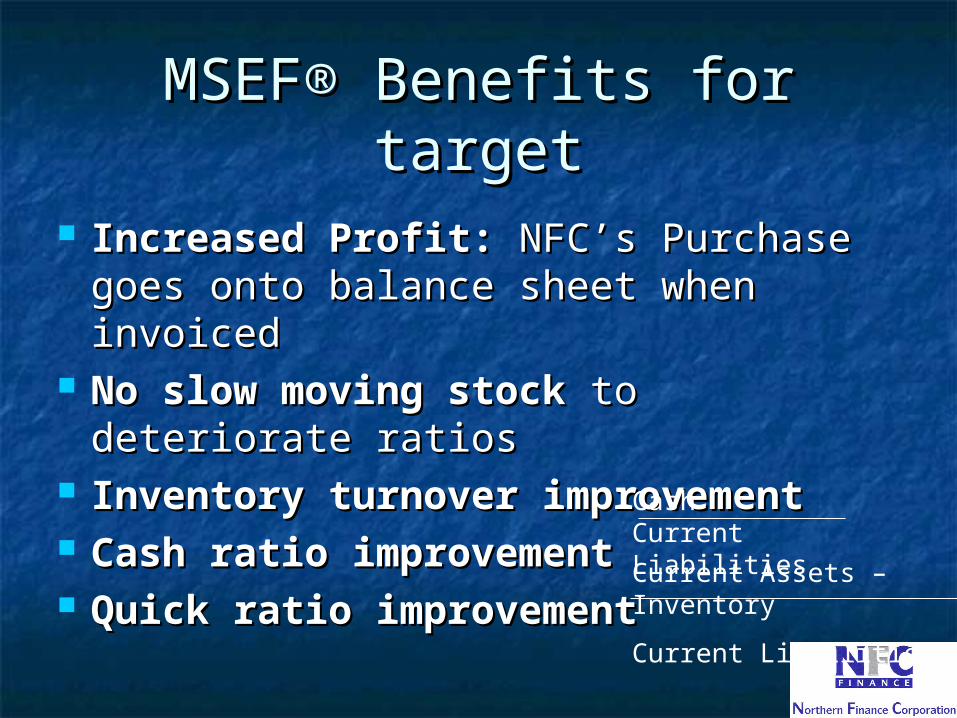
MSEF® Benefits for targetMSEF® Benefits for target
Increased Profit:Increased Profit: NFC’s Purchase NFC’s Purchase goes onto balance sheet when goes onto balance sheet when invoicedinvoiced
No slow moving stockNo slow moving stock to deteriorate to deteriorate ratiosratios
Inventory turnover improvementInventory turnover improvement Cash ratio improvementCash ratio improvement Quick ratio improvementQuick ratio improvement
CashCurrent Liabilities
Current Assets – Inventory
Current Liabilities
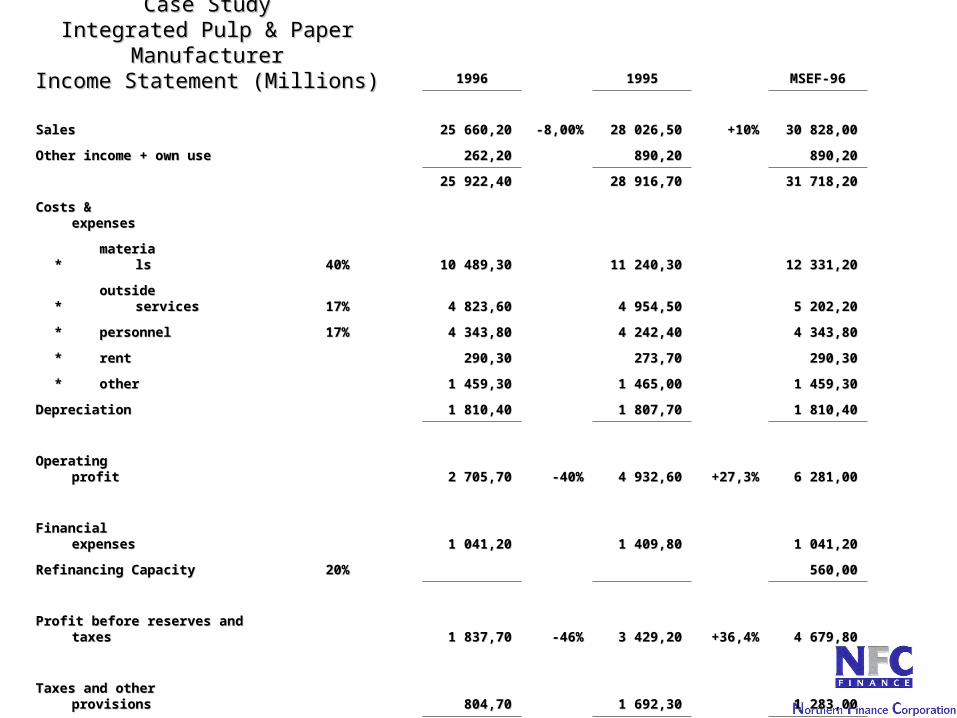
Case StudyCase StudyIntegrated Pulp & Paper Integrated Pulp & Paper
ManufacturerManufacturerIncome Statement (Millions)Income Statement (Millions) 19961996 19951995 MSEF-96MSEF-96
SalesSales 25 660,2025 660,20 -8,00%-8,00% 28 026,5028 026,50 +10%+10% 30 828,0030 828,00
Other income + own useOther income + own use 262,20262,20 890,20890,20 890,20890,20
25 922,4025 922,40 28 916,7028 916,70 31 718,2031 718,20
Costs & Costs & expensesexpenses
**materiamateria
lsls 40%40% 10 489,3010 489,30 11 240,3011 240,30 12 331,2012 331,20
** outside servicesoutside services 17%17% 4 823,604 823,60 4 954,504 954,50 5 202,205 202,20
** personnelpersonnel 17%17% 4 343,804 343,80 4 242,404 242,40 4 343,804 343,80
** rentrent 290,30290,30 273,70273,70 290,30290,30
** otherother 1 459,301 459,30 1 465,001 465,00 1 459,301 459,30
DepreciationDepreciation 1 810,401 810,40 1 807,701 807,70 1 810,401 810,40
Operating profitOperating profit 2 705,702 705,70 -40%-40% 4 932,604 932,60 +27,3%+27,3% 6 281,006 281,00
Financial Financial expensesexpenses 1 041,201 041,20 1 409,801 409,80 1 041,201 041,20
Refinancing CapacityRefinancing Capacity 20%20% 560,00560,00
Profit before reserves and taxesProfit before reserves and taxes 1 837,701 837,70 -46%-46% 3 429,203 429,20 +36,4%+36,4% 4 679,804 679,80
Taxes and other Taxes and other provisionsprovisions 804,70804,70 1 692,301 692,30 1 283,001 283,00
Net ProfitNet Profit 1 033,001 033,00 -40%-40% 1 736,901 736,90 +96%+96% 3 396,803 396,80
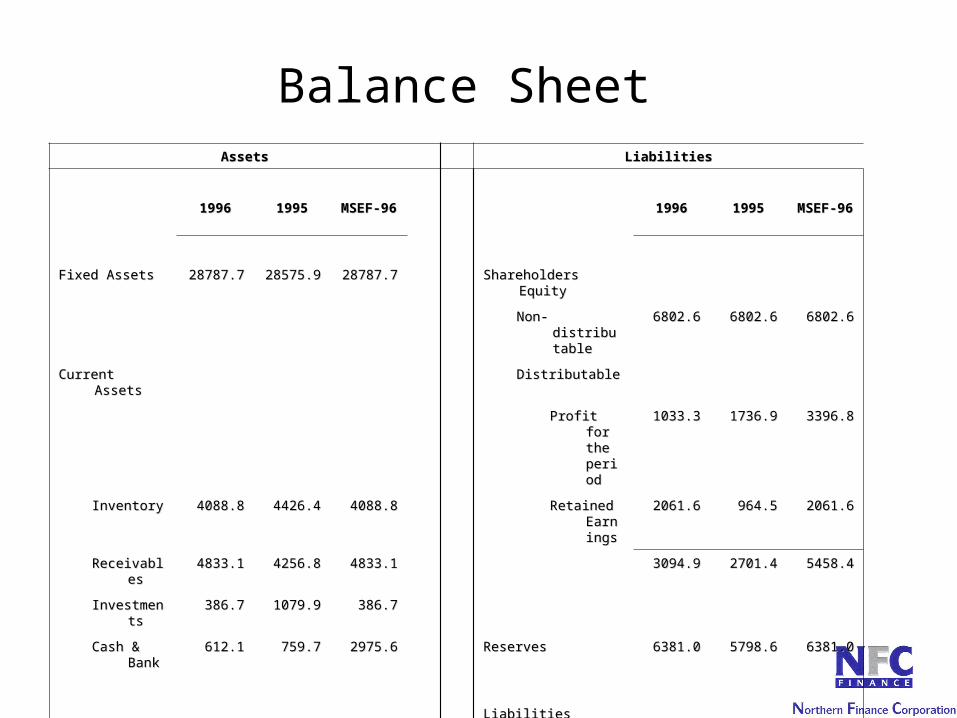
AssetsAssets LiabilitiesLiabilities
19961996 19951995 MSEF-MSEF-9696
19961996 19951995 MSEF-MSEF-9696
Fixed AssetsFixed Assets 28787.728787.7 28575.928575.9 28787.728787.7 Shareholders EquityShareholders Equity
Non-Non-distributadistributableble
6802.66802.6 6802.66802.6 6802.66802.6
Current AssetsCurrent Assets DistributableDistributable
Profit for Profit for the the perioperiodd
1033.31033.3 1736.91736.9 3396.83396.8
InventoryInventory 4088.84088.8 4426.44426.4 4088.84088.8 Retained Retained EarniEarningsngs
2061.62061.6 964.5964.5 2061.62061.6
ReceivableReceivabless
4833.14833.1 4256.84256.8 4833.14833.1 3094.93094.9 2701.42701.4 5458.45458.4
InvestmentInvestmentss
386.7386.7 1079.91079.9 386.7386.7
Cash & Cash & BankBank
612.1612.1 759.7759.7 2975.62975.6 ReservesReserves 6381.06381.0 5798.65798.6 6381.06381.0
LiabilitiesLiabilities
LongLong 12353.712353.7 16355.716355.7 12353.712353.7
CurrentCurrent 10073.210073.2 7440.47440.4 10073.210073.2
TOTALTOTAL 38705.38705.44
39098.39098.77
41068.41068.99
TOTALTOTAL 38705.38705.44
39098.39098.77
41068.41068.99
Balance Sheet
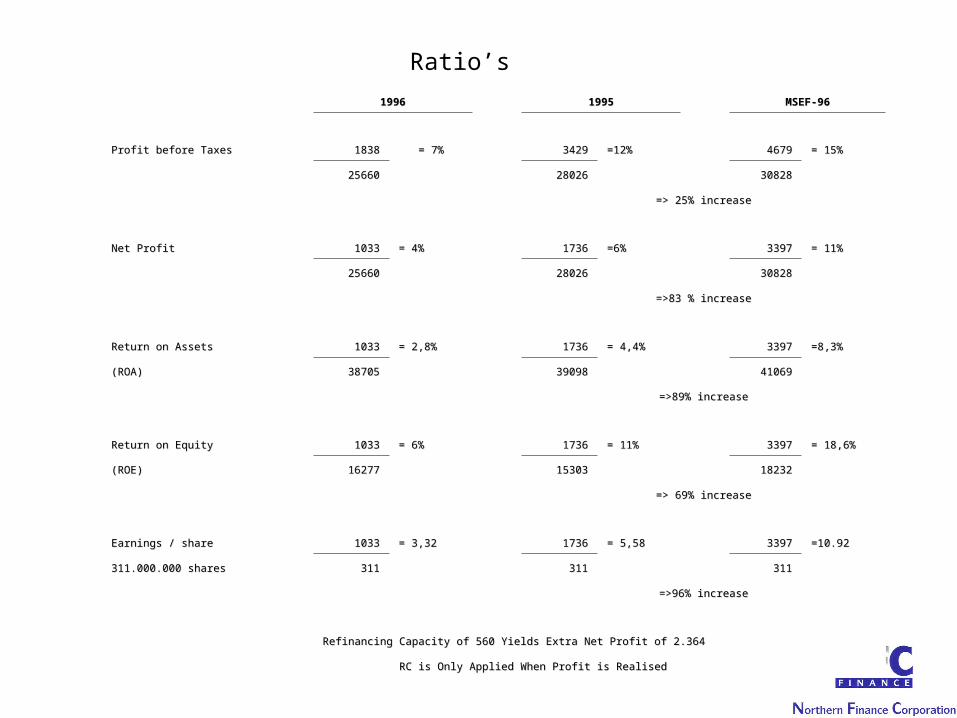
19961996 19951995 MSEF-96MSEF-96
Profit before TaxesProfit before Taxes 18381838 = 7%= 7% 34293429 =12%=12% 46794679 = 15%= 15%
2566025660 2802628026 3082830828
=> 25% increase=> 25% increase
Net ProfitNet Profit 10331033 = 4%= 4% 17361736 =6%=6% 33973397 = 11%= 11%
2566025660 2802628026 3082830828
=>83 % increase=>83 % increase
Return on AssetsReturn on Assets 10331033 = 2,8%= 2,8% 17361736 = 4,4%= 4,4% 33973397 =8,3%=8,3%
(ROA)(ROA) 3870538705 3909839098 4106941069
=>89% increase=>89% increase
Return on EquityReturn on Equity 10331033 = 6%= 6% 17361736 = 11%= 11% 33973397 = 18,6%= 18,6%
(ROE)(ROE) 1627716277 1530315303 1823218232
=> 69% increase=> 69% increase
Earnings / shareEarnings / share 10331033 = 3,32= 3,32 17361736 = 5,58= 5,58 33973397 =10.92=10.92
311.000.000 shares311.000.000 shares 311311 311311 311311
=>96% increase=>96% increase
Refinancing Capacity of 560 Yields Extra Net Profit of 2.364Refinancing Capacity of 560 Yields Extra Net Profit of 2.364
RC is Only Applied When Profit is RealisedRC is Only Applied When Profit is Realised
Ratio’s
How & When you win with How & When you win with MSEF®MSEF®
Available capacityAvailable capacity Desire for growthDesire for growth Accepted in market, offering real Accepted in market, offering real
choice as supplierchoice as supplier Variable cost margin, allows sufficient Variable cost margin, allows sufficient
leverage (Refinancing Capacity)leverage (Refinancing Capacity) Target turnover is significantTarget turnover is significant
MSEFMSEF®®
Cost of Idle CapacityCost of Idle Capacity Traditional « Sales Push » ApproachTraditional « Sales Push » Approach MSEF® MethodMSEF® Method Target customer motivations & Target customer motivations &
advantagesadvantages Financial impact of MSEF®Financial impact of MSEF® How & when you win with MSEF®How & when you win with MSEF®