MARKET RECONNAISSANCE AND STRATEGIC POLICY …...MARKET RECONNAISSANCE AND STRATEGIC POLICY...
118
MARKET RECONNAISSANCE AND STRATEGIC POLICY RECOMMENDATIONS FOR THE BELL ROAD CORRIDOR To CITY OF SCOTTSDALE From GRUEN GRUEN + ASSOCIATES Urban Economists, Market Strategists & Land Use/Public Policy Analysts May 2015 C1415
Transcript of MARKET RECONNAISSANCE AND STRATEGIC POLICY …...MARKET RECONNAISSANCE AND STRATEGIC POLICY...
MARKET RECONNAISSANCE AND STRATEGIC POLICY RECOMMENDATIONS FOR THE BELL ROAD CORRIDOR
To
CITY OF SCOTTSDALE
From
GRUEN GRUEN + ASSOCIATES Urban Economists, Market Strategists & Land Use/Public Policy Analysts
May 2015
C1415

MARKET RECONNAISSANCE AND STRATEGIC POLICY RECOMMENDATIONS FOR THE BELL ROAD CORRIDOR
To
CITY OF SCOTTSDALE
From
GRUEN GRUEN + ASSOCIATES Urban Economists, Market Strategists & Land Use/Public Policy Analysts
May 2015
C1415
©2015 Gruen Gruen + Associates. Do not reproduce without written permission from Gruen Gruen + Associates.

- 1 -
ACKNOWLEDGEMENTS While the authors take 100 percent responsibility for the content and conclusions of the study, the report could not have been prepared without the assistance of many others. It is not possible to cite all of those who have offered data and insights but we would like to thank the City of Scottsdale staff and the following individuals which provided data and participated in interviews. Individuals Bryan Babits, Weingarten Tooraj Bakhtiari, Senior Commercial Specialist, RE/MAX Commercial Bill Blake, Lee & Associates John Bridger Executive Director, The Thunderbird Organization Suzanne Brown, Director of Community & Government Affairs, Scottsdale Area Association of Realtors Nickolas Cardinale, General Manager, Barrett-Jackson Irene Catsibris Clary, Catclar Investments John Coulter, Desert Troon Companies Mark Edelman, Planning and Engineering Section Manager, Arizona State Land Department Dan Farley, Owner/Designated Broker, Responsive Realty Michael Fee, Community Manager, Grayhawk Ranch HOA Eric Gerster, Windgate Ranch HOA Pam Gilbert, Director of Sales and Marketing at Fairmont Hotels and Resorts Jim Gmelich, Principal Notre Dame Preparatory High School Mike Gonzales, McDowell Mountain Ranch HOA Rebecca Grossman, President/CEO, Scottsdale Area Association of Realtors Glenn Guenther, YAM Management, LLC Vanessa Hickman, Faculty Associate, Master of Real Estate Development, Arizona State University Craig Jackson, Chairman and CEO, Barrett-Jackson Mick Kallo, Senior Vice President, Nautilus Insurance Rick Kidder, President and CEO, Scottsdale Chamber of Commerce Tom Knoell, Desert Troon Companies Brad Larsen, Senior Siting Consultant, APS Adam Madison, Cushman & Wakefield Billy Malkovich, Vice President of Real Estate, Great Hearts Academy Michael Martindale, CRA Dennis May, Owner Occupant, McDowell Mountain Business Park Greg Mayer, Cushman & Wakefield Gerard Mauvis, Director of Operations, Fairmont Scottsdale Princess Casey McDonald, Site & Operations Director, Barrett-Jackson Michelle Pabis, Senior Network Director, Government and Public Affairs, HonorHealth Racheal Pearson, Vice President of Community & Government Affairs, Scottsdale Convention & Visitors Bureau Gary Roe, Roe Associates Planning, Inc. Jason Rose, Rose+Moser+Allyn Public Relations John Quatrini, Vice President, Shell Commercial Tom Sadvary, CEO of Honor Health Monica Spivey, Vice President Finance & Accounting, Nautilus Insurance

- 2 -
ACKNOWLEDGEMENTS, Continued
Mark Stapp, Executive Director of the Masters of Real Estate Development, W.P. Carrey School of Business, Arizona State University Tyler Strathman, Director of Hotel Operations, Marriott International Amanda Sue Piltz, Director of Communications & Technology, Scottsdale Area Association of Realtors Bryan Taute, CBRE Fred Unger, Spring Creek Development Individuals Todd Vesledahl, CRA Michael Woolington, General Manager, McDowell Mountain Ranch Community Association Terry Worcester, Director of Facilities and Operations, Scottsdale Unified School District City of Scottsdale Staff Fritz Behring, City Manager, City Manager’s Office Jan Cameron, Parks and Recreation Director, Parks and Recreation Danielle Casey, Economic Development Director, Economic Development C. Ashley Couch, Stormwater Management Director, Stormwater Management Tim Curtis, Current Planning Director, Planning and Development Services Brian Dygert, General Manager, WestWorld Derek Earle, City Engineer, Public Works Laurel Edgar, Real Estate Management Specialist, Public Works Kroy Ekblaw, Strategic Projects & City Liaison for ASLD Jim Ford, Deputy Chief of Fire & Life Safety, Fire Dept. Steven Geiogamah, Interim Tourism Development Director, Tourism and Events Dept. Randy Grant, Director, Planning & Development Services Lee Guillory, Finance Director, Finance Dept. Phil Kercher, Traffic Engineer and Operations Manager, Transportation Doug Mann, Principal Engineer, Water Resources Larry Marmie Jr., Watch Commander, Police Department Bill Murphy, Executive Director, Community Services Erin Perreault, Long Range Planning Manager, Planning and Development Services Taylor Reynolds, Planner, Planning and Development Services Bob Tunis, Economic Development Manager, Economic Development Steve Venker, PNT Manager, Planning and Development Services Martha West, Senior Real Estate Manager, Public Works Dept. Dan Worth, Executive Director, Public Works Adam Yaron, Senior Planner, Planning and Development Services
- 3 -
City of Scottsdale Mayor and City Council Mayor W.J. “Jim” Lane Suzanne Klapp Virginia Korte Kathy Littlefield Vice Mayor Linda Milhaven Guy Phillips David N. Smith
i
TABLE OF CONTENTS
CHAPTER I: EXECUTIVE SUMMARY, GOALS AND OBJECTIVES, AND RECOMMENDATIONS 1
INTRODUCTION AND PURPOSE ...................................................................................................................... 1
GOALS AND OBJECTIVES .................................................................................................................................... 3
FINDINGS AND CONCLUSIONS ........................................................................................................................ 3
Land Summary ............................................................................................................................................................... 3
Employment and Business Establishment Trends ................................................................................................... 3
Land Use Trends ............................................................................................................................................................ 4
Office Market ................................................................................................................................................................. 4
The Demand for Office Space .................................................................................................................................... 5
Industrial Market ............................................................................................................................................................ 6
Primary Geographic Markets for Industrial Space ................................................................................................... 7
Taxable Sales Trends ..................................................................................................................................................... 7
Retail Market ................................................................................................................................................................... 7
Hotel/Tourism Market ................................................................................................................................................. 9
Multi-Family Market .................................................................................................................................................... 10
DEVELOPMENT SCENARIOS TO STUDY FURTHER FOR CITY-OWNED PROPERTIES ......... 12
Economic Development Recommendations .......................................................................................................... 14
RECOMMENDATIONS FOR FURTHER EVALUATION, PROGRAMMING, CRITERIA TO USE TO ASSESS SCENARIOS AND TEST MARKETING OF OPTIONS ....................................................... 16
CHAPTER II: INTRODUCTION AND PURPOSE .............................................................................................. 18
INTRODUCTION AND PURPOSE .................................................................................................................... 18
STUDY AREA ............................................................................................................................................................ 18
WORK COMPLETED .............................................................................................................................................. 19
REPORT ORGANIZATION .................................................................................................................................. 21
CHAPTER III: THE STRUCTURE OF THE EMPLOYMENT BASE OF THE BELL ROAD CORRIDOR AND COMPARISON TO CITY OF SCOTTSDALE AS A WHOLE AND LABOR FORCE CHARACTERISTICS AND COMMUTATION PATTERNS .............................................................................. 23
LABOR FORCE CHARACTERISTICS AND COMMUTATION PATTERNS ........................................ 28
CHAPTER IV: COMPOSITION OF LAND USE AND BUILDING SPACE INVENTORY WITHIN BELL ROAD CORRIDOR ........................................................................................................................................... 33
LAND SUPPLY .......................................................................................................................................................... 33
SUPPLY OF BUILDING SPACE .......................................................................................................................... 35
CHAPTER V: OFFICE MARKET SUPPLY TRENDS ......................................................................................... 39
SCOTTSDALE AIRPARK OFFICE SPACE INVENTORY AND TRENDS ............................................ 39
BELL ROAD CORRIDOR STUDY AREA OFFICE SPACE TRENDS ...................................................... 46
FUTURE SUPPLY OF OFFICE SPACE AND AVAILABLE LAND .......................................................... 51
ii
CHAPTER VI: THE DEMAND FOR OFFICE SPACE IN THE STUDY AREA ......................................... 53
INTRODUCTION ..................................................................................................................................................... 53
THE RELEVANT PRIMARY GEOGRAPHIC MARKETS ........................................................................... 53
The Primary Geographic Area within Which Bell Road Corridor Study Area Competes for Office Space Users .............................................................................................................................................................................. 53
Geographic Origins of Potential Office Space Users ............................................................................................ 53
TYPES OF OFFICE SPACE USERS ATTRACTED ........................................................................................ 54
COMPETITIVE POSITION OF STUDY AREA FOR ATTRACTING OFFICE SPACE USERS ....... 55
Primary Comparative Advantages ............................................................................................................................. 56
Primary Disadvantages ................................................................................................................................................ 57
POTENTIAL SOURCES OF DEMAND ............................................................................................................. 57
CHAPTER VII: INDUSTRIAL MARKET SUPPLY TRENDS AND THE DEMAND FOR INDUSTRIAL SPACE IN THE STUDY AREA ..................................................................................................... 59
SCOTTSDALE AIRPARK INDUSTRIAL SPACE INVENTORY AND TRENDS ................................. 59
BELL ROAD CORRIDOR STUDY AREA INDUSTRIAL SPACE AND TRENDS ............................... 62
THE RELEVANT PRIMARY GEOGRAPHIC MARKETS ........................................................................... 64
The Primary Market Area ........................................................................................................................................... 64
Geographic Origins and Competing Locations ...................................................................................................... 64
TYPES OF INDUSTRIAL OR FLEX SPACE USERS ATTRACTED AND ADVANTAGES AND DISADVANTAGES FOR ATTRACTING INDUSTRIAL/ FLEX SPACE USERS ................................. 64
CHAPTER VIII: TAXABLE SALES TRENDS ....................................................................................................... 65
BELL ROAD CORRIDOR TAXABLE SALES TRENDS ............................................................................... 65
CHAPTER IX: THE RETAIL MARKET .................................................................................................................. 67
NORTH SCOTTSDALE RETAIL SPACE INVENTORY AND TRENDS................................................ 67
COMPETING REGIONAL-SERVING AGGLOMERATIONS NEAR STUDY AREA ........................ 70
Retail Centers and Major Free-standing Retail Space near Study Area ............................................................... 70
Neighborhood Retail Supply of Space in Study Area ............................................................................................ 74
PLANNED FUTURE RETAIL SPACE SUPPLY .............................................................................................. 76
PRIMARY MARKET AREA DEFINITION ....................................................................................................... 76
ESTIMATED POTENTIAL RETAIL DEMAND IN BELL ROAD CORRIDOR ................................... 80
Five-Mile Radius Trade Area around Scottsdale Road and Loop 101 ................................................................ 80
Three-Mile Radius Trade Area around 98th Street and Bell Road ....................................................................... 81
ESTIMATE OF EXPENDITURES FOR RETAIL GOODS .......................................................................... 82
ESTIMATED EXPENDITURE POTENTIAL AND THE ESTIMATED AMOUNT OF SUPPORTABLE SPACE IN THE TWO PRIMARY TRADE AREAS ......................................................... 84
RELATIONSHIP BETWEEN ESTIMATED RETAIL DEMAND AND SUPPLY ................................. 85
CHAPTER X: THE HOTEL MARKET .................................................................................................................... 87
CITY OF SCOTTSDALE HOTEL MARKET TRENDS ................................................................................. 87

iii
SUPPLY OF HOTEL ROOMS IN STUDY AREA ............................................................................................ 90
Fairmont Scottsdale Princess ..................................................................................................................................... 92
Scottsdale Marriott at McDowell Mountains .......................................................................................................... 93
CHAPTER XI: THE MARKET FOR MULTI-FAMILY USES ............................................................................ 94
APARTMENT MARKET CHARACTERISTICS IN NORTH SCOTTSDALE ......................................... 94
BELL ROAD CORRIDOR STUDY AREA APARTMENT MARKET CHARACTERISTICS AND TRENDS ....................................................................................................................................................................... 95
ESTIMATED SUPPORTABLE DEMAND FOR POTENTIAL APARTMENT USE IN NORTH SCOTTSDALE DUE TO EMPLOYMENT GROWTH ................................................................................. 100
OTHER RESIDENTIAL USES ............................................................................................................................ 102

iv
LIST OF TABLES, MAPS & FIGURES
CHAPTER I, MAP I-1: Bell Road Corridor Study Area ....................................................................................................... 2
CHAPTER II, MAP II-1: Bell Road Corridor Study Area .................................................................................................. 19
TABLE III-1: Bell Road Corridor Employment Base1 Patterns, 2007-2013 ................................................................... 23
TABLE III-2: Bell Road Corridor Employment by Size of Establishment, 2007-2013 ................................................. 24
CHAPTER III, MAP III-1: Largest Employers in the Bell Road Corridor ..................................................................... 25
TABLE III-3: City of Scottsdale Employment Base1 Patterns, 2007-2013 ...................................................................... 26
TABLE III-4: Bell Road Corridor Share of Citywide Employment Base, 2007-2013 .................................................... 27
TABLE III-5: Estimated Origin and Destination of Workers Employed or Residing in the Bell Road Corridor, by Drive Time Zone1 ....................................................................................................................................................................... 29
TABLE III-6: Estimated Origin of Workers Employed in the Bell Road Corridor, by Drive Time Zone and Occupation1 ................................................................................................................................................................................. 30
TABLE III-7: Estimated Destination of Bell Road Corridor Resident Labor Force, by Drive Time Zone and Occupation1 ................................................................................................................................................................................. 31
TABLE III-8: Educational Attainment, Earnings, and Other Demographic Characteristics of Study Area Workforce and Resident Labor ................................................................................................................................................ 32
TABLE IV-1: Bell Road Corridor Land Use Inventory1 ..................................................................................................... 33
CHAPTER IV, MAP IV-1: Vacant Land Within and Near the Bell Road Corridor ..................................................... 34
TABLE IV-2: Office and Industrial Space Developed in Bell Road Corridor Study Area ........................................... 35
TABLE IV-3: Supply of Retail Space, Hotel Rooms, and Multi-family Units Developed in Bell Road Corridor Study Area .................................................................................................................................................................................... 37
TABLE V-1: Scottsdale Airpark Position Within Regional Class A Office Market1 ...................................................... 39
CHAPVER V, MAP V-1: Phoenix Region Office Submarkets .......................................................................................... 40
TABLE V-2: Vacancy and Rents Within Regional Class A Office Market ...................................................................... 42
TABLE V-3: Scottsdale Airpark Office Space Supply Trends1 .......................................................................................... 43
TABLE V-4: Scottsdale Airpark Absorption and Construction Trends, 2000-20141 ..................................................... 44
TABLE V-5: Sample of Class A Office Buildings in Scottsdale Airpark Submarket and Study Area ......................... 45
TABLE V-6: Bell Road Corridor Study Area Office Space Inventory Compared to Total Airpark Office Submarket ........................................................................................................................................................................................................ 47
CHAPTER V, MAP V-2: Major Office Parks in the Bell Road Corridor ........................................................................ 48
TABLE V-7: Office Space in Major Office Parks in Bell Road Corridor Study Area .................................................... 49
TABLE V-8: Distribution of Office Vacancies in Study Area by Maximum Amount of Contiguous Floor Space .. 50
TABLE V-9: Potential Office Space and Land Supply in Study Area ............................................................................... 51
TABLE VII-1: Scottsdale Airpark Position within Regional Industrial Market1 ............................................................. 59
CHAPTER VII, MAP VII-1: Phoenix Region Industrial Submarkets .............................................................................. 60
TABLE VII-2: Vacancy and Rents Within Regional Industrial Market ............................................................................ 61
TABLE VII-3: Scottsdale Airpark Industrial Space Characteristics1 ................................................................................. 62
TABLE VII-4: Industrial Space in Bell Road Corridor Study Area ................................................................................... 63
v
TABLE VIII-1: Bell Road Corridor Taxable Sales/Revenue Estimates1 .......................................................................... 65
TABLE VIII-2: Estimated Bell Road Corridor Share of Citywide Taxable Sales/Revenue .......................................... 66
TABLE IX-1: North Scottsdale Retail, 3rd Quarter 2014 .................................................................................................... 68
CHAPTER IX, MAP IX-1: Phoenix Region Retail Submarkets ........................................................................................ 69
TABLE IX-2: Scottsdale Airpark Retail Space Supply Trends1 .......................................................................................... 70
TABLE IX-3: Regional, Power, and Community Shopping Centers and Free-standing Stores Near Study Area ... 71
TABLE IX-4: Major Neighborhood Shopping Centers in or Near Study Area1 ........................................................... 74
TABLE IX-5: Likely Future Supply of Community- and Regional-Serving Retail Space in Bell Road Corridor Study Area................................................................................................................................................................................................ 76
CHAPTER IX, MAP IX-2: Primary Trade Area for Destination/Comparison Retail Goods .................................... 78
CHAPTER IX, MAP IX-3: Primary Trade Area for Neighborhood Retail .................................................................... 79
TABLE IX-6: Demographic and Income Estimates for Residents and Workers in Five-Mile Radius Trade Area, 2000 – 2013 .................................................................................................................................................................................. 81
TABLE IX-7: Demographic and Income Estimates for Residents and Workers in Three-Mile Radius Trade Area, 2000 – 2013 .................................................................................................................................................................................. 81
TABLE IX-8: Average Household Annual Expenditure on Retail Goods and Services for Higher Income Households (2013) ...................................................................................................................................................................... 83
TABLE IX-9: Estimated Demand for Retail Space in Primary Trade Area ..................................................................... 84
TABLE IX-10: Relationship between Estimated Retail Space Demand and Supply of Retail Space in Primary Trade Area................................................................................................................................................................................................ 85
TABLE X-1: Hotel Inventory, 2004-20131 ............................................................................................................................ 87
TABLE X-2: Hotel Market Demand and Supply in Scottsdale Area, 2003-20141 .......................................................... 88
TABLE X-3: Hotel Revenue Performance in Scottsdale Area, 2003-20141 ..................................................................... 89
FIGURE X-1: Scottsdale Hotel Market Demand Segments (2014) .................................................................................. 90
TABLE X-4: Supply of Hotels in the Study Area ................................................................................................................. 91
TABLE XI-1: Highest Rent Apartment Submarkets in Phoenix Metro Area, 4th Quarter 2013 .................................. 94
TABLE XI-2: Inventory, Vacancy and Rent Characteristics of North Scottsdale Apartment Market, 2010-2014 ... 95
TABLE XI-3: Bell Road Corridor Study Area Existing Apartment Properties and Average Monthly Rent, 2002-2015 ............................................................................................................................................................................................... 96
FIGURE XI-1: Per Square Foot Rents by Project Age ....................................................................................................... 97
TABLE XI-4: Parking and Unit Mix Characteristics of Recently-Built, Under Construction & Planned ................. 98
Apartment Supply in North Scottsdale Submarket ............................................................................................................... 98
CHAPTER XI, MAP XI-1: Recently Built, Under Construction, and Planned Apartment Projects ......................... 99
TABLE XI-5: Employment-Driven Rental Housing Demand in North Scottsdale Compared to Supply of Under Construction and Planned Apartment Units ........................................................................................................................ 101

I
BASIC LAND USE FINDINGS AND CONCLUSIONS DRAWN FROM MARKET RECONAISSANCE
Land Use Potential Use Opportunity Competitive Factors
Office For City-owned land, build-to-suit; owner occupant seeking corporate/R&D campus which are not as image or visibility conscious as users which want to be on Scottsdale Road and adjoin Loop 101 and whose decision makers live in the vicinity of the site. Sources of demand are likely to include firms with engineering, administrative, sales and managerial talent more typically associated with an older, family-age workforce seeking the quality of life opportunities, school, library and park amenities more prevalent in suburban environments like the part of Scottsdale in which the study area is located.
A central location to executive housing and the labor base which comes from the southeast valley and north Phoenix; lower cost option than preferred core Airpark, Downtown Scottsdale locations. Speculative, multi-tenant development not supported by obtainable rents and more likely to occur on land within Crossroads East. Ample capacity within existing buildings to accommodate smaller space users.
Hotel/Tourism
A lower-priced select service hotel within walking distance to WestWorld would improve the competitive position of WestWorld, while offering an option not currently available to visitors to WestWorld. Such a hotel should:
Be large enough to help serve WestWorld and other tourism inducing events that currently cannot be accommodated within the study area hotel room inventory, provide another source of supply to serve overflow group demand, and serve as an amenity to users of potential office and medical uses that may locate in the vicinity in the future);
Include smaller meeting space to appeal to those companies and regional, state governmental entities with restrictive travel and meeting budgets and to help WestWorld increase its ability to book different events, including some trade shows or exhibitions;
Be pet friendly and be near a viewing area for car
Some hotel room supply has been removed from the market due to conversion to time share uses. Scottsdale’s supply of hotel rooms has decreased as a proportion of all hotel rooms in the region since 2006. The newest hotel in the study area was built over 10 years ago. No new hotel rooms have been added since 2005 and only two hotels have been built in the study area in the last 15 years. During peak winter event season, the room inventory of study area hotels is insufficient to accommodate event visitors (and event service providers) as well as business and other leisure travelers. Scottsdale hotel market has recovered with occupancy rates above 65 percent and dominant hotels having record performance.

II
BASIC LAND USE FINDINGS AND CONCLUSIONS DRAWN FROM MARKET RECONAISSANCE
Land Use Potential Use Opportunity Competitive Factors
Hotel/Tourism, continued
enthusiasts;
Free Wifi; and
An information desk on all that Scottsdale offers. To also help the Fairmont and Marriott at McDowell Mountain compete for additional and larger group business, near the select service hotel should be an outdoor area with facilities that groups can use so as to not be taken outside of the area and be tempted to select hotels outside Scottsdale. For example, a camp fire, with cook-out facilities, a western themed obstacle course with mechanical horse riding could be resources available for team building, education and training in an outdoor setting (with back up indoor facilities in the case of rain or adverse weather available in WestWorld). An additional draw would be a car museum/showroom as part of a headquarters complex for Barrett-Jackson, which the firm’s CEO has indicated potential interest in constructing.
Increased demand for healthcare services provided by the Mayo Clinic and Honor Health could contribute to greater demand for a suites-type product. Increases in group meetings which the resort hotels are targeting create the need to accommodate “overflow” demand. Recovery and growth of office space market and increased tourism will boost room night demand. Study area disadvantages for hotels include a limited selection of proximate services, restaurants and shopping walkable from the hotel. Downtown Scottsdale hotels and Westin at Kierland Commons, for example, are in more pedestrian-oriented, mixed-use environments that provide locational advantages to hotels. Advantages include scenic views in a resort environment known as a resort destination.
Retail
While the Scottsdale Road and Loop 101 intersection remains a logical location for additional regional-serving uses this node should also be planned to include a mix of uses, with a defining characteristic that developments promote linkages and spillover to adjoining uses (as opposed to free-standing and separated single use buildings). Link support services and restaurants with proximate office space developments.
The relationship between demand and supply for community- and regional- serving and neighborhood and convenience–serving retail space is relatively balanced. The Scottsdale Road agglomeration in the core Airpark area is likely to be able to maintain market area dominance for comparison and shopper goods, and leisure shopping. As the existing major dominant retail destinations such as Scottsdale Quarter, Scottsdale Promenade, and Scottsdale

III
BASIC LAND USE FINDINGS AND CONCLUSIONS DRAWN FROM MARKET RECONAISSANCE
Land Use Potential Use Opportunity Competitive Factors
Retail uses on or near City-owned land including eating and drinking establishments, and convenience services have the potential to make WestWorld more appealing to visitors and to serve residents and workers in the area: for example, a restaurant and lively bar to appeal alike to residents, businesses, and visitors.
101 fill up, new proximate locations will develop as the household and employment base grows over time. New specialty chain entrants to the region will tend to select locations along or near Scottsdale Road, near existing critical masses of other specialty retailers and restaurants with excellent visibility and accessibility, and closer to major centers of future employment and growing population concentrations.
Industrial Users whose decision makers live near the study area and want the convenience, quality-of-life advantages, and positive locational image and engage in (1) combinations of research and development with a high office space component; or (2) which have retailing or service functions geared to households in the area are likely to be the primary candidates for existing industrial space in the study area.
Land prices are too high to support the development of distribution or manufacturing assembly facilities. Other locations preferred for traditional industrial uses.
Healthcare/Wellness Healthcare services to serve nearby residents and employer-sponsored wellness programs and if obtainable a fitness center.
User demand indicated; growing economic sectors; near affluent households and office base.
Parking/Access Additional parking if needed to preserve the ability of WestWorld to host large events Parking uses for commercial office occupants in buildings developed with 3 and 4:1,000 parking ratios that are now utilizing office space at higher level ratios up to 6 and 7:1,000. Obtain permanent control of an approximately 9.4-acre Arizona State Land Department parcel about 760’ east of 94th Street and south of Bell Road currently utilized via a State Land Use Permit (“SLUP”) for event parking and a permanent secondary entrance to WestWorld. Acquisition of this property
Identify and implement a parking plan to accommodate the parking needs of major events such as the Barrett-Jackson Collection Car Auction (which for example currently estimates a parking need of 14,000 spaces) and the Waste Management Phoenix Open at TPC Scottsdale (which estimates a parking need of 25,000 spaces) on the assumption that current arrangements with the Arizona State Land Department will not be available in perpetuity to maintain. The evaluation should include the identification of shared parking and shuttle system opportunities to provide

IV
BASIC LAND USE FINDINGS AND CONCLUSIONS DRAWN FROM MARKET RECONAISSANCE
Land Use Potential Use Opportunity Competitive Factors
will provide necessary flexibility to accommodate dynamic access and parking needs for large events requiring concurrent ingress and egress and will also allow multiple event operations within the same day at WestWorld to have alternative access patterns and thus maximize the flexibility of the existing WestWorld facilities
convenient locations for auxiliary parking for major events. Sources of funding beyond an outright City subsidy should be identified including the potential for parking revenue from attendees to be dedicated to a parking fund to lease land or build strategically placed parking structures. Identify whether and if so how much City-owned land would be needed to accommodate parking requirements. Parking facilities developed for large scale events could be utilized on non-event days for private business parking needs on a leased or per car fee basis.
Multi-Family Residential
Integrate multi-family uses with major retail and office uses to create efficient and productive mixed-use environments in highly accessible locations such as Crossroads East Arizona State Trust land in the western portion of the study area.
The large supply of planned and under construction or recently opened apartment units compared to the estimated rental housing demand due to job growth suggests that the multi-family rental housing market will be competitive in the foreseeable future. Rent and occupancy growth may slow until the currently planned or under construction units are absorbed. Concerns exist about residential uses on City-owned property. The concerns relate primarily to the potential for residential uses to be incompatible with WestWorld, Scottsdale Airport, and large event operations, including the traffic created by visitors and the residents having complaints about traffic, noise, etc. induced by the events.

V
BASIC LAND USE FINDINGS AND CONCLUSIONS DRAWN FROM MARKET RECONAISSANCE
Land Use Potential Use Opportunity Competitive Factors
Representatives of home owner associations for nearby master planned communities also indicated various reservations about multi-family uses.
MARKET RECONNAISSANCE AND STRATEGIC POLICY RECOMMENDATIONS FOR THE BELL ROAD CORRIDOR
GRUEN GRUEN + ASSOCIATES PAGE 1
CHAPTER I: EXECUTIVE SUMMARY, GOALS AND OBJECTIVES, AND RECOMMENDATIONS
INTRODUCTION AND PURPOSE In 2009, Gruen Gruen + Associates (GG+A) conducted economic and market research and analysis to provide an information base and identify strategic policy actions for the preparation of the Greater Airpark Character Area Plan. The Greater Airpark Character Area Plan was adopted in 2010. Since GG+A’s 2009 study (which can be found on Scottsdale’s web site: http://www.scottsdaleaz.gov/Assets/Public+Website/economics/2009+Airpark+Land+Use+Study.pdf or by using the website search bar), the Great Recession has ended, the more than 300,000-square-foot, climate-controlled Tony Nelssen Equestrian Center at WestWorld has opened, and the center's North Hall, where the Barrett-Jackson Collector Car Event auction is held, has been expanded, and applications for the purchase and development of vacant State of Arizona Trust land in the Bell Road Corridor have been made. The City of Scottsdale commissioned GG+A to conduct research and analysis, including stakeholder interviews, to provide an updated information base and strategic recommendations for a portion of the Greater Airpark Area, the Bell Road Corridor (sometimes referred to below as “study area”). Map I-1 outlines the study area (and the Greater Airpark Character Area). The study area is bounded by Frank Lloyd Wright Boulevard and the Central Arizona Project (C.A.P. Canal) on the south, Scottsdale Road on the west, and Thompson Peak Parkway on both the east and north boundary of the study area. The study area includes or is near WestWorld, land owned by the City of Scottsdale, Arizona State Land Trust land, United States Bureau of Reclamation land, and a host of additional recreational attractions such as the McDowell Sonoran Preserve, the Barrett-Jackson Collector Car Auction, and the TPC of Scottsdale/Waste Management Phoenix Open, and the largest resort hotel in the City of Scottsdale: The Fairmont Princess.

MARKET RECONNAISSANCE AND STRATEGIC POLICY RECOMMENDATIONS FOR THE BELL ROAD CORRIDOR
GRUEN GRUEN + ASSOCIATES PAGE 2
CHAPTER I, MAP I-1: Bell Road Corridor Study Area
MARKET RECONNAISSANCE AND STRATEGIC POLICY RECOMMENDATIONS FOR THE BELL ROAD CORRIDOR
GRUEN GRUEN + ASSOCIATES PAGE 3
GOALS AND OBJECTIVES The results of the current study summarized below suggest goals and objectives of the City of Scottsdale for the Bell Road Corridor could include the following:
Improving and more tightly linking the base of recreational, entertainment, and cultural attractions to enhance the appeal of the study area to residents, businesses, and visitors;
Encouraging mutually reinforcing linkages (including physical, wayfaring, visual, and pedestrian as well as vehicular based connections) between hotel uses, visitor attractions, and retail/restaurant uses to help attract and hold businesses and visitors;
Encouraging mixed-use, integrated development patterns within the study area that will maximize the economic development, fiscal, and tourism vitality opportunities to be gained by clustering land uses in a complimentary fashion; and
Positioning City of Scottsdale-owned property to help WestWorld succeed, advance economic development, and support fiscal and tourism opportunities.
FINDINGS AND CONCLUSIONS The following summarizes the principal findings and conclusions drawn from the market reconnaissance. Land Summary The study area includes a total of 4,941 acres of land. Approximately 1,100 acres are currently vacant. Vacant Arizona State Land Trust holdings within the study area total approximately 703 acres, representing the majority of vacant land.1 Ten vacant parcels controlled by the City of Scottsdale, all located east of Loop 101, total approximately 171 acres. Private land ownership totals approximately 231 additional acres or about 20 percent of the total vacant land inventory. The Bureau of Reclamation also controls a small amount of vacant land in the study area. Employment and Business Establishment Trends According to the Maricopa Association of Governments Employer Database, the study area contained approximately 10,700 non-farm jobs in 2013.
1 The Crossroads East planned development on Arizona State Trust land contains approximately 1,000 acres in total; western portions of the site are located outside of the Bell Road Corridor study area.
MARKET RECONNAISSANCE AND STRATEGIC POLICY RECOMMENDATIONS FOR THE BELL ROAD CORRIDOR
GRUEN GRUEN + ASSOCIATES PAGE 4
The total non-farm employment base did not grow over the 2007-2013 period although individual industry sectors gained or lost jobs. The education and healthcare industry sector experienced particularly robust job growth – even during the recession of 2008-2009, adding nearly 3,600 jobs between 2007 and 2013. From 2007 through 2013, the largest firms (employing 100 or more workers) declined by six establishments to 21 establishments. Smaller firms (employing less than 50 workers) increased by 103 establishments to a total of 291. Total employment at these larger firms declined as a share of total employment from 62 percent in 2007 to 48 percent in 2013. Smaller firms increased as a percentage of total employment from 23 percent to 33 percent. The two economic sectors which predominate in the study area relative to the City as a whole are professional and business services and leisure and hospitality services. These sectors comprise a 39 percent share of employment in the study area. Professional and business services and leisure and hospitality sectors collectively only make up 21 percent of citywide employment. Land Use Trends From 1990 through 2009, approximately 3.3 million square feet of office space was built in the study area. No office space has been added to the study area inventory since 2009. The last office developments built were the Terra Verde Corporate Campus and La Curvata in 2009. Approximately 1.1 million square feet of industrial space has been built in the study area. No industrial space has been added to the study area inventory since 2008. The last industrial development was three buildings at 16413-16419 91st Street, built in 2008. Approximately 622,000 square feet of retail space has been built in the study area with no space added since 2008. The last retail development was the DC Ranch Crossing shopping center built in 2008. One thousand nine hundred twelve (1,911) hotel rooms have been added from 1988 to 2005. The Fairmont Princess is planning a 102 room expansion. This room inventory comprises approximately 20 percent of the City’s total hotel room inventory. No new hotel rooms have been added since 2005 and only two hotels have been built in the study area in the last 15 years. Approximately 220 multi-family units been added within the study area in 2015 in one project known as Camden Foothills. Prior to this 10 percent addition to the inventory, the last multi-family development was completed in 2005. The study area contains about 2,400 multi-family units, representing about 10 percent of the citywide multi-family supply. Office Market The Airpark submarket contains one of the highest Class A office space vacancy rates in the region
MARKET RECONNAISSANCE AND STRATEGIC POLICY RECOMMENDATIONS FOR THE BELL ROAD CORRIDOR
GRUEN GRUEN + ASSOCIATES PAGE 5
at 19 percent, exceeded only by higher vacancy rates in the Camelback Corridor and Midtown submarkets. Office space rents in the Airpark submarket peaked in the 2005-2007 boom period as nearly over 2.6 million square feet of space was added and the vacancy rate declined to a low of nine percent. With the advent of the Great Recession, vacancy rates increased rapidly from 18 percent in 2007 to nearly 30 percent by 2009. Rents fell significantly during this period from levels of nearly $30 per square foot to about $22 per square foot by 2011. Since 2009, limited new inventory has been added (the space inventory increased less than 150,000 square feet) so that as demand has increased with the improving economy and employment recovery, overall vacancy rates have declined and rents have started to slowly increase. Approximately 730,000 square feet of existing space would need to be absorbed to bring the overall vacancy down to 10 percent in the Airpark, which is roughly the historical "low" in the most robust years (1999-2000, 2005-2006, etc.). If little new office supply is added and absorption continues on a positive pace, it is likely a 10 percent vacancy could be achieved in the Airpark submarket within the next couple of years. Within the Airpark submarket for Class A office space, the Scottsdale Quarter office buildings command the highest rents at more than $30 per square foot and have the lowest vacancy rates. Class A office buildings in the study area have experienced higher vacancy rates and command lower rents of $25 per square foot or less. The annual rent differential between Class A office buildings along Scottsdale Road near Kierland Commons and The Scottsdale Quarter and those in the study area is at least $7 to $8 more per square foot. Office space within the study area of over 3.0 million square feet comprises approximately 24 percent of the Airpark’s total office space inventory. The overall vacancy rate of 25 percent for office space in the study area is significantly higher than for the overall Airpark submarket. Approximately 22 buildings include contiguous spaces no larger than 5,000 square feet in size. Only 15 study area office properties include available contiguous blocks of office space consisting of between 10,000 and 20,000 square feet of space. Further, only two buildings in the study area can accommodate users over 40,000 square feet in size. The Scottsdale Airpark office submarket as a whole has a limited supply of large blocks of contiguous office space available. The study area contains more than 700 acres of vacant land (other than City-owned land) potentially able to accommodate future office space development. The Demand for Office Space The primary market area within which office space in the study area typically competes for office users includes the larger Airpark area, and projects and land on the Salt River Pima Maricopa Indian Community and further south along the Loop 101 corridor.

MARKET RECONNAISSANCE AND STRATEGIC POLICY RECOMMENDATIONS FOR THE BELL ROAD CORRIDOR
GRUEN GRUEN + ASSOCIATES PAGE 6
Most office space users will originate from within the Airpark area and within Scottsdale. The study area is primarily characterized by smaller to medium size users serving the local household base and local industries as opposed to firms exporting goods/services well beyond the market area. Firms in the study area operate in a variety of industries but the primary functions relate to corporate administrative-processing and back office functions. The finance, insurance, and real estate (FIRE), medical, and other service sector office space users have been attracted primarily to the study area’s office space due to the rapid population and household growth and significant housing development in the Phoenix region and because their decision makers reside in north Scottsdale. Higher density mixed-use facilities near specialized support services and shopping and dining amenities, whether located in Downtown Scottsdale or the core Airpark area, are more desirable locations than the study area for technology as well as professional and technical service firms and higher-order financial service office space users. Spread-out, primarily single-use office park uses not readily walkable to restaurants and services and with parking shortages (given the shift to more space intensive cost sensitive back office businesses) are currently finding it challenging to attract the kinds of firms mixed-user higher density developments capture. Industrial Market The Greater Airpark submarket (which includes the Bell Road Corridor study area) is one of the smaller concentrations of industrial space within the region comprising about 7.1 million square feet of space or 2.3 percent of total supply in the Phoenix industrial market. The submarket includes 373 warehouse and flex buildings with an average building size of less than 20,000 square feet. Flex space in the Airpark submarket is approximately 19 percent vacant. Since 2000, approximately 869,000 square feet of industrial space has been built in the Airpark submarket though no new space has been added since 2008. In contrast, the Deer Valley submarket has added approximately 1.0 million square feet of industrial space since 2008. The study area includes industrial space of over 1.0 million square feet or approximately 16 percent of the Airpark submarket’s industrial space. Several industrial buildings are located along the south side of Bell Road between 90th and 94th Streets, north of WestWorld. Industrial space in this area totals approximately 625,000 square feet. The space was built between 2004 and 2008 and the current vacancy totals approximately 196,000 square feet or 31 percent. The majority of the vacant space, however, is located in one large 144,000-square-foot industrial building which is completely vacant. Excluding this one large vacant building, the industrial space vacancy totals 52,000 square feet or nearly 11 percent of the total space.
MARKET RECONNAISSANCE AND STRATEGIC POLICY RECOMMENDATIONS FOR THE BELL ROAD CORRIDOR
GRUEN GRUEN + ASSOCIATES PAGE 7
Primary Geographic Markets for Industrial Space For most industrial uses, the primary market includes the Airpark submarket including the Bell Road study area as well as Deer Valley to the west, Tempe and Mesa to the south. The Airpark area has shifted toward higher margin, more intensive land uses over time from its origins as a relatively low cost location for industrial activities. Deer Valley has become the preferred location for industrial uses that in the past may have considered a Scottsdale Airpark location. Most industrial space users will originate from within or near the study area and use a high proportion of office or research and development space or use industrial space for quasi-retail or service activities serving the households in the broader area. Traditional manufacturing and distribution activities will tend to locate in the Deer Valley submarket. Land prices are too high to support the development of distribution or manufacturing assembly facilities.2 Business executives who live near the study area and want the convenience, quality-of-life advantages, and positive locational image and engage in (1) combinations of research and development with a high office space component; or (2) which have retailing or service functions geared to households in the area are likely to be the primary candidates for existing industrial space in the study area. Examples of existing users in industrial space within the study area include recreational facilities such as AZ on the Rocks at 16447 North 91st Street, one block south of Bell Road (a rock climbing and fitness facility) and Rebound Gymnastics 16611 North 91st Street, also one block south of Bell Road. Taxable Sales Trends Taxable retail sales, including automotive, in the Bell Road Corridor have grown strongly since 2001, increasing by about 24 percent annually from $8.5 million in 2001 to $135.5 million in 2014. Hotel and restaurant sales have recovered from the nadir of the recession and have increased by $33.5 million since 2001. Consistent with the growth in households attracted to housing in master planned communities within or near the study area and the growth in retail centers, the automotive, food, and miscellaneous retail base has grown rapidly relative to the City as a whole, increasing from only 0.2 percent of the citywide base in 2001 to 3.7 percent by 2014. Retail Market The Airpark’s retail space inventory of approximately 8.3 million square feet comprises about 56 percent of North Scottsdale’s total retail space. The vacancy rate in the Airpark’s retail space inventory increased between 2006 and 2009 as new retail supply was added. The vacancy rate
2 According to property listing information on Loopnet.com, a 1.97-acre industrially zoned land parcel with runway/taxiway frontage in the Scottsdale Airpark is listed for sale at $10,000,000. In comparison, a 1.43 acre industrially zoned parcel with taxiway frontage at the Deer Valley Airport is listed for $622,600.

MARKET RECONNAISSANCE AND STRATEGIC POLICY RECOMMENDATIONS FOR THE BELL ROAD CORRIDOR
GRUEN GRUEN + ASSOCIATES PAGE 8
increased from 4.6 percent in 2006 to over nine percent in 2009. Vacancy rates peaked in 2010 and 2011 during the recession and have since decreased as little supply has been added. Vacancy rates still remain above 2006 levels at 6.0 percent. Rents which had been as high as $28 to $32 per square foot in 2006 and 2007 have declined significantly. In the past two years with vacancy declining, rents have started to increase slightly to more than $20 per square foot in 2014, but still remain far below peak levels. The Bell Road Corridor study area which is part of the Scottsdale Airpark retail submarket currently does not contain any regional, power, or community shopping center space. Approximately 3.7 million square feet of community and regional-serving retail space currently exists near the study area. Most of these larger centers or big-box stores draw from a five-mile radius. Kierland Commons’ primary trade area extends from approximately 10 miles to the south (to Biltmore Fashion Park in Phoenix and Scottsdale Fashion Square in Scottsdale) to more than 15 miles to the north beyond Cave Creek and to Desert Ridge shopping center on the west to more than 10 miles on the east to Fountain Hills. Market area dominance depends upon three factors: location, size, and tenant mix. The Scottsdale Road agglomeration in the core Airpark area is likely to be able to maintain market area dominance. This is because many of the dominant category killer retailers and lifestyle/specialty retailers have located along Scottsdale Road in mixed-use environments. This combination of hard and soft goods retailing with ample dining options has created a major retail destination in a well-established location. The 2009 GG+A report predicted that “demand is not likely to support much more regional-serving retail uses than those already planned and under construction and it will be challenging for all of the existing properties and planned projects to build-out in the time frames the developers originally anticipated.” This prediction has been borne out as proposed projects such as the one million-square-foot Palisene regional mall across the street from One Scottsdale have not moved forward. The major retail destinations three miles south of the western edge (around Scottsdale Road and Loop 101) of the study area in well-established regional- and community-serving agglomerations are close to larger employment centers and growing concentrations of population. These centers are currently well leased. The Crossroads East Arizona State Trust land in the western portion of the study area benefits from a highly accessible location near a major freeway interchange with convenient access to Loop 101 from Scottsdale Road, proximity to major resort and hotels and other nearby concentrations of dominant retail supply, and an expanding base of households with new apartments being constructed in the area. The 1,000-acre Crossroads East area has approximately 168 acres of land zoned for future commercial uses. As the existing major dominant retail destinations such as Kierland Commons, Scottsdale Quarter, Scottsdale Promenade, and Scottsdale 101 fill up, new proximate locations will develop as the
MARKET RECONNAISSANCE AND STRATEGIC POLICY RECOMMENDATIONS FOR THE BELL ROAD CORRIDOR
GRUEN GRUEN + ASSOCIATES PAGE 9
household and employment base grows over time. New specialty chain entrants to the region will tend to select locations along or near Scottsdale Road, near existing critical masses of other specialty retailers and restaurants with excellent visibility and accessibility, and closer to major centers of future employment and growing population concentrations. While the Scottsdale Road and Loop 101 intersection remains a logical location for additional regional-serving uses this node should also be planned to include a mix of uses, with a defining characteristic that developments promote linkages and spillover to adjoining uses (as opposed to free-standing and separated single use buildings). Approximately 1.4 million square feet of neighborhood-serving retail space currently exists in or very close to the study area. Within the study area, five grocery-anchored neighborhood centers and one drug store-anchored strip center comprise approximately 622,000 square feet of space. Another four retail centers totaling 778,000 square feet of space are located very close to the study area boundaries. The major neighborhood retail space within or near the study includes few vacancies. Overall, the existing supply of neighborhood retail space is approximately 95 percent occupied. The centers in the study area serve local neighborhoods and cater to the area’s high income households. In both trade areas, the relationship between demand and supply for community- and regional- serving and neighborhood and convenience –serving retail space is relatively balanced. The relatively competitive conditions suggest the importance of linking support services and restaurants with proximate office space developments and encouraging a smaller number of denser, more mixed-use, integrated uses that promote walking between compatible land uses. In addition, the competitive conditions suggest to reduce traffic congestion and travel time due to excessive curb cuts, a policy of discouraging the development of smaller freestanding stand-alone locations for retail space. The results of the interviews and relationship found to apply to potential retail space demand and supply suggest retail uses on or near City-owned land including eating and drinking establishments, and convenience services should be encouraged primarily to make WestWorld more appealing to visitors and to serve residents and workers in the area. Hotel/Tourism Market Since 2004, 543 hotel rooms have been added to the hotel inventory in the City of Scottsdale. Some hotel room supply has been removed from the market due to conversion to time share uses. Hotel room growth has occurred within the Salt River Pima Maricopa Indian Community where the Talking Stick Resort (496 rooms), and Courtyard by Marriott (158 rooms), and Hampton Inn and Suites (101 rooms) have all been built since 2010. Many local businesses have their guests stay at lower-tier hotels than the upper end Scottsdale Fairmont and relatively few attendees of WestWorld events stay at the Fairmont and Marriott at
MARKET RECONNAISSANCE AND STRATEGIC POLICY RECOMMENDATIONS FOR THE BELL ROAD CORRIDOR
GRUEN GRUEN + ASSOCIATES PAGE 10
McDowell Mountain. During peak winter event season, hotel room inventory in study area hotels are insufficient to accommodate event visitors (and event service providers) as well as business and other leisure travelers. Increased demand for healthcare services provided by the Mayo Clinic and Honor Health could contribute to greater demand for a suites-type product. Increases in group meetings which the resort hotels are targeting create the need to accommodate “overflow” demand. The study area’s locational disadvantages for hotels include the limited selection of proximate services, restaurants, and shopping walkable from the hotel. Downtown Scottsdale hotels and the Westin at Kierland Commons, for example, are in more pedestrian-oriented, mixed-use environments that provide advantages to hotels located in such environments. Advantages include scenic views in a resort environment known as a resort destination. The interviews with WestWorld and tourism officials and hotel managers indicate a high proportion of attendees of WestWorld events are middle class, family-oriented, baby boomers (adjectives used to describe typical visitors include “belongers”, “Chevrolet and Apple Pie”, and savvy consumers seeking unique experiences). While equestrian events are reported to comprise 75 percent of the current events, WestWorld is seeking to increase the frequency and diversity of events, including music festivals. A lower-priced select service hotel within walking distance to WestWorld would improve the competitive position of WestWorld, while offering an option not currently available to visitors to WestWorld. Such a hotel should:
Be large enough to help serve WestWorld and other tourism inducing events that currently cannot be accommodated within the study area hotel room inventory, provide another source of supply to serve overflow group demand, and serve as an amenity to users of potential office and medical uses that may locate in the vicinity in the future;
Offer smaller meeting space to appeal to those companies and regional, state governmental entities with restrictive travel and meeting budgets and to help WestWorld increase its ability to book different events, including some trade shows or exhibitions;
Be pet friendly and be near a viewing area for car enthusiasts;
Provide free Wifi; and
Include an information desk on all that Scottsdale offers. To also help the Fairmont and Marriott at McDowell Mountain compete for additional and larger group business, near the select service hotel should be an outdoor area with facilities that groups can use so as to not be taken outside of the area and be tempted to select hotels also outside Scottsdale. For example, a camp fire, with cook-out facilities, a western themed obstacle course with mechanical horse riding could be resources available for team building, education and training in an outdoor setting (with back up indoor facilities in the case of rain or adverse weather available in WestWorld). Multi-Family Market North Scottsdale has consistently been one of the higher-rent, lower vacancy rate submarkets in the
MARKET RECONNAISSANCE AND STRATEGIC POLICY RECOMMENDATIONS FOR THE BELL ROAD CORRIDOR
GRUEN GRUEN + ASSOCIATES PAGE 11
Phoenix apartment market. While no apartment projects were built between 2005 and 2014, one project has recently been built in the study area: Camden Foothills, a 220 unit project, opened in early 2015. One project, View at Cascade Apartments, south of Mayo Boulevard on the east side of Scottsdale Road, is under construction which will add another nearly 187 apartments in the study area. The recently completed and under construction apartment units will increase the existing apartment stock in the study area by nearly eight percent. An additional nine apartment projects either completed, under construction, or planned are located proximate to the study area. Collectively, these additional nine projects total more than 3,000 units. Based on U.S. Census Bureau County Business Patterns data, total employment within a geographic area including Zip-Code areas 85260 and 85255 (portions of the Bell Road Corridor are located in each of these two zip codes) and Zip-Code area 85254, in 2013 is estimated at 85,000. This broader North Scottsdale geographic area has been adding an average of approximately 2,000 jobs per year during recovery from the recession. Assuming employment growth continues to increase positively at approximately three percent annually would result in the employment in the North Scottsdale area increasing from approximately 85,000 workers in 2013 to approximately 104,500 workers in 2020. The gain in employment between 2015 (where estimated employment is approximately 90,200 workers) and 2020 is nearly 14,400 jobs. If a very sound jobs-to-housing balance of 1.7 jobs per household is maintained, approximately 8,500 new housing units of all types would be needed to accommodate an additional 14,400 jobs. Currently, 18 percent of the North Scottsdale housing stock is comprised of multi-family rental housing units. If this same ratio is maintained, such job growth would create demand for an additional 1,500 rental housing units. Approximately 2,800 apartments units recently opened, or are under construction or planned in the North Scottsdale area (in addition to two projects that opened in 2014 which added 627 units so the total is approximately 3,400 units). Although additional demand for multi-family rental housing may arise from not only employment growth but change in lifestyle, the supply of planned and under construction or recently opened units compared to the estimated rental housing demand due to job growth suggests that the multi-family rental housing market will be competitive in the foreseeable future and that rent and occupancy growth may slow until the currently planned or under construction units are absorbed. Relatively limited new construction single-family inventory is available. The interviews suggest at 3.5 units per acre, single-family lots and assuming typical site development costs, single-family development could potentially support a land value of approximately $400,000 per acre. Standard Pacific is developing a 42 unit gated attached townhome project at the northwest corner of Bell Road and Thompson Peak Parkway, north and west of the Windgate Crossing retail center. Asking prices range from approximately $470,000 to $570,000. The interviews suggest at eight units to the acre, a townhome type product with similar pricing could support a land value of approximately $600,000 per acre. The interviews with representatives of WestWorld and certain large events indicate concerns about residential uses on City-owned property. The concerns relate primarily to the potential for residential
MARKET RECONNAISSANCE AND STRATEGIC POLICY RECOMMENDATIONS FOR THE BELL ROAD CORRIDOR
GRUEN GRUEN + ASSOCIATES PAGE 12
uses to be incompatible with WestWorld, large event operations, and the Scottsdale Airport including the traffic created by visitors and the residential uses creating a source of complaints about traffic, noise, etc. induced by the events. Representatives of home owner associations for nearby master planned communities also indicated various reservations about apartment uses. DEVELOPMENT SCENARIOS TO STUDY FURTHER FOR CITY-OWNED PROPERTIES Development scenarios whose real estate economics and potential financial feasibility and supportable land values should be estimated in the next phase of work, and if found feasible economic and fiscal impacts evaluated, should include the following:
A select service hotel described above;
A restaurant and lively bar to appeal alike to residents, businesses, and visitors (examples interviews provided include unique, southwest themed venues such as Tonto Bar and Grill at Rancho Manana in Cave Creek (http://www.tontobarandgrill.com/) or LONS at the Hermosa Inn (http://www.hermosainn.com/lons/);
Additional food service including quick casual restaurants and convenience services;
Healthcare services to serve nearby residents and employer-sponsored wellness programs and if obtainable a fitness center (fitness centers have previously expressed interest in the higher visibility location at Crossroads East);
Corporate campus uses especially if sharing parking could be utilized between the corporate campus users and WestWorld events (with the exception of Arizona State Land Trust holdings, limited larger contiguous parcels are available and large blocks of building space are limited); and
Parking uses if needed to preserve the ability of WestWorld to host large events (see below). POLICY RECOMMENDATIONS The following summarize policy recommendations drawn from the synthesis of interviews and quantitative analysis described in this report:
Lower density, spread-out, predominately single-use office parks, particularly those with a parking shortage will not be readily able to compete for space users on factors other than price. Direct policies to encourage the linkage of Perimeter Center and other workplaces with restaurant, support services, and shopping, recreational, and residential uses. Encourage the continued evolution of the primary office park projects into mixed-use developments including office, retail, visitors and residential uses. Mixed-use developments enhance productivity and sense of place more than single-use or stand-alone office developments.
MARKET RECONNAISSANCE AND STRATEGIC POLICY RECOMMENDATIONS FOR THE BELL ROAD CORRIDOR
GRUEN GRUEN + ASSOCIATES PAGE 13
Because of infrastructure or environmental constraints, and in order to facilitate traffic-mitigating, and sense of place enhancing linkages between uses, development regulations should be structured so as to permit the concentration or density of building space to make the best use of the available property;
To facilitate such linkages and the creation of mixed-use developments, provide for setback, floor-area ratios, and height conditions reflective of the evolution of the study area to a more urban environment as opposed to low-density, separate land use suburban development characteristic of past land use no longer responsive to contemporary preferences;
Create an exciting way-finding system and biking and pedestrian trail system that connects to and between tourism and recreational attractions including WestWorld, the TPC of Scottsdale/Waste Management Phoenix Open, the McDowell Sonoran Preserve, the Ice Den, McDowell Mountain Ranch Aquatic Center etc. This should include a landscaped path with provision for parking under the Arizona Public Service Co. transmission line north of Bell Road on City-owned land and under the Arizona Public Service Co. transmission line east of Pima Road on Arizona State Land Trust land;
Create a visible, iconic, and informative signage system to promote the events and activities available at WestWorld that capitalize on highway and major arterial roadway proximity;
Identify and implement a parking plan to accommodate the current and long-term parking needs of major events such as the Barrett-Jackson Collection Car Auction (which for example currently estimates a parking need of 14,000 spaces) and the Waste Management Phoenix Open at TPC Scottsdale (which currently estimates a parking need of 25,000 spaces) on the assumption that current arrangements with the Arizona State Land Department will not be available in perpetuity. The evaluation should include the identification of shared parking and shuttle system opportunities to provide convenient locations for auxiliary parking for major events. Sources of funding beyond an outright City subsidy should be identified including the establishment of a dedicated parking fund account which would generate revenue from parking fees that would begin collection in the 2015-2016 season. The fees would be charged to attendees of all WestWorld and Phoenix Open events and the dedicated parking funds would be utilized to acquire/lease land and build strategically placed parking lots and/or structures. Identify whether, and if so, how much City-owned land would be needed to accommodate parking requirements;
Explore a parking leasing program, providing potential for private property users in or near the Bell Road corridor to lease parking stalls at WestWorld. Such a program would allow expanding businesses/office facilities in the area the opportunity to utilize WestWorld event parking to reduce the need to add parking on their property. Leasing arrangements would be for off-peak periods of WestWorld activity (typically weekday daytime hours) and not allow parking use to occur/conflict during major event parking periods. Fees generated from the program would be utilized to support the acquisition, development and maintenance of the event parking areas.
MARKET RECONNAISSANCE AND STRATEGIC POLICY RECOMMENDATIONS FOR THE BELL ROAD CORRIDOR
GRUEN GRUEN + ASSOCIATES PAGE 14
Complete the planning, funding, and implementation of drainage, flood-mitigation and stormwater management improvements and other needed infrastructure improvements to facilitate development of City-owned and Arizona State Land Department land holdings in the study area. A current study area disadvantage is lack of an interchange at Bell Road and Loop 101. Improving the accessibility and ingress and egress to WestWorld and City-owned land by identifying and implementing a Loop 101 interchange and other roadway improvements currently under study would increase the desirability of WestWorld to event sponsors and visitors (and hotel and office uses) and can be expected to raise the value of City-owned land (and other study area land);
In addition to the existing access points to WestWorld (via Loop 101 frontage, 94th street and McDowell Mountain Ranch), identify and implement a plan to obtain permanent control of an approximately 9.4-acre Arizona State Land Department parcel about 760’ east of 94th Street and south of Bell Road currently utilized via a State Land Use Permit (“SLUP”) for event parking and a permanent secondary entrance to WestWorld (and on which a hotel use and other potential uses described below could be built). Acquisition of this property will provide necessary flexibility to accommodate dynamic access and parking needs for large events requiring concurrent ingress and egress and will also allow multiple event operations within the same day at WestWorld to have alternative access patterns and thus maximize the flexibility of the existing WestWorld facilities; and
An additional draw would be a car museum/showroom as part of a headquarters complex for Barrett-Jackson, which the firm’s CEO has indicated potential interest in constructing (The CEO owns six acres of land adjoining WestWorld). Identify an optimum location for the facility to generate spillover to adjoining uses and activities (including the potential new hotel) and identify and encourage the commencement of the sequence of actions needed for implementation of the complex. One ideal location for the facility may be a portion of the approximately 9.4-acre Arizona State Land Department parcel south of Bell Road and East of 94th Street currently utilized via a State Land Use Permit (“SLUP”) so that the entrance way to WestWorld would feature the hotel and the museum/showroom which would be planned and designed in an integrated fashion. Whether through a long term ground lease or sale arrangements (the best structure to be determined), the hotel use and Barrett-Jackson use should offset and provide a return on the City’s cost of obtaining control of the 9.4 acre land parcel. If WestWorld would derive benefits from control of the six-acre parcel owned by Barrett-Jackson’s CEO, located closer to WestWorld and this site would not be needed by Barrett-Jackson if the headquarters’ complex was constructed on part of the 9.4-acre parcel, perhaps part of the contemplated transaction could include a land exchange between the City of Scottsdale and Barrett Jackson.
Economic Development Recommendations The study area contains ample capacity to house smaller office space users in existing buildings. When demand does arise for new multi-tenant speculative office development, Arizona State Trust Land located at the southeast quadrant of Loop 101 and Scottsdale Road is likely to be a preferred
MARKET RECONNAISSANCE AND STRATEGIC POLICY RECOMMENDATIONS FOR THE BELL ROAD CORRIDOR
GRUEN GRUEN + ASSOCIATES PAGE 15
location. The City-owned land could hold potential for corporate campus/R&D users which are not as image or visibility conscious as users which want to be on Scottsdale Road and adjoin Loop 101 and whose decision makers live in the vicinity of the site. Sources of demand are likely to include firms with engineering, administrative, sales and managerial talent more typically associated with an older, family-age workforce seeking the quality of life opportunities, school, library and park amenities more prevalent in suburban environments like the part of Scottsdale in which the study area is located. Concentrate economic development efforts on serving existing firms in Scottsdale and accommodating the expansion or consolidation needs of those firms already located within the market area seeking additional locations or more efficient facilities (in the course of the study multiple examples of such firms were identified). Should a multi-site company from outside the region appear interested in establishing a local corporate campus or R&D function a concentrated effort should be made to meet the company’s space requirements. Such actions, however, should be spurred by evidence of interest. To be in the best position to respond to internal or external sources of demand will require having resolved or being able to address the infrastructure issues and physical constraints, including parking needs for events/WestWorld outlined above. The City should continue to direct economic development policies and programs to encourage firm growth and retention primarily by ensuring that the civic, social, and physical infrastructure, or local economic environmental conditions, exist to help local industries adapt and remain successful. This means helping areas within the City to change and reorder themselves to provide services, amenities, building space and mixes of land uses that attract and hold talented labor upon which innovative companies depend and increase agglomeration economies (advantages of clustering) to firms, institutions, and talent. So, for example, while decidedly unglamorous, helping one local financial services company within the study area solve its parking shortage caused by growth of employment at its existing office space location is a good example of the municipal basics for providing the conditions for innovation and growth. In addition to adequate parking, the conditions required include adequate transportation infrastructure, digital connectivity, a well-maintained public realm, sufficient housing, and a well-educated workforce.

MARKET RECONNAISSANCE AND STRATEGIC POLICY RECOMMENDATIONS FOR THE BELL ROAD CORRIDOR
GRUEN GRUEN + ASSOCIATES PAGE 16
RECOMMENDATIONS FOR FURTHER EVALUATION, PROGRAMMING, CRITERIA TO USE TO ASSESS SCENARIOS AND TEST MARKETING OF OPTIONS In order to identify a practical, effective, and beneficial development plan and strategy for the use and development of City-owned property, we recommend that the following issues be addressed prior to solicitation of investors-developers:
Completion of the evaluation of physical conditions related to infrastructure requirements such as stormwater and flood mitigation issues referred to above that bear on potential land use and development options;
Preparation of conceptual land use plans and development cost estimates (including on- and off-site site, hard and soft costs) showing the scale and type of real estate products suggested by the results of the market reconnaissance and subsequent follow-up market research geared to refining product definition and obtainable pricing(e.g., hotel and other uses described above);
Analysis of the real estate economics and supportable land values of the conceptual land use plans in order to identify which plan or product scenarios are most likely to enhance the land value of the property and to quantify that value as well as the likely fiscal ramifications on taxing entities and economic impacts of the alternatives;
Stakeholder input and outreach process to ensure the plan is sensitive and responsive to the needs of the community. Proactively adopt appropriate zoning and other regulatory designations to mitigate uncertainty about developers obtaining the requisite approvals to implement the civic vision for City-owned land; and
Identification of implementation program and strategies, including marketing and solicitation components based on test marketing and developer/user outreach.
The results of the physical evaluation, conceptual land use planning, real estate economic analysis, and stakeholder input process will include the following:
1. Identification of one or more land use programs or development options and associated marketing strategies that enhance the value of the land from the perspective of prospective users/developers. More than one set of uses will probably need to be identified so as to evaluate trade-offs in terms of what will be preferred by stakeholders and market conditions and the ability to preserve market responsiveness in the future (as well as any constraints on disposition structures related to the debt encumbering City-owned land);
2. Identification of the supportable land value or revenue-generating potential and fiscal and
economic impacts from alternative land use programs; and
3. Identification of a marketing strategy, including timing, parcelization, sale, joint venture ground-leasing or other transaction structures and the targeting of both potential users and investors/developers.
The advantages and disadvantages of alternative development implementation and marketing

MARKET RECONNAISSANCE AND STRATEGIC POLICY RECOMMENDATIONS FOR THE BELL ROAD CORRIDOR
GRUEN GRUEN + ASSOCIATES PAGE 17
strategies will be identified. There may be trade-offs between decisions about the kind of use and development alternatives. For example, if providing for parking on City-owned land to preserve the ability of WestWorld to serve large events when Arizona State Land Trust holdings are no longer available to be used for temporary parking, it may be more important to provide for a less remunerative parking use at a given location than a use that supports a higher land value. Issues such as which “parcels” to market at various times and the advisability of issuing "Requests for Proposals" or combinations of “Requests for Qualifications” and Requests for Proposals to various target user and developer/investor markets should be based on the outcome of the process outlined above. In the past GG+A has found that obtaining the most dollars and community benefits from the sale, ground-leasing or other disposition of a site is rarely achieved by insisting that development conform exactly to a pre-conceived plan. Instead, we have found that if a floor of value is established by demonstrating feasibility and identifying highest and best uses for the site, this leaves open the potential for further value enhancement by the buyer/user/developer, and the number of bidders and what they will conceive in terms of further value enhancements is maximized. In addition, we have found that entitlement issues related to the specific alternatives should be resolved prior to solicitation as should the criteria to be used in the selection of a buyer/developer(s) or other participants.

MARKET RECONNAISSANCE AND STRATEGIC POLICY RECOMMENDATIONS FOR THE BELL ROAD CORRIDOR
GRUEN GRUEN + ASSOCIATES PAGE 18
CHAPTER II: INTRODUCTION AND PURPOSE INTRODUCTION AND PURPOSE In 2009, Gruen Gruen + Associates (GG+A) conducted economic and market research and analysis to provide an information base and identify strategic policy actions for the preparation of the Greater Airpark Character Area Plan. The Greater Airpark Character Area Plan was adopted in 2010. Since GG+A’s 2009 study (which can be found on the City of Scottsdale’s web site: http://www.scottsdaleaz.gov/Assets/Public+Website/economics/2009+Airpark+Land+Use+Study.pdf, or by using the website search bar), the Great Recession has ended; the more than 300,000-square-foot, climate-controlled Tony Nelssen Equestrian Center at WestWorld has opened; the center's North Hall, where the Barrett-Jackson Collector Car Event auction is held, has been expanded; and applications for the purchase and development of vacant State of Arizona Trust land in the Bell Road Corridor have been made. The City of Scottsdale commissioned GG+A to conduct research and analysis, including stakeholder interviews, to provide an updated information base and strategic recommendations for a portion of the Greater Airpark Area, the Bell Road Corridor (sometimes referred to below as “study area”). STUDY AREA Map II-1 outlines the study area (and the Greater Airpark Character Area). The study area is bounded by Frank Lloyd Wright Boulevard on the south, Scottsdale Road on the west, Pima Road on the east, and Thompson Peak Parkway on both the east and north boundary of the study area. The study area includes or is near WestWorld, land owned by the City of Scottsdale, Arizona State Land Trust land, and a host of additional recreational attractions such as the McDowell Sonoran Preserve, the Barrett-Jackson Collector Car Auction, and the TPC of Scottsdale/Waste Management Phoenix Open, and the largest resort hotel in the City of Scottsdale: The Fairmont Princess.
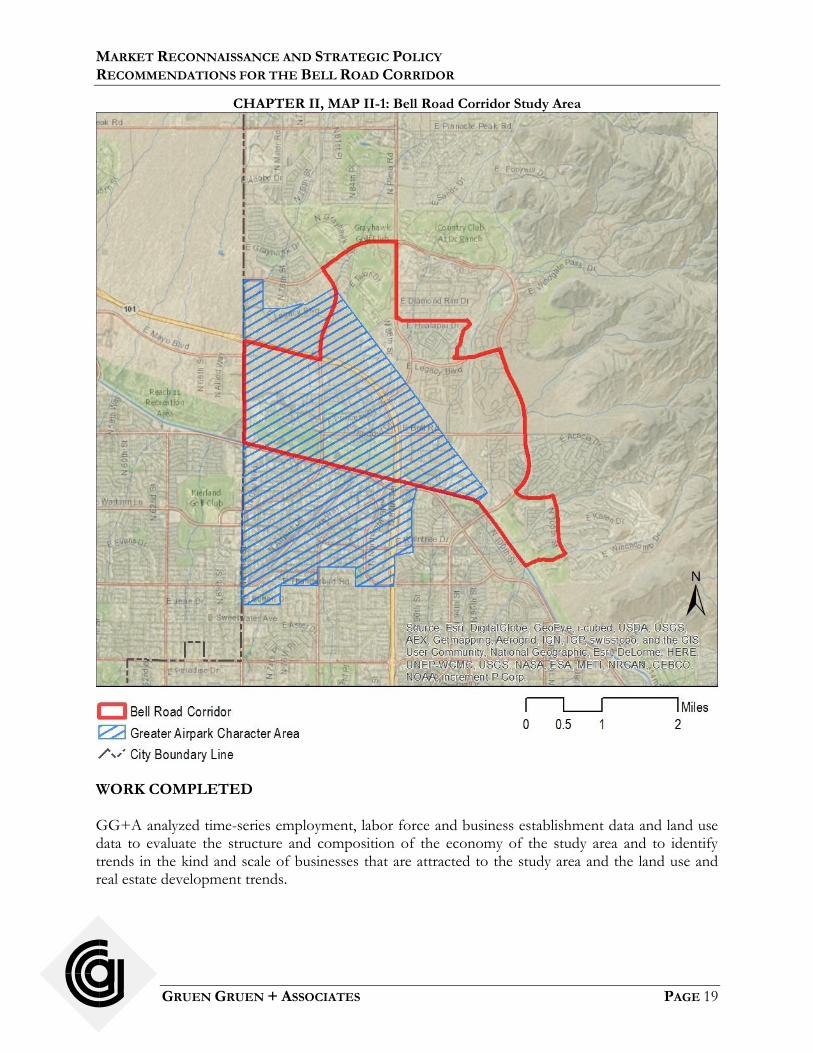
MARKET RECONNAISSANCE AND STRATEGIC POLICY RECOMMENDATIONS FOR THE BELL ROAD CORRIDOR
GRUEN GRUEN + ASSOCIATES PAGE 19
CHAPTER II, MAP II-1: Bell Road Corridor Study Area
WORK COMPLETED GG+A analyzed time-series employment, labor force and business establishment data and land use data to evaluate the structure and composition of the economy of the study area and to identify trends in the kind and scale of businesses that are attracted to the study area and the land use and real estate development trends.
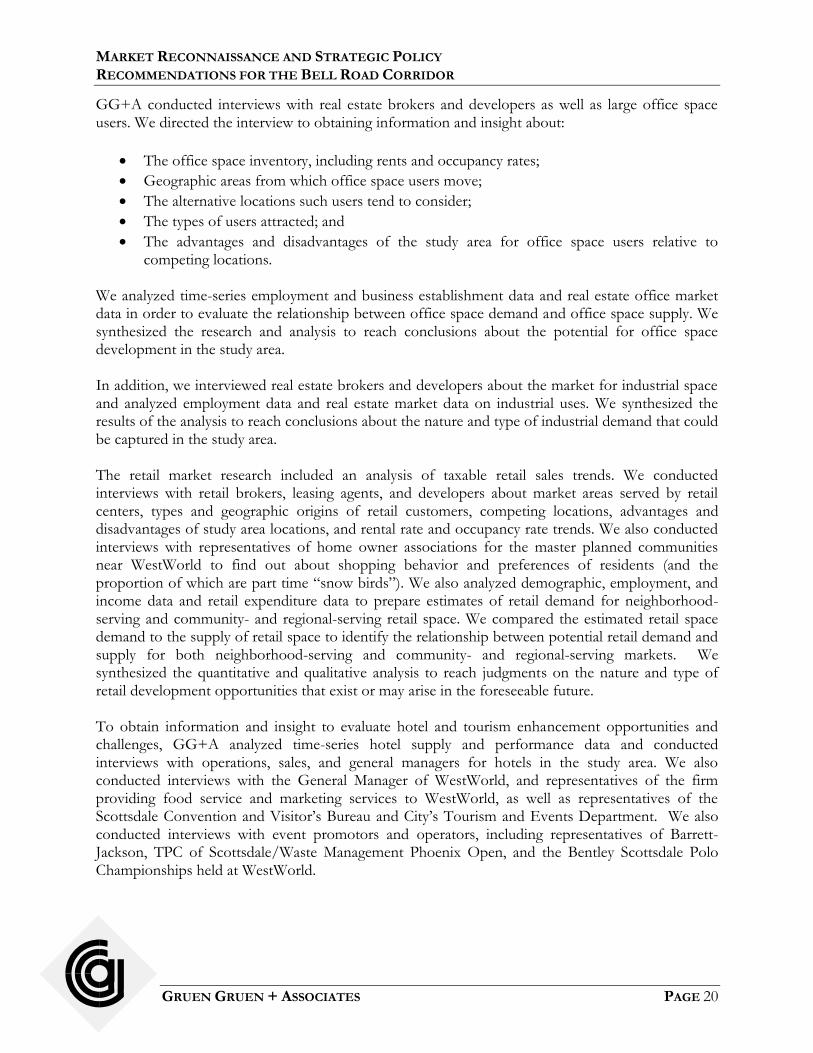
MARKET RECONNAISSANCE AND STRATEGIC POLICY RECOMMENDATIONS FOR THE BELL ROAD CORRIDOR
GRUEN GRUEN + ASSOCIATES PAGE 20
GG+A conducted interviews with real estate brokers and developers as well as large office space users. We directed the interview to obtaining information and insight about:
The office space inventory, including rents and occupancy rates;
Geographic areas from which office space users move;
The alternative locations such users tend to consider;
The types of users attracted; and
The advantages and disadvantages of the study area for office space users relative to competing locations.
We analyzed time-series employment and business establishment data and real estate office market data in order to evaluate the relationship between office space demand and office space supply. We synthesized the research and analysis to reach conclusions about the potential for office space development in the study area. In addition, we interviewed real estate brokers and developers about the market for industrial space and analyzed employment data and real estate market data on industrial uses. We synthesized the results of the analysis to reach conclusions about the nature and type of industrial demand that could be captured in the study area. The retail market research included an analysis of taxable retail sales trends. We conducted interviews with retail brokers, leasing agents, and developers about market areas served by retail centers, types and geographic origins of retail customers, competing locations, advantages and disadvantages of study area locations, and rental rate and occupancy rate trends. We also conducted interviews with representatives of home owner associations for the master planned communities near WestWorld to find out about shopping behavior and preferences of residents (and the proportion of which are part time “snow birds”). We also analyzed demographic, employment, and income data and retail expenditure data to prepare estimates of retail demand for neighborhood-serving and community- and regional-serving retail space. We compared the estimated retail space demand to the supply of retail space to identify the relationship between potential retail demand and supply for both neighborhood-serving and community- and regional-serving markets. We synthesized the quantitative and qualitative analysis to reach judgments on the nature and type of retail development opportunities that exist or may arise in the foreseeable future. To obtain information and insight to evaluate hotel and tourism enhancement opportunities and challenges, GG+A analyzed time-series hotel supply and performance data and conducted interviews with operations, sales, and general managers for hotels in the study area. We also conducted interviews with the General Manager of WestWorld, and representatives of the firm providing food service and marketing services to WestWorld, as well as representatives of the Scottsdale Convention and Visitor’s Bureau and City’s Tourism and Events Department. We also conducted interviews with event promotors and operators, including representatives of Barrett-Jackson, TPC of Scottsdale/Waste Management Phoenix Open, and the Bentley Scottsdale Polo Championships held at WestWorld.

MARKET RECONNAISSANCE AND STRATEGIC POLICY RECOMMENDATIONS FOR THE BELL ROAD CORRIDOR
GRUEN GRUEN + ASSOCIATES PAGE 21
We obtained apartment market data and conducted interviews with residential land brokers and multi-family product developers to obtain information and insight about the multi-family market. We estimated the demand for apartment units attributable to employment growth in the broader Airpark market area and compared the relationship between employment-driven apartment demand to supply to reach judgements about whether the current supply additions are likely to satisfy demand in the short to medium term. We also conducted interviews and analyzed secondary data related to townhome, condominium, and single-family uses. REPORT ORGANIZATION
Chapter III summarizes employment, labor force, and commutation patterns for the study area and compares the study area’s employment base by industry sector to that of the City of Scottsdale;
Chapter IV summarizes the study area’s land inventory by land use and the amount of office, industrial, and retail space and the hotel and multi-family inventory;
Chapter V describes the office market trends for the Scottsdale Airpark and summarizes the amount of existing and planned future supply of office space in the study area;
Chapter VI identifies the primary geographic areas from which office building space users will tend to be attracted and identifies the primary competing locations which many office space users will consider in selecting locations to which they will move. It also identifies the primary advantages and disadvantages associated with the study area as a business location and provides a review of the building space inventory and the land capacity to accommodate future building space development;
Chapter VII describes industrial market trends for the Scottsdale Airpark and summarizes the amount of existing and planned future supply of industrial space in the study area and identifies the primary competing locations which many industrial space users will consider in selecting locations to which they will move. It also identifies the primary advantages and disadvantages associated with the study area as an industrial location and the ability to attract industrial/flex space users;
Chapter VIII describes the taxable sales trends for the study area and presents a comparison to citywide taxable sales;
Chapter IX summarizes retail market trends for both North Scottsdale and the Scottsdale Airpark areas and the supply of regional, community, big-box, and free-standing retail space and neighborhood retail space in and near the study area. The potential primary trade area for retail development in the study area is described. A quantitative assessment of the primary trade area demand, both in terms of available dollars and supportable space for the study area is presented. An analysis of the relationship between present demand and supply in the primary trade area for retail uses is also presented;

MARKET RECONNAISSANCE AND STRATEGIC POLICY RECOMMENDATIONS FOR THE BELL ROAD CORRIDOR
GRUEN GRUEN + ASSOCIATES PAGE 22
Chapter X presents hotel market trends in Scottsdale and the hotel room inventory in the study area and describes findings drawn from interviews with managers of major hotels in the study area; and
Chapter XI presents apartment market trends in North Scottsdale and the existing apartment unit inventory in the study area and supply of future apartment units planned in and near the study area. Chapter XI presents an analysis of potential demand for apartments relative to supply. Chapter XI also summarizes findings about other residential product types in the study area.
MARKET RECONNAISSANCE AND STRATEGIC POLICY RECOMMENDATIONS FOR THE BELL ROAD CORRIDOR
GRUEN GRUEN + ASSOCIATES PAGE 23
CHAPTER III: THE STRUCTURE OF THE EMPLOYMENT BASE OF THE BELL ROAD CORRIDOR AND COMPARISON TO CITY OF SCOTTSDALE AS A WHOLE
AND LABOR FORCE CHARACTERISTICS AND COMMUTATION PATTERNS
Table III-1 summarizes the Bell Road Corridor study area’s employment by industry sector for 2007 and 2013 (most recent year for which data is available).
TABLE III-1: Bell Road Corridor Employment Base1 Patterns, 2007-2013
Industry Sector
2007 #
2013 #
Change 2007-2013
#
AAGR2 2007-2013
%
Construction 1,279 1,018 (261) (3.7)
Manufacturing 1,376 1,642 266 3.0
Wholesale Trade 789 374 (415) (11.7)
Retail Trade 389 416 27 1.1
Transportation & Warehousing 91 140 49 7.4
Information 181 379 198 13.1
Finance, Insurance & Real Estate (FIRE) 1,692 1,437 (255) (2.7)
Professional & Business Services 2,109 2,003 (106) (0.9)
Education & Health Care/Social Services 416 907 491 13.9
Leisure & Hospitality 2,198 2,225 27 0.2
Other Services 132 93 (39) (5.7)
Public Administration 70 78 8 1.8
Total 3 10,754 10,747 (7) (0.0) 1 Job estimates are for employers with five or more employees. Smaller firms and self-employed individuals, etc., are not covered. 2 Average annual growth rate (compound growth rate). 3 Total includes a small number of unclassified and mining/extraction jobs.
Sources: Maricopa Association of Governments (MAG), 2007 & 2013 Employer Database (Employers with 5 or More Employees); Gruen Gruen + Associates.
According to the Maricopa Association of Governments Employer Database, the Bell Road Corridor study area contained approximately 10,700 non-farm jobs in 2013. The total non-farm employment base did not grow over the 2007-2013 period although individual industry sectors gained or lost jobs. The education and healthcare industry sector experienced particularly robust job growth – even during the recession of 2008-2009, adding nearly 500 jobs, more than double the number of jobs in 2007. Employment in the two largest sectors – leisure and hospitality and

MARKET RECONNAISSANCE AND STRATEGIC POLICY RECOMMENDATIONS FOR THE BELL ROAD CORRIDOR
GRUEN GRUEN + ASSOCIATES PAGE 24
professional and business services – slightly declined or remained stable over the period. Manufacturing employment, the third largest sector gained 266 jobs but this was offset by an almost equal amount of jobs losses in the finance, insurance, and real estate sector. Construction industry employment also declined as little new building space and housing was added over the six-year period. Table III-2 summarizes the number of business establishments by employment size in 2007 and 2013 for the study area.
TABLE III-2: Bell Road Corridor Employment by Size of Establishment, 2007-2013
5-9 Employees
10-19 Employees
20-49 Employees
50-99 Employees
100+ Employees
2007:
Number of Establishments 91 55 42 27 27
Percent of Establishments 37.6% 22.7% 17.4% 11.2% 11.2%
Number of Employees 575 697 1,173 1,689 6,620
Percent of Employment 5.3% 6.5% 10.9% 15.7% 61.6%
2013:
Number of Establishments 154 78 59 29 21
Percent of Establishments 45.2% 22.9% 17.3% 8.5% 6.2%
Number of Employees 933 983 1,731 1,951 5,149
Percent of Employment 8.7% 9.1% 16.1% 18.2% 47.9%
Change 2007-2013:
Number of Establishments 63 23 17 2 -6
Number of Employees 358 286 558 262 -1,471
Sources: Maricopa Association of Governments (MAG), 2007 & 2013 Employer Database (See Table III-1); Gruen Gruen + Associates.
In 2007, over one-third of study area businesses had nine or fewer employees which represented about five percent of total study area employment. The largest firms (those with 100+ employees) which represented just over 10 percent of all businesses contained a majority of the study area’s employment base at nearly 62 percent of total employment. By 2013, most of the growth in employment and number of businesses was for firms with 49 or fewer employees. The largest firms declined by six establishments and total employment at these larger firms comprised just under half of the study area’s total employment. This decline in the number (and employment represented) of the larger firms is consistent with interviews with brokers and leasing agents who indicated that larger firms have contracted or not grown employment.

MARKET RECONNAISSANCE AND STRATEGIC POLICY RECOMMENDATIONS FOR THE BELL ROAD CORRIDOR
GRUEN GRUEN + ASSOCIATES PAGE 25
Map III-1 shows the largest employers in the study area. They include firms serving households in the area, and providing administrative support services and hospitality services.
CHAPTER III, MAP III-1: Largest Employers in the Bell Road Corridor
Table III-3 summarizes the employment base by industry sector for the City of Scottsdale in 2007

MARKET RECONNAISSANCE AND STRATEGIC POLICY RECOMMENDATIONS FOR THE BELL ROAD CORRIDOR
GRUEN GRUEN + ASSOCIATES PAGE 26
and 2013.
TABLE III-3: City of Scottsdale Employment Base1 Patterns, 2007-2013
Industry Sector
2007 #
2013 #
Change 2007-2013
#
AAGR2 2007-2013
%
Construction 9,089 7,314 (1,775) (3.6)
Manufacturing 12,184 7,812 (4,372) (7.1)
Wholesale Trade 4,731 4,374 (357) (1.3)
Retail Trade 17,211 16,715 (496) (0.5)
Transportation & Warehousing 1,481 1,284 (197) (2.4)
Information 2,648 5,774 3,126 13.9
Finance, Insurance & Real Estate (FIRE) 17,830 17,332 (498) (0.5)
Professional & Business Services 29,086 21,146 (7,940) (5.2)
Education & Health Care/Social Services 16,972 20,542 3,570 3.2
Leisure & Hospitality 19,525 18,637 (888) (0.8)
Other Services 4,628 4,565 (63) (0.2)
Public Administration 2,467 2,103 (364) (2.6)
Total 3 138,041 128,150 (9,891) (1.2) 1 Job estimates are for employers with five or more employees. Smaller firms and self-employed individuals, etc., are not covered. The 2007 job estimate is lower than shown on Table V-2 in GG+A’s March 2009 report “Analysis and Forecast of Employment and Building Space Demand and Strategic Policy Recommendations for Greater Airpark Study Area” which covers total employment including firms with fewer than five employees. 2 Average annual growth rate (compound growth rate). 3 Total includes a small number of unclassified, agriculture and mining/extraction jobs.
Sources: Maricopa Association of Governments (MAG), 2007 & 2013 Employer Database; Gruen Gruen + Associates.
According to the Maricopa Association of Governments (MAG) Employer Database which covers employment for firms with five or more employees, the City of Scottsdale contained approximately 128,000 non-farm jobs in 2013. The total non-farm employment base declined over the 2007-2013 period though individual industry sectors gained or lost jobs. The City lost a total of nearly 10,000 jobs between 2007 and 2013. While the study area stayed relatively constant in its total employment base, the City of Scottsdale declined by one percent annually. Consistent with employment trends in the Bell Road Corridor study area, the education and healthcare industry sector experienced particularly robust job growth – even during the recession of 2008-2009, adding nearly 3,600 jobs.

MARKET RECONNAISSANCE AND STRATEGIC POLICY RECOMMENDATIONS FOR THE BELL ROAD CORRIDOR
GRUEN GRUEN + ASSOCIATES PAGE 27
(About 14 percent of the education and healthcare sector job growth occurred in the study area). The only other sector to increase in jobs over the six year period was the information sector. This sector grew by more than 3,000 jobs. The largest sector and the one that declined the most was the professional and business services sector. This sector lost approximately 7,900 jobs. Manufacturing also experienced a large loss of nearly 4,400 jobs. Table III-4 summarizes the share the Bell Road Corridor study area’s employment base makes up of citywide employment and how this has shifted over time.
TABLE III-4: Bell Road Corridor Share of Citywide Employment Base, 2007-2013
Industry Sector
2007 %
2013 %
Shift 2007-2013 Percentage Points
Construction 14.1 13.9 (0.2)
Manufacturing 11.3 21.0 +9.7
Wholesale Trade 16.7 8.6 (8.1)
Retail Trade 2.3 2.5 +0.2
Transportation & Warehousing 6.1 10.9 +4.8
Information 6.8 6.6 (0.3)
Finance, Insurance & Real Estate (FIRE) 9.5 8.3 (1.2)
Professional & Business Services 7.3 9.5 +2.2
Education & Health Care/Social Services 2.5 4.4 +2.0
Leisure & Hospitality 11.3 11.9 +0.7
Other Services 2.9 2.0 (0.8)
Public Administration 2.8 3.7 +0.9
Total 7.8 8.4 +0.6
Sources: Maricopa Association of Governments (MAG), 2007 & 2013 Employer Database; Gruen Gruen + Associates.
The study area’s share of the City’s overall employment increased between 2007 and 2013, as the City’s total employment fell but the study area’s total employment remained constant. The study area increased its share of citywide employment by 0.6 percent to nearly 8.5 percent in 2013. Although professional and business services and leisure and hospitality services make up a significant share (39 percent) of employment in the study area, these two sectors collectively make up 21 percent of citywide employment. Manufacturing, the third largest employment sector in the study area, comprises the largest share of citywide employment, having increased from 11 percent in 2007 to 21 percent in 2013 of total manufacturing employment in the City of Scottsdale.
MARKET RECONNAISSANCE AND STRATEGIC POLICY RECOMMENDATIONS FOR THE BELL ROAD CORRIDOR
GRUEN GRUEN + ASSOCIATES PAGE 28
Construction sector employment also makes up a significant share of citywide employment at nearly 14 percent, though its share of the study area employment base is less than 10 percent. Transportation and warehousing employment make up a very tiny share of both study area and citywide employment but the study area’s share of citywide employment in this sector is nearly 11 percent (consistent with nearly a quarter of the study area’s space inventory being comprised of industrial/flex warehouse type space). FIRE employment, the study area’s fourth largest employment sector, accounts for under 10 percent of citywide employment and its share of citywide employment has fallen since 2007. The review of employment and business establishment trends suggest smaller (less than 49 employees and especially less than 20 and less than 10 employees) businesses have been attracted to the study area. Employers in the educational and healthcare sectors have experienced the highest growth in the study area while relative to the City as a whole, employment in manufacturing and information has increased. According to MAG, 55 percent of manufacturing employment within the study area is in the “Computer and Electronic Product Manufacturing” sector. Fabricated metals and wood products comprise another 28 percent of manufacturing employment. Taser International, St. Jude Medical, and Fender Musical Instruments are listed as the three largest manufacturers, comprising about 950 jobs. In terms of occupational data, MAG’s trip reduction survey database (covering only employers with 50+ workers) indicates that only 2.6 percent of study area jobs are comprised by blue-collar “Production, Construction and Transport” occupations. White collar “Business, Financial and Professional” occupations make up about 35 percent of the job base, the largest occupational sector. This suggests that even manufacturing employers in the study area are likely to be comprised by a white collar occupational skill set. LABOR FORCE CHARACTERISTICS AND COMMUTATION PATTERNS As summarized in Table III-5, about 15 percent of the study area’s workforce originates from within a 15-minute commute shed. A much higher proportion of the study area’s resident labor force, approximately 35 percent, is employed within a 15-minute commute shed. The “workforce” is representative of workers employed in the Bell Road Corridor study area; many of which commute into the study area for employment. The “labor force” is representative of employed resident workers living in the Bell Road Corridor, but not necessarily working there.

MARKET RECONNAISSANCE AND STRATEGIC POLICY RECOMMENDATIONS FOR THE BELL ROAD CORRIDOR
GRUEN GRUEN + ASSOCIATES PAGE 29
TABLE III-5: Estimated Origin and Destination of Workers Employed or Residing in the Bell
Road Corridor, by Drive Time Zone1
Less than
15 Minutes 15 to 30 Minutes
30 to 45 Minutes
More than 45 Minutes
Total Responses
Workers Employed in Bell Road Corridor (Origin of the Workforce):
Number of Responses (#) 446 1,210 921 347 2,924
Percent of Responses (%) 15.3 41.4 31.5 11.9 100.0
Resident Labor in Bell Road Corridor (Destination of the Labor force):
Number of Responses (#) 704 578 731 18 2,031
Percent of Responses (%) 34.7 28.5 36.0 0.9 100.0 1The survey estimates only reflect the commute characteristics of workers employed at large (50+ person) firms.
Sources: Maricopa Association of Governments (MAG), 2013 Trip Reduction Database; Gruen Gruen + Associates.
The high proportion of workers who commute in or commute out of the Bell Road Corridor study area is consistent with discussion with real estate brokers and leasing agents that the study area draws its workforce from farther away, primarily the southeast valley and northeast Phoenix. Table III-6 identifies differences in the commute shed of workers employed in the study area by type of occupation.
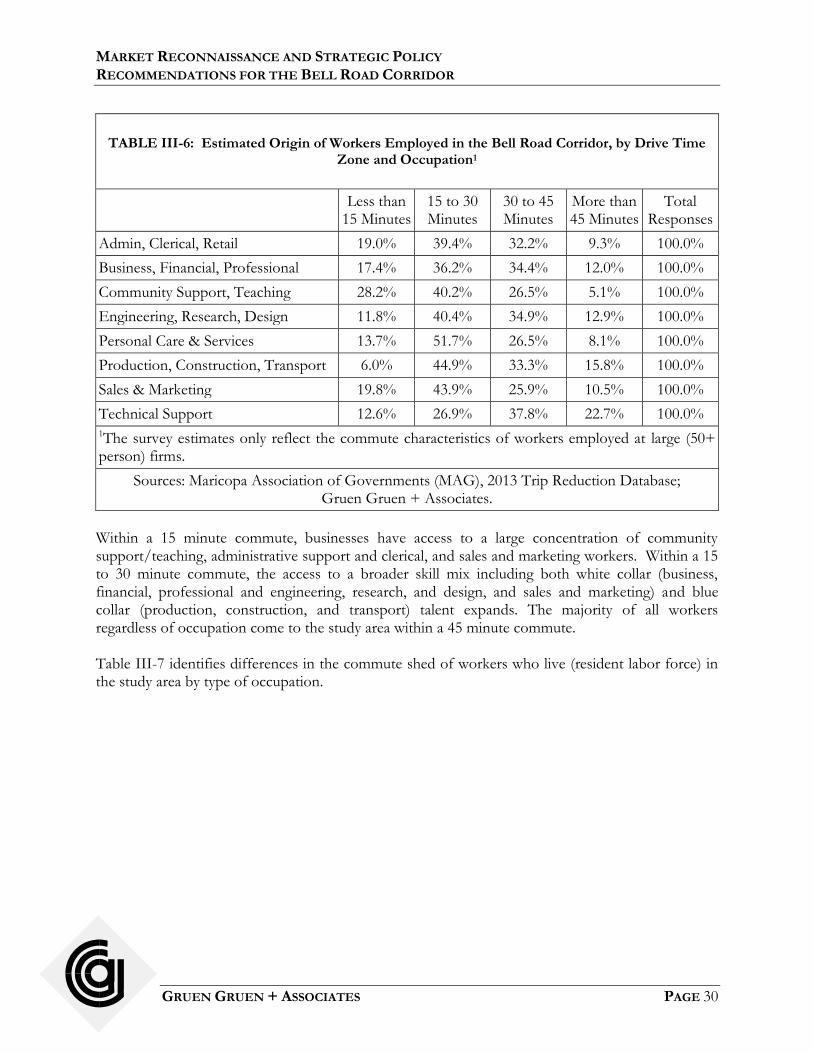
MARKET RECONNAISSANCE AND STRATEGIC POLICY RECOMMENDATIONS FOR THE BELL ROAD CORRIDOR
GRUEN GRUEN + ASSOCIATES PAGE 30
TABLE III-6: Estimated Origin of Workers Employed in the Bell Road Corridor, by Drive Time
Zone and Occupation1
Less than
15 Minutes 15 to 30 Minutes
30 to 45 Minutes
More than 45 Minutes
Total Responses
Admin, Clerical, Retail 19.0% 39.4% 32.2% 9.3% 100.0%
Business, Financial, Professional 17.4% 36.2% 34.4% 12.0% 100.0%
Community Support, Teaching 28.2% 40.2% 26.5% 5.1% 100.0%
Engineering, Research, Design 11.8% 40.4% 34.9% 12.9% 100.0%
Personal Care & Services 13.7% 51.7% 26.5% 8.1% 100.0%
Production, Construction, Transport 6.0% 44.9% 33.3% 15.8% 100.0%
Sales & Marketing 19.8% 43.9% 25.9% 10.5% 100.0%
Technical Support 12.6% 26.9% 37.8% 22.7% 100.0% 1The survey estimates only reflect the commute characteristics of workers employed at large (50+ person) firms.
Sources: Maricopa Association of Governments (MAG), 2013 Trip Reduction Database; Gruen Gruen + Associates.
Within a 15 minute commute, businesses have access to a large concentration of community support/teaching, administrative support and clerical, and sales and marketing workers. Within a 15 to 30 minute commute, the access to a broader skill mix including both white collar (business, financial, professional and engineering, research, and design, and sales and marketing) and blue collar (production, construction, and transport) talent expands. The majority of all workers regardless of occupation come to the study area within a 45 minute commute. Table III-7 identifies differences in the commute shed of workers who live (resident labor force) in the study area by type of occupation.

MARKET RECONNAISSANCE AND STRATEGIC POLICY RECOMMENDATIONS FOR THE BELL ROAD CORRIDOR
GRUEN GRUEN + ASSOCIATES PAGE 31
TABLE III-7: Estimated Destination of Bell Road Corridor Resident Labor Force, by Drive Time
Zone and Occupation1
Less than
15 Minutes 15 to 30 Minutes
30 to 45 Minutes
More than 45 Minutes
Total Responses
Admin, Clerical, Retail 39.9% 32.0% 27.7% 0.4% 100.0%
Business, Financial, Professional 30.2% 25.9% 43.3% 0.6% 100.0%
Community Support, Teaching 36.6% 32.0% 29.7% 1.7% 100.0%
Engineering, Research, Design 26.7% 34.8% 36.3% 2.2% 100.0%
Personal Care & Services 52.4% 27.6% 20.0% 0.0% 100.0%
Production, Construction, Transport 24.5% 13.2% 58.5% 3.8% 100.0%
Sales & Marketing 39.6% 20.9% 38.7% 0.9% 100.0%
Technical Support 32.7% 16.4% 50.9% 0.0% 100.0% 1The survey estimates only reflect the commute characteristics of workers employed at large (50+ person) firms.
Sources: MAG, 2013 Trip Reduction Database; Gruen Gruen + Associates.
Approximately a quarter to half of workers who live in the study area are employed within a 15 minute commute across all skill types. A high share of for personal care and services workers live within a 15 minute commute. Sales and marketing and administrative and clerical resident workers also have a higher share of those employed close to or in the study area. This is consistent with the kinds of functions businesses are providing in the study area, namely back office and administrative type functions. Differences also exist among the educational and wage characteristics of the study area workforce and resident labor force, as summarized below in Table III-8.
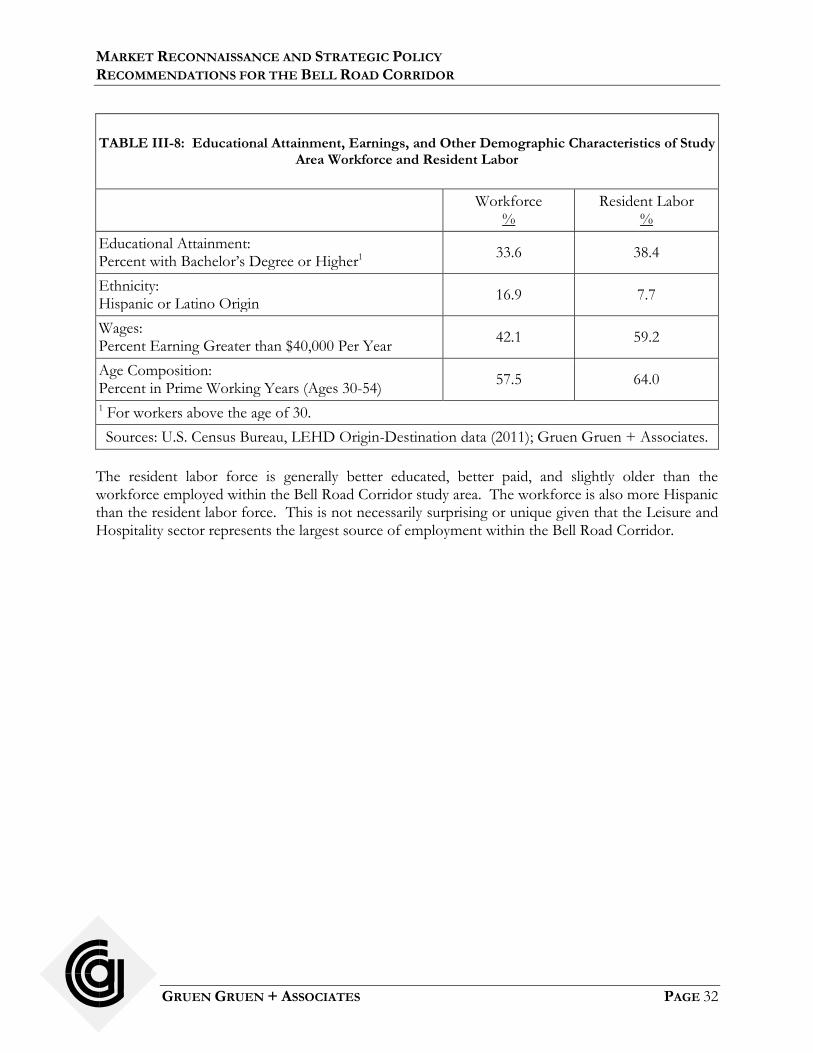
MARKET RECONNAISSANCE AND STRATEGIC POLICY RECOMMENDATIONS FOR THE BELL ROAD CORRIDOR
GRUEN GRUEN + ASSOCIATES PAGE 32
TABLE III-8: Educational Attainment, Earnings, and Other Demographic Characteristics of Study
Area Workforce and Resident Labor
Workforce
% Resident Labor
%
Educational Attainment: Percent with Bachelor’s Degree or Higher1
33.6 38.4
Ethnicity: Hispanic or Latino Origin
16.9 7.7
Wages: Percent Earning Greater than $40,000 Per Year
42.1 59.2
Age Composition: Percent in Prime Working Years (Ages 30-54)
57.5 64.0
1 For workers above the age of 30.
Sources: U.S. Census Bureau, LEHD Origin-Destination data (2011); Gruen Gruen + Associates.
The resident labor force is generally better educated, better paid, and slightly older than the workforce employed within the Bell Road Corridor study area. The workforce is also more Hispanic than the resident labor force. This is not necessarily surprising or unique given that the Leisure and Hospitality sector represents the largest source of employment within the Bell Road Corridor.
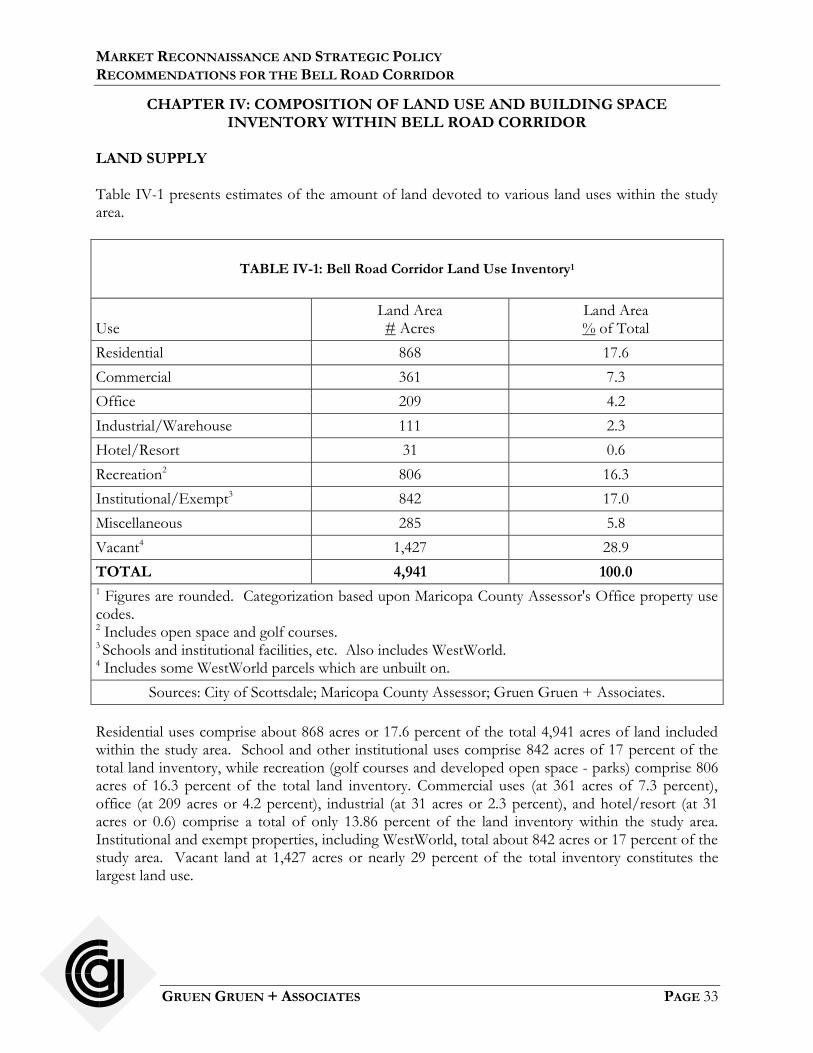
MARKET RECONNAISSANCE AND STRATEGIC POLICY RECOMMENDATIONS FOR THE BELL ROAD CORRIDOR
GRUEN GRUEN + ASSOCIATES PAGE 33
CHAPTER IV: COMPOSITION OF LAND USE AND BUILDING SPACE INVENTORY WITHIN BELL ROAD CORRIDOR
LAND SUPPLY Table IV-1 presents estimates of the amount of land devoted to various land uses within the study area.
TABLE IV-1: Bell Road Corridor Land Use Inventory1
Use
Land Area # Acres
Land Area % of Total
Residential 868 17.6
Commercial 361 7.3
Office 209 4.2
Industrial/Warehouse 111 2.3
Hotel/Resort 31 0.6
Recreation2 806 16.3
Institutional/Exempt3 842 17.0
Miscellaneous 285 5.8
Vacant4 1,427 28.9
TOTAL 4,941 100.0 1 Figures are rounded. Categorization based upon Maricopa County Assessor's Office property use codes. 2 Includes open space and golf courses. 3 Schools and institutional facilities, etc. Also includes WestWorld. 4 Includes some WestWorld parcels which are unbuilt on.
Sources: City of Scottsdale; Maricopa County Assessor; Gruen Gruen + Associates.
Residential uses comprise about 868 acres or 17.6 percent of the total 4,941 acres of land included within the study area. School and other institutional uses comprise 842 acres of 17 percent of the total land inventory, while recreation (golf courses and developed open space - parks) comprise 806 acres of 16.3 percent of the total land inventory. Commercial uses (at 361 acres of 7.3 percent), office (at 209 acres or 4.2 percent), industrial (at 31 acres or 2.3 percent), and hotel/resort (at 31 acres or 0.6) comprise a total of only 13.86 percent of the land inventory within the study area. Institutional and exempt properties, including WestWorld, total about 842 acres or 17 percent of the study area. Vacant land at 1,427 acres or nearly 29 percent of the total inventory constitutes the largest land use.
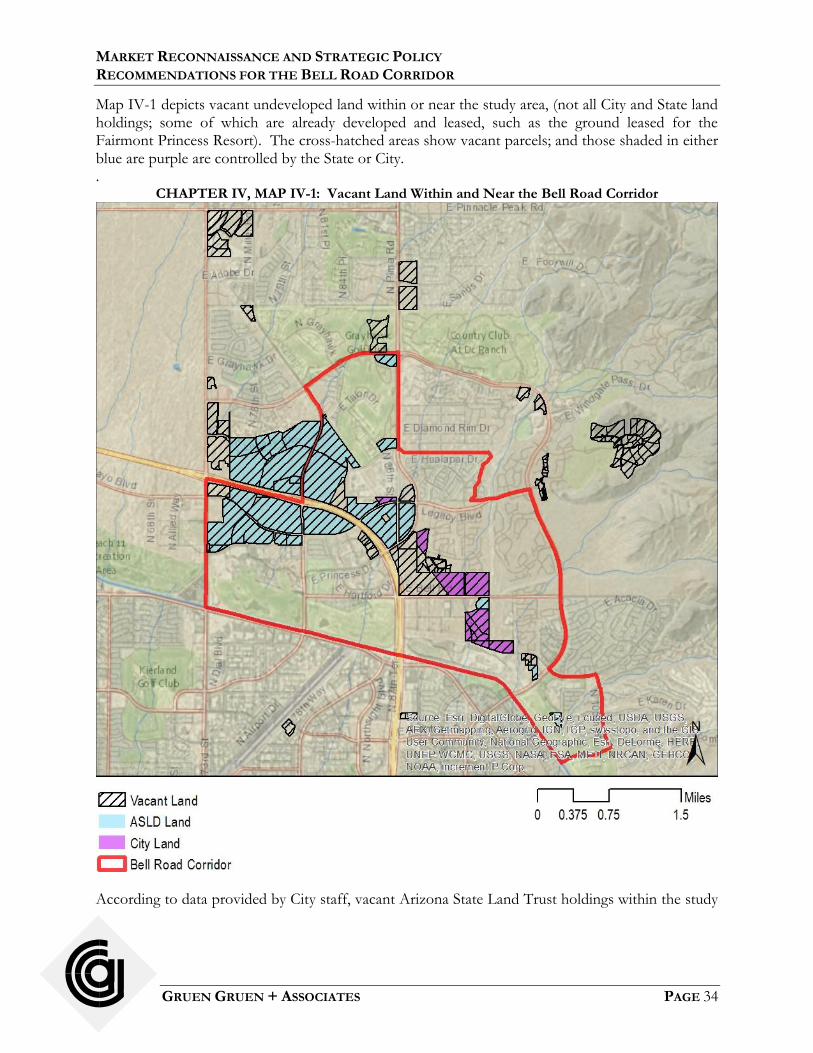
MARKET RECONNAISSANCE AND STRATEGIC POLICY RECOMMENDATIONS FOR THE BELL ROAD CORRIDOR
GRUEN GRUEN + ASSOCIATES PAGE 34
Map IV-1 depicts vacant undeveloped land within or near the study area, (not all City and State land holdings; some of which are already developed and leased, such as the ground leased for the Fairmont Princess Resort). The cross-hatched areas show vacant parcels; and those shaded in either blue are purple are controlled by the State or City. .
CHAPTER IV, MAP IV-1: Vacant Land Within and Near the Bell Road Corridor
According to data provided by City staff, vacant Arizona State Land Trust holdings within the study
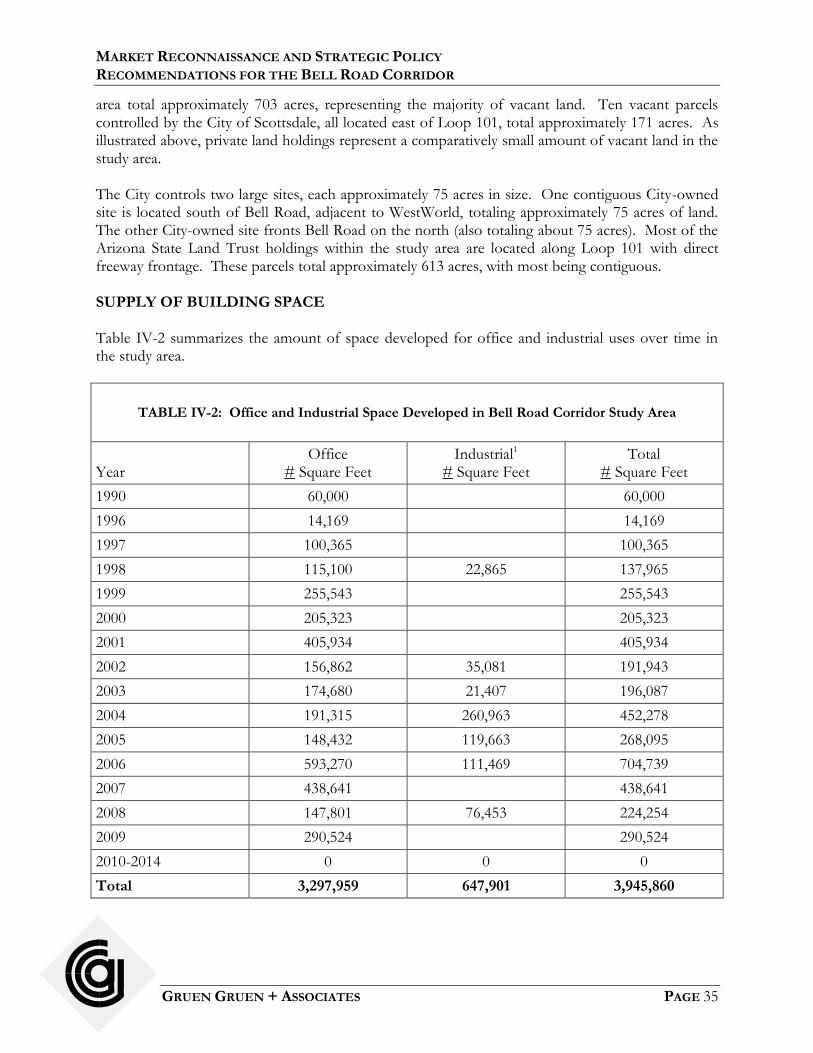
MARKET RECONNAISSANCE AND STRATEGIC POLICY RECOMMENDATIONS FOR THE BELL ROAD CORRIDOR
GRUEN GRUEN + ASSOCIATES PAGE 35
area total approximately 703 acres, representing the majority of vacant land. Ten vacant parcels controlled by the City of Scottsdale, all located east of Loop 101, total approximately 171 acres. As illustrated above, private land holdings represent a comparatively small amount of vacant land in the study area. The City controls two large sites, each approximately 75 acres in size. One contiguous City-owned site is located south of Bell Road, adjacent to WestWorld, totaling approximately 75 acres of land. The other City-owned site fronts Bell Road on the north (also totaling about 75 acres). Most of the Arizona State Land Trust holdings within the study area are located along Loop 101 with direct freeway frontage. These parcels total approximately 613 acres, with most being contiguous. SUPPLY OF BUILDING SPACE Table IV-2 summarizes the amount of space developed for office and industrial uses over time in the study area.
TABLE IV-2: Office and Industrial Space Developed in Bell Road Corridor Study Area
Year
Office # Square Feet
Industrial1 # Square Feet
Total # Square Feet
1990 60,000 60,000
1996 14,169 14,169
1997 100,365 100,365
1998 115,100 22,865 137,965
1999 255,543 255,543
2000 205,323 205,323
2001 405,934 405,934
2002 156,862 35,081 191,943
2003 174,680 21,407 196,087
2004 191,315 260,963 452,278
2005 148,432 119,663 268,095
2006 593,270 111,469 704,739
2007 438,641 438,641
2008 147,801 76,453 224,254
2009 290,524 290,524
2010-2014 0 0 0
Total 3,297,959 647,901 3,945,860

MARKET RECONNAISSANCE AND STRATEGIC POLICY RECOMMENDATIONS FOR THE BELL ROAD CORRIDOR
GRUEN GRUEN + ASSOCIATES PAGE 36
Annual Average2 231,282 53,992 285,274 1 Only includes industrial space located east of Loop 101 in study area. Another 498,000 square feet of industrial flex type space is located west of Loop 101 but was not included in CoStar inventory data. 2 For office space, annual average is calculated from 1996 – 2009 period.
Sources: CoStar; City of Scottsdale; Gruen Gruen + Associates.
From 1990 through 2009, approximately 3.3 million square feet of office space was built in the study area. This equates to an average annual amount of 231,000 square feet of office space. Two years (2006 and 2007), however, during the economic boom before the 2008 Great Recession account for over 1.0 million square feet or 31 percent of the total office space added to the study area over 19 years. No office space has been added to the study area inventory since 2009. Only approximately 648,000 square feet of industrial space was added over the 1990-2009 period. This equates to an average of about 54,000 square feet per year. Only in 2004 was more than 120,000 square feet of industrial space added and in 13 years no industrial space was added to the study area inventory. Table IV-3 summarizes the amount of retail space, number of hotel rooms, and number of multi-family units developed over time in the study area.

MARKET RECONNAISSANCE AND STRATEGIC POLICY RECOMMENDATIONS FOR THE BELL ROAD CORRIDOR
GRUEN GRUEN + ASSOCIATES PAGE 37
TABLE IV-3: Supply of Retail Space, Hotel Rooms, and Multi-family Units Developed in Bell Road
Corridor Study Area
Year
Retail # Square Feet
Hotel # Rooms
Multi-family # Units
1987-1990 589
1996 60
1997 224
1998 230
2,021 1999
399,3801
494
2000
2001
2002 120
2003
2004
2005 122 202
2006 140,000
2007 15,000 72
2008 68,100
2009
2010
2011
2012
2013
2014
2015 220
Total 622,480 1,911 2,443
MARKET RECONNAISSANCE AND STRATEGIC POLICY RECOMMENDATIONS FOR THE BELL ROAD CORRIDOR
GRUEN GRUEN + ASSOCIATES PAGE 38
1 Includes Market at DC Ranch, McDowell Mountain Village, and McDowell Mountain Marketplace. Blank years indicate no construction activity occurred.
Source: Gruen Gruen + Associates
From 1987 to 2015, only 622,500 square feet of retail space has been added to the study area. No retail space has been added to the area since the Great Recession. About 400,000 square feet or 64 percent of the total retail space inventory was added from 1999 to 2003. As described more fully in Chapter IX, the projects built in this period include the 241,280-square-foot Market at DC Ranch, 84,000-square-foot McDowell Mountain Marketplace, and 74,000-square-foot McDowell Mountain Village. Between 1987 and 2005, approximately 1,900 hotel rooms in seven hotels were added in the study area. The largest number of rooms (649) is located in the Scottsdale Fairmont Princess Resort. The most recent hotel, the 122-room Hilton Garden Inn was built 10 years ago in 2005 (and another hotel was expanded after this time in 2007). Multi-family development is the newest built space to have been added in the study area. Approximately 2,400 units have been built in the study area with the majority of units added in the 1998 to 2001 period in four apartment projects. One 202-unit apartment project was built in 2005 and in the past year, one new apartment project with 220 units has been developed.
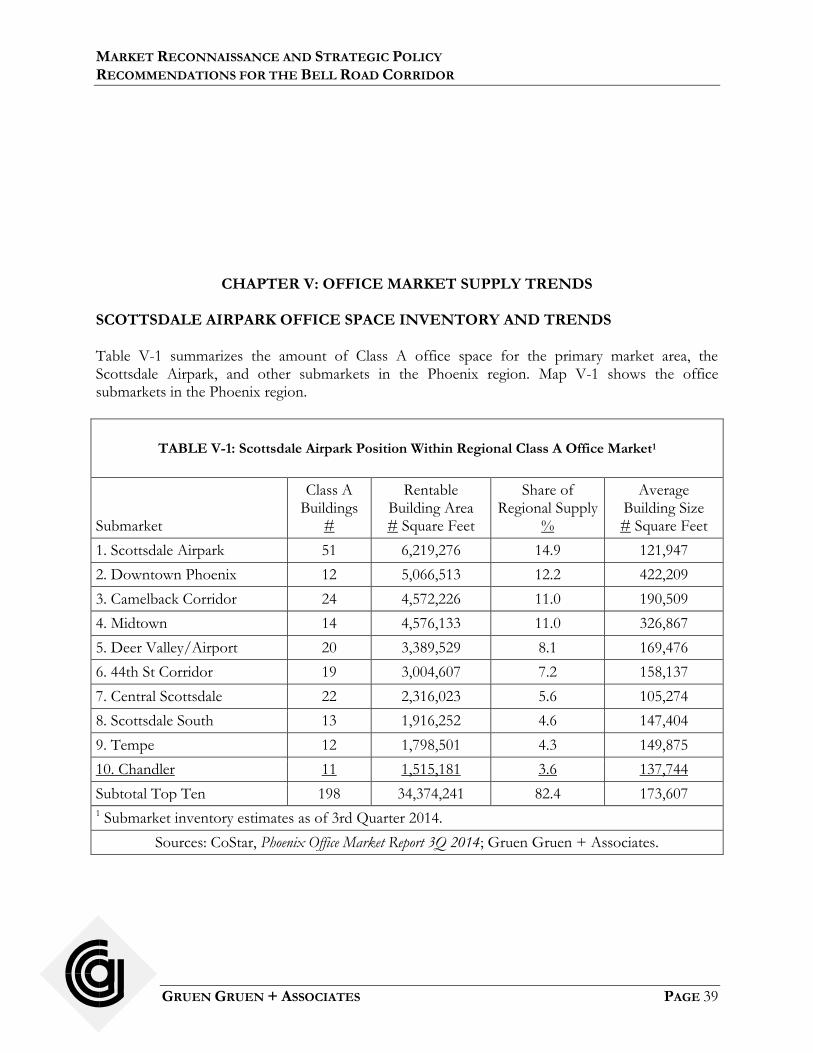
MARKET RECONNAISSANCE AND STRATEGIC POLICY RECOMMENDATIONS FOR THE BELL ROAD CORRIDOR
GRUEN GRUEN + ASSOCIATES PAGE 39
CHAPTER V: OFFICE MARKET SUPPLY TRENDS SCOTTSDALE AIRPARK OFFICE SPACE INVENTORY AND TRENDS Table V-1 summarizes the amount of Class A office space for the primary market area, the Scottsdale Airpark, and other submarkets in the Phoenix region. Map V-1 shows the office submarkets in the Phoenix region.
TABLE V-1: Scottsdale Airpark Position Within Regional Class A Office Market1
Submarket
Class A Buildings
#
Rentable Building Area # Square Feet
Share of Regional Supply
%
Average Building Size # Square Feet
1. Scottsdale Airpark 51 6,219,276 14.9 121,947
2. Downtown Phoenix 12 5,066,513 12.2 422,209
3. Camelback Corridor 24 4,572,226 11.0 190,509
4. Midtown 14 4,576,133 11.0 326,867
5. Deer Valley/Airport 20 3,389,529 8.1 169,476
6. 44th St Corridor 19 3,004,607 7.2 158,137
7. Central Scottsdale 22 2,316,023 5.6 105,274
8. Scottsdale South 13 1,916,252 4.6 147,404
9. Tempe 12 1,798,501 4.3 149,875
10. Chandler 11 1,515,181 3.6 137,744
Subtotal Top Ten 198 34,374,241 82.4 173,607 1 Submarket inventory estimates as of 3rd Quarter 2014.
Sources: CoStar, Phoenix Office Market Report 3Q 2014; Gruen Gruen + Associates.

MARKET RECONNAISSANCE AND STRATEGIC POLICY RECOMMENDATIONS FOR THE BELL ROAD CORRIDOR
GRUEN GRUEN + ASSOCIATES PAGE 40
CHAPVER V, MAP V-1: Phoenix Region Office Submarkets
The Greater Airpark submarket (which includes the Bell Road Corridor study area) is still the largest concentration of Class A office space within the region comprising about 6.2 million square feet of space or 15 percent of total supply in the Phoenix office market. It includes 51 Class A buildings; no other submarket compares. It has below-average Class A building size of about 122,000 square

MARKET RECONNAISSANCE AND STRATEGIC POLICY RECOMMENDATIONS FOR THE BELL ROAD CORRIDOR
GRUEN GRUEN + ASSOCIATES PAGE 41
feet. Only Central Scottsdale on average contains smaller Class A buildings. Table V-2 shows the Class A office space vacancy and rents by submarket in the Phoenix region.

MARKET RECONNAISSANCE AND STRATEGIC POLICY RECOMMENDATIONS FOR THE BELL ROAD CORRIDOR
GRUEN GRUEN + ASSOCIATES PAGE 42
TABLE V-2: Vacancy and Rents Within Regional Class A Office Market
Submarket
Class A Vacancy Rate %
Average Quoted Rents $ Per Square Foot
1. Scottsdale Airpark 19.0 $25.52
2. Downtown Phoenix 15.1 $26.58
3. Camelback Corridor 23.9 $27.67
4. Midtown 31.1 $21.39
5. Deer Valley/Airport 7.2 $21.81
6. 44th St Corridor 11.3 $23.93
7. Central Scottsdale 11.2 $24.14
8. Scottsdale South 13.2 $25.34
9. Tempe 7.3 $30.28
10. Chandler 12.6 $26.62
Sources: CoStar, Phoenix Office Market Report 3Q 2014; Gruen Gruen + Associates.
The Airpark submarket contains one of the highest Class A office space vacancy rates in the region at 19 percent, exceeded only by higher vacancy rates in the Camelback Corridor and Midtown submarkets. Class A office space full-service rents in the Airpark are toward the top end of submarket rents at over $25 per square foot. The Downtown Phoenix, Scottsdale South, and Tempe office submarkets both have tighter conditions with lower vacancy rates and higher rents than that of the Airpark submarket. The Scottsdale South submarket which includes Old Town Scottsdale has performed well over the past several years as high-tech tenants such as Yelp, Zenefits, ZocDoc, and Weebly have all located attracted by the area’s urban walkable environment near dining, shopping, and entertainment options. Most recently, OutboundEngine, a content, email, and social media marketing firm has decided to locate in Old Town.3 Tempe has also fared well due to its central location within the region and excellent freeway and airport accessibility. Marina Heights, a 20-acre mixed-use development includes five office buildings totaling approximately 2 million square feet of space will be leased by State Farm. Retail amenities and a 10-acre plaza will be added which will have seating, Wi-fi, and event venue space. The Tempe Town Lake around which the buildings will be located offers walking trails. The project will also include fitness and training rooms. Within the Scottsdale Airpark submarket, the supply of total office space in all classes of space has grown significantly over the past 16 years, increasing four fold from nearly 4.0 million square feet of space in 1999 to nearly 13 million square feet of space by 2015. Table V-3 shows historical inventory, vacancy, and rent trends.
3 http://cem-az.com/jll-signs-latest-tech-tenant-to-old-town-scottsdale-outboundengine/.
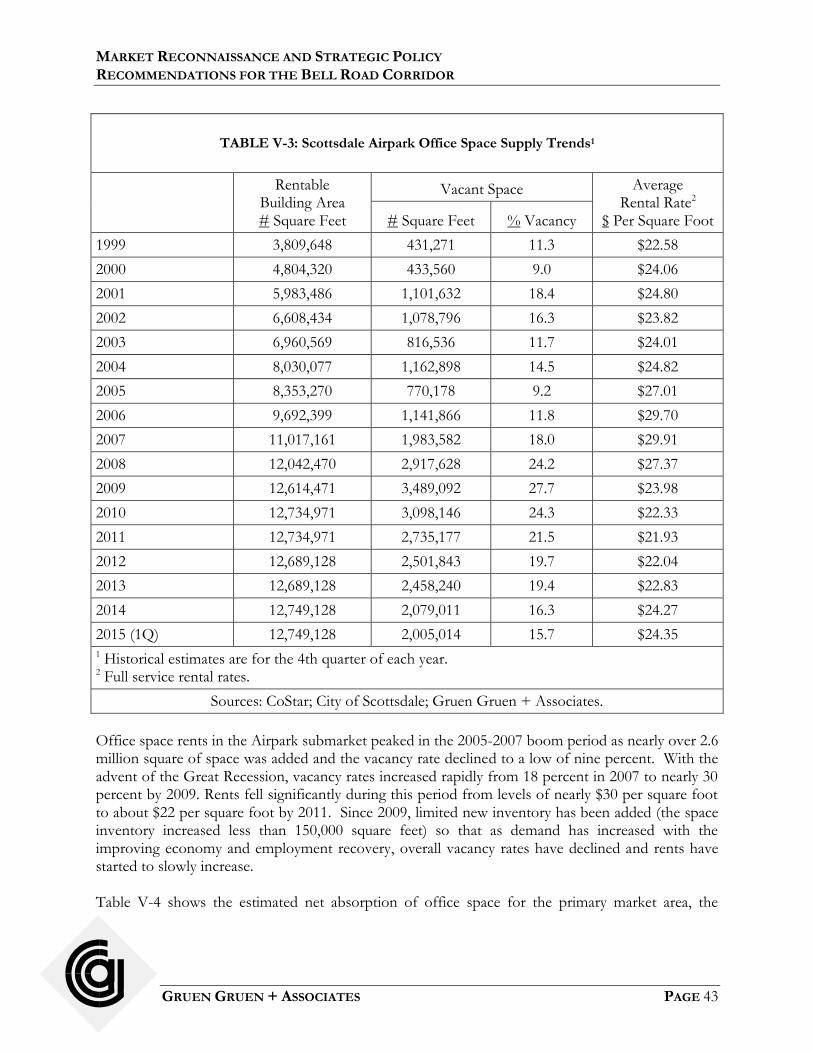
MARKET RECONNAISSANCE AND STRATEGIC POLICY RECOMMENDATIONS FOR THE BELL ROAD CORRIDOR
GRUEN GRUEN + ASSOCIATES PAGE 43
TABLE V-3: Scottsdale Airpark Office Space Supply Trends1
Rentable Building Area # Square Feet
Vacant Space Average Rental Rate2
$ Per Square Foot # Square Feet % Vacancy
1999 3,809,648 431,271 11.3 $22.58
2000 4,804,320 433,560 9.0 $24.06
2001 5,983,486 1,101,632 18.4 $24.80
2002 6,608,434 1,078,796 16.3 $23.82
2003 6,960,569 816,536 11.7 $24.01
2004 8,030,077 1,162,898 14.5 $24.82
2005 8,353,270 770,178 9.2 $27.01
2006 9,692,399 1,141,866 11.8 $29.70
2007 11,017,161 1,983,582 18.0 $29.91
2008 12,042,470 2,917,628 24.2 $27.37
2009 12,614,471 3,489,092 27.7 $23.98
2010 12,734,971 3,098,146 24.3 $22.33
2011 12,734,971 2,735,177 21.5 $21.93
2012 12,689,128 2,501,843 19.7 $22.04
2013 12,689,128 2,458,240 19.4 $22.83
2014 12,749,128 2,079,011 16.3 $24.27
2015 (1Q) 12,749,128 2,005,014 15.7 $24.35 1 Historical estimates are for the 4th quarter of each year. 2 Full service rental rates.
Sources: CoStar; City of Scottsdale; Gruen Gruen + Associates.
Office space rents in the Airpark submarket peaked in the 2005-2007 boom period as nearly over 2.6 million square of space was added and the vacancy rate declined to a low of nine percent. With the advent of the Great Recession, vacancy rates increased rapidly from 18 percent in 2007 to nearly 30 percent by 2009. Rents fell significantly during this period from levels of nearly $30 per square foot to about $22 per square foot by 2011. Since 2009, limited new inventory has been added (the space inventory increased less than 150,000 square feet) so that as demand has increased with the improving economy and employment recovery, overall vacancy rates have declined and rents have started to slowly increase. Table V-4 shows the estimated net absorption of office space for the primary market area, the

MARKET RECONNAISSANCE AND STRATEGIC POLICY RECOMMENDATIONS FOR THE BELL ROAD CORRIDOR
GRUEN GRUEN + ASSOCIATES PAGE 44
Scottsdale Airpark, from 2000 through 2014.
TABLE V-4: Scottsdale Airpark Absorption and Construction Trends, 2000-20141
Period
Net Absorption # Square Feet
New Construction Deliveries # Square Feet
2000 – 2001 1,503,000 2,173,800
2002 – 2003 1,262,200 1,003,500
2004 – 2005 1,439,100 1,408,300
2006 – 2007 1,450,500 2,663,900
2008 – 2009 95,500 1,597,300
2010 - 20142 1,544,700 181,000
Total 7,295,000 9,027,800
Average Annual 2000 - 2007 706,900 906,200
Average Annual 2008 - 2009 47,800 798,700
Average Annual 2010 - 2014 308,900 90,500 1 Figures are rounded. Net absorption refers to the change in occupied office space. 2 Through 4th quarter 2014.
Sources: CoStar; Gruen Gruen + Associates.
Annual office space absorption in the Scottsdale Airpark submarket has averaged roughly one-half million square feet over the past 15 years. Between 2000 and 2007, absorption of space was robust and average annual absorption averaged slightly over 700,000 square feet. Very little space was absorbed in 2008 and 2009. Since 2010, annual space absorption has averaged approximately 309,000 square feet, less than half of the annual absorption in the boom period. Approximately 70 percent of the Airpark’s 12.7 million square foot office inventory has been delivered since 2000. New construction deliveries have slightly outpaced absorption, averaging about 900,000 square feet per year during the 2000 – 2007 period when the majority of new construction took place. When little space was absorbed between 2008 and 2009 during the height of the recession and new space was continuing to be delivered, vacancies rose to as high as nearly 30 percent. With little new supply being added since 2010, overall vacancy has declined in the Airpark to pre-2008 levels. Approximately 730,000 square feet of existing space would need to be absorbed to bring the overall vacancy down to 10 percent in the Airpark, which is roughly the historical "low" in the most robust years (1999-2000, 2005-2006, etc.). If little new office supply is added and absorption continues on a positive pace, it is likely a 10 percent vacancy could be achieved in the Airpark submarket within the next couple of years. Within the Airpark submarket for Class A office space, the Scottsdale Quarter office buildings
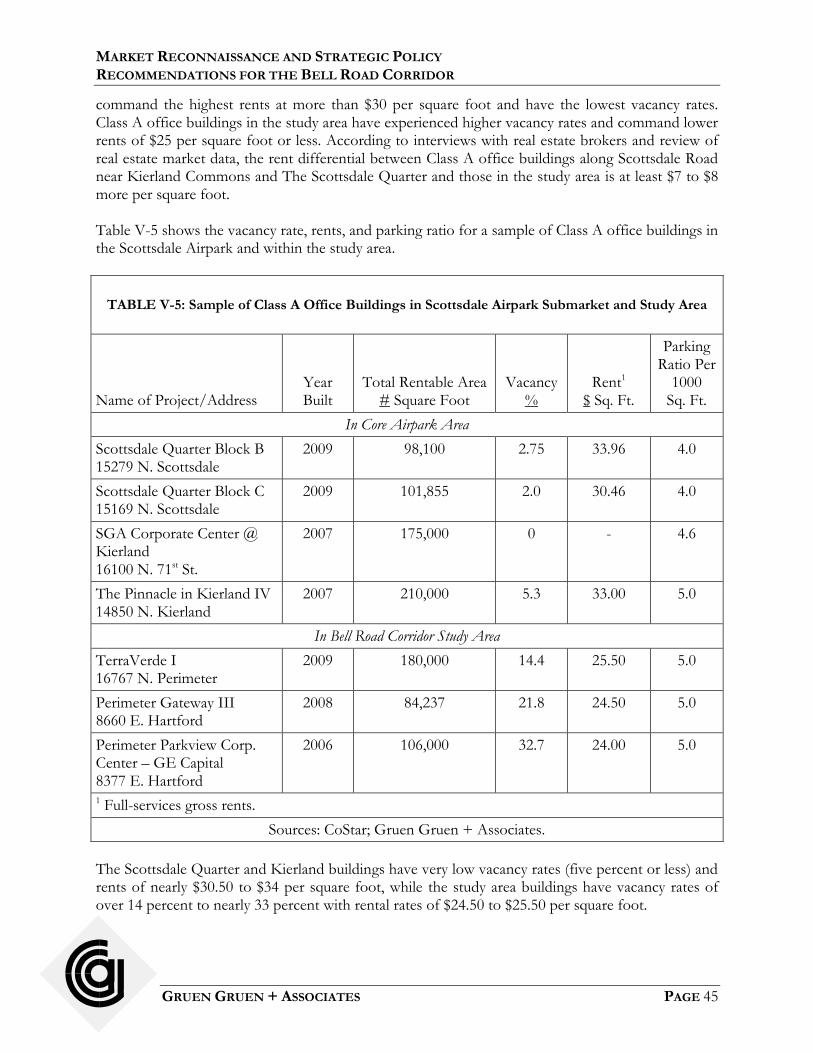
MARKET RECONNAISSANCE AND STRATEGIC POLICY RECOMMENDATIONS FOR THE BELL ROAD CORRIDOR
GRUEN GRUEN + ASSOCIATES PAGE 45
command the highest rents at more than $30 per square foot and have the lowest vacancy rates. Class A office buildings in the study area have experienced higher vacancy rates and command lower rents of $25 per square foot or less. According to interviews with real estate brokers and review of real estate market data, the rent differential between Class A office buildings along Scottsdale Road near Kierland Commons and The Scottsdale Quarter and those in the study area is at least $7 to $8 more per square foot. Table V-5 shows the vacancy rate, rents, and parking ratio for a sample of Class A office buildings in the Scottsdale Airpark and within the study area.
TABLE V-5: Sample of Class A Office Buildings in Scottsdale Airpark Submarket and Study Area
Name of Project/Address
Year Built
Total Rentable Area # Square Foot
Vacancy %
Rent1 $ Sq. Ft.
Parking Ratio Per
1000 Sq. Ft.
In Core Airpark Area
Scottsdale Quarter Block B 15279 N. Scottsdale
2009 98,100 2.75 33.96 4.0
Scottsdale Quarter Block C 15169 N. Scottsdale
2009 101,855 2.0 30.46 4.0
SGA Corporate Center @ Kierland 16100 N. 71st St.
2007 175,000 0 - 4.6
The Pinnacle in Kierland IV 14850 N. Kierland
2007 210,000 5.3 33.00 5.0
In Bell Road Corridor Study Area
TerraVerde I 16767 N. Perimeter
2009 180,000 14.4 25.50 5.0
Perimeter Gateway III 8660 E. Hartford
2008 84,237 21.8 24.50 5.0
Perimeter Parkview Corp. Center – GE Capital 8377 E. Hartford
2006 106,000 32.7 24.00 5.0
1 Full-services gross rents.
Sources: CoStar; Gruen Gruen + Associates.
The Scottsdale Quarter and Kierland buildings have very low vacancy rates (five percent or less) and rents of nearly $30.50 to $34 per square foot, while the study area buildings have vacancy rates of over 14 percent to nearly 33 percent with rental rates of $24.50 to $25.50 per square foot.
MARKET RECONNAISSANCE AND STRATEGIC POLICY RECOMMENDATIONS FOR THE BELL ROAD CORRIDOR
GRUEN GRUEN + ASSOCIATES PAGE 46
BELL ROAD CORRIDOR STUDY AREA OFFICE SPACE TRENDS Table V-6 shows the amount and type of space, current vacancy, and current rent for office space in the study area.
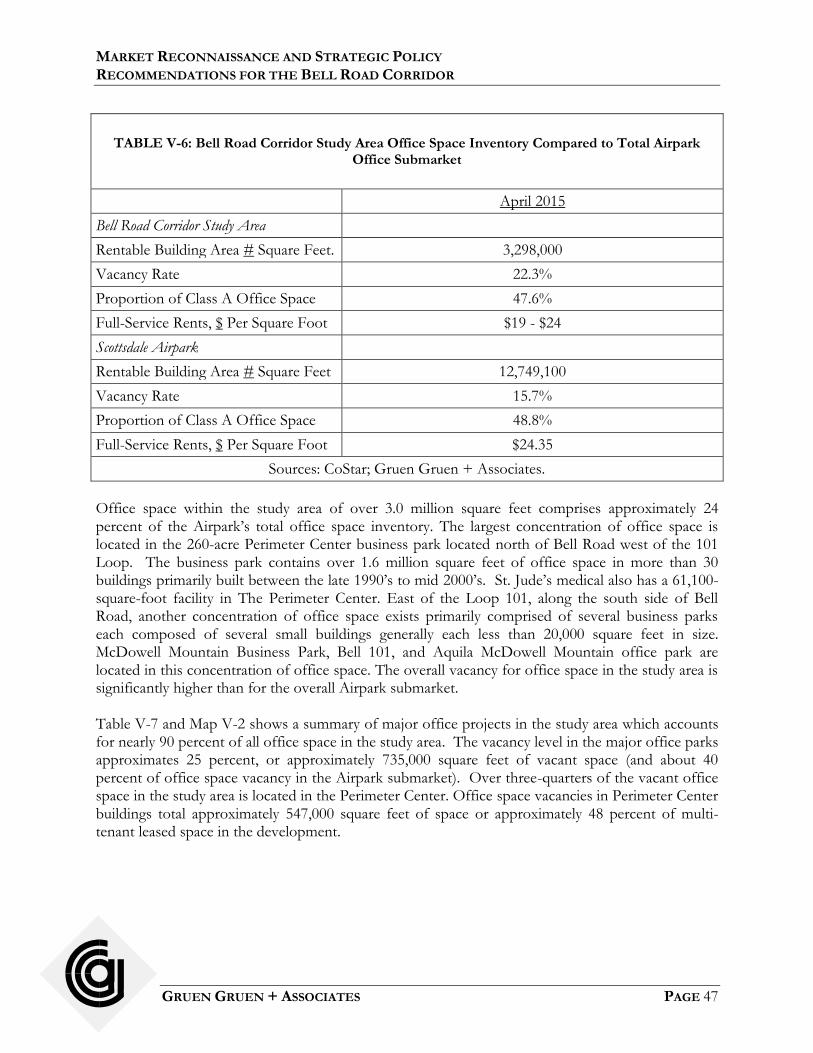
MARKET RECONNAISSANCE AND STRATEGIC POLICY RECOMMENDATIONS FOR THE BELL ROAD CORRIDOR
GRUEN GRUEN + ASSOCIATES PAGE 47
TABLE V-6: Bell Road Corridor Study Area Office Space Inventory Compared to Total Airpark
Office Submarket
April 2015
Bell Road Corridor Study Area
Rentable Building Area # Square Feet. 3,298,000
Vacancy Rate 22.3%
Proportion of Class A Office Space 47.6%
Full-Service Rents, $ Per Square Foot $19 - $24
Scottsdale Airpark
Rentable Building Area # Square Feet 12,749,100
Vacancy Rate 15.7%
Proportion of Class A Office Space 48.8%
Full-Service Rents, $ Per Square Foot $24.35
Sources: CoStar; Gruen Gruen + Associates.
Office space within the study area of over 3.0 million square feet comprises approximately 24 percent of the Airpark’s total office space inventory. The largest concentration of office space is located in the 260-acre Perimeter Center business park located north of Bell Road west of the 101 Loop. The business park contains over 1.6 million square feet of office space in more than 30 buildings primarily built between the late 1990’s to mid 2000’s. St. Jude’s medical also has a 61,100-square-foot facility in The Perimeter Center. East of the Loop 101, along the south side of Bell Road, another concentration of office space exists primarily comprised of several business parks each composed of several small buildings generally each less than 20,000 square feet in size. McDowell Mountain Business Park, Bell 101, and Aquila McDowell Mountain office park are located in this concentration of office space. The overall vacancy for office space in the study area is significantly higher than for the overall Airpark submarket. Table V-7 and Map V-2 shows a summary of major office projects in the study area which accounts for nearly 90 percent of all office space in the study area. The vacancy level in the major office parks approximates 25 percent, or approximately 735,000 square feet of vacant space (and about 40 percent of office space vacancy in the Airpark submarket). Over three-quarters of the vacant office space in the study area is located in the Perimeter Center. Office space vacancies in Perimeter Center buildings total approximately 547,000 square feet of space or approximately 48 percent of multi-tenant leased space in the development.
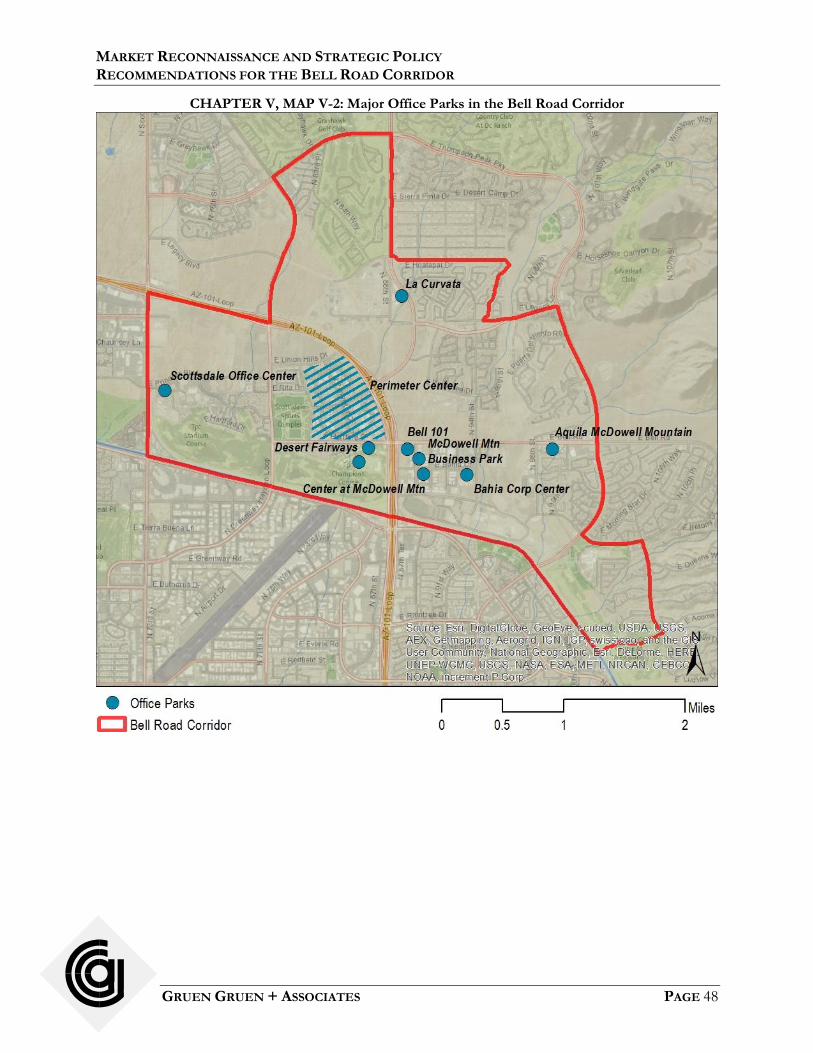
MARKET RECONNAISSANCE AND STRATEGIC POLICY RECOMMENDATIONS FOR THE BELL ROAD CORRIDOR
GRUEN GRUEN + ASSOCIATES PAGE 48
CHAPTER V, MAP V-2: Major Office Parks in the Bell Road Corridor

MARKET RECONNAISSANCE AND STRATEGIC POLICY RECOMMENDATIONS FOR THE BELL ROAD CORRIDOR
GRUEN GRUEN + ASSOCIATES PAGE 49
TABLE V-7: Office Space in Major Office Parks in Bell Road Corridor Study Area
Name of Park/Address
Year(s) Built
# Buildings
Total Rentable Area
# Square Feet
Vacancy Rate %
McDowell Mountain Business Park
2003-2008 5 295,638 1.4
Center at McDowell Mountain 2004 4 38,159 17.8
Bahia Corporate Center 2007 4 76,060 29.3
Desert Fairways 2002-2004 10 137,578 12.4
Bell 101 2006 8 85,717 19.4
Aquila McDowell Mountain 2004-2006 19 123,023 10.8
Terra Verde Corporate Campus 2009 1 180,000 14.4
North Scottsdale Gateway 2001 1 80,979 2.3
La Curvata 2009 2 100,324 53.0
Scottsdale Office Center 2007 3 101,969 6.3
Other Study Area Office 1999-2005 4 110,069 19.6
Perimeter Center
Perimeter Parkview Corporate Center
2006 -2008 3 155,916 34.7
Sonoran Corporate Center 2002 6 74,702 37.3
Perimeter Gateway I – V 1990 – 2008
5 520,837 58.9
Princess & Perimeter I & II 1999 & 2007
2 213,750 14.1
Turnstone Office Park 1998 4 65,100 19.4
The Perimeter Center One & Two Princess Dr.
2001 2 94,955 18.1
Princess Medical Center 2003 – 2004
2 71,200 15.4
Other Perimeter Center Bldgs. NA 12 402,148 26.0
Subtotal Perimeter Center1 36 1,598,608 34.2
Total2 2,928,124 25.1
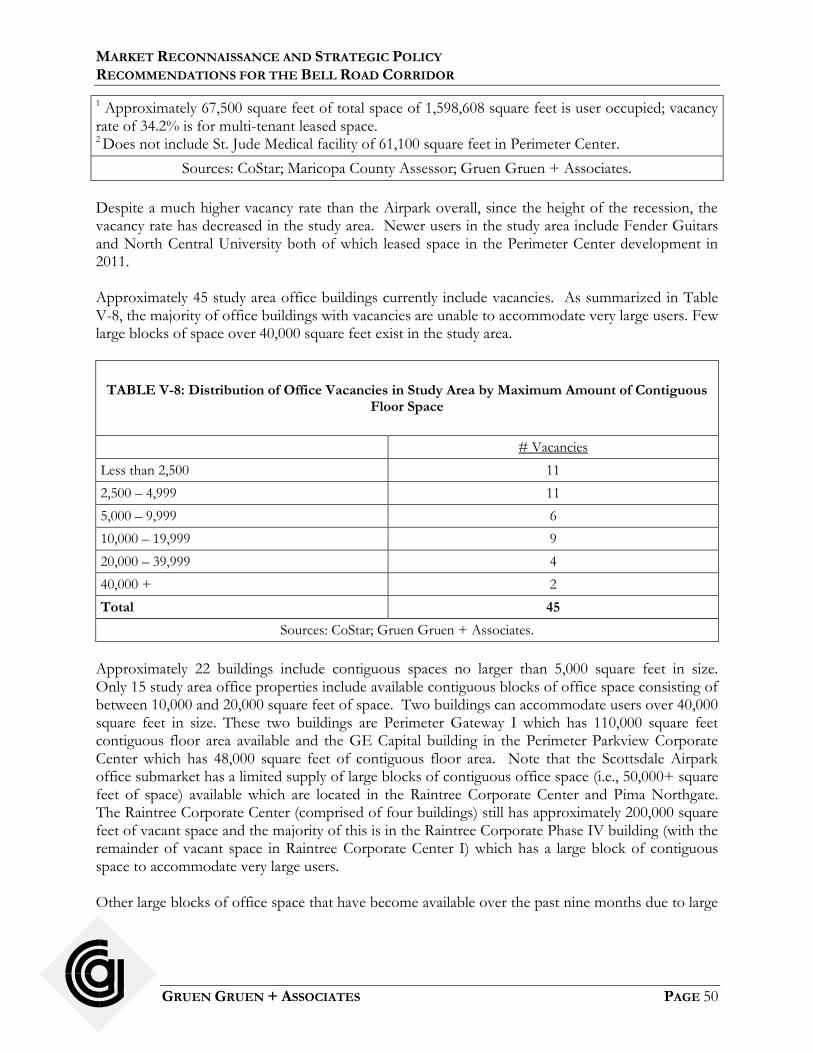
MARKET RECONNAISSANCE AND STRATEGIC POLICY RECOMMENDATIONS FOR THE BELL ROAD CORRIDOR
GRUEN GRUEN + ASSOCIATES PAGE 50
1 Approximately 67,500 square feet of total space of 1,598,608 square feet is user occupied; vacancy rate of 34.2% is for multi-tenant leased space. 2 Does not include St. Jude Medical facility of 61,100 square feet in Perimeter Center.
Sources: CoStar; Maricopa County Assessor; Gruen Gruen + Associates.
Despite a much higher vacancy rate than the Airpark overall, since the height of the recession, the vacancy rate has decreased in the study area. Newer users in the study area include Fender Guitars and North Central University both of which leased space in the Perimeter Center development in 2011. Approximately 45 study area office buildings currently include vacancies. As summarized in Table V-8, the majority of office buildings with vacancies are unable to accommodate very large users. Few large blocks of space over 40,000 square feet exist in the study area.
TABLE V-8: Distribution of Office Vacancies in Study Area by Maximum Amount of Contiguous
Floor Space
# Vacancies
Less than 2,500 11
2,500 – 4,999 11
5,000 – 9,999 6
10,000 – 19,999 9
20,000 – 39,999 4
40,000 + 2
Total 45
Sources: CoStar; Gruen Gruen + Associates.
Approximately 22 buildings include contiguous spaces no larger than 5,000 square feet in size. Only 15 study area office properties include available contiguous blocks of office space consisting of between 10,000 and 20,000 square feet of space. Two buildings can accommodate users over 40,000 square feet in size. These two buildings are Perimeter Gateway I which has 110,000 square feet contiguous floor area available and the GE Capital building in the Perimeter Parkview Corporate Center which has 48,000 square feet of contiguous floor area. Note that the Scottsdale Airpark office submarket has a limited supply of large blocks of contiguous office space (i.e., 50,000+ square feet of space) available which are located in the Raintree Corporate Center and Pima Northgate. The Raintree Corporate Center (comprised of four buildings) still has approximately 200,000 square feet of vacant space and the majority of this is in the Raintree Corporate Phase IV building (with the remainder of vacant space in Raintree Corporate Center I) which has a large block of contiguous space to accommodate very large users. Other large blocks of office space that have become available over the past nine months due to large

MARKET RECONNAISSANCE AND STRATEGIC POLICY RECOMMENDATIONS FOR THE BELL ROAD CORRIDOR
GRUEN GRUEN + ASSOCIATES PAGE 51
firms downsizing or consolidating space needs include:
Pima Northgate at 14000 North Pima with 66,500 square feet of available space and contiguous space of 46,000 square feet;
Kierland One with the whole building of 175,441 square feet of space available and contiguous floor area of 45,919 square feet;
JDA headquarters at Northsight Corporate Center at which the company is downsizing to 70,000 square feet; and
Riverwalk on the Salt River Pima Maricopa Indian Community at which Medici’s 150,000-square-foot building is available for sublease due to consolidation from a merger.
In addition, north of the study area small pockets of office space have been developed in the DC Ranch and Grayhawk master planned communities that attract smaller size office users for leased and owned space. These developments including Canyon Village, Grayhawk Office Villas, Offices at Grayhawk and Market at DC Ranch comprise a total of approximately 324,000 square feet of office space. FUTURE SUPPLY OF OFFICE SPACE AND AVAILABLE LAND Based on our interviews, information obtained from municipal staff, and review of secondary listing data, as Table V-9 shows, the study area contains more than 700 acres of vacant land (other than City-owned land) potentially able to accommodate future office development.
TABLE V-9: Potential Office Space and Land Supply in Study Area
Vacant Land
#Acres
Potential Future Buildable Space # Square Feet Status
Crossroads East1 SEC Loop 101 and Scottsdale Rd.
760 13,639,000 Future
TerraVerde II-IV 16763-16781 N. Perimeter Dr.
420,000 Planned
17300 Perimeter 17,000 Planned
Perimeter Parkview II – 8399 E. Hartford 100,000 Planned
Bahia 101 40,000 Planned
1 Crossroads East 760 acres can accommodate office, industrial, and commercial uses. Buildable space is based on a concept plan which utilizes floor-area ratios that vary from 0.3 to 0.8 depending on zoning district within the PCD (Planned Community District).
Sources: Gruen Gruen + Associates; Arizona State Land Dept.; City of Scottsdale; CoStar.
Arizona State Trust Land of 760 acres located at the southeast quadrant of Loop 101 and Scottsdale Road will need to be improved with infrastructure but is ideally located within the study area from a

MARKET RECONNAISSANCE AND STRATEGIC POLICY RECOMMENDATIONS FOR THE BELL ROAD CORRIDOR
GRUEN GRUEN + ASSOCIATES PAGE 52
transportation access and highway visibility standpoint for office space uses. The land is estimated to be able to accommodate over 13.0 million square feet of office, industrial, and commercial space-more space than currently contained in the Airpark submarket as a whole. Desert Troon, the developer of Perimeter Center, has another three future office buildings planned in TerraVerde that will total 420,000 square feet of space. Other identified potential additions to the office space inventory within the study area total approximately 157,000 square feet of building space.
MARKET RECONNAISSANCE AND STRATEGIC POLICY RECOMMENDATIONS FOR THE BELL ROAD CORRIDOR
GRUEN GRUEN + ASSOCIATES PAGE 53
CHAPTER VI: THE DEMAND FOR OFFICE SPACE IN THE STUDY AREA INTRODUCTION The type and mix of businesses that can benefit from the comparative advantages the study area location provides can be inferred from the identification of the businesses that have moved from and are moving to sites within the same market area within which future office space users can be expected to be attracted. This chapter identifies the primary geographic areas from which office space users will tend to be attracted and identifies the primary competing locations which many office space users will consider in selecting office space locations. This chapter also identifies the primary advantages and disadvantages associated with the study area as an office location. THE RELEVANT PRIMARY GEOGRAPHIC MARKETS The Primary Geographic Area within Which Bell Road Corridor Study Area Competes for Office Space Users The interviews with knowledgeable real estate brokers and review of supply and tenanting trends suggest that the primary market area within which office space in the study area typically competes for office users includes the larger Airpark area, and projects and land on the Salt River Pima Maricopa Indian Community and further south along the Loop 101 corridor. Office space in the study area especially competes with buildings further south in the Airpark around Raintree Drive and Loop 101. In 2009, Pulte Homes moved out of Raintree Corporate Center and leased 96,000 square feet in the first phase of the TerraVerde corporate campus in the study area. In 2013, Meritage Homes which had been located in Perimeter Center relocated due to expansion needs to the Raintree Corporate Center. Meritage which had been occupying 40,000 square feet on two floors in the Perimeter Center expanded to nearly 58,000 square feet on one floor in the Raintree project. Other competitive projects and areas include Tempe which has attracted Northern Trust which had considered The Perimeter Center but is planning a 450,000-square-foot development in Tempe’s Discovery Business Campus at Elliott Road and Loop 101. Zenefits, another larger office space user, had considered leasing space in The Perimeter Center but decided to locate its 100,000-square-foot office in Old Town Scottsdale. Another potential tenant to The Perimeter Center was Standard Aero in Tempe which had considered The Perimeter Center but decided to relocate its corporate headquarters to the Scottsdale Spectrum office complex on Scottsdale Road. The study area has attracted few corporate headquarters users including in 2012 Fender Musical Instruments Corporation which expanded and moved its headquarters from 82,000 square feet in several buildings at the Chaparral Business Center on Indian Community land to nearly 110,000 square feet in the Perimeter Center. Taser has corporate offices in the study area but also uses the facility as a production and testing facility. Quicken Loans occupies offices in the study area for its web center to process loans. Geographic Origins of Potential Office Space Users Most office space users will originate from within the Airpark area and within Scottsdale. For
MARKET RECONNAISSANCE AND STRATEGIC POLICY RECOMMENDATIONS FOR THE BELL ROAD CORRIDOR
GRUEN GRUEN + ASSOCIATES PAGE 54
example, Taser International already located in the Perimeter Center has recently expanded by over 15,000 square feet of space. In 2012 Quicken Loans expanded its Internet web lending center in the McDowell Mountain Business Park from 40,000 square feet to 60,000 square feet to add another 200 employees to its 400 worker employment base.4 The company has recently expanded again taking another nearly 28,000 square feet of space in the McDowell Mountain Business Park.5 North Central University which leased over 26,000 square feet of space in The Perimeter Center in 2011 for its administrative support functions doubled its space in 2012. A small proportion of uses come from out of state including California. For example, AT Security Services moved its headquarters from Irvine, California in 2012 to over 66,000 square feet of space in Perimeter Gateway V.6 TYPES OF OFFICE SPACE USERS ATTRACTED The study area is primarily characterized by smaller to medium size users serving the local household base and local industries as opposed to firms exporting goods/services well beyond the market area. Firms in the study area operate in a variety of industries but the primary functions relate to corporate administrative-processing and back office functions. (Customer facing, higher-order businesses tend to prefer locations in the core Airpark area proximate to amenities and support services, including dining options). By industry type, office space users attracted to the study area are concentrated in the construction, finance, insurance and real estate (“FIRE”) sectors, medical and other service sectors. The FIRE, medical, and other service sector office space users have been attracted primarily to study area’s office space due to the rapid population and household growth and significant housing development in the Phoenix region and because their decision makers reside in north Scottsdale. Major users in the study area include St. Jude Medical, Taser International, Pulte Homes, Fender Guitar, GE Franchise Finance, and Ryland Mortgage. Quicken Loans, is also another major user in the study area occupying 100,000 square feet of space in the McDowell Mountain Business Park for its Internet web lending center. The company which opened its Scottsdale office in 2007 has grown from its initial 40,000 square feet of space to now occupy over 100,000 square feet of space. The company chose the Scottsdale location due to its labor base, quality of life and business-friendly environment.7 Early Warning Systems, a bank security firm, also occupies over 84,000 square feet in the same development and its location was chosen in part because the company’s executives live in north Scottsdale. Accolade Healthcare, a firm that helps large self-insured employers with their healthcare needs, opened a 25,000-square-foot western regional office in Perimeter Center in 2014 and is expanding with plans to hire up to 300 health assistants.8 An air ambulance provider, Aviation West Charters, recently signed a 15,875-square-foot office lease at The Pinnacle in Perimeter Center for its administrative offices.
4 http://www.quickenloans.com/press-room/2012/06/28/quicken-loans-scottsdale-web-center-announces-plan-to-hire-200-new-team-members/ 5 http://www.friedmanrealestate.com/news/friedman-assists-quicken-loans-with-a-27982-sf-office-expansion-in-scottsdale-arizona/ 6 http://lee-investments.com/images/2011-3Q_Phx_Absorption_Office.pdf. 7 http://www.quickenloans.com/blog/quicken-loans-announces-plans-open-division-north-scottsdale. 8http://www.bizjournals.com/phoenix/blog/health-care-daily/2014/08/accolade-to-hire-300-health-assistants-in.html.

MARKET RECONNAISSANCE AND STRATEGIC POLICY RECOMMENDATIONS FOR THE BELL ROAD CORRIDOR
GRUEN GRUEN + ASSOCIATES PAGE 55
By size of user, according to The Perimeter Center’s developer, over the past two to three years, users have generally been in the small to medium size range of 10,000 to 30,000 square feet of space. Larger corporate users in the broader region such as JDA Software and Medici’s (in Riverwalk) have been downsizing or consolidating recently resulting in larger blocks of space available in the market. By function, businesses in the study area tend to provide administrative and corporate support functions. The atmosphere of professional business parks with efficient building layouts and lower cost space options than those available in other areas of the Airpark have attracted firms such as Quicken Loans and Fender Guitar that provide call center work environments9. North Central University, an online distance learning graduate school, houses its administrative support center in The Perimeter Center. DHL Worldwide Express had leased 106,000 square feet of space in The Perimeter Center back in 2002 to employ IT professionals to manage its network infrastructure 24 hours a day, seven days a week.10 The study area does not currently tend to attract high technology firms. JDA Software, a supply chain management software and services company is located further south in the core Airpark as well as a number of other technology related firms. According to Cushman and Wakefield’s map of high technology corridor firms in the Phoenix region, no technology-related firms are located in the study area although firms such as JDA Software and Axosoft, are located in the core part of the Airpark. The interviews and review of supply data suggest higher density mixed-use facilities near specialized support services and shopping and dining amenities, whether located in Downtown Scottsdale or the core Airpark area, are more desirable locations than the study area for technology as well as professional and technical service firms and higher-order financial service office space users. Spread-out, primarily single-use office park uses not walkable to restaurants and services and with parking shortages given the shift to more space intensive cost sensitive back office businesses will find challenging attracting the kinds of firms mixed-user higher density developments capture. COMPETITIVE POSITION OF STUDY AREA FOR ATTRACTING OFFICE SPACE USERS To help forecast future office space demand and assess the competitive position of study area as a location for office space, we conducted research to identify the comparative advantages and disadvantages of the study area as a location for office space.
Successful corporate office developments depend on how well they enable businesses to be more productive and satisfy their customers with innovations that produce better products and services. To succeed office projects must be located and built with or near other activities that will enhance productivity and attract and hold talented labor. They must be located where a culture of innovation exists and can be enhanced by the office space. Therefore, the availability of an affordable and diverse mix of housing and a supply of land zoned for residential uses that serves to maintain a supply of competitively priced high-quality housing units is an inducement to office space using
9http://www.bizjournals.com/phoenix/print-edition/2011/09/09/fender-moving-world-headquarters-to.html?s=print. 10 http://www.siteselection.com/ssinsider/pwatch/pw020318.htm.

MARKET RECONNAISSANCE AND STRATEGIC POLICY RECOMMENDATIONS FOR THE BELL ROAD CORRIDOR
GRUEN GRUEN + ASSOCIATES PAGE 56
businesses. It is difficult to be productive or innovative if the talented labor companies need is exhausted by long commutes. In an era of globalization and a shortage of well educated, highly-skilled workers, businesses and office development follows the talented labor. Successful corporate office space developments typically must meet the following criteria:
A central or highly accessible location to major transportation modes and other activity centers in the region;
A large commute shed providing access to a significant concentration of a highly-skilled and well educated workforce;
Proximity to a diverse set of housing uses. The proximity to a variety of housing product options relates well to the national trend for people to prefer to work close to their residences. This is especially true for female wage earners, which are often primarily responsible for rearing children and caring for elderly parents as well as for part-time workers;
Proximity to retail, lodging, and other support services and amenities, including eating and drinking establishments and day-care and fitness facilities;
Market responsive product types with appropriate technology capabilities; and as indicated above,
Locations within agglomerations or a “critical mass” that help businesses attract and retain labor and operate cost effectively and productively. Agglomeration economies refer to a spatially concentrated development and capital base that from increasing returns to economies of scale, gives cost and revenue advantages to a geographic area’s expanding and new firms. These advantages are “external to the firm” because they benefit all the companies engaged in a given range of activities within a particular place, without firms having to shell out extra resources.
Primary Comparative Advantages The following comparative advantages apply to the study area as an office location:
A central location to executive housing in north Scottsdale and the labor base which comes from the southeast valley and north Phoenix11;
Portions of the study area have excellent accessibility to Loop 101 Freeway; the east side of the study area centered around Bell Road east of Loop 101 is a good location for
11 According to MAG Trip Reduction database, approximately 41 percent of study area work force has 15 to 30 minute commute time and 31 percent of study area work force has 30 to 45 minute commute time.

MARKET RECONNAISSANCE AND STRATEGIC POLICY RECOMMENDATIONS FOR THE BELL ROAD CORRIDOR
GRUEN GRUEN + ASSOCIATES PAGE 57
firms which draw much of their labor from the southeast valley which has easy access north on Loop 101; the west side of the study area centered around Loop 101 and Scottsdale Road interchange will be attractive to firms drawing labor from north Phoenix, and
A large supply of available land to accommodate large office space users/developments.
In addition, rents for office space are cost competitive with competing supply options. Primary Disadvantages Our inspections and interviews suggest the following disadvantages apply to the study area as an office space location:
No direct freeway access to Loop 101 freeway from Bell Road;
Traffic congestion during major special events such as the WM Phoenix Open and the Barrett-Jackson Classic Car Auction at WestWorld;
A location not as proximate to as diverse housing of housing options (especially for a younger-aged workforce) as other office space submarkets and not as convenient to the Phoenix Sky Harbor Airport such as Downtown Scottsdale;
The immediate area does not contain shopping, eating and drinking and specialized support services within walking or easy driving distances as does the core Airpark, Downtown Scottsdale, or Tempe office submarkets;
Parking allowances in some business parks such as Perimeter Center do not reflect current employment densities which have required more parking than allowed under current regulations due to the attraction of more back office types of businesses that require a high amount of employment per square foot of space; and
WestWorld does not help brand the area as a desirable office space location. At best ignoring the traffic congestion associated with major events, it is a neutral factor from the point-of-view of office space users.
POTENTIAL SOURCES OF DEMAND The study area contains ample capacity to house smaller office space users in existing buildings. When demand does arise for new multi-tenant speculative development, Arizona State Trust Land located at the southeast quadrant of Loop 101 and Scottsdale Road is likely to be a preferred location. The City-owned land could hold potential for corporate campus/R&D users which are not as image or visibility conscious as users which want to be on Scottsdale Road and adjoin Loop 101 and whose decision makers live in the vicinity of the site.

MARKET RECONNAISSANCE AND STRATEGIC POLICY RECOMMENDATIONS FOR THE BELL ROAD CORRIDOR
GRUEN GRUEN + ASSOCIATES PAGE 58
Sources of demand are likely to include from engineering, administrative, sales and managerial talent more typically associated with an older, family-age workforce seeking the quality of life opportunities, school, library and park amenities more prevalent in suburban environments like the part of Scottsdale in which the study area is located.
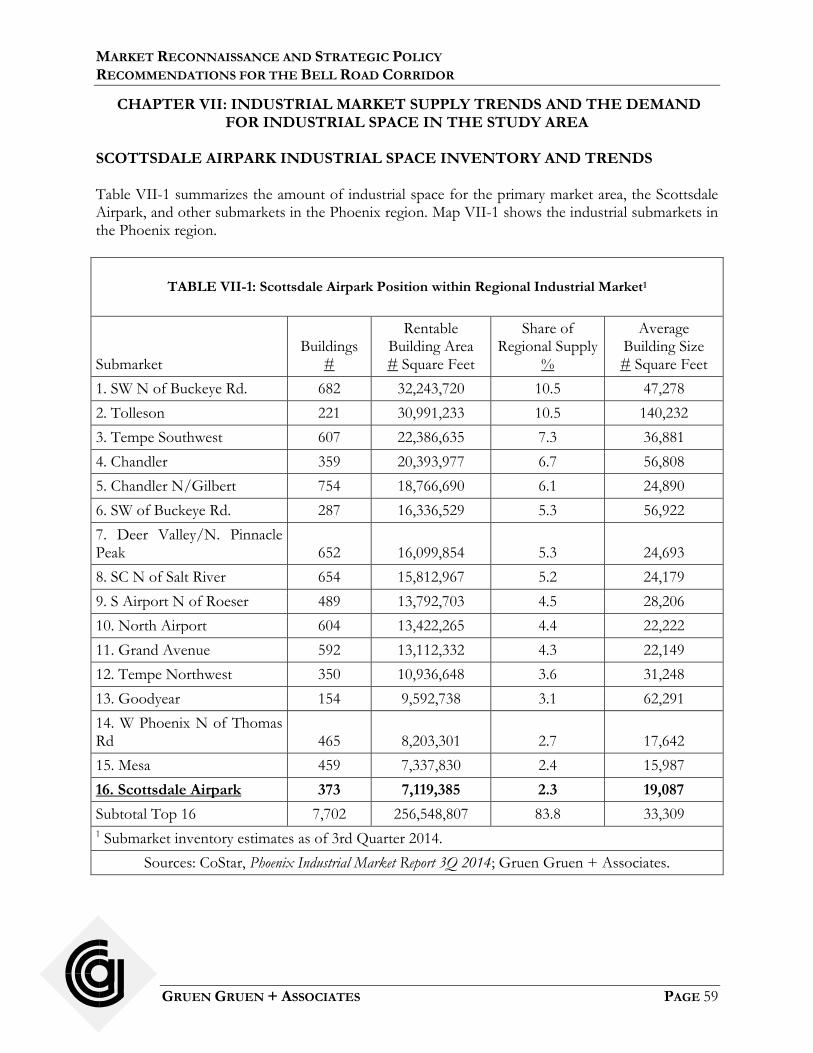
MARKET RECONNAISSANCE AND STRATEGIC POLICY RECOMMENDATIONS FOR THE BELL ROAD CORRIDOR
GRUEN GRUEN + ASSOCIATES PAGE 59
CHAPTER VII: INDUSTRIAL MARKET SUPPLY TRENDS AND THE DEMAND FOR INDUSTRIAL SPACE IN THE STUDY AREA
SCOTTSDALE AIRPARK INDUSTRIAL SPACE INVENTORY AND TRENDS Table VII-1 summarizes the amount of industrial space for the primary market area, the Scottsdale Airpark, and other submarkets in the Phoenix region. Map VII-1 shows the industrial submarkets in the Phoenix region.
TABLE VII-1: Scottsdale Airpark Position within Regional Industrial Market1
Submarket
Buildings #
Rentable Building Area # Square Feet
Share of Regional Supply
%
Average Building Size # Square Feet
1. SW N of Buckeye Rd. 682 32,243,720 10.5 47,278
2. Tolleson 221 30,991,233 10.5 140,232
3. Tempe Southwest 607 22,386,635 7.3 36,881
4. Chandler 359 20,393,977 6.7 56,808
5. Chandler N/Gilbert 754 18,766,690 6.1 24,890
6. SW of Buckeye Rd. 287 16,336,529 5.3 56,922
7. Deer Valley/N. Pinnacle Peak 652 16,099,854 5.3 24,693
8. SC N of Salt River 654 15,812,967 5.2 24,179
9. S Airport N of Roeser 489 13,792,703 4.5 28,206
10. North Airport 604 13,422,265 4.4 22,222
11. Grand Avenue 592 13,112,332 4.3 22,149
12. Tempe Northwest 350 10,936,648 3.6 31,248
13. Goodyear 154 9,592,738 3.1 62,291
14. W Phoenix N of Thomas Rd 465 8,203,301 2.7 17,642
15. Mesa 459 7,337,830 2.4 15,987
16. Scottsdale Airpark 373 7,119,385 2.3 19,087
Subtotal Top 16 7,702 256,548,807 83.8 33,309 1 Submarket inventory estimates as of 3rd Quarter 2014.
Sources: CoStar, Phoenix Industrial Market Report 3Q 2014; Gruen Gruen + Associates.
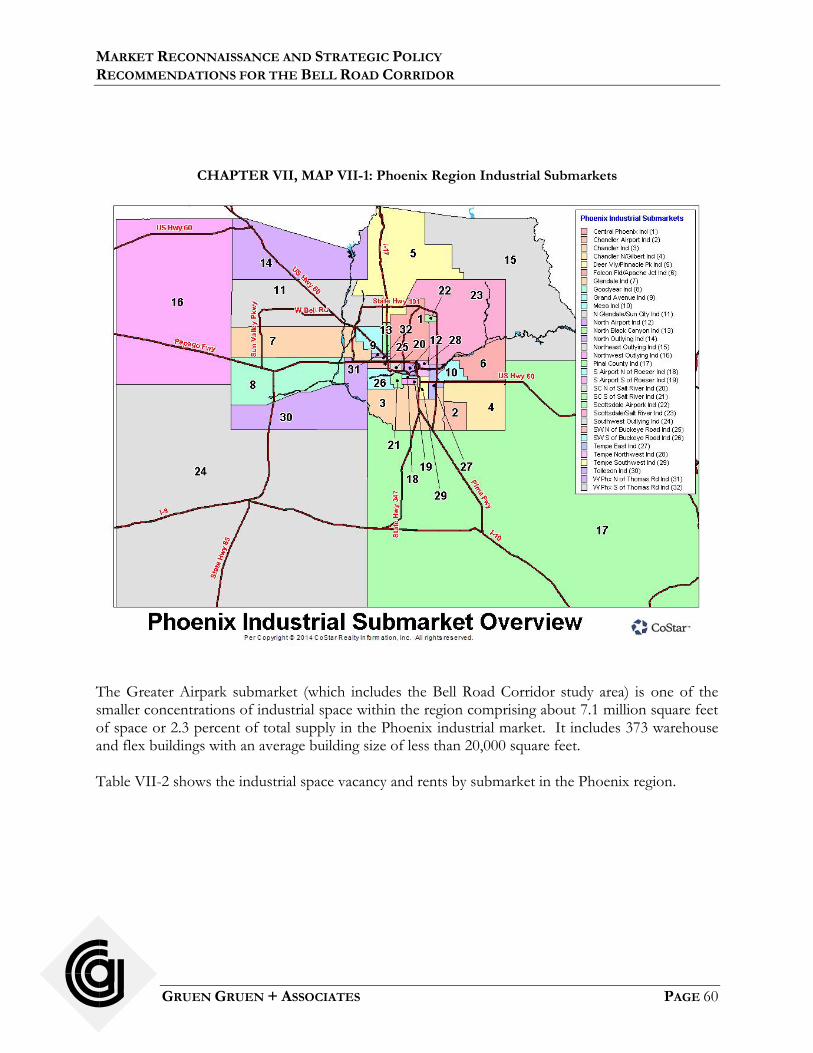
MARKET RECONNAISSANCE AND STRATEGIC POLICY RECOMMENDATIONS FOR THE BELL ROAD CORRIDOR
GRUEN GRUEN + ASSOCIATES PAGE 60
CHAPTER VII, MAP VII-1: Phoenix Region Industrial Submarkets
The Greater Airpark submarket (which includes the Bell Road Corridor study area) is one of the smaller concentrations of industrial space within the region comprising about 7.1 million square feet of space or 2.3 percent of total supply in the Phoenix industrial market. It includes 373 warehouse and flex buildings with an average building size of less than 20,000 square feet. Table VII-2 shows the industrial space vacancy and rents by submarket in the Phoenix region.

MARKET RECONNAISSANCE AND STRATEGIC POLICY RECOMMENDATIONS FOR THE BELL ROAD CORRIDOR
GRUEN GRUEN + ASSOCIATES PAGE 61
TABLE VII-2: Vacancy and Rents Within Regional Industrial Market
Submarket
Vacancy Rate %
Average Quoted Rents $ Per Square Foot
1. SW N of Buckeye Rd. 11.7 4.37
2. Tolleson 14.8 4.31
3. Tempe Southwest 9.4 8.12
4. Chandler 18.7 7.74
5. Chandler N/Gilbert 12.1 7.84
6. SW of Buckeye Rd. 18.5 4.68
7. Deer Valley/N. Pinnacle Peak 10.8 10.05
8. SC N of Salt River 10.3 5.39
9. S Airport N of Roeser 8.0 8.43
10. North Airport 15.9 7.34
11. Grand Avenue 6.9 4.87
12. Tempe Northwest 15.2 9.48
13. Goodyear 12.5 4.20
14. W Phoenix N of Thomas Rd 5.5 4.63
15. Mesa 8.2 6.81
16. Scottsdale Airpark 11.1 11.01
Sources: CoStar, Phoenix Industrial Market Report 3Q 2014; Gruen Gruen + Associates.
The Airpark submarket industrial space vacancy rate of 11.1 percent is consistent with other industrial submarkets though quoted rates are the highest in the region. This is due to the Airpark submarket having a higher proportion of flex space (buildings containing a high proportion of office space and quasi-retail sales activities) than other submarkets. Table VII-3 presents the industrial space characteristics within the Airpark submarket.

MARKET RECONNAISSANCE AND STRATEGIC POLICY RECOMMENDATIONS FOR THE BELL ROAD CORRIDOR
GRUEN GRUEN + ASSOCIATES PAGE 62
TABLE VII-3: Scottsdale Airpark Industrial Space Characteristics1
Buildings
#
Rentable Building Area
# Square Feet Vacancy Rate
%
Average Quoted Rents
$ Per Square Foot
Flex Space 109 2,503,134 19.4 11.58
Warehouse Space 264 4,616,251 6.6 10.44
Total 373 7,119,385 11.1 11.01 1 Submarket inventory estimates as of 3rd Quarter 2014.
Sources: CoStar, Phoenix Industrial Market Report 3Q 2014; Gruen Gruen + Associates.
The Airpark submarket contains seven percent of the Phoenix region’s flex space. Of the total industrial space within the Airpark submarket, approximately 35 percent is flex space. Although the Airpark submarket has a high proportion of flex space, the vacancy for this type of industrial space is significantly higher than for warehouse space. Flex space in the Airpark submarket is approximately 19 percent vacant as compared to over six percent for warehouse type space. Since 2000, approximately 869,000 square feet of industrial space has been built in the Airpark submarket though no new space has been added since 2008. In contrast, the Deer Valley submarket has added approximately 1.0 million square feet of industrial space since 2008. BELL ROAD CORRIDOR STUDY AREA INDUSTRIAL SPACE AND TRENDS Table VII-4 summarizes the industrial space inventory in the study area.
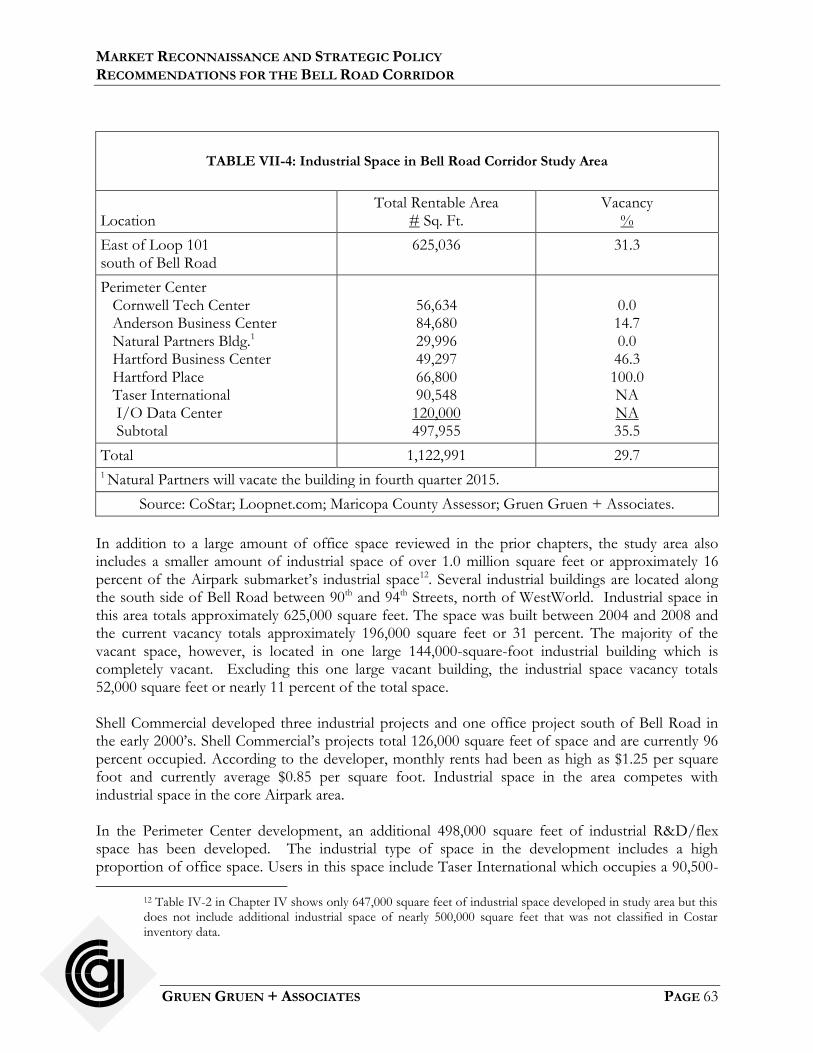
MARKET RECONNAISSANCE AND STRATEGIC POLICY RECOMMENDATIONS FOR THE BELL ROAD CORRIDOR
GRUEN GRUEN + ASSOCIATES PAGE 63
TABLE VII-4: Industrial Space in Bell Road Corridor Study Area
Location
Total Rentable Area # Sq. Ft.
Vacancy %
East of Loop 101 south of Bell Road
625,036 31.3
Perimeter Center Cornwell Tech Center Anderson Business Center Natural Partners Bldg.1 Hartford Business Center Hartford Place Taser International I/O Data Center Subtotal
56,634 84,680 29,996 49,297 66,800 90,548 120,000 497,955
0.0 14.7 0.0 46.3 100.0 NA NA 35.5
Total 1,122,991 29.7 1 Natural Partners will vacate the building in fourth quarter 2015.
Source: CoStar; Loopnet.com; Maricopa County Assessor; Gruen Gruen + Associates.
In addition to a large amount of office space reviewed in the prior chapters, the study area also includes a smaller amount of industrial space of over 1.0 million square feet or approximately 16 percent of the Airpark submarket’s industrial space12. Several industrial buildings are located along the south side of Bell Road between 90th and 94th Streets, north of WestWorld. Industrial space in this area totals approximately 625,000 square feet. The space was built between 2004 and 2008 and the current vacancy totals approximately 196,000 square feet or 31 percent. The majority of the vacant space, however, is located in one large 144,000-square-foot industrial building which is completely vacant. Excluding this one large vacant building, the industrial space vacancy totals 52,000 square feet or nearly 11 percent of the total space. Shell Commercial developed three industrial projects and one office project south of Bell Road in the early 2000’s. Shell Commercial’s projects total 126,000 square feet of space and are currently 96 percent occupied. According to the developer, monthly rents had been as high as $1.25 per square foot and currently average $0.85 per square foot. Industrial space in the area competes with industrial space in the core Airpark area. In the Perimeter Center development, an additional 498,000 square feet of industrial R&D/flex space has been developed. The industrial type of space in the development includes a high proportion of office space. Users in this space include Taser International which occupies a 90,500-
12 Table IV-2 in Chapter IV shows only 647,000 square feet of industrial space developed in study area but this does not include additional industrial space of nearly 500,000 square feet that was not classified in Costar inventory data.
MARKET RECONNAISSANCE AND STRATEGIC POLICY RECOMMENDATIONS FOR THE BELL ROAD CORRIDOR
GRUEN GRUEN + ASSOCIATES PAGE 64
square-foot building comprised of office and warehouse/production space. A data center of 120,000 square feet of space is also located in the development. Other industrial flex type buildings range in size from approximately 18,000 square feet to 56,000 square feet. One of the developments, Cornwell Tech Center, has attracted medical users, Summit Health, a workplace wellness and support provider for employers, and Provista Diagnostics which develops medical diagnostic tests. Current rents for the industrial flex space in the development are in the $0.85 - $0.90 per square foot range. THE RELEVANT PRIMARY GEOGRAPHIC MARKETS The Primary Market Area For most industrial uses, especially those involving manufacturing and combinations of assembly and distribution, the primary market includes the Airpark submarket including the Bell Road study area as well as Deer Valley to the west, and Tempe and Mesa to the south. The Airpark area has shifted toward higher margin, more intensive land uses over time from its origins as a relatively low cost location for industrial activities. Deer Valley has become the preferred location for industrial uses that in the past may have considered a Scottsdale Airpark location. Geographic Origins and Competing Locations Most users will originate from within or near the study area and use a high proportion of office or research and development space or use industrial space for quasi-retail or service activities serving the households in the broader area. Examples of existing users in industrial space within the study area include recreational facilities such as AZ on the Rocks at 16447 North 91st Street, one block south of Bell Road (a rock climbing and fitness facility) and Rebound Gymnastics 16611 North 91st Street, also one block south of Bell Road. Traditional manufacturing and distribution activities will tend to locate in the Deer Valley submarket. TYPES OF INDUSTRIAL OR FLEX SPACE USERS ATTRACTED AND ADVANTAGES AND DISADVANTAGES FOR ATTRACTING INDUSTRIAL/ FLEX SPACE USERS Land prices are too high to support the development of distribution or manufacturing assembly facilities. For those types of industrial users, access to lower-skilled labor is also a disadvantage associated with the study area location. Users whose decision makers live near the study area and want the convenience, quality-of-life advantages, and positive locational image and engage in (1) combinations of research and development with a high office space component; or (2) which have retailing or service functions geared to households in the area are likely to be the primary candidates for existing industrial space in the study area. Companies engaging in large-scale manufacturing or wholesale distribution are unlikely to select locations within the study area.
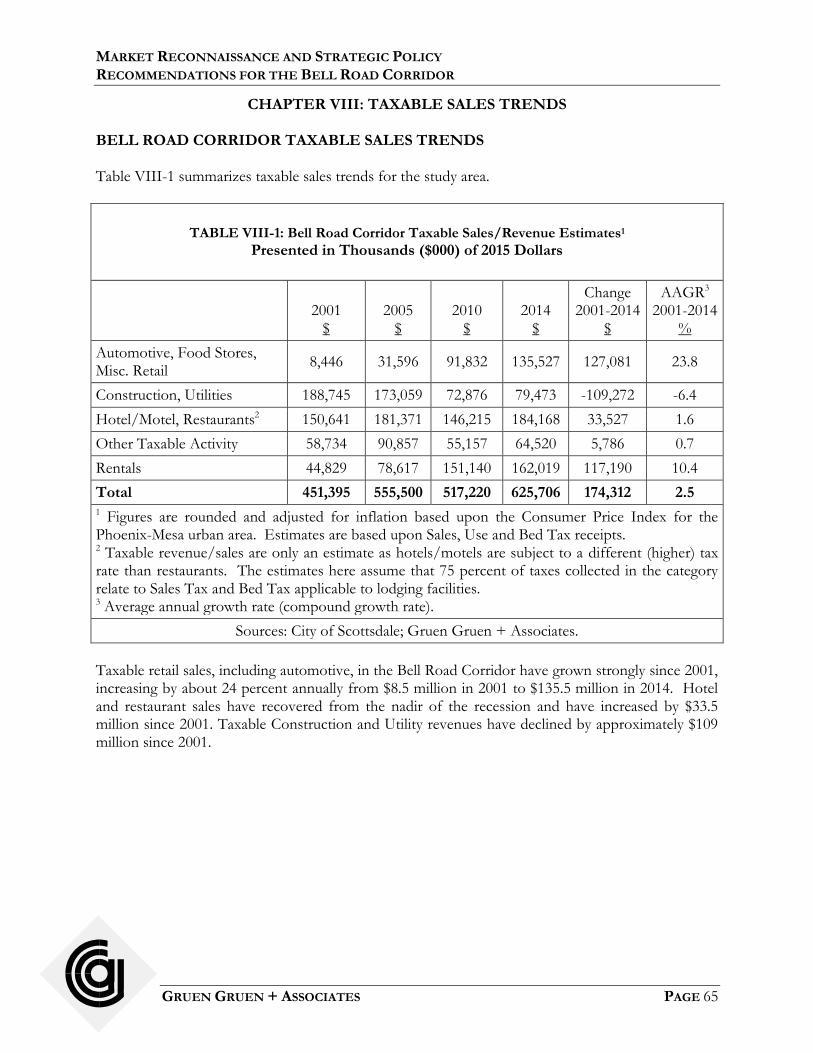
MARKET RECONNAISSANCE AND STRATEGIC POLICY RECOMMENDATIONS FOR THE BELL ROAD CORRIDOR
GRUEN GRUEN + ASSOCIATES PAGE 65
CHAPTER VIII: TAXABLE SALES TRENDS BELL ROAD CORRIDOR TAXABLE SALES TRENDS Table VIII-1 summarizes taxable sales trends for the study area.
TABLE VIII-1: Bell Road Corridor Taxable Sales/Revenue Estimates1
Presented in Thousands ($000) of 2015 Dollars
2001
$ 2005
$ 2010
$ 2014
$
Change 2001-2014
$
AAGR3 2001-2014
%
Automotive, Food Stores, Misc. Retail
8,446 31,596 91,832 135,527 127,081 23.8
Construction, Utilities 188,745 173,059 72,876 79,473 -109,272 -6.4
Hotel/Motel, Restaurants2 150,641 181,371 146,215 184,168 33,527 1.6
Other Taxable Activity 58,734 90,857 55,157 64,520 5,786 0.7
Rentals 44,829 78,617 151,140 162,019 117,190 10.4
Total 451,395 555,500 517,220 625,706 174,312 2.5 1 Figures are rounded and adjusted for inflation based upon the Consumer Price Index for the Phoenix-Mesa urban area. Estimates are based upon Sales, Use and Bed Tax receipts. 2 Taxable revenue/sales are only an estimate as hotels/motels are subject to a different (higher) tax rate than restaurants. The estimates here assume that 75 percent of taxes collected in the category relate to Sales Tax and Bed Tax applicable to lodging facilities. 3 Average annual growth rate (compound growth rate).
Sources: City of Scottsdale; Gruen Gruen + Associates.
Taxable retail sales, including automotive, in the Bell Road Corridor have grown strongly since 2001, increasing by about 24 percent annually from $8.5 million in 2001 to $135.5 million in 2014. Hotel and restaurant sales have recovered from the nadir of the recession and have increased by $33.5 million since 2001. Taxable Construction and Utility revenues have declined by approximately $109 million since 2001.

MARKET RECONNAISSANCE AND STRATEGIC POLICY RECOMMENDATIONS FOR THE BELL ROAD CORRIDOR
GRUEN GRUEN + ASSOCIATES PAGE 66
Table VIII-2 shows the share of the study area sales relative to citywide sales since 2001.
TABLE VIII-2: Estimated Bell Road Corridor Share of Citywide Taxable Sales/Revenue
2001
% 2005
% 2010
% 2014
%
Shift 2001-2014 Pct Points
Automotive, Food Stores, Misc. Retail 0.2 0.7 3.1 3.7 3.5
Construction, Utilities 7.5 6.3 5.9 4.9 -2.6
Hotel/Motel, Restaurants 16.5 17.4 17.1 18.0 1.5
Other Taxable Activity 11.3 12.8 9.2 8.5 -2.8
Rentals 3.0 4.8 10.3 11.0 7.9
Major Department Stores (Retail) 0.0 0.0 0.0 0.0 0.0
Total 4.3 4.7 6.4 6.6 2.4
Sources: City of Scottsdale; Gruen Gruen + Associates.
Consistent with the growth in households attracted to housing in master planning communities within or near the study area and the growth in retail centers, the automotive, food, and miscellaneous retail base has grown rapidly relative to the City as a whole, increasing from only 0.2 percent of the citywide base in 2001 to 3.7 percent by 2014. The high proportion of citywide taxable hotel/motel and restaurant revenues estimated to be comprised by the Bell Road Corridor, about 18 percent in 2014, reflects tourism draws and resorts within the study area, including the destination of the Fairmont Princess Resort.
MARKET RECONNAISSANCE AND STRATEGIC POLICY RECOMMENDATIONS FOR THE BELL ROAD CORRIDOR
GRUEN GRUEN + ASSOCIATES PAGE 67
CHAPTER IX: THE RETAIL MARKET NORTH SCOTTSDALE RETAIL SPACE INVENTORY AND TRENDS According to CBRE’s fourth quarter 2014 MarketView report, few Class A big box spaces remain available in the Phoenix region. In 2011, 168 big box spaces were available in the Phoenix region. Today only 126 big box spaces (greater than 20,000 square feet) are available in the Phoenix region and of these spaces, only 21 spaces are Class A spaces. Class B spaces, of which there were 38, account for 30 percent of the big box spaces. Class C and D spaces accounted for more than half of the large big box spaces in the greater Phoenix region. The dwindling supply of large premium spaces reflects the lack of new retail space added since 2010. According to CBRE, in 2013, 512,000 square feet of new retail space was added in the Phoenix region and in 2014, this amount of new space was 285,400 square feet. This compares to an average of 5.5 million square feet of new space added annually in the Phoenix region between 2000 and 2010. Accordingly the region’s overall retail vacancy rate has fallen below 10 percent. According to CBRE, North Scottsdale has the highest retail rents of all Phoenix area retail submarkets (the submarket posted a rate of $20.41 per square foot in fourth quarter 2014) and the highest net absorption of space in fourth quarter 2014. Table IX-1 summarizes the amount retail space for the North Scottsdale submarket of which the study area is a part. According to CoStar, the North Scottsdale submarket boundaries extend from Cactus Road on the south to Dynamite Boulevard on the north and from 136th Street on the west to State Highway 51 and North 32nd Street on the west (the submarket includes some portion of Phoenix). Map IX-1 shows the boundaries of the retail submarkets in the Phoenix region.

MARKET RECONNAISSANCE AND STRATEGIC POLICY RECOMMENDATIONS FOR THE BELL ROAD CORRIDOR
GRUEN GRUEN + ASSOCIATES PAGE 68
TABLE IX-1: North Scottsdale Retail, 3rd Quarter 2014
North Scottsdale
Gross Leasable Area # Sq. Ft.
Vacancy Rate %
Quoted Rates $ PSF
General Retail1 3,764,905 5.2 23.56
Mall2 1,987,256 2.4 15.66
Power Center3 3,381,972 4.8 18.48
Shopping Center4 5,670,868 9.8 18.26
Specialty Center5 0 0 NA
Total 14,805,001 6.5 19.98 1 Single tenant free-standing general purpose commercial buildings. 2 Combined retail center types of lifestyle center, regional mall, and super regional mall. 3 Center typically consists of several free-standing (unconnected) anchors and only a minimum amount of small specialty tenants. 4 Combined retail center types of community center, neighborhood center, and strip center. 5Combined retail center types of airport retail, outlet center, and theme/festival center.
Sources: The CoStar Retail Report, Mid-Year 2014, Phoenix Retail Market; Gruen Gruen + Associates.
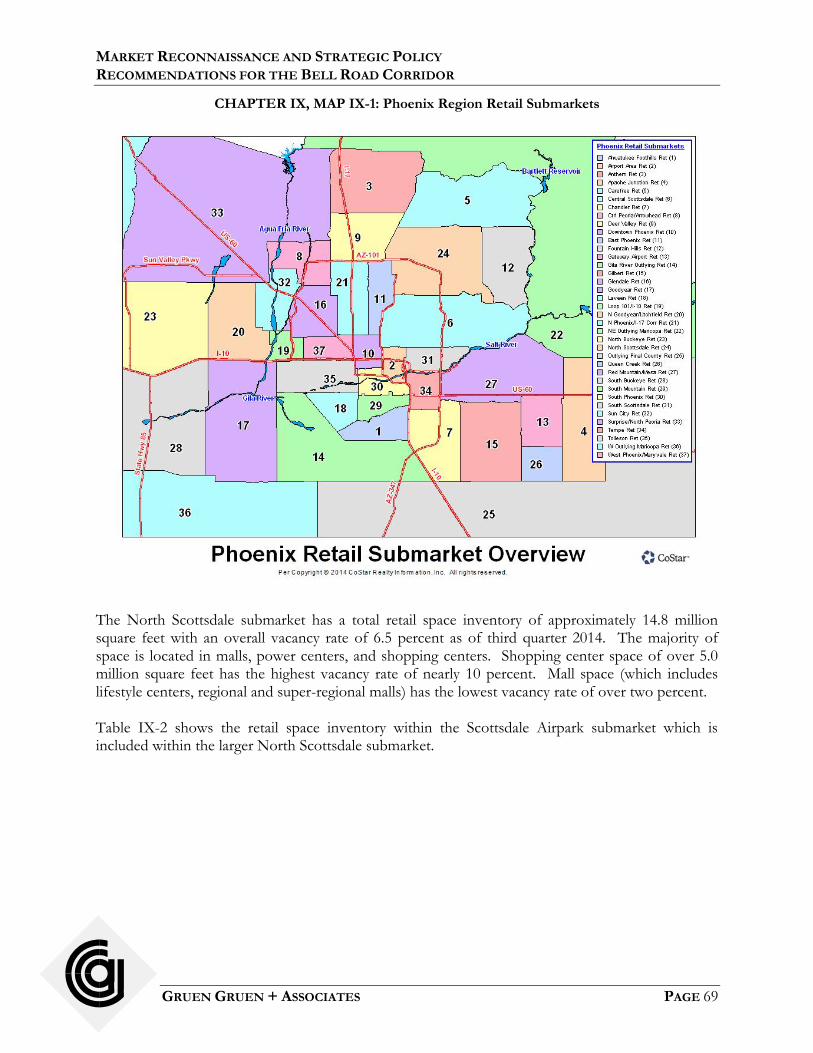
MARKET RECONNAISSANCE AND STRATEGIC POLICY RECOMMENDATIONS FOR THE BELL ROAD CORRIDOR
GRUEN GRUEN + ASSOCIATES PAGE 69
CHAPTER IX, MAP IX-1: Phoenix Region Retail Submarkets
The North Scottsdale submarket has a total retail space inventory of approximately 14.8 million square feet with an overall vacancy rate of 6.5 percent as of third quarter 2014. The majority of space is located in malls, power centers, and shopping centers. Shopping center space of over 5.0 million square feet has the highest vacancy rate of nearly 10 percent. Mall space (which includes lifestyle centers, regional and super-regional malls) has the lowest vacancy rate of over two percent. Table IX-2 shows the retail space inventory within the Scottsdale Airpark submarket which is included within the larger North Scottsdale submarket.
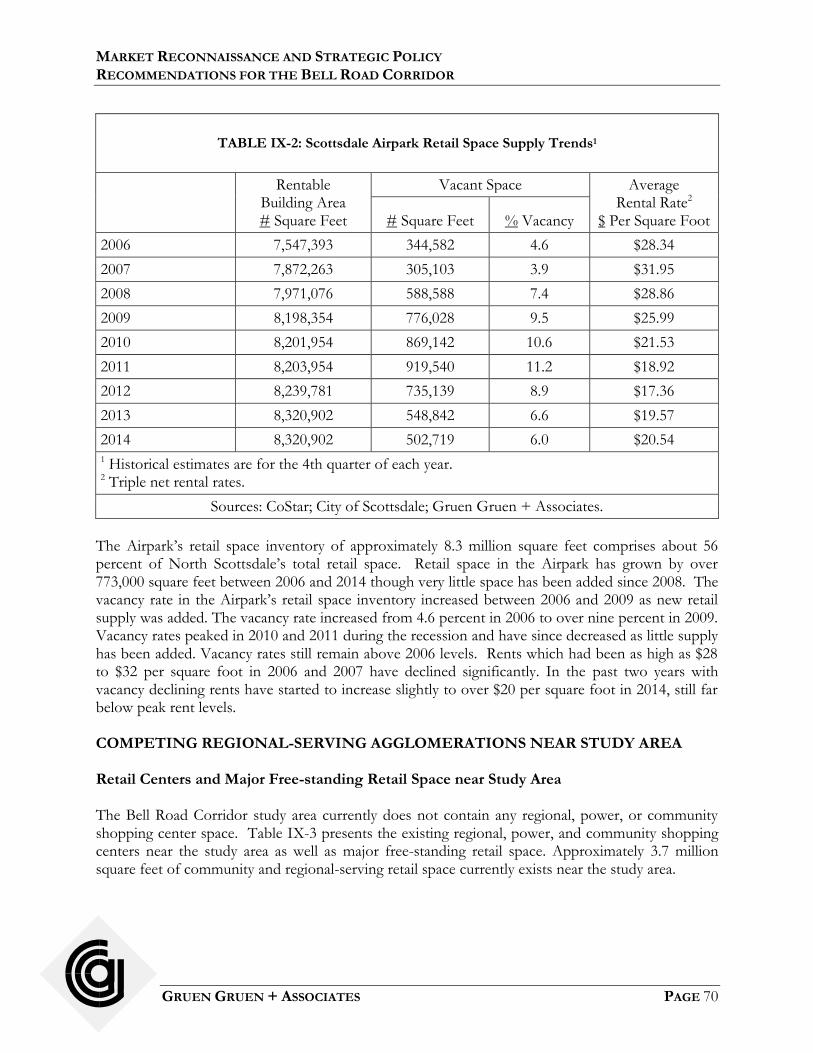
MARKET RECONNAISSANCE AND STRATEGIC POLICY RECOMMENDATIONS FOR THE BELL ROAD CORRIDOR
GRUEN GRUEN + ASSOCIATES PAGE 70
TABLE IX-2: Scottsdale Airpark Retail Space Supply Trends1
Rentable Building Area # Square Feet
Vacant Space Average Rental Rate2
$ Per Square Foot # Square Feet % Vacancy
2006 7,547,393 344,582 4.6 $28.34
2007 7,872,263 305,103 3.9 $31.95
2008 7,971,076 588,588 7.4 $28.86
2009 8,198,354 776,028 9.5 $25.99
2010 8,201,954 869,142 10.6 $21.53
2011 8,203,954 919,540 11.2 $18.92
2012 8,239,781 735,139 8.9 $17.36
2013 8,320,902 548,842 6.6 $19.57
2014 8,320,902 502,719 6.0 $20.54 1 Historical estimates are for the 4th quarter of each year. 2 Triple net rental rates.
Sources: CoStar; City of Scottsdale; Gruen Gruen + Associates.
The Airpark’s retail space inventory of approximately 8.3 million square feet comprises about 56 percent of North Scottsdale’s total retail space. Retail space in the Airpark has grown by over 773,000 square feet between 2006 and 2014 though very little space has been added since 2008. The vacancy rate in the Airpark’s retail space inventory increased between 2006 and 2009 as new retail supply was added. The vacancy rate increased from 4.6 percent in 2006 to over nine percent in 2009. Vacancy rates peaked in 2010 and 2011 during the recession and have since decreased as little supply has been added. Vacancy rates still remain above 2006 levels. Rents which had been as high as $28 to $32 per square foot in 2006 and 2007 have declined significantly. In the past two years with vacancy declining rents have started to increase slightly to over $20 per square foot in 2014, still far below peak rent levels. COMPETING REGIONAL-SERVING AGGLOMERATIONS NEAR STUDY AREA Retail Centers and Major Free-standing Retail Space near Study Area The Bell Road Corridor study area currently does not contain any regional, power, or community shopping center space. Table IX-3 presents the existing regional, power, and community shopping centers near the study area as well as major free-standing retail space. Approximately 3.7 million square feet of community and regional-serving retail space currently exists near the study area.
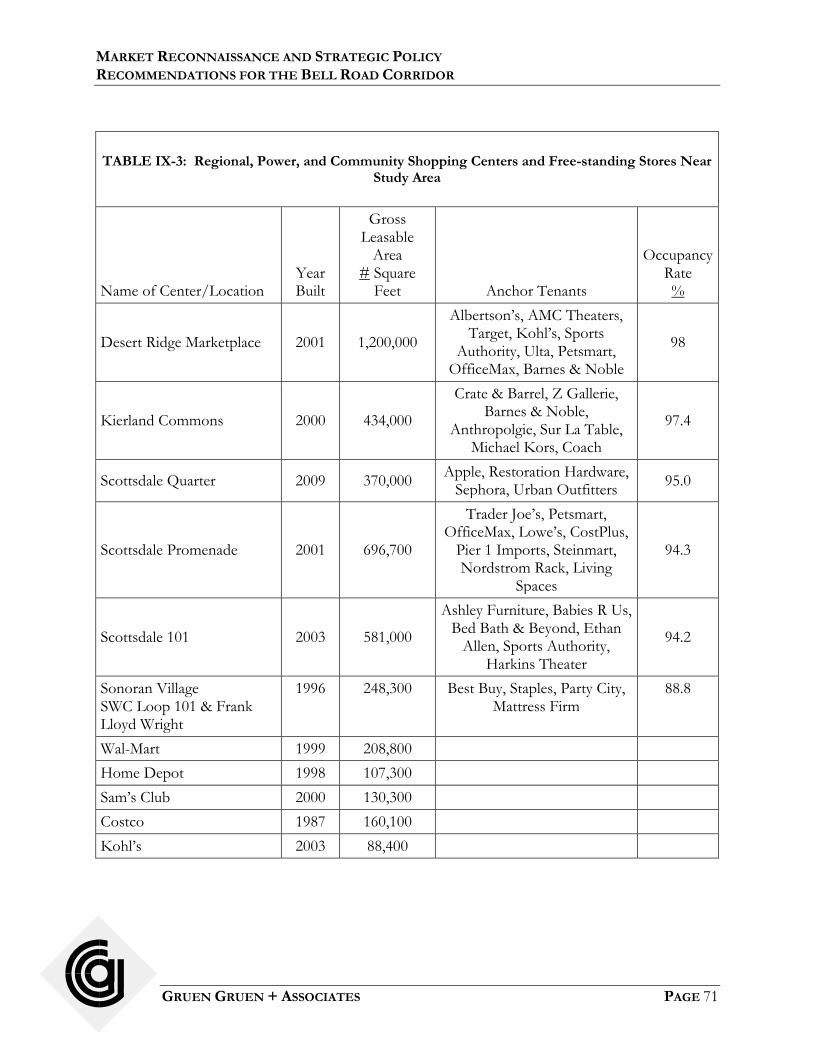
MARKET RECONNAISSANCE AND STRATEGIC POLICY RECOMMENDATIONS FOR THE BELL ROAD CORRIDOR
GRUEN GRUEN + ASSOCIATES PAGE 71
TABLE IX-3: Regional, Power, and Community Shopping Centers and Free-standing Stores Near
Study Area
Name of Center/Location
Year Built
Gross Leasable
Area # Square
Feet Anchor Tenants
Occupancy Rate %
Desert Ridge Marketplace 2001 1,200,000
Albertson’s, AMC Theaters, Target, Kohl’s, Sports
Authority, Ulta, Petsmart, OfficeMax, Barnes & Noble
98
Kierland Commons 2000 434,000
Crate & Barrel, Z Gallerie, Barnes & Noble,
Anthropolgie, Sur La Table, Michael Kors, Coach
97.4
Scottsdale Quarter 2009 370,000 Apple, Restoration Hardware,
Sephora, Urban Outfitters 95.0
Scottsdale Promenade 2001 696,700
Trader Joe’s, Petsmart, OfficeMax, Lowe’s, CostPlus,
Pier 1 Imports, Steinmart, Nordstrom Rack, Living
Spaces
94.3
Scottsdale 101 2003 581,000
Ashley Furniture, Babies R Us, Bed Bath & Beyond, Ethan
Allen, Sports Authority, Harkins Theater
94.2
Sonoran Village SWC Loop 101 & Frank Lloyd Wright
1996 248,300 Best Buy, Staples, Party City, Mattress Firm
88.8
Wal-Mart 1999 208,800
Home Depot 1998 107,300
Sam’s Club 2000 130,300
Costco 1987 160,100
Kohl’s 2003 88,400

MARKET RECONNAISSANCE AND STRATEGIC POLICY RECOMMENDATIONS FOR THE BELL ROAD CORRIDOR
GRUEN GRUEN + ASSOCIATES PAGE 72
General free-standing (incl. La-z-boy Furniture, The Room Store, Ladlow’s, Lumature)
1997 - 2005
352,600
Total 3,774,300
Sources: City of Scottsdale; CoStar; Macerich 2014 Form 10-K; www.vestar.com; Gruen Gruen + Associates.
The primary regional-serving node of retail is located along Scottsdale Road from Greenway Parkway north to Loop 101 and Scottsdale Road. This regional-serving node of retail abuts the west side of the study area at Scottsdale Road and Loop 101, just west of the 1,000 acres of Arizona State Trust Land known as Crossroads East located in the study area. A major amount of big-box free-standing and shopping center space is also located south of the study area, generally located in the core part of the Airpark south of Frank Lloyd Wright Boulevard. This area also includes smaller strip retail centers and one larger hybrid neighborhood-community shopping center. In addition, the Desert Ridge Marketplace shopping center, a 1.2 million-square-foot center in Phoenix, is located to the west, less than four miles from the west side of the study area. Desert Ridge Marketplace at Tatum Boulevard and Loop 101 in northeast Phoenix, is a 1.2 million-square-foot regional mall that contains 75 stores and 31 restaurants. Major tenants include Target, Albertson’s, an 18-screen AMC Theater, Kohl’s, Ulta, Sports Authority, OfficeMax, and Barnes & Noble. Vestar reports that the center is currently 98 percent occupied. Kierland Commons contains approximately 434,000 square feet of space with more than 70 stores. The center is part of a larger master-planned community that includes residential and office uses as well as a 750-room Westin Resort. Kierland Commons includes several restaurants in addition to home furnishings and apparel and accessories stores. Major tenants include Crate and Barrel and Z Gallerie. The center is 97 percent leased. Barnes and Noble recently closed at Kierland Commons due to its inability to renegotiate a lease renewal for its 30,000-square-foot store. Arhaus furniture, a hand crafted furniture store chain has leased the former Barnes and Noble space.13 PBteen, a furniture store, also opened in the center last summer joining Pottery Barn Kids. Rents at Kierland Commons are reported to be double and triple the $35 per square foot net rents that the center’s initial proforma called for and sales in 2011 were reported at $650 per square foot.14 Scottsdale Quarter, a newer mixed-use project, contains 370,000 square feet of retail space and is located across Scottsdale Road from Kierland Commons. The center is a mix of restaurants, retail, office, and residential uses. Scottsdale Quarter is 95 percent leased. The center was built in 2009. Tenants at Scottsdale Quarter include Apple, Restoration Hardware, Pottery Barn, West Elm, Le Creuset, lululemon athletica, Nike, Sephora, Forever 21, and H&M. According to a Phoenix
13http://www.bizjournals.com/phoenix/news/2015/02/03/trendy-furniture-seller-leasesold-borders-barnes.html 14 http://www.naiop.org/en/Magazine/2011/Winter-2011/Development-Ownership/How-to-Succeed-in-Lifestyle-Retail.aspx

MARKET RECONNAISSANCE AND STRATEGIC POLICY RECOMMENDATIONS FOR THE BELL ROAD CORRIDOR
GRUEN GRUEN + ASSOCIATES PAGE 73
Business Journal article, approximately one-third of the center’s retail tenants are “restaurants, entertainment venues or unconventional retailers offering experiences not duplicated by cyberspace.”15 American Girl will anchor 12,000 square feet of ground floor retail space in the newest 170,000-square-foot building currently under development in the center. Built in 2001, Scottsdale Promenade, located north of Kierland Commons and Scottsdale Quarter, at the southeast corner of Scottsdale Road and Frank Lloyd Wright Boulevard, contains nearly 700,000 square feet of space. Major tenants and occupants include Lowe’s, Nordstrom Rack, OfficeMax, CostPlus, Steinmart, Pier 1 Imports, and Trader Joe’s. The most recent tenant, Living Spaces, a home furnishings store, leased the former 130,000-square-foot Great Indoors space in 2013. Scottsdale 101, a 581,000-square-foot power center located at the southwest quadrant of Loop 101 and Scottsdale Road, just to the west of the study area’s western border, was built in 2003. The center is 94 percent leased. Tenants include Bed Bath & Beyond, Ethan Allen, Ashley Furniture, Mattress Firm, Sports Authority, and the Harkins Theater. The center has had a significant amount of turnover since the start of the recession. More recent tenants include Potato Barn, a home furnishings store that relocated from the Pavilions at Talking Stock center to a 34,000-square-foot former Circuit City space. A 33,000-square-foot PGA Tour Superstore opened in the center last fall, its second store in Scottsdale. With its multiple practice bays, putting greens, and club fitting facility, the stores focus on serving high touch customer service for those who are “Nordstrom and REI customers – people who have a high knowledge and high expectations of what they are shopping for.”16 In addition, a significant amount of big-box retail space exists in the core Airpark area along Hayden, Raintree, and Frank Lloyd Wright and includes Sonoran Village, a nearly 250,000-square-foot center as well as Home Depot, Sam’s Club, Wal-Mart, Costco, and Kohl’s. Mattress Firm located in nearly 25,000 square feet in the center in early 2014. The Mattress Firm flagship store is larger than its typical 3,000 to 5,000 square foot stores and the center’s high traffic, national tenant base, and great visibility were attractions in the store’s location decision.17 A concentration of home furnishing stores with more than 350,000 square feet of space is also located north of Kierland Commons and Scottsdale Quarter along Scottsdale Road. The supply of larger format retail space in power centers, “category-killer, big-box” retail stores or regional malls largely relates to the demand for home furnishings and destination activities such as experiential shopping or restaurants. The North Scottsdale retail submarket has the highest rents in the Phoenix region and demand is strong from retailers as evidenced by Arhaus and PB Teen locating to Kierland Commons, Restoration Hardware relocating from Kierland Commons to Scottsdale Quarter in a new store, and Potato Barn and the PGA Tour Supertore locating at the Scottsdale 101 shopping center. 15http://www.bizjournals.com/phoenix/print-edition/2012/07/27/scottsdale-quarter-adds-tenants.html?page=all 16 http://www.bizjournals.com/phoenix/news/2014/10/24/pga-tour-superstore-tees-off-in-scottsdale-this.html 17http://cem-az.com/velocity-retail-group-negotiates-24000-square-food-mattress-firm-supercenter-for-north-scottsdale/

MARKET RECONNAISSANCE AND STRATEGIC POLICY RECOMMENDATIONS FOR THE BELL ROAD CORRIDOR
GRUEN GRUEN + ASSOCIATES PAGE 74
Demographic data drawn from marketing and leasing packages for various retail centers indicates that most of these larger centers or big-box stores draw from a five-mile radius. Kierland Commons primary trade area is described as extending from approximately 10 miles to the south (to Biltmore Fashion Park in Phoenix and Scottsdale Fashion Square in Scottsdale) to more than 15 miles to the north beyond Cave Creek and to Desert Ridge shopping center on the west to more than 10 miles on the east to Fountain Hills. Neighborhood Retail Supply of Space in Study Area Table IX-4 presents the existing neighborhood shopping centers in the study area. Approximately 1.4 million square feet of neighborhood-serving retail space currently exists in or very close to the study area. Within the study area, five grocery-anchored neighborhood centers and one drug store-anchored strip center comprise approximately 622,000 square feet of space. Another four centers totaling 778,000 square feet of space are located very close to the study area boundaries.
TABLE IX-4: Major Neighborhood Shopping Centers in or Near Study Area1
Name of Center/
Location Year Built
Gross Leasable
Area # Square
Feet Major Tenants
Occupancy Rate
%
Monthly Rents
$ Per Sq. Ft.
In Study Area
McDowell Mountain Marketplace
2002
84,100 Basha’s 95.0 Under $25
McDowell Mountain Village
2002 74,000 AJ’s, Walgreen’s
100.0 NA
Windgate Crossing 2007 15,000 CVS Low $20’s
Market Street at DC Ranch 1999 - 2003
241,280 Safeway 90.0
DC Ranch Crossing 2008 68,100 AJ’s 60.0
Hayden Peak Crossing SEC Thompson Peak Pkwy & Hayden
2006 140,000 Fry’s 99.2
Subtotal 622,480 91.0
Near Study Area
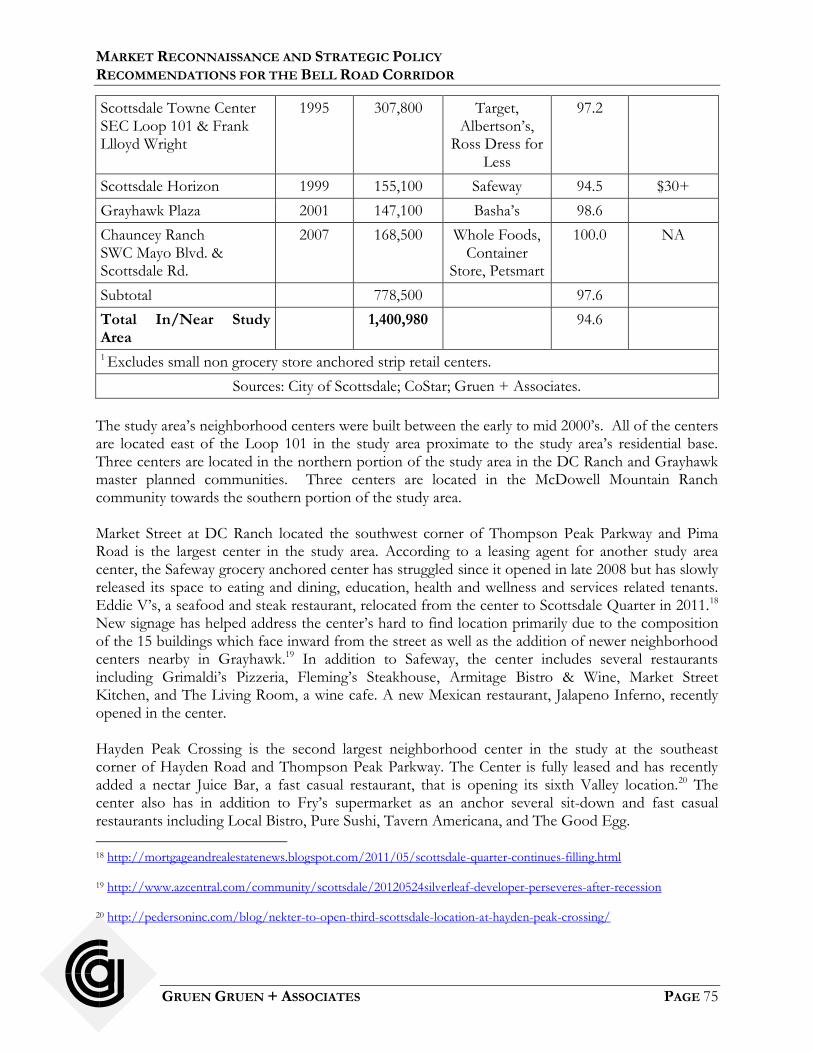
MARKET RECONNAISSANCE AND STRATEGIC POLICY RECOMMENDATIONS FOR THE BELL ROAD CORRIDOR
GRUEN GRUEN + ASSOCIATES PAGE 75
Scottsdale Towne Center SEC Loop 101 & Frank Llloyd Wright
1995 307,800 Target, Albertson’s,
Ross Dress for Less
97.2
Scottsdale Horizon 1999 155,100 Safeway 94.5 $30+
Grayhawk Plaza 2001 147,100 Basha’s 98.6
Chauncey Ranch SWC Mayo Blvd. & Scottsdale Rd.
2007 168,500 Whole Foods, Container
Store, Petsmart
100.0 NA
Subtotal 778,500 97.6
Total In/Near Study Area
1,400,980 94.6
1 Excludes small non grocery store anchored strip retail centers.
Sources: City of Scottsdale; CoStar; Gruen + Associates.
The study area’s neighborhood centers were built between the early to mid 2000’s. All of the centers are located east of the Loop 101 in the study area proximate to the study area’s residential base. Three centers are located in the northern portion of the study area in the DC Ranch and Grayhawk master planned communities. Three centers are located in the McDowell Mountain Ranch community towards the southern portion of the study area. Market Street at DC Ranch located the southwest corner of Thompson Peak Parkway and Pima Road is the largest center in the study area. According to a leasing agent for another study area center, the Safeway grocery anchored center has struggled since it opened in late 2008 but has slowly released its space to eating and dining, education, health and wellness and services related tenants. Eddie V’s, a seafood and steak restaurant, relocated from the center to Scottsdale Quarter in 2011.18 New signage has helped address the center’s hard to find location primarily due to the composition of the 15 buildings which face inward from the street as well as the addition of newer neighborhood centers nearby in Grayhawk.19 In addition to Safeway, the center includes several restaurants including Grimaldi’s Pizzeria, Fleming’s Steakhouse, Armitage Bistro & Wine, Market Street Kitchen, and The Living Room, a wine cafe. A new Mexican restaurant, Jalapeno Inferno, recently opened in the center. Hayden Peak Crossing is the second largest neighborhood center in the study at the southeast corner of Hayden Road and Thompson Peak Parkway. The Center is fully leased and has recently added a nectar Juice Bar, a fast casual restaurant, that is opening its sixth Valley location.20 The center also has in addition to Fry’s supermarket as an anchor several sit-down and fast casual restaurants including Local Bistro, Pure Sushi, Tavern Americana, and The Good Egg.
18 http://mortgageandrealestatenews.blogspot.com/2011/05/scottsdale-quarter-continues-filling.html 19 http://www.azcentral.com/community/scottsdale/20120524silverleaf-developer-perseveres-after-recession 20 http://pedersoninc.com/blog/nekter-to-open-third-scottsdale-location-at-hayden-peak-crossing/

MARKET RECONNAISSANCE AND STRATEGIC POLICY RECOMMENDATIONS FOR THE BELL ROAD CORRIDOR
GRUEN GRUEN + ASSOCIATES PAGE 76
McDowell Mountain Marketplace, at the southwest corner of Bell Road and Thompson Peak Parkway, is a Basha’s grocery anchored center that is 95 percent occupied. According to the leasing agent, Basha’s remodeled the store last year and sales are reportedly up 20 percent this year. Rents, however, remain lower than what was projected when the center was built in 2002. The center serves households within two to three miles of the center. The major neighborhood retail space within or near the study includes few vacancies. Overall, the existing supply of neighborhood retail space is approximately 95 percent occupied. Based on our site inspections and interviews, the centers in the study area serve local neighborhoods and cater to the area’s high income households. Interviews with homeowner association representatives of the master planned communities in or near the study area confirm that area residents frequently shop at these neighborhood centers in addition to the node of neighborhood retail space nearby at Loop 101 and Frank Lloyd Wright Boulevard. PLANNED FUTURE RETAIL SPACE SUPPLY Table IX-5 summarizes the planned future retail supply within the study area.
TABLE IX-5: Likely Future Supply of Community- and Regional-Serving Retail Space in Bell
Road Corridor Study Area
# Acres Status
Crossroads East1 SEC Quadrant Loop 101 & Scottsdale Rd.
168 acres
Future
1 Zoned commercial.
Sources: State of Arizona Land Department; Gruen Gruen + Associates.
Within the study area, no significant amount of retail space is either planned or under construction. The 1,000-acre Crossroads East on the west side of the study area has approximately 168 acres of land zoned for future commercial uses. Near the study area, Scottsdale Quarter is adding 30,000 square feet of new retail space in its new mixed-use building. According to the City of Scottsdale planning department, no new significant retail supply additions have been proposed for the study area. PRIMARY MARKET AREA DEFINITION A primary market area is defined as the area from which most (i.e., 70 percent or more) customers of a shopping center or shopping area are drawn. The market area for any specific agglomerations or set of stores is a function of the size and tenant make-up of the agglomeration, its accessibility, and the scale and tenancies of competing agglomerations. Therefore, market areas are dynamic and

MARKET RECONNAISSANCE AND STRATEGIC POLICY RECOMMENDATIONS FOR THE BELL ROAD CORRIDOR
GRUEN GRUEN + ASSOCIATES PAGE 77
tend to change as a function of the type and supply of competing shopping locations. The travel time people are willing to expend in order to visit a shopping or business location varies as a function of both the size of the shopping areas and the relative uniqueness of the tenancies and environments available at alternative destinations. The relative accessibility to the shopping area and ease of getting in-, about-, and out- of the shopping area also influence the market area. Uniqueness, attraction, and accessibility are always relative to the specific competition in the area. Combinations of hard and soft good retailers and restaurants have created major retail destinations three miles south of western edge (around Scottsdale Road and Loop 101) of the study area in well-established regional- and community-serving agglomerations that are also close to larger employment centers and growing concentrations of population. These centers are currently well leased. The west side of the study area, which includes the Arizona State Land Department Crossroads East land, benefits from a highly accessible location near a major freeway interchange with convenient access to Loop 101 from Scottsdale Road, proximity to major resort and hotels and other nearby concentrations of dominant retail supply, and an expanding base of households with new apartments being constructed in the area. As the existing major dominant retail destinations such as Kierland Commons, Scottsdale Quarter, Scottsdale Promenade, and Scottsdale 101 fill up, new proximate locations will develop as the household and employment base grows over time. New specialty chain entrants to the region will tend to select locations along or near Scottsdale Road, near existing critical masses of other specialty retailers and restaurants with excellent visibility and accessibility, and closer to major centers of future employment and growing population concentrations. To estimate potential demand for destination activities and comparison or shopper goods such as those found at community shopping centers, power centers, “category-killer, big-box” retail stores or regional malls, we assumed a trade area from the west side of the study area based on a five-mile radius at the intersection of Scottsdale Road and Loop 101. Map IX-2 shows the postulated primary trade area for destination and comparison type goods.
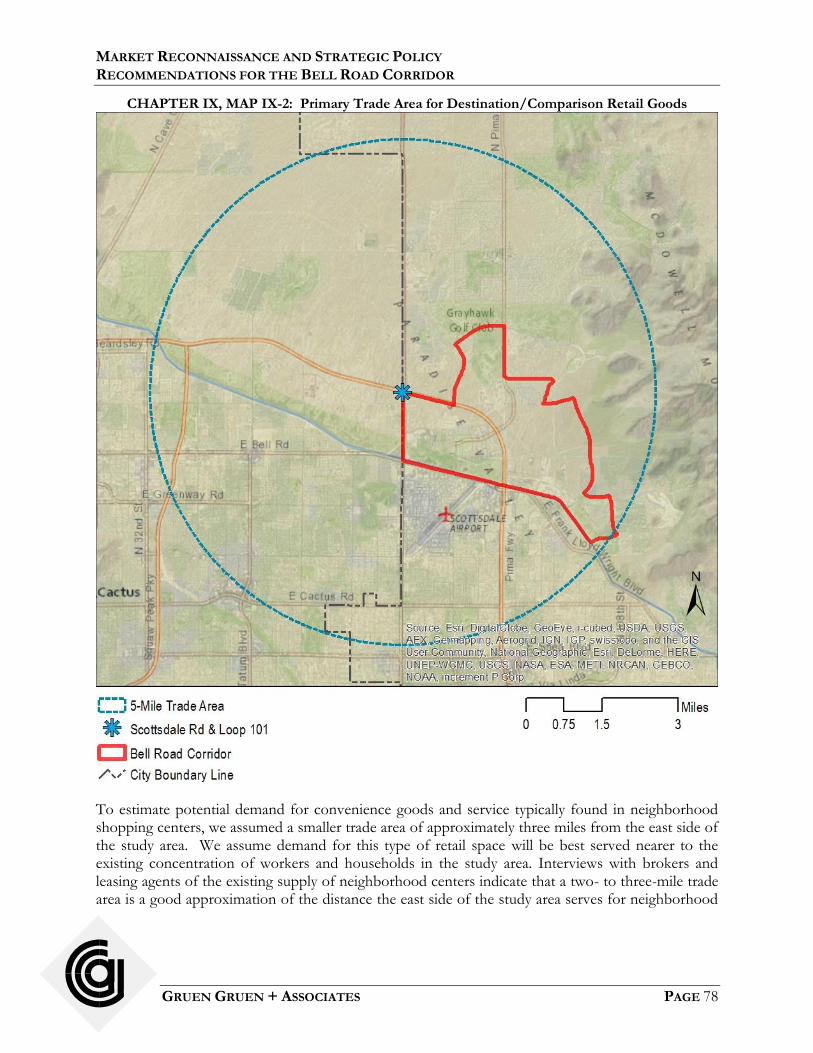
MARKET RECONNAISSANCE AND STRATEGIC POLICY RECOMMENDATIONS FOR THE BELL ROAD CORRIDOR
GRUEN GRUEN + ASSOCIATES PAGE 78
CHAPTER IX, MAP IX-2: Primary Trade Area for Destination/Comparison Retail Goods
To estimate potential demand for convenience goods and service typically found in neighborhood shopping centers, we assumed a smaller trade area of approximately three miles from the east side of the study area. We assume demand for this type of retail space will be best served nearer to the existing concentration of workers and households in the study area. Interviews with brokers and leasing agents of the existing supply of neighborhood centers indicate that a two- to three-mile trade area is a good approximation of the distance the east side of the study area serves for neighborhood

MARKET RECONNAISSANCE AND STRATEGIC POLICY RECOMMENDATIONS FOR THE BELL ROAD CORRIDOR
GRUEN GRUEN + ASSOCIATES PAGE 79
convenience and necessity goods and services. We assume a trade area based on a three mile radius at the intersection of 98th Street and Bell Road. Map IX-3 shows the postulated primary trade area for neighborhood type retail.
CHAPTER IX, MAP IX-3: Primary Trade Area for Neighborhood Retail
MARKET RECONNAISSANCE AND STRATEGIC POLICY RECOMMENDATIONS FOR THE BELL ROAD CORRIDOR
GRUEN GRUEN + ASSOCIATES PAGE 80
ESTIMATED POTENTIAL RETAIL DEMAND IN BELL ROAD CORRIDOR GG+A analyzed demographic and office space data to estimate the potential retail demand in terms of expenditure potential and the square footage that the identified demand could support, given assumptions about required average sales per square foot of commercial space. Retail demand primarily originates from two sources: market area residents and workers. Potential retail demand from residents depends largely upon the amount of disposable income within the market area. Population and income factors influence disposable income. Estimating potential demand also requires the identification of the proportion of income spent on retail goods and services. Not all internally generated demand is satisfied in a primary market area. Some of the potential demand within the market area is lost to retailers outside the market area. This is called leakage. Given the significant amount of retail and restaurant space within the primary market area definition, leakage is likely to occur. Conversely, retail sales in the market area will be made to workers and visitors who live outside the market area. This is referred to as surplus. Surplus is also likely to occur given the office employment base in the market area and the resort and specialty retail destinations in the market area. In order to simplify the analysis, the potential demand estimates are initially based on the estimated present and forecast future households and average household income of the market area. We then include an estimate of the potential contribution made to sales by workers in the market area. We assume that demand that originates from visitors will be offset by the proportion of households in the market area that are not located in the area year-round.21 Five-Mile Radius Trade Area around Scottsdale Road and Loop 101 Table IX-6 presents the population, number of households, and average household income and total available household income for 2000, 2010, and 2013 for the five-mile radius trade area.
21 Interviews with representatives of homeowner’s associations in and near the study area indicated that as much as 25-30% of households in the master planned communities are not full-time, year-round residents.

MARKET RECONNAISSANCE AND STRATEGIC POLICY RECOMMENDATIONS FOR THE BELL ROAD CORRIDOR
GRUEN GRUEN + ASSOCIATES PAGE 81
TABLE IX-6: Demographic and Income Estimates for Residents and Workers in Five-Mile Radius
Trade Area, 2000 – 2013
2000
2010
2013
2000-2013 % Change
Population 131,807 144,528 148,278 12.5
Households 52,003 61,347 61,752 18.7
Employees NA NA 127,070 -
Average Household Income NA NA $99,746 -
Total Household Income NA NA $6,159,514,992 -
Sources: Loopnet; Gruen Gruen + Associates.
In 2013, the five-mile radius trade area included nearly 62,000 households with average household income of nearly $100,000 for total household income of over $6.1 billion. Between 2000 and 2013, the population grew by approximately 12 percent and the number of households increased by nearly 19 percent. Over 127,000 employees worked within the trade area. Three-Mile Radius Trade Area around 98th Street and Bell Road Table IX-7 presents the population, number of households, and average household income and total available household income for 2000, 2010, and 2013 for the three-mile radius trade area.
TABLE IX-7: Demographic and Income Estimates for Residents and Workers in Three-Mile Radius
Trade Area, 2000 – 2013
2000
2010
2013
2000-2013 % Change
Population 35,329 43,744 44,914 27.1
Households 14,936 19,328 19,474 30.4
Employees NA NA 40,901 -
Average Household Income NA NA $108,198 -
Total Household Income NA NA $2,107,047,852 -
Sources: Loopnet; Gruen Gruen + Associates.
In 2013, the three-mile radius trade area included nearly 19,500 households with average household income of approximately $108,000 for total household income of over $2.1 billion. Between 2000 and 2013, the population grew by approximately 27 percent and the number of households

MARKET RECONNAISSANCE AND STRATEGIC POLICY RECOMMENDATIONS FOR THE BELL ROAD CORRIDOR
GRUEN GRUEN + ASSOCIATES PAGE 82
increased by 30 percent. The increase in population and households occurred between 2000 and 2010 when the area’s master planned communities were large developed and built out. Since 2010, little population and household growth has occurred in the trade area. Approximately 41,000 employees worked within the trade area in 2013. ESTIMATE OF EXPENDITURES FOR RETAIL GOODS In order to estimate the potential purchasing power for retail goods and services of the population and workers in the primary trade areas, we reviewed the 2012-2013 Bureau of Labor Statistics Consumer Expenditure Survey (“CES”) for higher-income households. As shown on Table IX-8, the 2013 BLS Consumer expenditure Survey indicates that higher income households expend approximately 21 percent of their before-tax income on retail goods and services.

MARKET RECONNAISSANCE AND STRATEGIC POLICY RECOMMENDATIONS FOR THE BELL ROAD CORRIDOR
GRUEN GRUEN + ASSOCIATES PAGE 83
TABLE IX-8: Average Household Annual Expenditure on Retail Goods and Services for Higher
Income Households (2013)
Good/Service
Average Household Annual Expenditure
$
Share of Average Household Income1
%
Food at Home 5,508 5.1
Food Away from Home 4,267 3.9
Alcoholic Beverages 613 0.6
Housekeeping Supplies 902 0.8
Household Furnishings & Equipment
2,333 2.1
Apparel and Services 2,662 2.5
Personal Care Products and Services 923 0.8
Reading 163 0.2
Tobacco Products 315 0.3
Drugs & Medical Supplies 802 0.7
Entertainment 4,057 3.7
TOTAL 22,545 20.7 1 Average household before-tax income was $108,624 reported in the 2013 Consumer Expenditure Survey for households in the $100,000 to $119,999 income category.
Sources: Bureau of Labor Statistics, Consumer Expenditure Survey, 2013; Gruen Gruen + Associates.
According to the 2013 CES, higher income households (those with income above $100,000) expend approximately 21 percent of their average before-tax household income on most retail goods and services. This expenditure rate includes expenditures on items such as apparel, home furnishings and equipment, and entertainment which are most likely to be made in larger retail centers or agglomerations that provide these types of destination goods and eating and drinking establishments. To estimate the purchasing power or expenditure potential within the trade area for neighborhood retail, we assume that approximately 13 percent of household income is spent on goods and services typically found in neighborhood centers, including food at home, food away from home, alcoholic beverages, housekeeping supplies, personal care products and services, tobacco, and reading materials, and drugs and medical supplies. To estimate the purchasing power for regional- and community-serving, comparison or shopper
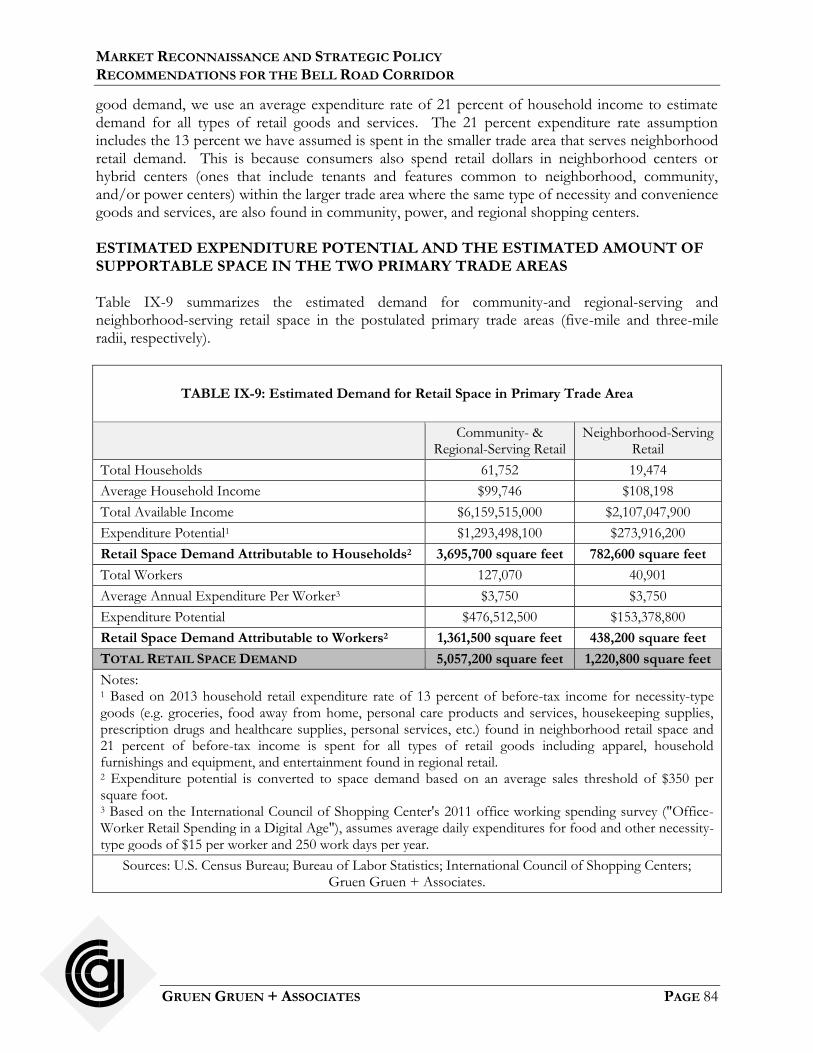
MARKET RECONNAISSANCE AND STRATEGIC POLICY RECOMMENDATIONS FOR THE BELL ROAD CORRIDOR
GRUEN GRUEN + ASSOCIATES PAGE 84
good demand, we use an average expenditure rate of 21 percent of household income to estimate demand for all types of retail goods and services. The 21 percent expenditure rate assumption includes the 13 percent we have assumed is spent in the smaller trade area that serves neighborhood retail demand. This is because consumers also spend retail dollars in neighborhood centers or hybrid centers (ones that include tenants and features common to neighborhood, community, and/or power centers) within the larger trade area where the same type of necessity and convenience goods and services, are also found in community, power, and regional shopping centers. ESTIMATED EXPENDITURE POTENTIAL AND THE ESTIMATED AMOUNT OF SUPPORTABLE SPACE IN THE TWO PRIMARY TRADE AREAS Table IX-9 summarizes the estimated demand for community-and regional-serving and neighborhood-serving retail space in the postulated primary trade areas (five-mile and three-mile radii, respectively).
TABLE IX-9: Estimated Demand for Retail Space in Primary Trade Area
Community- & Regional-Serving Retail
Neighborhood-Serving Retail
Total Households 61,752 19,474
Average Household Income $99,746 $108,198
Total Available Income $6,159,515,000 $2,107,047,900
Expenditure Potential1 $1,293,498,100 $273,916,200
Retail Space Demand Attributable to Households2 3,695,700 square feet 782,600 square feet
Total Workers 127,070 40,901
Average Annual Expenditure Per Worker3 $3,750 $3,750
Expenditure Potential $476,512,500 $153,378,800
Retail Space Demand Attributable to Workers2 1,361,500 square feet 438,200 square feet
TOTAL RETAIL SPACE DEMAND 5,057,200 square feet 1,220,800 square feet
Notes: 1 Based on 2013 household retail expenditure rate of 13 percent of before-tax income for necessity-type goods (e.g. groceries, food away from home, personal care products and services, housekeeping supplies, prescription drugs and healthcare supplies, personal services, etc.) found in neighborhood retail space and 21 percent of before-tax income is spent for all types of retail goods including apparel, household furnishings and equipment, and entertainment found in regional retail. 2 Expenditure potential is converted to space demand based on an average sales threshold of $350 per square foot. 3 Based on the International Council of Shopping Center's 2011 office working spending survey ("Office-Worker Retail Spending in a Digital Age"), assumes average daily expenditures for food and other necessity-type goods of $15 per worker and 250 work days per year.
Sources: U.S. Census Bureau; Bureau of Labor Statistics; International Council of Shopping Centers; Gruen Gruen + Associates.
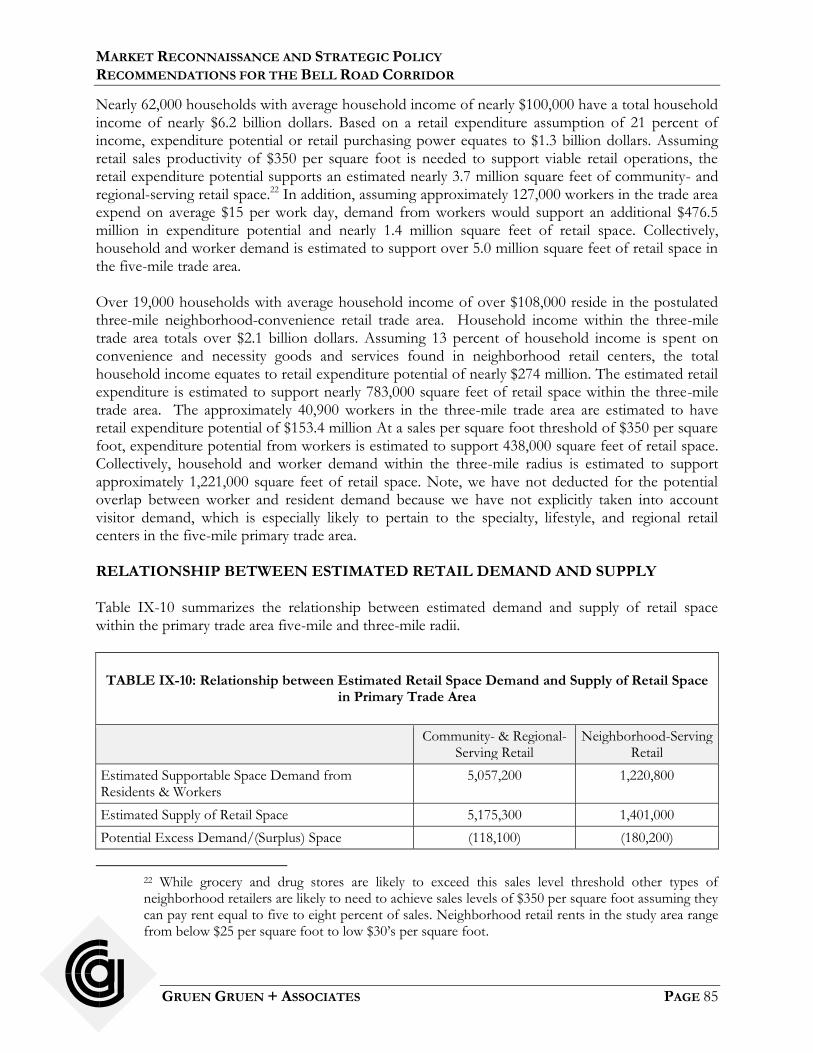
MARKET RECONNAISSANCE AND STRATEGIC POLICY RECOMMENDATIONS FOR THE BELL ROAD CORRIDOR
GRUEN GRUEN + ASSOCIATES PAGE 85
Nearly 62,000 households with average household income of nearly $100,000 have a total household income of nearly $6.2 billion dollars. Based on a retail expenditure assumption of 21 percent of income, expenditure potential or retail purchasing power equates to $1.3 billion dollars. Assuming retail sales productivity of $350 per square foot is needed to support viable retail operations, the retail expenditure potential supports an estimated nearly 3.7 million square feet of community- and regional-serving retail space.22 In addition, assuming approximately 127,000 workers in the trade area expend on average $15 per work day, demand from workers would support an additional $476.5 million in expenditure potential and nearly 1.4 million square feet of retail space. Collectively, household and worker demand is estimated to support over 5.0 million square feet of retail space in the five-mile trade area. Over 19,000 households with average household income of over $108,000 reside in the postulated three-mile neighborhood-convenience retail trade area. Household income within the three-mile trade area totals over $2.1 billion dollars. Assuming 13 percent of household income is spent on convenience and necessity goods and services found in neighborhood retail centers, the total household income equates to retail expenditure potential of nearly $274 million. The estimated retail expenditure is estimated to support nearly 783,000 square feet of retail space within the three-mile trade area. The approximately 40,900 workers in the three-mile trade area are estimated to have retail expenditure potential of $153.4 million At a sales per square foot threshold of $350 per square foot, expenditure potential from workers is estimated to support 438,000 square feet of retail space. Collectively, household and worker demand within the three-mile radius is estimated to support approximately 1,221,000 square feet of retail space. Note, we have not deducted for the potential overlap between worker and resident demand because we have not explicitly taken into account visitor demand, which is especially likely to pertain to the specialty, lifestyle, and regional retail centers in the five-mile primary trade area. RELATIONSHIP BETWEEN ESTIMATED RETAIL DEMAND AND SUPPLY Table IX-10 summarizes the relationship between estimated demand and supply of retail space within the primary trade area five-mile and three-mile radii.
TABLE IX-10: Relationship between Estimated Retail Space Demand and Supply of Retail Space
in Primary Trade Area
Community- & Regional-Serving Retail
Neighborhood-Serving Retail
Estimated Supportable Space Demand from Residents & Workers
5,057,200 1,220,800
Estimated Supply of Retail Space 5,175,300 1,401,000
Potential Excess Demand/(Surplus) Space (118,100) (180,200)
22 While grocery and drug stores are likely to exceed this sales level threshold other types of neighborhood retailers are likely to need to achieve sales levels of $350 per square foot assuming they can pay rent equal to five to eight percent of sales. Neighborhood retail rents in the study area range from below $25 per square foot to low $30’s per square foot.
MARKET RECONNAISSANCE AND STRATEGIC POLICY RECOMMENDATIONS FOR THE BELL ROAD CORRIDOR
GRUEN GRUEN + ASSOCIATES PAGE 86
Sources: U.S. Census Bureau; Bureau of Labor Statistics; International Council of Shopping Centers; Gruen Gruen + Associates.
In both trade areas, the relationship between demand and supply is relatively balanced. Additional retail space will need to be primarily supported by future growth in visitation associated with WestWorld making more full and intense use of its expanded facilities and growth in area employment. Growth in the neighborhoods nearest the City-owned land and WestWorld is likely to be far smaller than by the State-owned Crossroads East by Loop101 and Scottsdale Road. (The Windgate Ranch development has an estimated capacity to add 650 housing units but the other proximate master planned communities are significantly built-out). The relatively competitive conditions suggest the importance of linking support services and restaurants with proximate office space developments and discouraging the development of smaller freestanding stand-alone locations for retail space. Instead, encourage a smaller number of denser, more mixed-use, integrated uses that promote walking between compatible land uses. The results of the interviews and relationship found to apply to potential retail demand and supply suggest retail uses on or near City-owned land including eating and drinking establishments, and convenience services should be encouraged primarily to make WestWorld more appealing to visitors and to serve residents and workers in the area.

MARKET RECONNAISSANCE AND STRATEGIC POLICY RECOMMENDATIONS FOR THE BELL ROAD CORRIDOR
GRUEN GRUEN + ASSOCIATES PAGE 87
CHAPTER X: THE HOTEL MARKET CITY OF SCOTTSDALE HOTEL MARKET TRENDS Table X-1 shows number of hotel rooms in the City of Scottsdale and other broader market area hotels for the Phoenix region.
TABLE X-1: Hotel Inventory, 2004-20131
Year
City of Scottsdale # of Rooms
Other Market Area2 # of Rooms
Total # of Rooms
2004 8,848 6,001 14,849
2005 8,932 5,739 14,671
2006 9,021 6,243 15,264
2007 9,167 6,178 15,345
2008 9,444 6,793 16,237
2009 9,397 6,753 16,150
2010 9,354 7,237 16,591
2011 9,332 7,403 16,735
2012 9,378 7,380 16,758
2013 9,391 7,354 16,745
Percent Change 2004-2013
6.1% 22.5% 12.8%
1 Includes transient use properties with 25 or more rooms. 2 Including Town of Paradise Valley, Carefree, Fountain Hills, Phoenix, Tempe, and Salt River Pima Maricopa Indian Community.
Sources: City of Scottsdale; Gruen Gruen + Associates.
Scottsdale’s supply of hotel rooms has decreased as a proportion of all hotel rooms in the region over time. The City of Scottsdale’ room inventory has increased by approximately six percent from over 8,800 rooms in 2004 to approximately 9,400 rooms in 2013. Other market area hotels (outside of Scottsdale) have increased by 22 percent over the same period. This has resulted in the Scottsdale’s share of the region’s hotel inventory decreasing from about 60 percent in 2004 to 56 percent in 2013. Between 2004 and 2008, Scottsdale’s room inventory grew by nearly 600 rooms or about 43 percent of the region-wide room inventory growth during this period. Since 2008, Scottsdale’s hotel room inventory has remained stable as other areas outside of Scottsdale have increased room inventory by total of more than 500 rooms. Areas that have grown in hotel room inventory outside of but near Scottsdale include the Salt River Pima Maricopa Indian Community where the Talking Stick Resort (496 rooms), and Courtyard by Marriott (158 rooms), and Hampton
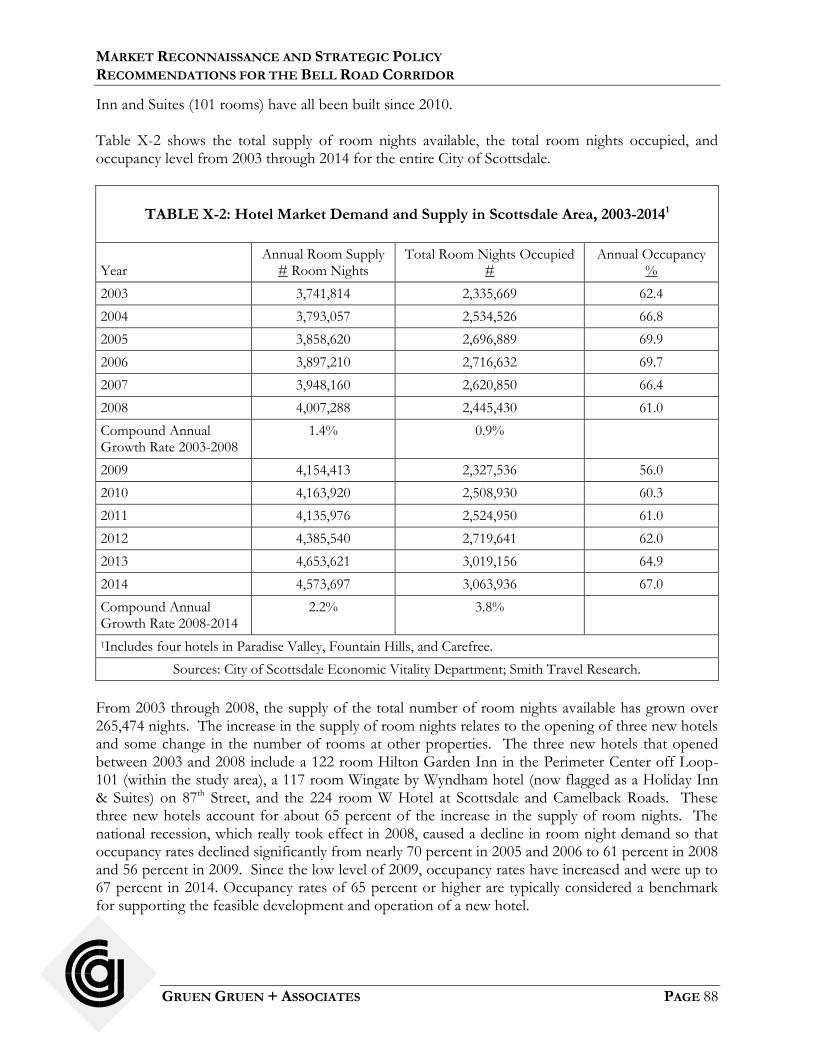
MARKET RECONNAISSANCE AND STRATEGIC POLICY RECOMMENDATIONS FOR THE BELL ROAD CORRIDOR
GRUEN GRUEN + ASSOCIATES PAGE 88
Inn and Suites (101 rooms) have all been built since 2010. Table X-2 shows the total supply of room nights available, the total room nights occupied, and occupancy level from 2003 through 2014 for the entire City of Scottsdale.
TABLE X-2: Hotel Market Demand and Supply in Scottsdale Area, 2003-20141
Year
Annual Room Supply # Room Nights
Total Room Nights Occupied #
Annual Occupancy %
2003 3,741,814 2,335,669 62.4
2004 3,793,057 2,534,526 66.8
2005 3,858,620 2,696,889 69.9
2006 3,897,210 2,716,632 69.7
2007 3,948,160 2,620,850 66.4
2008 4,007,288 2,445,430 61.0
Compound Annual Growth Rate 2003-2008
1.4% 0.9%
2009 4,154,413 2,327,536 56.0
2010 4,163,920 2,508,930 60.3
2011 4,135,976 2,524,950 61.0
2012 4,385,540 2,719,641 62.0
2013 4,653,621 3,019,156 64.9
2014 4,573,697 3,063,936 67.0
Compound Annual Growth Rate 2008-2014
2.2% 3.8%
1Includes four hotels in Paradise Valley, Fountain Hills, and Carefree.
Sources: City of Scottsdale Economic Vitality Department; Smith Travel Research.
From 2003 through 2008, the supply of the total number of room nights available has grown over 265,474 nights. The increase in the supply of room nights relates to the opening of three new hotels and some change in the number of rooms at other properties. The three new hotels that opened between 2003 and 2008 include a 122 room Hilton Garden Inn in the Perimeter Center off Loop-101 (within the study area), a 117 room Wingate by Wyndham hotel (now flagged as a Holiday Inn & Suites) on 87th Street, and the 224 room W Hotel at Scottsdale and Camelback Roads. These three new hotels account for about 65 percent of the increase in the supply of room nights. The national recession, which really took effect in 2008, caused a decline in room night demand so that occupancy rates declined significantly from nearly 70 percent in 2005 and 2006 to 61 percent in 2008 and 56 percent in 2009. Since the low level of 2009, occupancy rates have increased and were up to 67 percent in 2014. Occupancy rates of 65 percent or higher are typically considered a benchmark for supporting the feasible development and operation of a new hotel.
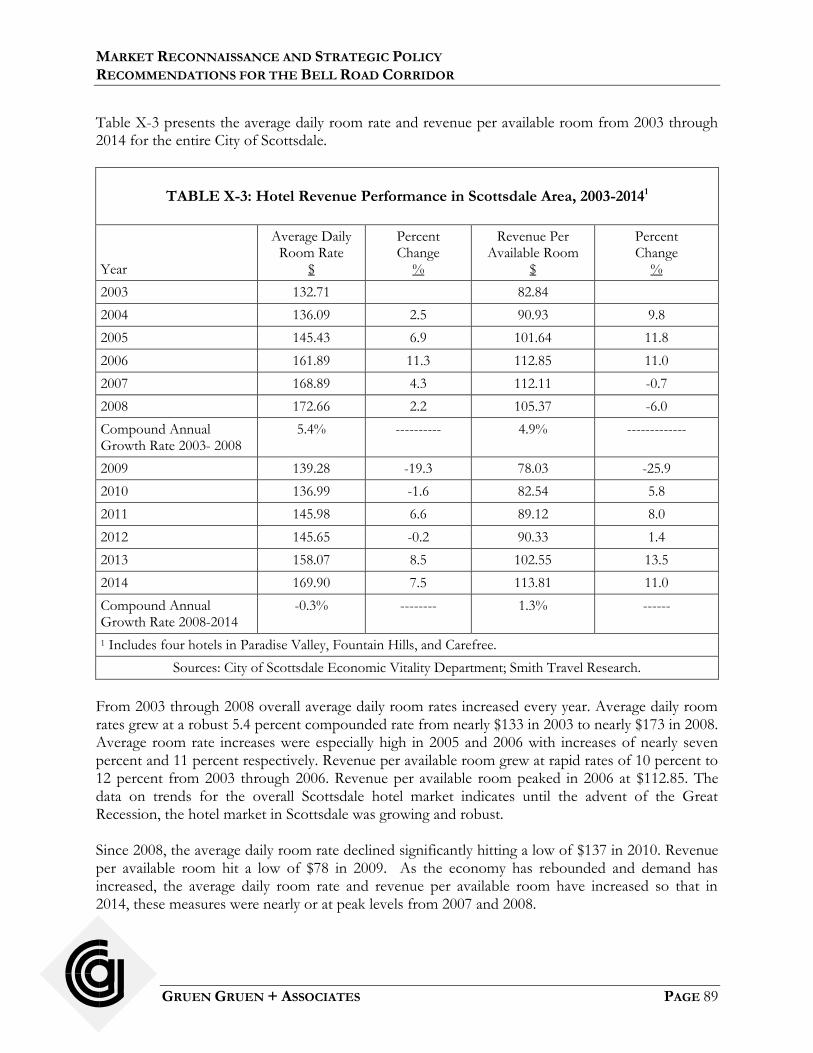
MARKET RECONNAISSANCE AND STRATEGIC POLICY RECOMMENDATIONS FOR THE BELL ROAD CORRIDOR
GRUEN GRUEN + ASSOCIATES PAGE 89
Table X-3 presents the average daily room rate and revenue per available room from 2003 through 2014 for the entire City of Scottsdale.
TABLE X-3: Hotel Revenue Performance in Scottsdale Area, 2003-20141
Year
Average Daily Room Rate
$
Percent Change
%
Revenue Per Available Room
$
Percent Change
%
2003 132.71 82.84
2004 136.09 2.5 90.93 9.8
2005 145.43 6.9 101.64 11.8
2006 161.89 11.3 112.85 11.0
2007 168.89 4.3 112.11 -0.7
2008 172.66 2.2 105.37 -6.0
Compound Annual Growth Rate 2003- 2008
5.4% ---------- 4.9% -------------
2009 139.28 -19.3 78.03 -25.9
2010 136.99 -1.6 82.54 5.8
2011 145.98 6.6 89.12 8.0
2012 145.65 -0.2 90.33 1.4
2013 158.07 8.5 102.55 13.5
2014 169.90 7.5 113.81 11.0
Compound Annual Growth Rate 2008-2014
-0.3% -------- 1.3% ------
1 Includes four hotels in Paradise Valley, Fountain Hills, and Carefree.
Sources: City of Scottsdale Economic Vitality Department; Smith Travel Research.
From 2003 through 2008 overall average daily room rates increased every year. Average daily room rates grew at a robust 5.4 percent compounded rate from nearly $133 in 2003 to nearly $173 in 2008. Average room rate increases were especially high in 2005 and 2006 with increases of nearly seven percent and 11 percent respectively. Revenue per available room grew at rapid rates of 10 percent to 12 percent from 2003 through 2006. Revenue per available room peaked in 2006 at $112.85. The data on trends for the overall Scottsdale hotel market indicates until the advent of the Great Recession, the hotel market in Scottsdale was growing and robust. Since 2008, the average daily room rate declined significantly hitting a low of $137 in 2010. Revenue per available room hit a low of $78 in 2009. As the economy has rebounded and demand has increased, the average daily room rate and revenue per available room have increased so that in 2014, these measures were nearly or at peak levels from 2007 and 2008.
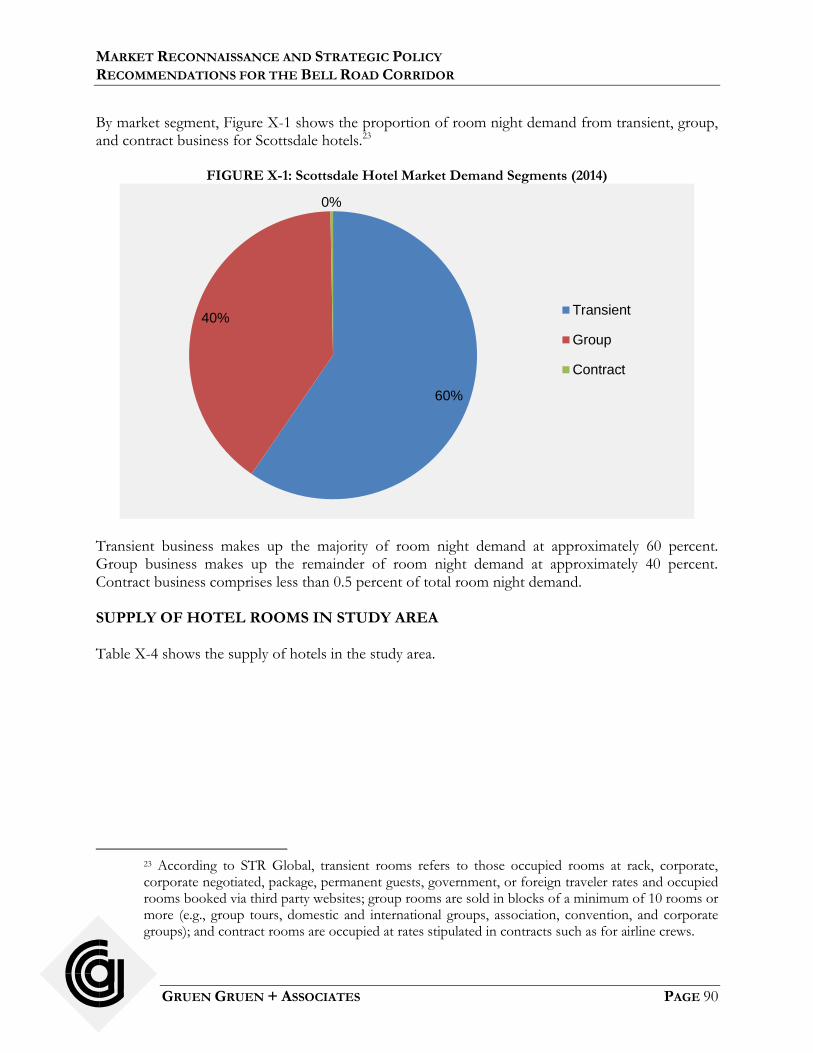
MARKET RECONNAISSANCE AND STRATEGIC POLICY RECOMMENDATIONS FOR THE BELL ROAD CORRIDOR
GRUEN GRUEN + ASSOCIATES PAGE 90
By market segment, Figure X-1 shows the proportion of room night demand from transient, group, and contract business for Scottsdale hotels.23
FIGURE X-1: Scottsdale Hotel Market Demand Segments (2014)
Transient business makes up the majority of room night demand at approximately 60 percent. Group business makes up the remainder of room night demand at approximately 40 percent. Contract business comprises less than 0.5 percent of total room night demand. SUPPLY OF HOTEL ROOMS IN STUDY AREA Table X-4 shows the supply of hotels in the study area.
23 According to STR Global, transient rooms refers to those occupied rooms at rack, corporate, corporate negotiated, package, permanent guests, government, or foreign traveler rates and occupied rooms booked via third party websites; group rooms are sold in blocks of a minimum of 10 rooms or more (e.g., group tours, domestic and international groups, association, convention, and corporate groups); and contract rooms are occupied at rates stipulated in contracts such as for airline crews.
60%
40%
0%
Transient
Group
Contract
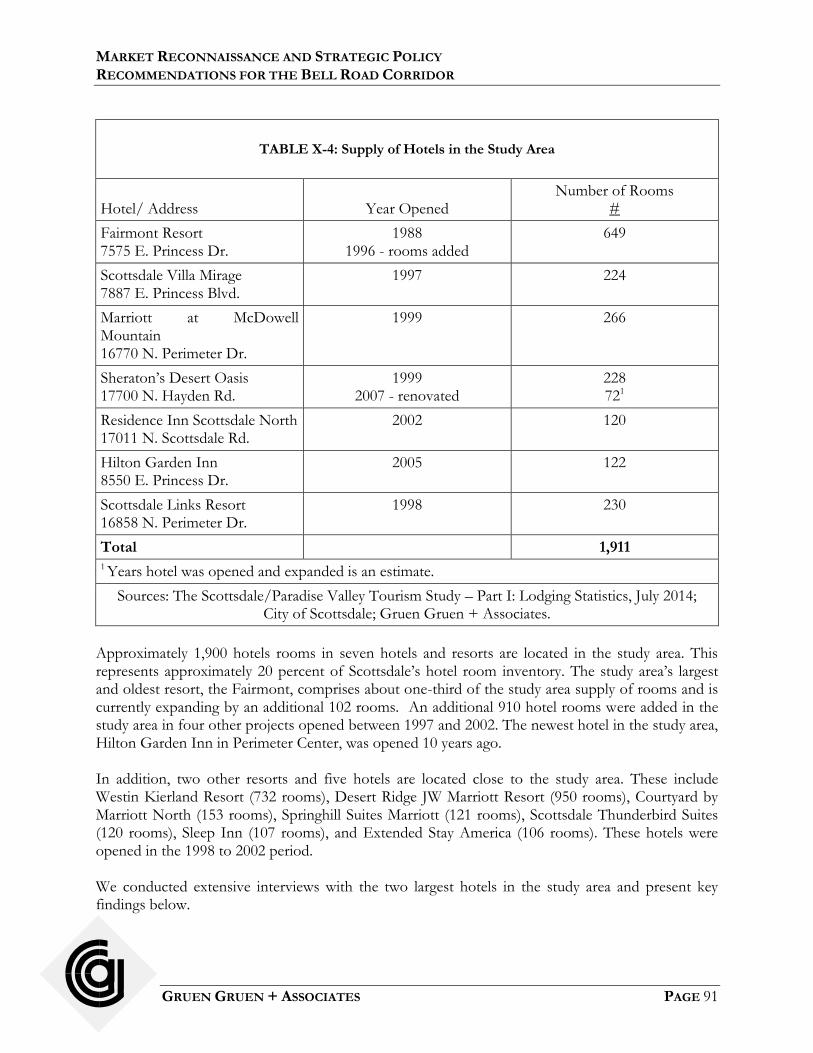
MARKET RECONNAISSANCE AND STRATEGIC POLICY RECOMMENDATIONS FOR THE BELL ROAD CORRIDOR
GRUEN GRUEN + ASSOCIATES PAGE 91
TABLE X-4: Supply of Hotels in the Study Area
Hotel/ Address
Year Opened
Number of Rooms #
Fairmont Resort 7575 E. Princess Dr.
1988 1996 - rooms added
649
Scottsdale Villa Mirage 7887 E. Princess Blvd.
1997 224
Marriott at McDowell Mountain 16770 N. Perimeter Dr.
1999 266
Sheraton’s Desert Oasis 17700 N. Hayden Rd.
1999 2007 - renovated
228 721
Residence Inn Scottsdale North 17011 N. Scottsdale Rd.
2002 120
Hilton Garden Inn 8550 E. Princess Dr.
2005 122
Scottsdale Links Resort 16858 N. Perimeter Dr.
1998 230
Total 1,911 1 Years hotel was opened and expanded is an estimate.
Sources: The Scottsdale/Paradise Valley Tourism Study – Part I: Lodging Statistics, July 2014; City of Scottsdale; Gruen Gruen + Associates.
Approximately 1,900 hotels rooms in seven hotels and resorts are located in the study area. This represents approximately 20 percent of Scottsdale’s hotel room inventory. The study area’s largest and oldest resort, the Fairmont, comprises about one-third of the study area supply of rooms and is currently expanding by an additional 102 rooms. An additional 910 hotel rooms were added in the study area in four other projects opened between 1997 and 2002. The newest hotel in the study area, Hilton Garden Inn in Perimeter Center, was opened 10 years ago. In addition, two other resorts and five hotels are located close to the study area. These include Westin Kierland Resort (732 rooms), Desert Ridge JW Marriott Resort (950 rooms), Courtyard by Marriott North (153 rooms), Springhill Suites Marriott (121 rooms), Scottsdale Thunderbird Suites (120 rooms), Sleep Inn (107 rooms), and Extended Stay America (106 rooms). These hotels were opened in the 1998 to 2002 period. We conducted extensive interviews with the two largest hotels in the study area and present key findings below.

MARKET RECONNAISSANCE AND STRATEGIC POLICY RECOMMENDATIONS FOR THE BELL ROAD CORRIDOR
GRUEN GRUEN + ASSOCIATES PAGE 92
Fairmont Scottsdale Princess The Fairmont Scottsdale Princess includes 650 rooms and 150,000 square feet of meeting space. The Fairmont doubled the meeting space capacity two years ago. The Fairmont also expanded rooms and renovated the property in 2008. It is currently in process of creating an 102 additional rooms by removing some tennis courts to accommodate the expansion. Major supply competitors are JW Marriott in Desert Ridge, Arizona Biltmore in Phoenix, Phoenician on Camelback Road in Scottsdale, the Westin by Kierland Commons, and the Hyatt Regency Scottsdale Resort and Spa at Gainey Ranch. The composition of supply competition has not changed. According to interviews with senior hotel managers in 2014 approximately 65-70 percent of demand was attributable to business/group travel while the balance was attributable to leisure travel. Area employers serve to generate room night demand. Local companies have sales conferences and other meetings which translate into room night demand. Local businesses may account for 20 percent of room night demand. Almost all of the businesses generating room night demand also use conference space. According to the Director of Sales, corporate accounts are less important in Scottsdale than larger markets. The Fairmont has a relatively limited number of corporate accounts which generate high volumes of room nights. Many of the local businesses have their visitors stay at lower-tier properties. The average length of stay is under two nights, which has not changed. The Mayo Clinic generates limited demand for room nights partly because hotels have been built at the Mayo Clinic. Other healthcare entities located in the area currently generate limited spillover demand for the Fairmont. The Barrett-Jackson Collector Car Auction and the Scottsdale Arabian Horse Show held at WestWorld generate some room night demand (but at times when the hotel would otherwise enjoy high occupancy rates) and the balance of events have not historically generated meaningful room night demand. Equestrian shows, even the Arabian Horse Show also have less impact for the Fairmont. High-end travelers with expensive horses, for example, frequently have luxury travel trailers. For the January through April season, the Fairmont experiences high occupancy rates and would do so in the absence of WestWorld. The importance of attracting groups applies to the May through December period (the primary events that generate hotel rooms are held in the peak season). Group demand has increased due to increase in meeting space. As a result average daily rates and occupancy rates have increased significantly since the depths of the Great Recession. The property enjoyed record results in 2014 and expects continued strong performance over the next several years. Given the expansion, of meeting space, the hotel is seeking to attract price sensitive associations and groups to have meetings over the summer months when less leisure and business demand occurs. The Fairmont used the Zona Hotel & Suites located near Princess Boulevard, just north of the Fairmont to house overflow demand from large groups but the Zona is being converted to a time share and will not be available to serve overflow demand. This is a competitive
MARKET RECONNAISSANCE AND STRATEGIC POLICY RECOMMENDATIONS FOR THE BELL ROAD CORRIDOR
GRUEN GRUEN + ASSOCIATES PAGE 93
disadvantage. To remedy this disadvantage in competing for groups and to respond to demand from a major corporate account and the Fairmont has embarked on the 102 room expansion referred to above. The managers cite disadvantages of the location include a limited selection of restaurants, support services, and amenities in a walkable environment outside of the resort itself. Supply competition such as the Westin possesses outside the hotels themselves better amenity packages in more pedestrian-friendly environments. Groups want services shopping, amenities etc. closer to the meeting hotel. The Fairmont competes with many other areas for large events, including San Diego, which is renowned for its temperate weather and beaches, Austin with its vibrant music scene, locations in Florida with its fishing, beaches, nightlife, family entertainment etc. The Fairmont takes group guests to dude ranches for “team building” exercises etc. and emphasizes the outdoors, scenic beauty, and
other features that distinguish the location from supply competition. Scottsdale Marriott at McDowell Mountains Built in 1999, the Scottsdale Marriott at McDowell Mountains includes 266 rooms and 15,000 square feet of meeting space. The amount of meeting space was expanded in 2012 by 4,000 square feet. An interview with a senior Marriott manager indicates that about 50 percent of room night demand is attributable to group business, 25 percent attributable to transient business demand, and 25 percent attributable to leisure travelers. Like the Fairmont, the manager of the Marriott reports having meeting space is critical to capturing local business demand. The Marriott manager reports that most of the demand generated by the Mayo clinic is captured on site. Compared to prior to the Great Recession, the hotel captures a greater number of smaller groups and fewer larger groups. Transient corporate room night demand is also increasing. Competitive disadvantages associated with the location are the same cited by the Fairmont managers. These include the limited selection of proximate services, restaurants and shopping walkable from the hotel. Downtown Scottsdale hotels and Westin at Kierland Commons, for example, are in more pedestrian-oriented, mixed-use environments that provide advantages to hotels located in such environments. Advantages include scenic views in a resort environment known as a resort destination. The Marriott enjoyed above market occupancy rates in 2014 and expects to maintain in high occupancy rates in 2015. The removal of the Zona Hotel & Suites from the hotel market inventory will tend to increase the occupancy rates for the remaining properties. While the Marriott would maintain viable occupancy and average daily rates in the absence of WestWorld, the major winter tourism events do help increase rates. The Marriott captures limited demand from visitors to the Barrett-Jackson and Arabian Horse Show events. Area hotels, however, cannot serve all of the peak event demand, while still serving demand from other sources. Some of the demand is served outside the Scottsdale market.
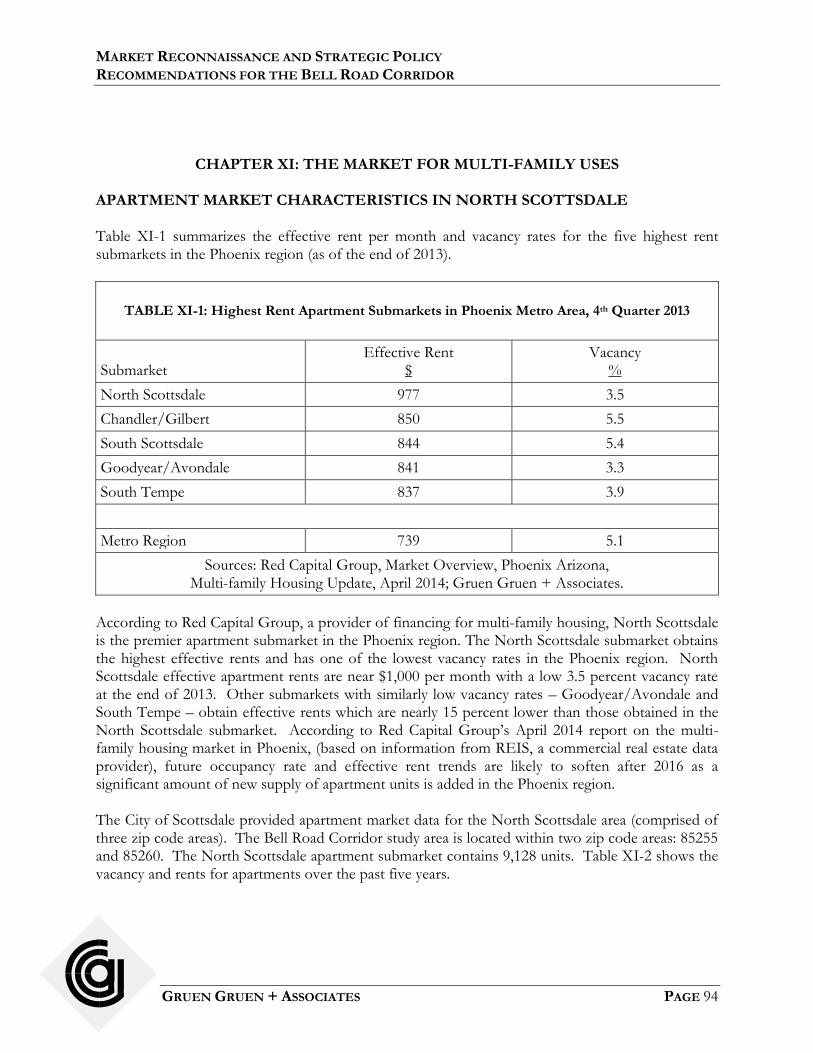
MARKET RECONNAISSANCE AND STRATEGIC POLICY RECOMMENDATIONS FOR THE BELL ROAD CORRIDOR
GRUEN GRUEN + ASSOCIATES PAGE 94
CHAPTER XI: THE MARKET FOR MULTI-FAMILY USES
APARTMENT MARKET CHARACTERISTICS IN NORTH SCOTTSDALE Table XI-1 summarizes the effective rent per month and vacancy rates for the five highest rent submarkets in the Phoenix region (as of the end of 2013).
TABLE XI-1: Highest Rent Apartment Submarkets in Phoenix Metro Area, 4th Quarter 2013
Submarket
Effective Rent $
Vacancy %
North Scottsdale 977 3.5
Chandler/Gilbert 850 5.5
South Scottsdale 844 5.4
Goodyear/Avondale 841 3.3
South Tempe 837 3.9
Metro Region 739 5.1
Sources: Red Capital Group, Market Overview, Phoenix Arizona, Multi-family Housing Update, April 2014; Gruen Gruen + Associates.
According to Red Capital Group, a provider of financing for multi-family housing, North Scottsdale is the premier apartment submarket in the Phoenix region. The North Scottsdale submarket obtains the highest effective rents and has one of the lowest vacancy rates in the Phoenix region. North Scottsdale effective apartment rents are near $1,000 per month with a low 3.5 percent vacancy rate at the end of 2013. Other submarkets with similarly low vacancy rates – Goodyear/Avondale and South Tempe – obtain effective rents which are nearly 15 percent lower than those obtained in the North Scottsdale submarket. According to Red Capital Group’s April 2014 report on the multi-family housing market in Phoenix, (based on information from REIS, a commercial real estate data provider), future occupancy rate and effective rent trends are likely to soften after 2016 as a significant amount of new supply of apartment units is added in the Phoenix region. The City of Scottsdale provided apartment market data for the North Scottsdale area (comprised of three zip code areas). The Bell Road Corridor study area is located within two zip code areas: 85255 and 85260. The North Scottsdale apartment submarket contains 9,128 units. Table XI-2 shows the vacancy and rents for apartments over the past five years.

MARKET RECONNAISSANCE AND STRATEGIC POLICY RECOMMENDATIONS FOR THE BELL ROAD CORRIDOR
GRUEN GRUEN + ASSOCIATES PAGE 95
TABLE XI-2: Inventory, Vacancy and Rent Characteristics of North Scottsdale Apartment Market,
2010-2014
Zip Code 852541 Zip Code 852552 Zip Code 85260
Number of Existing Units 2,861 1,673 4,594
Vacancy Rate (5 Year Average)
5.4% 5.3% 6.0%
Asking Rents (Current): 1 Br 2 Br 3 Br
$982 $1,181 $1,406
$1,212 $1,373 $1,783
$991 $1,194 $1,566
1 Includes portion of Phoenix, adjacent to Scottsdale. 2 Market report states 509 units are under construction which corresponds to Cascade Apartments at 18525 North Scottsdale and Jefferson on Legacy at 7340 East Legacy Blvd., both in Bell Road Corridor study area.
Sources: City of Scottsdale Economic Vitality; Gruen Gruen + Associates.
The North Scottsdale submarket’s apartment vacancy rate (over a five year average) ranges from 5.3 to 6.0 percent. Current monthly asking rents range from $982 to $1,212 for one-bedroom units, $1,181 to $1,373 for two-bedroom units, and $1,406 to $1,783 for three-bedroom units. The highest asking rents are in the 85255 zip code which includes two new projects currently under construction. Rents in the 85255 zip code area nearly 15 to over 20 percent higher than asking rents in the other two zip code areas. BELL ROAD CORRIDOR STUDY AREA APARTMENT MARKET CHARACTERISTICS AND TRENDS Table XI-3 shows the supply of existing apartment properties, number of units, and average monthly rent in the study area.

MARKET RECONNAISSANCE AND STRATEGIC POLICY RECOMMENDATIONS FOR THE BELL ROAD CORRIDOR
GRUEN GRUEN + ASSOCIATES PAGE 96
TABLE XI-3: Bell Road Corridor Study Area Existing Apartment Properties and Average Monthly
Rent, 2002-2015
Year
Number of Properties
#
Number of Units #
Average Monthly Rent $
2002 4 2,021 974
2003 4 2,021 999
2004 4 2,021 1,007
2005 5 2,223 1,000
2006 5 2,223 1,135
2007 5 2,223 1,132
2008 5 2,223 1,144
2009 5 2,223 1,078
2010 5 2,223 1,092
2011 5 2,223 1,048
2012 5 2,223 1,111
2013 5 2,223 1,095
2014 5 2,223 1,186
2015 6 2,443 1,261
Sources: Colliers; City of Scottsdale; Gruen Gruen + Associates.
In 2002, the study area contained four apartment projects with a total of 2,021 units, about 22 percent of the North Scottsdale apartment inventory. The four apartment projects were all built between 1998 and 2001. Desert Parks Vista, a 202-unit project opened in 2005. From 2005 to 2015, no new apartment supply was added in the study area. One project has recently been built in the study area. Camden Foothills, a 220 unit project, opened in early 2015. In addition, one project is under construction which combined will add another 187 apartments in the study area. The study area’s supply of apartment units has grown by 21 percent from about 2,000 units in 2002 to 2,400 units in 2015. Average monthly rent in the study area has increased by nearly 30 percent (on a non-inflation adjusted basis) from $974 in 2002 to $1,261 in 2015. Figure XI-1 shows the monthly rent per square foot and project age of the existing apartment projects in or near the study area.
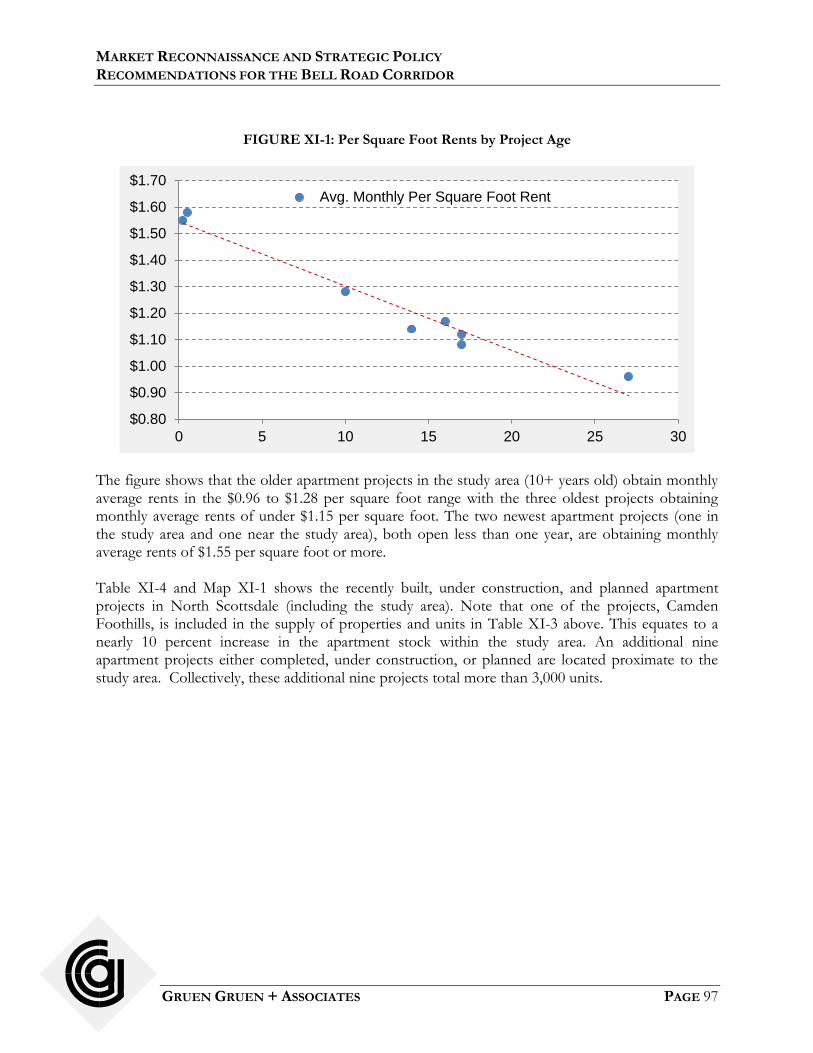
MARKET RECONNAISSANCE AND STRATEGIC POLICY RECOMMENDATIONS FOR THE BELL ROAD CORRIDOR
GRUEN GRUEN + ASSOCIATES PAGE 97
FIGURE XI-1: Per Square Foot Rents by Project Age
The figure shows that the older apartment projects in the study area (10+ years old) obtain monthly average rents in the $0.96 to $1.28 per square foot range with the three oldest projects obtaining monthly average rents of under $1.15 per square foot. The two newest apartment projects (one in the study area and one near the study area), both open less than one year, are obtaining monthly average rents of $1.55 per square foot or more. Table XI-4 and Map XI-1 shows the recently built, under construction, and planned apartment projects in North Scottsdale (including the study area). Note that one of the projects, Camden Foothills, is included in the supply of properties and units in Table XI-3 above. This equates to a nearly 10 percent increase in the apartment stock within the study area. An additional nine apartment projects either completed, under construction, or planned are located proximate to the study area. Collectively, these additional nine projects total more than 3,000 units.
$0.80
$0.90
$1.00
$1.10
$1.20
$1.30
$1.40
$1.50
$1.60
$1.70
0 5 10 15 20 25 30
Avg. Monthly Per Square Foot Rent
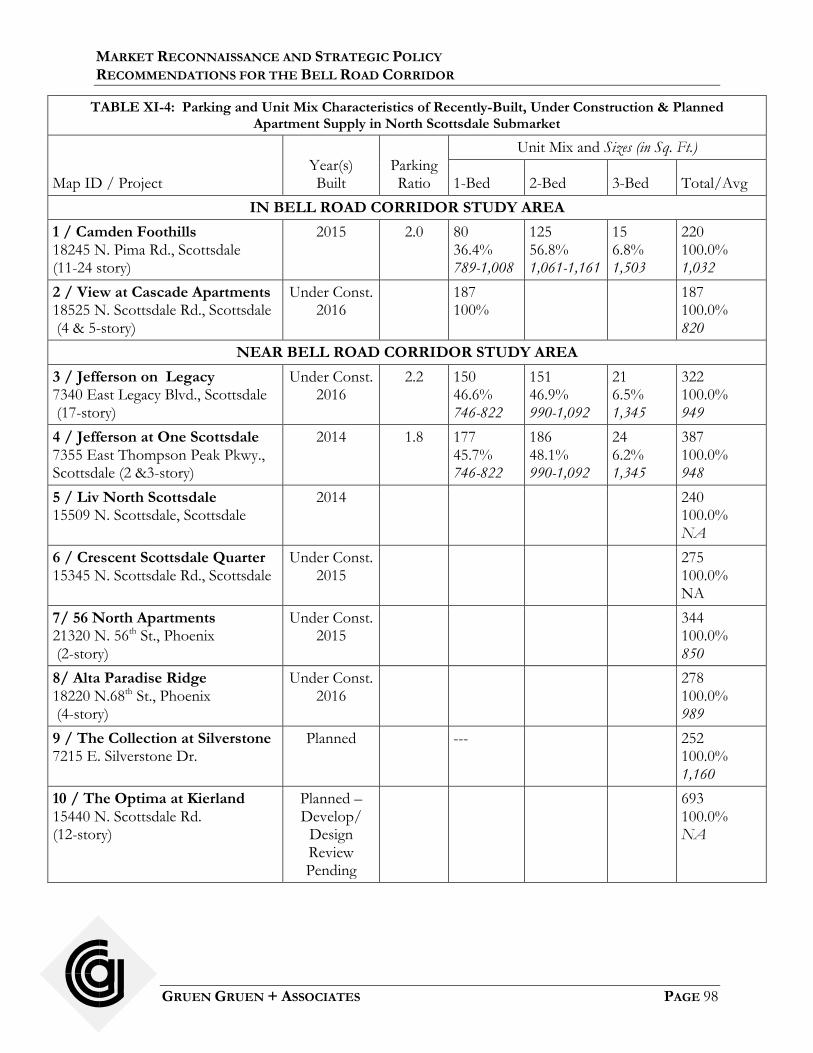
MARKET RECONNAISSANCE AND STRATEGIC POLICY RECOMMENDATIONS FOR THE BELL ROAD CORRIDOR
GRUEN GRUEN + ASSOCIATES PAGE 98
TABLE XI-4: Parking and Unit Mix Characteristics of Recently-Built, Under Construction & Planned Apartment Supply in North Scottsdale Submarket
Map ID / Project
Year(s) Built
Parking Ratio
Unit Mix and Sizes (in Sq. Ft.)
1-Bed 2-Bed 3-Bed Total/Avg
IN BELL ROAD CORRIDOR STUDY AREA
1 / Camden Foothills 18245 N. Pima Rd., Scottsdale (11-24 story)
2015 2.0 80 36.4% 789-1,008
125 56.8% 1,061-1,161
15 6.8% 1,503
220 100.0% 1,032
2 / View at Cascade Apartments 18525 N. Scottsdale Rd., Scottsdale (4 & 5-story)
Under Const. 2016
187 100%
187 100.0% 820
NEAR BELL ROAD CORRIDOR STUDY AREA
3 / Jefferson on Legacy 7340 East Legacy Blvd., Scottsdale (17-story)
Under Const. 2016
2.2 150 46.6% 746-822
151 46.9% 990-1,092
21 6.5% 1,345
322 100.0% 949
4 / Jefferson at One Scottsdale 7355 East Thompson Peak Pkwy., Scottsdale (2 &3-story)
2014 1.8 177 45.7% 746-822
186 48.1% 990-1,092
24 6.2% 1,345
387 100.0% 948
5 / Liv North Scottsdale 15509 N. Scottsdale, Scottsdale
2014 240 100.0% NA
6 / Crescent Scottsdale Quarter 15345 N. Scottsdale Rd., Scottsdale
Under Const. 2015
275 100.0% NA
7/ 56 North Apartments 21320 N. 56th St., Phoenix (2-story)
Under Const. 2015
344 100.0% 850
8/ Alta Paradise Ridge 18220 N.68th St., Phoenix (4-story)
Under Const. 2016
278 100.0% 989
9 / The Collection at Silverstone 7215 E. Silverstone Dr.
Planned ---
252 100.0% 1,160
10 / The Optima at Kierland 15440 N. Scottsdale Rd. (12-story)
Planned – Develop/
Design Review Pending
693 100.0% NA
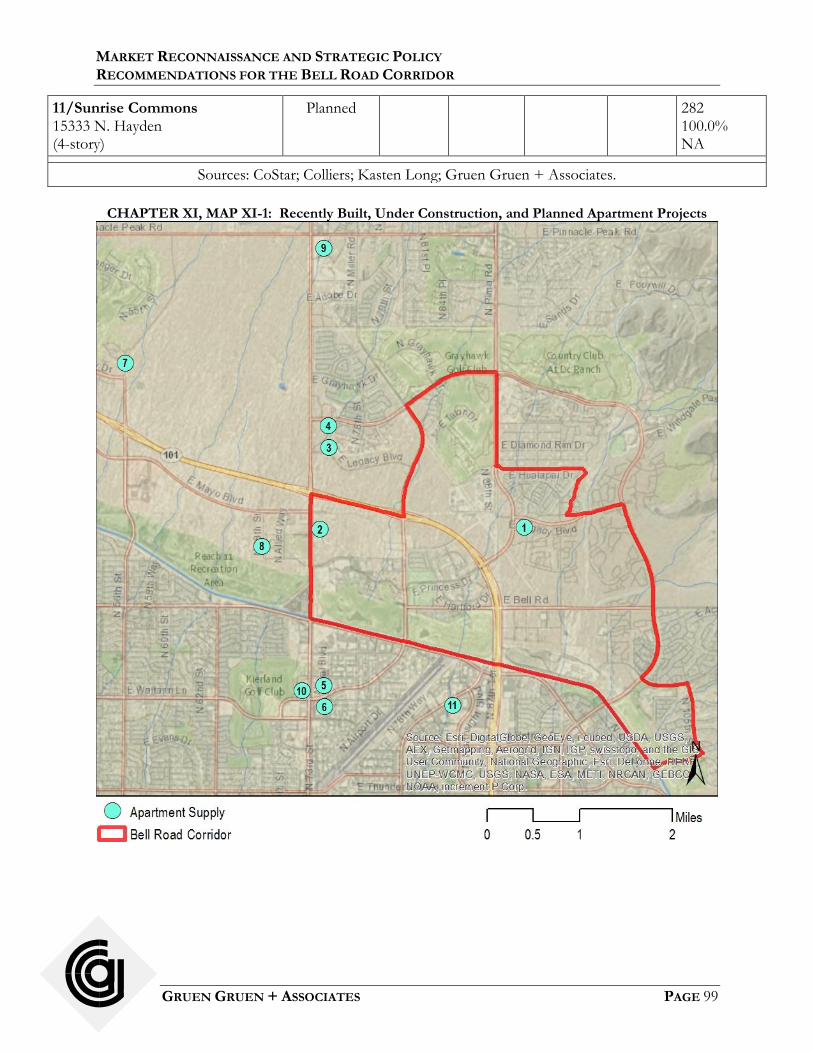
MARKET RECONNAISSANCE AND STRATEGIC POLICY RECOMMENDATIONS FOR THE BELL ROAD CORRIDOR
GRUEN GRUEN + ASSOCIATES PAGE 99
11/Sunrise Commons 15333 N. Hayden (4-story)
Planned 282 100.0% NA
Sources: CoStar; Colliers; Kasten Long; Gruen Gruen + Associates.
CHAPTER XI, MAP XI-1: Recently Built, Under Construction, and Planned Apartment Projects

MARKET RECONNAISSANCE AND STRATEGIC POLICY RECOMMENDATIONS FOR THE BELL ROAD CORRIDOR
GRUEN GRUEN + ASSOCIATES PAGE 100
ESTIMATED SUPPORTABLE DEMAND FOR POTENTIAL APARTMENT USE IN NORTH SCOTTSDALE DUE TO EMPLOYMENT GROWTH Demand for apartment units is likely to arise from millennials and older households. Employment growth and the need to house new workers is likely to be the most important determinant of demand. The recent severe recession particularly impacted millennials’ ability to find work, so that many returned to their parents’ homes or “doubled up” with friends in high density living relationships. As jobs become available for this group millennials are generating demand for apartments. Given the housing foreclosure crises has disenchanted many with the value of a home as an investment, and other factors, many millennials will opt to rent housing units for longer periods than did their boomer parents. Based on U.S. Census Bureau County Business Patterns data, total employment within a broader geographic area including Zip-Code areas 85260 and 85255 (portions of the Bell Road Corridor are located in each of these two zip codes) and Zip-Code area 85254, in 2013 is estimated at 85,000. This broader geographic area (North Scottsdale) has been adding an average of approximately 2,000 jobs per year during recovery from the recession. This equates to average annual growth of approximately three percent. Assuming employment growth continues to increase positively at approximately three percent annually would result in the employment in the North Scottsdale area increasing from approximately 85,000 workers in 2013 to approximately 104,500 workers in 2020. The gain in employment between 2015 (where estimated employment is approximately 90,200 workers) and 2020 is nearly 14,400 jobs. Table XI-5 presents an estimate of demand for apartment units in North Scottsdale based on employment growth forecast for North Scottsdale and assumptions about the jobs-housing ratio and proportion of new housing units demanded which are likely to be multi-family rental units.
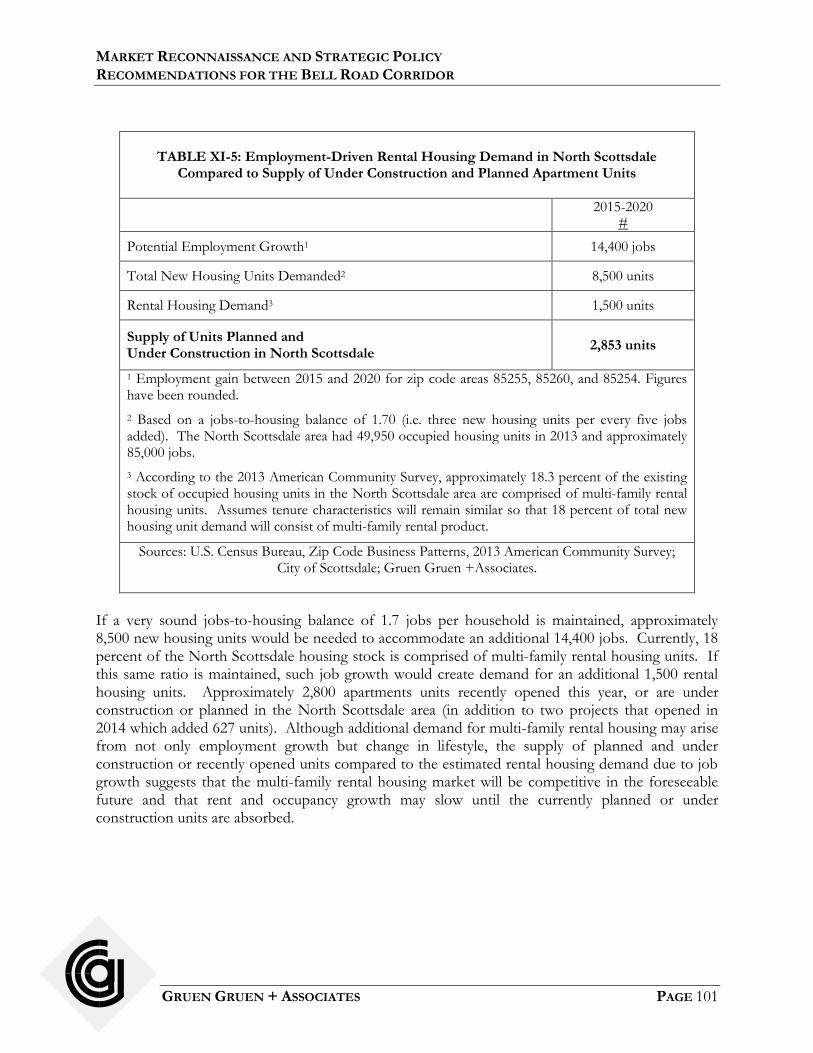
MARKET RECONNAISSANCE AND STRATEGIC POLICY RECOMMENDATIONS FOR THE BELL ROAD CORRIDOR
GRUEN GRUEN + ASSOCIATES PAGE 101
TABLE XI-5: Employment-Driven Rental Housing Demand in North Scottsdale
Compared to Supply of Under Construction and Planned Apartment Units
2015-2020 #
Potential Employment Growth1 14,400 jobs
Total New Housing Units Demanded2 8,500 units
Rental Housing Demand3 1,500 units
Supply of Units Planned and Under Construction in North Scottsdale
2,853 units
1 Employment gain between 2015 and 2020 for zip code areas 85255, 85260, and 85254. Figures have been rounded.
2 Based on a jobs-to-housing balance of 1.70 (i.e. three new housing units per every five jobs added). The North Scottsdale area had 49,950 occupied housing units in 2013 and approximately 85,000 jobs.
3 According to the 2013 American Community Survey, approximately 18.3 percent of the existing stock of occupied housing units in the North Scottsdale area are comprised of multi-family rental housing units. Assumes tenure characteristics will remain similar so that 18 percent of total new housing unit demand will consist of multi-family rental product.
Sources: U.S. Census Bureau, Zip Code Business Patterns, 2013 American Community Survey; City of Scottsdale; Gruen Gruen +Associates.
If a very sound jobs-to-housing balance of 1.7 jobs per household is maintained, approximately 8,500 new housing units would be needed to accommodate an additional 14,400 jobs. Currently, 18 percent of the North Scottsdale housing stock is comprised of multi-family rental housing units. If this same ratio is maintained, such job growth would create demand for an additional 1,500 rental housing units. Approximately 2,800 apartments units recently opened this year, or are under construction or planned in the North Scottsdale area (in addition to two projects that opened in 2014 which added 627 units). Although additional demand for multi-family rental housing may arise from not only employment growth but change in lifestyle, the supply of planned and under construction or recently opened units compared to the estimated rental housing demand due to job growth suggests that the multi-family rental housing market will be competitive in the foreseeable future and that rent and occupancy growth may slow until the currently planned or under construction units are absorbed.

MARKET RECONNAISSANCE AND STRATEGIC POLICY RECOMMENDATIONS FOR THE BELL ROAD CORRIDOR
GRUEN GRUEN + ASSOCIATES PAGE 102
OTHER RESIDENTIAL USES Interviews with representatives of home owner associations and land/residential brokers indicate that the Grayhawk, DC Ranch, McDowell Mountain Ranch and Windgate Ranch communities have relatively limited lot and single-family and condominium inventory left (less than 1,000 units). Approximately 150 vacant lots are currently available for sale in the Windgate Ranch Toll Brothers development with a potential future single family total of 650 additional units. The interviews suggest at 3.5 units per acre, single-family lots and assuming typical site development costs, single-family development could potentially support a land value of approximately $400,000 per acre. Standard Pacific is developing a 42-unit gated attached townhome project at Bell Road and Thompson Peak Parkway, west of the Windgate Crossing retail center. Asking prices range from approximately $470,000 to $570,000. The interviews suggest at eight units to the acre, a townhome type product with similar pricing could support a land value of approximately $600,000 per acre.
Gruen Gruen + Associates (GG+A) is a firm of economists, sociologists, statisticians and market, financial and fiscal analysts. Developers, public agencies, attorneys and others involved in real estate asset management utilize GG+A research and consulting to make and implement investment, marketing, product, pricing and legal support decisions The firm's staff has extensive experience and special training in the use of demographic analysis, survey research, econometrics, psychometrics and financial analysis to describe and forecast markets for a wide variety of real estate projects and economic activities. Since its founding in 1970, GG+A has pioneered the integration of behavioral research and econometric analysis to provide a sound foundation for successful land use policy and economic development actions. GG+A has also pioneered the use of economic, social and fiscal impact analysis. GG+A impact studies accurately and comprehensively portray the effects of public and private real estate developments, land use plans, regulations, annexations and assessments on the affected treasuries, taxpayers, consumers, other residents and property owners.
DENVER: CHICAGO: SAN FRANCISCO: (720) 583-2056 (847) 317-0634 (415) 432-4342