Compact Reconnaissance Imaging Spectrometer for Mars ... · Compact Reconnaissance Imaging...
15
Compact Reconnaissance Imaging Spectrometer for Mars observations of northern Martian latitudes in summer W. M. Calvin, 1 L. H. Roach, 2 F. P. Seelos, 3 K. D. Seelos, 3 R. O. Green, 4 S. L. Murchie, 3 and J. F. Mustard 2 Received 29 January 2009; revised 4 August 2009; accepted 21 August 2009; published 2 December 2009. [1] This paper brings together initial results obtained of the high northern latitudes in Mars years 28 and 29, between October 2006 and October 2008. These measurements confirm many previous models and shed new light on the nature of polar surface materials, particularly in intermediate-albedo units of the polar layered deposits, many of which are found to be ice-rich. We identify hydrated non ice materials present in many low- albedo troughs, as well as in the circumpolar erg that was previously associated with gypsum. We identify icy outlier deposits that may be related to subsurface thermophysical properties and permafrost. New observations of the gypsum-rich dune material constrain models for its formation and distribution. Intrinsic properties of ice content and grain size are found to be independent of the albedo of fine layered units and may provide a novel method for stratigraphic identification and correlation. Citation: Calvin, W. M., L. H. Roach, F. P. Seelos, K. D. Seelos, R. O. Green, S. L. Murchie, and J. F. Mustard (2009), Compact Reconnaissance Imaging Spectrometer for Mars observations of northern Martian latitudes in summer, J. Geophys. Res., 114, E00D11, doi:10.1029/2009JE003348. 1. Introduction [2] The north and south polar deposits and circumpolar materials preserve a record of current and recent Martian climate history. The residual ice and subjacent layered units may reflect the last few hundred thousand to few million years. Dune and mantling deposits around the northern polar layered deposits (PLD) span the entire Amazonian period, 3Ga to the present, and multiple sequences of deposition and erosion are recorded. Understanding the interaction between the current climate and residual ice caps will act as a ‘Rosetta stone’ which can be used to interpret the layered deposits in terms of the previous climates which formed them. This modern climate record is intimately tied to the migration pathways of the primary volatile species, CO 2 and H 2 O, and non ice con- taminants entrained in the seasonal and residual ice deposits. Recent observations of the permanent and sea- sonal polar caps have shown the complex dynamics involved in the layers active today and also the extent and consistency of layering in the polar caps themselves. Our observations extend and enhance these recent de- scriptions of the polar deposits through high-resolution compositional information of the various units of the PLD and surrounding terrains. [3] The layers of the northern PLD were recognized in Viking imagery [e.g., Cutts, 1973; Howard et al., 1982] and it was noted that the uppermost high-albedo surfaces were nearly coincident with lower albedo layered units, in contrast to the southern PLD. Viking and telescopic obser- vations demonstrated that the upper, ‘‘bright’’ surface was water ice and the albedo was most consistent with a coarse old water ice surface with a substantial portion of in- grained fines, sand or rocky materials (aka ‘‘dirt’’) [Kieffer et al., 1976; Clark and McCord, 1982; Kieffer, 1990]. Based on the lower albedo of the dark portions of the PLD these were inferred to be largely rocky material [Thomas et al., 1992]. Howard [2000] recognized a wide variety of frost streaks, either bright through the deposition of icy material or dark via removal of a frosty veneer, and these streaks exhibit a wide range of orientation and dynamics. He proposed that the major contribution to the deep troughs was ablation due to katabatic winds and solar insolation patterns, rather than ice cap flow, unlike terres- trial glaciers whose surface and interior morphology is strongly dependent on ice flow and deformation. The circumpolar dune field or ‘erg’ is the largest accumulation of dunes on Mars [Tsoar et al., 1979] and their inertias are lower than other low-albedo dunes [Herkenhoff and Vasavada, 1999]. [4] The Mars Global Surveyor complement of instru- ments enhanced our understanding of these regions through detailed topographic mapping [Zuber et al., 1998], high- resolution imagery [Malin and Edgett, 2001], and tempera- ture evolution [Kieffer and Titus, 2001]. The Mars Observer Laser Altimeter (MOLA) showed the extreme depths of the JOURNAL OF GEOPHYSICAL RESEARCH, VOL. 114, E00D11, doi:10.1029/2009JE003348, 2009 Click Here for Full Article 1 Department of Geological Sciences and Engineering, University of Nevada, Reno, Nevada, USA. 2 Department of Geological Sciences, Brown University, Providence, Rhode Island, USA. 3 Johns Hopkins University Applied Physics Laboratory, Laurel, Maryland, USA. 4 Jet Propulsion Laboratory, Pasadena, California, USA. Copyright 2009 by the American Geophysical Union. 0148-0227/09/2009JE003348$09.00 E00D11 1 of 15
Transcript of Compact Reconnaissance Imaging Spectrometer for Mars ... · Compact Reconnaissance Imaging...

Compact Reconnaissance Imaging Spectrometer for Mars
observations of northern Martian latitudes in summer
W. M. Calvin,1 L. H. Roach,2 F. P. Seelos,3 K. D. Seelos,3 R. O. Green,4 S. L. Murchie,3
and J. F. Mustard2
Received 29 January 2009; revised 4 August 2009; accepted 21 August 2009; published 2 December 2009.
[1] This paper brings together initial results obtained of the high northern latitudes inMars years 28 and 29, between October 2006 and October 2008. These measurementsconfirm many previous models and shed new light on the nature of polar surface materials,particularly in intermediate-albedo units of the polar layered deposits, many of whichare found to be ice-rich. We identify hydrated non ice materials present in many low-albedo troughs, as well as in the circumpolar erg that was previously associated withgypsum. We identify icy outlier deposits that may be related to subsurface thermophysicalproperties and permafrost. New observations of the gypsum-rich dune material constrainmodels for its formation and distribution. Intrinsic properties of ice content and grainsize are found to be independent of the albedo of fine layered units and may provide anovel method for stratigraphic identification and correlation.
Citation: Calvin, W. M., L. H. Roach, F. P. Seelos, K. D. Seelos, R. O. Green, S. L. Murchie, and J. F. Mustard (2009), Compact
Reconnaissance Imaging Spectrometer for Mars observations of northern Martian latitudes in summer, J. Geophys. Res., 114, E00D11,
doi:10.1029/2009JE003348.
1. Introduction
[2] The north and south polar deposits and circumpolarmaterials preserve a record of current and recent Martianclimate history. The residual ice and subjacent layered unitsmay reflect the last few hundred thousand to few millionyears. Dune and mantling deposits around the northernpolar layered deposits (PLD) span the entire Amazonianperiod, �3Ga to the present, and multiple sequences ofdeposition and erosion are recorded. Understanding theinteraction between the current climate and residual icecaps will act as a ‘Rosetta stone’ which can be used tointerpret the layered deposits in terms of the previousclimates which formed them. This modern climate recordis intimately tied to the migration pathways of theprimary volatile species, CO2 and H2O, and non ice con-taminants entrained in the seasonal and residual icedeposits. Recent observations of the permanent and sea-sonal polar caps have shown the complex dynamicsinvolved in the layers active today and also the extentand consistency of layering in the polar caps themselves.Our observations extend and enhance these recent de-scriptions of the polar deposits through high-resolution
compositional information of the various units of the PLDand surrounding terrains.[3] The layers of the northern PLD were recognized in
Viking imagery [e.g., Cutts, 1973; Howard et al., 1982]and it was noted that the uppermost high-albedo surfaceswere nearly coincident with lower albedo layered units, incontrast to the southern PLD. Viking and telescopic obser-vations demonstrated that the upper, ‘‘bright’’ surface waswater ice and the albedo was most consistent with a coarseold water ice surface with a substantial portion of in-grained fines, sand or rocky materials (aka ‘‘dirt’’) [Kiefferet al., 1976; Clark and McCord, 1982; Kieffer, 1990].Based on the lower albedo of the dark portions of the PLDthese were inferred to be largely rocky material [Thomas etal., 1992]. Howard [2000] recognized a wide variety offrost streaks, either bright through the deposition of icymaterial or dark via removal of a frosty veneer, and thesestreaks exhibit a wide range of orientation and dynamics.He proposed that the major contribution to the deeptroughs was ablation due to katabatic winds and solarinsolation patterns, rather than ice cap flow, unlike terres-trial glaciers whose surface and interior morphology isstrongly dependent on ice flow and deformation. Thecircumpolar dune field or ‘erg’ is the largest accumulationof dunes on Mars [Tsoar et al., 1979] and their inertiasare lower than other low-albedo dunes [Herkenhoff andVasavada, 1999].[4] The Mars Global Surveyor complement of instru-
ments enhanced our understanding of these regions throughdetailed topographic mapping [Zuber et al., 1998], high-resolution imagery [Malin and Edgett, 2001], and tempera-ture evolution [Kieffer and Titus, 2001]. The Mars ObserverLaser Altimeter (MOLA) showed the extreme depths of the
JOURNAL OF GEOPHYSICAL RESEARCH, VOL. 114, E00D11, doi:10.1029/2009JE003348, 2009ClickHere
for
FullArticle
1Department of Geological Sciences and Engineering, University ofNevada, Reno, Nevada, USA.
2Department of Geological Sciences, Brown University, Providence,Rhode Island, USA.
3Johns Hopkins University Applied Physics Laboratory, Laurel,Maryland, USA.
4Jet Propulsion Laboratory, Pasadena, California, USA.
Copyright 2009 by the American Geophysical Union.0148-0227/09/2009JE003348$09.00
E00D11 1 of 15

troughs into the bulk of the PLD deposit, as well as theabsolute height profile and upper surface contour [Zuber etal., 1998]. The Mars Observer Camera (MOC) showednumerous fine scale layers and enabled a number of detailedstudies of the stratigraphy [e.g., Byrne and Murray, 2002;Edgett et al., 2003; Fishbaugh and Head, 2005; Fishbaughand Hvidberg, 2006] and the first attempts to find strati-graphic correlations across different regions of the PLD andto identify layer patterns that are coupled to the climatecycles [Laskar et al., 2002; Milkovich and Head, 2005;Levrard et al., 2007]. Attempts to model Viking camera andMOC albedo in terms of ice content concentrated on thebrighter units and were limited by the absolute calibration ofthe cameras [Hale et al., 2005; Benson and James, 2005;Bass et al., 2000]. Estimates of the volume percent of nonice material derived from these studies were consistent withearlier models. The Thermal Emission Spectrometer (TES)albedo and spectral measurements showed seasonal evolu-tion of albedo and the presence of both sustained andvariable bright patches [Kieffer and Titus, 2001; Calvinand Titus, 2008].[5] The major contribution to our understanding of
northern polar volatiles from the Odyssey mission wasgleaned from the Gamma ray and neutron spectroscopymeasurements that showed significant enhancement inhydrogen poleward of 60� latitude, and large concentra-tions, inferred to be buried permafrost, beyond the visualextent of the PLD [Boynton et al., 2002; Feldman et al.,2004]. For the north polar region, THEMIS data were usedto identify a water ice collar on the retreating seasonal cap[Wagstaff et al., 2008].[6] Spectroscopy in the wavelengths of reflected solar
radiation (0.4 to 5 mm, for the coldest polar temperatures onMars) is ideally suited to the discrimination of water icefrom carbon dioxide ice. The OMEGA instrument on MarsExpress provided a synoptic view of seasonal changes in thenorthern polar ices, noting midsummer removal of earlyfine-grained frosts and the sustained presence of smallpatches of fine-grained water ice [Langevin et al., 2005a].In addition, OMEGA discovered gypsum deposits in thenorth polar erg [Langevin et al., 2005b].[7] The Compact Reconnaissance Imaging Spectrometer
for Mars (CRISM) can amplify these observations andinterpretations through high spatial resolution mappingof the polar units and surrounding material. This paperbrings together initial results obtained in the early portion ofthe Mars Reconnaissance Orbiter (MRO) Primary SciencePhase (PSP) observations from October 2006 to January2007, Ls 130� to 180� in Mars Year 28 (MY 28) and selectedobservations from the following northern summer, July2008 to October 2008, Ls 95�–145� in MY 29. Each ofthe topical areas is the subject of detailed ongoing analysisand future focused reports. The measurements describedhere confirm many previous models and shed new light onthe nature of materials, particularly in intermediate albedounits of the PLD, many of which are found to be ice-rich.We identify icy outlier deposits that may be related tosubsurface thermophysical properties (i.e., permafrost).New observations of the gypsum-rich dune material con-strain models for its formation and distribution. Intrinsicproperties of ice content and grain size are found to beindependent of the albedo of fine layered units and may
provide a novel method for stratigraphic identification andcorrelation.
2. Observation Summary
[8] CRISM is a visible and near infrared hyperspectralimager with 544 channels from 0.362 to 3.920 mm (6.55 nmspectral sampling). The instrument has two primary dataacquisition modes: a gimbaled or targeted hyperspectralmode that acquires 544 channel high spatial resolution dataat�20 or�40 m/pixel and a push broom mode that acquiresa 72 channel spectral subset at �100 or �200 m/pixel.Gimbaled observation types include Full Resolution Tar-geted (FRT) and Half-Resolution Long (HRL) or Short(HRS) which differ in spatial resolution and down-trackcoverage (�10 or �20 km). Push broom observation typesinclude Multispectral Survey (MSP, 200 m/pixel) andMultispectral Window (MSW, 100 m/pixel) that can bothbe acquired with down-track coverage of �45, �180, or�540 km [Murchie et al., 2007]. All CRISM observationshave �10 km coverage cross track. The MRO PrimaryScience Phase (PSP) began at Ls � 130� allowing forsignificant data acquisition at the high northern latitudesin advance of deteriorating atmospheric and illuminationconditions. As a result of early PSP science priorities andoperational constraints, the majority of the CRISM dataacquired at that time were MSP, although a handful of FRT,HRS and HRL observations were acquired at high northernlatitudes.
2.1. MSP North Polar Mosaics
[9] Early in MRO PSP the spacecraft was restricted to anadir observing geometry on 50% of the available scienceorbits to facilitate systematic campaign observations. TheCRISM multispectral survey campaign observation strategyis designed to acquire a near-global map using the MSP dataacquisition mode. CRISM survey observations early in PSPtypically took the form of three minute segments scheduledin series on the dedicated campaign orbits. Multispectralsurvey data are also acquired on unrestricted orbits on anoninterference basis subject to operational and scheduleconstraints. The 72 wavelengths in a CRISM multispectralobservation consist of a subset of the hyperspectral wave-lengths carefully selected to maintain sufficient spectralsampling of key surface and atmospheric absorptions. Thisallows a robust set of spectral summary parameters to becalculated from multispectral data [Pelkey et al., 2007]. Thehigh mapping survey coverage density near the poles allowsfor the generation of a nearly complete multispectral surveymosaic for the north polar residual cap and the surroundingterrain (>75� latitude). The north polar mapping mosaicswere created from an Ls range of 95 to 180 degrees intwo Mars years. Individual mapping strips are converted toapparent I/F using standard pipeline processing, photomet-rically corrected using a Lambert assumption, and correctedfor atmospheric gas absorptions using an empirical trans-mission spectrum derived from observations over OlympusMons. Summary parameters are then calculated from thecorrected reflectance data. These processed strips and bandparameter maps are projected using spacecraft orientationinformation and then mosaicked using custom registrationsoftware [Murchie et al., 2009a]. The spacecraft and instru-
E00D11 CALVIN ET AL.: CRISM NORTH POLE SUMMER
2 of 15
E00D11
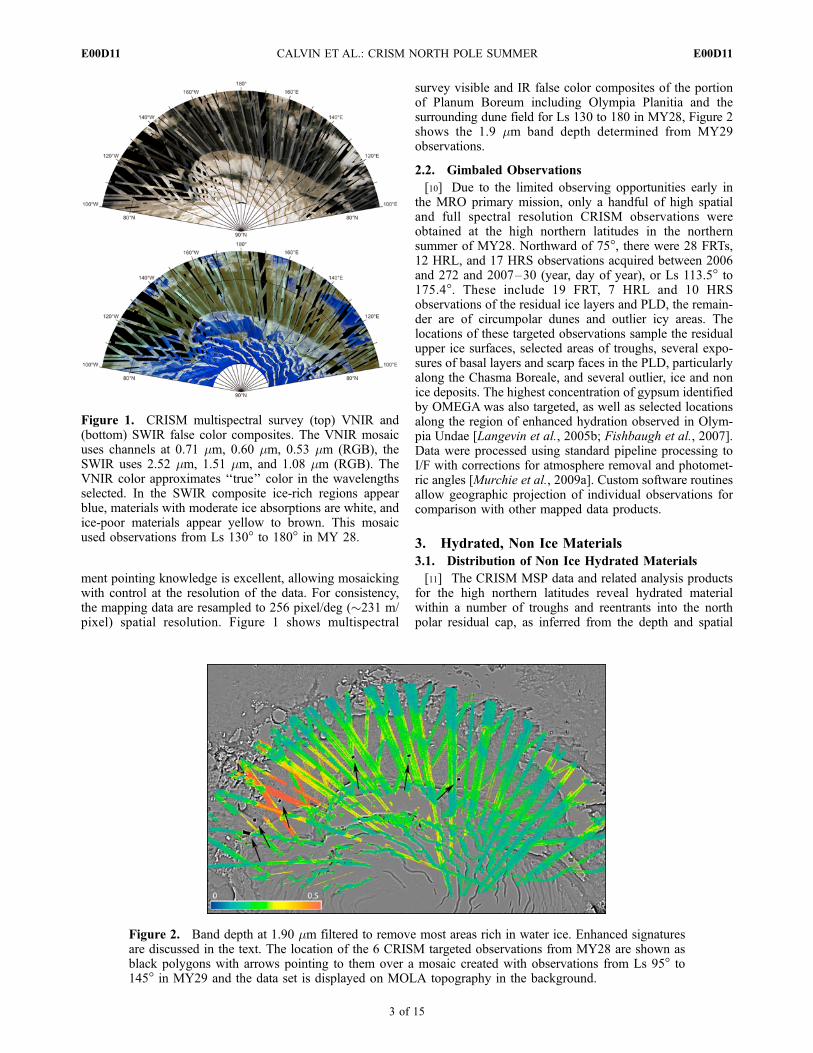
ment pointing knowledge is excellent, allowing mosaickingwith control at the resolution of the data. For consistency,the mapping data are resampled to 256 pixel/deg (�231 m/pixel) spatial resolution. Figure 1 shows multispectral
survey visible and IR false color composites of the portionof Planum Boreum including Olympia Planitia and thesurrounding dune field for Ls 130 to 180 in MY28, Figure 2shows the 1.9 mm band depth determined from MY29observations.
2.2. Gimbaled Observations
[10] Due to the limited observing opportunities early inthe MRO primary mission, only a handful of high spatialand full spectral resolution CRISM observations wereobtained at the high northern latitudes in the northernsummer of MY28. Northward of 75�, there were 28 FRTs,12 HRL, and 17 HRS observations acquired between 2006and 272 and 2007–30 (year, day of year), or Ls 113.5� to175.4�. These include 19 FRT, 7 HRL and 10 HRSobservations of the residual ice layers and PLD, the remain-der are of circumpolar dunes and outlier icy areas. Thelocations of these targeted observations sample the residualupper ice surfaces, selected areas of troughs, several expo-sures of basal layers and scarp faces in the PLD, particularlyalong the Chasma Boreale, and several outlier, ice and nonice deposits. The highest concentration of gypsum identifiedby OMEGA was also targeted, as well as selected locationsalong the region of enhanced hydration observed in Olym-pia Undae [Langevin et al., 2005b; Fishbaugh et al., 2007].Data were processed using standard pipeline processing toI/F with corrections for atmosphere removal and photomet-ric angles [Murchie et al., 2009a]. Custom software routinesallow geographic projection of individual observations forcomparison with other mapped data products.
3. Hydrated, Non Ice Materials
3.1. Distribution of Non Ice Hydrated Materials
[11] The CRISM MSP data and related analysis productsfor the high northern latitudes reveal hydrated materialwithin a number of troughs and reentrants into the northpolar residual cap, as inferred from the depth and spatial
Figure 1. CRISM multispectral survey (top) VNIR and(bottom) SWIR false color composites. The VNIR mosaicuses channels at 0.71 mm, 0.60 mm, 0.53 mm (RGB), theSWIR uses 2.52 mm, 1.51 mm, and 1.08 mm (RGB). TheVNIR color approximates ‘‘true’’ color in the wavelengthsselected. In the SWIR composite ice-rich regions appearblue, materials with moderate ice absorptions are white, andice-poor materials appear yellow to brown. This mosaicused observations from Ls 130� to 180� in MY 28.
Figure 2. Band depth at 1.90 mm filtered to remove most areas rich in water ice. Enhanced signaturesare discussed in the text. The location of the 6 CRISM targeted observations from MY28 are shown asblack polygons with arrows pointing to them over a mosaic created with observations from Ls 95� to145� in MY29 and the data set is displayed on MOLA topography in the background.
E00D11 CALVIN ET AL.: CRISM NORTH POLE SUMMER
3 of 15
E00D11

coherency of the 1.9 mm absorption band. Figure 2 showsthis hydration signature filtered to remove those regions richin water ice for the area adjacent to Olympia Planitia, asmodified from Horgan et al. [2009]. The parameter seeks toisolate the 1.928 mm band depth due to hydrated materialsfrom the broader �2 mm water ice absorption in locationswhere both water ice and hydrated materials are present.First, a continuum is calculated from the shoulders of the�2 mm water ice absorption and removed to compensate forthe negative slope. The hydration signature is measured asthe excess 1.928 mm absorption after water ice continuumremoval. Theoretically, water ice should have a symmetricalabsorption over that wavelength region, so it will not affectthe continuum removal or the excess 1.928 mm band depth.In practice, the multispectral CRISM wavelengths availablefor constructing the continuum are not exactly symmetricaround the �2 mm water ice absorption, so a slight compo-nent of water ice is included in the resulting hydrationparameter. This is most evident around high-albedo iceoutliers around 120E and equatorward of 70N.
Hydration parameter ¼ 1� CR1928=CR2119
CR1928 ¼ R1928R2205�R1809ð Þ= 2:205�1:809ð Þ* 1:928� 1:809ð Þ
( )þR1809
CR2119 ¼ R2119R2205�R1809ð Þ= 2:205�1:809ð Þ* 2:119� 1:809ð Þ
( )þR1809
where CR1928 is the continuum-removed reflectance at1.928 mm, R1928 is the reflectance at 1.928 mm, etc., and anumber without a letter prefix refers to the wavelengthvalue.[12] The hydration signature is most commonly associated
with low-albedo dunes, both in the vicinity of the OlympiaUndae gypsum-bearing sand sea, and in distant polar cap
reentrants. In particular, non ice hydrated material is iden-tified in the Boreales Scopuli adjacent to Olympia Rupes(using nomenclature of Tanaka et al. [2008]), but is com-mon in reentrants and troughs, as also observed in lowerresolution using OMEGA data by Horgan et al. [2009]. Thedetailed analysis of high-resolution hyperspectral CRISMobservations of hydrated materials in the vicinity of thenorth polar residual cap is ongoing and will be the subject offuture papers focused on these regions.
3.2. Gypsum
[13] Targeted CRISM observations at 21–43 m/pixelalong Olympia Undae characterize the gypsum spectralsignature in the dunes and allow speculation into thelocation of the gypsum source region. Six targeted obser-vations from MY28 and seven from MY29 covering Olym-pia Undae and its geologic contacts were analyzed for thisstudy. Figure 2 shows the distribution of CRISM targetedobservations from MY28 designed to explore the variationof hydration along the arc of hydration noted by OMEGA[Langevin et al., 2005b]. Figure 3 shows a close-up ofthe Olympia Undae region of highest hydration signaturetogether with MY28 and MY29 CRISM observations in-cluding in this study. In order to clarify the positions andlocations of these and other materials we refer to the units asidentified by Tanaka et al. [2008]. Using the Tanaka et al.[2008] nomenclature, CRISM observations were concen-trated along contacts between ABou and underlying polarunits.[14] The distinguishing absorption features of gypsum are
a triplet absorption between 1.44 and 1.54 mm, absorptionsat 1.75 mm and 1.9 mm, and a doublet absorption at 2.25 and2.265 mm, all due to combinations and overtones of H2Ovibrations and librations [Hunt et al., 1971; Cloutis et al.,2006]. Gypsum was identified in CRISM spectra by a wide�2.2 mm absorption, often with a resolvable doublet, and adrop off after 2.4 mm diagnostic of polyhydrated sulfates. Asmall absorption at 1.75 mm is also usually present. Atmo-spheric CO2 absorptions complicate interpreting the 1.9 mmfeature.
Figure 3. (left) Subset of select CRISM targeted observations over the region of Olympia Undae withthe strongest hydration signature in OMEGA (brown colors). OMEGA hydration signature in color overthe Mars Digital Image Mosaic. CRISM observations are from MY 28 (black outline) and MY29 (blueoutline). (right) The same CRISM observational footprints over the geologic unit map modified fromTanaka et al. [2005] to include revisions from Tanaka et al. [2008].
E00D11 CALVIN ET AL.: CRISM NORTH POLE SUMMER
4 of 15
E00D11
3.2.1. Distribution[15] Targeted observations were analyzed to study changes
in gypsum signature concentration. They showed a generaldecrease in the overall strength of the gypsum signaturewith clockwise distance along Olympia Undae. This trendis not due to differences in the relative areas covered bygypsum-rich dune crests and interdune substrate exposures[Lahtela et al., 2009]. The gypsum signature decrease in adownwind direction from Chasma Boreal is consistent withaeolian transport of gypsum or its sulfur-rich precursormaterials.[16] The deepest hydration bands and strongest gypsum-
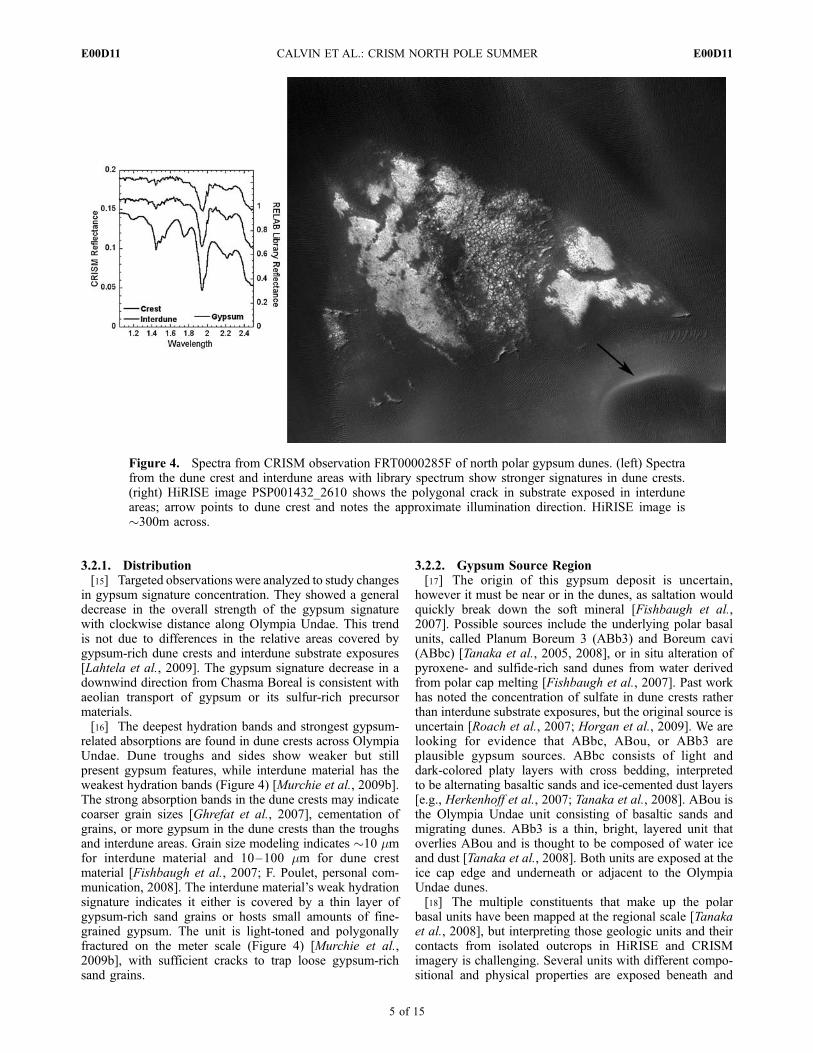
related absorptions are found in dune crests across OlympiaUndae. Dune troughs and sides show weaker but stillpresent gypsum features, while interdune material has theweakest hydration bands (Figure 4) [Murchie et al., 2009b].The strong absorption bands in the dune crests may indicatecoarser grain sizes [Ghrefat et al., 2007], cementation ofgrains, or more gypsum in the dune crests than the troughsand interdune areas. Grain size modeling indicates �10 mmfor interdune material and 10–100 mm for dune crestmaterial [Fishbaugh et al., 2007; F. Poulet, personal com-munication, 2008]. The interdune material’s weak hydrationsignature indicates it either is covered by a thin layer ofgypsum-rich sand grains or hosts small amounts of fine-grained gypsum. The unit is light-toned and polygonallyfractured on the meter scale (Figure 4) [Murchie et al.,2009b], with sufficient cracks to trap loose gypsum-richsand grains.
3.2.2. Gypsum Source Region[17] The origin of this gypsum deposit is uncertain,
however it must be near or in the dunes, as saltation wouldquickly break down the soft mineral [Fishbaugh et al.,2007]. Possible sources include the underlying polar basalunits, called Planum Boreum 3 (ABb3) and Boreum cavi(ABbc) [Tanaka et al., 2005, 2008], or in situ alteration ofpyroxene- and sulfide-rich sand dunes from water derivedfrom polar cap melting [Fishbaugh et al., 2007]. Past workhas noted the concentration of sulfate in dune crests ratherthan interdune substrate exposures, but the original source isuncertain [Roach et al., 2007; Horgan et al., 2009]. We arelooking for evidence that ABbc, ABou, or ABb3 areplausible gypsum sources. ABbc consists of light anddark-colored platy layers with cross bedding, interpretedto be alternating basaltic sands and ice-cemented dust layers[e.g., Herkenhoff et al., 2007; Tanaka et al., 2008]. ABou isthe Olympia Undae unit consisting of basaltic sands andmigrating dunes. ABb3 is a thin, bright, layered unit thatoverlies ABou and is thought to be composed of water iceand dust [Tanaka et al., 2008]. Both units are exposed at theice cap edge and underneath or adjacent to the OlympiaUndae dunes.[18] The multiple constituents that make up the polar
basal units have been mapped at the regional scale [Tanakaet al., 2008], but interpreting those geologic units and theircontacts from isolated outcrops in HiRISE and CRISMimagery is challenging. Several units with different compo-sitional and physical properties are exposed beneath and
Figure 4. Spectra from CRISM observation FRT0000285F of north polar gypsum dunes. (left) Spectrafrom the dune crest and interdune areas with library spectrum show stronger signatures in dune crests.(right) HiRISE image PSP001432_2610 shows the polygonal crack in substrate exposed in interduneareas; arrow points to dune crest and notes the approximate illumination direction. HiRISE image is�300m across.
E00D11 CALVIN ET AL.: CRISM NORTH POLE SUMMER
5 of 15
E00D11

between the ABou dunes. They include ABs, ABrt, ABbc,and ABb3.[19] The bright, meter-scale polygonally fractured material
exposed in interdune areas shown in Figure 4 we interpret asABb3, presumably dusty water ice. In that case, the hydra-tion signature would be more due to water ice than gypsum.A more detailed discussion of the spectral character ofABb3 appears in section IV.B.2. Another contact betweenABou and ABb3 is seen in HRS0000C074 (Figure 5). Here,ABb3 has strong water ice signatures, and no assessment ofits gypsum-bearing potential is possible. The dark dunes inABou have strong hydration bands and gypsum features at2.2 and 2.4 mm while the light-toned material underlying thedunes is hydrated but without gypsum features. In Figure 5,the light-toned material exposed between dunes we interpretas either Rupes Tenuis unit (ABrt) or Scandia region unit(ABs), reworked by permafrost activity into an intermediate-toned unit with raised edge polygons a few to 10 m on a side.Tanaka et al. [2008] interpret ABrt as consisting of consol-idated aeolian material from weathering ABs, a massivesedimentary unit with evidence for water- and ice-drivenmobilization. Figure 6, HiRISE image PSP_010120_2605shows both the lighter-toned ABb3 and the ABrt or ABsunit which underlie the ABou gypsum-bearing dunes. ABb3is fractured on the meter to submeter scale, with multiplelayers sometimes visible, and is preferentially exposed onthe lee side of dunes. These identifications are based on thecorrespondence of unit descriptions and pictures of Tanakaet al. [2008] and regional mapping [Tanaka et al., 2005]with CRISM imagery. None of the units underlying ABoushow gypsum absorption features.[20] Finally, the Planum Boreum cavi unit, ABbc, which
has been identified as the dominant source of OlympiaUndae sand [Thomas and Weitz, 1989; Byrne and Murray,2002], was examined to test if it was also a source for thegypsum in the north polar sand sea. CRISM spectra confirma lack of gypsum in large exposures of ABbc at the edge ofthe polar cap, but often these observations are dominated bywater ice, which will occlude potential hydration signatures.
In smaller outcrops of ABbc that are clearly separated fromice-bearing terrains, there is a slight hydration signature butnone of the diagnostic gypsum bands. HRL0000B99F,Figure 7, shows a sharp contact between ABbc and thegypsum-bearing dunes of ABou. Ratio spectra show ABbcis slightly more hydrated than the light-toned ABrt or ABsexposures beneath the gypsum dunes, but neither materialhas convincing sulfate signatures. Another contact of ABouand ABbc further west from the high gypsum region revealsthat both ABou or ABbc have slightly hydrated signaturesbut no diagnostic gypsum absorptions. Like ABb3, thehydration signature in the dark-toned platy unit ABbc couldbe due to either a water ice component, a nongypsumhydrated mineral, or small amounts of gypsum. The gypsumsignature of the dunes may be stronger than any sourceregion as the gypsum could be concentrated on the surfaceby capillary wicking and evaporation.[21] In summary, multiple geologic units near ABou have
been investigated with CRISM data to determine the source
Figure 5. False color composite and band depth map at 1.9 mm (BD1900) for HRS0000C074 on thecontact between ABb3 and ABou units. Increased hydration, bright in BD1900, are associated with darkdunes. Spectra associated with dunes (ABou-red) and underlying light-toned substrate (ABs or ABrt)(green). Note the 1.9 mm feature is present in both bright and dune units, but is strongest in the dunes. Thedunes also show a concavity near 2.2 mm and an absorption near 2.4 mm due to gypsum.
Figure 6. HiRISE image PSP_010120_2605. Unit rela-tionship to the gypsum signature is described in the text.Illumination if from the top right of the image.
E00D11 CALVIN ET AL.: CRISM NORTH POLE SUMMER
6 of 15
E00D11

of the gypsum. The units ABs, ABrt, ABbc, and ABb3 allshow weak hydration bands but no diagnostic sulfate bands,which suggests the units have a water ice component ratherthan large amounts of gypsum. However, small amounts ofgypsum cannot be ruled out. The polygonal fracturing orplaty nature of these units have sufficient roughness to traploose gypsum-rich sand grains. In that case, the gypsumsource would be within the dunes themselves. On the otherhand, if one of the basal units is the gypsum source, apostulate is that beneath the gypsum-bearing dunes, thesubstrate could consist of an eroded friable (gypsum con-taining) layer over a more resistant layer (gypsum-poorlighter-toned substrate). As current analysis is not conclu-sive with regard to either the source or formation mecha-nism for gypsum, continued analysis of high-resolutionCRISM and HiRISE data of geologic contacts in the regionwith the highest gypsum concentration is ongoing.
4. Icy Materials
4.1. Ice Outliers
[22] Analysis of late northern summer MSP mosaic dataproducts (e.g., Figure 1) reveals small water ice depositsdistributed throughout the northern plains at latitudes quitedistant from the residual polar cap and the usual brightoutliers between 70 and 80�N. These small outliers range insize from a few hundreds of meters to several kilometers,and are generally associated with the northward facingslopes of crater rims or other elevated landforms. In a fewinstances the ice deposits are located on the leeward(southeast facing) sides of larger craters, and may indicatethe presence of wintertime CO2 frost formation fromorographic lifting [Beitia et al., 2008]. The brighter frostsublimes more slowly than the surrounding CO2 ice, ulti-
mately forming a late spring cold trap and inducing anaccumulation of water ice.4.1.1. Distribution[23] The spatial resolution and coverage of the MSP data
set allowed for consistent detection of water ice deposits atthe scale of �500 m and larger. To determine the southern-most extent of the deposits, false color visible and infraredcomposites of the MSP data set as well as a 1.5mm banddepth map were assembled. Here 1� longitude bins weresystematically evaluated and the furthest south occurrence(minimum latitude) of water ice was recorded. For compar-ison to other data sets, a 10� latitude and longitude averagewas determined about a center latitude of 75�N. Hyper-spectral targeted observations were acquired throughout thenorthern plains resulting from support of Phoenix landingsite selection. Although the distribution of hyperspectralobservations is sparse for MY28, the higher spatial resolu-tion allows for detection of an order of magnitude smallerice deposits (50 to 100 m, depending on the observingmode). Figure 8 portrays the mapped minimum latitude ofwater ice occurrence. For large portions of the mosaic, theminimum latitude follows the outline of the residual polarcap and well-known bright outliers. However, km-scale iceoutliers frequently exist well away from the cap to as farsouth as 67�N. The average latitude is 75.5�N. The longi-tudinal distribution is also not uniform, with a noticeableincrease in minimum latitude around lower albedo regionssuch as Acidalia Planitia (�300–345�E). Comparison to theGRS dry layer thickness [Boynton et al., 2008; Feldman etal., 2008; Mellon et al., 2008] also shows a strong corre-lation to the inferred ice table depth, areas with shallow icealso having abundant surface outliers as seen in Figure 8.This suggests that large-scale factors are common controlsto both surface and subsurface ice distribution, or thatpermafrost close to the surface may improve the retentionof late season surface ice.4.1.2. Local Factors Influencing Occurrence[24] A majority of the outlying deposits are located on
north facing crater rims or escarpments, but a few appear toextend around to the east and southeast facing side of thecrater rim (Figure 9). The prevalence of ice occurrence inassociation with craters indicates that local slope is adominant factor controlling the presence of late summerwater ice. The deposits that persist on east to southeastfacing sides of craters where readily exposed to morningsunlight are less intuitive. These leeward deposits may bedue to orographic lifting that causes wintertime depositionof bright fine-grained CO2 frost [Beitia et al., 2008]. TheCO2 frost sublimes more slowly than the surrounding CO2
ice and induces a late spring cold trap that favors accumu-lation of water ice. Figure 9 shows high-resolution examplesfor deposits adjacent to and within craters. In Figure 9 (left),the orientation suggests a contribution from local winds andthe ripple-like morphology of the deposit is suggestive ofaeolian influence. In Figure 9 (right), local insolation andtopography likely influence the location of sustained icepatches.[25] Outlying late summer water ice deposits are an
indication of the extent of environments favorable to inter-annual persistence of near-surface ice. Since Martian per-mafrost is presumed to form by vapor diffusion [Mellon etal., 2008] overlying small patches of surface frost may
Figure 7. CRISM observation HRL0000B99F showing asharp contact between ABou and ABbc units. Hydrationsignatures are discussed in the text.
E00D11 CALVIN ET AL.: CRISM NORTH POLE SUMMER
7 of 15
E00D11

either provide additional water vapor for underlying perma-frost or may prohibit diffusive loss from the underlying ice-rich soil. Future observations will monitor the evolution ofthese water ice deposits through time.
4.2. Survey of Polar Layered Deposits
[26] Of the 17 FRTs from MY28 that observe the uppersurfaces of the PLD, four are predominantly of the upperice-rich surface, six show fine layering and stratigraphyadjacent to troughs, and seven observe the lowest units of
Boreum Planum. Given the timing of the start of MROscience phase observations, Ls 130, the early north seasonalevolution of albedo and frost grain size noted by OMEGAand TES over the residual ice deposits [Langevin et al.,2005a; Calvin and Titus, 2008] was finished for Mars year28. We explored selected observations for variation in iceabsorption features, ice content of low-albedo layers, asso-ciation between albedo and ice band strength, and to explorespectral parameters that may be suggestive of ice content inthe lower albedo units.4.2.1. Overview of Unit Types[27] Simple measures of ice content include band depth of
the 1.5 mm absorption feature, slope down from 1.15 to2.25 mm, and spectral rise from 3.0 to 3.6 mm. Langevin etal. [2007] have noted that icy particles in the atmospherecontribute weakly to these three parameters, but that thespectral shape beyond 3 mm can be quite diagnostic indiscriminating ice cloud from icy surfaces. We haveperformed simple color composites, relative band depthsof the 1.5 mm feature and find the upper ice-rich surfaces(ABb4) show subtle changes in ice band strength, and thatmost of the upper, lower albedo units of the PLD (ABb1–ABb3) are still quite water ice–rich. Figure 10 showsaverage spectral properties for differing high-albedo(ABb4) and low-albedo (ABb1) units of the PLD, withproperties that suggest grain size variation in these surfaces.These spectra were taken from surfaces on Gemini Lingulathat remain high albedo throughout the northern summer.The location map in Figure 10 shows that observationFRT00002F46 is roughly 850m lower in absolute elevationthan FRT000035B1. The strong features of water ice at1.04, 1.25, 1.5, 2.0 mm are noted in bright upper surfaces ofthe PLD. Although the overall albedo is low for water ice,the shape of peaks at 3.05 and 3.65 mm in the 35B1spectrum (black spectral line) suggest fairly fine ice grainsizes, as the region longward of 3 mm rapidly saturates withlarge grains [Calvin and Clark, 1991; Calvin et al., 2002;Warren and Brandt, 2008]. The other high-albedo surface
Figure 9. High-resolution examples of outlier ice deposits.(left) CRISM hyperspectral observation of a southeastfacing water ice deposit (appears white; clouds are alsoapparent). HRL000044AD was acquired at Ls = 180�;image is approximately 11 km across at narrowest. (right) Asmall fresh crater with water ice deposit (bluish spots,subset). FRT0000332C was acquired at Ls = 142.6�; imageis approximately 11 km across at narrowest. In both casesthe false color composite uses R = 0.71mm, G = 0.60mm,B = 0.53mm.
Figure 8. (top) CRISM 1.5 mm band depth map from 65to 90�N with minimum ice latitudes (white dots). (bottom)GRS dry layer thickness (g/cm2) over MOLA topographywith mapped minimum ice latitude. Areas with very highand very low DLT values (Acidalia and the polar cap,respectively) have been masked out.
E00D11 CALVIN ET AL.: CRISM NORTH POLE SUMMER
8 of 15
E00D11

from FRT00002F46 (cyan colored spectrum and also shownwith various image color composites) shows stronger icefeatures shorter than 2.6 mm, but reduced contrast longerthan 3 mm, consistent with somewhat larger grain sizes.Color composites highlight ice band strength both in IRcolor combinations and with the band strength of the 1.5 mmfeature. Albedo varies a few percent, along with changes inband depth. For low-albedo surfaces in troughs (ABb2 or 3),the units have nearly identical visible albedos, but havestrongly contrasting water ice band strengths (troughs oneither side of a small promontory in Figure 10, observationFRT00002F46 at the margins of Gemini Lingula).[28] Figure 10 shows that a wide range of surfaces can
have nearly identical visible albedo, yet strongly varying
water ice absorption features. This variation must be due tochanges in ice abundance, grain size, or possibly surfacedistribution of small bright patches as observed in HiRISEimagery [Fishbaugh et al., 2009]. In order to further exploreice content variability in the low-albedo troughs we exam-ined the 1.5 mm band depth (as determined in simple 3channel ratios) and found that this can consistently trackexposed layers, regardless of albedo. As shown in Figure 11,ice content of layers is not correlated to albedo, and may bean independent method for determining stratigraphy orlayer ‘‘packets.’’ Figure 11 shows the visible color ofFRT000027EC, on the side of the residual cap nearOlympia Planitia. The 1.5 mm band depth is calculated andplotted in a density slice for intermediate band strengths. In
Figure 10. Average full spectral range data from ice and upper unit low-albedo troughs. The locationmap with arrows shows the regions for the two FRTs used for averages in the plot. FRT000035B1 (blackspectrum) is 850m higher than 00002F46 (colored spectra). Bright units in both FRTs are high albedothroughout northern summer. Residual CO2 atmosphere features are seen near 2.0 mm, and valuesbetween 2.65 and 2.9 have also been set to zero due to atmospheric interference. The feature near 0.65 mm isa calibration artifact. Spectra have been smoothed using a 5-channel box-car filter. FRT00002F46acquired at Ls 133 shown below in visible color RGB bands (0.73, 0.60, 0.44 mm), IR color (RGB-2.25,1.50, 1.25 mm), and 1.5 mm band depth (values range from 2.2 to 6). IR color emphasizes ice-richmaterial in blue, and the band depth is highest for lightest colors in the false color stretch. Spectra arefrom high-albedo ice-rich regions (cyan) and the two dark troughs (green and orange) and regions for thespectral extraction are noted on the visible color image as small colored circles. Note the left trough ofFRT00002F46 (green spectrum) is more ice-rich than the right (orange spectrum). Additional discussionof spectral features provided in the text.
E00D11 CALVIN ET AL.: CRISM NORTH POLE SUMMER
9 of 15
E00D11

cluster plots of albedo versus 1.5 mm band depth there are nostrong linear trends, yet clusters within the data cloud canisolate units with consistent water content and variablealbedo. This is demonstrated by highlighting a coherent setof points in red (Figure 11c) and then showing those samepoints in red on an IR false color composite (Figure 11d).This suggests that water ice content of low-albedo ‘‘dirty’’layers can be traced to intrinsic layer properties, rather thansurface veneers or small patches of frost on eroded surfacesas seen in HiRISE imagery [Herkenhoff et al., 2007;Fishbaugh et al., 2009]. Continuous horizontal bandingin 1.5 mm band depth is also seen to extend over tens ofkilometers in the MSP mosaic (Figure 1). Large-scalestratification in water ice content is also observed withinthe full 3 km vertical stack of the Planum Boreal. Thelowest layers with sections just above the what has beencalled the ‘‘ Basal Unit’’ (BU), identified as ABrt, ABbc[Tanaka et al., 2008] are all more water ice–rich thanintermediate sections (ABb1–ABb3) as described in thenext section. Future work will concentrate on determininglayer sequences defined by infrared ice absorption featurestrength, if these correlate with layers identified based onalbedo and morphology, and if there is consistency between
these spectral parameterizations and previously noted‘‘marker’’ beds [Malin and Edgett, 2001; Milkovich andHead, 2006; Fishbaugh et al., 2009].4.2.2. Ice Content of the Lower PLD[29] We had previously noted that the lowest sections of
the PLD exhibit weak to no water ice signatures based onthe 1.5 mm band depth [Murchie, 2007; Seelos et al., 2007].However, Herkenhoff et al. [2007] found that based onpolygonal fractures and mass wasting of blocks that thebrighter basal units should be volatile rich. Improvedcalibration gives us increased confidence in weak icesignatures at 1.5 mm and we find that the 3.0 to 3.6 mmrise is diagnostic of ice in lighter toned basal unit materialswhere the 1.5 and 2.0 mm features of water ice are notobvious, as shown in Figure 12. Of the 6 FRTs in MY28that cover the lower units of the PLD initial analysis showsthat portions of the basal unit material are ice-cemented,particularly light layered materials adjacent to the upperBasal Unit (BU) scarps (ABrt, ABbc, and/or ABb1–Figure 12,also FRT00002FA6, not shown here). An upturn longwardof 3 mm can also be indicative of hydrated minerals ratherthan water ice [Calvin, 1997; Milliken and Mustard, 2005].We find that the presence of a distinct 3.7 mm peak, ratherthan just a spectral rise can reliably distinguish betweenhydrated minerals and ice content. In hydrated materials, ifthere is a peak it is also usually at longer wavelengths thanthose materials that have some water ice. Detailed modelingof the spectral shape longward of 3 mm is needed toconfidently identify ice in the darkest materials, but thereis evidence that lighter ejecta surrounding craters in theChasma Boreale floor and lighter units of the differentiallyeroded basal layers contain some ice (FRT0000287F, notshown). The lower portion of the PLD just above the basalunit (ABbc, and/or ABb1) is found to be relatively ice-richcompared to layers higher up in the sequence, with theuppermost highest albedo surface (ABb4) the most ice-rich(Figures 10 and 11). Though coverage is sparse, this trend isobserved in all high-resolution images at widely separatedlocations. In FRT00002854 (Figure 13) light colored ice-rich cones are seen on top of the ABrt and ABbc units of thebasal unit scarp in contact with these upper ice-rich (ABb1/ABb2) layers. Russell et al. [2008] also note these featuresin HiRISE imagery and interpret them as being composed ofwater ice and related to scarp mass wasting processes.
4.3. Initial Modeling of Spectral Properties
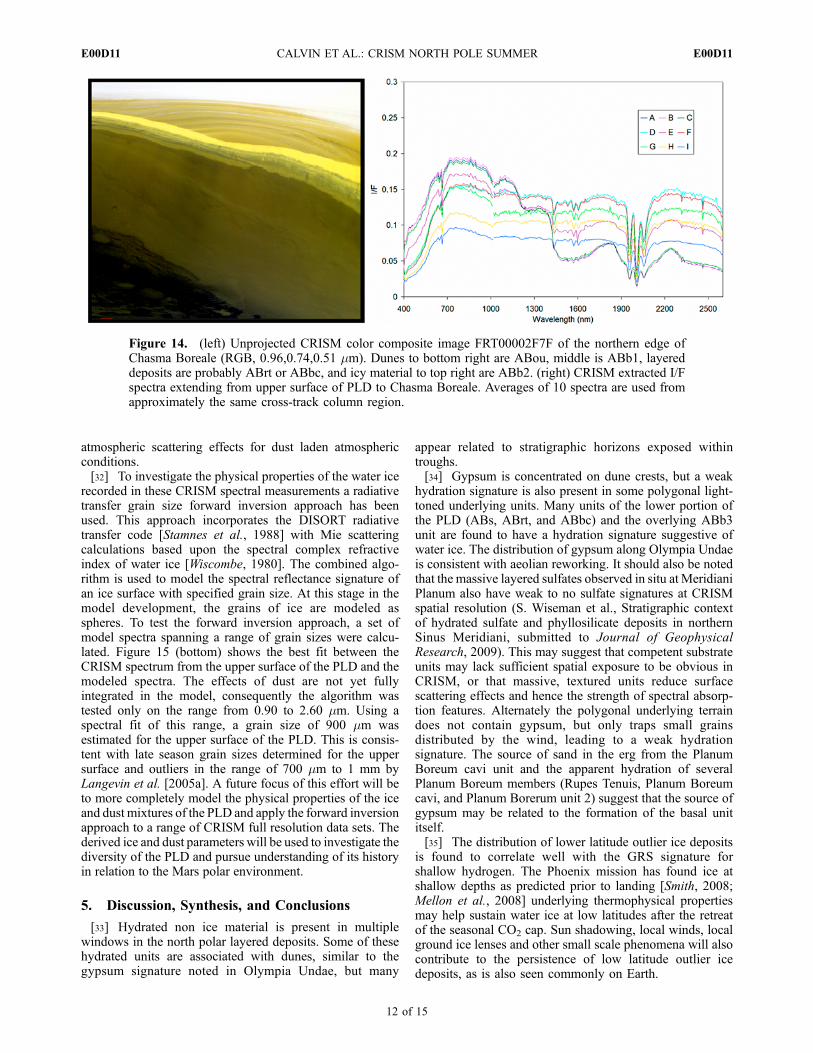
[30] In order to examine model fits to the varying spectralproperties of the PLD we examined CRISM FRT00002F7Facquired at Ls of 133. This image captures the north centralwall of Chasma Boreale and is shown in Figure 14 (curveA). The image contains a portion of the base of ChasmaBoreale as well as a section the polar layered depositsincluding the upper surface. The image shows layering ofmixed ice and dust. From this data set a set of averagespectra were extracted from the central swath and from thetop to the bottom of the image; these spectra included unitsfrom ABou, ABb1, ABrt or ABbc, and icy material ABb2.The spatial locations of the extracted spectra were optimallymatched between the two CRISM spectrometers. Figure 14(curve B) shows the calibrated I/F spectra labeled A to I forthe different sections from top to bottom. In each case anaverage of 10 spectra were extracted and averaged. Spectra
Figure 11. (a) Visible color for FRT000027EC showingalbedo striping in upper PLD units, the data are unprojected.(b) Density slice of the 1.5 mm band depth, displayed over agray scale of infrared albedo. Only intermediate bandstrengths are shown and range from browns (low) to colors(moderate). (c) Plot of albedo (horizontal axis) versus 1.5 mmband depth (vertical) for the IR portion of this FRT. Data donot show strong linear trends but clusters that range inalbedo and water ice band strength. The red cluster is shownas the red overlay on the IR false color image. (d) Falsecolor IR composite using 2.50, 1.50, and 1.02 mm channels,highlight ice-rich, high-albedo surfaces in blue. This sectionis a subset of the full scene, and the region shown as a blackbox on Figure 11b. Here consistent ice band depth (redcluster from Figure 11C) occurs over a range of albedos andlikely traces intrinsic units on the lower edge of the ice-richsurface (ABb4/ABb3).
E00D11 CALVIN ET AL.: CRISM NORTH POLE SUMMER
10 of 15
E00D11

A, B, C, and E show water ice absorption features at 1.05,1.25, 1.50, 2.00 mm. Spectrum E was extracted from thefine layer on the surface of the upper unit and is likely aspatial mixture even at full CRISM spatial resolution.[31] An atmospheric correction using a modified
MODTRAN approach with residual artifact suppressionwas applied to the I/F data set. MODTRAN was originallydesigned to model the atmospheric properties of the Earth[e.g., Anderson et al., 2000]. However, the underlyingphysics of radiative transfer captured in MODTRAN allowsit to be configured to model the atmosphere of Mars. InMODTRAN, sensor view and illumination geometry as wellas the atmospheric constituent abundances and profiles maybe adjusted. By varying the amount of water vapor for aMars type atmosphere we find the wavelength regions of1.38, 1.88, and 2.60 mm are most impacted by these low butvariable amounts. MODTRAN modeled spectra with vary-ing amounts of carbon dioxide that may be due to pathlength changes from low to high surface elevation or pathlength changes due to illumination and observation geom-etry were also considered. Using this approach we created aMODTRAN atmospheric transmittance look-up table thatspans a range of carbon dioxide and water vapor abundances(Figure 15, top). These modeled transmittance spectrawere convolved to the CRISM spectral response functionstaking into account the instrumental cross-track spectralvariation. Figure 15 (middle) shows the atmosphericallycorrected spectra of the PLD that were derived from this
approach. Following atmospheric correction, weak water iceabsorptions are more clearly observable in spectra D, E andF from the upper unit of the PLD. This early result showsgood success with a MODTRAN based atmospheric cor-rection approach. Future work will be focused on increasedautomation of the techniques and on proper inclusion of
Figure 12. FRT00002854, acquired Ls 114. (top) Visible color RGB bands (0.73, 0.60, 0.44 mm), IRcolor (2.50, 1.50, and 1.02 mm), and ice emphasis. The ice emphasis is created using the RGBcombination of albedo at 1.1 mm, the 1.5 mm band depth, and the spectral rise from 3.3 to 3.6 mm. In theIR color ice-rich units are light blue, and only layered material in the trough wall and small mounds nearthe base appear to contain water ice. In the ice emphasis image, icy materials are white, cyan andmagenta; ice-poor units are blue. Magenta colors clearly highlight spatially coherent units, including theupper most surface and layered material at the bottom of the PLD (right side) and light-toned areassurrounding dunes (top left). (bottom) Corresponding HiRISE color, PSP_0014112_2650. The locationof HiRISE is shown as a light rectangle on the visible color CRISM image. The material in the middle ofthe image is ABs, and the layered material in the bottom right is probably ABrt, ABbc, and/or ABb1.
Figure 13. Close-up of the right hand side of FRT00002854,from Figure 12, rotated counterclockwise. Visible color(left) RGB bands (0.73, 0.60, 0.44 mm), (right) IR color(1.50, 2.20, and 1.02 mm). Ice-rich materials are light blue inthe IR color, though note that the orange/brown layeredterrain laying on the Chasma Boreale floor (single arrow leftimage) is also ice cemented in the ice emphasis image inFigure 12. Note that the ice lenses stratigraphically abovethe above the floor and lowest layered unit (multiple arrowsright image) appear to connect with overlying ice-richlayered materials.
E00D11 CALVIN ET AL.: CRISM NORTH POLE SUMMER
11 of 15
E00D11
atmospheric scattering effects for dust laden atmosphericconditions.[32] To investigate the physical properties of the water ice
recorded in these CRISM spectral measurements a radiativetransfer grain size forward inversion approach has beenused. This approach incorporates the DISORT radiativetransfer code [Stamnes et al., 1988] with Mie scatteringcalculations based upon the spectral complex refractiveindex of water ice [Wiscombe, 1980]. The combined algo-rithm is used to model the spectral reflectance signature ofan ice surface with specified grain size. At this stage in themodel development, the grains of ice are modeled asspheres. To test the forward inversion approach, a set ofmodel spectra spanning a range of grain sizes were calcu-lated. Figure 15 (bottom) shows the best fit between theCRISM spectrum from the upper surface of the PLD and themodeled spectra. The effects of dust are not yet fullyintegrated in the model, consequently the algorithm wastested only on the range from 0.90 to 2.60 mm. Using aspectral fit of this range, a grain size of 900 mm wasestimated for the upper surface of the PLD. This is consis-tent with late season grain sizes determined for the uppersurface and outliers in the range of 700 mm to 1 mm byLangevin et al. [2005a]. A future focus of this effort will beto more completely model the physical properties of the iceand dust mixtures of the PLD and apply the forward inversionapproach to a range of CRISM full resolution data sets. Thederived ice and dust parameters will be used to investigate thediversity of the PLD and pursue understanding of its historyin relation to the Mars polar environment.
5. Discussion, Synthesis, and Conclusions
[33] Hydrated non ice material is present in multiplewindows in the north polar layered deposits. Some of thesehydrated units are associated with dunes, similar to thegypsum signature noted in Olympia Undae, but many
appear related to stratigraphic horizons exposed withintroughs.[34] Gypsum is concentrated on dune crests, but a weak
hydration signature is also present in some polygonal light-toned underlying units. Many units of the lower portion ofthe PLD (ABs, ABrt, and ABbc) and the overlying ABb3unit are found to have a hydration signature suggestive ofwater ice. The distribution of gypsum along Olympia Undaeis consistent with aeolian reworking. It should also be notedthat the massive layered sulfates observed in situ at MeridianiPlanum also have weak to no sulfate signatures at CRISMspatial resolution (S. Wiseman et al., Stratigraphic contextof hydrated sulfate and phyllosilicate deposits in northernSinus Meridiani, submitted to Journal of GeophysicalResearch, 2009). This may suggest that competent substrateunits may lack sufficient spatial exposure to be obvious inCRISM, or that massive, textured units reduce surfacescattering effects and hence the strength of spectral absorp-tion features. Alternately the polygonal underlying terraindoes not contain gypsum, but only traps small grainsdistributed by the wind, leading to a weak hydrationsignature. The source of sand in the erg from the PlanumBoreum cavi unit and the apparent hydration of severalPlanum Boreum members (Rupes Tenuis, Planum Boreumcavi, and Planum Borerum unit 2) suggest that the source ofgypsum may be related to the formation of the basal unititself.[35] The distribution of lower latitude outlier ice deposits
is found to correlate well with the GRS signature forshallow hydrogen. The Phoenix mission has found ice atshallow depths as predicted prior to landing [Smith, 2008;Mellon et al., 2008] underlying thermophysical propertiesmay help sustain water ice at low latitudes after the retreatof the seasonal CO2 cap. Sun shadowing, local winds, localground ice lenses and other small scale phenomena will alsocontribute to the persistence of low latitude outlier icedeposits, as is also seen commonly on Earth.
Figure 14. (left) Unprojected CRISM color composite image FRT00002F7F of the northern edge ofChasma Boreale (RGB, 0.96,0.74,0.51 mm). Dunes to bottom right are ABou, middle is ABb1, layereddeposits are probably ABrt or ABbc, and icy material to top right are ABb2. (right) CRISM extracted I/Fspectra extending from upper surface of PLD to Chasma Boreale. Averages of 10 spectra are used fromapproximately the same cross-track column region.
E00D11 CALVIN ET AL.: CRISM NORTH POLE SUMMER
12 of 15
E00D11

[36] Phillips et al. [2008] have noted that the PLD islargely transparent at the radio frequencies of MARSIS andSHARAD but find multiple interior radar reflection hori-zons. They suggest 2–10% admixture of soil with ice andthat some strong reflectors may be possibly as much as 30%dust. Additionally, they see a radar reflection from both theBU under the main lobe and the underlying Vastitas
Borealis Formation. CRISM also suggests that the majorityof the PLD is ice-rich and that multiple horizons are seenwithin the vertical layered unit related to variation in icecontent or thickness of non ice coating on the upper mostsurfaces. It has been shown that modest amounts of low-albedo material coating ice-rich surfaces will dramaticallylower the visible albedo but that the infrared ice featureswill remain strong [Clark, 1981; Kieffer, 1990]. CRISMobservations suggest both large scale stratigraphic variationin bulk ice content, as well as localized variation in veneersof either dust or ice coatings. Many low-albedo layers,previously assumed to be ‘‘dirt’’ are found to have stronginfrared signatures of water ice. Sections just above thelowest units are found to be more ice-rich. Lighter materialsin the lowest elevations of the PLD and adjacent to ice-richscarps are ice cemented, possibly also ice-rich. A strongunderlying ice content may also contribute to interannualvariability in the appearance of bright ‘‘frosted’’ patches[Malin and Edgett, 2001; Calvin and Titus, 2008, andreferences therein].[37] Previously, stratigraphic units and layering within the
PLD have been related to albedo and unique morphologicalfeatures. Numerous studies have noted that albedo alone isnot a good indicator of stratigraphy. We find that ice grainsize or content, as determined by the strength of the infraredwater ice absorptions, may be an independent identifier ofhorizontally competent units. The water ice content of‘‘dirty’’ layers can be mapped and traced to intrinsic proper-ties rather than surface veneers or slopes. This may offer anew approach to stratigraphy of the PLD, and ultimatelyrelating the vertical structure to past climate cycles.[38] Numerous small ice lenses overly the lowest lami-
nated units and are in contact with ice-rich materials above.These may represent slumping of volatile rich blocks, oraccumulations of landslide material in the wake of down-slope motion as captured by HiRISE [Herkenhoff et al.,2007; Russell et al., 2008].[39] Preliminary efforts suggest terrestrial models for
atmospheric correction and surface physical properties canbe readily adapted to Martian conditions. Moderate grainsizes for the upper water ice units are found, consistent withmodels from OMEGA. This suggests that the lower coher-ent units of the PLD are sintered by age or compaction,developing a surface lag of non ice material, similar to someglacial ice on earth.[40] The results presented lay the foundation for future
studies and analysis that will continue to reveal the nature ofthe units that have the most direct link to current and recentclimate change on Mars.
[41] Acknowledgment. This work supported by the Mars Reconnais-sance Orbiter CRISM Science Team and Participating Scientist Programs.
ReferencesAnderson, G. P., et al. (2000), MODTRAN4 radiative transfer modeling forremote sensing, Proc. SPIE, 4049, 176–183, doi:10.1117/12.410338.
Bass, D. S., K. E. Herkenhoff, and D. A. Paige (2000), Variability of Mars’north polar water ice cap: I. Analysis of Mariner 9 and Viking Orbiterimaging data, Icarus, 144(2), 382–396, doi:10.1006/icar.1999.6300.
Beitia, E. A., T. N. Titus, K. D. Seelos, F. P. Seelos, A. Colaprete, S. L.Murchie, and P. R. Christensen (2008), Martian H2O ice outliers mayresult from wintertime near-surface CO2 snows, Lunar Planet. Sci.,XXXIX, Abstract 1422.
Figure 15. (top) MODTRAN modeled atmospheric trans-mittance for varying carbon dioxide path length. Thesespectra have been convolved to the CRISM spectral responsefunctions. (middle) Spectra shown in Figure 14 atmo-spherically corrected using MODTRAN models. (bottom)Grain size model fit of 900 mm radius with CRISM spectrumC from the upper surface of the PLD.
E00D11 CALVIN ET AL.: CRISM NORTH POLE SUMMER
13 of 15
E00D11

Benson, J. L., and P. B. James (2005), Yearly comparisons of the Martianpolar caps: 1999–2003 Mars Orbiter Camera observations, Icarus,174(2), 513–523, doi:10.1016/j.icarus.2004.08.025.
Boynton, W. V., et al. (2002), Distribution of hydrogen in the near surfaceof Mars: Evidence for subsurface ice deposits, Science, 297(5578), 81–85, doi:10.1126/science.1073722.
Boynton, W. V., G. J. Taylor, S. Karunatillake, R. C. Reedy, and J. M.Keller (2008), Elemental abundances determined via the Mars OdysseyGRS, in The Martian Surface: Composition, Mineralogy, and PhysicalProperties, edited by J. F. Bell, pp. 105–124, Cambridge Univ. Press,London.
Byrne, S., and B. C. Murray (2002), North polar stratigraphy and the paleo-erg of Mars, J. Geophys. Res., 107(E6), 5044, doi:10.1029/2001JE001615.
Calvin, W. M. (1997), Variation of the 3-mm absorption feature on Mars:Observations over eastern Valles Marineris by the Mariner 6 infraredspectrometer, J. Geophys. Res., 102, 9097 – 9107, doi:10.1029/96JE03767.
Calvin, W. M., and R. N. Clark (1991), Modeling the reflectance spectrumof Callisto 0.25 to 4.1 mm, Icarus, 89(2), 305–317, doi:10.1016/0019-1035(91)90180-2.
Calvin, W. M., and T. N. Titus (2008), Summer season variability of thenorth residual cap of Mars as observed by the Mars Global SurveyorThermal Emission Spectrometer (MGS-TES), Planet. Space Sci., 56,212–226, doi:10.1016/j.pss.2007.08.005.
Calvin, W. M., M. Milman, and H. H. Kieffer (2002), Reflectance ofAntarctica from 3 to 5 mm: Discrimination of surface snow and cloudproperties, Ann. Glaciol., 34, 121–126.
Clark, R. N. (1981), Spectral reflectance of water-mineral mixtures at lowtemperatures, J. Geophys. Res., 86(B4), 3074 – 3086, doi:10.1029/JB086iB04p03074.
Clark, R. N., and T. B. McCord (1982), Mars residual north polar cap:Earth-based spectroscopic confirmation of water ice as a major constitu-ent and evidence for hydrated minerals, J. Geophys. Res., 87(B1), 367–370, doi:10.1029/JB087iB01p00367.
Cloutis, E. C., et al. (2006), Detection and discrimination of sulfate miner-als using reflectance spectroscopy, Icarus, 184, 121–157, doi:10.1016/j.icarus.2006.04.003.
Cutts, J. A. (1973), Nature and origin of layered deposits of the Martianpolar regions, J. Geophys. Res., 78, 4231 – 4249, doi:10.1029/JB078i020p04231.
Edgett, K. S., R. M. E. Williams, M. C. Malin, B. A. Cantor, and P. C.Thomas (2003), Mars landscape evolution: Influence of stratigraphy ongeomorphology in the north polar region, Geomorphology, 52, 289–297.
Feldman, W. C., et al. (2004), Global distribution of near-surface hydrogenon Mars, J. Geophys. Res., 109, E09006, doi:10.1029/2003JE002160.
Feldman, W. C., M. T. Mellon, O. Gasnault, S. Maurice, and T. H.Prettyman (2008), Volatiles on Mars: Scientific results from the MarsOdyssey neutron spectrometer, in The Martian Surface: Composition,Mineralogy, and Physical Properties, edited by J. F. Bell, pp. 125–148,Cambridge Univ. Press, London.
Fishbaugh, K. E., and J. W. Head (2005), Origin and characteristics of theMars north polar basal unit and implications for polar geologic history,Icarus, 174(2), 444–474, doi:10.1016/j.icarus.2004.06.021.
Fishbaugh, K. E., and C. S. Hvidberg (2006), Martian north polar layereddeposits stratigraphy: Implications for accumulation rates and flow,J. Geophys. Res., 111, E06012, doi:10.1029/2005JE002571.
Fishbaugh, K. E., F. Poulet, V. Chevrier, Y. Langevin, and J.-P. Bibring(2007), On the origin of gypsum in the Mars north polar region,J. Geophys. Res., 112, E07002, doi:10.1029/2006JE002862.
Fishbaugh, K. E., S. Byrne, K. E. Herkenhoff, R. L. Kirk, C. Fortezzo, P. S.Russell, and A. McEwen (2009), Evaluating the meaning of ‘‘layer’’ inthe Martian north polar layered deposits and the impact on the climateconnection, Icarus, doi:10.1016/j.icarus.2009.04.011, in press.
Ghrefat, H. A., P. C. Goodell, B. E. Hubbard, R. P. Langford, and R. E.Aldouri (2007), Modeling grain size variations of aeolian gypsum depos-its at White Sands New Mexico, using AVIRIS imagery, Geomophology,88, 57–68, doi:10.1016/j.geomorph.2006.10.013.
Hale, A. S., D. S. Bass, and L. K. Tamppari (2005), Monitoring the per-ennial Martian northern polar cap with MGS MOC, Icarus, 174, 502–512, doi:10.1016/j.icarus.2004.10.033.
Herkenhoff, K. E., and A. R. Vasavada (1999), Dark material in the polarlayered deposits and dunes on Mars, J. Geophys. Res., 104(E7), 16,487–16,500, doi:10.1029/1998JE000589.
Herkenhoff, K. E., S. Byrne, P. S. Russell, K. E. Fishbaugh, and A. S.McEwen (2007), Meter scale morphology of the north polar region ofMars, Science, 317, 1711–1715, doi:10.1126/science.1143544.
Horgan, B. H., J. F. Bell III, E. Z. Noe Dobrea, E. A. Cloutis, D. T. Bailey,M. A. Craig, L. H. Roach, and J. F. Mustard (2009), The distribution of
hydrated minerals in the north polar region of Mars, J. Geophys. Res.,114, E01005, doi:10.1029/2008JE003187.
Howard, A. D. (2000), The role of eolian processes in forming surfacefeatures of the Martian polar layered deposits, Icarus, 144, 267–288,doi:10.1006/icar.1999.6305.
Howard, A. D., J. A. Cutts, and K. R. Blasius (1982), Stratigraphic relation-ships within Martian polar cap deposits, Icarus, 50, 161 – 215,doi:10.1016/0019-1035(82)90123-3.
Hunt, G. R., J. W. Salisbury, and C. J. Lenhoff (1971), Visible and near-infrared spectra of minerals and rocks: IV. Sulphides and sulfates, Mod.Geol., 3, 1–14.
Kieffer, H. H. (1990), H2O grain-size and the amount of dust in Marsresidual north polar cap, J. Geophys. Res., 95(B2), 1481 – 1493,doi:10.1029/JB095iB02p01481.
Kieffer, H. H., and T. N. Titus (2001), TES mapping of Mars’ north sea-sonal cap, Icarus, 154(1), 162–180, doi:10.1006/icar.2001.6670.
Kieffer, H. H., S. C. Chase, T. Z. Martin, E. D. Miner, and F. D. Palluconi(1976), Martian north pole summer temperatures: Dirty water ice,Science, 194(4271), 1341–1344, doi:10.1126/science.194.4271.1341.
Lahtela, H., et al. (2009), Coordinated HiRISE/CRISM observation ongypsum signature in Martian polar dunes, Lunar Planet. Sci., XL, Abstract2254.
Langevin, Y., F. Poulet, J. P. Bibring, and B. Gondet (2005a), Summerevolution of the north polar cap of Mars as observed by OMEGA/Marsexpress, Science, 307(5715), 1581–1584, doi:10.1126/science.1109438.
Langevin, Y., F. Poulet, J. P. Bibring, and B. Gondet (2005b), Sulfates inthe north polar region of Mars detected by OMEGA/Mars express,Science, 307(5715), 1584–1586, doi:10.1126/science.1109091.
Langevin, Y., J. P. Bibring, F. Montmessin, F. Forget, M. Vincendon,S. Doute, F. Poulet, and B. Gondet (2007), Observations of the southseasonal cap of Mars during recession in 2004–2006 by the OMEGAvisible/near-infrared imaging spectrometer on board Mars Express,J. Geophys. Res., 112, E08S12, doi:10.1029/2006JE002841.
Laskar, J., B. Levrard, and J. F. Mustard (2002), Orbital forcing of theMartian polar layered deposits, Nature, 419, 375–377, doi:10.1038/nature01066.
Levrard, B., F. Forget, F. Montmessin, and J. Laskar (2007), Recent for-mation and evolution of northern Martian polar layered deposits as in-ferred from a global climate model, J. Geophys. Res., 112, E06012,doi:10.1029/2006JE002772.
Malin, M. C., and K. S. Edgett (2001), Mars Global Surveyor Mars OrbiterCamera: Interplanetary cruise through primary mission, J. Geophys. Res.,106(E10), 23,429–23,570, doi:10.1029/2000JE001455.
Mellon, M. T., W. V. Boynton, W. C. Feldman, R. E. Arvidson, T. N. Titus,J. L. Bandfield, N. E. Putzig, and H. G. Sizemore (2008), A prelandingassessment of the ice table depth and ground ice characteristics in Martianpermafrost at the Phoenix landing site, J. Geophys. Res., 113, E00A25,doi:10.1029/2007JE003067.
Milkovich, S. M., and J. W. Head (2005), North polar cap of Mars: Polarlayered deposit characterization and identification of a fundamental cli-mate signal, J. Geophys. Res., 110, E01005, doi:10.1029/2004JE002349.
Milkovich, S. M., and J. W. Head (2006), Surface textures of Mars’ northpolar layered deposits: A framework for interpretation and future explora-tion, Mars, 2, 21–45, doi:10.1555/mars.2006.0003.
Milliken, R. E., and J. F. Mustard (2005), Quantifying absolute water con-tent of minerals using near-infrared reflectance spectroscopy, J. Geophys.Res., 110, E12001, doi:10.1029/2005JE002534.
Murchie, S. M. (2007), First results from the Compact ReconnaissanceImaging Spectrometer for Mars (CRISM), Lunar Planet. Sci., XXXVIII,Abstract 1472.
Murchie, S. M., et al. (2007), Compact Reconnaissance Imaging Spectro-meter for Mars (CRISM) on Mars Reconnaissance Orbiter (MRO),J. Geophys. Res., 112, E05S03, doi:10.1029/2006JE002682.
Murchie, S. M., et al. (2009a), Compact Reconnaissance Imaging Spectro-meter for Mars investigation and data set from the Mars ReconnaissanceOrbiter’s primary science phase, J. Geophys. Res., 114, E00D07,doi:10.1029/2009JE003344.
Murchie, S. M., et al. (2009b), A synthesis of Martian aqueous mineralogyafter one Mars year of observations from the Mars Reconnaissance Or-biter, J. Geophys. Res., 114, E00D06, doi:10.1029/2009JE003342.
Pelkey, S. M., et al. (2007), CRISM multispectral summary products: Para-meterizing mineral diversity on Mars from reflectance, J. Geophys. Res.,112, E08S14, doi:10.1029/2006JE002831.
Phillips, R. J., et al. (2008), Mars north polar deposits: Stratigraphy, age,and geodynamical response, Science, 320(5880), 1182 – 1185,doi:10.1126/science.1157546.
Roach, L. H., et al. (2007), CRISM spectral signatures on the north polargypsum dunes, Lunar Planet. Sci., XXXVIII, Abstract 1970.
E00D11 CALVIN ET AL.: CRISM NORTH POLE SUMMER
14 of 15
E00D11

Russell, P., et al. (2008), Seasonally active frost-dust avalanches on a northpolar scarp of Mars captured by HiRISE, Geophys. Res. Lett., 35,L23204, doi:10.1029/2008GL035790.
Seelos, F. P., S. L. Murchie, S. M. Pelkey, and K. D. Seelos (2007), CRISMmultispectral survey campaign: Status and initial mosaics, Lunar Planet,Sci., XXXVIII, Abstract 2336.
Smith, P. (2008), The Phoenix mission explores the Martian arctic, EosTrans. AGU, 89(53), Fall Meet. Suppl., Abstract P13F–01.
Stamnes, K., S. C. Tsay, W. J. Wiscombe, and K. Jayaweera (1988),Numerically stable algorithm for discrete-ordinate-method radiativetransfer in multiple scattering and emitting layered media, Appl. Opt.,27, 2502–2509, doi:10.1364/AO.27.002502.
Tanaka, K. L., J. A. Rodriguez, J. A. Skinner, M. C. Bourke, C. M. Fortezzo,K. E. Herkenhoff, E. J. Kolb, and C. H. Okubo (2008), North polar regionof Mars: Advances in stratigraphy, structure, and erosional modification,Icarus, 196(2), 318–358, doi:10.1016/j.icarus.2008.01.021.
Tanaka, T. L., J. A. Skinner Jr., and T. M. Hare (2005), Geologic map of thenorthern plains of Mars, U.S. Geol. Surv. Spec. Invest. Map 2888.
Thomas, P., and C. Weitz (1989), Sand dune materials and polarlayered deposits on Mars, Icarus, 81, 185–215, doi:10.1016/0019-1035(89)90133-4.
Thomas, P., S. Squyres, K. Herkenhoff, A. Howard, and B. Murray (1992),Polar deposits of Mars, in Mars, edited by H. H. Kieffer et al., pp. 767–795, Univ. of Ariz. Press, Tucson.
Tsoar, H., R. Greeley, and A. R. Peterfreund (1979), Mars: The north polarsand sea and related wind patterns, J. Geophys. Res., 84, 8167–8180,doi:10.1029/JB084iB14p08167.
Wagstaff, K. L., T. N. Titus, A. B. Ivanov, R. Castano, and J. L. Bandfield(2008), Observations of the north polar water ice annulus on Mars usingTHEMIS and TES, Planet. Space Sci., 56, 256 –265, doi:10.1016/j.pss.2007.08.008.
Warren, S. G., and R. E. Brandt (2008), Optical constants of ice from theultraviolet to the microwave: A revised compilation, J. Geophys. Res.,113, D14220, doi:10.1029/2007JD009744.
Wiscombe, W. J. (1980), Improved Mie scattering algorithms, Appl. Opt.,19(9), 1505–1509, doi:10.1364/AO.19.001505.
Zuber, M. T., et al. (1998), Observations of the north polar region of Marsfrom the Mars Orbiter Laser Altimeter, Science, 282, 2053 –2060,doi:10.1126/science.282.5396.2053.
�����������������������W. M. Calvin, Department of Geological Sciences and Engineering,
University of Nevada, MS 172, Reno, NV 89557, USA. ([email protected])R. O. Green, Jet Propulsion Laboratory, Pasadena, CA 91109, USA.S. L. Murchie, F. P. Seelos, and K. D. Seelos, Johns Hopkins University
Applied Physics Laboratory, Laurel, MD 20723, USA.J. F. Mustard and L. H. Roach, Department of Geological Sciences,
Brown University, Providence, RI 02912, USA.
E00D11 CALVIN ET AL.: CRISM NORTH POLE SUMMER
15 of 15
E00D11