Market Prioritisation, Jan 10 - Wright Associateswright-associates.com/WA/Resources/file/WA White...
21
White Paper Market Targeting and Prioritisation January 2010
Transcript of Market Prioritisation, Jan 10 - Wright Associateswright-associates.com/WA/Resources/file/WA White...

White Paper
Market Targeting and
Prioritisation
January 2010
© Wright Associates Services Ltd 2010 Tel: +44 (0) 1869 250222
www.wright-associates.com
2
Contents
CONTENTS ................................................................................................... 2
1. INTRODUCTION ..................................................................................... 3
2. SEGMENTATION, TARGETING AND PRIORITISATION ........................... 4
3. MARKET ATTRACTIVENESS..................................................................... 6
SIZE ............................................................................................................... 6
GROWTH ....................................................................................................... 6
STABILITY ........................................................................................................ 6
PRICE SENSITIVITY ............................................................................................ 6
COMPETITION ................................................................................................. 6
4. ABILITY TO ADDRESS MARKET ............................................................... 8
EXISTING MARKET SHARE .................................................................................. 8
RELATIVE BRAND STRENGTH .............................................................................. 8
COST STRUCTURE/MODEL ............................................................................... 9
DISTRIBUTION CHANNELS ................................................................................. 9
CUSTOMER LOYALTY ....................................................................................... 9
PRODUCT/TECHNOLOGY DIFFERENTIATION ........................................................ 9
5. MARKET MODELS ................................................................................. 10
6. TARGETING AND PRIORITISATION IN PRACTICE ................................ 12
SPECIFICATION OF KEY FACTORS ..................................................................... 12
WEIGHTING .................................................................................................. 13
SCORING ..................................................................................................... 14
MODELING................................................................................................... 15
TESTING ........................................................................................................ 15
INTERPRETING AND USING OUTPUT .................................................................. 16
7. SUMMARY ............................................................................................ 21
8. ABOUT WRIGHT ASSOCIATES.............................................................. 21
9. FURTHER INFORMATION ...................................................................... 21
© Wright Associates Services Ltd 2010 Tel: +44 (0) 1869 250222
www.wright-associates.com
3
1. Introduction
This white paper:
• provides an overview of the general principles of market
targeting and prioritisation;
• looks at some of the main theoretical models in use today;
• describes in some detail how Wright Associates has used
enhanced variants of these models to deliver practical,
actionable results for clients.
It is intended to provide both an introduction to the subject for those
new to these concepts, and more detailed information for
experienced marketing strategists.
While the examples and models used are drawn from experience
with large multi-national companies, the principles and processes
described can be applied by any size of organisation and for any
market.
Section 2 explains some of the basic terminology and concepts used
in the white paper. The next two sections cover some of the ideas
behind 'market attractiveness' and 'ability to address market'. Section
5 looks at some of the core market models and Section 6 goes on to
describe in more detail how the market targeting and prioritisation
process can be applied in practice.
…the
principles and
processes
described
can be
applied by
any size of
organisation
and for any
market

© Wright Associates Services Ltd 2010 Tel: +44 (0) 1869 250222
www.wright-associates.com
4
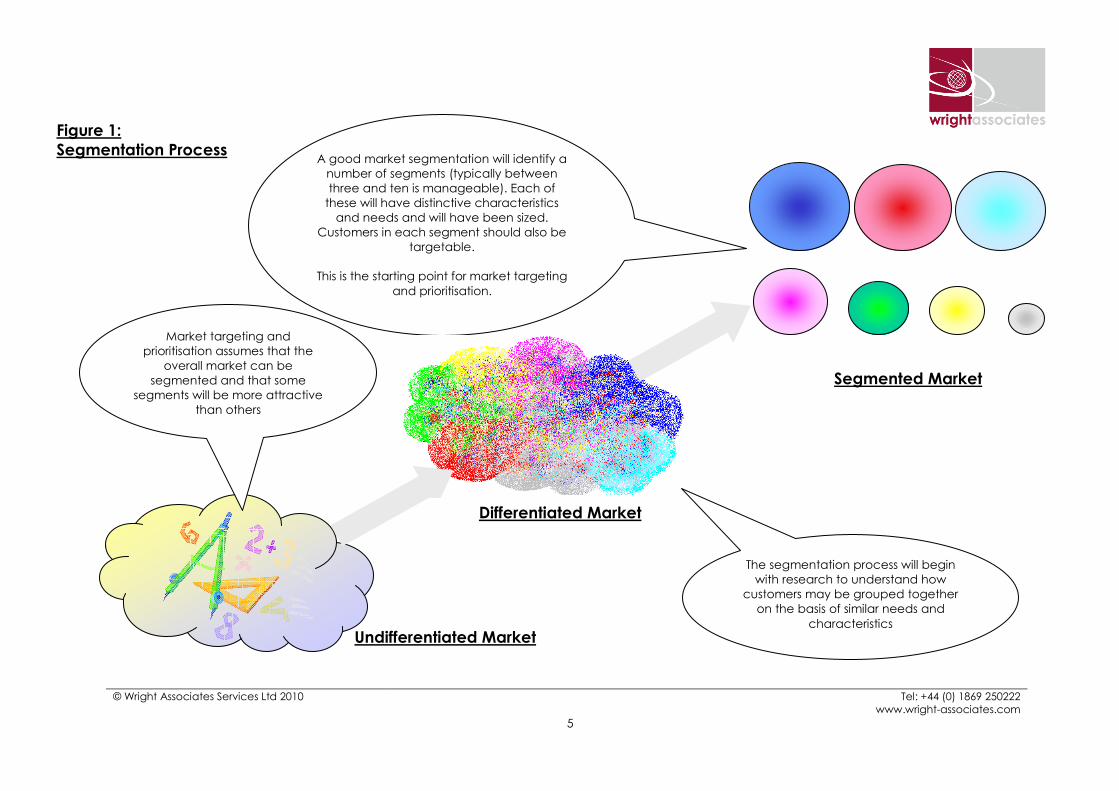
2. Segmentation, Targeting and Prioritisation
Segmentation groups customers with similar needs and
characteristics together in a way that allows them to be targeted.
Figure 1 on the next page shows a basic segmentation process,
moving from an undifferentiated market to a segmented market. This
process is described in more detail in another Wright Associates white
paper 'Customer Segments for Marketing'.
Market targeting is simply the process of choosing which market
segment(s) to address following a segmentation exercise. This usually
involves looking at each segment's attractiveness against some
agreed criteria (typically size and/or growth).
However, most organisations
a. need to address more than one segment, and
b. have limited resources.
We use the term market prioritisation to describe the process of
comparing segments in a methodical way that allows resources to
be allocated between them.
Market segmentation, targeting and prioritisation are the foundation
of marketing strategy and are critical to the development of routes
to market1. The principles of prioritisation can also be used tactically,
for example in the allocation of sales resource to key accounts.
1 Routes to market are the combinations of resources, internal and external, required to deliver a
product or service to a customer through the relationship cycle. Internal resources are those directly
under the control of the organisation. External resources are those resources outside its direct control
but over which it may have some influence, eg channel partners.
Market
segmentation,
targeting and
prioritisation are
the foundation
of marketing
strategy…
© Wright Associates Services Ltd 2010 Tel: +44 (0) 1869 250222
www.wright-associates.com
5
Figure 1:
Segmentation Process
Undifferentiated Market
Segmented Market
Market targeting and
prioritisation assumes that the
overall market can be
segmented and that some
segments will be more attractive
than others
A good market segmentation will identify a
number of segments (typically between
three and ten is manageable). Each of
these will have distinctive characteristics
and needs and will have been sized.
Customers in each segment should also be
targetable.
This is the starting point for market targeting
and prioritisation.
The segmentation process will begin
with research to understand how
customers may be grouped together
on the basis of similar needs and
characteristics
Differentiated Market
© Wright Associates Services Ltd 2010
6
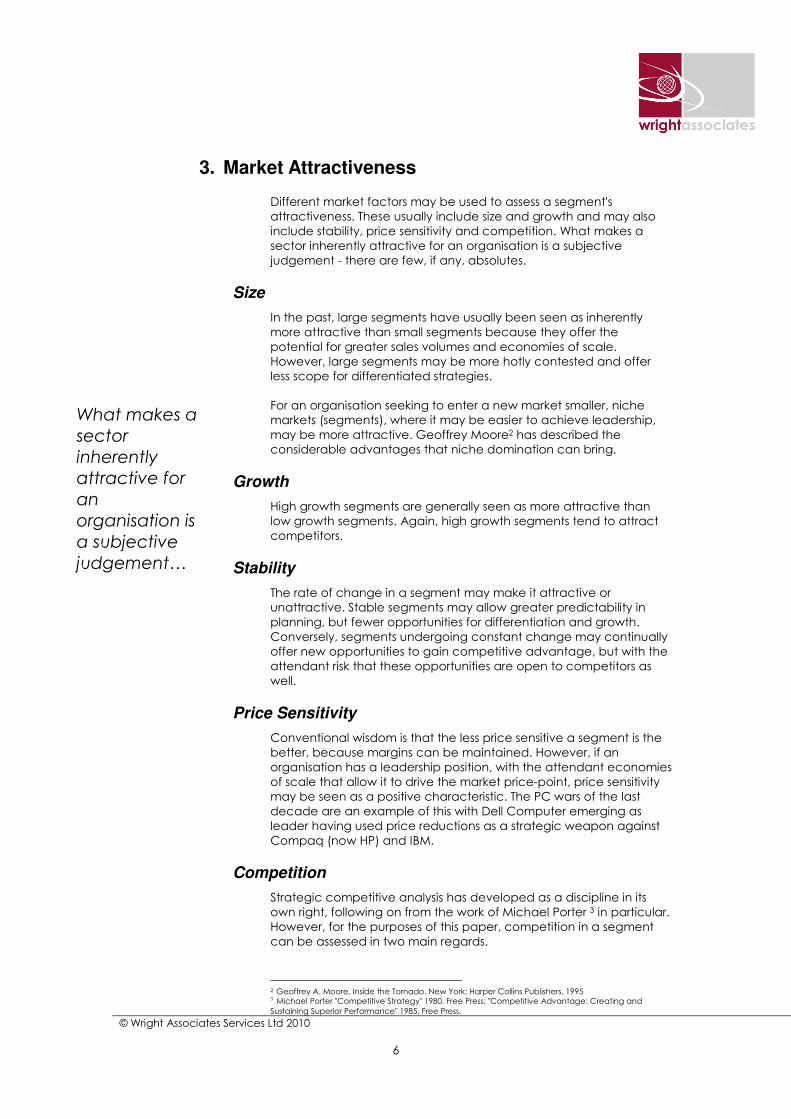
3. Market Attractiveness
Different market factors may be used to assess a segment's
attractiveness. These usually include size and growth and may also
include stability, price sensitivity and competition. What makes a
sector inherently attractive for an organisation is a subjective
judgement - there are few, if any, absolutes.
Size
In the past, large segments have usually been seen as inherently
more attractive than small segments because they offer the
potential for greater sales volumes and economies of scale.
However, large segments may be more hotly contested and offer
less scope for differentiated strategies.
For an organisation seeking to enter a new market smaller, niche
markets (segments), where it may be easier to achieve leadership,
may be more attractive. Geoffrey Moore2 has described the
considerable advantages that niche domination can bring.
Growth
High growth segments are generally seen as more attractive than
low growth segments. Again, high growth segments tend to attract
competitors.
Stability
The rate of change in a segment may make it attractive or
unattractive. Stable segments may allow greater predictability in
planning, but fewer opportunities for differentiation and growth.
Conversely, segments undergoing constant change may continually
offer new opportunities to gain competitive advantage, but with the
attendant risk that these opportunities are open to competitors as
well.
Price Sensitivity
Conventional wisdom is that the less price sensitive a segment is the
better, because margins can be maintained. However, if an
organisation has a leadership position, with the attendant economies
of scale that allow it to drive the market price-point, price sensitivity
may be seen as a positive characteristic. The PC wars of the last
decade are an example of this with Dell Computer emerging as
leader having used price reductions as a strategic weapon against
Compaq (now HP) and IBM.
Competition
Strategic competitive analysis has developed as a discipline in its
own right, following on from the work of Michael Porter 3 in particular.
However, for the purposes of this paper, competition in a segment
can be assessed in two main regards.
2 Geoffrey A. Moore, Inside the Tornado. New York: Harper Collins Publishers, 1995 3 Michael Porter "Competitive Strategy" 1980, Free Press; "Competitive Advantage: Creating and
Sustaining Superior Performance" 1985, Free Press.
What makes a
sector
inherently
attractive for
an
organisation is
a subjective
judgement…
© Wright Associates Services Ltd 2010 Tel: +44 (0) 1869 250222
www.wright-associates.com
7
The first of these is the extent and nature of the existing competition.
If there are few or weak competitors in a segment then it is likely to
be more attractive than one where there is strong competition.
Factors that can fuel intensity of competition include:
• The presence of several players with similar shares, struggling
for leadership.
• Willingness of customers to switch products/suppliers.
• Standardisation and commoditisation of products.
• Ready availability of products through multiple channels.
• Ease of price comparison.
Secondly, consideration must be given to the likelihood of new
competitors entering the market. If the barriers to market entry are
low, the threat of new entrants, perhaps using new technology to
gain advantage, needs to be taken into account. Barriers to entry
can include a high marketing costs or investment in new production
capacity, patents, or high switching costs for customers. Segments
where an organisation can take advantage of such barriers are likely
to be more attractive than those freely open to new entrants.
…consideration
must be given
to the likelihood
of new
competitors
entering the
market
© Wright Associates Services Ltd 2010 Tel: +44 (0) 1869 250222
www.wright-associates.com
8
4. Ability to Address Market
These are essentially factors over which the organisation has some
control. The phrases 'competitive strength' and 'ability to address
market' are often treated as interchangeable. However, 'ability to
address market' is sometimes preferred as it includes capabilities and
advantages that may be potential rather than actual for a new
segment being assessed.
Factors that affect the ability to address a market can include the
following.
• Existing market share
• Relative brand strength
• Cost structure/model
• Distribution channels
• Customer loyalty
• Product/technology differentiation
It must be stressed that this is just a selection of factors.
Understanding what can make a difference in a market is a critical
success factor in itself.
Existing Market Share
Presence in a market over time brings advantages such as
established awareness of the company and its products and the
ability to leverage reference customers. These advantages become
much more accentuated if the company is the market leader. For
example:
• in industrial markets invitations to tender may only be issued as
a matter of course to the top two or three suppliers in the
market;
• in FMCG markets where shelf space in stores is at a premium,
supermarkets will typically stock their own brand, the market
brand leader and perhaps the number two brand if strong.
Relative Brand Strength
There are as many definitions of what a brand is as there are
marketing textbooks. However, it is generally accepted that two
measurable dimensions of a brand are recognition (eg the
proportion of the population in a market that are aware of the
brand) and perception (how positively or negatively the brand is
perceived by those aware of it).
Other things being equal, strong brands will typically do better than
unknown or poorly perceived brands. This may be a self-fulfilling
prophecy in markets where a company is already established, but
the challenge becomes more interesting when considering new
markets.
If a company has built a strong brand in one market this may provide
it with credibility and reputation to assist new market entry (the 'halo
Understanding
what can
make a
difference in a
market is a
critical
success factor
in itself
© Wright Associates Services Ltd 2010 Tel: +44 (0) 1869 250222
www.wright-associates.com
9
effect'). The extent to which brand can be leveraged in this way
requires careful judgement. Extending a strong brand also carries the
risk of damaging it should problems be encountered in the new
market.
Cost Structure/Model
Being able to deliver a comparable product or service at a
consistently lower cost than the competition is clearly a major
advantage in most markets.
Such a cost advantage can come from size (economies of scale),
operational efficiencies (being better at doing the same things as
the competition are doing) or structural differences (doing things in a
different way to the competition). Examples of the latter have
become common as technological change (eg the growth of call
centres and the web) has allowed new competitors to disrupt long-
established market hierarchies.
Distribution Channels
At the simplest level, channel partners can provide an organisation
with market reach that would be too expensive to provide directly. If
the organisation has too few channel partners potential customers
may be unable to access the product or service. There is also a
danger in having too many channel partners (over-distribution) as
this can lead to channel conflict, internal competition and market
price erosion.
Just as importantly, channel partners are usually responsible for
delivering a substantial part of the brand experience to the end
customer. If an organisation recruits the wrong channel partners, or
manages them badly, its brand can be severely damaged.
For these reasons the ability to access and leverage distribution
channels of different types, effectively, can be a major source of
competitive advantage.
Customer Loyalty
Customer loyalty can be a significant source of advantage and a
barrier to competitors. Apart from the greater likelihood of their
continuing to purchase from the company, loyal customers can help
by providing word of mouth recommendation, acting as reference
accounts and participating in PR activities.
Product/Technology Differentiation
"Build a better mousetrap and the world will beat a path to your
door"4 is the foundation of many product strategies. However, in most
markets the time advantage which a new product innovation can
provide is reducing all the time as a consequence of ever increasing
globalisation and shortening development cycles.
There are exceptions to this, for example where a product or
technology can be protected by patent. But for the most part an
organisation should look at its ability to continue to innovate and
differentiate its products over time against its competitors, rather
than at the current uniqueness of a product.
4 Attributed to Ralph Waldo Emerson.
If an
organisation
recruits the
wrong
channel
partners… its
brand can be
severely
damaged
© Wright Associates Services Ltd 2010 Tel: +44 (0) 1869 250222
www.wright-associates.com
10
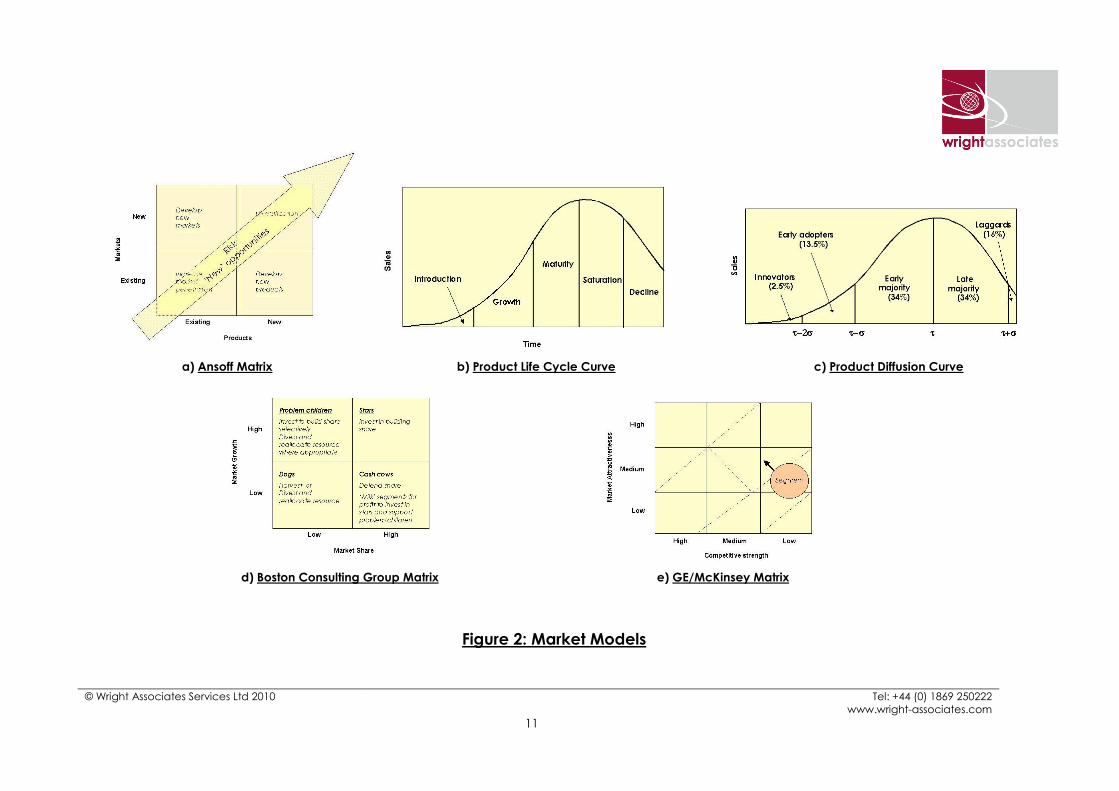
5. Market Models
When assessing the attractiveness of a segment, different models
can be used to give different perspectives. A selection of some of
the most useful models is shown in Figure 2.
• The Ansoff Matrix5 is still used to look at market segments in the
context of product development strategy. Broadly speaking,
moving into new products or markets offers more opportunities
for growth, but also involves greater risk. It is often suggested
that product strategy should balance activity across the four
quadrants. However, an organisation also needs to take
account of its own particular strengths and objectives (eg its
attitude towards risk).
• The product life cycle and the product diffusion curves are
also commonly used in product and brand management. The
essential premise is that sales of a product follow a predictable
pattern of development with recognisable stages, and that
different parts of a market will begin to adopt the product at
different stages. A very important enhancement to this is the
Chasm Model developed by Geoffrey Moore (qv).
• The Boston Consulting Group Matrix focuses on market growth
and share for portfolio management. It makes the reasonable
assumption that a company benefits from high market share
and high growth in its markets. It is a well-used model that
generates easy to understand strategy options. For example,
'stars' need to be invested in heavily to develop or maintain a
leadership position, so net cash flow may be balanced. As
market growth slows the company should be able to reap the
rewards of investment in its previous 'stars'. The level of
investment required to maintain share is much lower, but the
high share is generating large amounts of cash profitably -
hence the term 'cash cow'.
• Another portfolio planning tool is the General
Electric/McKinsey Matrix. Originally developed to assess SBU6
strength, it can be used to plot segments in terms of market
attractiveness and competitive strength. This is an
enhancement of the BCG Matrix and is particularly useful
because it allows an organisation to take account of its own
strengths and weaknesses when targeting and prioritising
markets.
There is no 'best' model. All have their strengths and weaknesses and
it must always be borne in mind that they are models. That is to say
they are ways of simply representing the real world. Real markets are
highly complex and involve the interplay of hundreds of factors. In
consequence, models should be seen as useful aids to intelligent
analysis, and not a substitute for the application of thought and
insight based on experience.
Wright Associates has substantial expertise in selecting and deploying
marketing models on behalf of clients, including the development of
sophisticated variants to meet the needs of individual companies
and situations.
5 Igor Ansoff, 'Strategies for Diversification', 1957, Harvard Business Review. 6 Strategic business unit - an SBU can range from an operating company or division to a product line or
brand.
…models should
be seen as useful
aids to intelligent
analysis, not a
substitute for the
application of
thought…
© Wright Associates Services Ltd 2010 Tel: +44 (0) 1869 250222
www.wright-associates.com
11
Figure 2: Market Models
c) Product Diffusion Curve a) Ansoff Matrix b) Product Life Cycle Curve
e) GE/McKinsey Matrix d) Boston Consulting Group Matrix

© Wright Associates Services Ltd 2010 Tel: +44 (0) 1869 250222
www.wright-associates.com
12
6. Targeting and Prioritisation in Practice
The market models shown in Figure 2 are two-dimensional
representations of complex variables. To be applied in practice they
need to be able to model more than one variable, and to obtain the
best results it is usually necessary to adapt one or more of the models
to meet the specific needs of the company and situation.
For the rest of this section we will use the GE/McKinsey model as a
starting point to describe the targeting and prioritisation process.
The process usually involves the following steps.
• Specification of the key factors for the two axes.
• Weighting of the relative importance of the factors.
• Scoring of each segment against each of the key factors.
• Modeling of the weighting and scoring, including sensitivity
analysis.
• Interpretation of the resulting output (usually in the form of a
graphical plot) and use it to assist decision-making.
Specification of key factors
All of the steps are important, but this is particularly critical as it
provides the foundation for the whole process. The organisation must
give careful consideration to what factors make a market inherently
attractive and what factors determine ability to address the market.
There are several pitfalls that need to be avoided at this stage.
• Ignoring factors that are important, but difficult to measure.
With application most 'soft' factors can be quantified
sufficiently to allow comparison.
• Lack of precision in defining and articulating precisely what is
meant by each factor.
• Duplicating very similar factors (although this can be
addressed through weighting).
• Focusing only on the strengths/weaknesses of one part of the
organisation (sometimes, for example, sales and marketing
factors may be over-represented, with factors related to
product development or manufacturing given little
consideration).
• Concentrating only on the organisation's own ability to
address the market, ie ignoring competitors.
…to obtain
the best results
it is usually
necessary to
adapt… the
models to
meet the
specific needs
of the
company and
situation
© Wright Associates Services Ltd 2010 Tel: +44 (0) 1869 250222
www.wright-associates.com
13
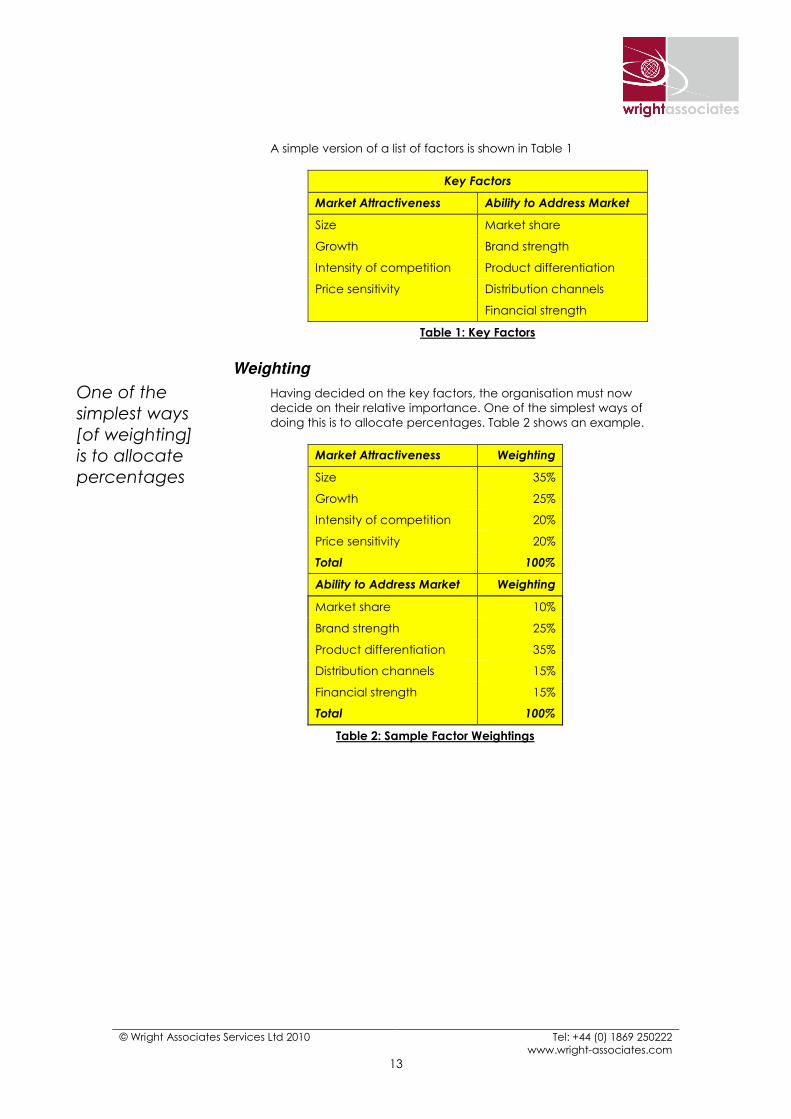
A simple version of a list of factors is shown in Table 1
Key Factors
Market Attractiveness Ability to Address Market
Size Market share
Growth Brand strength
Intensity of competition Product differentiation
Price sensitivity Distribution channels
Financial strength
Table 1: Key Factors
Weighting
Having decided on the key factors, the organisation must now
decide on their relative importance. One of the simplest ways of
doing this is to allocate percentages. Table 2 shows an example.
Market Attractiveness Weighting
Size 35%
Growth 25%
Intensity of competition 20%
Price sensitivity 20%
Total 100%
Ability to Address Market Weighting
Market share 10%
Brand strength 25%
Product differentiation 35%
Distribution channels 15%
Financial strength 15%
Total 100%
Table 2: Sample Factor Weightings
One of the
simplest ways
[of weighting]
is to allocate
percentages

© Wright Associates Services Ltd 2010 Tel: +44 (0) 1869 250222
www.wright-associates.com
14
Scoring
A rational scheme has to be found for scoring each factor. Taking
one factor from Table 2 as an example, let us say a company has
decided that markets between €100m and €250m in size are ideal.
Table 3 shows how scoring criteria might look for this factor.
Market Attractiveness Factor: Market Size
Criteria Score Rationale
<€50m 0 Market too small.
€50m - €100m 2 Market may not provide substantial
revenue, but it may be possible to
achieve dominance, quickly.
€101m - €250m 5 This is the 'sweet spot' in terms of size
for this organisation. It is large enough
to generate significant revenue and
allow economies of scale, but small
enough for them to aim realistically
for a leadership position (in terms of
share).
€251 - €500m 3 The market is large enough to provide
substantial revenue opportunity, but is
getting too large for share leadership
to be achieved in a reasonable
timescale. It needs to be segmented
further to identify smaller, more
attractive segments.
€501m - €1,000m 2
>€1,000m 1
Table 3: Sample Scoring Criteria
Scoring needs to reflect the importance of each criterion and does
not have to be linear, as can be seen in Table 3.
Using different scoring ranges for different factors (eg 0 to 5 for one,
0 to 10 for another) effectively introduces a second level of
weighting. This might be acceptable in some instances, but as a
general rule the scoring ranges should be similar for each factor.
Scoring…
does not
have to be
linear…
© Wright Associates Services Ltd 2010 Tel: +44 (0) 1869 250222
www.wright-associates.com
15
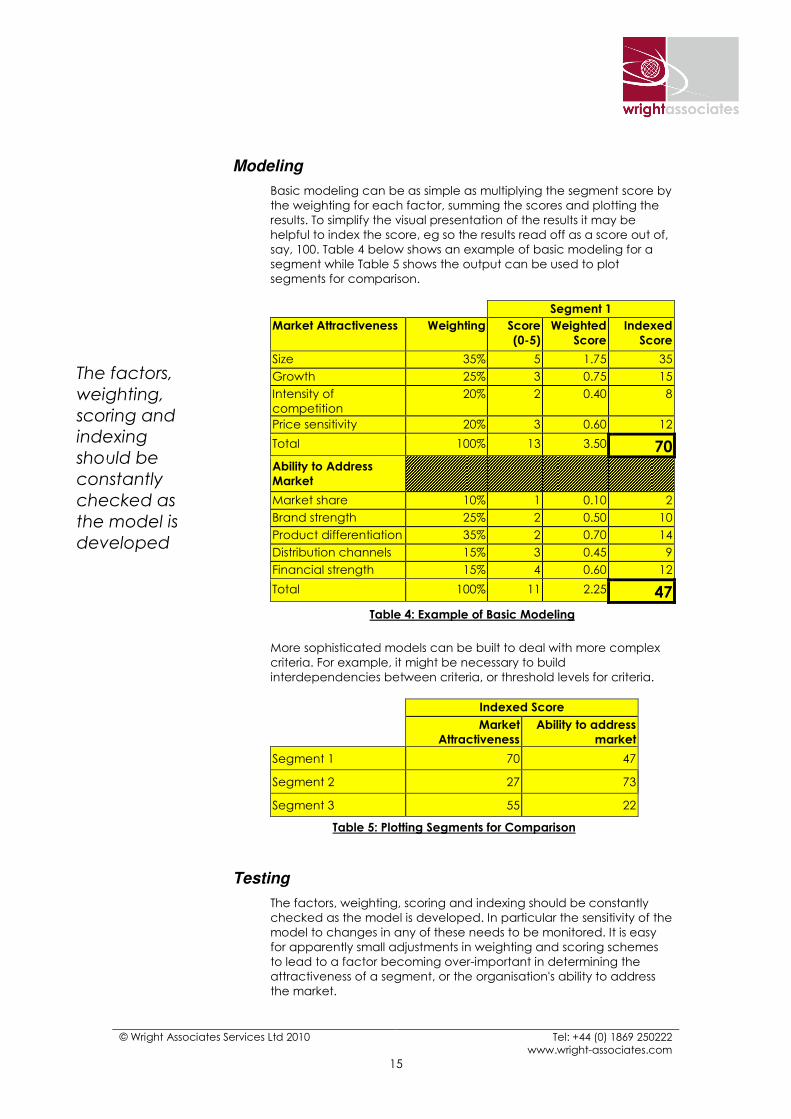
Modeling
Basic modeling can be as simple as multiplying the segment score by
the weighting for each factor, summing the scores and plotting the
results. To simplify the visual presentation of the results it may be
helpful to index the score, eg so the results read off as a score out of,
say, 100. Table 4 below shows an example of basic modeling for a
segment while Table 5 shows the output can be used to plot
segments for comparison.
Segment 1
Market Attractiveness Weighting Score
(0-5)
Weighted
Score
Indexed
Score
Size 35% 5 1.75 35
Growth 25% 3 0.75 15
Intensity of
competition
20% 2 0.40 8
Price sensitivity 20% 3 0.60 12
Total 100% 13 3.50 70 Ability to Address
Market
Market share 10% 1 0.10 2
Brand strength 25% 2 0.50 10
Product differentiation 35% 2 0.70 14
Distribution channels 15% 3 0.45 9
Financial strength 15% 4 0.60 12
Total 100% 11 2.25 47
Table 4: Example of Basic Modeling
More sophisticated models can be built to deal with more complex
criteria. For example, it might be necessary to build
interdependencies between criteria, or threshold levels for criteria.
Indexed Score
Market
Attractiveness
Ability to address
market
Segment 1 70 47
Segment 2 27 73
Segment 3 55 22
Table 5: Plotting Segments for Comparison
Testing
The factors, weighting, scoring and indexing should be constantly
checked as the model is developed. In particular the sensitivity of the
model to changes in any of these needs to be monitored. It is easy
for apparently small adjustments in weighting and scoring schemes
to lead to a factor becoming over-important in determining the
attractiveness of a segment, or the organisation's ability to address
the market.
The factors,
weighting,
scoring and
indexing
should be
constantly
checked as
the model is
developed

© Wright Associates Services Ltd 2010 Tel: +44 (0) 1869 250222
www.wright-associates.com
16
Once the first version is developed it needs to be tested more
formally. One of the most straightforward ways of doing this is to use
current or historical data for markets the organisation knows well. If
the model generates a picture that does not reflect the known reality
then it probably needs to be revisited.
This is an iterative process that needs to continue until the model is
sensitive enough to differentiate segments, but stable enough not to
fluctuate disproportionately with small changes in the factors.
Interpreting and Using Output
The position of the three segments shown in Figure 3 is based on the
data shown in Table 5. It is common for the size of circles used for
each to reflect a characteristic of each segment, usually size. This
can be taken further, with the circles becoming pie charts showing
share of the segment. Sometimes an arrow is added showing the
expected change in position of the segment over time.
Interpretation of this simple modeling of three segments might be as
follows.
Segment 1
This is a large attractive segment, but the company's ability to
address it is lower than desirable. To succeed here the company
needs to invest in capability to address the segment.
Segment 2
This is a segment where the company is strongly competitive, but it is
relatively unattractive. Appropriate strategies here could be to
withdraw completely and reallocate the resources to more
attractive segments, or to harvest revenue and margin with the
minimum of investment.
Figure 3: Basic Segment Plotting
This… needs to
continue until the
model is sensitive
enough... but
stable enough
not to fluctuate
disproportionately
© Wright Associates Services Ltd 2010 Tel: +44 (0) 1869 250222
www.wright-associates.com
17
Segment 3
This segment is moderately attractive, but the company's ability to
address it is very low. It may be that the investment required to
improve capability is too great for the likely returns.
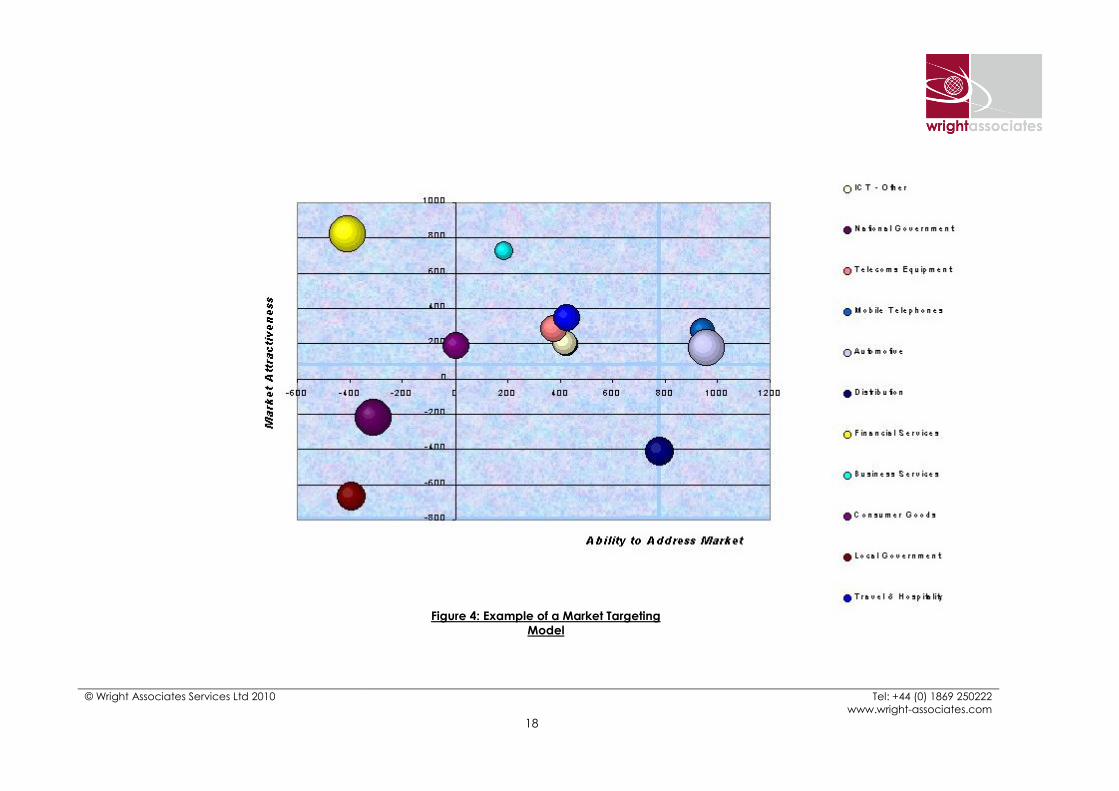
This is a basic model. A more sophisticated example used by a multi-
national company is shown in Figure 4. This looks at comparing whole
industries as segments, but it is important to note that the same
techniques can be used down to compare micro-segments, and
even individual customers (eg in determining the level of investment
to be made in developing key accounts).
As stated earlier, market prioritisation goes further than traditional
market targeting. It assumes that:
a) there is a quantifiable cost (investment or saving) associated
with changing the factors comprising the ability to address the
market;
b) changing the ability to address the market will affect market
share;
c) it is possible to model this relationship and so make
comparisons of return on investment for different markets.
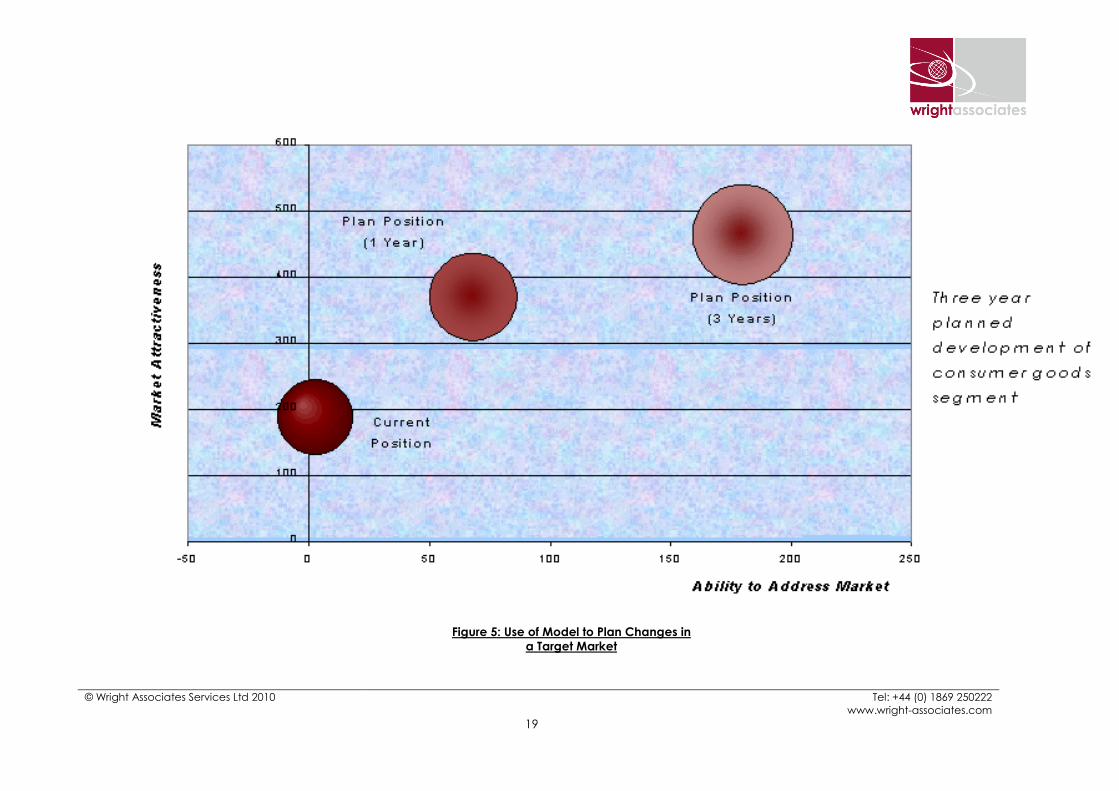
In general, the most favourable markets will be those providing the
greatest return on investment over time. Figure 5 shows how the
model can be used to assist planning changes to address a
particular target market. For the situation shown, the cost of moving
position in the target market would be compared with the expected
revenue and profit. In this way the model can be used to compare
the financial implications of strategic marketing decisions. This can
be extended still further through the use of optimisation techniques to
assist senior management with operational decision-making.
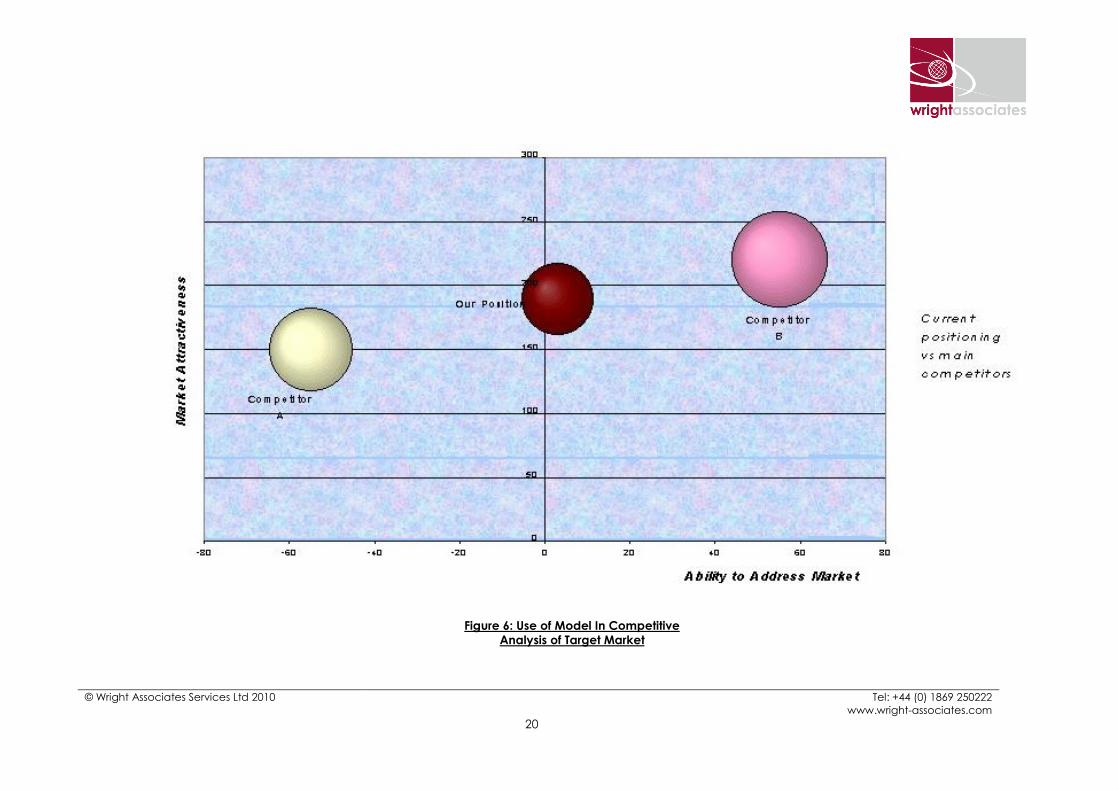
The same principles can be used to compare positioning in a
segment against key competitors as shown in Figure 67. This can be a
very useful tool for competitive analysis as it requires consideration of
what makes a market attractive to a competitor, as well as an
analysis of their strengths and weaknesses. By modeling this over
time, eg taking account of market maturity and predicted product
life cycles, a picture can be built up of the evolution of the
competitive environment with likely entry and exit points for key
competitors.
7 Here the size of the bubbles may represent market share.
…the most
favourable
markets will be
those
providing the
greatest return
on investment
over time
© Wright Associates Services Ltd 2010 Tel: +44 (0) 1869 250222
www.wright-associates.com
18
Figure 4: Example of a Market Targeting
Model
© Wright Associates Services Ltd 2010 Tel: +44 (0) 1869 250222
www.wright-associates.com
19
Figure 5: Use of Model to Plan Changes in
a Target Market
© Wright Associates Services Ltd 2010 Tel: +44 (0) 1869 250222
www.wright-associates.com
20
Figure 6: Use of Model In Competitive
Analysis of Target Market
© Wright Associates Services Ltd 2010 Tel: +44 (0) 1869 250222
www.wright-associates.com
21
7. Summary
Market segmentation, targeting and prioritisation provide the
foundations for effective marketing strategy.
Segmentation groups customers with similar needs and
characteristics together in a way that allows them to be targeted.
Market targeting is the process of selecting which segments to
address based primarily on their attractiveness and the company's
ability to address the segment. This is taken further in market
prioritisation with greater quantification of the resources needed to
achieve success in a target segment, so allowing segments to be
compared on the basis of (for example) return on investment.
No single model should be relied upon to give a definitive picture of
the market, and it is usually necessary to use several approaches,
often with customisation, to give the most effective results for any
particular company and situation.
These techniques have been used by Wright Associates successfully
with clients ranging from multi-national companies to start-ups and
SMEs. Tangible benefits result from this methodical approach, for
example
• maximised return on sales and marketing investment;
• efficient use of resources to address the right market
opportunities;
• reduced risk through rigorous planning, including the
assessment of 'what if' scenarios;
• a consistent market view allowing segment comparisons and
competitive analysis within segments.
8. About Wright Associates
Founded in 1994 Wright Associates is a management consultancy
firm offering support to senior executives lacking the time or resource
to deal with critical issues as fast as they would like. Our clients range
from corporates to SMEs and start-ups. We work across business
sectors with a particularly strong track record in technology, media
and services. Our services are grouped into focus areas:
• Go to market
• Decision support and planning
• Sales performance
• Africa solutions
• Organisational support
9. Further Information
For further information please contact Wright Associates:
telephone: +44 (0) 1869 250222
email: [email protected]
web: www.wright-associates.com
No single
model should
be relied upon
to give a
definitive
picture of the
market