MARKET POWER IN EUROPEAN BANKING SECTORSMARKET POWER IN EUROPEAN BANKING SECTORS Juan Fernández de...
27
MARKET POWER IN EUROPEAN BANKING SECTORS * Juan Fernández de Guevara, Joaquín Maudos and Francisco Pérez ** WP-EC 2002-05 Correspondence to: Juan Fernández de Guevara, Instituto Valenciano de Investigaciones Económicas, C/ Guardia Civil, 22, Esc.2, 1º, 46020-Valencia, Tel: 96- 393 08 16, Fax: 96-393 08 56, E-mail: [email protected] Editor: Instituto Valenciano de Investigaciones Económicas, S.A. Primera Edición Marzo 2002 Depósito Legal: V-1009-2002 IVIE working papers offer in advance the results of economic research under way in order to encourage a discussion process before sending them to scientific journals for their final publication. * The authors wish to thank the financial aid of the Ministerio de Ciencia y Tecnología (SEC2001-2950) and Generalitat Valenciana (GV99-103-1-08). ** J. Fernández de Guevara: Ivie; J. Maudos y F. Pérez: Ivie y Universitat de València.
Transcript of MARKET POWER IN EUROPEAN BANKING SECTORSMARKET POWER IN EUROPEAN BANKING SECTORS Juan Fernández de...
MARKET POWER
IN EUROPEAN BANKING SECTORS*
Juan Fernández de Guevara, Joaquín Maudos and Francisco Pérez**
WP-EC 2002-05
Correspondence to: Juan Fernández de Guevara, Instituto Valenciano deInvestigaciones Económicas, C/ Guardia Civil, 22, Esc.2, 1º, 46020-Valencia, Tel: 96-393 08 16, Fax: 96-393 08 56, E-mail: [email protected]
Editor: Instituto Valenciano de Investigaciones Económicas, S.A.
Primera Edición Marzo 2002
Depósito Legal: V-1009-2002
IVIE working papers offer in advance the results of economic research underway in order to encourage a discussion process before sending them to scientificjournals for their final publication.
* The authors wish to thank the financial aid of the Ministerio de Ciencia y Tecnología (SEC2001-2950)
and Generalitat Valenciana (GV99-103-1-08).
** J. Fernández de Guevara: Ivie; J. Maudos y F. Pérez: Ivie y Universitat de València.
2
MARKET POWER IN EUROPEAN BANKING SECTORS
Juan Fernández de Guevara, Joaquín Maudos and Francisco Pérez
ABSTRACT
This study analyses the evolution of market power in the banking sectors of theEuropean Union based on the estimation of Lerner indices. Using a panel of 18,810observations of the banking industries of Germany, France, Italy, Spain and the UnitedKingdom during the period 1992-99, the results show substantial differences betweencountries. The evolution of the Lerner index does not show an increase in the degree ofcompetition within the EU, despite the liberalisation measures implemented in order tocreate a single banking market. The study discusses the limitations to the interpretationof the Lerner index as an indicator of the degree of competition, and analyses itsdetermining factors.
Key words: market power, competition, European banking sectors.
JEL: D40, G21, L10
RESUMEN
Este trabajo analiza la evolución del poder de mercado en los sectores bancariosde la Unión Europea a partir de la estimación de índices de Lerner. Utilizando un panelde 18,810 observaciones de los sectores bancarios de Alemania, Francia, Italia, Españay Reino Unido durante de periodo 1992-99, los resultados muestran importantesdiferencias por países, siendo los sectores bancarios del Reino Unido e Italia los quepresentan mayores valores del índice. La evolución del índice de Lerner en el periodoanalizado no muestra un aumento en el grado de competencia en el seno de la UE, apesar de las medidas liberalizadoras implementadas con objeto de crear un mercadoúnico bancario. El trabajo discute las limitaciones a la interpretación del índice deLerner como indicador del grado de competencia y analiza sus factores determinantes.A este respecto, la concentración del mercado, el tamaño de las empresas y el riesgoaparecen como variables significativas. En el caso de la concentración, la influencianegativa en el mercado de depósitos y no siendo significativa en el mercado depréstamos permiten rechazar la hipótesis de colusión.
Palabras clave: poder de mercado, competencia, sectores bancarios europeos.
3
1. Introduction
The banking industries of the European Union have been subjected during the
last decade to continual transformations deriving from the implantation of new
technologies, deregulation, the globalisation of the economy, economic integration, etc.,
which have altered the conditions in which banking firms compete. At the same time,
European banks have taken part in a wave of mergers and acquisitions that have
produced a reduction in the number of firms and an increase in the concentration of
markets1. These years saw increased consolidation at both national and European levels
as Europe moved towards a single banking and capital market as a result of the Single
Market Programme, Monetary Union, and the Second Banking Directive.
Although the transformations described may have increased the levels of
competition in banking industries, the increase in market concentration poses a question
about the final result of the degree of competition. Indeed, the recent studies by De
Bandt and Davis (2000) and Corvoisier and Gropp (2001) show that in the principal
European countries and in some banking products there existed situations of
monopolistic competition in the 1990s, and the monopoly situation was even accepted
in banks that acted in small markets2.
The aim of this study is to evaluate whether the set of circumstances that have
accompanied the liberalisation measures tending to the creation of a single market have
caused variations in the differences in the degree of competition among the different
banking industries of the European Union, and for this purpose Lerner indices were
calculated from the estimation of marginal costs and prices and their determinants were
analysed. The period analysed covers the years from 1992 to 1999.
The assumptions used in the modelling of banking markets when calculating
relative margins are important for the interpretation of the margins. Also important are
the hypotheses used in the empirical estimation, because the simplifications introduced
to overcome the insufficiencies of the data may affect the meaning of the results. In the
case of the analyses based on the Lerner index both aspects are relevant for discussing
1 See European Central Bank (2000a)
2 In the case of De Bandt and Davis (2000), by applying the Panzar and Rosse test on the basis ofestimations of revenue functions, and in the case of Corvoisier and Gropp (2001), by estimating thedeterminants of banking margins.

4
the causes of the evolution of the indices (such as market concentration, specialisation
of firms, size, risk, the growth of the economy) and their relationship to market power.
The rest of the paper is structured as follows. Section 2 describes the theoretical
foundations of the Lerner index in the specific case of banking firms, as well as its
estimation, meaning and determining factors. Section 3 presents the sample and
variables used and the methodology and empirical approach used in estimating the
Lerner index. Section 4 shows the empirical results obtained. Finally, section 5 contains
the conclusions.
2. The Lerner index
The Lerner index in banking firms
In the case of banking firms, the model most often used as a reference from
which a Lerner index expression is obtained is the Monti-Klein imperfect competition
model3. This model examines the behaviour of a monopolistic bank faced with a loan
demand curve of negative slope L(rL) and a deposit supply of positive slope D(rD). The
decision variables of the bank are L (volume of loans) and D (volume of deposits), as
for simplicity's sake the level of capital is assumed to be given. The bank is assumed to
be price taker in the inter-bank market (r), so that the objective function of profits to be
maximised is as follows4:
( )( ) ( )( ) ( )DLCDDrrLrLrDL DL ,),( −−+−=Π=Π (1)
so that profit is the net interest income between loans and deposits, after deduction of
the transformation costs C(L,D). The first order conditions with respect to loans and
deposits are as follows:
3 Monti (1972) and Klein (1971).
4 See an exposition of the models in Freixas and Rochet (1997).
5
0
0
=∂∂
−−+∂∂
−=∂Π∂
=∂∂
−−+∂∂
=∂Π∂
D
CrrD
D
r
D
LC
rrL
r
L
DD
LL
(2)
or,
DD
D
LL
L
er
D
Crr
er
L
Crr
1
1
*
*
*
*
=
∂∂
−−
=
∂∂
−−
(3)
eL and eD being the elasticities of demand for loans and deposits, respectively.
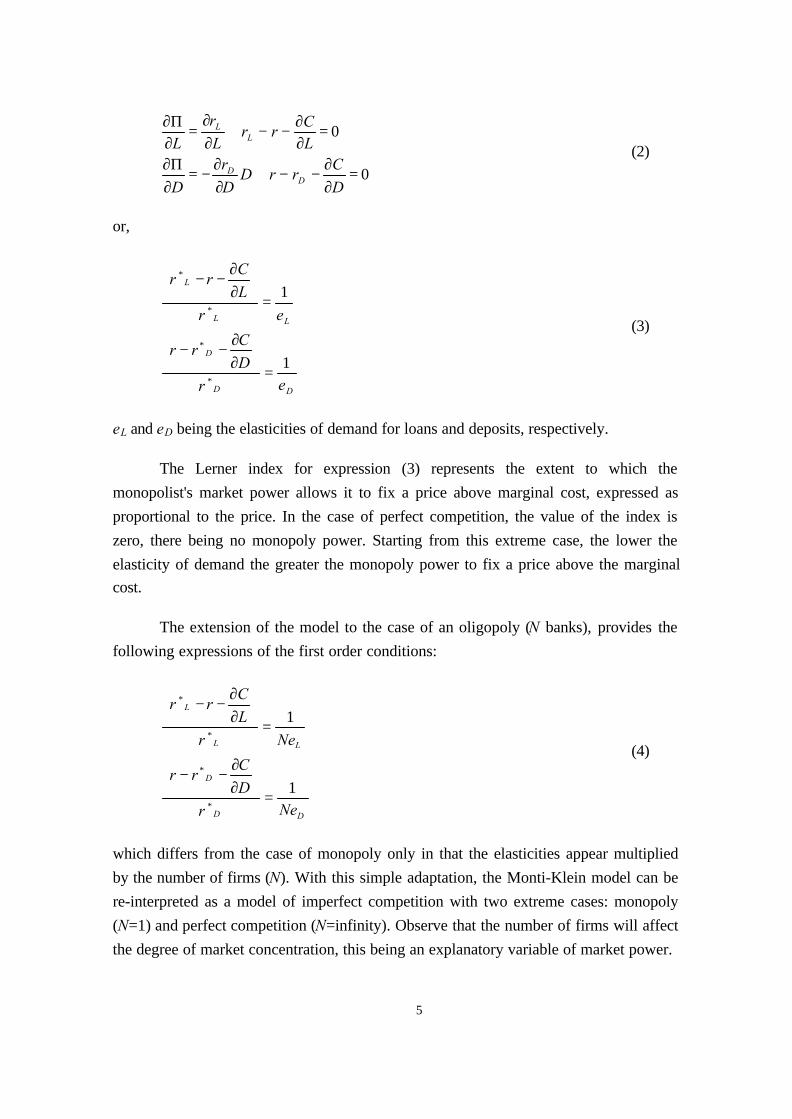
The Lerner index for expression (3) represents the extent to which the
monopolist's market power allows it to fix a price above marginal cost, expressed as
proportional to the price. In the case of perfect competition, the value of the index is
zero, there being no monopoly power. Starting from this extreme case, the lower the
elasticity of demand the greater the monopoly power to fix a price above the marginal
cost.
The extension of the model to the case of an oligopoly (N banks), provides the
following expressions of the first order conditions:
DD
D
LL
L
Ner
D
Crr
Ner
L
Crr
1
1
*
*
*
*
=
∂∂
−−
=
∂∂
−−
(4)
which differs from the case of monopoly only in that the elasticities appear multiplied
by the number of firms (N). With this simple adaptation, the Monti-Klein model can be
re-interpreted as a model of imperfect competition with two extreme cases: monopoly
(N=1) and perfect competition (N=infinity). Observe that the number of firms will affect
the degree of market concentration, this being an explanatory variable of market power.
6
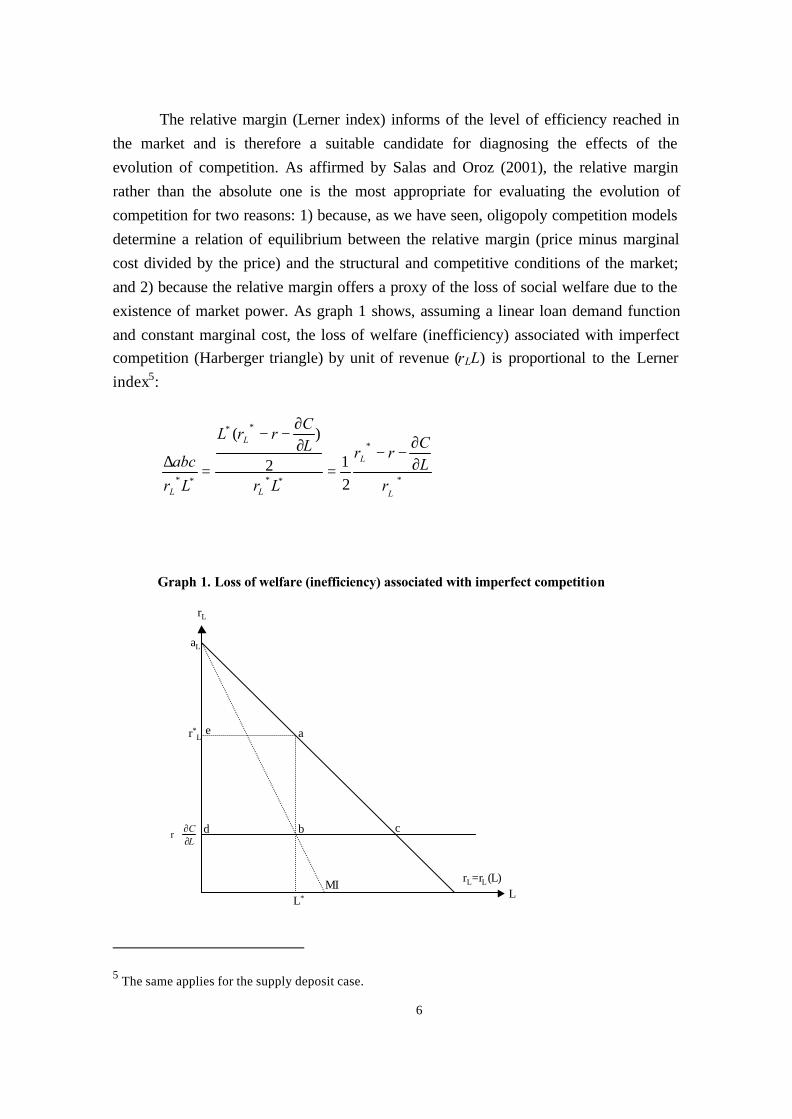
The relative margin (Lerner index) informs of the level of efficiency reached in
the market and is therefore a suitable candidate for diagnosing the effects of the
evolution of competition. As affirmed by Salas and Oroz (2001), the relative margin
rather than the absolute one is the most appropriate for evaluating the evolution of
competition for two reasons: 1) because, as we have seen, oligopoly competition models
determine a relation of equilibrium between the relative margin (price minus marginal
cost divided by the price) and the structural and competitive conditions of the market;
and 2) because the relative margin offers a proxy of the loss of social welfare due to the
existence of market power. As graph 1 shows, assuming a linear loan demand function
and constant marginal cost, the loss of welfare (inefficiency) associated with imperfect
competition (Harberger triangle) by unit of revenue (rLL) is proportional to the Lerner
index5:
*
*
**
**
** 2
12
)(
L
L
L
L
L rLC
rr
Lr
LC
rrL
Lr
abc ∂∂
−−=
∂∂
−−
=∆
5 The same applies for the supply deposit case.
L
rL
r*L ae
d b
L*
aL
c
Graph 1. Loss of welfare (inefficiency) associated with imperfect competition
rL=rL(L)MI
LC
∂∂+r

7
It is interesting to consider the possibility of incorporating into the model three
other elements of relevance to banking competition: the existence of insolvency costs
associated with the possibility of default risk, the existence of monopolistic competition
associated with the differentiation of products, and the existence of competition in
prices instead of quantities. This more realistic scenario is that contemplated by the
model of Corvoisier and Gropp (2001) which supposes that banks fix prices in the loans
market6, while they face a given deposit rate (rD) on their liabilities7. For the sake of
simplicity, in the latter study the authors consider fixed operating costs and assume that
banks offer a single but differentiated type of loan k, whose demand function is as
follows:
N
Brrr
Nb
N
LL L
N
kjjk
ok −−
−−= ∑
≠
)(1
(5)
where:
b is the derivative of the demand for loans from bank k with respect to the
differential of interest against its competitors, enabling the effects of the
differentiation of products to be captured.
B is the derivative of the total demand for loans (L) with respect to the
average rate of interest on loans ( ∑=
=N
kkL Nrr
1
/ ).
Only if banks face the same demand schedule will the loan rate in equilibrium be
equal for all banks. The equilibrium condition then becomes,
∑ ==−=
N
k kL LLwhereBrLL10 (6)
6 The empirical evidence on market power in the loans and/or deposit market is ambiguous. Studies suchas Nathan and Neave (1989), Neave and Nathan (1991) and Shaffer (1993) have found an absence ofmarket power even for the concentrated banking industry in Canada. However, other studies (Berger andHannan, 1989 and 1997; Hannan, 1991; among others) show the existence of market power for banks inthe U.S. Thus, whether market power exists in a country’s loan or deposit market is an empirical question.
7 The model could be extended by allowing the existence of market power in the pricing of deposits,obtaining in this case a Lerner index for deposits analogous to that obtained in the Corvoisier and Gropp(2001) model for loans.

8
Deriving equation (5) with respect to the interest rate on loans, we obtain:
)(2N
Bb
r
L
k
k +−=∂∂
(7)
If we assume a reserve requirement (R) proportional to deposits, Lk=Dk(1-α), the
objective function of firm k is as follows:
),(1
)1)(1( kkkkD
kkkk DLCLr
LrMax −−
−−−=Πα
αβ (8)
where βk represents the risk of insolvency, which acts as an added cost (βkLkrk).
On this basis, the first order condition of the problem of maximisation of profits,
when we consider that banks compete with the rate of interest on their loans, is:
01
)1)(1()1)(1( =∂∂
∂∂
−∂∂
−−
∂∂
−−+−−=∂Π∂
k
k
k
k
k
kD
k
kkkkk
k
k
r
L
L
C
r
Lr
r
LrL
r ααβαβ (9)
or, equivalently,
kkk
k
k
kDkk L
r
L
L
Crr )1)(1(
1)1)(1( αβ
ααβ −−−=
∂∂
∂∂
−−
−−− (10)
Dividing both sides of the equation by rk and taking (7) into account,
k
k
k
kk
k
k
kDkk
eN
Bbr
L
r
L
Crr
)1)(1(
)(
1)1)(1(
1)1)(1(
2
αβαβ
ααβ
−−=
+−−=
∂∂
−−
−−−(11)
where ek=
k
k
k
k
L
r
r
L
∂∂
− is the elasticity of the demand for loans from bank k. Finally, given
that in (6) Lk=(L0-rkB)/N we obtain
)(
1)1)(1(
)1)(1(
2
0
N
Bbr
N
Br
N
L
r
L
Crr
k
k
kk
k
kDKk
+
+−−=
∂∂
−−−−αβ
αβ(12)
9
Observe that the left side of equation (12) is the expression of the Lerner index
corrected for risk of insolvency (default risk). Its determinants, appearing on the right
side, are the cost of risk (βk), average size of firm (L0/N), the number of firms (N), the
sensitivity of the demand for loans of type k to the differential of their rate of interest
against their competitors (b) and the sensitivity of total demand of loan to the average
interest rate (B).
Estimation, significance and determinants of the Lerner index
The interpretation of the Lerner index as market power is often made too
mechanically, as it is necessary to take into account several problems that are posed in
the empirical estimation when valuing its significance:
a) Firstly, the value of the Lerner index is influenced by the criteria followed
when more or fewer concepts are included in the calculation of revenue and
costs. Thus it is not infrequent to consider only financial revenue and costs
and to omit other revenue and trading costs (so that the margin varies and the
value of the index changes). When only the traditional intermediation activity
of loans-deposits is considered, the model does not consider the banking
activity of providing services. The substantial growth in this type of activity
in recent years has led to a change in the revenue structure of banking firms;
the relative importance of net financial revenue has decreased, and revenue
from items other than interest (mainly commissions) has increased8.
b) Secondly, it is general practice not to consider the cost of risk, even though
its effect on the profit and loss account of banking systems is on average very
important, representing about 25% of the net income. There are various
reasons for the continuance of these practices: the lack of sufficient data, the
difficulties of calculation, and in the case of the cost of risk, the problem of
its posting in time, as banking risk often appears only at a certain moment of
the life of the investments made.
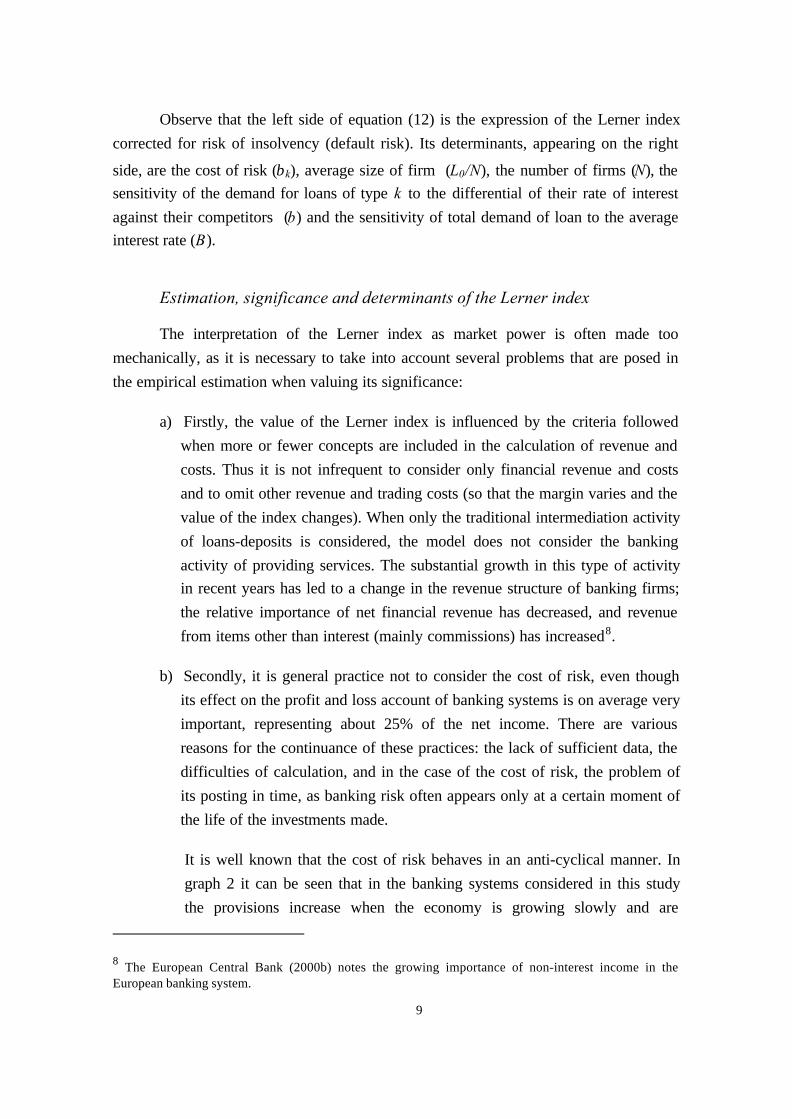
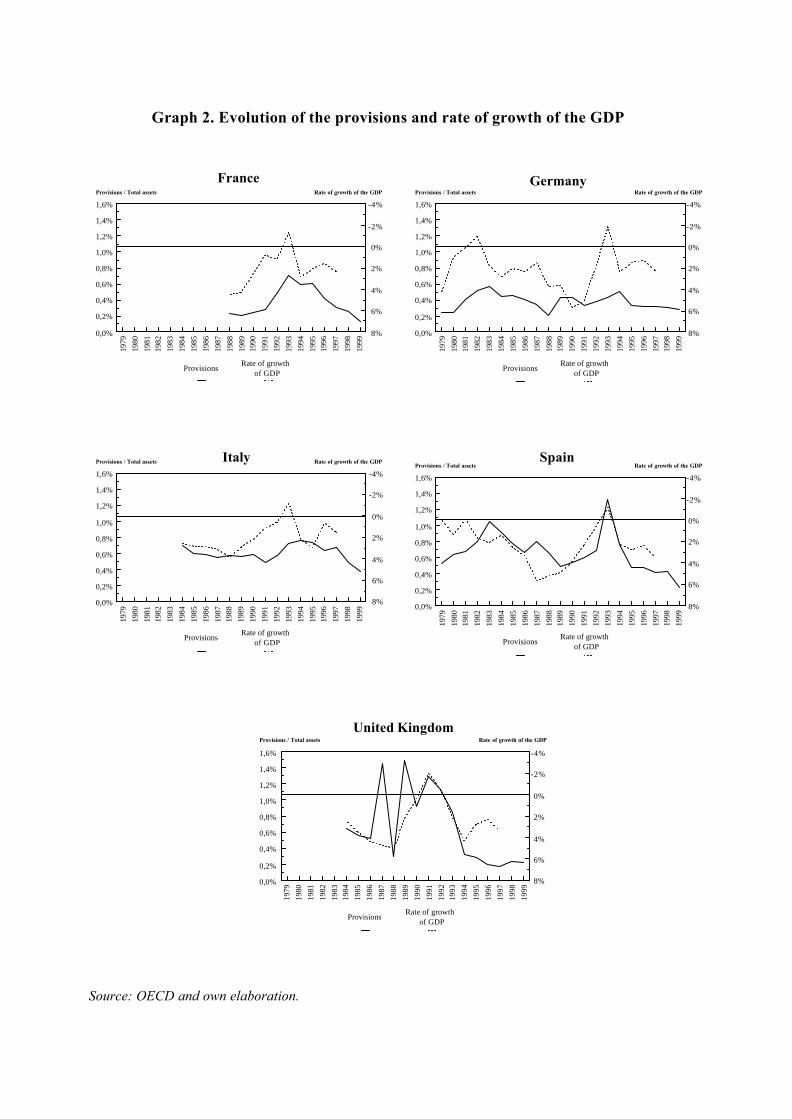
It is well known that the cost of risk behaves in an anti-cyclical manner. In
graph 2 it can be seen that in the banking systems considered in this study
the provisions increase when the economy is growing slowly and are
8 The European Central Bank (2000b) notes the growing importance of non-interest income in theEuropean banking system.
10
reduced when real growth is strong; this occurred in all the countries without
exception from 1994 to 1999. Indeed, the correlation between GDP growth
rates and provisions per unit of assets is systematically negative.
It is, then, important to point out that, although the cost of risk is not
included in the estimation of the cost function, this problem is present in two
ways: 1) if the cost of risk is not taken into account, the interpretation of the
Lerner index as market power may be wrong because it overestimates the
margin; and 2) if the cost of risk is only computed when the corresponding
provisions are made, its time profile will be skewed, as it can be said that
these are costs that were latent in other periods but whose recognition has
been delayed. In this last case, the Lerner index is likely to increase in an
expanding phase of the cycle - in which there are few problems of bad debt
and insolvency - and decrease in a low phase of the cycle - in which bad debt
and provisions increase - without affecting market power.
c) Thirdly, the empirical estimation of separate prices or rates for loans and
deposits is not without problems. Thus, in the case of loans the profit and loss
account does not give separately the financial income associated with them,
as it appears jointly with other financial products (fixed income investments,
for example). In the case of deposits, the financial costs are included with
those of other liability products.
Taking into account all these aspects, in the empirical model of this study we use
a single indicator of banking activity and, as in Shaffer (1993) and Berg and Kim
(1994), banking output is proxied by the total assets of each firm. The starting
assumption is that the flow of banking goods and services produced by a bank is
proportional to its total assets. With this approximation, we construct an average price
that includes financial and service income and both financial and operating costs are
computed, though not the cost of risk due to the problems of identification and
periodification indicated above.
11
Graph 2. Evolution of the provisions and rate of growth of the GDP
Source: OECD and own elaboration.
1979
1980
1981
1982
1983
1984
1985
1986
1987
1988
1989
1990
1991
1992
1993
1994
1995
1996
1997
1998
1999
0,0%
0,2%
0,4%
0,6%
0,8%
1,0%
1,2%
1,4%
1,6%
-8%
-6%
-4%
-2%
0%
2%
4%
Provisions / Total assets Rate of growth of the GDP
Provisions Rate of growth
of GDP
France
8%
6%
4%
2%
0%
-2%
-4%
1979
1980
1981
1982
1983
1984
1985
1986
1987
1988
1989
1990
1991
1992
1993
1994
1995
1996
1997
1998
1999
0,0%
0,2%
0,4%
0,6%
0,8%
1,0%
1,2%
1,4%
1,6%
-8%
-6%
-4%
-2%
0%
2%
4%
Provisions / Total assets Rate of growth of the GDP
Provisions Rate of growth
of GDP
Germany
8%
6%
4%
2%
0%
-2%
-4%
1979
1980
1981
1982
1983
1984
1985
1986
1987
1988
1989
1990
1991
1992
1993
1994
1995
1996
1997
1998
1999
0,0%
0,2%
0,4%
0,6%
0,8%
1,0%
1,2%
1,4%
1,6%
-8%
-6%
-4%
-2%
0%
2%
4%
Provisions / Total assets Rate of growth of the GDP
Provisions Rate of growth
of GDP
Spain
8%
6%
4%
2%
0%
-2%
-4%
1979
1980
1981
1982
1983
1984
1985
1986
1987
1988
1989
1990
1991
1992
1993
1994
1995
1996
1997
1998
1999
0,0%
0,2%
0,4%
0,6%
0,8%
1,0%
1,2%
1,4%
1,6%
-8%
-6%
-4%
-2%
0%
2%
4%
Provisions / Total assets Rate of growth of the GDP
Provisions Rate of growth
of GDP
Italy
8%
6%
4%
2%
0%
-2%
-4%
1979
1980
1981
1982
1983
1984
1985
1986
1987
1988
1989
1990
1991
1992
1993
1994
1995
1996
1997
1998
1999
0,0%
0,2%
0,4%
0,6%
0,8%
1,0%
1,2%
1,4%
1,6%
-8%
-6%
-4%
-2%
0%
2%
4%
Provisions / Total assets Rate of growth of the GDP
Provisions Rate of growth
of GDP
United Kingdom
8%
6%
4%
2%
0%
-2%
-4%
12
Although the expression of the Lerner index is the same for different market
situations and different types of competition, when we observe on which variables its
value depends (considering the right-hand side of the equation) we find that its meaning
is not always the same. Thus, in the last model developed in this section we find that if
imperfect competition and differentiation of products are considered, the Lerner index
depends not only on the elasticity of demand for loans (the element associated with
market power in the derivation of the Lerner index in the Monti-Klein model), but also
on the sensitivity of each producer's demand to the differences in price with his
competitors, on the size of the market, on the level of interest rates and on the cost of
risk. Indeed, for a given value of elasticity, the level and the evolution of the index will
depend on the behaviour of all the other variables.
In the next section we make an estimation of the Lerner index and an analysis of
its determinants, taking these considerations into account. Given that the computation of
the costs of risk cannot be included with guarantees in the cost function, they must be
taken very much into account in interpreting the index, as the period analysed is
characterised mainly by strong growth of the economy and of banking activity, and in
general by low provisions for write-offs and insolvencies.
Having estimated the index, its determinants will be analysed from the following
angles:
a) Variables indicative of market power, such as indices of concentration
(related to the number of firms) or market shares.
b) Variables indicative of the elasticity of loan demand.
c) Variables indicative of scale, which may imply advantages in cost, or in
operational efficiency.
d) Variables indicative of the size and growth of markets and of the risk
undertaken, related with the above-mentioned question of cost of risk.
e) Variables related to productive specialisation, institutional and country
differences, which may be proxies for the type of competition, the
differentiation of products and the intensity of the rivalry among firms.
13
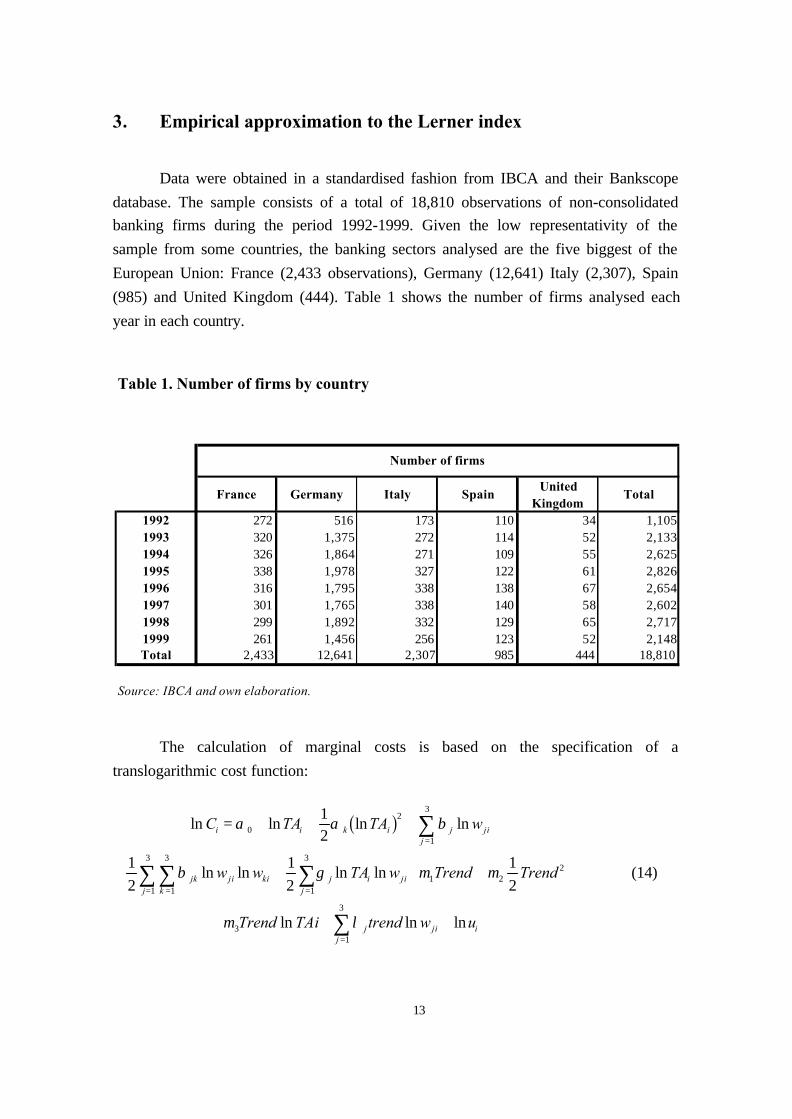
3. Empirical approximation to the Lerner index
Data were obtained in a standardised fashion from IBCA and their Bankscope
database. The sample consists of a total of 18,810 observations of non-consolidated
banking firms during the period 1992-1999. Given the low representativity of the
sample from some countries, the banking sectors analysed are the five biggest of the
European Union: France (2,433 observations), Germany (12,641) Italy (2,307), Spain
(985) and United Kingdom (444). Table 1 shows the number of firms analysed each
year in each country.
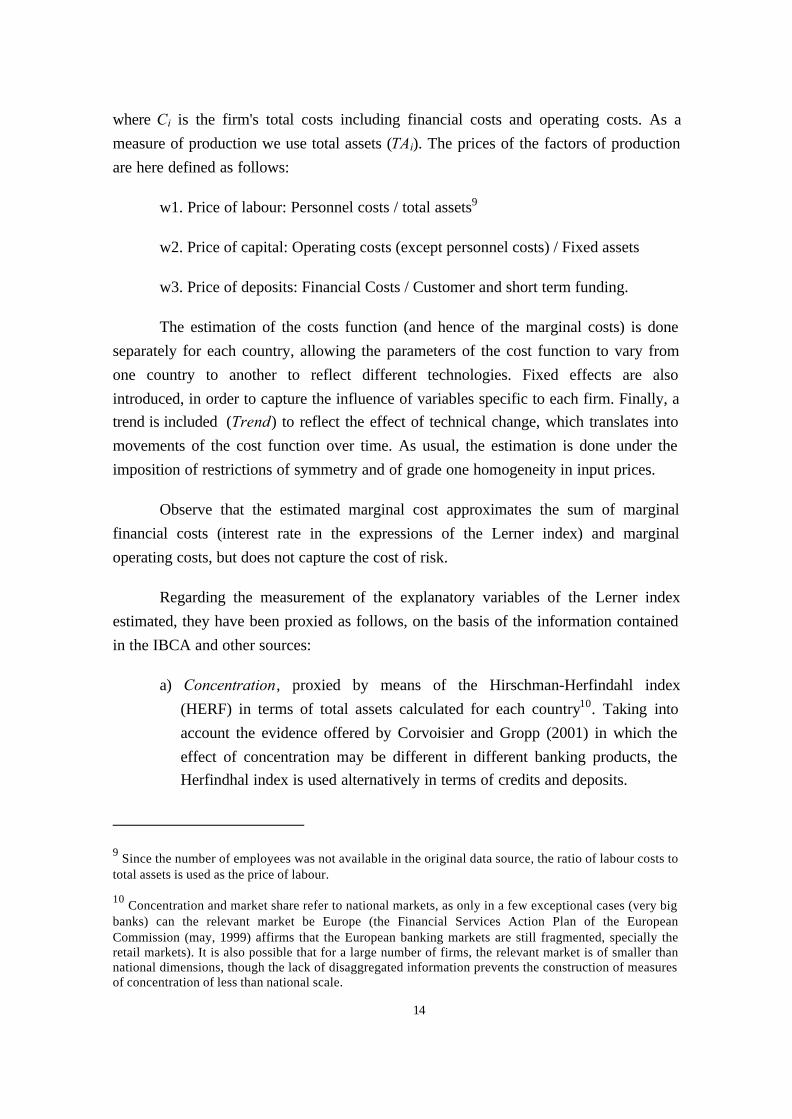
The calculation of marginal costs is based on the specification of a
translogarithmic cost function:
ln ln ln ln
ln ln ln ln
ln ln ln
C TA TA w
w w TA w Trend Trend
Trend TAi trend w u
i i k i jj
ji
jk ji kikj
j i jij
j ji ij
= + + + +
+ + + + +
+ + +
=
== =
=
∑
∑∑ ∑
∑
α α β
β γ µ µ
µ λ
0
2
1
3
1
3
1
3
1
3
1 22
31
3
12
1
2
1
2
1
2
b g
(14)
Table 1. Number of firms by country
France Germany Italy SpainUnited
KingdomTotal
1992 272 516 173 110 34 1,1051993 320 1,375 272 114 52 2,1331994 326 1,864 271 109 55 2,6251995 338 1,978 327 122 61 2,8261996 316 1,795 338 138 67 2,6541997 301 1,765 338 140 58 2,6021998 299 1,892 332 129 65 2,7171999 261 1,456 256 123 52 2,148Total 2,433 12,641 2,307 985 444 18,810
Source: IBCA and own elaboration.
Number of firms
14
where Ci is the firm's total costs including financial costs and operating costs. As a
measure of production we use total assets (TAi). The prices of the factors of production
are here defined as follows:
w1. Price of labour: Personnel costs / total assets9
w2. Price of capital: Operating costs (except personnel costs) / Fixed assets
w3. Price of deposits: Financial Costs / Customer and short term funding.
The estimation of the costs function (and hence of the marginal costs) is done
separately for each country, allowing the parameters of the cost function to vary from
one country to another to reflect different technologies. Fixed effects are also
introduced, in order to capture the influence of variables specific to each firm. Finally, a
trend is included (Trend) to reflect the effect of technical change, which translates into
movements of the cost function over time. As usual, the estimation is done under the
imposition of restrictions of symmetry and of grade one homogeneity in input prices.
Observe that the estimated marginal cost approximates the sum of marginal
financial costs (interest rate in the expressions of the Lerner index) and marginal
operating costs, but does not capture the cost of risk.
Regarding the measurement of the explanatory variables of the Lerner index
estimated, they have been proxied as follows, on the basis of the information contained
in the IBCA and other sources:
a) Concentration, proxied by means of the Hirschman-Herfindahl index
(HERF) in terms of total assets calculated for each country10. Taking into
account the evidence offered by Corvoisier and Gropp (2001) in which the
effect of concentration may be different in different banking products, the
Herfindhal index is used alternatively in terms of credits and deposits.
9 Since the number of employees was not available in the original data source, the ratio of labour costs tototal assets is used as the price of labour.
10 Concentration and market share refer to national markets, as only in a few exceptional cases (very bigbanks) can the relevant market be Europe (the Financial Services Action Plan of the EuropeanCommission (may, 1999) affirms that the European banking markets are still fragmented, specially theretail markets). It is also possible that for a large number of firms, the relevant market is of smaller thannational dimensions, though the lack of disaggregated information prevents the construction of measuresof concentration of less than national scale.

15
b) Market share (MS), i.e. the firm's total assets expressed as a percentage of
those of the national banking industry. Alternatively market shares in terms
of credits and deposits are used.
c) Elasticity of aggregate loan demand (B). Following Corvoisier and Groopp
(2001), the elasticity of aggregate loan demand has been proxied for by the
ratio of the total assets of the banking system to GDP (TA/GDP) and by the
ratio of stock market capitalisation to GDP (MK/GDP).
d) Size: measured by total assets (LTA log of total assets). This variable is
introduced for two reasons: a) to capture the possible cost advantages
associated with size (economies of scale) and b) to be able to capture the
possible market power associated with size11.
e) Efficiency : proxied through the cost to income ratio (EFFC), defined as the
quotient between operating costs and the gross income.
f) Risk: measured by the loans / total assets (L/TA)12 ratio as a proxy for the
default risk and equity/ total assets (E/TA) ratio as a proxy for the risk of
insolvency, since in the empirical approximation of the Lerner index the role
of risk is not considered.
g) Market expansion: proxied by the real growth rate of GDP (GDPGROWTH)
in each of the national markets.
h) Productive specialisation. Using a cluster analysis13, groups of firms with
similar productive specialisation are identified, calculating the percentage
structure of the balance sheet in its main items (loans, other earning assets,
fixed assets, deposits, other sources of funding and equity). Table 2 shows,
for the year 1999, the percentage structure of the balance sheet and the most
11 Although the latest model with product differentiation considers banks of equal size, in reality it is verydifficult to accept this assumption, so we introduce the size of firm as an explanatory variable of theLerner index.
12 Bearing in mind that the default risk depends on the asset quality, it would be better to use variablessuch as net charges-offs/loans, non-performing assets/total assets or loan loss provisions/loans. However,the database used (BankScope) contains data on loan loss provisions only for a few banks. With respectto the net charges-offs and non-performing assets, the database does not provide information.
13 To form the clusters the non-hierarchical k-means technique was used.

16
important economical and financial ratios of the four clusters identified,
whose main characteristics are described in the annex.
i) Institutional dummy: bank (BANK), savings bank (SAVINGS), co-operative
banks (COOP) and others (OTHERS)14.
j) Country dummy (GERMANY, SPAIN, FRANCE, ITALY, UK).
14 The category of Others includes the following types of institutions: Bank holding and holdingcompanies, Investment banks/securities houses, Medium and long term credit banks, Non-banking creditinstitutions, Real state / mortgage banks, Specialised Government credit institutions.
Table 2. Specialization in the European banking system. 1999Percentages over total assets
Cluster 1 Cluster 2 Cluster 3 Cluster 4 Total firms
Percentage over Total Assets
Loans 69.58 24.45 47.63 47.89 44.90Other earining assets 25.45 68.45 45.17 42.53 47.46Fixed assets 1.49 0.31 1.34 0.73 0.85Non earning assets 3.47 6.80 5.87 8.85 6.79
Total assets 100.00 100.00 100.00 100.00 100.00
Total deposits 84.51 67.29 81.08 54.83 68.19Total money market funding 1.48 5.62 2.84 13.12 7.12Other funding 5.89 15.30 6.64 21.55 14.41Other non interest bearing 2.96 8.23 5.02 10.07 7.41Loan loss reserves 0.02 0.09 0.01 0.16 0.09Other reserves 0.20 0.04 0.38 0.77 0.39Equity 5.30 3.51 5.15 5.69 4.90
Operating expenses / Total assets 2.27 0.78 1.85 1.44 1.47Operating expenses / Gross income 65.48 65.66 64.33 62.61 64.21Interest expenses / Total assets 3.03 4.35 2.95 3.52 3.57Interest expenses / Interest income 55.00 88.03 60.22 71.91 71.25
ROA 0.74 0.45 0.73 0.57 0.59ROE 14.04 12.76 14.26 10.02 12.12
Number of firms 1,170 210 504 264 2,148Percentage over the institutional group
Banks 10.09 52.86 19.44 30.68 18.99 Saving Banks 27.78 12.86 31.55 15.15 25.65 Cooperative Banks 58.03 15.71 45.63 39.02 48.65 Other 4.10 18.57 3.37 15.15 6.70
Share in Total assets 17.66 28.91 17.22 36.21 100.00
Source: IBCA and own elaboration.
17
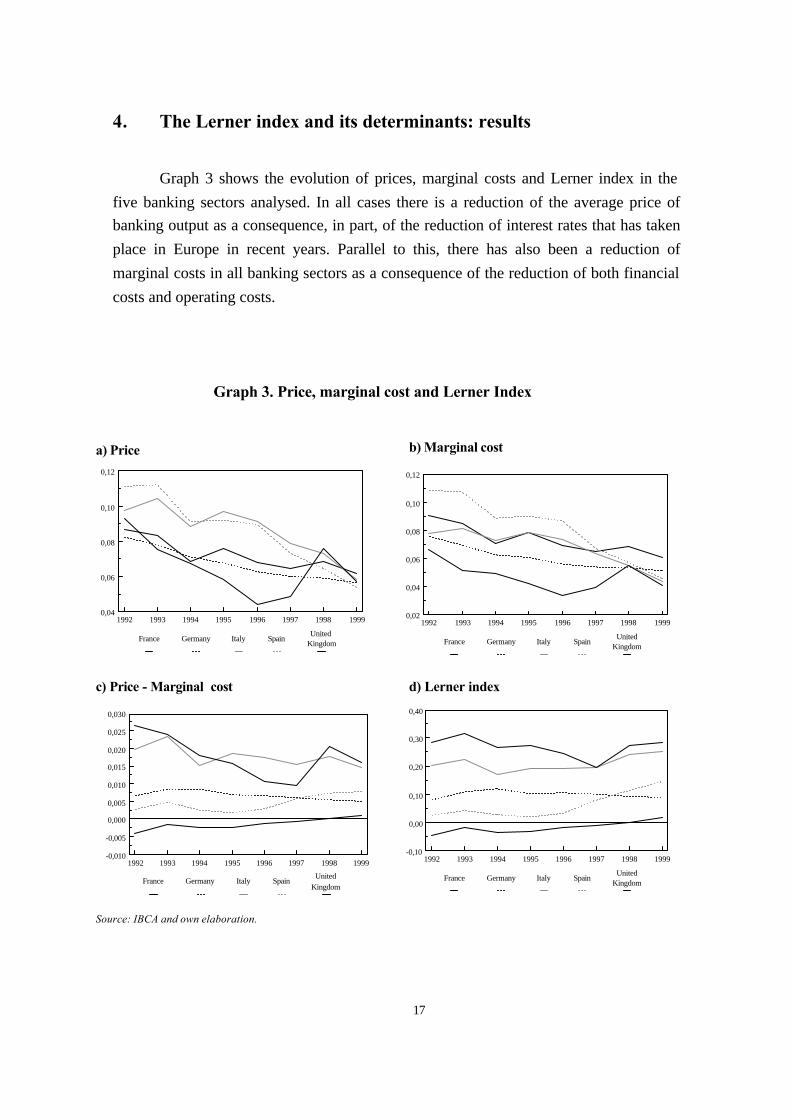
4. The Lerner index and its determinants: results
Graph 3 shows the evolution of prices, marginal costs and Lerner index in the
five banking sectors analysed. In all cases there is a reduction of the average price of
banking output as a consequence, in part, of the reduction of interest rates that has taken
place in Europe in recent years. Parallel to this, there has also been a reduction of
marginal costs in all banking sectors as a consequence of the reduction of both financial
costs and operating costs.
1992 1993 1994 1995 1996 1997 1998 19990,04
0,06
0,08
0,10
0,12
France Germany Italy Spain United
Kingdom
Graph 3. Price, marginal cost and Lerner Index
a) Price
1992 1993 1994 1995 1996 1997 1998 19990,02
0,04
0,06
0,08
0,10
0,12
France Germany Italy Spain United
Kingdom
1992 1993 1994 1995 1996 1997 1998 1999-0,10
0,00
0,10
0,20
0,30
0,40
France Germany Italy Spain United
Kingdom
b) Marginal cost
d) Lerner index
Source: IBCA and own elaboration.
1992 1993 1994 1995 1996 1997 1998 1999-0,010
-0,005
0,000
0,005
0,010
0,015
0,020
0,025
0,030
France Germany Italy Spain United
Kingdom
c) Price - Marginal cost
18
The net effect of the evolution of marginal costs and prices is not always a
reduction of the absolute margin. And with regard to the relative margin, the Lerner
index increased in recent years in all the countries except Germany and the UK, as the
reduction of marginal costs was greater than that of the average price of assets. If we
take into account the lower representativity of the sample in 1992 and take 1993 as the
initial year of reference, the Lerner index increased in France, Italy and Spain, and
diminished in Germany and the UK. Its average value stood at 15% in 1999.
Computed Lerner indices show substantial differences across countries. Thus the
banking sector of the United Kingdom enjoys the greatest relative margin in the setting
of prices, followed by Italy, France being at the opposite extreme15.
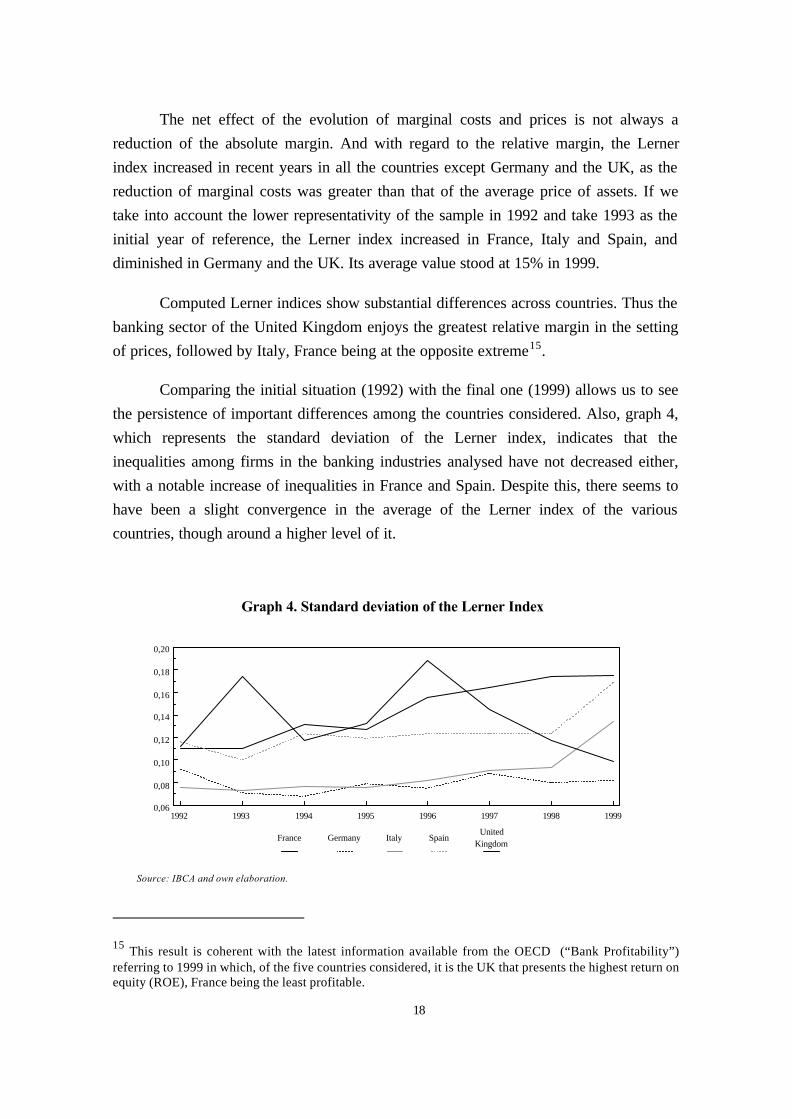
Comparing the initial situation (1992) with the final one (1999) allows us to see
the persistence of important differences among the countries considered. Also, graph 4,
which represents the standard deviation of the Lerner index, indicates that the
inequalities among firms in the banking industries analysed have not decreased either,
with a notable increase of inequalities in France and Spain. Despite this, there seems to
have been a slight convergence in the average of the Lerner index of the various
countries, though around a higher level of it.
15 This result is coherent with the latest information available from the OECD (“Bank Profitability”)referring to 1999 in which, of the five countries considered, it is the UK that presents the highest return onequity (ROE), France being the least profitable.
Graph 4. Standard deviation of the Lerner Index
1992 1993 1994 1995 1996 1997 1998 19990,06
0,08
0,10
0,12
0,14
0,16
0,18
0,20
France Germany Italy Spain United
Kingdom
Source: IBCA and own elaboration.

19
Graph 5 shows the differences observed by type of institution (banks, savings
banks, co-operatives and others) and by productive specialisation group. The savings
banks enjoy greater monopoly power, with a growth of the Lerner index over the period
analysed. The banks stand clearly below the savings banks, with a growing trend from
1995 onwards. Credit co-operatives stand in a position between these two, the
behaviour of their Lerner index being stable in recent years.
Graph 5. Lerner index by type of institution and specialization
1992 1993 1994 1995 1996 1997 1998 19990,04
0,06
0,08
0,10
0,12
0,14
0,16
Banks Saving Banks Cooperative banks Other institutions
1992 1993 1994 1995 1996 1997 1998 1999-0,05
0,00
0,05
0,10
0,15
0,20
Cluster 1 Cluster 2 Cluster 3 Cluster 4
a) By type of institution
b) By group of specialization
Source: IBCA and own elaboration.

20
Differences are also observed by specialisation groups. Cluster 2, which carry
out typical investment banking, enjoy the lowest margin with a value of the Lerner
index so low that we can describe their situation as being close to perfect competition.
At the opposite extreme, cluster 1 - intermediation banking - enjoys the greatest
monopoly power practically every year, though in 1999 cluster 3 presents a higher value
of the index.
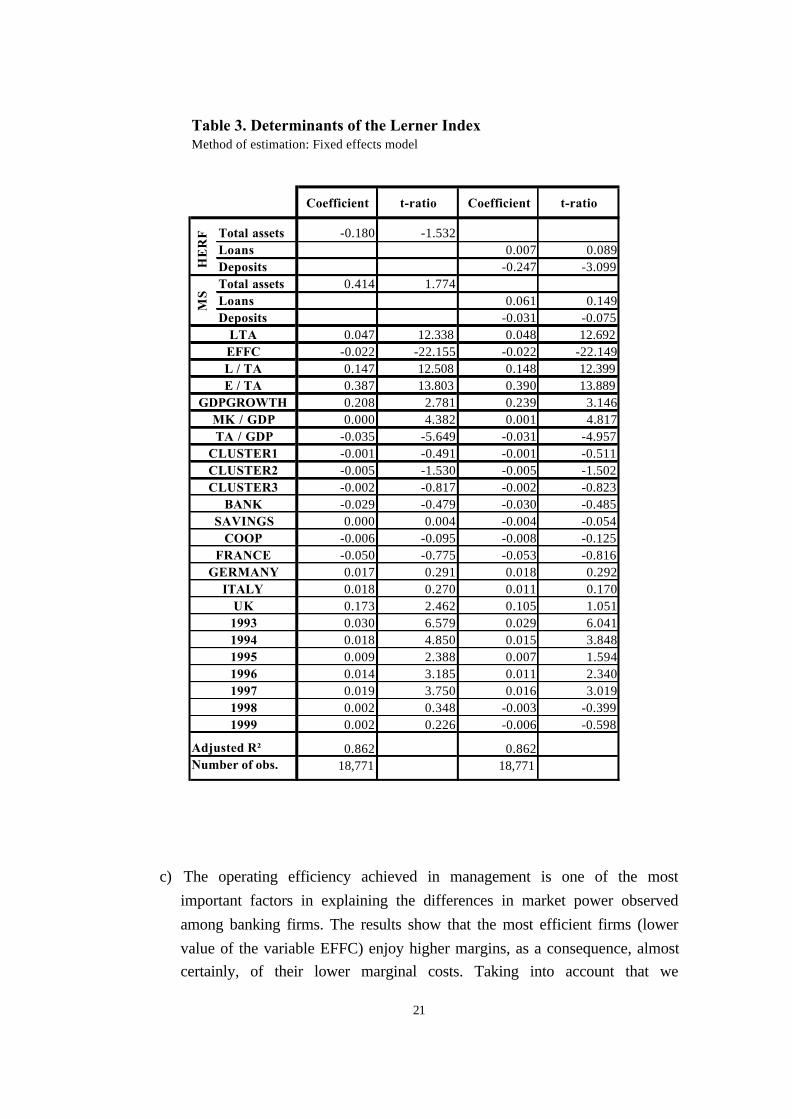
Table 3 presents the results of the estimation of the determinants of the Lerner
index 16, introducing fixed effects and time effects. The main results are as follows:
a) According to expression (12) the effect of the number of firms on the Lerner
index is ambiguous. The empirical model indicates that the concentration of
national banking markets in terms of total assets on the basis of the
Hirschman-Herfindahl index (HERF) is not significant. Following Corvoisier
and Gropp (2001), the evolution of concentration and its effect on market
power may differ depending on the banking product considered. For this
reason, in column (2) of the table we offer the results introducing at the same
time two indices of concentration: one referring to the loans market and the
other to deposits17. The results show that only the effect of the concentration
of the deposits market is significant, its influence being negative18.
Consequently, the results show the importance of distinguishing the effect of
concentration by type of product, rejecting the traditional hypothesis of
collusion in the deposits market.
b) The market share of each firm in its national market (MS) does not have a
significant effect in any of the cases, irrespective of the reference market
(total assets, loans or deposits). However, firm size (LTA) is revealed as a
variable with a positive and very significant effect on market power.
16 Given that in the estimation of cost functions it is necessary to have information on several variables inorder to estimate input prices, we have had to exclude from the initial sample the firms for which we didnot have complete information, 18,771 being the final number of firms considered in the estimations ofthe determinants of the Lerner index.
17 Although Klein’s model considers deposits as an input, “several authors implement models in whichboth input and output characteristics of deposits are simultaneously represented, rather than just one orthe other as is common in the existing literature” (see Humphrey, 1992).
18 This result agrees with the evidence recently obtained by Corvoisier and Gropp (2001). Specifically,their results for a sample of European countries from 1993 to 1999 show that concentration affects bankmargins positively in the loans market and negatively in the deposits market.
21
c) The operating efficiency achieved in management is one of the most
important factors in explaining the differences in market power observed
among banking firms. The results show that the most efficient firms (lower
value of the variable EFFC) enjoy higher margins, as a consequence, almost
certainly, of their lower marginal costs. Taking into account that we
Table 3. Determinants of the Lerner IndexMethod of estimation: Fixed effects model
Coefficient t-ratio Coefficient t-ratio
Total assets -0.180 -1.532Loans 0.007 0.089Deposits -0.247 -3.099Total assets 0.414 1.774Loans 0.061 0.149Deposits -0.031 -0.075
0.047 12.338 0.048 12.692-0.022 -22.155 -0.022 -22.1490.147 12.508 0.148 12.3990.387 13.803 0.390 13.8890.208 2.781 0.239 3.1460.000 4.382 0.001 4.817
-0.035 -5.649 -0.031 -4.957-0.001 -0.491 -0.001 -0.511-0.005 -1.530 -0.005 -1.502-0.002 -0.817 -0.002 -0.823-0.029 -0.479 -0.030 -0.4850.000 0.004 -0.004 -0.054
-0.006 -0.095 -0.008 -0.125-0.050 -0.775 -0.053 -0.8160.017 0.291 0.018 0.2920.018 0.270 0.011 0.1700.173 2.462 0.105 1.0510.030 6.579 0.029 6.0410.018 4.850 0.015 3.8480.009 2.388 0.007 1.5940.014 3.185 0.011 2.3400.019 3.750 0.016 3.0190.002 0.348 -0.003 -0.3990.002 0.226 -0.006 -0.598
Adjusted R² 0.862 0.862Number of obs. 18,771 18,771
19981999
HE
RF
MS
1994199519961997
GERMANYITALY
UK1993
BANKSAVINGS
COOPFRANCE
GDPGROWTH
CLUSTER1CLUSTER2CLUSTER3
TA / GDPMK / GDP
LTAEFFCL / TAE / TA
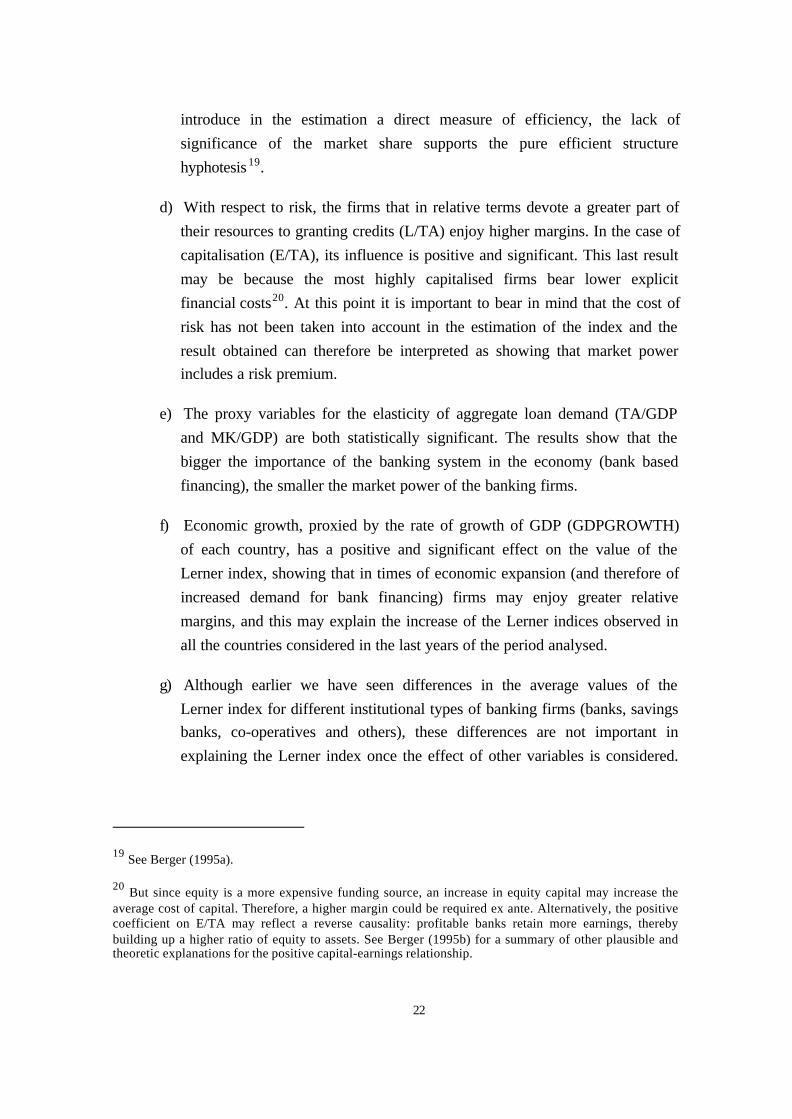
22
introduce in the estimation a direct measure of efficiency, the lack of
significance of the market share supports the pure efficient structure
hyphotesis 19.
d) With respect to risk, the firms that in relative terms devote a greater part of
their resources to granting credits (L/TA) enjoy higher margins. In the case of
capitalisation (E/TA), its influence is positive and significant. This last result
may be because the most highly capitalised firms bear lower explicit
financial costs20. At this point it is important to bear in mind that the cost of
risk has not been taken into account in the estimation of the index and the
result obtained can therefore be interpreted as showing that market power
includes a risk premium.
e) The proxy variables for the elasticity of aggregate loan demand (TA/GDP
and MK/GDP) are both statistically significant. The results show that the
bigger the importance of the banking system in the economy (bank based
financing), the smaller the market power of the banking firms.
f) Economic growth, proxied by the rate of growth of GDP (GDPGROWTH)
of each country, has a positive and significant effect on the value of the
Lerner index, showing that in times of economic expansion (and therefore of
increased demand for bank financing) firms may enjoy greater relative
margins, and this may explain the increase of the Lerner indices observed in
all the countries considered in the last years of the period analysed.
g) Although earlier we have seen differences in the average values of the
Lerner index for different institutional types of banking firms (banks, savings
banks, co-operatives and others), these differences are not important in
explaining the Lerner index once the effect of other variables is considered.
19 See Berger (1995a).
20 But since equity is a more expensive funding source, an increase in equity capital may increase theaverage cost of capital. Therefore, a higher margin could be required ex ante. Alternatively, the positivecoefficient on E/TA may reflect a reverse causality: profitable banks retain more earnings, therebybuilding up a higher ratio of equity to assets. See Berger (1995b) for a summary of other plausible andtheoretic explanations for the positive capital-earnings relationship.
23
Thus, as the results in table 3 show, none of the dummies that characterise the
institutional group is significant 21.
h) Regarding the possible existence of a country effect, a statistically significant
result is obtained only in the case of the UK, Spain being the country of
reference. This result is coherent with the view of the level of the Lerner
index in graph 3.
i) Finally, we observe no differences in market power as a consequence of
belonging to a particular banking specialisation group (CLUSTER). A result,
of very little significance, is obtained only in the case of cluster 2 (investment
banks), compatible with graph 3 in which it can be clearly appreciated that
this group is the one with the lowest value for the Lerner index.
5. Conclusions
The objective of this study has been to offer empirical evidence on the evolution
of competition in the banking industries of five big European countries, through the
estimation of Lerner indices and the analysis of their determinants. The sample used
contains 18,810 observations of the banking sectors of Germany, France, Italy, Spain
and the United Kingdom for the period 1992-1999.
The results show an average level of the Lerner index of 0.15 in 1999, with
substantial differences in the index among countries and a growing trend during the
latter years in four of the five cases considered. This behaviour of the relative margins is
often interpreted as indicating that, despite the process of de-regulation of the European
banking systems and the increasing integration of markets, the existing market power
may be persisting, and even - surprisingly - increasing. This interpretation is based on
the fact that the many changes that have occurred have been accompanied by an intense
process of concentration, driven by numerous mergers and acquisitions.
However, this thesis cannot be accepted just like that, given the limitations
imposed by the information on a complete estimation of costs when calculating the
Lerner indices (in particular, to include the cost of risk) and, also in the light of the
21 The group of reference is that of "other" institutional types.
24
results obtained in the study of the determinants of the index. The values of the Lerner
index in the late 1990s stood on average around 0.15 and a correction for risk could
reduce them by 25%, the relative margins standing at little more than 10%.
The explanatory factors of the index most directly related to market power are in
general not significant (market share) or even have negative influence (concentration in
the deposits market). Likewise the variables representing specialisation, the institutional
form of the firm, or the country. On the other hand, the size of firms and the operating
efficiency of each one, risk and the economic cycle have a notable capacity to explain
the behaviour of the Lerner index.
The negative effect of concentration (proxied by the Hirschman-Herfindhal
index) in the deposits market together with the non-significance in the case of loans,
allow us to reject the traditional hypothesis of collusion. This effect, together with the
importance of operating efficiency, constitute evidence in favour of the efficient
structure hypothesis, this being similar to that obtained recently by Corvoisier and
Gropp. (2001).
Consequently, if the variables that in general do not turn out to be significant are
those that describe the evolution of the structure of markets and specialisation, which
could be determinants of competitive rivalry, the latter would not seem to be able to
explain the evolution of the Lerner index during these years. For this reason, contrary to
the thesis that affirms the above, the results allow us to formulate another:
macroeconomic stability, accompanied by low interest rates and strong economic
growth rates, have favoured the growth of size of firms and their efficiency, and limited
for the time being the impact of the cost of risk on the banks' costs. All this is behind the
evolution of the Lerner index during these years, but it is debatable whether this
evolution can be interpreted as an increase of market power. In particular, to verify
whether the relative margin achieved in these years is stable, it will be necessary to
observe what happens when, as habitually occurs in recessive phases, the cost of risk
increases rapidly and places pressure on absolute margins that are already substantially
narrower than those of earlier years.
25
APPENDIX
Cluster 1. This is the group with the largest number of firms (1,170),
representing 18% of the sample in terms of total assets. It is characterised by carrying
out typical intermediation activity, deposits and credits representing 84.5% and 70% of
the balance sheet, respectively. It is also the group of firms with highest fixed assets due
to its extensive branch network. Despite being the cluster that bears highest operating
costs (2.27% of assets), it manages to be the most profitable in all margins of the profit
and loss account. The cluster is formed mostly by credit co-operatives and to a lesser
extent by savings banks.
Cluster 2. This group consists of 210 firms representing 29% of the total of the
banking system of the countries analysed. These firms capture their resources basically
through deposits (67%), and invest them mostly in other earning assets (68%) so we
could call this the group of the investment banks. Of all the groups it is the least
profitable given the high average costs it bears, due not to its operating costs (which are
the lowest) but to its high average financial costs. More than half the cluster consists of
banks (53% of the total), and other types of firms have in this group their largest
presence.
Cluster 3. In 1999 this consisted of 504 firms representing 17% of the total
assets of the firms of the sample. Like cluster 1, the firms of this group are funded
mostly by deposits (81%), though they diversify their asset portfolio to a greater extent
between loans (48%) and other earning assets (45%). They present a return on assets
similar to that of cluster 1 and higher in terms of returns on equity (ROE). As in cluster
1, the largest group is that of credit co-operatives (47%) followed by savings banks
(32%).
Cluster 4. This is the largest group in relation to the total assets of the sample
(35%), but relies the least on the capture of deposits (55%), preferring other sources of
funding. On the asset side, it presents a percentage structure very similar to that of
cluster 3, with a very balanced distribution between loans (48%) and other earning
assets (43%). This is the group with lowest ROE, though it presents the best indicator of
operating efficiency (62.6%).
26
REFERENCES
Berg, S.A. and Kim, M. (1994): “Oligopolistic interdependence and the structure of productionin banking: an empirical evaluation”, Journal of Money Credit and Banking 26, (2) 309-322.
Berger. A. N. (1995a): “The profit-relationship in banking –test of market-power and efficient-structure hypothesis”, Journal of Money, Credit and Banking 27(2), 405-431.
Berger, A.N. (1995b): “The relationship between capital and earnings in banking”, Journal ofMoney, Credit and Banking 27, 432-456.
Berger, A.N. and Hannan, T. (1989): “The price-concentration relationship in banking”, Reviewof Economics and Statistics 71, 291-299.
Berger, A.N. and Hannan, T. (1997): “Using measures of firm efficiency to distinguish amongalternative explanations of the structure-performance relationship”, Managerial Finance23.
Corvoisier, S. and Gropp, R. (2001). “Bank concentration and retail interest rates”, WorkingPaper No. 72, European Central Bank.
De Bandt, O. and David, E. P. (2000): “Competition, contestability and market structure inEuropean banking sectors on the eve of EMU”, Journal of Banking and Finance 24,1045-2066.
European Central Bank (2000a): “Mergers and acquisitions involving the EU banking industry–Facts and implications”, December 2000.
European Central Bank (2000b): “EU banks income structure”, April 2000.
Freixas, X and Rochet, J.C. (1997). Microeconomics of Banking, Massachusetss Institute ofTechnology, MIT Press.
Klein, M. (1971): “A theory of the banking firm”, Journal of Money, Credit and Banking 3,205-18.
IBCA (2000): BankScope, New York.
Hannan, T. (1991): “Bank commercial loan markets and the role of market structure: evidencefrom surveys of commercial lending”, Journal of Banking and Finance 15, 133-149.
Hannan, T. and Liang, J.N. (1993): “Inferring market power from time series data”,International Journal of Industrial Organization 11, 205-218.
Humphrey, D.B. (1992): “Flow versus stock indicators of banking output: effects onproductivity and scale economy measurement”, Journal of Financial Services Research6, 115-135.
27
Mojon, B. (2000): “Financial structure and the interest rate channel of ECB monetary policy”,Working Paper No. 40, European Central Bank, November.
Monti, M. (1972): “Deposit, credit, and interest rate determination under alternative bankobjectives”, in G.P. Szego and K. Shell (eds.), Mathematical methods in investment andfinance, Amsterdam, North-Holland.
Nathan, A. and Neave, E.H. (1989): “Competition and contestability in Canada’s FinancialSystem: Empirical Results”, Canadian Journal of Economics 22, 576-594.
Neave, E.H. and Nathan, A. (1991): “Assessing competition in Canada’s financial system:empirical results“, Canadian Journal of Economics 22(3), 733-735.
Salas V, and Oroz, M. (2001): “Competencia y eficiencia en la intermediación financiera enEspaña: 1977-2000”, mimeo.
Shaffer, S. (1993): “A test of competition in Canadian Banking”, Journal of Money, Credit andBanking 25 (1), 49-61.