Market Positioning and Pricing Analysis · Market Positioning and Pricing Analysis 1. 3215-3219...
33
3215,3217 & 3219 WEST WASHINGTON BOULEVARD 3219 W Washington Blvd • Los Angeles, CA 90018 Market Positioning and Pricing Analysis 1
Transcript of Market Positioning and Pricing Analysis · Market Positioning and Pricing Analysis 1. 3215-3219...
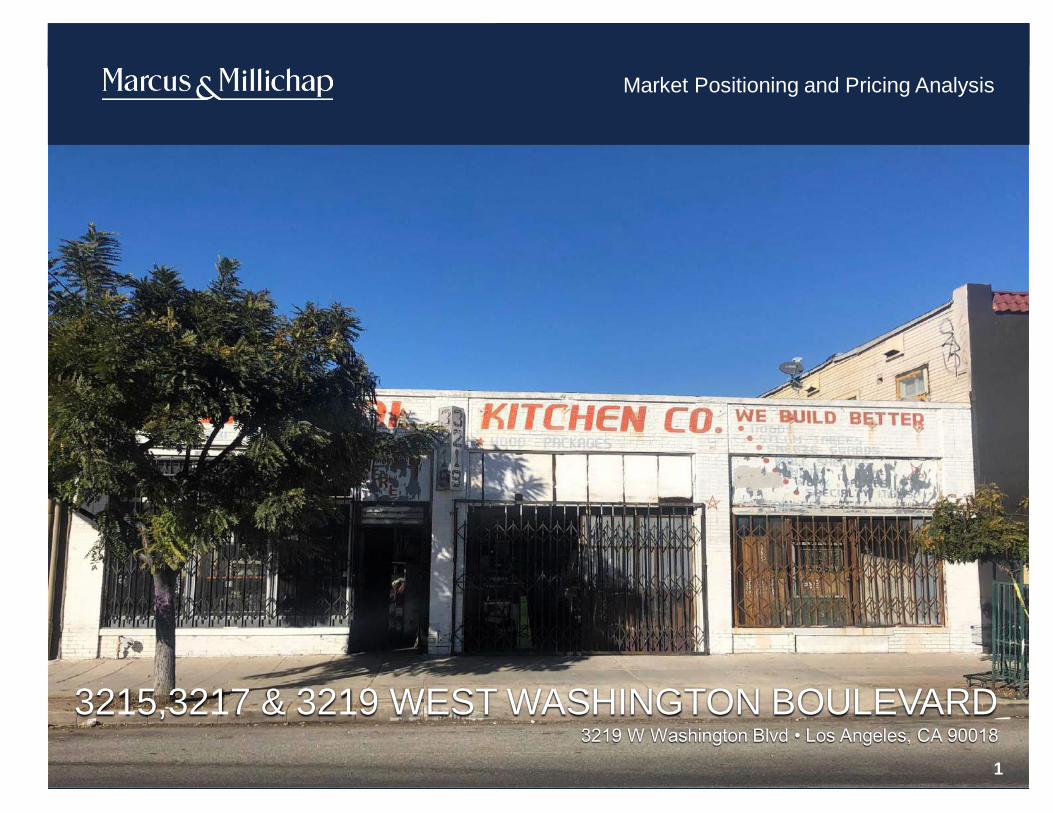
3215,3217 & 3219 WEST WASHINGTON BOULEVARD3219 W Washington Blvd • Los Angeles, CA 90018
Market Positioning and Pricing Analysis
1
3215-3219 WEST WASHINGTON BOULEVARD
Los Angeles, CA
ACT ID ZAA0380059
N O N - E N D O R S E M E N T A N D D I S C L A I M E R N O T I C E
Non-EndorsementsMarcus & Millichap is not affiliated with, sponsored by, or endorsed by any commercial tenant or lessee identified in this marketing package. The presence of any
corporation's logo or name is not intended to indicate or imply affiliation with, or sponsorship or endorsement by, said corporation of Marcus & Millichap, its affiliates or
subsidiaries, or any agent, product, service, or commercial listing of Marcus & Millichap, and is solely included for the purpose of providing tenant lessee information about
this listing to prospective customers.
ALL PROPERTY SHOWINGS ARE BY APPOINTMENT ONLY.
PLEASE CONSULT YOUR MARCUS & MILLICHAP AGENT FOR MORE DETAILS.
DisclaimerTHIS IS A BROKER PRICE OPINION OR COMPARATIVE MARKET ANALYSIS OF VALUE AND SHOULD NOT BE CONSIDERED AN APPRAISAL. This information has
been secured from sources we believe to be reliable, but we make no representations or warranties, express or implied, as to the accuracy of the information. References
to square footage or age are approximate. Buyer must verify the information and bears all risk for any inaccuracies. Marcus & Millichap is a service mark of Marcus &
Millichap Real Estate Investment Services, Inc. © 2018 Marcus & Millichap. All rights reserved.
2
P R E S E N T E D B Y
Laura Alice Scaturro
Member - National Office and Industrial Properties Group
West Los Angeles Office
Tel: (310) 909-54-72
Fax: (310) 909-5410
License: CA 01942167
Ingrid Farias-Eisner
West Los Angeles Office
Tel: (310) 909-5449
Fax: (310) 909-5410
License: CA 02071328
3

TABLE OF CONTENTS
MARKET COMPARABLES 03Sales Comparables
Lease Comparables
MARKET OVERVIEW 04Market Analysis
Demographic Analysis
SECTION SECTION
INVESTMENT OVERVIEW 01Property Overview
Regional Map
Local Map
Aerial Photo
Floor Plan
FINANCIAL ANALYSIS 02Tenant Summary
Lease Expiration Summary
Operating Statement
Notes
Pricing Detail
Proposal Price
3215-3219 WEST WASHINGTON BOULEVARD
4

3215-3219 WEST WASHINGTON BOULEVARD
5
INVESTMENT
OVERVIEW
PROPERTY OVERVIEW
3215-3219 WEST WASHINGTON BOULEVARD
PROPERTY OVERVIEW
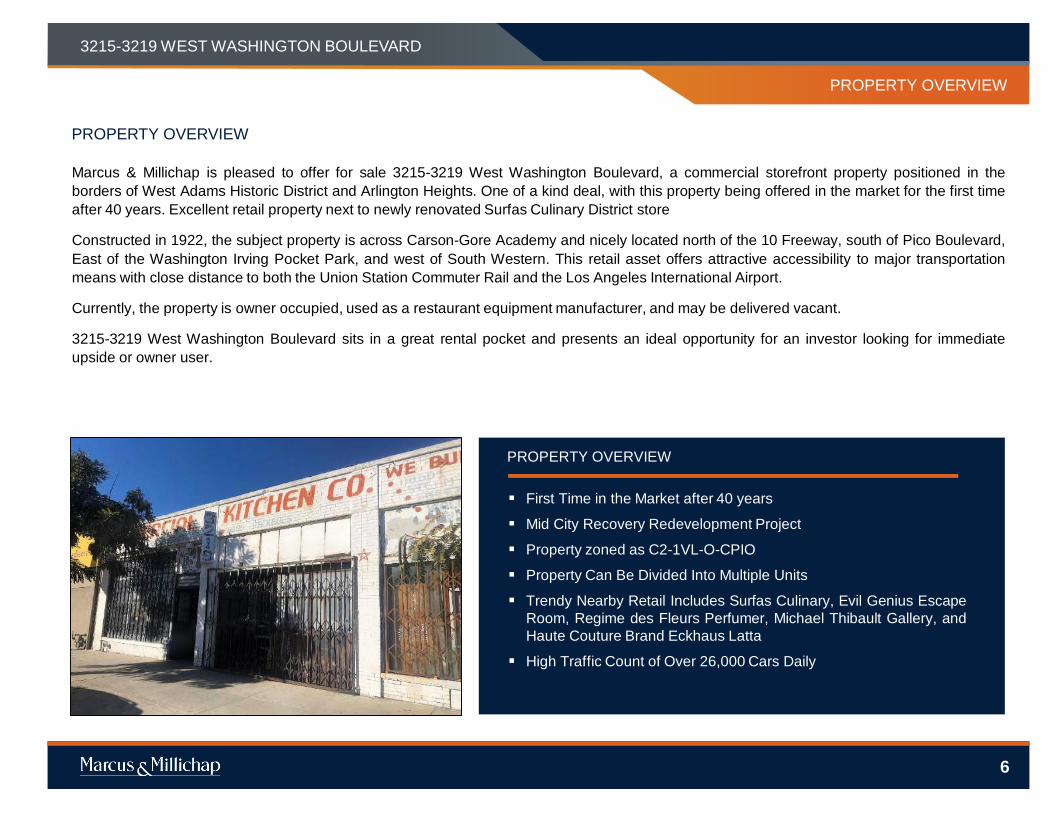
Marcus & Millichap is pleased to offer for sale 3215-3219 West Washington Boulevard, a commercial storefront property positioned in the
borders of West Adams Historic District and Arlington Heights. One of a kind deal, with this property being offered in the market for the first time
after 40 years. Excellent retail property next to newly renovated Surfas Culinary District store
Constructed in 1922, the subject property is across Carson-Gore Academy and nicely located north of the 10 Freeway, south of Pico Boulevard,
East of the Washington Irving Pocket Park, and west of South Western. This retail asset offers attractive accessibility to major transportation
means with close distance to both the Union Station Commuter Rail and the Los Angeles International Airport.
Currently, the property is owner occupied, used as a restaurant equipment manufacturer, and may be delivered vacant.
3215-3219 West Washington Boulevard sits in a great rental pocket and presents an ideal opportunity for an investor looking for immediate
upside or owner user.
PROPERTY OVERVIEW
▪ First Time in the Market after 40 years
▪ Mid City Recovery Redevelopment Project
▪ Property zoned as C2-1VL-O-CPIO
▪ Property Can Be Divided Into Multiple Units
▪ Trendy Nearby Retail Includes Surfas Culinary, Evil Genius Escape
Room, Regime des Fleurs Perfumer, Michael Thibault Gallery, and
Haute Couture Brand Eckhaus Latta
▪ High Traffic Count of Over 26,000 Cars Daily
6
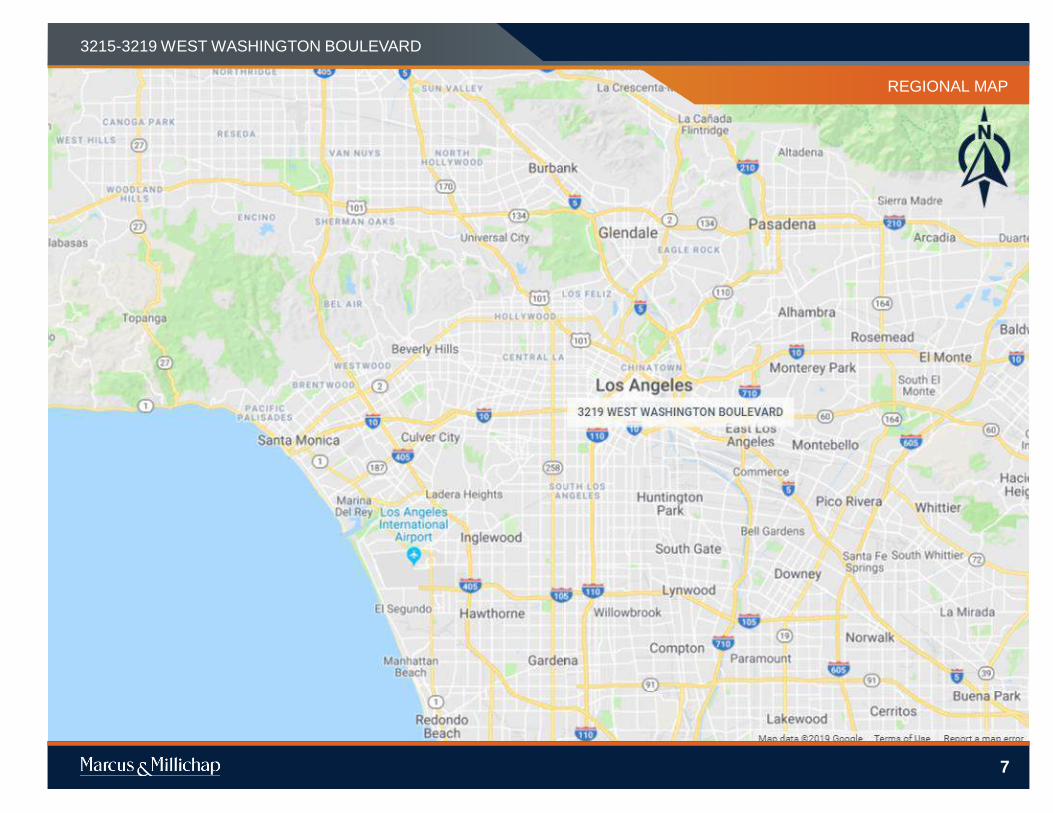
REGIONAL MAP
3215-3219 WEST WASHINGTON BOULEVARD
7
7

LOCAL MAP
3215-3219 WEST WASHINGTON BOULEVARD
8
8

AERIAL PHOTO
3215-3219 WEST WASHINGTON BOULEVARD
9
9

12
3215-3219 WEST WASHINGTON BOULEVARD
PROPERTY PHOTO
10
3215-3219 WEST WASHINGTON BOULEVARD
11
FINANCIAL
ANALYSIS
11
FINANCIAL ANALYSIS
3215-3219 WEST WASHINGTON BOULEVARD
PRICING DETAIL
12
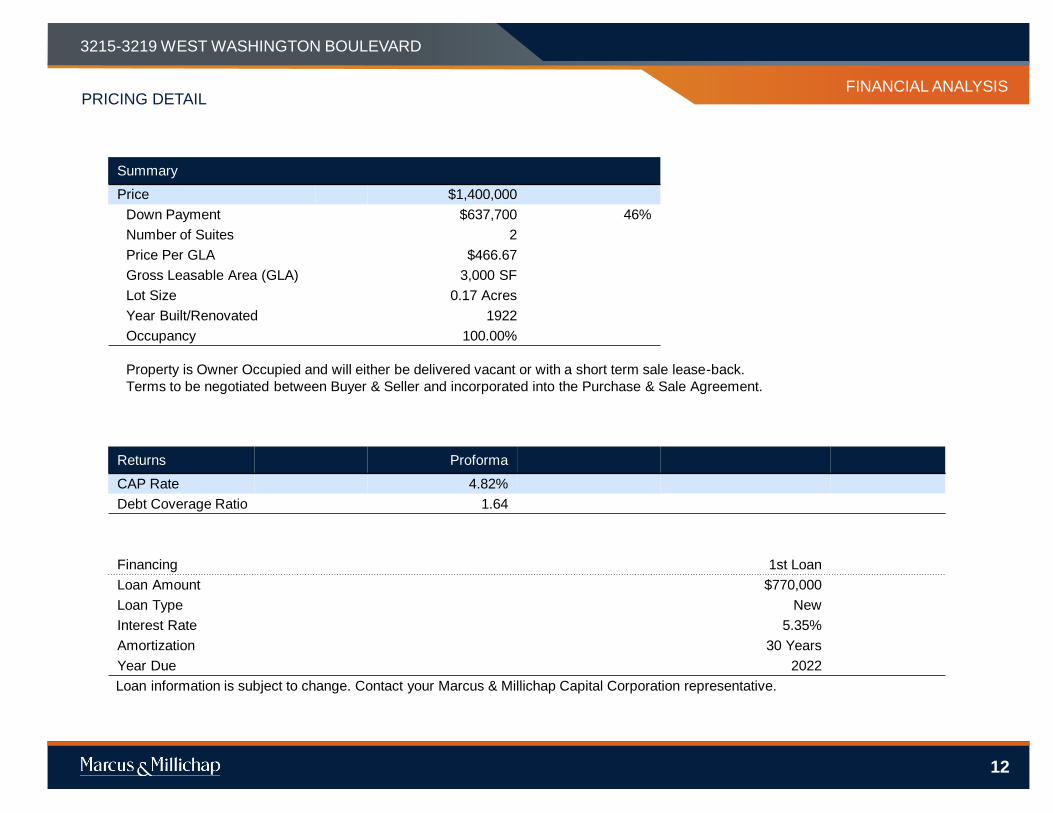
Summary
Price $1,400,000
Down Payment $637,700 46%
Number of Suites 2
Price Per GLA $466.67
Gross Leasable Area (GLA) 3,000 SF
Lot Size 0.17 Acres
Year Built/Renovated 1922
Occupancy 100.00%
Property is Owner Occupied and will either be delivered vacant or with a short term sale lease-back.
Terms to be negotiated between Buyer & Seller and incorporated into the Purchase & Sale Agreement.
Returns Proforma
CAP Rate 4.82%
Debt Coverage Ratio 1.64
Financing 1st Loan
Loan Amount $770,000
Loan Type New
Interest Rate 5.35%
Amortization 30 Years
Year Due 2022
Loan information is subject to change. Contact your Marcus & Millichap Capital Corporation representative.
12

FINANCIAL ANALYSIS
3215-3219 WEST WASHINGTON BOULEVARD
OPERATING STATEMENT
13
Notes: [1] Estimated
Income Proforma Per SF Notes
Scheduled Base Rental Income $67,500 $22.50
Expense Reimbursement Income
Insurance $3,000 $1.00 [1]
Utilities $2,400 $0.80 [1]
Trash $1,440 $0.48 [1]
Real Estate Taxes $16,744 $5.58
Total Reimbursement Income $23,584 100.0% $7.86
Effective Gross Revenue $91,084 $30.36
Operating Expenses Proforma Per SF Notes
Insurance $3,000 $1.00 [1]
Utilities $2,400 $0.80 [1]
Trash $1,440 $0.48 [1]
Real Estate Taxes $16,744 $5.58
Total Expenses $23,584 $7.86
Expenses as % of EGR 25.89%
Net Operating Income $67,500 $22.50
13
3215-3219 WEST WASHINGTON BOULEVARD
MARKET
COMPARABLES
14
3215-3219 WEST WASHINGTON BOULEVARD
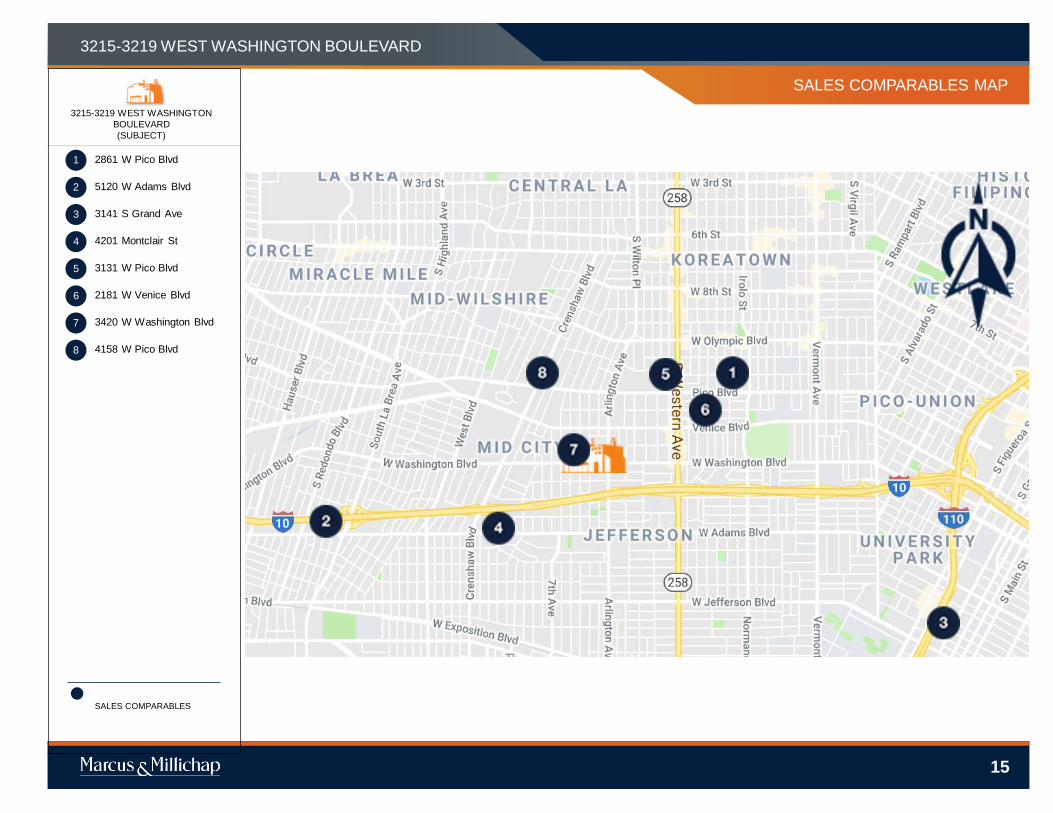
SALES COMPARABLES MAP
3215-3219 WEST WASHINGTON
BOULEVARD
(SUBJECT)
2861 W Pico Blvd
5120 W Adams Blvd
3141 S Grand Ave
4201 Montclair St
3131 W Pico Blvd
2181 W Venice Blvd
3420 W Washington Blvd
4158 W Pico Blvd
SALES COMPARABLES
1
2
3
4
5
7
8
6
15
16
PROPERTY NAME3215-3219 WEST WASHINGTON BOULEVARD
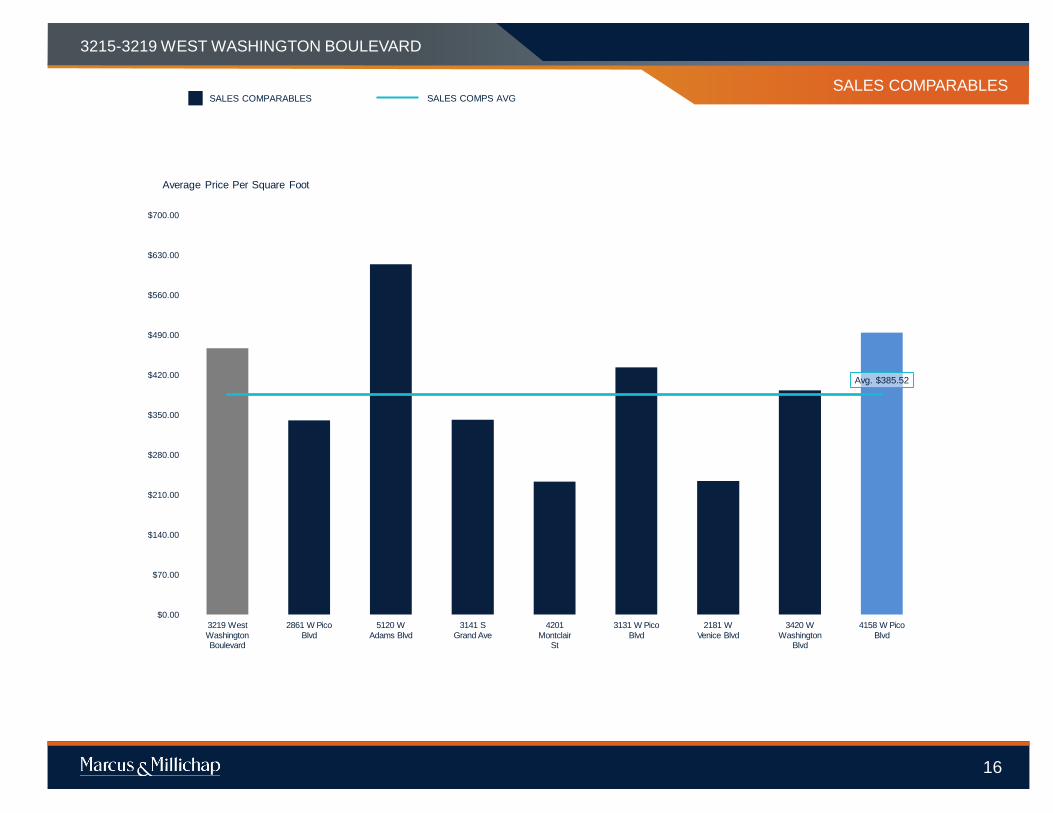
SALES COMPARABLES
Avg. $385.52
$0.00
$70.00
$140.00
$210.00
$280.00
$350.00
$420.00
$490.00
$560.00
$630.00
$700.00
3219 West
WashingtonBoulevard
2861 W Pico
Blvd
5120 W
Adams Blvd
3141 S
Grand Ave
4201
MontclairSt
3131 W Pico
Blvd
2181 W
Venice Blvd
3420 W
WashingtonBlvd
4158 W Pico
Blvd
Average Price Per Square Foot
SALES COMPARABLES SALES COMPS AVG

PROPERTY NAME
MARKETING TEAM
3215-3219 WEST WASHINGTON BOULEVARD
SALES COMPARABLES
rentpropertyname1
rentpropertyaddress1
rentpropertyname1
rentpropertyaddress1
rentpropertyname1
rentpropertyaddress1
17
SALES COMPARABLES
Asking Price $1,400,000
Price/SF $466.67
CAP Rate 4.82%
Year Built 1922
Occupancy 100%
3219 WEST WASHINGTON BOULEVARD3219 W Washington Blvd, Los Angeles, CA, 90018
1
Close of Escrow 11/21/2018
Sales Price $1,700,000
Rentable SF 4,992
Price/SF $340.54
Year Built 1922
Occupancy 100%
2861 W PICO BLVD2861 W Pico Blvd, Los Angeles, CA, 90006
2
Close of Escrow 3/1/2018
Sales Price $1,750,000
Rentable SF 2,850
Price/SF $614.04
Year Built 1928
5120 W ADAMS BLVD5120 W Adams Blvd, Los Angeles, CA, 90016
17

PROPERTY NAME
MARKETING TEAM
3215-3219 WEST WASHINGTON BOULEVARD
SALES COMPARABLES
rentpropertyname1
rentpropertyaddress1
rentpropertyname1
rentpropertyaddress1
rentpropertyname1
rentpropertyaddress1
18
SALES COMPARABLES
NOTES
The seller was doing a 1031 exchange in this sale transaction.
3
Close of Escrow 12/31/2018
Sales Price $1,650,000
Rentable SF 4,830
Price/SF $341.61
Year Built 1956
Parking Ratio 1.3
Power N
Clear Height 18'0""
3141 S GRAND AVE3141 S Grand Ave, Los Angeles, CA, 90007
4
NOTES
Property located in a corner. It was bought by CIM Group.
Tenants Lease Type
Close Of
Escrow:6/20/2018
Days On
Market:113
Sales Price: $925,000
Price/SF: $233.11
Year Built: 1927
4201 MONTCLAIR ST 4201 Montclair St, Los Angeles, CA, 90018
5
Tenants Lease Type
Close Of
Escrow:11/14/2018
Sales Price: $2,750,000
Price/SF: $433.48
Year Built: 1963
3131 W PICO BLVD3131 W Pico Blvd, Los Angeles, CA, 90019
18

PROPERTY NAME
MARKETING TEAM
3215-3219 WEST WASHINGTON BOULEVARD
SALES COMPARABLES
rentpropertyname1
rentpropertyaddress1
rentpropertyname1
rentpropertyaddress1
rentpropertyname1
rentpropertyaddress1
19
SALES COMPARABLES
6
Tenants Lease Type
Close Of
Escrow:8/10/2018
Sales Price: $1,700,000
Price/SF: $234.29
Year Built: 1955
2181 W VENICE BLVD2181 Venice Blvd, Los Angeles, CA, 90006
7
Close of Escrow 4/11/2018
Sales Price $1,100,000
Rentable SF 2,800
Price/SF $392.86
Year Built 1947
3420 W WASHINGTON BLVD3420 W Washington Blvd, Los Angeles, CA, 90018
8
NOTES
On the Market For Sale.
Tenants Lease Type
Days On
Market:299
Sales Price: $2,780,000
Price/SF: $494.22
Year Built: 1913
4158 W PICO BLVD4158 W Pico Blvd, Los Angeles, CA, 90019
19
8
3215-3219 WEST WASHINGTON BOULEVARD
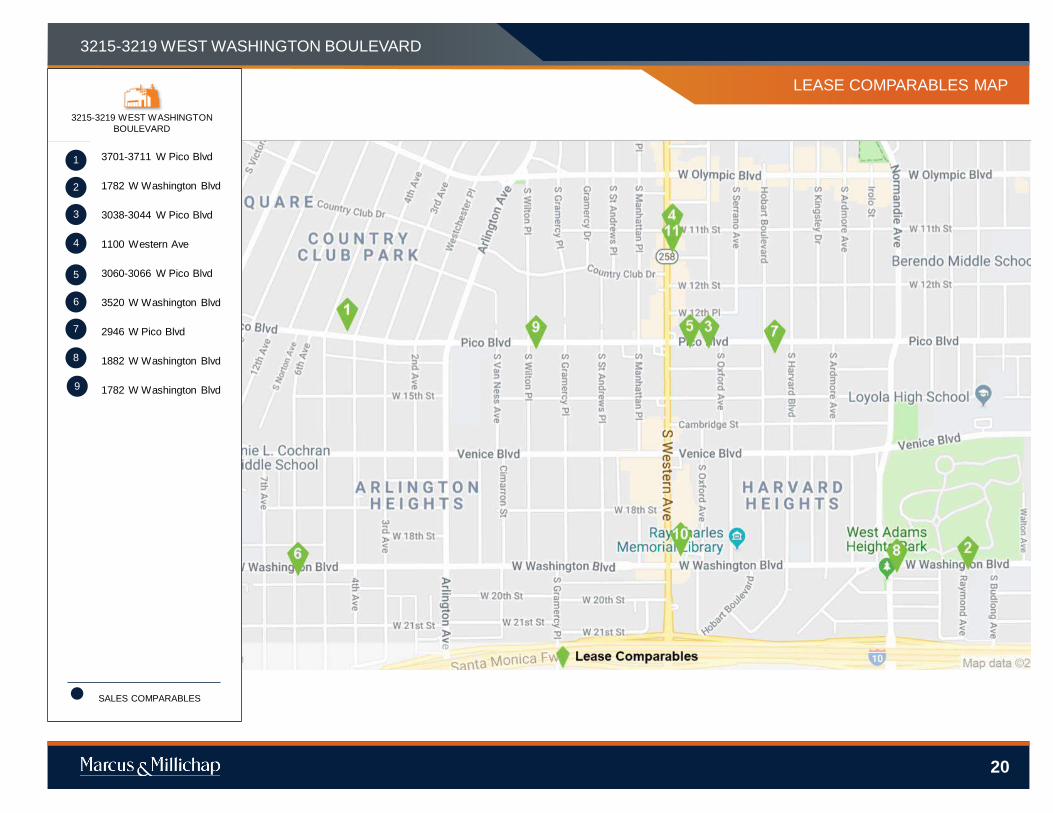
LEASE COMPARABLES MAP
3215-3219 WEST WASHINGTON
BOULEVARD
3701-3711 W Pico Blvd
1782 W Washington Blvd
3038-3044 W Pico Blvd
1100 Western Ave
3060-3066 W Pico Blvd
3520 W Washington Blvd
2946 W Pico Blvd
1882 W Washington Blvd
1782 W Washington Blvd
SALES COMPARABLES
4
7
8
9
11
20
12
14
15
16
17
13
18
10
20
1
2
3
4
5
7
8
6
8
9
9
20
PROPERTY NAME3215-3219 WEST WASHINGTON BOULEVARD
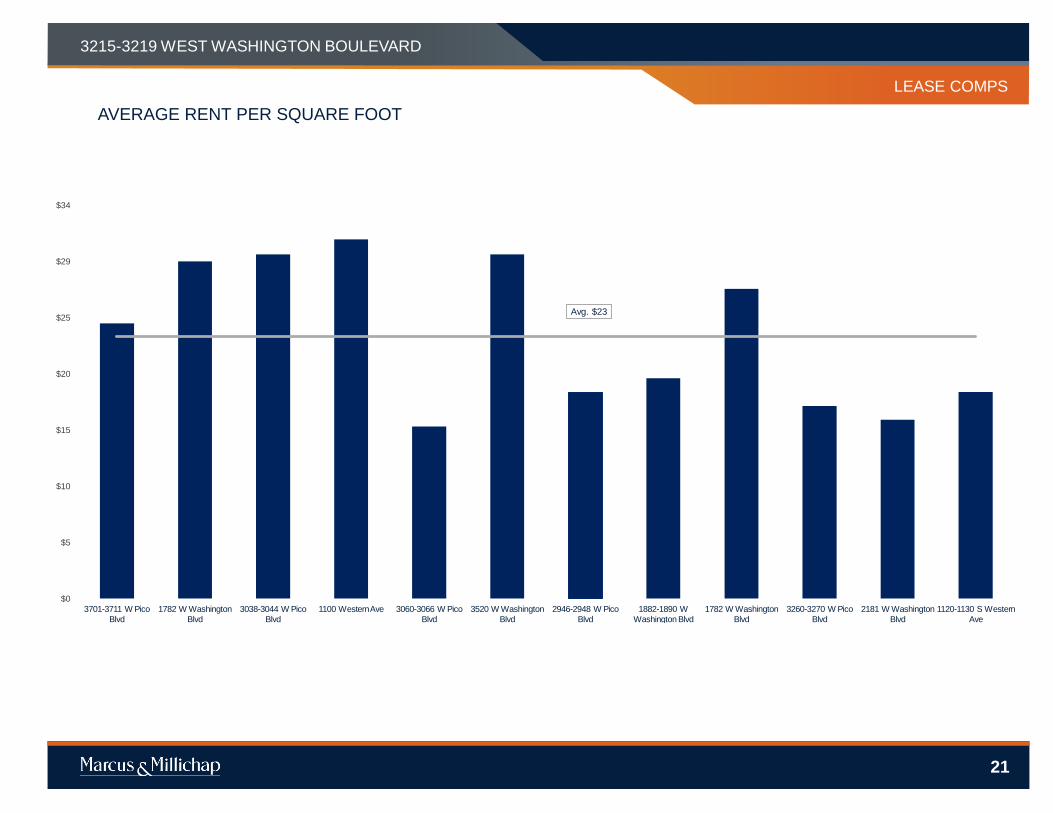
AVERAGE RENT PER SQUARE FOOT
Avg. $23
$0
$5
$10
$15
$20
$25
$29
$34
3701-3711 W Pico
Blvd
1782 W Washington
Blvd
3038-3044 W Pico
Blvd
1100 Western Ave 3060-3066 W Pico
Blvd
3520 W Washington
Blvd
2946-2948 W Pico
Blvd
1882-1890 W
Washington Blvd
1782 W Washington
Blvd
3260-3270 W Pico
Blvd
2181 W Washington
Blvd
1120-1130 S Western
Ave
LEASE COMPS
21
PROPERTY NAME
MARKETING TEAM
3215-3219 WEST WASHINGTON BOULEVARD
LEASE COMPARABLES
rentpropertyname1
rentpropertyaddress1
rentpropertyname1
rentpropertyaddress1
rentpropertyname1
rentpropertyaddress1
22
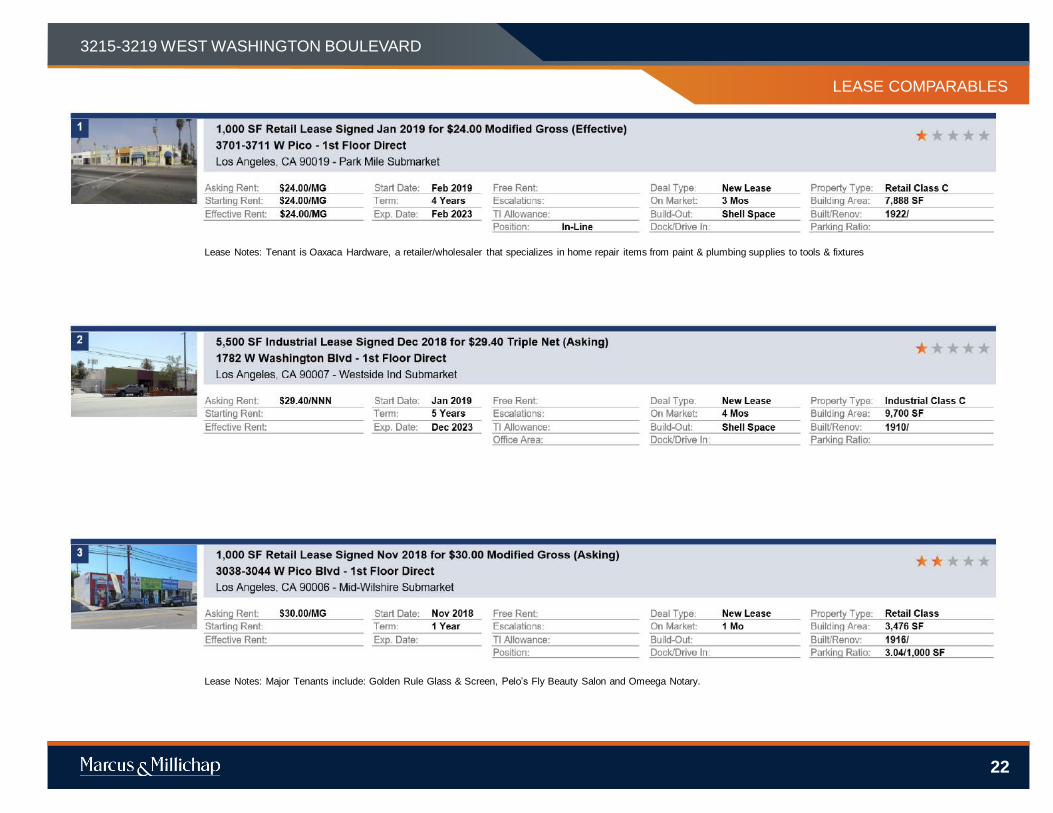
Lease Notes: Tenant is Oaxaca Hardware, a retailer/wholesaler that specializes in home repair items from paint & plumbing supplies to tools & fixtures
Lease Notes: Major Tenants include: Golden Rule Glass & Screen, Pelo’s Fly Beauty Salon and Omeega Notary.
22
PROPERTY NAME
MARKETING TEAM
3215-3219 WEST WASHINGTON BOULEVARD
LEASE COMPARABLES
rentpropertyname1
rentpropertyaddress1
rentpropertyname1
rentpropertyaddress1
rentpropertyname1
rentpropertyaddress1
23
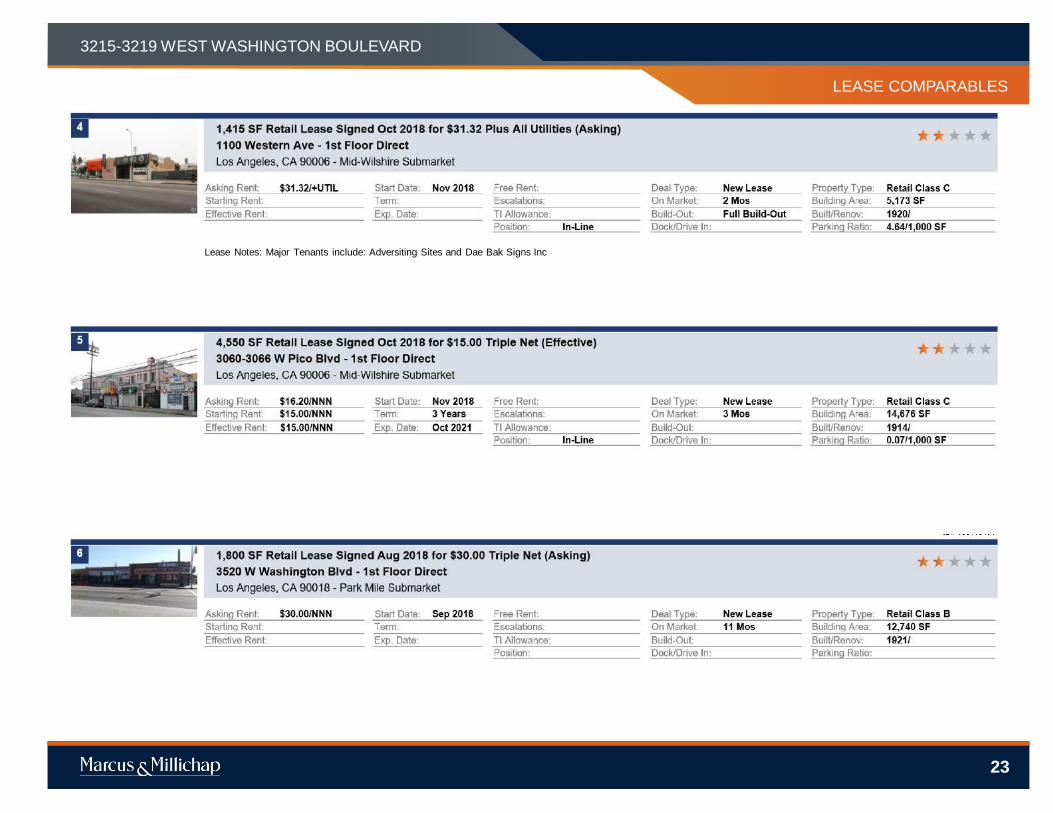
Lease Notes: Major Tenants include: Adversiting Sites and Dae Bak Signs Inc
23

PROPERTY NAME
MARKETING TEAM
3215-3219 WEST WASHINGTON BOULEVARD
LEASE COMPARABLES
rentpropertyname1
rentpropertyaddress1
rentpropertyname1
rentpropertyaddress1
rentpropertyname1
rentpropertyaddress1
24
24

PROPERTY NAME
MARKETING TEAM
3215-3219 WEST WASHINGTON BOULEVARD
LEASE COMPARABLES
rentpropertyname1
rentpropertyaddress1
rentpropertyname1
rentpropertyaddress1
rentpropertyname1
rentpropertyaddress1
25
25
3215-3219 WEST WASHINGTON BOULEVARD
26
MARKET
OVERVIEW
26
OVERVIEW
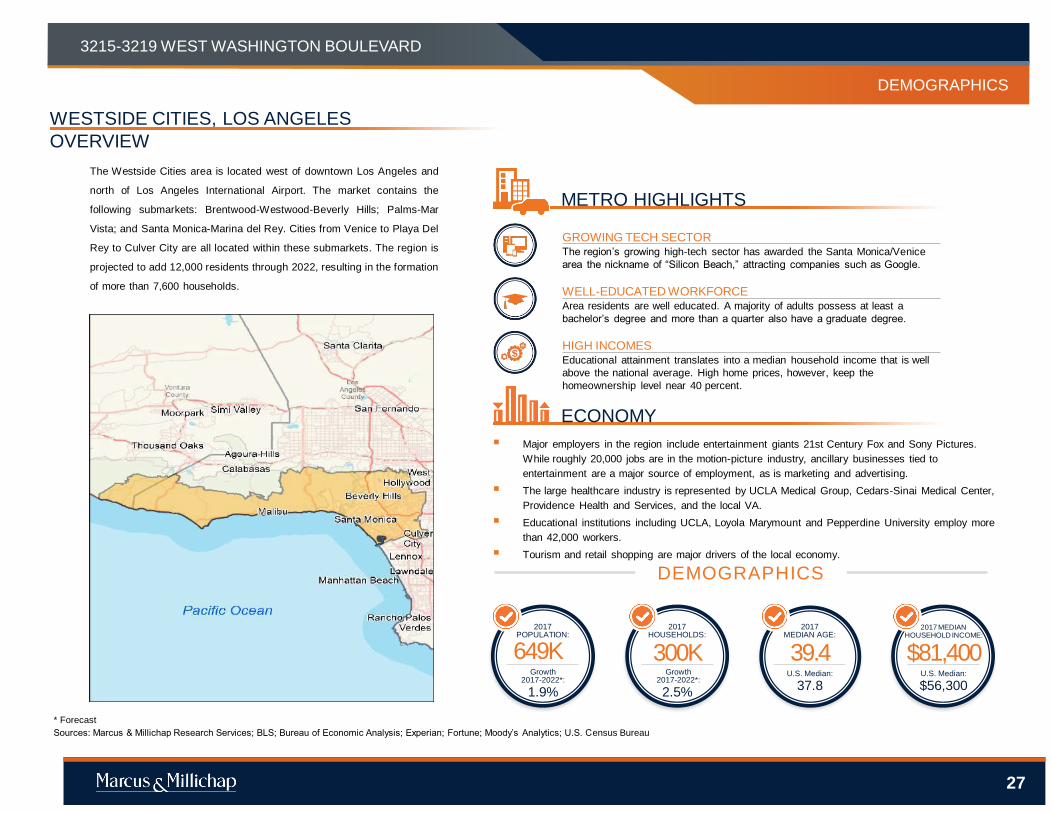
WESTSIDE CITIES, LOS ANGELES
GROWING TECH SECTORThe region’s growing high-tech sector has awarded the Santa Monica/Venice
area the nickname of “Silicon Beach,” attracting companies such as Google.
WELL-EDUCATED WORKFORCEArea residents are well educated. A majority of adults possess at least a
bachelor’s degree and more than a quarter also have a graduate degree.
HIGH INCOMESEducational attainment translates into a median household income that is well
above the national average. High home prices, however, keep the
homeownership level near 40 percent.
The Westside Cities area is located west of downtown Los Angeles and
north of Los Angeles International Airport. The market contains the
following submarkets: Brentwood-Westwood-Beverly Hills; Palms-Mar
Vista; and Santa Monica-Marina del Rey. Cities from Venice to Playa Del
Rey to Culver City are all located within these submarkets. The region is
projected to add 12,000 residents through 2022, resulting in the formation
of more than 7,600 households.
▪ Major employers in the region include entertainment giants 21st Century Fox and Sony Pictures.
While roughly 20,000 jobs are in the motion-picture industry, ancillary businesses tied to
entertainment are a major source of employment, as is marketing and advertising.
▪ The large healthcare industry is represented by UCLA Medical Group, Cedars-Sinai Medical Center,
Providence Health and Services, and the local VA.
▪ Educational institutions including UCLA, Loyola Marymount and Pepperdine University employ more
than 42,000 workers.
▪ Tourism and retail shopping are major drivers of the local economy.
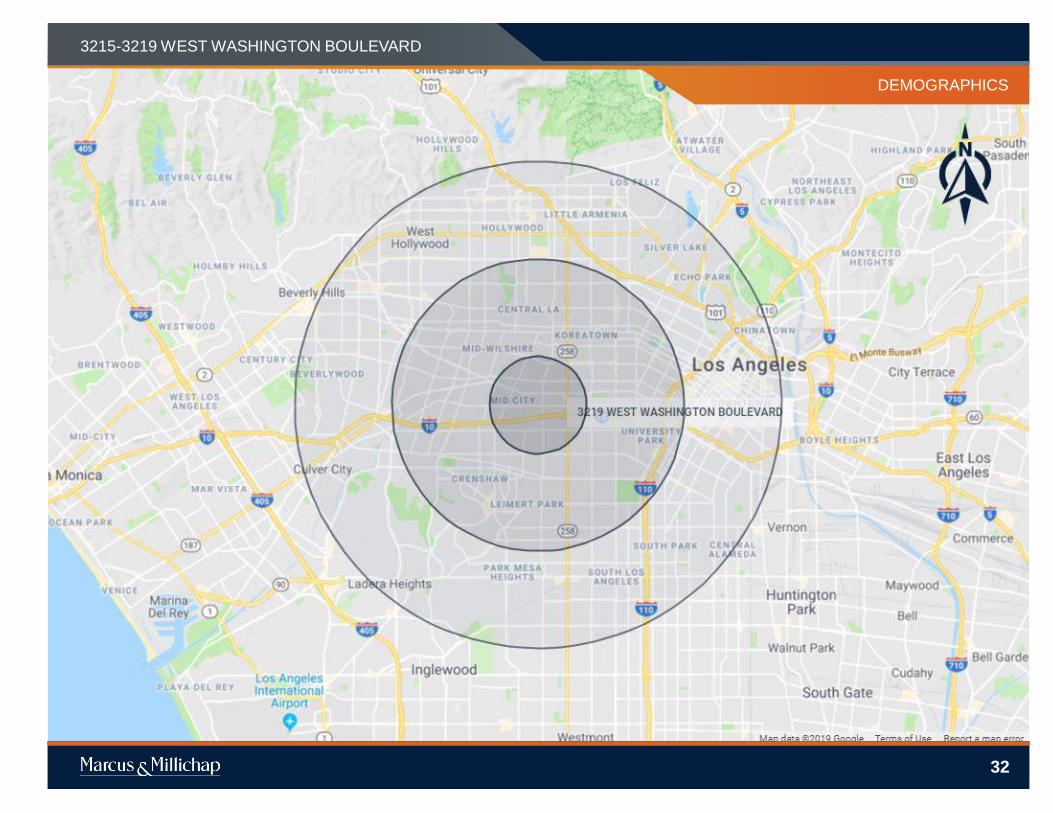
DEMOGRAPHICS
ECONOMY
METRO HIGHLIGHTS
* Forecast
Sources: Marcus & Millichap Research Services; BLS; Bureau of Economic Analysis; Experian; Fortune; Moody’s Analytics; U.S. Census Bureau
3219 WEST WASHINGTON BOULEVARD
649K
2017POPULATION:
300K
2017HOUSEHOLDS:
39.4
2017MEDIAN AGE:
$81,400
2017 MEDIAN HOUSEHOLD INCOME:
U.S. Median:
37.8U.S. Median:
$56,3002.5%
Growth2017-2022*:
1.9%
Growth2017-2022*:
2727
8
3215-3219 WEST WASHINGTON BOULEVARD
DEMOGRAPHICS
27

3219 WEST WASHINGTON BOULEVARD
28
LOS ANGELES METRO AREA
Rent Growth Among the Nation’s Strongest
In Supply-Constrained Los Angeles
Tenant demand holds strong amid a shift to newer, more affordable space. Booming e-commerce and
robust container traffic at the twin ports has logistics firms and retailers growing their supply-chain networks in
Los Angeles, keeping the vacancy rate below 3 percent for more than three years. A shortage of functional
space, though, has contributed to two consecutive quarters of negative net absorption this year as some
demand for new, modern space and lower rents shifts to the Inland Empire. Development remains
challenging amid limited land availability and lengthy permitting periods, driving outsize rent growth, which
rose 10.9 percent in June from one year earlier to $11.08 per square foot. Some of the market’s older
properties have been slated for creative office conversions, further reducing availability and contributing to
robust rent growth. Vigorous tenant demand, particularly for smaller properties that can be used to complete
the last mile of the supply chain, will keep the vacancy rate at a record low this year.
Los Angeles industrial sector one of the nation’s top performers. Deal flow during the trailing 12 months
ending in June was the strongest in three years, with increased bidding activity pushing the average price
above $225 per square foot. Out-of-state and institutional buyers remain highly active, drawn by limited
threats from new supply, tight vacancy and some of the best rent growth in the nation. Properties traded over
the past year recorded an average cap rate in the low-5 percent territory, one of the lowest industrial cap
rates in the nation. The Central Los Angeles submarket led industrial sales over the past year, with some
properties posting a first-year yield in the lower-4 percent territory. Buyers seeking higher returns will look to
San Gabriel Valley, where cap rates can be 100 basis points above the rest of the market in some instances
and prices averaged in the mid-$100 band.
* Forecast
Sources: Marcus & Millichap Research Services; Bureau of Labor
Statistics; CoStar Group, Inc.; Real Capital Analytics
8
3215-3219 WEST WASHINGTON BOULEVARD
DEMOGRAPHICS
28

3219 WEST WASHINGTON BOULEVARD
29
LOS ANGELES METRO AREA
2018 Market Forecast
Employment growth nearly matches last year’s creation of 62,300 jobs with
the addition of 61,000 workers this year.
Barriers to development slow deliveries this year from the 6.9 million square
feet finished in 2017, a cycle high, though construction remains above the
previous five-year average.
Strong pre-leasing activity keeps the vacancy rate exceptionally tight, ending
the year at 2 percent, remaining unchanged for the third straight year.
The average asking rent climbs to $11.60 per square foot this year, trailing
an 11.9 percent rise registered in 2017.
The Upper San Gabriel Valley submarket led the metro in net absorption
over the past year. The area could attract greater investment this year as
rents are among the lowest in LA.
** Trailing 12 months through 2Q
Sources: Marcus & Millichap Research Services; Bureau of Labor
Statistics; CoStar Group, Inc.; Real Capital Analytics
Employment
up 1.4%
Construction
4.6 million sq. ft.
Vacancy
unchanged
Rent
up 8.9%
Investment
8
3215-3219 WEST WASHINGTON BOULEVARD
DEMOGRAPHICS
29

PROPERTY NAME
MARKETING TEAM
3215-3219 WEST WASHINGTON BOULEVARD
DEMOGRAPHICS
Source: © 2018 Experian
Created on February 2019
POPULATION 1 Miles 3 Miles 5 Miles
▪ 2023 Projection
Total Population 61,478 568,629 1,363,562
▪ 2018 Estimate
Total Population 61,531 567,995 1,357,434
▪ 2010 Census
Total Population 59,479 546,134 1,291,599
▪ 2000 Census
Total Population 59,822 553,234 1,292,021
▪ Daytime Population
2018 Estimate 37,010 460,709 1,400,557
HOUSEHOLDS 1 Miles 3 Miles 5 Miles
▪ 2023 Projection
Total Households 20,307 207,926 530,501
▪ 2018 Estimate
Total Households 20,101 204,253 517,104
Average (Mean) Household Size 2.98 2.70 2.55
▪ 2010 Census
Total Households 19,280 194,353 484,456
▪ 2000 Census
Total Households 19,148 192,609 469,364
HOUSEHOLDS BY INCOME 1 Miles 3 Miles 5 Miles
▪ 2018 Estimate
$200,000 or More 3.48% 3.98% 5.59%
$150,000 - $199,000 3.40% 3.18% 4.18%
$100,000 - $149,000 7.83% 8.53% 10.37%
$75,000 - $99,999 7.77% 8.95% 9.78%
$50,000 - $74,999 15.00% 16.08% 15.66%
$35,000 - $49,999 13.61% 14.01% 12.53%
$25,000 - $34,999 12.06% 12.15% 10.42%
$15,000 - $24,999 15.73% 14.63% 13.02%
Under $15,000 21.11% 18.48% 18.46%
Average Household Income $60,223 $64,606 $74,295
Median Household Income $36,013 $39,590 $44,106
Per Capita Income $20,104 $23,698 $28,868
POPULATION PROFILE 1 Miles 3 Miles 5 Miles
▪ Population By Age
2018 Estimate Total Population 61,531 567,995 1,357,434
Under 20 24.84% 23.90% 22.37%
20 to 34 Years 24.36% 27.58% 27.87%
35 to 39 Years 7.07% 7.69% 8.13%
40 to 49 Years 13.44% 13.60% 13.95%
50 to 64 Years 18.26% 16.56% 16.55%
Age 65+ 12.05% 10.67% 11.12%
Median Age 35.54 34.12 34.86
▪ Population 25+ by Education Level
2018 Estimate Population Age 25+ 41,851 382,609 946,921
Elementary (0-8) 15.54% 14.52% 13.24%
Some High School (9-11) 13.39% 11.41% 10.49%
High School Graduate (12) 25.00% 21.15% 18.97%
Some College (13-15) 16.83% 16.74% 16.70%
Associate Degree Only 4.57% 5.08% 5.43%
Bachelors Degree Only 15.18% 19.48% 21.61%
Graduate Degree 5.57% 7.58% 9.69%
▪ Time Travel to Work
Average Travel Time in Minutes 37 35 34
30

Income
In 2018, the median household income for your selected geography is
$36,013, compare this to the US average which is currently $58,754.
The median household income for your area has changed by 53.76%
since 2000. It is estimated that the median household income in your
area will be $40,703 five years from now, which represents a change
of 13.02% from the current year.
The current year per capita income in your area is $20,104, compare
this to the US average, which is $32,356. The current year average
household income in your area is $60,223, compare this to the US
average which is $84,609.
Population
In 2018, the population in your selected geography is 61,531. The
population has changed by 2.86% since 2000. It is estimated that the
population in your area will be 61,478.00 five years from now, which
represents a change of -0.09% from the current year. The current
population is 48.86% male and 51.14% female. The median age of the
population in your area is 35.54, compare this to the US average
which is 37.95. The population density in your area is 19,583.14
people per square mile.
Households
There are currently 20,101 households in your selected geography.
The number of households has changed by 4.98% since 2000. It is
estimated that the number of households in your area will be 20,307
five years from now, which represents a change of 1.02% from the
current year. The average household size in your area is 2.98
persons.
Employment
In 2018, there are 8,526 employees in your selected area, this is also
known as the daytime population. The 2000 Census revealed that
47.05% of employees are employed in white-collar occupations in this
geography, and 53.40% are employed in blue-collar occupations. In
2018, unemployment in this area is 6.77%. In 2000, the average time
traveled to work was 37.00 minutes.
Race and Ethnicity
The current year racial makeup of your selected area is as follows:
25.68% White, 22.51% Black, 0.12% Native American and 14.66%
Asian/Pacific Islander. Compare these to US averages which are:
70.20% White, 12.89% Black, 0.19% Native American and 5.59%
Asian/Pacific Islander. People of Hispanic origin are counted
independently of race.
People of Hispanic origin make up 57.72% of the current year
population in your selected area. Compare this to the US average of
18.01%.
PROPERTY NAME
MARKETING TEAM
3215-3219 WEST WASHINGTON BOULEVARD
Housing
The median housing value in your area was $582,394 in 2018,
compare this to the US average of $201,842. In 2000, there were
4,224 owner occupied housing units in your area and there were
14,924 renter occupied housing units in your area. The median rent at
the time was $519.
Source: © 2018 Experian
DEMOGRAPHICS
31
8
3215-3219 WEST WASHINGTON BOULEVARD
DEMOGRAPHICS
32

www.MarcusMillichap.com
Laura Alice Scaturro
National Office and Industrial Properties Group
West Los Angeles Office
Tel: (310) 909-5472
Fax: (310) 909-5410
License: CA 01942167
Ingrid Farias-Eisner
West Los Angeles Office
Tel: (310) 909-5449
Fax: (310) 909-5410
License: CA 02071328
P R E S E N T E D B Y


![[WMD2016] Price Intelligently >> Patrick Campbell "What you need to know to have the best pricing and positioning"](https://static.fdocuments.in/doc/165x107/586e84e11a28aba0038b61bf/wmd2016-price-intelligently-patrick-campbell-what-you-need-to-know-to-592562fe6c63a.jpg)