Cardiology Conference Gatchalian, Gaw, Geraldoy, Geronimo, Geronimo, Geronimo December 22, 2010.

Market Outlook and Innovations in Wind and Solar Power
February 12th, 2013
Presented by:
Blake Nixon - President - Geronimo Energy
Charlie Daum - Director of Business Development - Geronimo Energy

Company Background
• Utility-scale renewable energy developer headquartered in Edina, MN
• Geronimo has successfully developed and built three projects (19 MW, 20 MW, and 200 MW)
• Recently achieved COD on a 200 megawatt (MW) wind farm in southwestern MN with a Power Purchase Agreement (PPA) with Xcel Energy (NYSE:XEL), the largest buyer of wind energy in the US
• Strategic partnership with Enel Green Power
• The 2nd leading generator of renewable energy in the world.
• Over 600 plants in operation around the world with over 7,000 MW of capacity
• 2011 revenue of ~$3.1 billion
• EBIDTA of ~$2 billion
• Market capitalization of ~$8 billion
• A majority owned subsidiary of Enel SpA
• Second largest utility in Europe
• Investment grade credit rating
Geronimo’s strategic partnership with EGP provides vast experience and financial capabilities
Market Outlook and Innovations in Wind and Solar Power - Feb 12th, 2013 2

Introduction
• Now is a unique time to buy renewable energy
– Costs of renewable energy are at all time lows
– Signs point to rising power prices
– Buying renewable energy can be done using a direct purchase or virtual purchase structure
Market Outlook and Innovations in Wind and Solar Power - Feb 12th, 2013 3

Agenda
• State of the Renewable Energy Industry
– Extension of the Production Tax Credit (PTC) for Wind
– Current market for wind power
– Current market for solar power
• Impact of Natural Gas on Renewable Energy
– U.S. Natural Gas Demand
– The impact of natural gas prices on the renewable energy market
• Examples of Innovative Structures for Purchases of Renewable Energy
– Direct Purchases of Renewable Energy
– The “Virtual Power Purchase Agreement”
Market Outlook and Innovations in Wind and Solar Power - Feb 12th, 2013 4
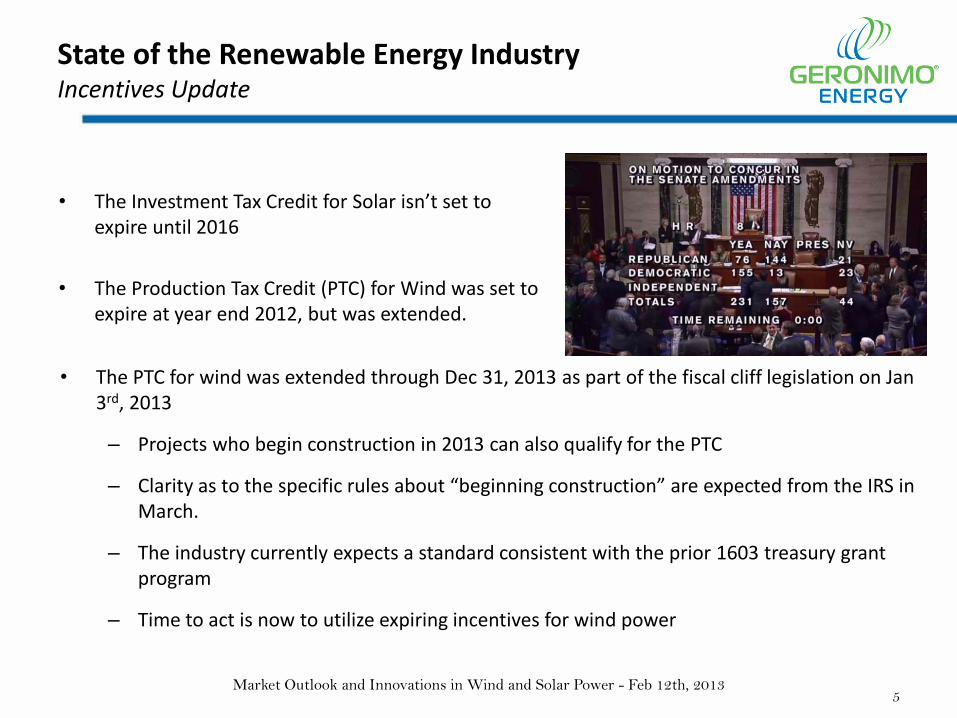
State of the Renewable Energy Industry Incentives Update
• The Investment Tax Credit for Solar isn’t set to expire until 2016
• The Production Tax Credit (PTC) for Wind was set to expire at year end 2012, but was extended.
• The PTC for wind was extended through Dec 31, 2013 as part of the fiscal cliff legislation on Jan 3rd, 2013
– Projects who begin construction in 2013 can also qualify for the PTC
– Clarity as to the specific rules about “beginning construction” are expected from the IRS in March.
– The industry currently expects a standard consistent with the prior 1603 treasury grant program
– Time to act is now to utilize expiring incentives for wind power
Market Outlook and Innovations in Wind and Solar Power - Feb 12th, 2013 5

State of the Renewable Energy Industry Wind Power PPAs
$/MWh Reporting projects
0
40
80
120
160
200
240
280
320
0
10
20
30
40
50
60
70
80
Q104
Q304
Q105
Q305
Q106
Q306
Q107
Q307
Q108
Q308
Q109
Q309
Q110
Q310
Q111
Q311
Q112
Reporting projects PPA price by commissioning date
Average offtake price PPA price by contract signing date
• Note: ‘Average offtake price’ includes all projects commissioned before 2004 and merchant and banded sales. PPA prices do not include banded structures. Rolling averages are used on historical PPA prices to eliminate outliers.
Source: Bloomberg New Energy Finance, FERC
Market Outlook and Innovations in Wind and Solar Power - Feb 12th, 2013 6
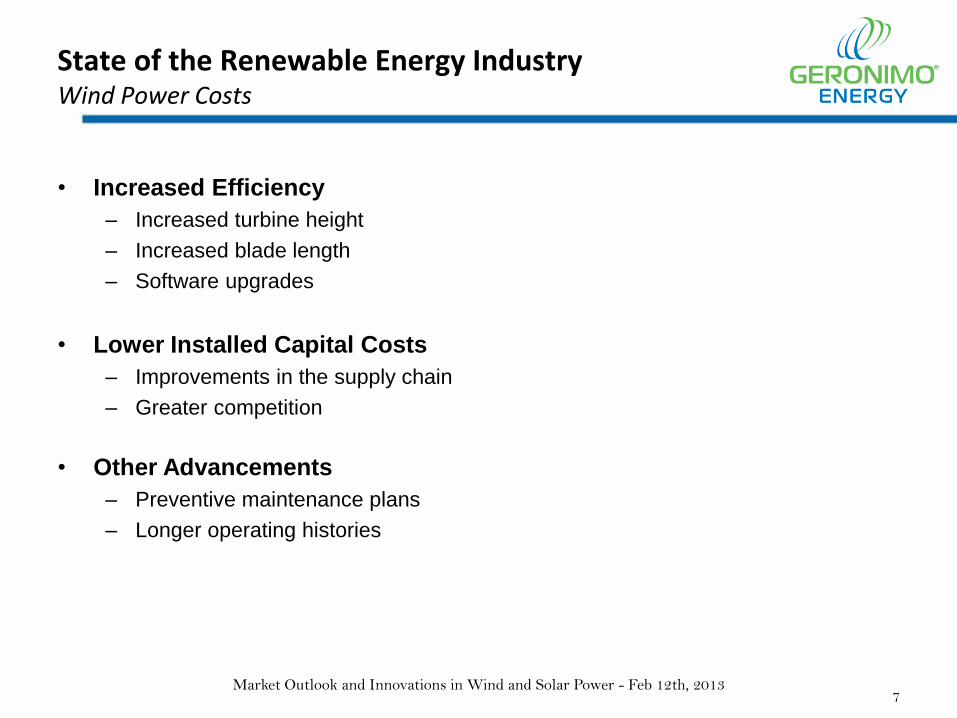
State of the Renewable Energy Industry Wind Power Costs
• Increased Efficiency
– Increased turbine height
– Increased blade length
– Software upgrades
• Lower Installed Capital Costs
– Improvements in the supply chain
– Greater competition
• Other Advancements
– Preventive maintenance plans
– Longer operating histories
Market Outlook and Innovations in Wind and Solar Power - Feb 12th, 2013 7

State of the Renewable Energy Industry Solar Power Costs
Solar Module Spot Prices November 2010 – September 2012
Costs today 50% lower than just two years ago
Source: Bloomberg New Energy Finance
Market Outlook and Innovations in Wind and Solar Power - Feb 12th, 2013 8

State of the Renewable Energy Industry Solar Power Market
U.S. PV Installations by Market Segment, Q1 2010 to Q3 2012
As expected low prices, among other reasons, meant more installations
Market Outlook and Innovations in Wind and Solar Power - Feb 12th, 2013 9
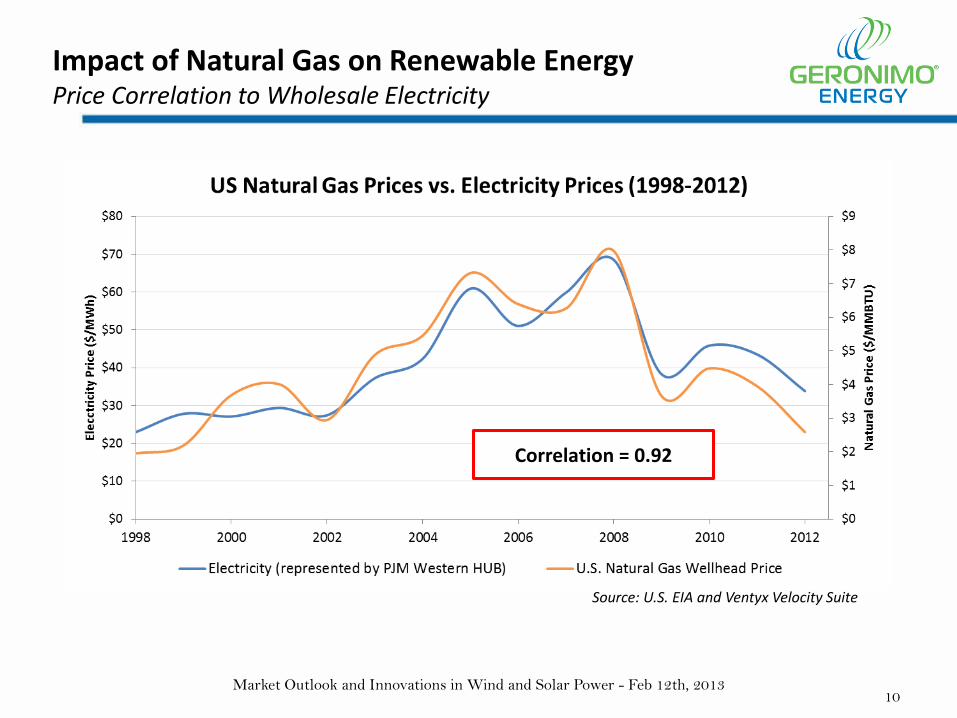
Impact of Natural Gas on Renewable Energy Price Correlation to Wholesale Electricity
Correlation = 0.92
Source: U.S. EIA and Ventyx Velocity Suite
Market Outlook and Innovations in Wind and Solar Power - Feb 12th, 2013 10

Impact of Natural Gas on Renewable Energy Natural Gas Past, Present, Future
• History
– Volatile / unpredictable
– Correlates very strongly with Electricity Prices
• Renewable Energy creates opportunity to hedge unpredictable price of natural gas
• Recent
– 2012 was an anomaly year
• Winter was fourth warmest in recorded history
• Large over supply of natural gas led to tumbling prices
– Production and storage pulled back as drilling slowed
• Future
– Demand drivers point upward
• Liquefied Natural Gas (LNG) exports
• Coal plant retirements
• Natural gas as a vehicle fuel
• Decreased drilling due to economics
Historic Natural Gas Price
$0.00
$2.00
$4.00
$6.00
$8.00
$10.00
$12.00
1995 1998 2001 2004 2007 2010
We
llhe
ad P
rice
($
/MM
BTU
)
Avg. Last 10 years: $5.31
Source: US EIA
0
1,000
2,000
3,000
4,000
5,000
4-Jan-12 4-Apr-12 4-Jul-12 4-Oct-12
bcf
U.S. Natural Gas Underground Supply
Previous 5 year range
2012 Working GasStock
Source: US EIA
Natural Gas Futures Price
$0.00
$2.00
$4.00
$6.00
2013 2015 2017 2019 2021
NY
MEX
He
ne
ry H
ub
Fu
ture
s P
rice
Avg. Forward Price: $4.61
$5.94/MMBTU
Source: NYMEX.com (2/7/2013) Market Outlook and Innovations in Wind and Solar Power - Feb 12th, 2013 11
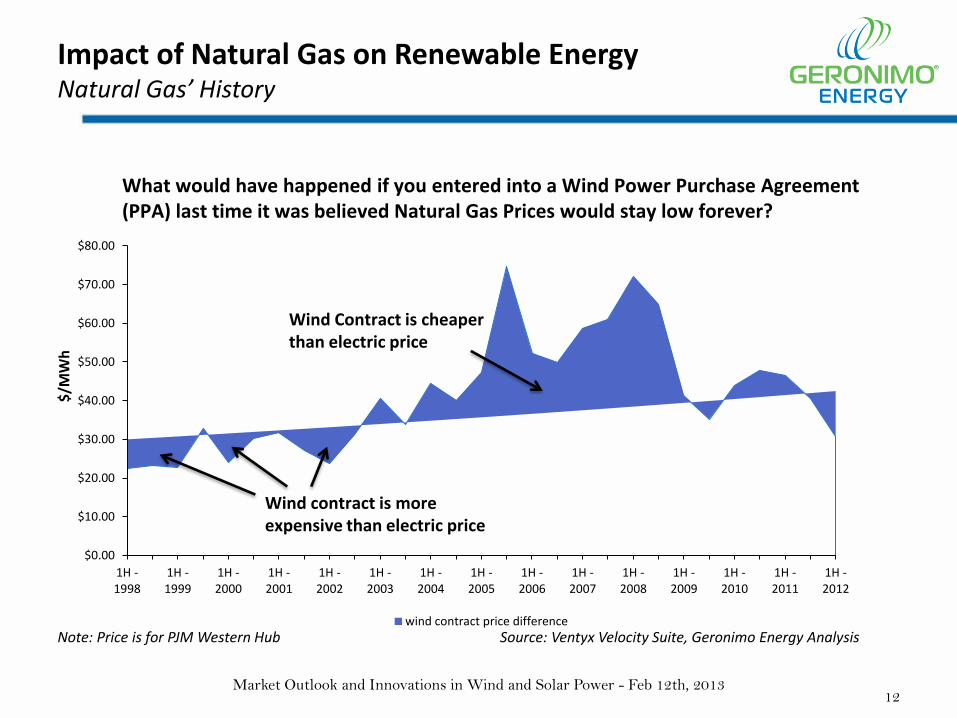
Impact of Natural Gas on Renewable Energy Natural Gas’ History
1H -2012
1H -2011
1H -2010
1H -2009
1H -2008
1H -2007
1H -2006
1H -2005
1H -2004
1H -2003
1H -2002
1H -2001
1H -2000
1H -1999
1H -1998
$0.00
$10.00
$20.00
$30.00
$40.00
$50.00
$60.00
$70.00
$80.00
wind contract price difference
$/M
Wh
Wind Contract is cheaper than electric price
Wind contract is more expensive than electric price
What would have happened if you entered into a Wind Power Purchase Agreement (PPA) last time it was believed Natural Gas Prices would stay low forever?
Note: Price is for PJM Western Hub Source: Ventyx Velocity Suite, Geronimo Energy Analysis
Market Outlook and Innovations in Wind and Solar Power - Feb 12th, 2013 12

Impact of Natural Gas on Renewable Energy Coal Plants Announced to Retire
• EPA regulation issued in December 2011 requiring coal-fired power plants to reduce their emissions by 2014 of: – Mercury – Arsenic – Acid gas – Nickel – Cyanide
• Estimated that ~60% will be replaced by natural gas Source: U.S. EIA
Market Outlook and Innovations in Wind and Solar Power - Feb 12th, 2013 13
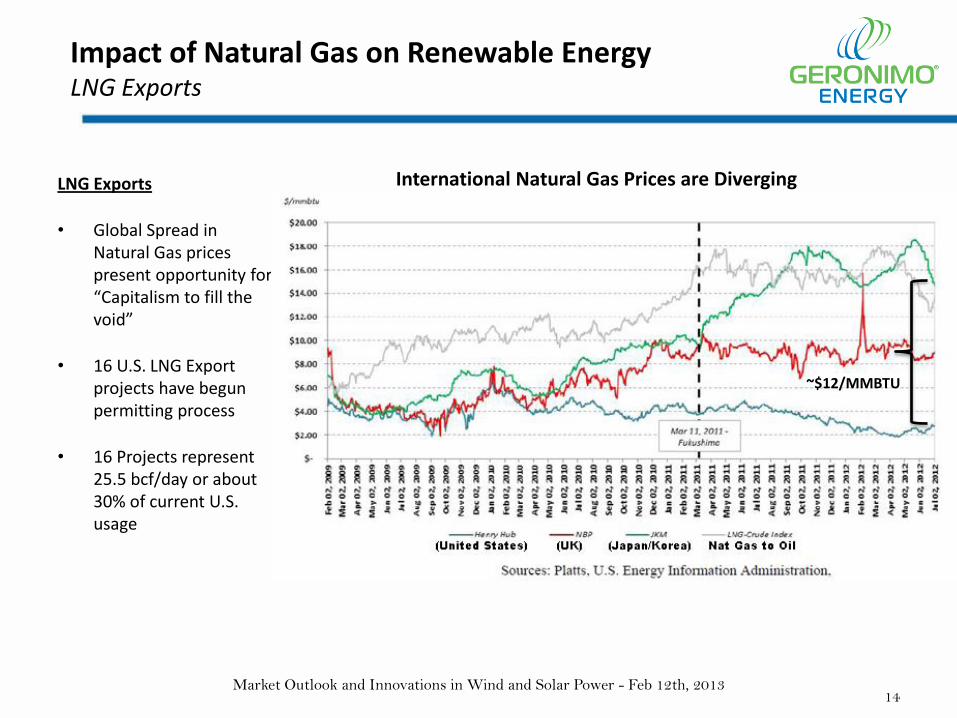
Impact of Natural Gas on Renewable Energy LNG Exports
LNG Exports
• Global Spread in Natural Gas prices present opportunity for “Capitalism to fill the void”
• 16 U.S. LNG Export projects have begun permitting process
• 16 Projects represent 25.5 bcf/day or about 30% of current U.S. usage
International Natural Gas Prices are Diverging
~$12/MMBTU
Market Outlook and Innovations in Wind and Solar Power - Feb 12th, 2013 14

Examples of Innovative Structures Why it makes sense
Direct Purchase
1. Additionality – a new renewable generator is added to the grid because of your actions
2. Hedge against cost increases
3. Opportunity to offset CO2 emissions
4. Purchase at a fixed price today when prices are low
5. Displace cost of “retail” power
“Virtual” Purchase
1. Additionality – a new renewable generator is added to the grid because of your actions
2. Hedge against cost increases
3. Opportunity to offset CO2 emissions
4. Purchase at a fixed price today when prices are low
5. Avoid dealing with transmission service and operational issues
Market Outlook and Innovations in Wind and Solar Power - Feb 12th, 2013 15
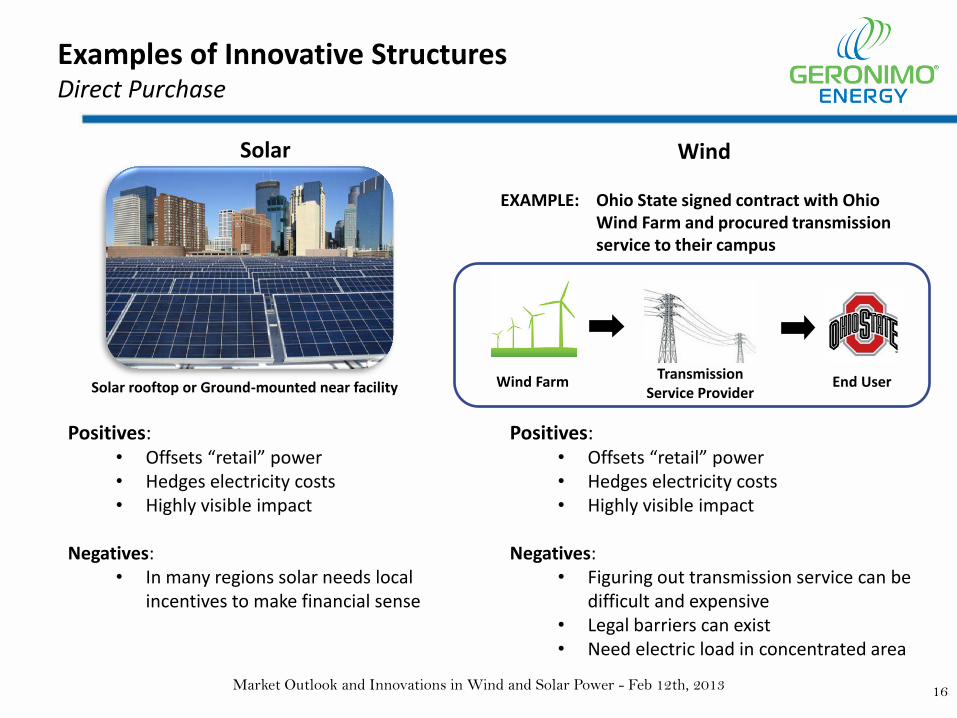
Examples of Innovative Structures Direct Purchase
Solar
Solar rooftop or Ground-mounted near facility
Positives: • Offsets “retail” power • Hedges electricity costs • Highly visible impact
Negatives:
• In many regions solar needs local incentives to make financial sense
Wind
EXAMPLE: Ohio State signed contract with Ohio Wind Farm and procured transmission service to their campus
Wind Farm Transmission Service Provider
End User
Positives: • Offsets “retail” power • Hedges electricity costs • Highly visible impact
Negatives:
• Figuring out transmission service can be difficult and expensive
• Legal barriers can exist • Need electric load in concentrated area
Market Outlook and Innovations in Wind and Solar Power - Feb 12th, 2013 16
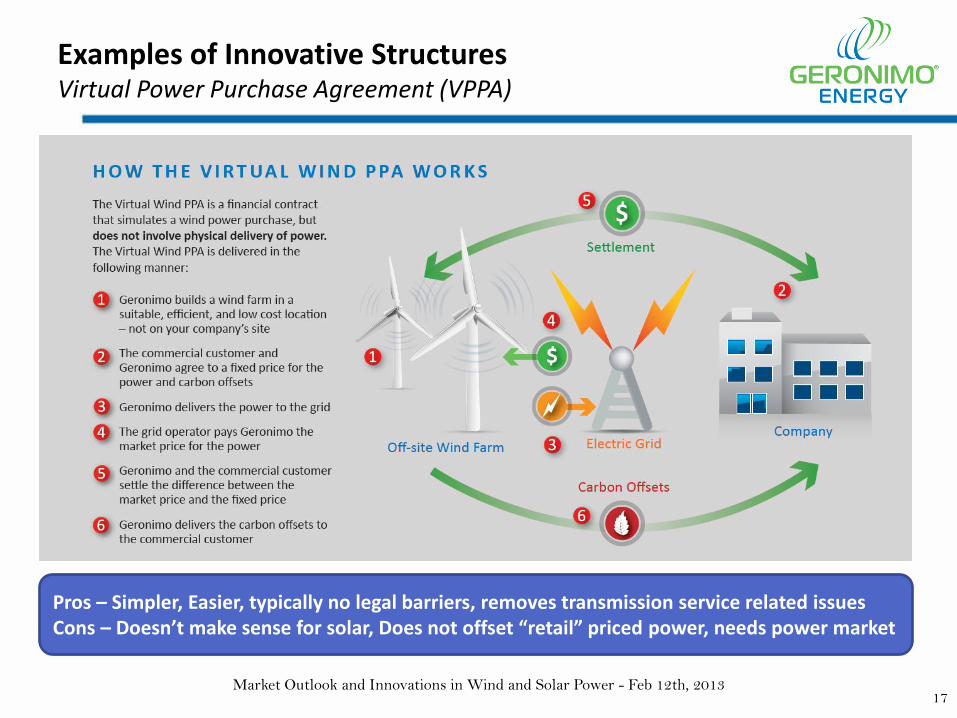
Examples of Innovative Structures Virtual Power Purchase Agreement (VPPA)
Pros – Simpler, Easier, typically no legal barriers, removes transmission service related issues Cons – Doesn’t make sense for solar, Does not offset “retail” priced power, needs power market
Market Outlook and Innovations in Wind and Solar Power - Feb 12th, 2013 17

Examples of Innovative Structures Pre-Paid PPAs
• Structure:
– Can work for solar or wind energy, virtual or direct
– Buyer prepays for ~60% of facility output at a ~50% discount to upfront price
– Buyer still receives energy produced, future payments are trued up to actual production
– Net cost is 25-30% lower than traditional PPA
• Positives:
– Uses customer’s lower cost of capital
– Still able to efficiently use tax benefits
• Negatives:
– More complex transaction
– Can have high transaction costs
Market Outlook and Innovations in Wind and Solar Power - Feb 12th, 2013 18
Summary
• State of the Renewable Energy Industry
– Extension of the Production Tax Credit (PTC) for Wind
– Cost of wind power at historic lows
– Solar energy costs declining rapidly
• Impact of Natural Gas on Renewable Energy
– Coal plant retirements and exports will increase demand for natural gas
– Electricity’s high correlation to natural gas presents an opportunity to hedge while also going green
• Examples of Innovative Structures for Purchases of Renewable Energy
– Direct Purchases of Renewable Energy offset “retail” power costs
– Virtual Wind Power Purchases offer a scalable and economic way to meet sustainability objectives
Market Outlook and Innovations in Wind and Solar Power - Feb 12th, 2013 19
Contact
Blake Nixon
President
C 612.730.3944
Charlie Daum
Director of Business Development
C 612.203.9023
Geronimo Energy 7650 Edinborough Way Suite 725 Edina, MN 55435 P 952.988.9000 F 952.988.9001 www.GeronimoEnergy.com
Market Outlook and Innovations in Wind and Solar Power - Feb 12th, 2013 20