Mark Scheme (Results)...million New sales revenue: £8.48 × 76 million = £644.5 million Analysis:...
26
Mark Scheme (Results) Summer 2017 Pearson Edexcel GCE A Level in Economics A (9EC0) Paper 01 Markets and Business Behaviour
Transcript of Mark Scheme (Results)...million New sales revenue: £8.48 × 76 million = £644.5 million Analysis:...
Mark Scheme (Results)
Summer 2017 Pearson Edexcel GCE A Level in Economics A (9EC0) Paper 01 Markets and Business Behaviour

Edexcel and BTEC Qualifications
Edexcel and BTEC qualifications are awarded by Pearson, the UK’s largest awarding
body. We provide a wide range of qualifications including academic, vocational,
occupational and specific programmes for employers. For further information visit our
qualifications websites at www.edexcel.com or www.btec.co.uk. Alternatively, you can
get in touch with us using the details on our contact us page at
www.edexcel.com/contactus.
Pearson: helping people progress, everywhere
Pearson aspires to be the world’s leading learning company. Our aim is to help
everyone progress in their lives through education. We believe in every kind of
learning, for all kinds of people, wherever they are in the world. We’ve been involved
in education for over 150 years, and by working across 70 countries, in 100
languages, we have built an international reputation for our commitment to high
standards and raising achievement through innovation in education. Find out more
about how we can help you and your students at: www.pearson.com/uk
Summer 2017
Publications Code 9EC0_01_1706_MS
All the material in this publication is copyright
© Pearson Education Ltd 2017

General marking guidance
All candidates must receive the same treatment. Examiners must mark
the last candidate in exactly the same way as they mark the first.
Mark schemes should be applied positively. Candidates must be
rewarded for what they have shown they can do rather than be penalised for
omissions.
Examiners should mark according to the mark scheme – not according to
their perception of where the grade boundaries may lie.
All the marks on the mark scheme are designed to be awarded.
Examiners should always award full marks if deserved, i.e. if the answer
matches the mark scheme. Examiners should also be prepared to award zero
marks if the candidate’s response is not worthy of credit according to the mark
scheme.
Where some judgement is required, mark schemes will provide the
principles by which marks will be awarded and exemplification/indicative content
will not be exhaustive.
When examiners are in doubt regarding the application of the mark
scheme to a candidate’s response, a senior examiner must be consulted before
a mark is given.
Crossed-out work should be marked unless the candidate has replaced it
with an alternative response.
Question
Number
Answer Mark
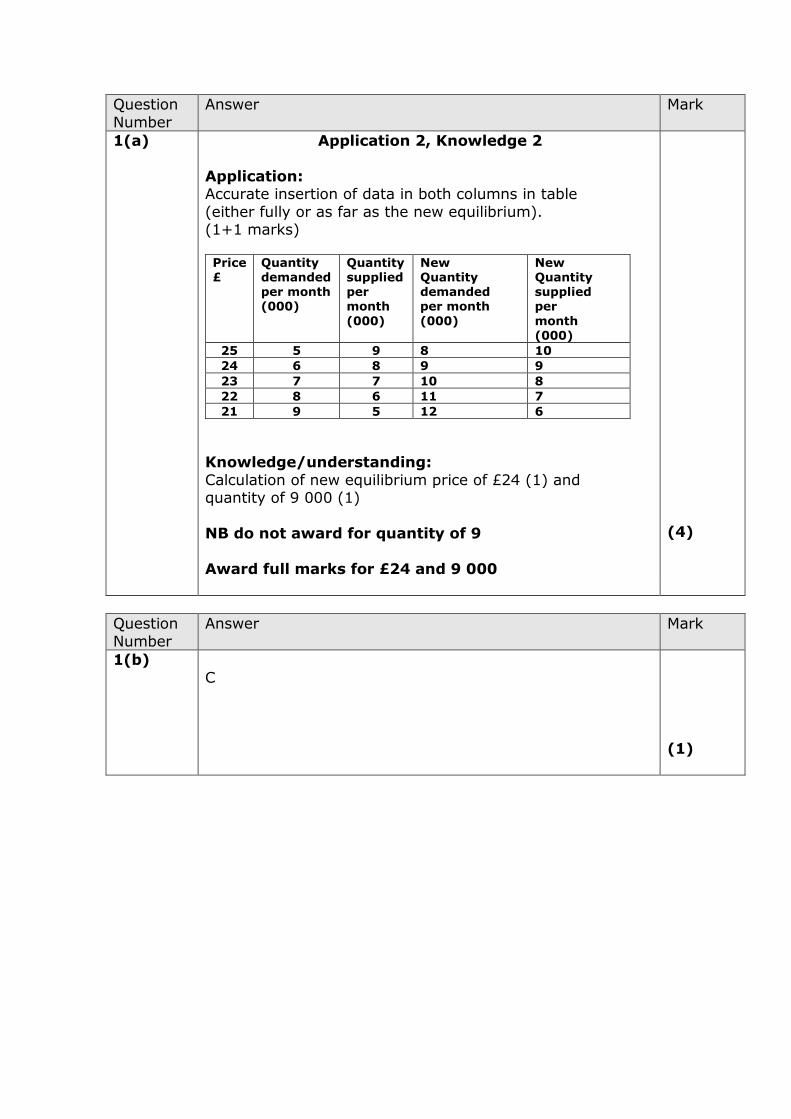
1(a) Application 2, Knowledge 2
Application: Accurate insertion of data in both columns in table
(either fully or as far as the new equilibrium). (1+1 marks) Price £
Quantity demanded per month (000)
Quantity supplied per month
(000)
New Quantity demanded per month
(000)
New Quantity supplied per
month (000)
25 5 9 8 10
24 6 8 9 9
23 7 7 10 8
22 8 6 11 7
21 9 5 12 6
Knowledge/understanding:
Calculation of new equilibrium price of £24 (1) and quantity of 9 000 (1)
NB do not award for quantity of 9
Award full marks for £24 and 9 000
(4)
Question
Number
Answer Mark
1(b)
C
(1)
Question
Number
Answer Mark
2(a) Application 2
Application: 1 mark for applying the formula and 1
mark for the correct answer -21.65% ÷ 17.78% (1) = -1.2 (1)
Correct calculations of both percentages
accept (-) 0.217 and (-) 0.178 = 1 mark NB if the answer given is -1.2 or 1.2, award 2
marks
(2)
Question Number
Answer Mark
2(b) Knowledge 1, Analysis 1
Knowledge/understanding:
1 mark for original and new sales revenue Original sales revenue: £7.20 × 97 million = £698.4
million
New sales revenue: £8.48 × 76 million = £644.5 million
Analysis:
1 mark for the change in revenue: -£53.9 million
(accept close approximation, for example a fall of
£54 million)
NB if the answer given is -53.9m/53.9m award 2 marks (this may be stated as -7.7% or 7.7%)
NB If million is missing from the answer award up
to 1 mark
(2)
Question
Number
Answer Mark
2(c)
B
(1)
Question
Number
Answer Mark
3(a) Application 2
Application:
568 × 1.8 million (1) Accept 1022 million or 1022.4 million for 2 marks.
Accept 1,022,400,000 NB If million is missing from the answer award up
to 1 mark
(2)
Question Number
Answer Mark
3(b) Application 2
Application: 1 mark for the percentage of subsidy for consumers:
71 ÷ 568 X 100 = 12.5% (1)
1 mark for the percentage of subsidy received by
producers: 497 ÷ 568 X 100 = 87.5% (1)
Award 1 mark if the answers are transposed
NB if no correct calculations, award up to 1 mark for: correct annotation of diagram depicting consumer and
producer subsidy areas
OR the actual consumer subsidy per unit (71 rupees) and producer subsidy per unit (497 rupees)
OR consumer subsidy (127.8 million rupees) and Producer subsidy (894.6 million rupees)
(2)

Question
Number
Answer Mark
3(c)
A
(1)
Question
Number
Answer Mark
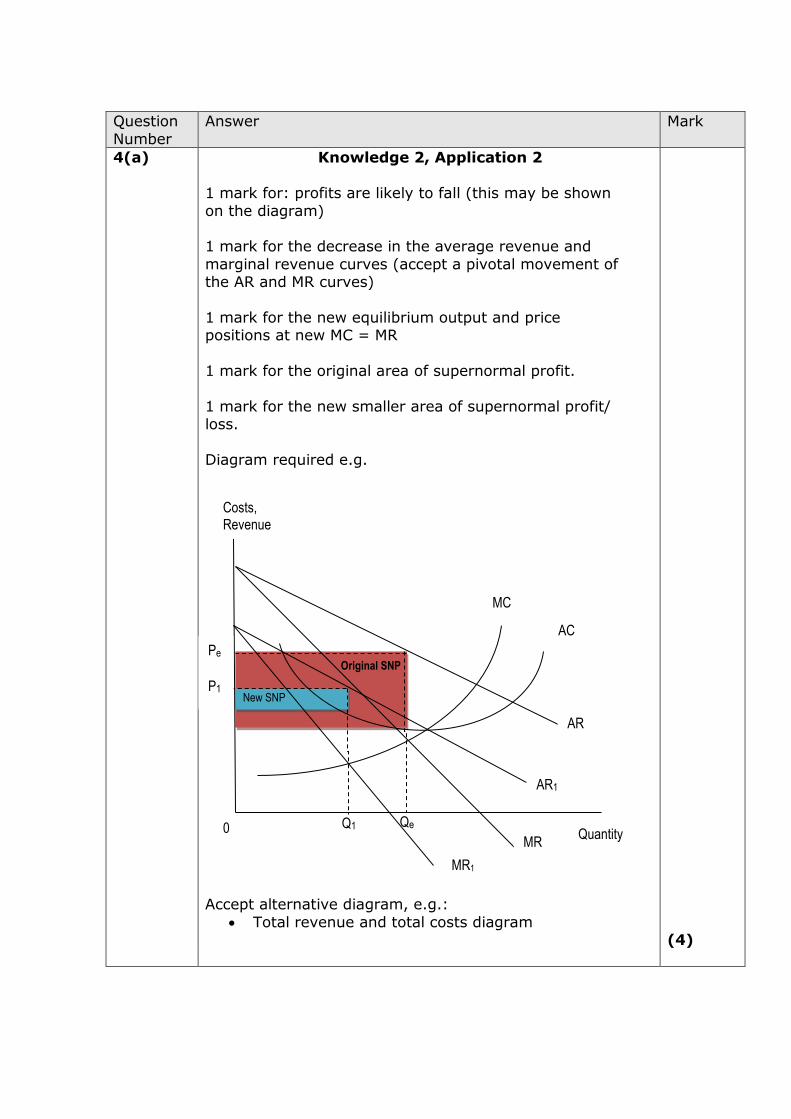
4(a) Knowledge 2, Application 2
1 mark for: profits are likely to fall (this may be shown
on the diagram) 1 mark for the decrease in the average revenue and
marginal revenue curves (accept a pivotal movement of the AR and MR curves)
1 mark for the new equilibrium output and price positions at new MC = MR
1 mark for the original area of supernormal profit.
1 mark for the new smaller area of supernormal profit/ loss.
Diagram required e.g.
Accept alternative diagram, e.g.:
Total revenue and total costs diagram
(4)
AR
AR1
MR
MR1
Costs, Revenue
Quantity 0 Qe
MC
Pe
P1
Q1
AC
New SNP
Original SNP
Question
Number
Answer Mark
4(b)
B
(1)
Question Number
Answer Mark
5(a) D
(1)
Question
Number
Answer Mark
5(b) Knowledge 1, Analysis 1
Fixed costs remain the same as output increases or decreases (1)
Variable costs vary directly with output. (1)
(2)
Question Number
Answer Mark
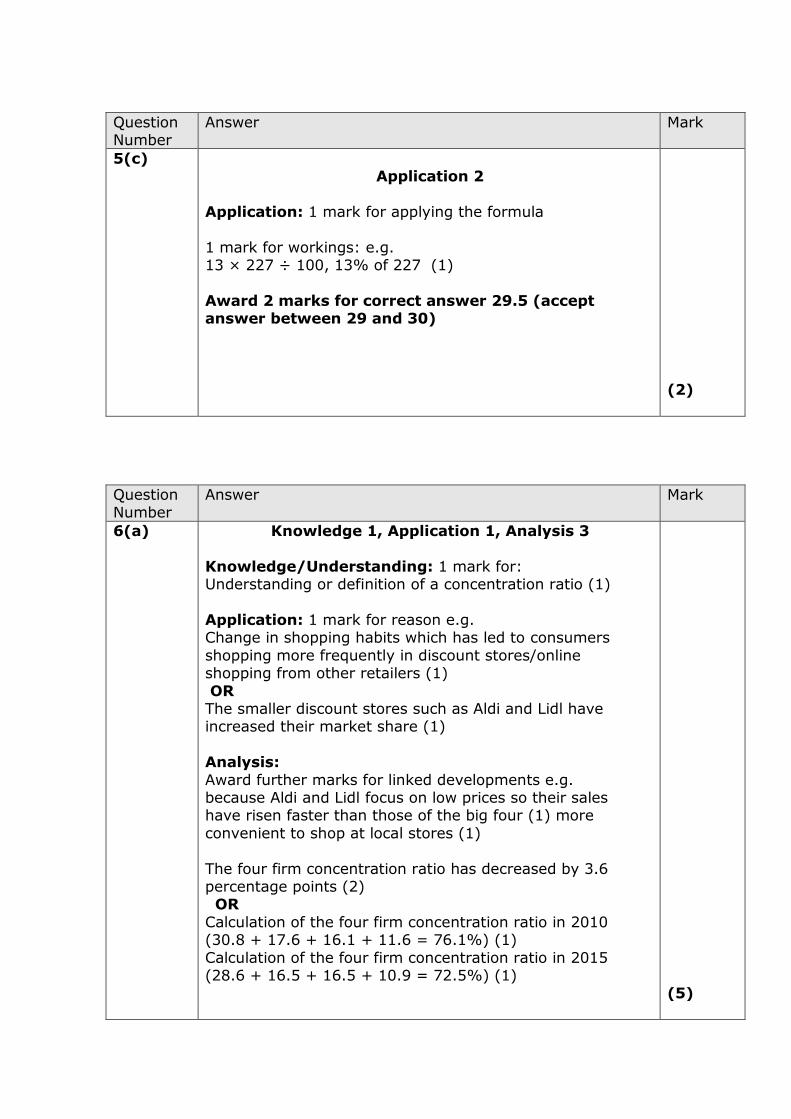
5(c) Application 2
Application: 1 mark for applying the formula
1 mark for workings: e.g. 13 × 227 ÷ 100, 13% of 227 (1)
Award 2 marks for correct answer 29.5 (accept answer between 29 and 30)
(2)
Question Number
Answer Mark
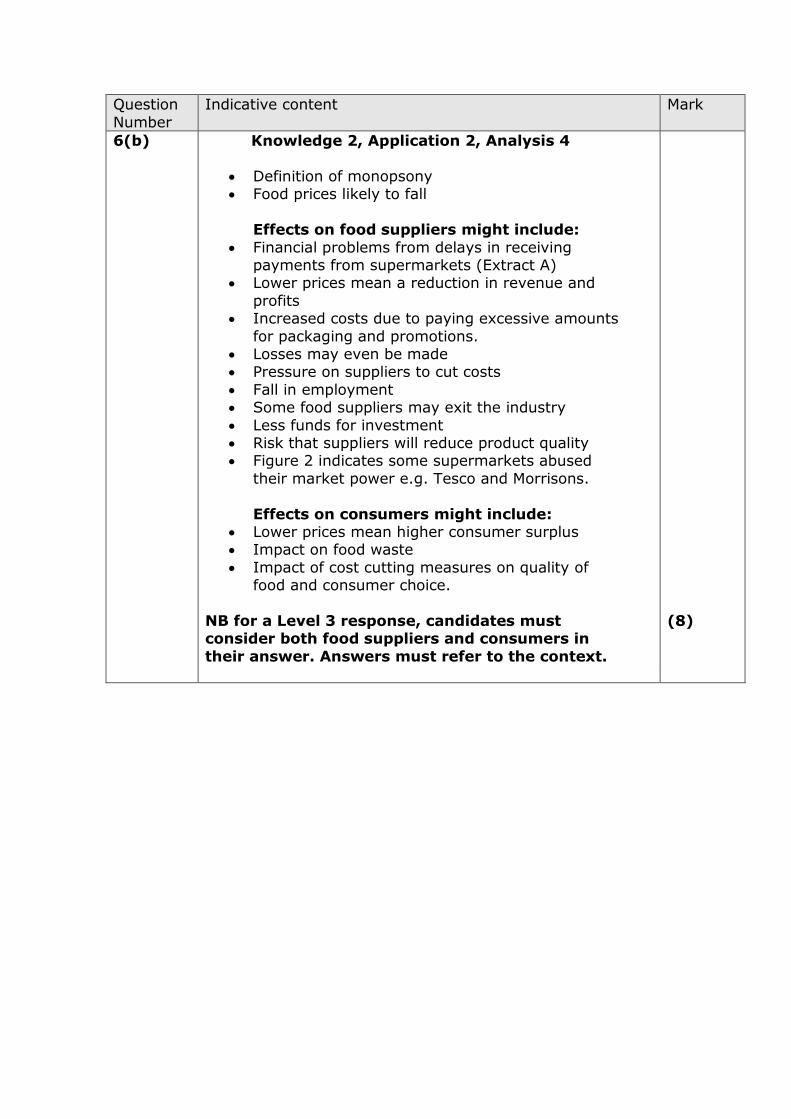
6(a) Knowledge 1, Application 1, Analysis 3
Knowledge/Understanding: 1 mark for: Understanding or definition of a concentration ratio (1)
Application: 1 mark for reason e.g. Change in shopping habits which has led to consumers
shopping more frequently in discount stores/online shopping from other retailers (1)
OR The smaller discount stores such as Aldi and Lidl have increased their market share (1)
Analysis:
Award further marks for linked developments e.g. because Aldi and Lidl focus on low prices so their sales have risen faster than those of the big four (1) more
convenient to shop at local stores (1)
The four firm concentration ratio has decreased by 3.6 percentage points (2) OR
Calculation of the four firm concentration ratio in 2010 (30.8 + 17.6 + 16.1 + 11.6 = 76.1%) (1)
Calculation of the four firm concentration ratio in 2015 (28.6 + 16.5 + 16.5 + 10.9 = 72.5%) (1)
(5)
Question
Number
Indicative content Mark
6(b) Knowledge 2, Application 2, Analysis 4
Definition of monopsony Food prices likely to fall
Effects on food suppliers might include:
Financial problems from delays in receiving payments from supermarkets (Extract A)
Lower prices mean a reduction in revenue and
profits Increased costs due to paying excessive amounts
for packaging and promotions. Losses may even be made Pressure on suppliers to cut costs
Fall in employment Some food suppliers may exit the industry
Less funds for investment Risk that suppliers will reduce product quality Figure 2 indicates some supermarkets abused
their market power e.g. Tesco and Morrisons.
Effects on consumers might include: Lower prices mean higher consumer surplus Impact on food waste
Impact of cost cutting measures on quality of food and consumer choice.
NB for a Level 3 response, candidates must consider both food suppliers and consumers in
their answer. Answers must refer to the context.
(8)

Level Mark Descriptor
0 A completely inaccurate response.
Level 1
1–2
Displays isolated or imprecise knowledge and understanding
of terms, concepts, theories and models. Use of generic or irrelevant information or examples.
Descriptive approach which has no chains of reasoning or links between causes and consequences.
Level 2 3–5 Displays elements of knowledge and understanding of
economic principles, concepts and theories. Applies economic ideas and relates them to economic problems in context, although does not focus on the broad
elements of the question. A narrow response; chains of reasoning are developed but
the answer may lack balance.
Level 3 6–8 Demonstrates accurate knowledge and understanding of the
concepts, principles and models. Ability to link knowledge and understanding in context using relevant and focused examples which are fully integrated.
Economic ideas are carefully selected and applied appropriately to economic issues and problems. The answer
demonstrates logical and coherent chains of reasoning.
Question
Number
Answer Mark
6(b)
continued
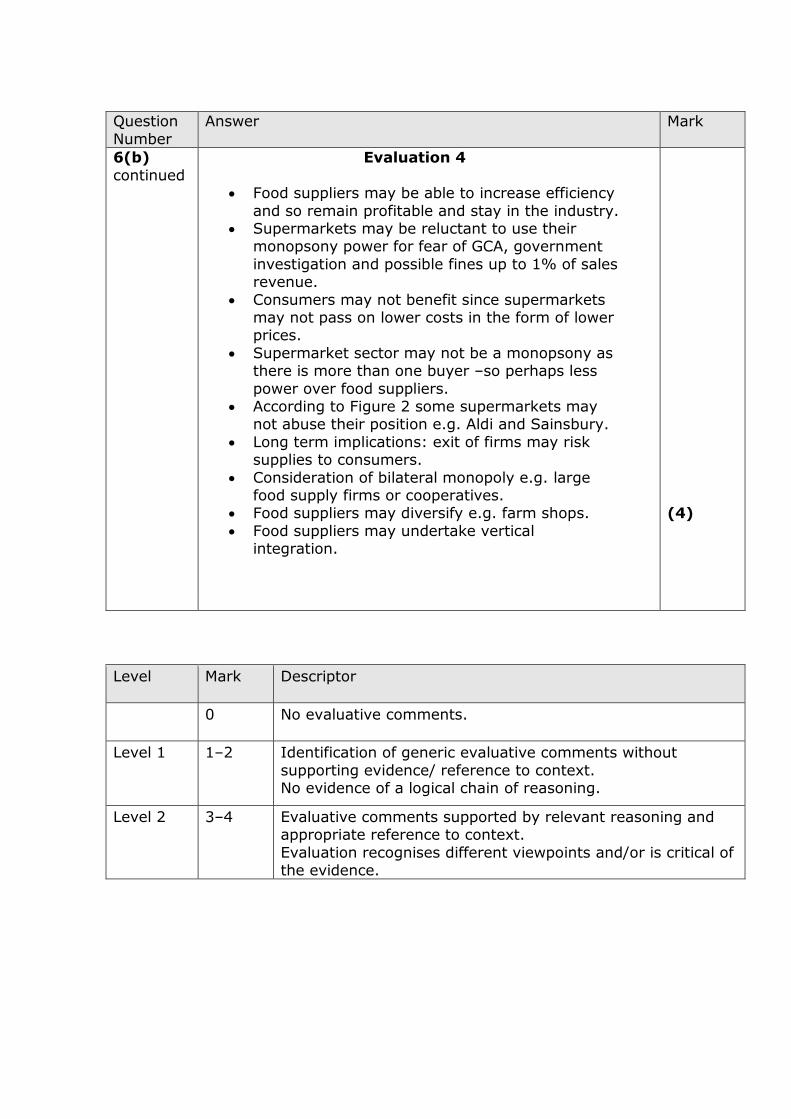
Evaluation 4
Food suppliers may be able to increase efficiency
and so remain profitable and stay in the industry. Supermarkets may be reluctant to use their
monopsony power for fear of GCA, government
investigation and possible fines up to 1% of sales revenue.
Consumers may not benefit since supermarkets may not pass on lower costs in the form of lower prices.
Supermarket sector may not be a monopsony as there is more than one buyer –so perhaps less
power over food suppliers. According to Figure 2 some supermarkets may
not abuse their position e.g. Aldi and Sainsbury.
Long term implications: exit of firms may risk supplies to consumers.
Consideration of bilateral monopoly e.g. large food supply firms or cooperatives.
Food suppliers may diversify e.g. farm shops.
Food suppliers may undertake vertical integration.
(4)
Level Mark Descriptor
0 No evaluative comments.
Level 1
1–2
Identification of generic evaluative comments without
supporting evidence/ reference to context. No evidence of a logical chain of reasoning.
Level 2 3–4 Evaluative comments supported by relevant reasoning and appropriate reference to context.
Evaluation recognises different viewpoints and/or is critical of the evidence.
Question
Number
Answer Mark
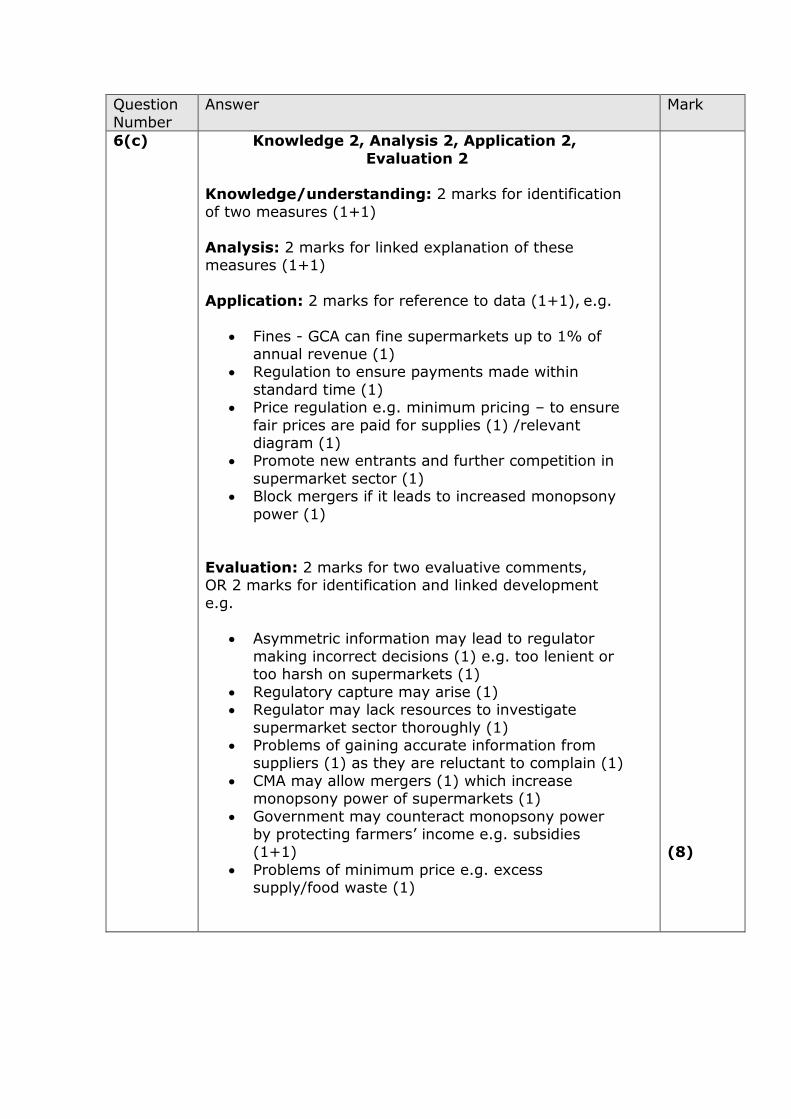
6(c) Knowledge 2, Analysis 2, Application 2,
Evaluation 2
Knowledge/understanding: 2 marks for identification
of two measures (1+1)
Analysis: 2 marks for linked explanation of these measures (1+1)
Application: 2 marks for reference to data (1+1), e.g.
Fines - GCA can fine supermarkets up to 1% of annual revenue (1)
Regulation to ensure payments made within
standard time (1) Price regulation e.g. minimum pricing – to ensure
fair prices are paid for supplies (1) /relevant diagram (1)
Promote new entrants and further competition in
supermarket sector (1) Block mergers if it leads to increased monopsony
power (1)
Evaluation: 2 marks for two evaluative comments, OR 2 marks for identification and linked development
e.g.
Asymmetric information may lead to regulator
making incorrect decisions (1) e.g. too lenient or too harsh on supermarkets (1)
Regulatory capture may arise (1) Regulator may lack resources to investigate
supermarket sector thoroughly (1) Problems of gaining accurate information from
suppliers (1) as they are reluctant to complain (1)
CMA may allow mergers (1) which increase monopsony power of supermarkets (1)
Government may counteract monopsony power by protecting farmers’ income e.g. subsidies (1+1)
Problems of minimum price e.g. excess supply/food waste (1)
(8)

Question Number
Indicative content Mark
6(d) Knowledge 2, Application 2, Analysis 2
Identification of information gaps as a cause of market failure
Information gaps as main cause of food waste e.g.
Food suppliers lack market information: e.g. predicting size of harvests – dependent on climate/ pest control and disease/ time lags in
growing crops and raising livestock. Supermarkets lack market information: e.g.
predicting household demand – depends on tastes and fashion which may change/ population and migration changes/ impact of competitors.
Consumers lack market information: e.g. uncertainty over how to store food or whether
food is fit for consumption after sell-by dates. Irrational behaviour as main cause of food
waste e.g. Computation issues e.g. consumers perceived
demand may exceed actual demand for food / difficulty in comparing the different size of food products to fit with the actual amount of food
required. Habitual behaviour e.g. consumers may have a
tendency to purchase more food than required/ better to have too much than too little food.
Influence of other people’s behaviour e.g.
consumers may purchase food that they might not want.
Impulse buying e.g. due to advertising or use of special offers.
NB These points could count as Evaluation and the Evaluation points as KAA.
NB A Level 3 response would typically consider
both ‘information gaps’ and ‘irrational behaviour’. NB There may be overlap between information
gaps and irrational behaviour as possible causes of food waste.
(6)
Level Mark Descriptor
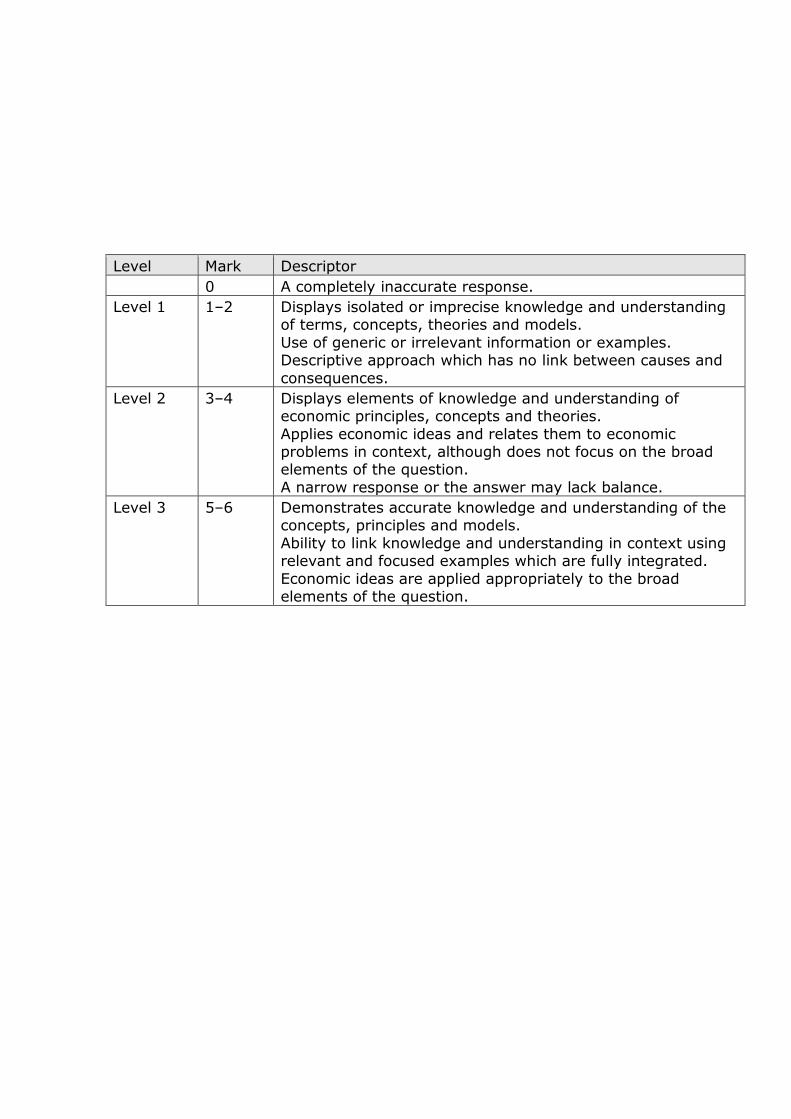
0 A completely inaccurate response.
Level 1
1–2
Displays isolated or imprecise knowledge and understanding of terms, concepts, theories and models.
Use of generic or irrelevant information or examples. Descriptive approach which has no link between causes and
consequences.
Level 2 3–4 Displays elements of knowledge and understanding of economic principles, concepts and theories.
Applies economic ideas and relates them to economic problems in context, although does not focus on the broad elements of the question.
A narrow response or the answer may lack balance.
Level 3 5–6 Demonstrates accurate knowledge and understanding of the concepts, principles and models.
Ability to link knowledge and understanding in context using relevant and focused examples which are fully integrated.
Economic ideas are applied appropriately to the broad elements of the question.
Question Number
Indicative content Mark
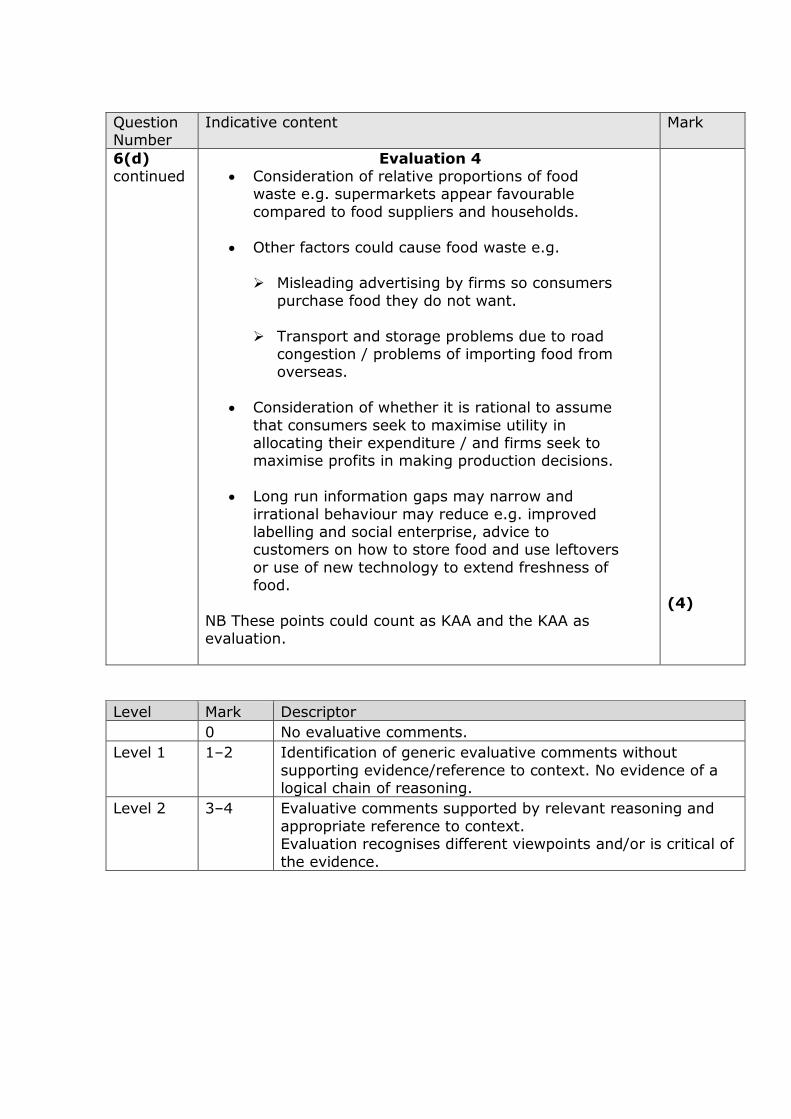
6(d) continued
Evaluation 4 Consideration of relative proportions of food
waste e.g. supermarkets appear favourable
compared to food suppliers and households.
Other factors could cause food waste e.g. Misleading advertising by firms so consumers
purchase food they do not want.
Transport and storage problems due to road congestion / problems of importing food from overseas.
Consideration of whether it is rational to assume
that consumers seek to maximise utility in allocating their expenditure / and firms seek to maximise profits in making production decisions.
Long run information gaps may narrow and
irrational behaviour may reduce e.g. improved labelling and social enterprise, advice to customers on how to store food and use leftovers
or use of new technology to extend freshness of food.
NB These points could count as KAA and the KAA as evaluation.
(4)
Level Mark Descriptor
0 No evaluative comments.
Level 1 1–2 Identification of generic evaluative comments without
supporting evidence/reference to context. No evidence of a logical chain of reasoning.
Level 2 3–4 Evaluative comments supported by relevant reasoning and
appropriate reference to context. Evaluation recognises different viewpoints and/or is critical of
the evidence.
Question
Number
Answer Mark
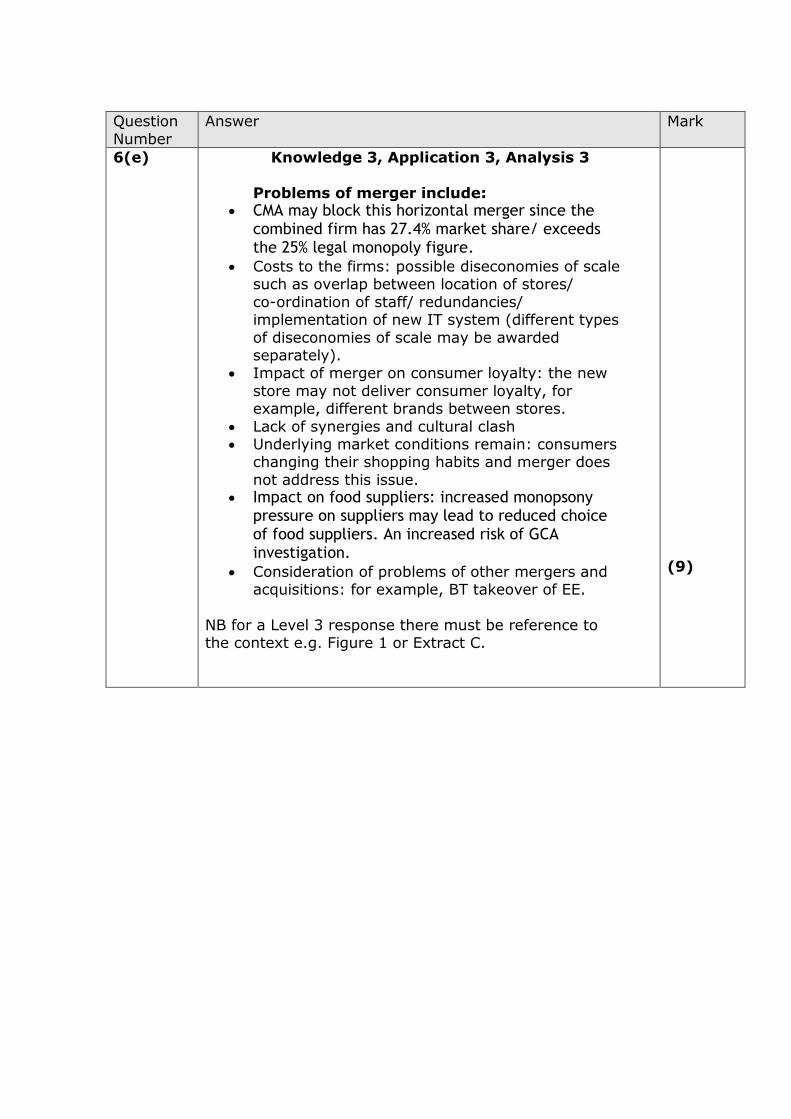
6(e) Knowledge 3, Application 3, Analysis 3
Problems of merger include:
CMA may block this horizontal merger since the combined firm has 27.4% market share/ exceeds the 25% legal monopoly figure.
Costs to the firms: possible diseconomies of scale such as overlap between location of stores/
co-ordination of staff/ redundancies/ implementation of new IT system (different types
of diseconomies of scale may be awarded separately).
Impact of merger on consumer loyalty: the new
store may not deliver consumer loyalty, for example, different brands between stores.
Lack of synergies and cultural clash Underlying market conditions remain: consumers
changing their shopping habits and merger does
not address this issue. Impact on food suppliers: increased monopsony
pressure on suppliers may lead to reduced choice of food suppliers. An increased risk of GCA investigation.
Consideration of problems of other mergers and acquisitions: for example, BT takeover of EE.
NB for a Level 3 response there must be reference to the context e.g. Figure 1 or Extract C.
(9)
Level Mark Descriptor
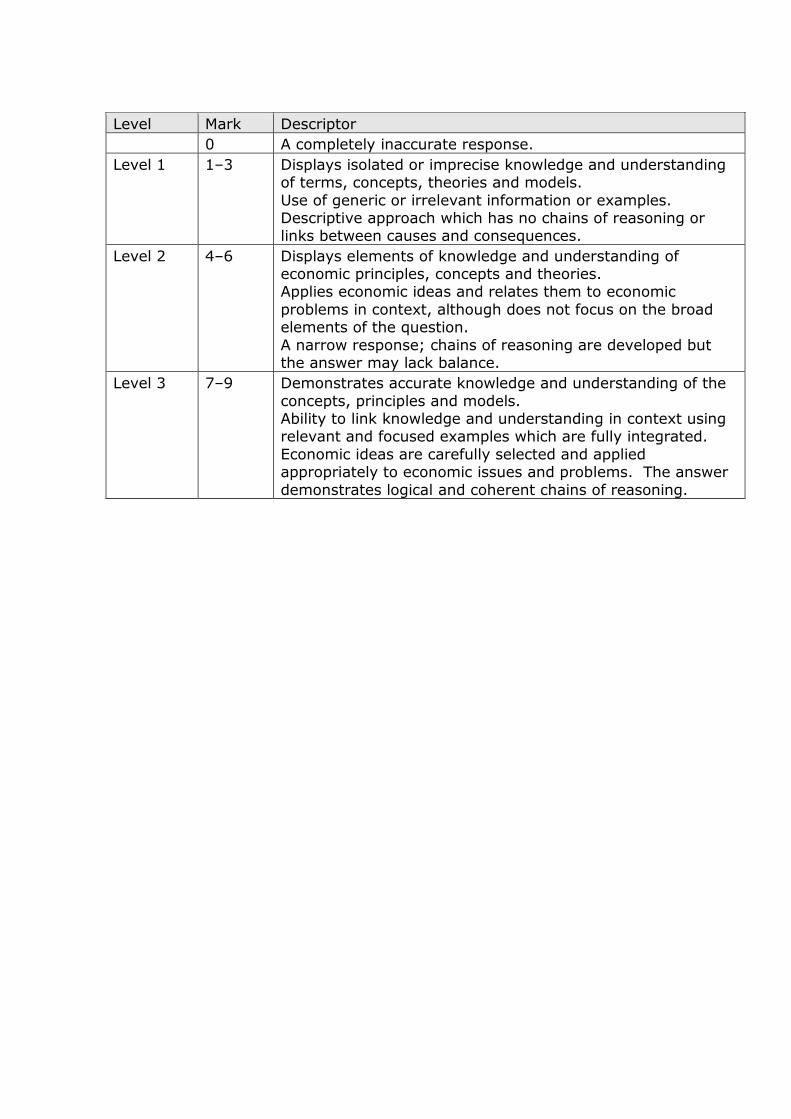
0 A completely inaccurate response.
Level 1
1–3
Displays isolated or imprecise knowledge and understanding of terms, concepts, theories and models.
Use of generic or irrelevant information or examples. Descriptive approach which has no chains of reasoning or links between causes and consequences.
Level 2 4–6 Displays elements of knowledge and understanding of economic principles, concepts and theories. Applies economic ideas and relates them to economic
problems in context, although does not focus on the broad elements of the question.
A narrow response; chains of reasoning are developed but the answer may lack balance.
Level 3 7–9 Demonstrates accurate knowledge and understanding of the
concepts, principles and models. Ability to link knowledge and understanding in context using relevant and focused examples which are fully integrated.
Economic ideas are carefully selected and applied appropriately to economic issues and problems. The answer
demonstrates logical and coherent chains of reasoning.
Question
Number
Indicative content Mark
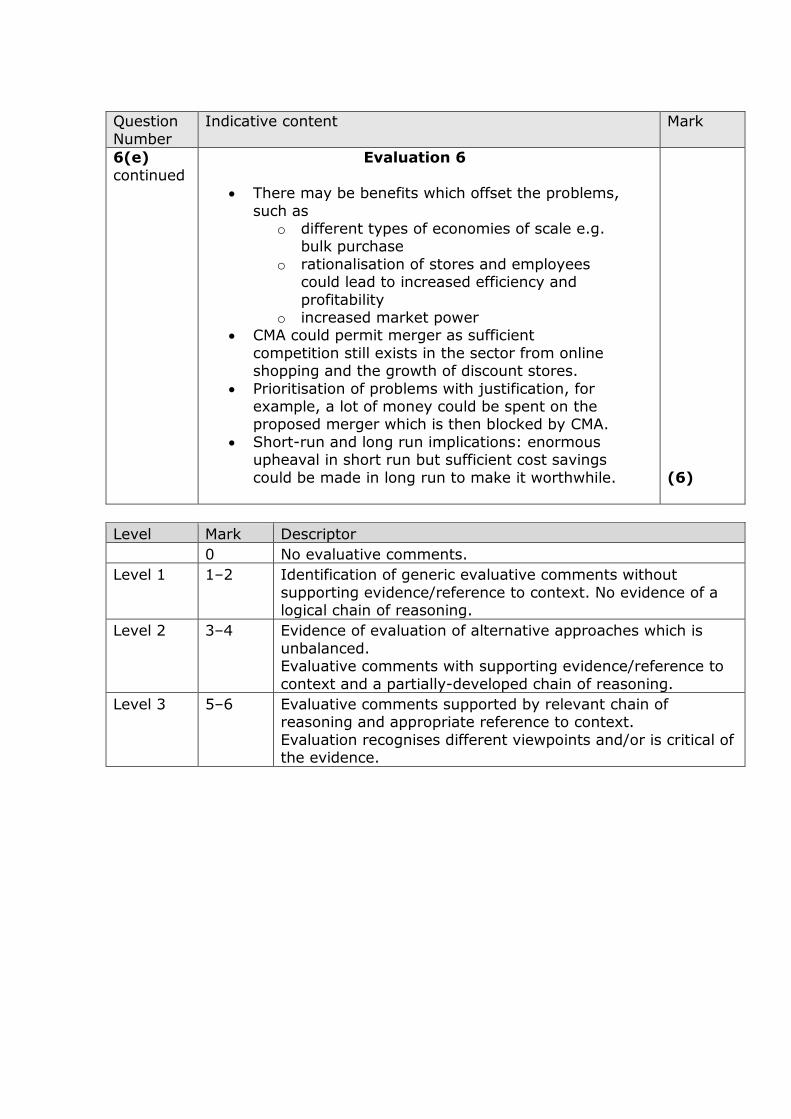
6(e)
continued
Evaluation 6
There may be benefits which offset the problems,
such as o different types of economies of scale e.g.
bulk purchase
o rationalisation of stores and employees could lead to increased efficiency and
profitability o increased market power
CMA could permit merger as sufficient
competition still exists in the sector from online shopping and the growth of discount stores.
Prioritisation of problems with justification, for example, a lot of money could be spent on the proposed merger which is then blocked by CMA.
Short-run and long run implications: enormous upheaval in short run but sufficient cost savings
could be made in long run to make it worthwhile.
(6)
Level Mark Descriptor
0 No evaluative comments.
Level 1 1–2 Identification of generic evaluative comments without
supporting evidence/reference to context. No evidence of a logical chain of reasoning.
Level 2 3–4 Evidence of evaluation of alternative approaches which is
unbalanced. Evaluative comments with supporting evidence/reference to
context and a partially-developed chain of reasoning.
Level 3 5–6 Evaluative comments supported by relevant chain of reasoning and appropriate reference to context.
Evaluation recognises different viewpoints and/or is critical of the evidence.
Question
Number
Indicative content Mark
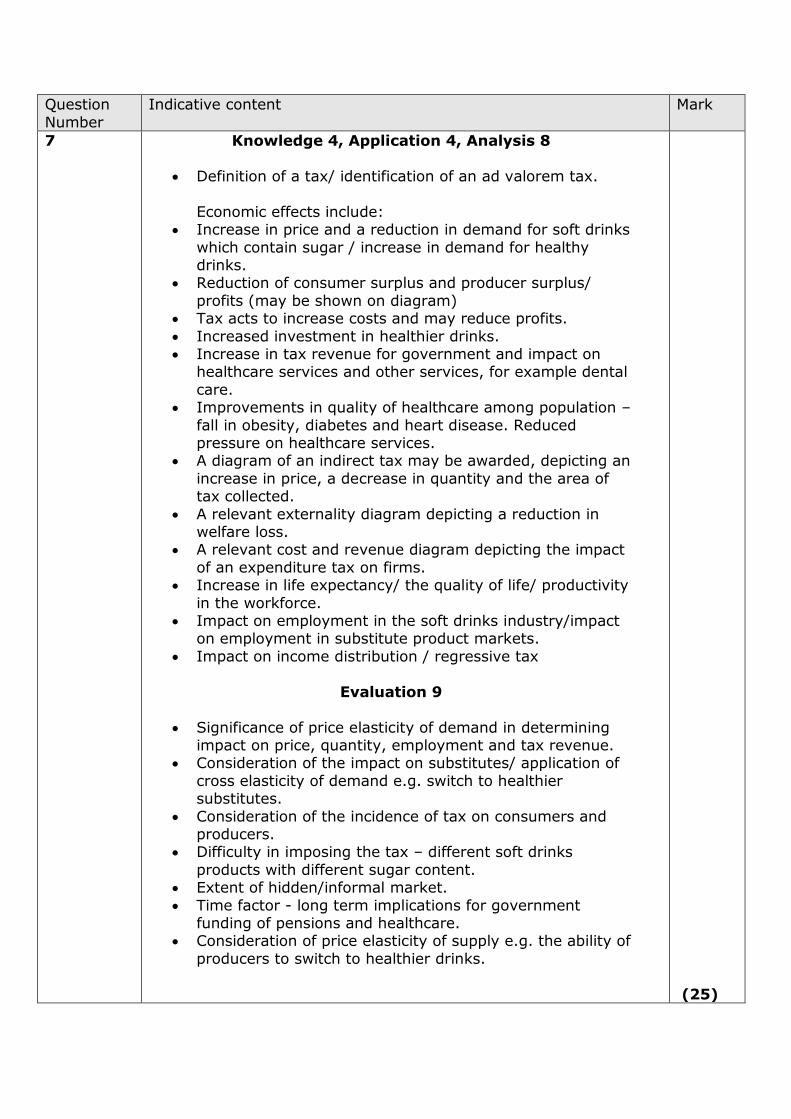
7 Knowledge 4, Application 4, Analysis 8
Definition of a tax/ identification of an ad valorem tax.
Economic effects include: Increase in price and a reduction in demand for soft drinks
which contain sugar / increase in demand for healthy drinks.
Reduction of consumer surplus and producer surplus/
profits (may be shown on diagram) Tax acts to increase costs and may reduce profits.
Increased investment in healthier drinks. Increase in tax revenue for government and impact on
healthcare services and other services, for example dental
care. Improvements in quality of healthcare among population –
fall in obesity, diabetes and heart disease. Reduced pressure on healthcare services.
A diagram of an indirect tax may be awarded, depicting an
increase in price, a decrease in quantity and the area of tax collected.
A relevant externality diagram depicting a reduction in welfare loss.
A relevant cost and revenue diagram depicting the impact
of an expenditure tax on firms. Increase in life expectancy/ the quality of life/ productivity
in the workforce. Impact on employment in the soft drinks industry/impact
on employment in substitute product markets.
Impact on income distribution / regressive tax
Evaluation 9
Significance of price elasticity of demand in determining impact on price, quantity, employment and tax revenue.
Consideration of the impact on substitutes/ application of
cross elasticity of demand e.g. switch to healthier substitutes.
Consideration of the incidence of tax on consumers and producers.
Difficulty in imposing the tax – different soft drinks
products with different sugar content. Extent of hidden/informal market.
Time factor - long term implications for government funding of pensions and healthcare.
Consideration of price elasticity of supply e.g. the ability of
producers to switch to healthier drinks.
(25)
Knowledge, application and analysis
Level Mark Descriptor
0 A completely inaccurate response.
Level 1
1–4
Displays isolated or imprecise knowledge and understanding of terms, concepts, theories and models. Use of generic or irrelevant information or examples.
Descriptive approach which has no chains of reasoning or links between causes and consequences.
Level 2 5–8 Displays elements of knowledge and understanding of
economic principles, concepts and theories. Applies economic ideas and relates them to economic
problems in context, although does not focus on the broad elements of the question. A narrow response or superficial, two stage chains of
reasoning only.
Level 3 9–12 Demonstrates accurate knowledge and understanding of the concepts, principles and models.
Ability to apply economic concepts and relate them directly to the broad elements of the question with evidence integrated
into the answer. Analysis is clear and coherent, although it may lack balance.
Chains of reasoning are developed but the answer may lack balance.
Level 4 13–16 Demonstrates precise knowledge and understanding of the
concepts, principles and models. Ability to link knowledge and understanding in context using appropriate examples. Analysis is relevant and focused with
evidence fully and reliably integrated. Economic ideas are carefully selected and applied
appropriately to economic issues and problems. The answer demonstrates logical and coherent chains of reasoning.
Evaluation
Level Mark Descriptor
0 No evaluative comments.
Level 1 1–3 Identification of generic evaluative comments without supporting evidence/reference to context. No evidence of a logical chain of reasoning.
Level 2 4–6 Evidence of evaluation of alternative approaches which is unbalanced leading to unsubstantiated judgements. Evaluative comments with supporting evidence/reference to
context and a partially-developed chain of reasoning.
Level 3 7–9 Evaluative comments supported by relevant reasoning and appropriate reference to context.
Evaluation recognises different viewpoints and is critical of the evidence provided and/or the assumptions underlying the
analysis enabling informed judgements to be made.
Question
Number
Indicative content Mark
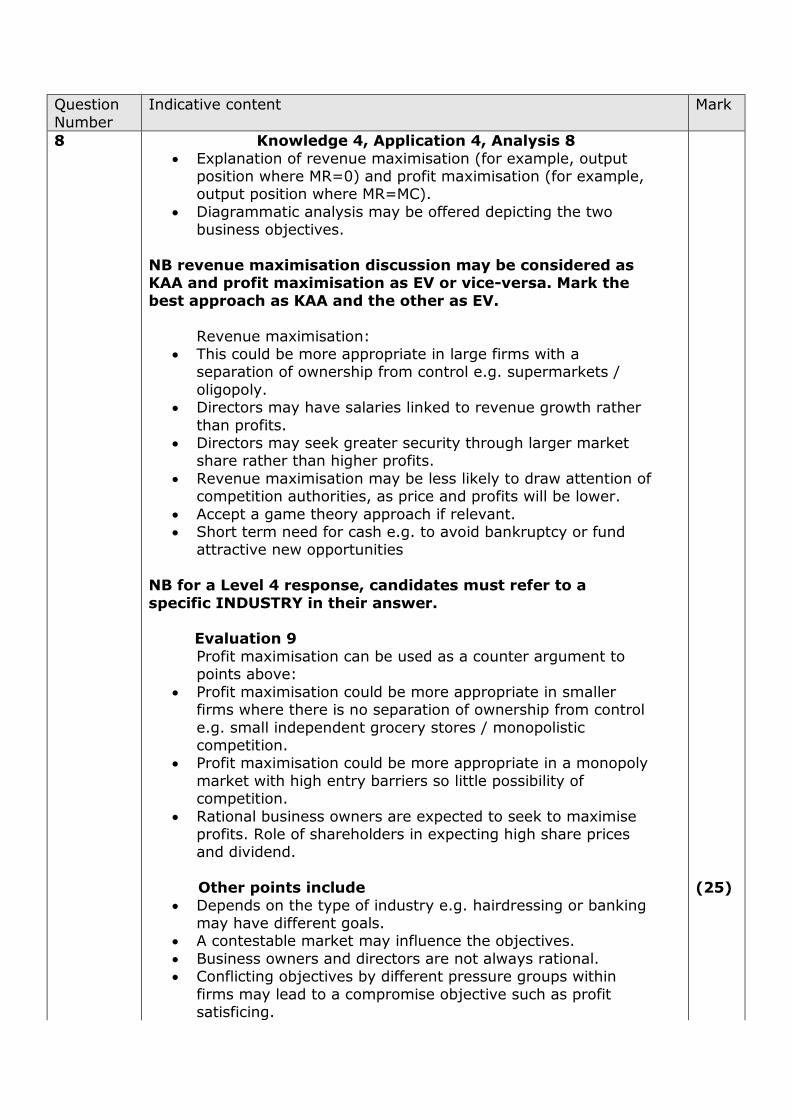
8 Knowledge 4, Application 4, Analysis 8
Explanation of revenue maximisation (for example, output position where MR=0) and profit maximisation (for example, output position where MR=MC).
Diagrammatic analysis may be offered depicting the two business objectives.
NB revenue maximisation discussion may be considered as KAA and profit maximisation as EV or vice-versa. Mark the
best approach as KAA and the other as EV.
Revenue maximisation: This could be more appropriate in large firms with a
separation of ownership from control e.g. supermarkets /
oligopoly. Directors may have salaries linked to revenue growth rather
than profits. Directors may seek greater security through larger market
share rather than higher profits.
Revenue maximisation may be less likely to draw attention of competition authorities, as price and profits will be lower.
Accept a game theory approach if relevant. Short term need for cash e.g. to avoid bankruptcy or fund
attractive new opportunities
NB for a Level 4 response, candidates must refer to a
specific INDUSTRY in their answer.
Evaluation 9
Profit maximisation can be used as a counter argument to points above:
Profit maximisation could be more appropriate in smaller firms where there is no separation of ownership from control
e.g. small independent grocery stores / monopolistic competition.
Profit maximisation could be more appropriate in a monopoly
market with high entry barriers so little possibility of competition.
Rational business owners are expected to seek to maximise profits. Role of shareholders in expecting high share prices and dividend.
Other points include
Depends on the type of industry e.g. hairdressing or banking may have different goals.
A contestable market may influence the objectives.
Business owners and directors are not always rational. Conflicting objectives by different pressure groups within
firms may lead to a compromise objective such as profit satisficing.
(25)
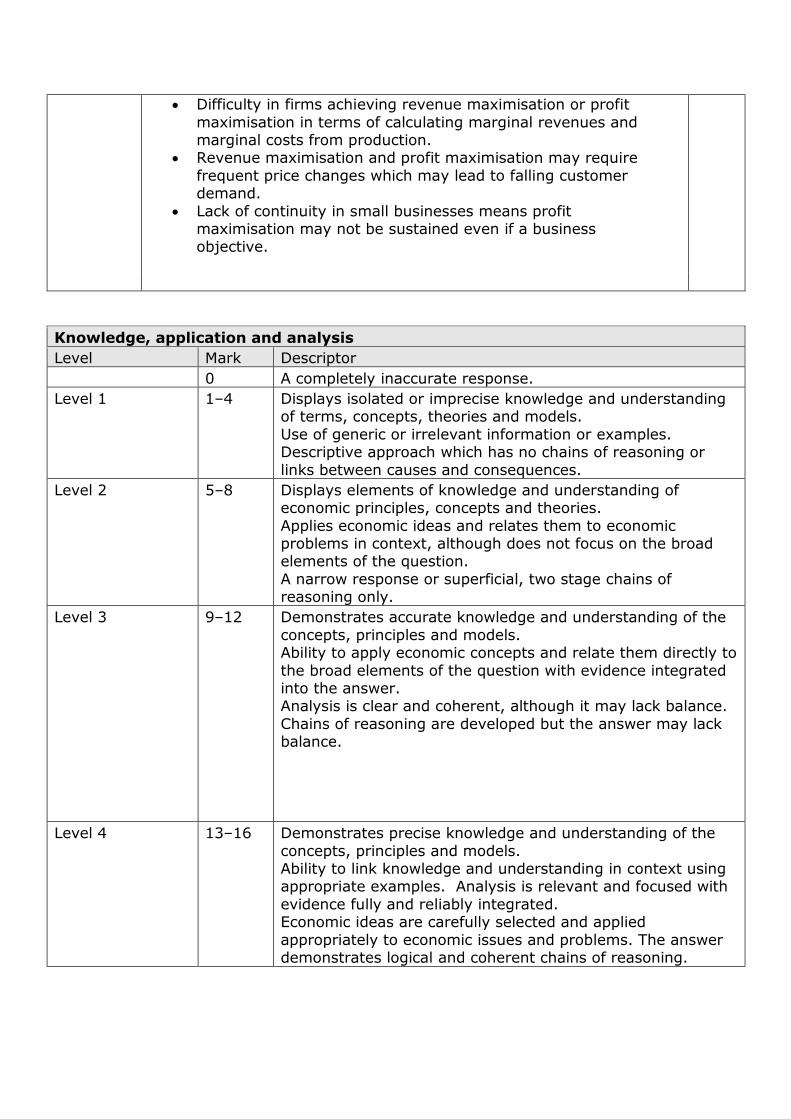
Difficulty in firms achieving revenue maximisation or profit
maximisation in terms of calculating marginal revenues and marginal costs from production.
Revenue maximisation and profit maximisation may require
frequent price changes which may lead to falling customer demand.
Lack of continuity in small businesses means profit maximisation may not be sustained even if a business objective.
Knowledge, application and analysis
Level Mark Descriptor
0 A completely inaccurate response.
Level 1
1–4
Displays isolated or imprecise knowledge and understanding of terms, concepts, theories and models.
Use of generic or irrelevant information or examples. Descriptive approach which has no chains of reasoning or
links between causes and consequences.
Level 2 5–8 Displays elements of knowledge and understanding of economic principles, concepts and theories.
Applies economic ideas and relates them to economic problems in context, although does not focus on the broad elements of the question.
A narrow response or superficial, two stage chains of reasoning only.
Level 3 9–12 Demonstrates accurate knowledge and understanding of the
concepts, principles and models. Ability to apply economic concepts and relate them directly to
the broad elements of the question with evidence integrated into the answer. Analysis is clear and coherent, although it may lack balance.
Chains of reasoning are developed but the answer may lack balance.
Level 4 13–16 Demonstrates precise knowledge and understanding of the
concepts, principles and models. Ability to link knowledge and understanding in context using appropriate examples. Analysis is relevant and focused with
evidence fully and reliably integrated. Economic ideas are carefully selected and applied
appropriately to economic issues and problems. The answer demonstrates logical and coherent chains of reasoning.
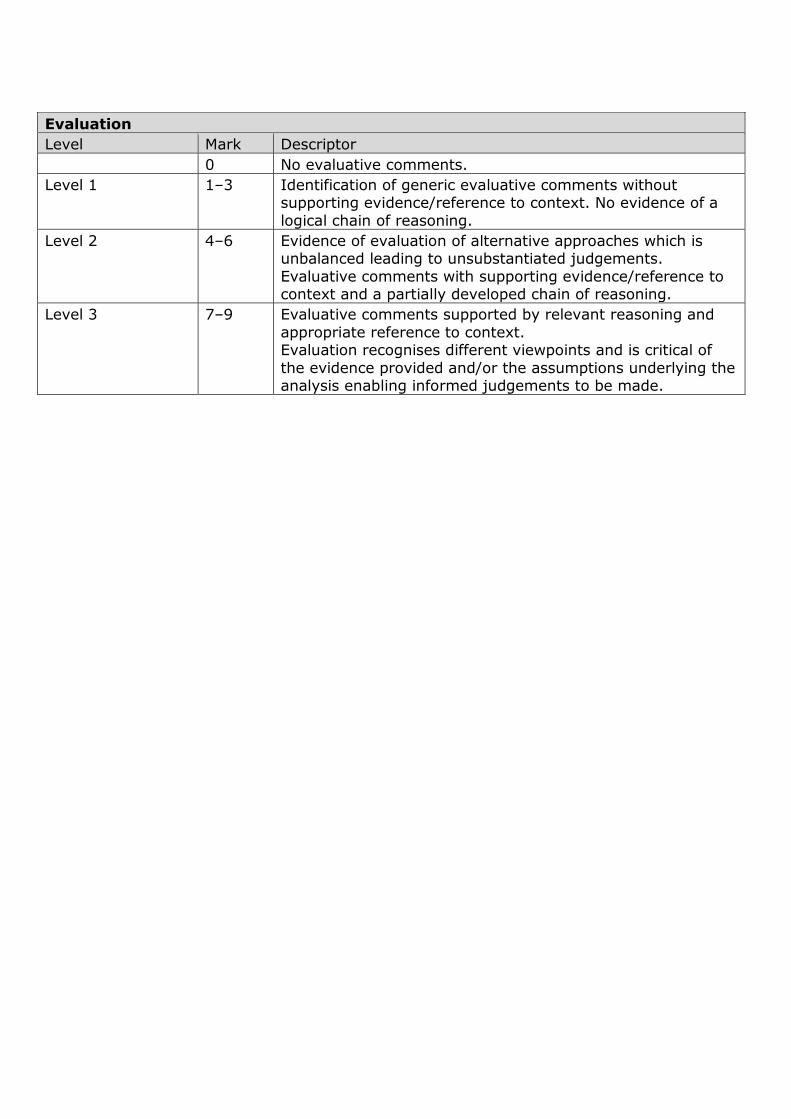
Evaluation
Level Mark Descriptor
0 No evaluative comments.
Level 1 1–3 Identification of generic evaluative comments without supporting evidence/reference to context. No evidence of a
logical chain of reasoning.
Level 2 4–6 Evidence of evaluation of alternative approaches which is unbalanced leading to unsubstantiated judgements.
Evaluative comments with supporting evidence/reference to context and a partially developed chain of reasoning.
Level 3 7–9 Evaluative comments supported by relevant reasoning and
appropriate reference to context. Evaluation recognises different viewpoints and is critical of
the evidence provided and/or the assumptions underlying the analysis enabling informed judgements to be made.

Pearson Education Limited. Registered company number 872828 with its registered office at 80 Strand, London WC2R 0RL, United Kingdom