MARK MORTON MEMORIAL FUND - Erikson Institute...2 Opinion In our opinion, the financial statements...
26
Erikson Institute Financial Report June 30, 2016
Transcript of MARK MORTON MEMORIAL FUND - Erikson Institute...2 Opinion In our opinion, the financial statements...
Erikson Institute Financial Report June 30, 2016

Contents Independent auditor’s report 1-2 Financial statements Statements of financial position 3 Statements of activities 4-5 Statements of functional expenses 6-7 Statements of cash flows 8 Notes to financial statements 9-24

1
Independent Auditor's Report To the Board of Trustees Erikson Institute Report on the Financial Statement We have audited the accompanying financial statements of Erikson Institute which comprise the statements of financial position as of June 30, 2016 and 2015, and the related statements of activities, functional expenses, and cash flows for the years then ended, and the related notes to the financial statements. Management’s Responsibility for the Financial Statements Management is responsible for the preparation and fair presentation of these financial statements in accordance with accounting principles generally accepted in the United States of America; this includes the design, implementation, and maintenance of internal control relevant to the preparation and fair presentation of financial statements that are free from material misstatement, whether due to fraud or error. Auditor’s Responsibility Our responsibility is to express an opinion on these financial statements based on our audits. We conducted our audits in accordance with auditing standards generally accepted in the United States of America. Those standards require that we plan and perform the audits to obtain reasonable assurance about whether the financial statements are free from material misstatement. An audit involves performing procedures to obtain audit evidence about the amounts and disclosures in the financial statements. The procedures selected depend on the auditor’s judgment, including the assessment of the risks of material misstatement of the financial statements, whether due to fraud or error. In making those risk assessments, the auditor considers internal control relevant to the entity’s preparation and fair presentation of the financial statements in order to design audit procedures that are appropriate in the circumstances, but not for the purpose of expressing an opinion on the effectiveness of the entity’s internal control. Accordingly, we express no such opinion. An audit also includes evaluating the appropriateness of accounting policies used and the reasonableness of significant accounting estimates made by management, as well as evaluating the overall presentation of the financial statements. We believe that the audit evidence we have obtained is sufficient and appropriate to provide a basis for our audit opinion.

2
Opinion In our opinion, the financial statements referred to above present fairly, in all material respects, the financial position of Erikson Institute as of June 30, 2016 and 2015, and the changes in its net assets and its cash flows for the years then ended in accordance with accounting principles generally accepted in the United States of America.
Chicago, Illinois October 12, 2016

3
Erikson Institute
Statements of Financial PositionJune 30, 2016 and 2015
2016 2015Assets
Cash 3,000,879 $ 1,124,000 $ Receivables, net:
Contributions 3,375,907 2,722,328 Grants and contracts 2,927,477 2,054,913 Other 456,230 402,763
Investments 44,843,652 49,914,067 Property and equipment, net 24,936,897 25,819,208 Investments held for deferred compensation plan 852,538 843,302 Other assets 305,622 359,566
Total assets 80,699,202 $ 83,240,147 $
Liabilities and Net Assets
Liabilities:Accounts payable and accrued liabilities 1,468,241 $ 1,607,346 $ Unearned tuition and deposits 314,437 441,933 Bonds payable 31,425,000 32,175,000 Deferred compensation plan payable 852,538 843,302 Interest rate swap agreement 7,147,848 4,625,414
Total liabilities 41,208,064 39,692,995
Net assets:Unrestricted:
Operating (accumulated deficit) (8,168,535) (6,002,564) Board designated - funds functioning as endowment 20,774,614 23,711,815 Board designated - reinvestment funds 231,000 231,000
12,837,079 17,940,251
Temporarily restricted 10,114,743 9,067,685 Permanently restricted 16,539,316 16,539,216
Total net assets 39,491,138 43,547,152
Total liabilities and net assets 80,699,202 $ 83,240,147 $
See notes to financial statements.

4
Erikson Institute
Statements of ActivitiesYears Ended June 30, 2016 and 2015
Temporarily PermanentlyUnrestricted Restricted Restricted Total
Support and revenue:Student tuition and fees, net of
scholarships of $1,179,511and $1,134,470, respectively 3,078,543 $ -$ -$ 3,078,543 $
Special events less direct expensesof $122,330 and $106,736, respectively 794,329 - - 794,329
Contributions 1,127,156 6,444,489 100 7,571,745 Government grants 7,233,000 - - 7,233,000 Clinical and training 2,951,981 - - 2,951,981 Investment income, net 1,893,174 65,853 - 1,959,027 Miscellaneous 125,223 - - 125,223 Net assets released from restrictions 3,676,298 (3,676,298) - -
Total support and revenue: 20,879,704 2,834,044 100 23,713,848
Expenses:Program services 16,841,465 - - 16,841,465 Management and general 2,968,953 - - 2,968,953 Fundraising 741,239 - - 741,239
Total expenses: 20,551,657 - - 20,551,657
Increase in net assetsbefore non-operating items 328,047 2,834,044 100 3,162,191
Non-operating items:Depreciation (896,729) - - (896,729) Investment loss, net (2,257,201) (1,786,986) - (4,044,187) Interest rate swap fair value adjustment (2,522,434) - - (2,522,434) Other 245,145 - - 245,145
Total non-operating items: (5,431,219) (1,786,986) - (7,218,205)
(Decrease) increase in net assets (5,103,172) 1,047,058 100 (4,056,014)
Net assets:Beginning of year 17,940,251 9,067,685 16,539,216 43,547,152
End of year 12,837,079 $ 10,114,743 $ 16,539,316 $ 39,491,138 $
See notes to financial statements.
2016
5
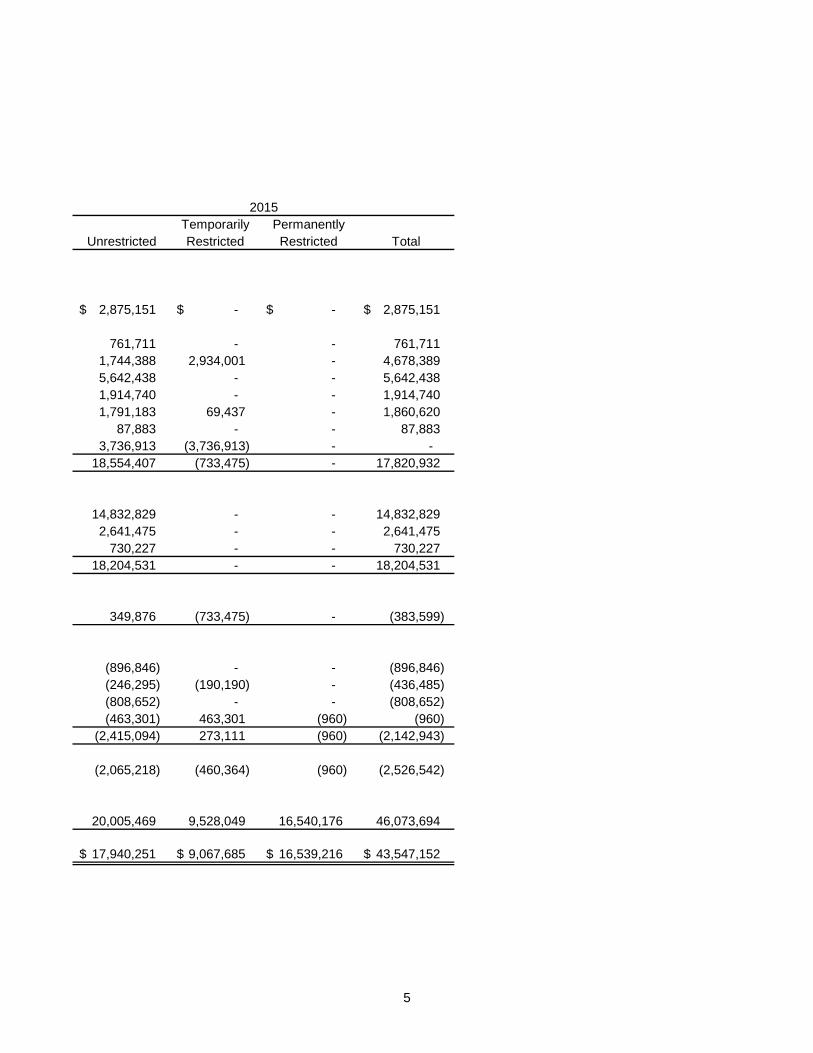
Temporarily PermanentlyUnrestricted Restricted Restricted Total
2,875,151 $ -$ -$ 2,875,151 $
761,711 - - 761,711 1,744,388 2,934,001 - 4,678,389 5,642,438 - - 5,642,438 1,914,740 - - 1,914,740 1,791,183 69,437 - 1,860,620
87,883 - - 87,883 3,736,913 (3,736,913) - -
18,554,407 (733,475) - 17,820,932
14,832,829 - - 14,832,829 2,641,475 - - 2,641,475
730,227 - - 730,227 18,204,531 - - 18,204,531
349,876 (733,475) - (383,599)
(896,846) - - (896,846) (246,295) (190,190) - (436,485) (808,652) - - (808,652) (463,301) 463,301 (960) (960)
(2,415,094) 273,111 (960) (2,142,943)
(2,065,218) (460,364) (960) (2,526,542)
20,005,469 9,528,049 16,540,176 46,073,694
17,940,251 $ 9,067,685 $ 16,539,216 $ 43,547,152 $
2015
6
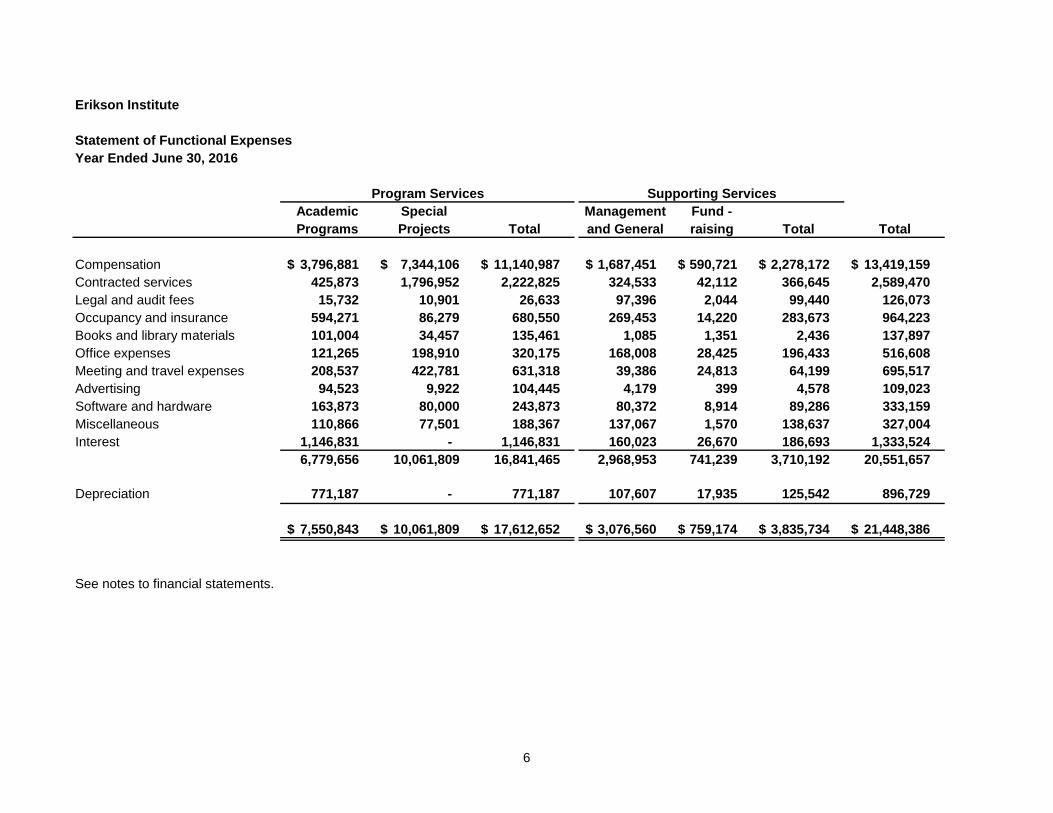
Erikson Institute
Statement of Functional ExpensesYear Ended June 30, 2016
Academic Special Management Fund -Programs Projects Total and General raising Total Total
Compensation 3,796,881 $ 7,344,106 $ 11,140,987 $ 1,687,451 $ 590,721 $ 2,278,172 $ 13,419,159 $ Contracted services 425,873 1,796,952 2,222,825 324,533 42,112 366,645 2,589,470 Legal and audit fees 15,732 10,901 26,633 97,396 2,044 99,440 126,073 Occupancy and insurance 594,271 86,279 680,550 269,453 14,220 283,673 964,223 Books and library materials 101,004 34,457 135,461 1,085 1,351 2,436 137,897 Office expenses 121,265 198,910 320,175 168,008 28,425 196,433 516,608 Meeting and travel expenses 208,537 422,781 631,318 39,386 24,813 64,199 695,517 Advertising 94,523 9,922 104,445 4,179 399 4,578 109,023 Software and hardware 163,873 80,000 243,873 80,372 8,914 89,286 333,159 Miscellaneous 110,866 77,501 188,367 137,067 1,570 138,637 327,004 Interest 1,146,831 - 1,146,831 160,023 26,670 186,693 1,333,524
6,779,656 10,061,809 16,841,465 2,968,953 741,239 3,710,192 20,551,657
Depreciation 771,187 - 771,187 107,607 17,935 125,542 896,729
7,550,843 $ 10,061,809 $ 17,612,652 $ 3,076,560 $ 759,174 $ 3,835,734 $ 21,448,386 $
See notes to financial statements.
Program Services Supporting Services

7
Erikson Institute
Statement of Functional ExpensesYear Ended June 30, 2015
Academic Special Management Fund -Programs Projects Total and General raising Total Total
Compensation 3,744,297 $ 6,159,571 $ 9,903,868 $ 1,396,471 $ 569,886 $ 1,966,357 $ 11,870,225 $ Contracted services 271,786 1,486,909 1,758,695 355,169 60,768 415,937 2,174,632 Legal and audit fees 2,345 25,085 27,430 112,839 - 112,839 140,269 Occupancy and insurance 557,979 71,565 629,544 255,170 19,032 274,202 903,746 Books and library materials 96,359 45,364 141,723 692 584 1,276 142,999 Office expenses 85,614 176,405 262,019 130,509 20,422 150,931 412,950 Meeting and travel expenses 130,738 338,904 469,642 35,515 17,449 52,964 522,606 Advertising 56,133 13,129 69,262 1,635 357 1,992 71,254 Software and hardware 166,355 101,816 268,171 53,282 12,166 65,448 333,619 Miscellaneous 99,003 9,368 108,371 133,575 1,793 135,368 243,739 Interest 1,194,104 - 1,194,104 166,618 27,770 194,388 1,388,492
6,404,713 8,428,116 14,832,829 2,641,475 730,227 3,371,702 18,204,531
Depreciation 771,288 - 771,288 107,621 17,937 125,558 896,846
7,176,001 $ 8,428,116 $ 15,604,117 $ 2,749,096 $ 748,164 $ 3,497,260 $ 19,101,377 $
See notes to financial statements.
Program Services Supporting Services

8
Erikson Institute
Statements of Cash FlowsYears Ended June 30, 2016 and 2015
2016 2015Cash flows from operating activities:
Decrease in net assets (4,056,014) $ (2,526,542) $ Adjustments to reconcile decrease in net assets
to net cash used in operating activities:Depreciation 896,729 896,846 Allowance for uncollectible accounts 74,231 (55,338) Realized and unrealized loss (gain) on investments 2,363,858 (1,058,473) Interest rate swap fair value adjustment 2,522,434 808,652 Change in assets and liabilities:
Contributions receivable (691,197) 1,078,631 Grants and contracts receivable (935,134) (814,423) Other receivables (52,810) 54,015 Other assets 53,944 (54,114) Accounts payable and accrued liabilities (139,105) 597,669 Unearned tuition and deposits (127,496) 308,413
Net cash used in operating activities (90,560) (764,664)
Cash flows from investing activities:Additions to property and equipment (14,418) (56,471) Proceeds from sale of investments 12,404,315 18,929,103 Purchase of investments (9,697,758) (18,794,696)
Net cash provided by investing activities 2,692,139 77,936
Cash flows from financing activities:Bond principal payment (750,000) (325,000) Proceeds from contributions restricted for permanent endowment 300 475,049
Net cash (used in) provided by financing activities (749,700) 150,049
Net increase (decrease) in cash 1,851,879 (536,679)
Cash:Beginning of year 1,124,000 1,660,679
End of year 2,975,879 $ 1,124,000 $
Supplemental disclosure of cash flow information:Cash payments for interest 1,281,840 $ 1,336,810 $
See notes to financial statements.

Erikson Institute Notes to Financial Statements
9
Note 1. Nature of Organization and Significant Accounting Policies Erikson Institute (“Institute”) is an independent institution of higher education located in Chicago, Illinois, that prepares child development professionals for leadership. Through its academic programs, applied research, and community service and engagement, the Institute advances the ability of practitioners and researchers to improve life for children and their families. The Institute is a catalyst for discovery and change, continually bringing the newest scientific knowledge on children’s development and learning into its classrooms and out to the community so that professionals serving children and families are informed, inspired and responsive. The Institute is exempt from income taxes under Section 501(c)(3) of the Internal Revenue Code and applicable state law. Accounting policies: The Institute follows accounting standards established by the Financial Accounting Standards Board (“FASB”) to ensure consistent reporting of financial condition, changes in net assets, and cash flows. References to Generally Accepted Accounting Principles (“GAAP”) in these footnotes are to the FASB Accounting Standards Codification™, sometimes referred to as the “Codification” or “ASC.” Revenue recognition: Revenue is recorded on the accrual basis of accounting, whereby revenue is recognized when earned. Tuition revenue is recognized as the classes take place. Student fees, consulting revenue and grant revenues are recognized as the services are provided. All contributions are considered to be available for unrestricted use unless otherwise specifically restricted by donors. Contributions are recorded and recognized as revenue when a notice of an award or a pledge is received. Restricted contributions are recorded as revenue in temporarily restricted net assets if limited by donor imposed stipulations that either expire by passage of time or can be fulfilled and removed by action of the Institute, or in permanently restricted net assets if such contributions are non-expendable. When a donor restriction expires, that is, when a stipulated time restriction ends or purpose restriction is accomplished, temporarily restricted net assets are reclassified to unrestricted net assets and reported in the statement of activities as net assets released from restrictions. Expense allocation: The costs of providing various programs and other activities have been summarized on a functional basis in the statement of activities and in the statement of functional expenses. Accordingly, certain costs have been allocated among the programs and supporting services benefited, based on estimates made by management. Cash: Cash includes cash on hand, demand deposits and time deposits with original maturities of less than three months. The Institute maintains funds in accounts that at times are in excess of Federal Deposit Insurance Corporation insurance limits; however, the Institute minimizes this risk by maintaining deposits in high-quality financial institutions. The Institute has not experienced any losses in such accounts and believes it is not exposed to any significant credit risk on cash. Grants and contracts receivables: Grants and contracts receivables are reported at their estimated realizable value and recognized as unrestricted revenue at the time the Institute performs the services. Management reviews the receivables for collectability and records an allowance for any accounts deemed uncollectible. Contributions receivable: Contributions receivable are reported at their estimated realizable value and recognized as revenue at the time an unconditional promise to give is received from a donor. If the pledge is receivable over an extended period of time, the present value of the pledge is recorded. The receivables are discounted using a present value discount rate of 3 percent. Management reviews the receivables for collectability and records an allowance for any accounts deemed uncollectible.

Erikson Institute Notes to Financial Statements
10
Note 1. Nature of Organization and Significant Accounting Policies (Continued) Investments: Investments in marketable securities held by the Institute are stated at fair value. The Institute reports the fair value of market alternatives, also known as alternative investments, using the practical expedient. The practical expedient allows for the use of net asset value (“NAV”), either as reported by the investee fund or as adjusted by the Institute based on various factors. Investment income or loss (including gains and losses on investments, interest and dividends) is included in the statement of activities as increases or decreases in unrestricted net assets unless the income or loss is restricted by donor or law. Interest rate swap agreement: The Institute’s interest rate swap agreement is recognized as either an asset or liability at its fair value in the statement of financial position with changes in the fair value reported as non-operating income or loss. For the years ended June 30, 2016 and 2015, the Institute recognized a loss of $2,522,434 and a loss of $808,652, respectively, on this instrument. Property and equipment: Property and equipment are recorded at cost. The Institute capitalizes all expenditures for property and equipment in excess of $5,000. Depreciation is being provided on a straight-line basis over the estimated useful lives of the assets as follows: Computer equipment 5 years
Furniture and equipment 10 years Building 39 years Assets retired or otherwise disposed of are removed from the accounts at their net book value and the gain or loss is recognized as the difference between proceeds, if any, and the net book value. Repairs and maintenance are charged to expense as incurred. Unearned tuition and deposits: Tuition and deposits received for classes to be held subsequent to year-end are recorded as an unearned tuition and deposits liability at year-end. Net assets: In order to ensure the observance of limitations and restrictions placed on the use of available resources, the Institute maintains its financial accounts in accordance with the principles and practices of fund accounting. This is the procedure by which resources for various purposes are classified into funds established in accordance with their nature and purpose. For financial reporting purposes, fund balances and related activities of the various funds are classified as unrestricted, temporarily restricted, or permanently restricted based on the existence or absence of donor-imposed restrictions. The Institute has designated portions of the unrestricted net assets as an endowment (funds functioning as endowment) and as a program investment fund (reinvestment funds). During fiscal year 2015, the Institute reclassified $463,301 of unrestricted net assets to temporarily restricted net assets pursuant to donors’ instructions. Accounting estimates: The preparation of financial statements requires management to make estimates and assumptions that affect the reported amounts of assets and liabilities and disclosure of contingent assets and liabilities at the date of the financial statements and the reported amounts of revenue and expenses during the reporting period. Actual results could differ from those estimates.

Erikson Institute Notes to Financial Statements
11
Note 1. Nature of Organization and Significant Accounting Policies (Continued) Income taxes: The accounting standard on accounting for uncertainty in income taxes addresses the determination of whether tax benefits claimed or expected to be claimed on a tax return should be recorded in the financial statements. Under this guidance, the Institute may recognize the tax benefit from an uncertain tax position only if it is more likely than not that the tax position will be sustained on examination by taxing authorities, based on the technical merits of the position. Examples of tax positions include the tax-exempt status of the Institute and various positions related to the potential sources of unrelated business taxable income. The tax benefits recognized in the financial statements from such a position are measured based on the largest benefit that has a greater than 50 percent likelihood of being realized upon ultimate settlement. There were no unrecognized tax benefits identified or recorded as liabilities during the periods covered by these financial statements. The Institute files Forms 990 in the U.S. federal jurisdiction and the State of Illinois. The Institute is generally no longer subject to examination by the Internal Revenue Service for tax years before fiscal 2013. Accounting pronouncements adopted: The Institute adopted the FASB issued Accounting Standards Update (“ASU”) 2015-07, Fair Value Measurement (Topic 820): Disclosures for Investments in Certain Entities That Calculate Net Asset Value per Share (or Its Equivalent). The amendments in this update remove the requirement to categorize within the fair value hierarchy all investments for which fair value is measured using the net asset value per share practical expedient. The amendments also remove the requirement to make certain disclosures for all investments that are eligible to be measured at fair value using the net asset value per share practical expedient. Recent accounting pronouncements: In May 2014, the FASB issued ASU 2014-09, Revenue from Contracts with Customers (Topic 606), requiring an entity to recognize the amount of revenue to which it expects to be entitled for the transfer of promised goods or services to customers. The updated standard will replace most existing revenue recognition guidance in U.S. GAAP when it becomes effective. Early adoption is permitted. The updated standard will now be effective for the Institute in the fiscal year ending June 30, 2020. In February 2016, the FASB issued ASU 2016-02, Leases (Topic 842). The guidance in this ASU supersedes the leasing guidance in Topic 840, Leases. Under the new guidance, lessees are required to recognize lease assets and lease liabilities on the statement of financial position for all leases with terms longer than twelve months. Leases will be classified as either finance or operating, with classification affecting the pattern of expense recognition in the income statement. The new standard is effective for the Institute in the fiscal year ending June 30, 2021. In August 2016, the FASB issued ASU 2016-14, Not-for-Profit Entities (Topic 958): Presentation of Financial Statements of Not-for-Profit Entities. Key elements of the ASU include a reduction in the number of net asset categories from three to two, conforming requirements on releases of capital restrictions, several new requirements related to expense presentation and disclosure (including investment expenses), and new required disclosures communicating information useful in assessing liquidity. The new standard is effective for the Institute in the fiscal year ending June 30, 2019, early adoption is allowed. The Institute is currently evaluating the impact of the adoption of these new standards on its financial statements. Subsequent events: The Institute has evaluated subsequent events for potential recognition and/or disclosure through October 12, 2016, the date the financial statements were available to be issued.

Erikson Institute Notes to Financial Statements
12
Note 2. Contributions Receivable Contributions receivable at June 30, 2016 and 2015 are due as follows:
2016 2015
Amounts due in less than one year 2,398,576 $ 2,083,200 $ Amounts due in one to five years 1,112,973 737,452
3,511,549 2,820,652 Less:
Allowance for uncollectible accounts (25,000) - Present value discount (110,642) (98,324)
3,375,907 $ 2,722,328 $
The receivables are discounted using a present value discount rate of 3 percent.
Note 3. Grants, Contracts and Other Receivables Grants and contracts receivable at June 30, 2016 and 2015 are composed of the following:
2016 2015
Grants and contracts receivable 3,114,484 $ 2,179,350 $ Less: Allowance for uncollectible accounts (187,007) (124,437)
2,927,477 $ 2,054,913 $
Other receivables at June 30, 2016 and 2015 are composed of the following:
2016 2015
Other receivables 479,649 $ 426,839 $ Less: Allowance for uncollectible accounts (23,419) (24,076)
456,230 $ 402,763 $

Erikson Institute Notes to Financial Statements
13
Note 4. Investments Investments at June 30, 2016 and 2015 are composed of the following:
Fair Value Cost Fair Value Cost
Short-term investments 2,982,089 $ 2,982,090 $ 4,217,448 $ 4,217,448 $ Mutual funds:
Commodities 1,914,827 2,440,337 2,136,793 2,429,388 Fixed income 7,735,809 7,882,212 7,570,050 7,640,304 Equities 11,560,454 9,718,790 14,080,584 10,706,857
Corporate stocks 4,979,821 4,685,586 5,155,008 4,569,012 Hedge funds and other investments:
Equity 4,978,998 4,087,004 5,575,496 4,318,797 Private equity 3,937,942 3,430,404 3,761,301 2,581,797 Absolute return 6,753,712 6,626,216 7,417,387 7,017,646
44,843,652 $ 41,852,640 $ 49,914,067 $ 43,481,249 $
June 30, 2016 June 30, 2015
Components of investment income (loss) at June 30, 2016 and 2015 are as follows:
2016 2015
Net realized and unrealized (losses) gains (2,363,858) $ 1,058,473 $ Interest and dividends 499,784 530,955 Investment fees and expenses (221,086) (165,293)
(2,085,160) $ 1,424,135 $
Investment earnings of the permanently restricted endowment are considered temporarily restricted until spent for their designated purpose. Only a portion of the Institute’s cumulative investment return on the board designated endowment is designated for support of current operations; the remainder is retained to support operations of future years and to offset potential market declines. The Institute considers the investment earnings allocation from the endowment assets to be operating income, with the remaining investment income recorded as non-operating. These amounts are reflected as investment income (loss) in the statements of activities as follows:
2016 2015
Support and revenue 1,959,027 $ 1,860,620 $ Non-operating expense (4,044,187) (436,485)
(2,085,160) $ 1,424,135 $

Erikson Institute Notes to Financial Statements
14
Note 5. Fair Value Measurements The Institute follows ASC Topic, Fair Value Measurements and Disclosure, which provides the framework for measuring fair value under generally accepted accounting principles. This Topic applies to all financial instruments that are being measured and reported on a fair value basis. As defined in the Topic, fair value is the price that would be received to sell an asset or paid to transfer a liability in an orderly transaction between market participants at the measurement date. In determining fair value, the Institute uses various methods including market, income, and cost approaches. Based on these approaches, the Institute often utilizes certain assumptions that market participants would use in pricing the asset or liability, including assumptions about risk and/or the risks inherent in the inputs to the valuation technique. These inputs can be readily observable, market corroborated, or generally unobservable inputs. The Institute utilizes valuation techniques that maximize the use of observable inputs and minimize the use of unobservable inputs. Based on the observability of the inputs used on the valuation techniques, the Institute is required to provide the following information according to the fair value hierarchy. The fair value hierarchy ranks the quality and reliability of the information used to determine fair values. Financial assets and liabilities carried at fair value will be classified and disclosed in one of the following three categories:
Level 1. Valuations for assets and liabilities traded in active exchange markets, such as the New York Stock Exchange. Level 1 assets primarily include listed equities, money market funds, government securities, and mutual funds. Valuations are obtained from readily available pricing sources for market transactions involving identical assets or liabilities. Level 2. Valuations for assets and liabilities traded in less active dealer or broker markets. Valuations are obtained from third-party pricing services for similar assets or liabilities. Level 2 assets primarily include less liquid and restricted equity securities, funds invested in equity securities, fixed-income, real estate securities, asset allocation and money market funds. Level 3. Valuations for assets and liabilities that are derived from other valuation methodologies, including option pricing models, discounted cash flow models and similar techniques, and not based on market exchange, dealer, or broker-traded transactions. Level 3 valuations incorporate certain assumptions and projections in determining the fair value assigned to such assets or liabilities.
In certain cases, the inputs used to measure fair value may fall into different levels of the fair value hierarchy. In such cases, an investment’s level within the fair value hierarchy is based on the lowest level of input that is significant to the fair value measurement. The Institute’s assessment of the significance of a particular input to the fair value measurement in its entirety requires judgment, and considers factors specific to the investment. For fiscal years 2016 and 2015, the application of valuation techniques applied to similar assets and liabilities has been consistent with techniques used in previous years. The valuation methodologies used for instruments at fair value are described on the following page.

Erikson Institute Notes to Financial Statements
15
Note 5. Fair Value Measurements (Continued) Investments in securities traded on a national securities exchange, or reported on the NASDAQ national market, are stated at the last reported sales price on the day of valuation; other securities traded in the over-the-counter market and listed securities for which no sale was reported on that date are stated at the last quoted bid price, except for short sales positions and call options written, for which the last quoted asked price is used. The fair values of the Institute’s short-term investments, including cash and cash equivalents approximate their individual carrying amounts due to the relatively short period of time between their origination and expected realization. Restricted securities and other securities for which quotations are not readily available are valued at fair value as determined by the general partner. Hedge funds and other investments, which generally are investment partnerships, are valued at fair value based on the applicable percentage ownership of the underlying partnerships’ net assets as of the measurement date, as determined by the general partner. In determining fair value, the general partner utilizes valuations provided by the underlying investment partnerships. The underlying investment partnerships value securities and other financial instruments on a fair value basis of accounting. The estimated fair values of certain investments of the underlying investment partnerships, which may include private placements and other securities for which prices are not readily available, are determined by the general partner or sponsor of the respective other investment partnership and may not reflect amounts that could be realized upon immediate sale, or amounts that ultimately may be realized. Accordingly, the estimated fair values may differ significantly from the values that would have been used had a ready market existed for these investments. The fair value of the Institute’s investment partnerships generally represents the amount the Institute would expect to receive if it were to liquidate its investment in the investment partnerships excluding any redemption charges that may apply. The current partnerships have quarterly redemption periods with a 60-day notice period. At June 30, 2016 and 2015, the Institute had $3,360,951 and $3,434,482, respectively, of unfunded commitments related to these investments. The following table sets forth the fair value of investments in certain entities that calculate NAV per share (or its equivalent):
June 30, June 30, 2016 20152016 2015 Unfunded Unfunded Redemption Redemption
Fair Value Fair Value Commitment Commitment Frequency Notice PeriodInvestment
Hedge Funds and other investmentsEquity (a) 1,979,239 $ 2,209,132 $ -$ -$ Quarterly 60 daysEquity (a) 2,999,759 3,366,364 - - Quarterly Over 90 daysPrivate equity (b) 3,937,942 3,761,301 3,360,951 3,434,482 Quarterly Over 90 daysAbsolute return (c) 1,530,530 - - - Quarterly 60 daysAbsolute return (c) 5,223,182 7,417,387 - - Quarterly Over 90 days
(a) Represents investments in mature mid-size companies with leading market positions and annual
revenues of $10 million - $100 million. (b) Represents limited partnership investments focused on achieving long-term returns through
investments in a diversified portfolio of private equity limited partnerships. (c) Includes funds of funds invested in limited partnerships and partnership investments which are
primarily private investment pools with no particular industry or geographic concentration. Certain alternative investments and investments in funds have been valued as of March 31, 2016 and 2015 and then adjusted for any purchases and withdrawals made between April 1 and June 30 because June 30 balances were not readily available from fund managers and general partners.

Erikson Institute Notes to Financial Statements
16
Note 5. Fair Value Measurements (Continued) Market alternatives are redeemable with the investee fund at NAV under the original terms of the subscription agreement. Due to the nature of these investments and changes in market conditions, the overall economic environment may significantly impact the NAV of the funds and therefore the value of the Institute’s interest. It is therefore reasonably possible that, if the Institute were to sell all or a portion its market alternatives, the transaction value could be significantly different than the fair value reported as of June 30. The Institute assesses the levels of financial instruments at each measurement date, and transfers between levels are recognized on the actual date of the event of change in circumstances that caused the transfer in accordance with the Institute’s accounting policy regarding recognition of transfers between levels of the fair value hierarchy. There were no such transfers for fiscal 2016 or 2015. In certain cases, the inputs used to measure fair value may fall into different levels of the fair value hierarchy. In such cases, an investment’s level within the fair value hierarchy is based on the lowest level of input that is significant to the fair value measurement. The Institute’s assessment of the significance of a particular input to the fair value measurement in its entirety requires judgment, and considers factors specific to the investment. The Institute’s valuation of the interest-rate swap agreement is based on widely-accepted valuation techniques, including discounted cash flow analysis on the expected cash flows of the interest-rate swap agreement. This analysis reflects the contractual terms of the agreement, including the period to maturity, and uses observable market-based inputs, including LIBOR rate curves. In accordance with ASU 2015-07, Fair Value Measurement (Topic 820), certain investments that were measured at net asset value per share (or its equivalent) have not been classified in the fair value hierarchy. The fair value amounts presented in this table are intended to permit reconciliation of the fair value hierarchy to the line items presented in the statement of financial position.

Erikson Institute Notes to Financial Statements
17
Note 5. Fair Value Measurements (Continued) The following table presents the Institute’s fair value hierarchy for those assets measured at fair value on a recurring basis as of June 30, 2016:
Investments Classified in the Fair Value HierarchyQuoted Prices Significant
in Active Markets Other SignificantInvestments for Identical Observable UnobservableMeasured at Assets Inputs Inputs
Description Total Net Asset Value (Level 1) (Level 2) (Level 3)
Short-term investments 2,982,089 $ -$ 2,982,089 $ -$ -$ Mutual funds:
Commodities 1,914,827 - 1,914,827 - - Fixed income 7,735,809 - 7,735,809 - - Equities 11,560,454 - 11,560,454 - - Corporate stocks 4,979,821 - 4,979,821 - -
Hedge funds and other investments:Equity 4,978,998 4,978,998 - - - Private equity 3,937,942 3,937,942 - - - Absolute return 6,753,712 6,753,712 - - -
44,843,652 $ 15,670,652 $ 29,173,000 $ -$ -$
Investments held for deferred compensation:Money market funds 125,479 $ -$ 125,479 $ -$ -$ Equity 475,488 - 475,488 - - Fixed income 84,048 - 84,048 - - Guaranteed 167,523 - - 167,523 -
852,538 $ -$ 685,015 $ 167,523 $ -$
Interest rate swap (7,147,848) $ -$ -$ (7,147,848) $ -$

Erikson Institute Notes to Financial Statements
18
Note 5. Fair Value Measurements (Continued) The following table presents the Institute’s fair value hierarchy for those assets measured at fair value on a recurring basis as of June 30, 2015:
Investments Classified in the Fair Value HierarchyQuoted Prices Significant
in Active Markets Other SignificantInvestments for Identical Observable UnobservableMeasured at Assets Inputs Inputs
Description Total Net Asset Value (Level 1) (Level 2) (Level 3)
Short-term investments 4,217,448 $ -$ 4,217,448 $ -$ -$ Mutual funds:
Commodities 2,136,793 - 2,136,793 - - Fixed income 7,570,050 - 7,570,050 - - Equities 14,080,584 - 14,080,584 - - Corporate stocks 5,155,008 - 5,155,008 - -
Hedge funds and other investments:Equity 5,575,496 5,575,496 - - - Private equity 3,761,301 3,761,301 - - - Absolute return 7,417,387 7,417,387 - - -
49,914,067 $ 16,754,184 $ 33,159,883 $ -$ -$
Investments held for deferred compensation:Money market funds 158,480 $ -$ 158,480 $ -$ -$ Equity 481,050 - 481,050 - - Fixed income 79,520 - 79,520 - - Multi-asset 99,605 - 99,605 - - Guaranteed 24,647 - - 24,647 -
843,302 $ -$ 660,175 $ 24,647 $ -$
Interest rate swap (4,625,414) $ -$ -$ (4,625,414) $ -$
The Institute’s investment portfolio is exposed to various risks, such as interest rate, credit, and overall market volatility. Due to the level of risk associated with certain investment securities, it is reasonably possible that changes in the values of investment securities will occur in the near term and such changes could materially affect the amounts reported in the financial statements. Market risk: Market risk arises primarily from changes in the market value of financial instruments. Exposure to market risk is influenced by a number of factors, including the relationships between financial instruments, and the volatility and liquidity in the markets in which the financial instruments are traded. In many cases, the use of financial instruments serves to modify or offset market risk associated with other transactions and, accordingly, serves to decrease the Institute's overall exposure to market risk. The Institute attempts to control its exposure to market risk through various analytical monitoring techniques. Credit risk: Credit risk arises primarily from the potential inability of counterparties to perform in accordance with the terms of a contract. The Institute’s exposure to credit risk associated with counterparty nonperformance is limited to the current cost to replace all contracts in which the Institute has a gain. Exchange-traded financial instruments generally do not give rise to significant counterparty exposure due to the cash settlement procedures for daily market movements and the margin requirements of individual exchanges. The Institute seeks to mitigate its exposure to this credit risk by placing its cash with major institutions.

Erikson Institute Notes to Financial Statements
19
Note 5. Fair Value Measurements (Continued) Concentration of credit risk: The Institute's managers currently invest with various managers and clearing brokers. In the event these counterparties do not fulfill their obligations, the Institute may be exposed to risk. This risk of default depends on the creditworthiness of the counterparty to these transactions. The Institute attempts to minimize this credit risk by monitoring the creditworthiness of the managers and clearing brokers. Alternative investments and investments in funds: The managers of underlying investment entities in which the Institute invests, may utilize derivative instruments with off-balance-sheet risk. The Institute’s exposure to risk is limited to the amount of its investment.
Note 6. Property and Equipment Property and equipment are composed of the following at June 30, 2016 and 2015:
2016 2015
Land 2,692,677 $ 2,692,677 $ Building 27,299,163 27,299,163 Furniture and equipment 4,052,594 4,052,594 Other 66,918 52,500
34,111,352 34,096,934 Less: Accumulated depreciation (9,174,455) (8,277,726)
24,936,897 $ 25,819,208 $
Depreciation expense totaled $896,729 and $896,846 for fiscal years 2016 and 2015, respectively.
Note 7. Long-Term Debt On December 12, 2007, the Institute entered into a bond trust agreement with the Illinois Finance Authority (“IFA”) to issue Adjustable Rate Demand Educational Facility Revenue Bonds, Series 2007, for $32,500,000. The Institute redeemed $750,000 and $325,000 of the outstanding bonds in 2016 and 2015, respectively. The bonds are non-amortizing and have a term of 30 years subject to the renewal of the letter of credit discussed below. These funds were used to construct its building at 451 North LaSalle Street, Chicago, Illinois. The bonds are secured by a transferable irrevocable letter of credit issued by Bank of America with a maturity date of November 29, 2017. The Institute also has a reimbursement agreement with Bank of America. As collateral, Bank of America has a negative pledge on all business assets of the Institute. Bank of America also requires the Institute to comply with certain financial covenants which are monitored on a quarterly and semi-annual basis.

Erikson Institute Notes to Financial Statements
20
Note 7. Long-Term Debt (Continued) In order to reduce exposure to adjustable interest rates on variable rate debt, the Institute entered into a 30-year interest rate swap agreement in March 2008. The agreement has the effect of fixing the rate of interest at 3.5 percent for the variable rate debt. The notional amount of the swap agreement at June 30, 2015, was $16,250,000. The fair value of the swap agreement is the estimated amount that the Institute would pay or receive to terminate the agreement as of the statement of financial position date, taking into account current interest rates and the current creditworthiness of the swap counterparty. As of June 30, 2016 and 2015, the fair value of the interest rate swap agreement was a liability of $7,147,848 and $4,625,414, respectively, and is presented on the statements of financial position as “Interest rate swap agreement.” The Institute recorded a loss in the amount of $2,522,434 and $808,652, respectively, for the change in the fair value of the swap agreement.
Note 8. Retirement Plans Pension expense for the Institute’s defined contribution 403(b) retirement plan was $509,147 and $461,975 in fiscal years 2016 and 2015, respectively. The plan covers all employees who have worked one year or were covered by a prior plan, and worked more than 1,000 hours during the year. Under this plan, pension benefits and costs are calculated separately for each participant and are funded currently. The Institute has a nonqualified 457(b) deferred compensation plan for certain employees. Contributions to the plan are invested under the direction of the individual qualified employee from the same options available for the 403(b) plan. Eligible employees made contributions of $8,875 and $23,000 for the fiscal years ended 2016 and 2015, respectively. At June 30, 2016 and 2015, $852,538 and $843,302, respectively, were accrued as a liability and set aside in a separate account for this benefit. The Plan is intended to constitute an unfunded plan and all amounts held are assets of the employer.
Note 9. Funds Functioning as Endowment The Board of Trustees has designated certain amounts of unrestricted revenues to be classified as funds functioning as endowment. The income on these funds will be used to support ongoing operations. As of June 30, 2016 and 2015, these funds were established for the following purposes:
2016 2015
Facilities 10,094,899 $ 11,872,389 $ General operations 10,536,713 11,680,895 Scholarships 143,002 158,531
20,774,614 $ 23,711,815 $
Erikson Institute Notes to Financial Statements
21
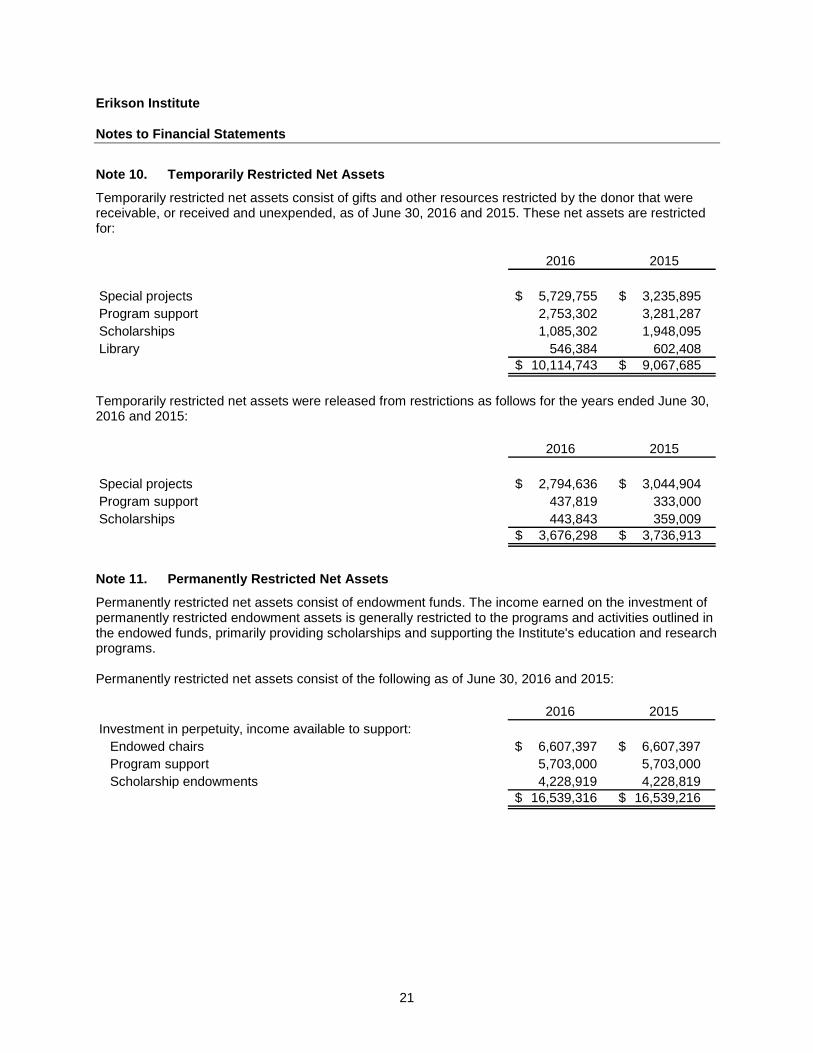
Note 10. Temporarily Restricted Net Assets Temporarily restricted net assets consist of gifts and other resources restricted by the donor that were receivable, or received and unexpended, as of June 30, 2016 and 2015. These net assets are restricted for:
2016 2015
Special projects 5,729,755 $ 3,235,895 $ Program support 2,753,302 3,281,287 Scholarships 1,085,302 1,948,095 Library 546,384 602,408
10,114,743 $ 9,067,685 $
Temporarily restricted net assets were released from restrictions as follows for the years ended June 30, 2016 and 2015:
2016 2015
Special projects 2,794,636 $ 3,044,904 $ Program support 437,819 333,000 Scholarships 443,843 359,009
3,676,298 $ 3,736,913 $
Note 11. Permanently Restricted Net Assets Permanently restricted net assets consist of endowment funds. The income earned on the investment of permanently restricted endowment assets is generally restricted to the programs and activities outlined in the endowed funds, primarily providing scholarships and supporting the Institute's education and research programs. Permanently restricted net assets consist of the following as of June 30, 2016 and 2015:
2016 2015Investment in perpetuity, income available to support:
Endowed chairs 6,607,397 $ 6,607,397 $ Program support 5,703,000 5,703,000 Scholarship endowments 4,228,919 4,228,819
16,539,316 $ 16,539,216 $

Erikson Institute Notes to Financial Statements
22
Note 12. Endowment Funds Interpretation of Relevant Law The Institute’s Board of Trustees has interpreted Uniform Prudent Management of Invested Funds Act (“UPMIFA”) as requiring the preservation of the fair value of the original gift as of the gift date of the donor-restricted endowment funds absent explicit donor stipulations to the contrary. As a result of this interpretation, the Institute classifies as permanently restricted net assets (a) the original value of gifts donated to the permanent endowment, (b) the original value of subsequent gifts to the permanent endowment, and (c) accumulations to the permanent endowment made in accordance with the direction of the applicable donor gift instrument at the time the accumulation is added to the fund. The remaining portion of the donor-restricted endowment fund that is not classified in permanently restricted net assets is classified as temporarily restricted net assets until those amounts are appropriated for expenditure by the Institute in a manner consistent with the standard of prudence prescribed by UPMIFA. In accordance with UPMIFA, the Institute considers the following factors in making a determination to appropriate or accumulate earnings on donor-restricted endowment funds:
1) The duration and preservation of the fund; 2) The purpose of the Institute and the donor-restricted endowment fund; 3) General economic conditions; 4) The possible effect of inflation and deflation; 5) The expected total return from income and the appreciation of investments; 6) Other resources of the Institute; and 7) The investment policies of the Institute.
The Institute’s endowment net asset composition by type of fund is as follows for the years ended June 30, 2016 and 2015:
Temporarily PermanentlyUnrestricted Restricted Restricted Total
Board designated 20,774,614 $ -$ -$ 20,774,614 $ Donor restricted - 1,891,014 16,539,316 18,430,330 Total 20,774,614 $ 1,891,014 $ 16,539,316 $ 39,204,944 $
2016
Temporarily PermanentlyUnrestricted Restricted Restricted Total
Board designated 23,711,815 $ -$ -$ 23,711,815 $ Donor restricted - 3,714,550 16,539,216 20,253,766 Total 23,711,815 $ 3,714,550 $ 16,539,216 $ 43,965,581 $
2015

Erikson Institute Notes to Financial Statements
23
Note 12. Endowment Funds (Continued) The changes in endowment net assets for the Institute were as follows for the years ended June 30, 2016 and 2015:
Temporarily PermanentlyUnrestricted Restricted Restricted Total
Endowment net assets, beginning of year 23,711,815 $ 3,714,550 $ 16,539,216 $ 43,965,581 $ Investment loss (304,201) (1,786,986) - (2,091,187) Contributions - 500 100 600 Board designated amounts
transferred from operations 70,000 - - 70,000 Board designated amounts
transferred to operations (750,000) - - (750,000) Appropriation of endowment assets
for expenditures (1,953,000) (37,050) - (1,990,050)
Endowment net assets, end of year 20,774,614 $ 1,891,014 $ 16,539,316 $ 39,204,944 $
Temporarily PermanentlyUnrestricted Restricted Restricted Total
Endowment net assets, beginning of year 23,963,666 $ 3,904,740 $ 16,540,176 $ 44,408,582 $ Investment income 1,607,705 (190,190) - 1,417,515 Bad debt expense - - (960) (960) Board designated amounts
transferred from operations 319,444 - - 319,444 Board designated amounts
transferred to operations (325,000) - - (325,000) Appropriation of endowment assets
for expenditures (1,854,000) - - (1,854,000)
Endowment net assets, end of year 23,711,815 $ 3,714,550 $ 16,539,216 $ 43,965,581 $
2016
2015
Return Objectives and Risk Parameters The Institute has adopted investment and spending policies for endowment assets that attempt to provide a predictable stream of funding. Funds functioning as endowment are only released by the Board of Trustees for spending based on organizational spending and investment policies or specifically directed spending in accordance with donor-specified uses. Endowment assets include those assets of donor-restricted funds that the Institute must hold in perpetuity as well as board-designated funds. Under this policy, as approved by the Board of Trustees, the endowment assets are invested in a manner that is intended to produce results that exceed the price and yield results of the various indices set in the investment policy, while assuming a moderate level of investment risk.

Erikson Institute Notes to Financial Statements
24
Note 12. Endowment Funds (Continued) Strategies Employed for Achieving Objectives To satisfy its long-term rate-of-return objectives, the Institute relies on a total return strategy in which investment returns are achieved through both capital appreciation (realized and unrealized) and current yield (interest and dividends). The Institute targets a diversified asset allocation that places a greater emphasis on equity-based investments to achieve its long-term return objectives within prudent risk constraints. Spending Policy and How the Investment Objectives Relate to Spending Policy The Institute has a policy of appropriating for distribution a percentage of its endowment fund’s average fair value over the prior 12 quarters through the calendar year proceeding the fiscal year in which the distribution is planned. The policy is coordinated with its investment policy such that over the long-term, its endowment will be able to maintain its purchasing power over time. The Board approved a spending rate of 4.5 percent for both the years ended June 30, 2016 and 2015.