Marine Geology between Cape San Martin and Pt. Sal A ... · Marine Geology between Cape San Martin...
41
Marine Geology between Cape San Martin and Pt. Sal South-central California Offshore A Preliminary Report August, 1974 by H. C. Wagner Pacific-Arctic Branch of Marine Geology U.S. Geological Survey OPEN FILE REPORT 74-252 This report is preliminary and has not been edited or reviewed for conformity with Geological Survey standards and nomenclature.
Transcript of Marine Geology between Cape San Martin and Pt. Sal A ... · Marine Geology between Cape San Martin...

Marine Geology between Cape San Martin and Pt. Sal South-central California Offshore
A Preliminary Report August, 1974
by
H. C. WagnerPacific-Arctic Branch of Marine Geology
U.S. Geological Survey
OPEN FILE REPORT 74-252
This report is preliminary and has not been edited or reviewed for conformity with Geological Survey standards and nomenclature.

Table of Contents
Page
Introduction ..................... 1
Offshore geology ................... 2
Acoustic and stratigraphic units ........ 3
Intrusive rocks .................. 6
Structure .................... 6
Acoustic evidence of recency of faulting. .... 9
Earthquake epicenters .............. 13
Bathymetry offshore from the San Luis Range ... 13
Summary and Conclusions. ............... 15
References ...................... 17

Figures
Fig. 1 Index map showing location of study area and positions of deep penetration geophysical track lines between Cape San Martin and Pt, Sal, south-central California offshore. Heavy lines indicate locations of figures 2 through 19.
Fig. 2 Annotated subbottom acoustic reflection profile showingcharacter of the "pre-Cenozoic unit" (Mz), "Miocene unit"(Tra), and "Pliocene unit" (Tp).
Fig. 3 Acoustic character of contact between "pre-Cenozoic unit" (Mz) and younger rocks.
Fig. 4 "Miocene unit" (Tin) as it commonly appears on deep penetra tion seismic reflection records.
Fig. 5 Folded and truncated beds of the "Miocene unit" (Tm)overlain by gently dipping beds of the "Pliocene unit" (Tp).
Fig. 6 Onlap relationship of strata of the "Pliocene unit" (Tp) upon the "Miocene unit" (Tm).
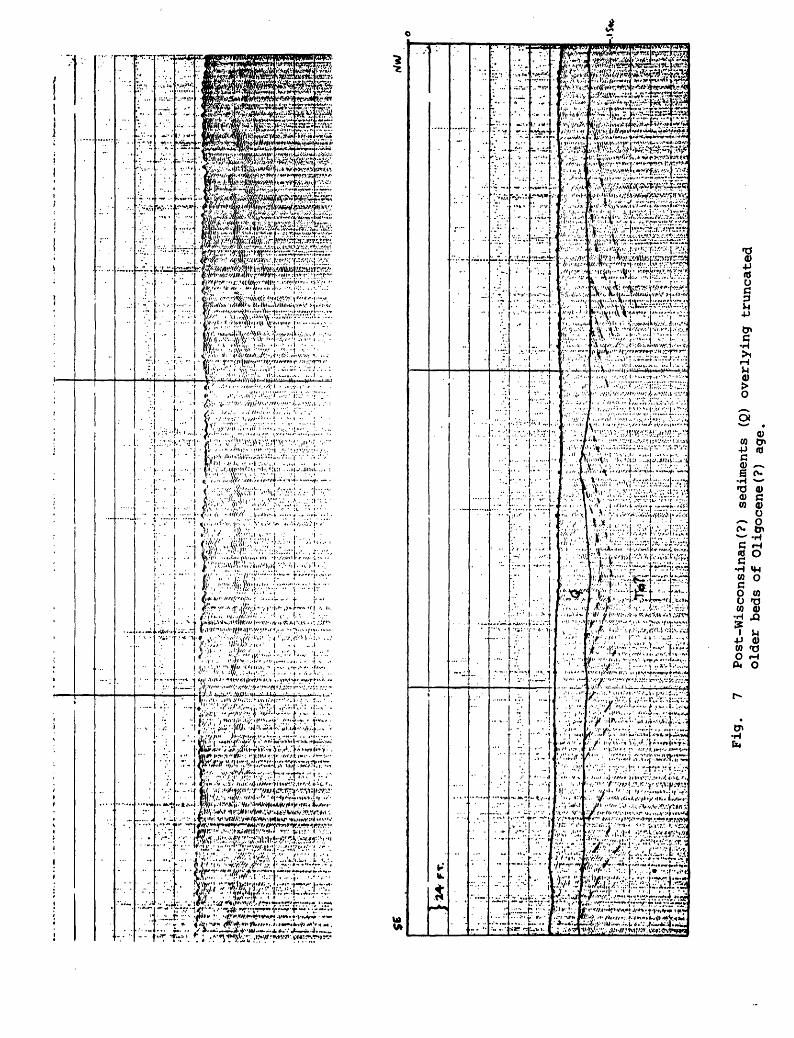
Fig. 7 Post-Wisconsinan(?) sediments (Q) overlying truncated older beds of Oligocene(?) age.
Fig. 8 Effect of wind chop upon a record showing post-Wisconsinan sediments (Q) overlying truncated beds of the "Miocene unit" (Tp).
Fig. 9 Post-Wisconsinan sediments (Q) overlying truncated and faulted beds of the "Miocene unit" (Tm) and "pre- Cenozoic unit" (Mz).
Fig. 10 Wedge-shaped body of post-Wisconsinan(?) sediments (Q) that fill eroded area between two resistant beds of the "Miocene unit" (Tm).
Fig. 11 Probable Tertiary intrusive in Estero Bay.
Fig. 12 Annotated seismic profile showing vertical offset ofthe unconformity at the top of the "pre-Cenozoic unit" along the Hosgri fault zone. Offset is possibly 6,000 ft (1,830 m). Sea water velocity (SWV) is 4,800 ft/sec. (1,460 m/sec.)

Fig. 13 Fault zone cutting truncated beds of the "Miocene unit" (Tm) and overlying sediments; seafloor possibly offset.
Fig. 14 Probable offset of post-Wisconsinan sediments (Q) directly above fault in older rocks. Seafloor possibly deformed.
Fig. 15 Fault cuts beds of the "Pliocene unit" (Tp) and reaches but does not offset the seafloor.
Fig. 16 Abrupt thinning of post-Wisconsinan sediment (Q) at old escarpment; possible fault.
Fig. 17 Abrupt thinning of post-Wisconsinan sediment (Q) at old escarpment; possibly faulted. Suggestion of faulting in older beds.
Fig. 18 Abrupt thinning of post-Wisconsinan sediment (Q) at old escarpment; probably faulted.
Fig. 19 Seafloor terraces separated by erosional features.
Fig. 20 Relative positions of bases of escarpments offshorefrom the San Luis Range, and their possible correlation,
Plates
Plate 1 Preliminary geologic map of the Cape San Martin to Pt. Sal offshore area, south-central California.
Plate 2 Preliminary geologic map offshore from the San LuisRange, south-central California, showing areas interpreted to be underlain by rocks of the "pre-Cenozoic unit" and "Miocene unit", and their relations to faults.
Plate 3 Preliminary geologic map offshore from the San LuisRange, south-central California, showing areas .interpreted to be underlain by strata of the "Pliocene unit" and by post-Wisconsinan sediments, and their relations to faults and to post-Wisconsinan erosional escarpments.
Plate 4 Preliminary map offshore from the San Luis Range, south- central California, showing relation of post-Wisconsinan erosional escarpments to bathymetry.
Marine Geology between Cape San Martin and Pt. Sal,
south-central California offshore-'
A Preliminary Report August 1974
by
H. C, Wagner
Introduct ion
The U.S. Geological Survey's Research Vessel George B., Kelez
was utilized in November 1973 to perform a geophysical survey between
Cape San Martin and Pt. Sal off central California. Approximately
750 mi (1,200 km) of deep penetration single channel seismic records
were obtained using a 120,000 joule sub-bottom acoustic reflection
profiling system with a 3-second sweep; high resolution records
were run simultaneously using an electrical-mechanical system with
a 1/4-second sweep (Wagner, 1974). In addition, bathymetric data
were obtained with a precision depth recorder, magnetic data were
gathered with a ship-towed magnetometer, and side-scan sonar records
were taken locally. The track lines extended 6 to 10 mi from shore and
were spaced one nautical mile apart throughout most of the area (fig. 1)
Because of structural complications offshore from the Diablo Canyon
site, another 80 mi (130 km) of geophysical line was run in that
area in December 1973, by Geomarine Services (a Division of the firm
Work done on behalf of U.S. Atomic Energy Commission, Division of Reactor Safety Research.
of Bolt, Beranak, and Newraan) under contract to the Pacific Gas and
Electric Company (PG&E). These PG&E data were also used in the
preparation of this report; however an additional 600 mi (965 km) of
geophysical data run by Geomarine Services and Aquatronics Geotechnical
Services in May, June, and July, 1974, under contract to PG&E were
made available but could not be interpreted in time to be included
in this preliminary report.
The objectives of the USGS cruise were to obtain detailed
geophysical data that would aid in identifying lithologic units
and interpreting offshore geologic structure for the evaluation of
potential hazards, if any, to large coastal installations and
attendant offshore pipelines. The potential hazards may include such
features as faults that cut the seafloor, areas of landsliding,
and submarine slumping.
The author wishes to acknowledge the able assistance of
S. C. Wolf during preparation for the R/V Kelez cruise, H. G.
Greene and M. S. Marlow at the time of the cruise, and P. A.
Mall4 during preparation of the report. C. D. Cavit and D. C.
Dolan helped to prepare the bathymetric map.
Offshore geology
The tectonic framework offshore from the Cape San Martin to
Pt. Sal area is characterized by a series of mainly northwest-
trending faults and folds roughly parallel to the coast (Plate 1).
The faults locally separate pre-Tertiary and Tertiary sedimentary
rock units each of which has a distinct acoustic and fold character

that can be correlated from track line to track line. In places,
the faults are covered by unfaulted late Tertiary and Quaternary
sediments *
Acoustic and stratigraphic units. Four acoustic units can be
recognized on the R/V Kelez seismic reflection profiles. These
units include a "pre-Cenozoic unit" (Mz), a "Miocene unit" (Tin), a
"Pliocene unit" (Tp), and a "post-Wisconsinan unit" (Q). The
relationship of these units to unconformities makes possible their
gross correlation with age-categorized units described by Hoskins
and Griffiths (1971) in this area. This correlation indicates
that the "pre-Cenozoic unit" of this report includes mainly rocks
of Jurassic and Cretaceous (and possibly Eocene) age, that the
"Miocene unit" includes rocks of early, middle, and late Miocene age,
and that the "Pliocene unit" includes rocks of late Miocene and
Pliocene age. The Pleistocene to Recent unit of Hoskins and Griffiths
(1971) probably correlates with the "post-Wisconsinan unit" of this
report.
As used herein, the "pre-Cenozoic unit" is an essentially
imbedded or chaotically bedded acoustic unit that appears on the deep
penetration profiles as a series of convex-upward (hyperbolic) curves,
irregularly sloping and crossing lines, and dotted and irregularly
2/ dashed lines (figs. 2, 3) . The imbedded unit is believed to contain
mainly Franciscan rocks and Cretaceous strata on the basis of seaward
2/ Interpretation of the deep penetration profiles on figures
2, 3, 4, 5, 6, 10, and 11 is complicated by the presence of multiple reflections of the seafloor and underlying geologic units at vertical intervals corresponding to the depth of the seafloor beneath sea level.

projection of the onshore outcrops and their lithologic characteristics.
Shoreline exposures show the Franciscan to consist of a jumbled
sequence of sandstone, shale, and basic igneous rocks. Each contrasting
lithologic unit has only short linear continuity (several meters to 100 m)
and would produce an essentially imbedded acoustic pattern. The onshore
Cretaceous strata form a sequence of massive sandstone beds that dip
steeply (45°-65°) eastward. Because of (1) the steep dip of the beds',
(2) the locally rough erosion surface cut upon the beds, and (3) the high
vertical exaggeration of the deep penetration sparker records (about
6 to 1), the Cretaceous strata would give an acoustic reflection pattern
similar to that of the Franciscan rocks. Elsewhere, as in the southern
part of Estero Bay, an acoustic pattern that contains tightly folded
beds, but is otherwise similar to the "pre-Cenozoic unit," probably
represents the seaward extension of tightly folded Oligocene(?), Miocene,
and Pliocene strata with dips of 30 to 50 degrees onshore (Hall, 1973).
In deeper water the "pre-Cenozoic unit" is correlated with Eocene
and Cretaceous rocks as shown by Hoskins and Griffiths (1971). The
surface that separates the "pre-Cenozoic unit" from overlying rocks
is readily observed on most records due to the strong sound-velocity
contrast between the highly indurated and locally metamorphosed
rocks of the, "pre-Cenozoic unit" and the broadly folded to unfolded
sedimentary rocks of middle Tertiary and Quaternary age. The contact
is erosional and commonly appears as a series of curved or nearly
planar dark lines on the unannotated parts of Figures 2 and 3.
The "Miocene unit" is generally recognized by sharp, even

banding and broad open folds in deep penetration and high resolution
seismic reflection profiles (fig. 4) . Near the shelf edge the folds
are locally truncated by pre-Pliocene erosion and in those areas the
"Pliocene unit" lies upon this eroded surface (fig. 5), The "Miocene
unit" is 2,000 to 5,000 ft (610 to 1,525 m) thick, assuming an
acoustic velocity of 8,000 ft/sec, and lies seaward of a major
northwest-trending fault except in two segments of the mapped
area. One segment lies offshore from an infaulted and folded
Miocene-Pliocene block in the San Luis Range (Hall, 1973). The
other segment lies northwest of Estero Bay where folded strata
of the "Miocene unit" crop out in a large, partly fault-bounded
area northwest of Piedras Blancas Point (Plate 1).
The "Pliocene unit" unconformably overlies the "Miocene unit"
and generally appears as a very gently folded to unfolded onlapping
acoustic sequence (fig. 6). The "Pliocene unit" is as much as 3,500 ft
(1,068 m) thick, assuming an acoustic velocity of 6,000 ft/sec, but
thins landward to a few feet (1-2 m) except in areas offshore from Santa
Maria Valley and northwest of Point Buchon (Plates 1 and 3).
The youngest sedimentary unit is believed to have been deposited
upon a late Quaternary (post-Wisconsinan) erosional surface less
than 20,000 years ago (figs. 7, 8, 9). This young unit is fairly
3/ The post-Wisconsinan sediments are well shown only on highresolution records many of which lack definition due to adverse weather conditions. Severe wind chop on the sea surface can make essentially unresolvable the bedding features not only of the post- Wisconsinan sediments but of the older units as well (fig. 8). High wave and swell conditions can also have a deteriorating effect on high resolution records (fig. 9) since the electrical-mechanical system is towed at the sea surface on a pontoon-like device.

widespread (Plate 3), in places covering the entire post-Wisconsinan
surface from near the shoreline to depths of at least 800 ft (244 m).
The thickness of the unit averages about 25 ft (8 m), but is variable
and locally occurs only as lens-shaped bodies that fill areas scoured
by erosion (fig, 10).
Intrusive rocks. A domal feature rises about 60 ft (18 m)
above the seafloor near the center of Estero Bay at an average
depth of about 180 ft (55 m). It is assumed to be an offshore
projection of the linear series of Tertiary intrusives that extend
northwestward parallel to San Luis and Los Osos valleys and culminate
at the shoreline with Morro Rock, as shown by Jennings (1958).
Strata of the "Pliocene unit" seem to lap against its seaward
side; on the landward side it is apparently intrusive into rocks
of the "pre-Cenozoic unit" (fig. 11). If it correlates with Morro
Rock, the nearest onshore intrusive body, its age is probably
Oligocene (Turner and others, 1970; Hall, 1973). Bathymetric
contours on USC&GS Charts 5302 and 5387 show a similarly shaped
feature that is about 2 mi (3 km) to the southwest but is not
on the linear trend of the other instrusives. This circular-shaped
feature extends about 130 ft (40 m) above the seafloor at an average
depth of about 190 ft (60 m). However, since no R/V Kelez profile
intersects it, the subbottom nature of the feature was not determined.
Structure. Faults and folds of generally northwest trend are
common in the study area (Plate 1). The major fault in the area is
the Hosgri Fault, so named from the two authors who first documented
and reported on its existence (Hoskins and Griffiths, 1971).

Records from the R/V Kelez survey indicate that the Hosgri fault
consists of a zone of 2 to 5 splays (fig. 12) that lie 2 to 4
mi (3 to 6 km) offshore from the Diablo Canyon site (Plate 1).
The fault zone extends beyond the area of this report in both
northwest and southeast directions and, according to Hoskins and
Griffiths (1971), has a total length of about 90 mi (145 km).
Apparent vertical offset of the unconformity at the top of the
"pre-Tertiary unit" along the Hosgri fault zone ranges from
possibly 6,000 ft (1,830 m) (fig. 12) to as little as 1,500 ft
(458 m) (fig. 4).
Fault planes commonly appear as vertical surfaces on both
deep penetration (figs. 2-6) and high resolution records(fig. 9).
Onshore mapping has shown that faults of northwest strike commonly
have right-lateral strike-slip movement and near-vertical dip in
coastal California, and nearly all faults of that trend on these
seismic profiles appear to be vertical and are presumed to have
similar slip. However, when noting attitudes of faults (or bedding),
one must take into account the vertical exaggeration of about
6 to 1 and realize that a vertical dip is not necessarily a true
dip, because any dip greater than about 50 degrees will appear to
be vertical on acoustic records with such an exaggeration.
In general, only the vertical sense of fault movement can
be observed on most seismic reflection records; however, evidence
of lateral movement is shown on some high resolution profiles
(fig. 13). This example shows large differences in thickness and

character of correlative units on opposite sides of the faults.
Since strictly vertical movement would displace contiguous parts
of a unit into contact, thickness and character changes would be
minimal. However, changes such as these, where strata of the
"Pliocene unit" (Tp) southeast of fault Y have a thickness of
about 50 ft (15 m) and those northwest of fault Z are only about
10 ft (3 m) thick, can be accounted for best by lateral (strike-
slip) movement. Bedding characteristics also are different,
but these differences are difficult to analyze because of the
apparent wavy character of the seafloor and bedding surfaces.
Several deep penetration profiles show a distinct downward
turning of the upper surface of the "pre-Cenozoic unit" just
seaward of the Hosgri fault zone (fig. 2). The presence of a
4/ fault is suggested by such a downturn, and its position and
relation to overlying strata indicate that it parallels the surface
trace of the Hosgri fault zone (Plate 1).
4/ Downturns commonly occur where two horizontal to gently
sloping units of very different sound velocities are in contact at a moderately dipping or vertical surface such as faulting might provide. Signals transmitted every 3-seconds from the ship, bounce off the steep surface of velocity contrast and are picked up and recorded at the same time interval as though vertically below the ship, but at the acoustic distance from which they came. Only signals from steep surfaces are picked up at considerable distances from the ship (either ahead of or off to the side). Since these signals are plotted as though vertically below the ship as the ship moves toward the source, the recorded vertical distance becomes less and less until a minimum is reached when the ship is vertically above source. The plotted vertical distance then becomes greater as the ship proceeds. In this manner the plotted shape of the steep surface appears on the record as a curve similar to part of a hyperbola. The surfaces shown (fig. 2) could be reflections from .a point source or reflections from curved surfaces.

No paleontologie age data are available for the strata immediately
above this downturn; but probably they are early to middle Tertiary
in age.
Folding in beds of the "Miocene unit" trends generally
northwest-southeast and was apparently developed during a period
of tectonism in middle Miocene time. A second, and more restricted,
period of deformation presumably occurred in late Miocene and
possibly early Pliocene time (figs. 4, 5) and the folds of middle
Miocene age were themselves folded along generally northeast-
trending axes (Plate 1, south of Pt. Piedras Blancas and Pt. Buchon),
Acoustic evidence of recency of faulting. Although most
faults are best observed on deep penetration seismic records, the
most definitive determination of recency of faulting is made from
high resolution records. On these records, offset of the sea
floor in conjunction with offset of bedding reflectors within
the post-Wisconsinan sediments reveals best where young faulting
has occurred. It should be noted, however, that where the sea floor
is not offset and the bedding reflectors in young sediments are
not clearly shown, the high resolution records do not provide
all the necessary information since many faults are not obvious
beneath the young sediments on high resolution records but are
shown clearly only on deep penetration records. Thus, many fault
positions must be projected onto high resolution records from
correlative times on deep penetration records. The projection of
faults from record to record has its difficulties since the area
of the young (and generally thin) sediments seen on the high
resolution records is generally obscured on the deep penetration
profiles because that part of the record is incorporated within
the large first bottom arrival signal (bubble pulse) on the deep
penetration records.
For purposes of this report, faults along which movement has
occurred in the last 20,000 years (post-Wisconsinan time) are
considered active. Evidence of such faulting would include (1)
faults that cut post-Wisconsinan sediments and offset the seafloor,
(2) faults that offset the base of post-Wisconsinan sediments
and some beds within the packet of sediments and (3) faults that
do not offset the seafloor in older beds but are located in shallow
water where wave or current action could have obliterated offsets
occurring in post-Wisconsinan time.
The bubble pulse, which results from oscillation of a bubble of high-pressure gas in sea water, creates a repetitive signal that commonly overrides other acoustic information and masks the geology at the sea floor and at other contacts of considerable velocity contrast on the profile record. The bubble pulse on these R/V Kelez deep penetration profiles averages about 300 ft (90 m) thick. Therefore, high resolution records, which show the upper 300 ± ft (90 ± m) below the seafloor, are clearly needed to fill this gap in information (compare figs. 12 and 18). A similar acoustic velocity override occurs at contacts between geologic units of considerable velocity contrast within the geologic section at depth and creates additional multiples (fig. 2).
10

None of the deep penetration or high resolution R/V Kelez
profiles in the study area show indisputable evidence of seafloor
offset attributable only to faulting. A few high resolution profiles,
however, show evidence that indicates possible offset of the seafloor
in conjunction with possible offset of post-Wisconsinan sediment
(fig. 13-15). At one place, about 2 mi (3 km) northwest of Pt.
Buchon (Plate 1, point A), a gently sloping seafloor separates
two nearly horizontal seafloor surfaces (fig. 13) at water depths
of about 230 and 240 ft (70 and 73 m). The seafloor is directly
underlain by post-Wisconsinan sediments of different thicknesses,
strongly suggesting young faulting. Furthermore, the top of the
"Miocene unit" is offset about 35 ft (11 m) at fault Y and 4 ft
(1.2 m) at fault Z. Offset of the post-Wisconsinan sediments,
however, does not occur at fault Y, but at fault Z where possible
seafloor offset is greatest, but where offset of the top of the
"Miocene unit" is least. One would, nevertheless, expect the
seafloor offset to appear as a near-vertical feature, but since
the water depth, 240 ft (70 m), is within the range of storm-wave
erosion (Komar and others, 1972, p. 612), a vertical surface in
soft sediment could readily be eroded to a sloping surface.
Furthermore, a geophysical profile line that intersected a moderately
sloping surface at an angle of 10-15 degrees, could show that
sloping surface approximately as seen on the profile. As noted
earlier, the difference in character and thickness of the post-
11

Miocene sediments on opposite sides of faults Y and Z (fig. 13)
suggests lateral fault movement. At another place in the map area,
beds of the "Pliocene unit" are cut by a fault that apparently
reaches the seafloor. Offset of the post-Wisconsinan beds is not
clearly shown, but there is a gentle change in level of the seafloor
suggesting offset of the seafloor, with later modification by
erosion (fig. 14). At still another place (Plate 1, point B), the
crossing of (1) a short fault, (2) an erosional escarpment and
(3) a seismic line in rocks of the "pre-Cenozoic unit" led, early
in the study, to the erroneous conclusion that faulting had offset
the seafloor a few miles off the reactor site. Detailed mapping
later revealed that several erosional escarpments occur in the
area and that one escarpment trends across the seafloor exactly
where the fault and the geophysical line cross (Plate 3, point B).
Since this fault does not offset the seafloor on any other
geophysical line, it seems probable that the escarpment is due to
erosion, not faulting.
Other high resolution records (figs. 15-18) show no offset of
the present seafloor, but some show possible offset of an older
seafloor. In Figure 15, strata of the "Pliocene unit" are cut by a
fault of the Hosgri zone at a depth of 340 ft (104 m), but no offset
of the present seafloor is seen. Figures 16 and 17 also show no
offset of the present seafloor, but a relatively abrupt rise in
the seafloor beneath the post-Wisconsinan sediments is notable.
The rise could be erosion- or fault-controlled. In a third example
12

the sediment is shown with sufficient clarity to determine that
a few feet of offset within the sediment unit has taken place
(fig. 18). Some of these areas of thinning can be directly
related to faults of the Hosgri fault zone (figs. 13, 14, 16,
17, 18). On several other high resolution records, however, the
base of the post-Wisconsinan sediments continues undisturbed at the
projection of the Hosgri fault zone (fig. 9). It is certain,
therefore, that post-Wisconsinan sediments are not offset on some
profiles, are offset on others, and may merely cover erosional
escarpments on an old seafloor on others. In any event, the
coincidence of the positions of abrupt thinning and the Hosgri
fault zone strongly suggests a fault relationship.
Earthquake epicenters. W. H. Gawthrop (written communication,
August, 1974) has provided replotted locations of many offshore
earthquake epicenters in the study area (Plate 1). Only those
earthquakes that have occurred since mid-1939 and with magnitudes
greater than 1.5 have been shown. He estimates a location
accuracy for the earthquake epicenters of ± 5 km. It is interesting
to note that most of the earthquake epicenters plot in the northern
part of the area, but that one of the most recent occurred in
1969 in the Estero Bay area.
Bathymetry offshore from the San Luis Range. The seafloor off
the San Luis Range slopes gently seaward to about 390 ft (115 m)
deep beyond which there is a general steepening of the slope.
13

Between depths of 150 ft (46 m) and 340 ft (104 m) the gentle
slope is broken by a number of locally steep escarpments ranging
in height from 6 to 40 ft (2 to 12 m). A relatively detailed
bathymetric map has been prepared for the area offshore from the
San Luis Range in order to answer the following questions:
1. Are the escarpments seen on high resolution profiles
areally related?
2. If related, how many terrace-related escarpments are
present?
3. What is the relation of escarpments to faulting?
4. Do escarpments provide indications of post-
Wisconsinan structural movement?
The bathymetric map (Plate 4) was developed by using sub-
bottom acoustic reflection profile data from the U.S. Geological
Survey and the Pacific Gas and Electric Co., and from depth
figures shown on the U.S. Coast and Geodetic Survey charts 5302 and
5387. A 5 m (16 ft) contour interval was used because a greater
interval did not show seafloor features related to the gently
seaward sloping terraces and erosional escarpments (fig. 19). In
preparing the bathymetric map, the positions and depths of the
escarpments were plotted directly onto the map sheet from acoustic
profile data and, during the plotting, correlations were made
from profile to profile. Segments of eight well-defined escarpments
could be correlated for distances of one to three miles on the
14

bathymetric map but over greater distances correlation was uncertain
because the relation of escarpment to bathymetric contour was
obscure. Also, large rock outcrops in places formed escarpment-
like features and broke terrace levels (fig. 19), and in other
places hard sedimentary units created barriers between which terrace-
like constructional features composed of post-Wisconsinan sediment
accumulated (fig. 10).
In order to extend laterally the correlations of erosional
escarpments, a diagram (fig. 20) was developed in which the
vertical heights of the escarpments were projected perpendicularly
to a plane aligned generally parallel to the escarpment trends
and plotted at a very great vertical exaggeration (800 to 1).
Several correlations of the bases of the escarpments are possible,
but the one chosen employs the data from the acoustic profiles as
a basic point of departure, uses the largest number of points,
and requires the smallest number of erosional escarpments (fig. 20).
Thus, it appears that eight escarpments are present and that the
upward warping reflects late Quaternary structural movement.
Their relation to the Hosgri fault zone is not yet completely
understood.
Summary and Conclusions
The geologic maps that resulted from interpretation of both the
high resolution and deep penetration seismic records indicate the
presence of a zone of faulting that includes 2 to 5 branches and
extends from the northern end to the southern end of the study area.
15
This fault zone' (Hosgri) has been mapped beyond both ends of the
area (Hoskins and Griffiths, 1971) and is about 90 mi (145 km)
long. Large variations in thickness (and different acoustic character
istics) of age-correlative units across parts of the Hosgri fault
zone indicate lateral movement on some of the faults. Several
thousand feet of vertical movement also occurs locally along the
.Hosgri zone.
Several high resolution profiles suggest offset of a pre-
Wisconsinan seafloor and possible offset of post-Wisconsinan
beds; others show no offset of the base of the post-Wisconsinan
beds at locations of faults of the Hosgri zone plotted from deep
penetration profiles. Thus, these data are contradictory as to
recency of faulting. Positions of earthquake epicenters and recency
of activity add information pertinent to the seismic- stability of
the region. All data taken together suggest that activity along
the Hosgri zone and other offshore faults has taken place, at
least locally, in Post-Wisconsinan time in the area studied. The
additional seismic reflection data that became available in July,
1974, will be interpreted, evaluated and compared with the
results shown in this report.
16

References
Hall, C. A., 1973, Geologic map of the Morro Bay South and Port
San Luis Quadrangles, San Luis Obispo County, California: -.T.f
U.S. Geol. Survey Map MF 511, scale 1:24,000.
Hoskins, E. G., and Griffiths, J. R., 1971, Hydro'carbon potential
of Northern and Central California offshore: Am. Assoc.
Petroleum Geologists Memoir 15, p. 212-228.
Jennings, C. W., 1958, Geologic map of California [Olaf P. Jenkins
ed., San Luis Obispo sheet]: California Div. Mines., scale
1:250,000.
Komar, P. D., Neudeck, R. H., and Kulm, L. D., 1972, Observations
and significance of deep water oscillatory - ripple marks on the
Oregon continental shelf: "p. 601-619 ill Swift, D. J. P., 1972,
Shelf sediment transport: Process and pattern: Dowden,
Hutchinson and Ross, Inc. Stroudsbrug, Pa., 656 p.
Turner, D. L., Surdam, R. C., and Hall, C. A., 1970, The Obispo
Formation and associated volcanic rocks in central California
Coast Ranges K-Ar ages and biochronologic significance: Geol.
Soc. America Abstracts with programs, Cordilleran Sec., 66th
Annual Meeting, v. 2, no. 2, p. 155.
Wagner, H. C., 1974, Acoustic reflection profiles, Cape San Martin
to Pt. Sal offshore area, south-central California: U.S.
Geol. Survey Open-file report, 27 p.
17
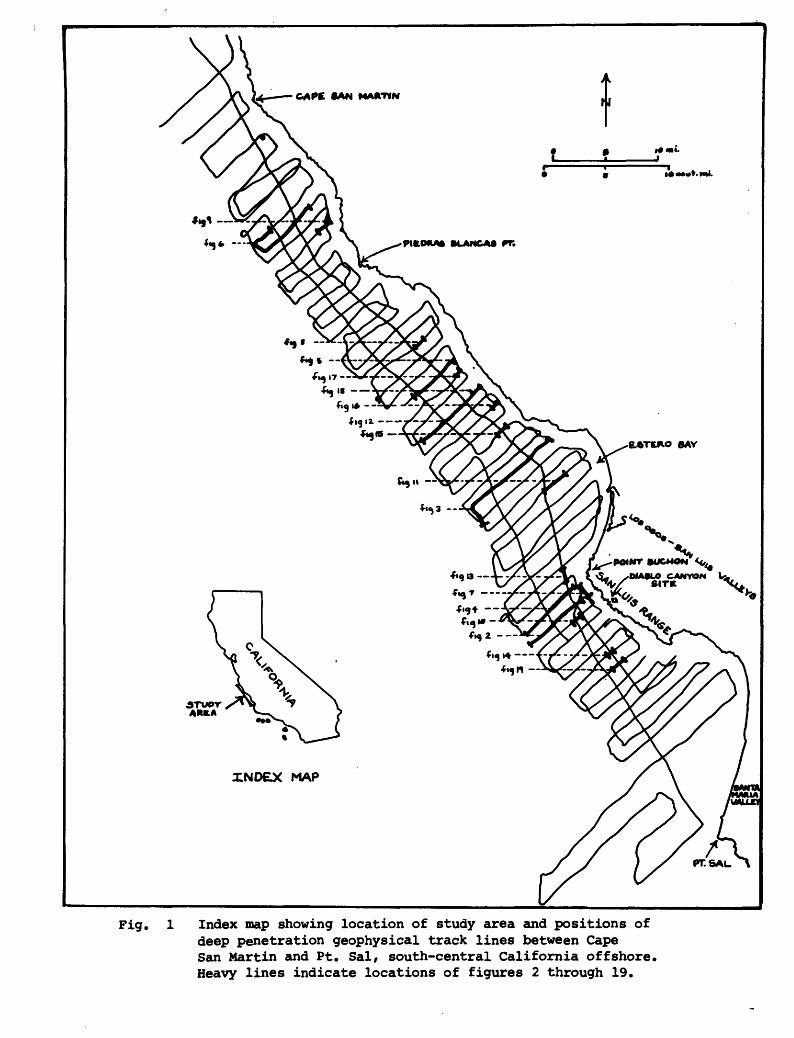
Fig. 1 Index map showing location of study area and positions of deep penetration geophysical track lines between Cape San Martin and Pt. Sal, south-central California offshore. Heavy lines indicate locations of figures 2 through 19.

Fig. 2 Annotated subbottom acoustic reflection profile showingcharacter of the "pre-Cenozoic unit" (Mz), "Miocene unit" (Tta), and "Pliocene unit" (Tp).

Pig*
3
Acou
stic
cha
ract
er o
f contact between
"pre-Cenozoic
unit
" (M
z) an
d younger
rock
s.

HOS6RI FASfLT ZONE
Pig, 4 "Miocene unit" (Tm) as it commonly appears on deep penetra tion seismic reflection records.

SW Mo5(r« KZ. N E
Fig. 5 Folded and truncated beds of the "Miocene unit" (Tm) overlain by gently dipping beds of the "Pliocene unit' (Tp).

"Z
iim
iTi
-.
''.'".
~~
^:^^-
r-'~
^''~
~~
"r'^
---~
"r~
~: ^:~
-'~
"-
r-^~
^
^^^^
mm
^^^'
^^^^
^^^^
^^^^
^
? ''
.'/:
£-:-
;
. <'-
, /
/..-.-
.; .
.,
/ -.^
; -
:: ..
".
, .:
"^v*
;:.'\v
< ^
;--'«
'V-./
.vc
:>^r
^--^
'^!.x
-/rriv
';;:.';v
'^ ' ^
-r-x
/--':
^ -
:..;' .
. ^
. .:
''...-.
:%:--
.".---
-.^-."
.t1'-,
. . :.
. -.
--:.:
r-. ;-
' .
-: ;
.'.- V
v:;-.
;?'^
'"'^.
-.--.:
/''';:.
-';
>V
;V;'r
^^
Fig
. 6
Onl
ap re
lati
onsh
ip o
f st
rata
of
the
"Pli
oce
ne
un
it"
(Tp)
up
on t
he
"Mio
cene
u
nit
" (T
m).
=» *
7~ ~c *
-"-
5-s-r-: * »»= r-r
-t*
BH^;
:^fH
^Thf
i^
Fig.
7
Post-Wisconsinan(?)
sedi
ment
s (Q
) ov
erly
ing
truncated
older
beds
of
Oli
goce
ne(?
) ag
e.

..
.--.
;:
Fig.
8 Effect of
wind
chop
up
on a record showing po
st-W
isco
nsin
an
sedi
ment
s (Q
) ov
erly
ing
trun
cate
d beds of
th
e "Miocene

. .
. .
. .
....
, - ; ;
: ! '!.; .;
; ' r .
'
j ',:
..'s..
!liJ!
:!:iJ
:!r!
!liii
!:!'i!
;i :'-
-.- :
: \,
..!:..: ;
-;-;i-
' V
ij-l'.
'-V
-
:;^!;
:-U
'ii::!
;;i>:
::;^
. |
; i
! :
: :
j : :
i !-i
'
.
' '
. ..
.- .
;..-
| .':,:: : ''
'' ':
i :
' :
:.
!-|!.I
'!
: '
'.] i
i
.
' 1
-':"
':
; .
: "
' -.
' .
!
..' '.
}.:''
:'
: '
"
: ;
: ' ' -
'I -j
; :'
' '
;.':
''
'.' '.
. ''
' .' '
' '.'
'. '
i {
: '
'-
:
'
; '
]'
; ;
:
: ' .
'. .
-.:.:.
-\\-
'n;H;
i!-KI
:ih;^H
!
i-^iijl
liJiii-
'ns.
njjiij
j!!,
*-»
r-
T ^
i
i
*'
iliiii! m
?-'
' /
' "
;; ;
' -:r
/::-:
-, .:;
.
iji; i
!ii:i:
;;i;i:
i:;i;
;i:;i
\* it:
'. '. }
; ; ; :
: =-.: u
j; :;
; :
lilii!
1
im im^
; i
i ! :
. :
Hj; m im e
^&
sl.J*%
C4
; i
!i iL
Sfc^^SKK
5'.^^^.";^^^^
Fig.
9
Post-Wisconsinan se
dime
nts
(Q)
overlying tr
unca
ted
and
faul
ted
beds
of
the
"Mio
cene
unit"
(Tm) and
"pre-
Cenozoic un
it"
(Mz).
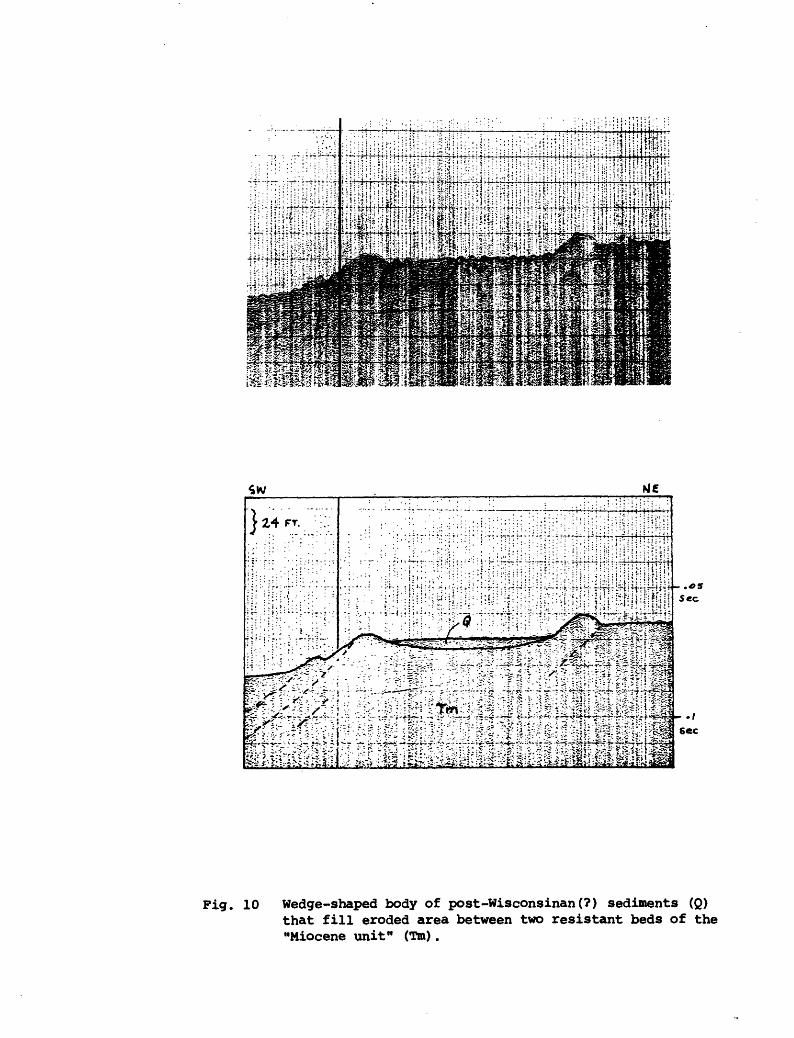
Fig. 10 Wedge-shaped body of post-Wisconsinan(?) sediments (Q) that fill eroded area between two resistant beds of the "Miocene unit" (Tm).

HrlMiMiiM3iig.yy.iiK*,- *Mmn ***>»&_tjmx*mrj\ V^^i^MlliMiiiiM,^!,,^!*'...! ass
Fig. 11 Probable Tertiary intrusive in Estero Bay.
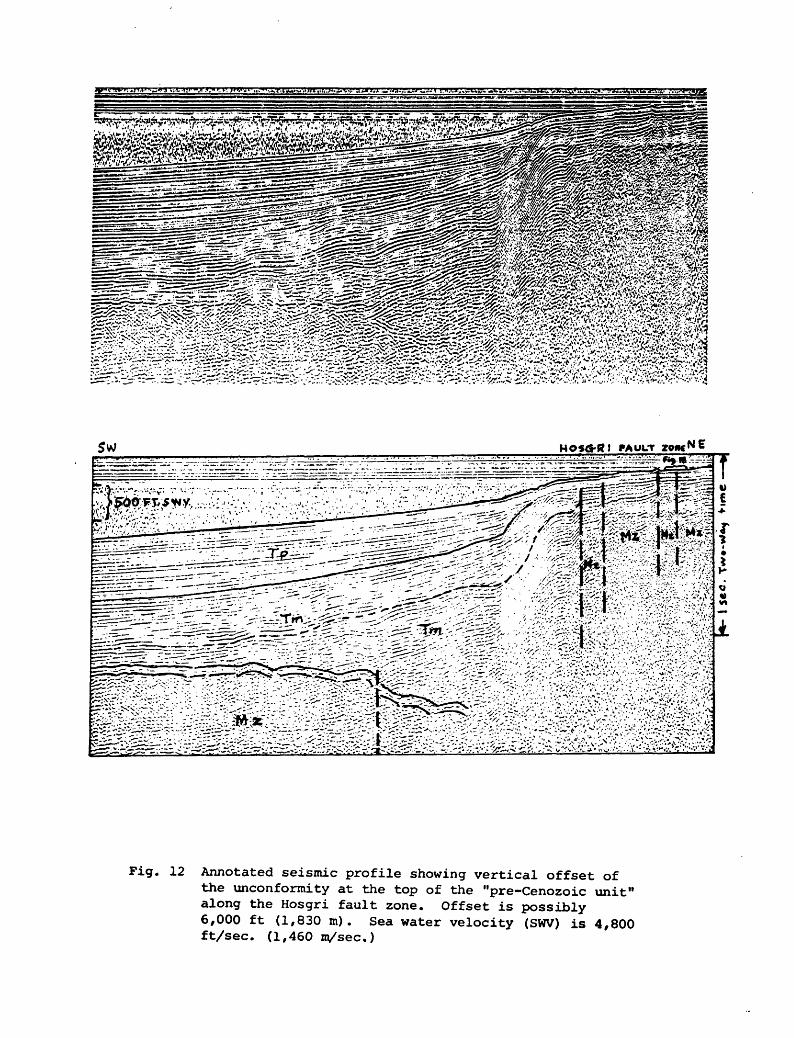
Fig. 12 Annotated seismic profile showing vertical offset ofthe unconformity at the top of the "pre-Cenozoic unit" along the Hosgri fault zone. Offset is possibly 6,000 ft (1,830 m) . Sea water velocity (SWV) is 4,800 ft/sec. (1,460 m/sec.)

Fig.
13
Fault
zone cu
ttin
g truncated
beds
of
the
"Mio
cene
unit"
(Tm)
an
d ov
erly
ing
sedi
ment
s; se
aflo
or possibly
offset.

' ?- i::.
: -.ISec.
Fig. 14 Probable offset of post-Wisconsinan sediments (Q) directly above fault in older rocks. Seafloor possibly deformed.

, .
.....;.i.
=;!:.!!i':
=!. ! .....; ;
=:!:
:
;;;:.I.
::::
::-
r^i'"!:
'"i.-;
: ':
'.. jj
j::
:::;::
?:;:J
?|»
!"»?
I _
\j .
:-?-;l
ij;?
§:J'i.!:
:i::;Ji
;'::ii
..ri^-
=:iM
.r;i;;
jSij^^
iiSS
ij||||
||iJ^^^fr
^!?
?^:^
;!^
WS
;^-s
;A-i^
;MW
S;s
feii»
li!
;:'-y
^-ti.
;j.'V
^:-:
;-:'«
;;;l|5
:::hi
i:-i^
:;-J-
:r:--|
lii
:!:
.:;.^
;:';-
.^.;
. :,
;.;,_
:-;;;
; -r
.:-
_ .; ;
:,;;.;
;.;;:
;::
Fig.
15
Fault
cuts b
eds
of t
he "P
lioc
ene
unit"
(Tp) an
d reaches

LyiL'tiii!*v ' *\ 't' .', ' ' -.' ';';'< :
>." [ ' "n -. ,'.Tvj.^-''^"l; u !
ffi^f^fS^^ ^
^^^iillsrSlMlis
Fig. 16 Abrupt thinning of post-Wisconsinan sediment (Q) at old escarpment; possible fault.

Fig. 17 Abrupt thinning of post-Wisconsinan sediment (Q) at old escarpment; possibly faulted. Suggestion of faulting in older beds.

S«c.
I See.
Fig. 18 Abrupt thinning of post-wisconsinan sediment (Q) at old escarpment; probably faulted.

.: _
. : :
r-; : ,
.;.:
.:
. - ~ ^T: ; '
, -, ; "
^ ~ ~
Fig. 19
Se
aflo
or terraces separated
by erosional
feat
ures
.

- lorn
-I I
v«rtic&t C
I I
I Km
I II
l|
o-t tow* ftoo; j
NOTE: Each, vertical line represents -Hie
Oop +o base) of ait eycarpmervt- cro5$)ng that is shoiun on a higK-Ke$olot'ion ;e is true hue. Escarpments w«re projected perpendtco lar l^
plane «li^n«d par«x»Ul -f0 escarp wantfo
- 9om i ,
V
. ^
_L
1
|
IT
Fig. 20 Relative positions of bases of escarpments offshorefrom the San Luis Range, and their possible correlation.