Marginal/Incremental Cost Pricing for Water & Drought...
33
Marginal/Incremental Cost Pricing for Water & Drought Pricing THOMAS W. CHESNUTT, PH.D., CAP ® [email protected] 760.942.5149 A&N TECHNICAL SERVICES, INC. 839 Second Street, Suite 5, Encinitas CA 92024
Transcript of Marginal/Incremental Cost Pricing for Water & Drought...

Marginal/Incremental Cost Pricing for Water & Drought Pricing
THOMAS W. CHESNUTT, PH.D., CAP®
[email protected] 760.942.5149
A&N TECHNICAL SERVICES, INC.839 Second Street, Suite 5, Encinitas CA 92024

Marginal/Incremental Cost Pricing for Water & Drought Pricing
Do Costs Matter? Are Costs Changing?How can Marginal/Incremental Costs help
(Long Term Efficiency)?What about Droughts and Drought Pricing?

Costs Matter: CPI trends for Utilities

WATER FLOW AND FLOW OF ECONOMIC LOGIC
SystemDesign
Costs
Water Rates
Demand
Source: Beecher IPU/MSU

How can Marginal/Incremental Costs help? Communicating Long Term Costs to Customers
Understanding Marginal/Incremental Costs helps the Utility Marginal/Incremental Costs are at the heart of cost avoidance
Communicating Marginal/Incremental costs inform customers Price response is a two-way street
Customers communicate to the Utility if additional production is worth it
Drought Pricing Prudent financial planning requires accounting for foreseeable future outcomes. If water utilities request customers to cut back water use during a drought
emergency, the effects on volumetric revenue and volumetric costs are predictable.
Drought pricing incorporates water rates into drought/shortage planning.

WATER RATES, EFFICIENCY, AND REVENUE
($7.00)
($6.00)
($5.00)
($4.00)
($3.00)
($2.00)
($1.00)
$0.00
$1.00
$2.00
2007 2008 2009 2010 2011 2012 2013 2014 2015 2016 2017 2018 2019 2020 2021 2022 2023 2024 2025 2026 2027 2028 2029 2030 2031 2032 2033 2034 2035 2036
Ch
ang
e fr
om
Bas
elin
e A
vg.
Bil
l ($
/mo
nth
)
Year
Impact to Average Water Bill
Change in Average Bill Annualized Impact
Water Rates: A Balancing Act for Water Utilities Revenue Generation-(to pay prudent costs) Resource Efficiency-(to avoid consumptive or productive waste) Fiscal Sustainability-(for sustainable water service delivery)
(Other details include Customer Acceptance, Affordability, Legality, etc.)
Do Nothing
Do Water Efficiency
Customer Bills

Conservation Pricing - Issues/Concerns
Understand Objectives - Long-Term or Short-Term Users face cost consequences of consumptive behavior Long term conservation programs (investment) vs. Short term shortage management (minimizing shortage costs)

Building a Better (Efficient) Rate Structure
Identify and Prioritize Ratemaking Objectives
Determine Revenue Requirements Allocate Costs Design A Rate Structure Evaluate the Rate Structure against
Objectives Deciding on a Rate Structure
Specific CostsJoint Costs
Annual Rate Revenue Requirements
Allocation to System Functions
Allocation of Functions as Joint or Specific Cost Categories
Classification of Costs by Service Characteristics
Allocation to Customer Classes
Design of Rates & ChargesBy Customer Class

Conservation Pricing - Issues/Concerns
Once Size Does Not Fit All a single rate structure may not work for all classes of service
one class with large variation in size and uses
Potentially Viewed by Customers as Punitive Communication issue about accuracy of price signal
Customer’s Ability to Modify Behavior/Usage Target programs – make your programs work for you

Efficient Pricing
Water rates can be used to communicate to water users the private and social costs of water scarcity.
Water users can then base their consumption decisions on a more accurate accounting of the benefits and costs of using more or less water.
If done correctly, the pricing of water can be a powerful means of signaling the cost and scarcity of the resource to water users.

BETTER WATER RATES – EFFICIENCY AND SUSTAINABILITY
Water Efficiency can improve prospects for fiscal sustainability as water utilities redefine the changing level of “water service” that their customers demand.The “service capacity” of a water utility to deliver various water services can be crippled or enabled by its “financial position”. Fiscal sustainability is a government’s ability and willingness to
generate inflows of resources necessary to honor current service commitments and to meet financial obligations as they come due, without transferring financial obligations to future periods that do not result in commensurate benefits.
See, Preliminary Views of the Governmental Accounting Standards Board on major issues to Economic Condition Reporting: Financial Projections. No 13-3, Nov 29, 2011 http://www.gasb.org/cs/ContentServer?site=GASB&pagename=GASB%2FDocument_C%2FGASBDocumentPage&cid=1176159500453

The Price Charged for Water Affects the Demand for Water.
Water Demand is Relatively Unresponsive (inelastic) to Changes in Water Prices. Lack of substitutes Low price for water
The Long-run Response is Greater than The Short-run Response.
The issue is not whether prices affect use, but rather how much prices affect use.
EFFICIENCY AND PRICING

Understand Objectives - Long-Term or Short-Term Users face cost consequences of consumptive behavior Long term Water Use Efficiency programs (investment) vs. Short term shortage management (minimizing shortage costs)Once Size Does Not Fit All a single rate structure may not work for all classes of service
one class with large variation in size and uses
Potentially Viewed by Customers as Punitive Communication issue about accuracy of price signal
Customer’s Ability to Modify Behavior/Usage Target programs – make WUE programs work for your customers
EFFICIENT PRICING - ISSUES/CONCERNS

AFFORDABILITY OF WATER SERVICE US Conf. of
Mayors/AWWA Report Average Bills less than
some fraction of median income in community (USEPA) does not guarantee “affordability.”
Flaw of Averages Need in depth and
informative understanding of affordability.
See AWE Sales Forecasting and Rate Model for an example

LONG TERM RISK- AVERAGE OUTCOME VS. LIKELY OUTCOMESFlaw of Averages Fact 1 – Planning for the future is rife with uncertainties. Fact 2 - Most people are not happy with Fact 1 and prefer to
think of the future in terms of average outcomes. Fact 3 - The “flaw of averages” states that plans based on
average assumptions are, on average, wrong.
-adapted from Savage (2012) Flaw of Averages
The cyclist is safe on the average path On average, the cyclist is dead.
See probabilitymanagment.org

AWE SALES FORECASTING AND RATE MODEL
Typical water rate models assume that future sales are known with certainty, and do not respond to price, weather, the economy, or supply shortages—that is to say, not the world we live in.
The AWE Sales Forecasting and Rate Model addresses this deficiency:
Customer Consumption Variability—weather, drought/shortage, or external shock
Demand Response—Predicting future block sales (volume and revenue) with empirical price elasticity's
Drought Pricing—Contingency planning for revenue neutrality
Probability Management—Risk theoretic simulation of revenue risks
Fiscal Sustainability—Sales forecasting over a 5 Year Time Horizon
Affordability-Can customers afford water service?
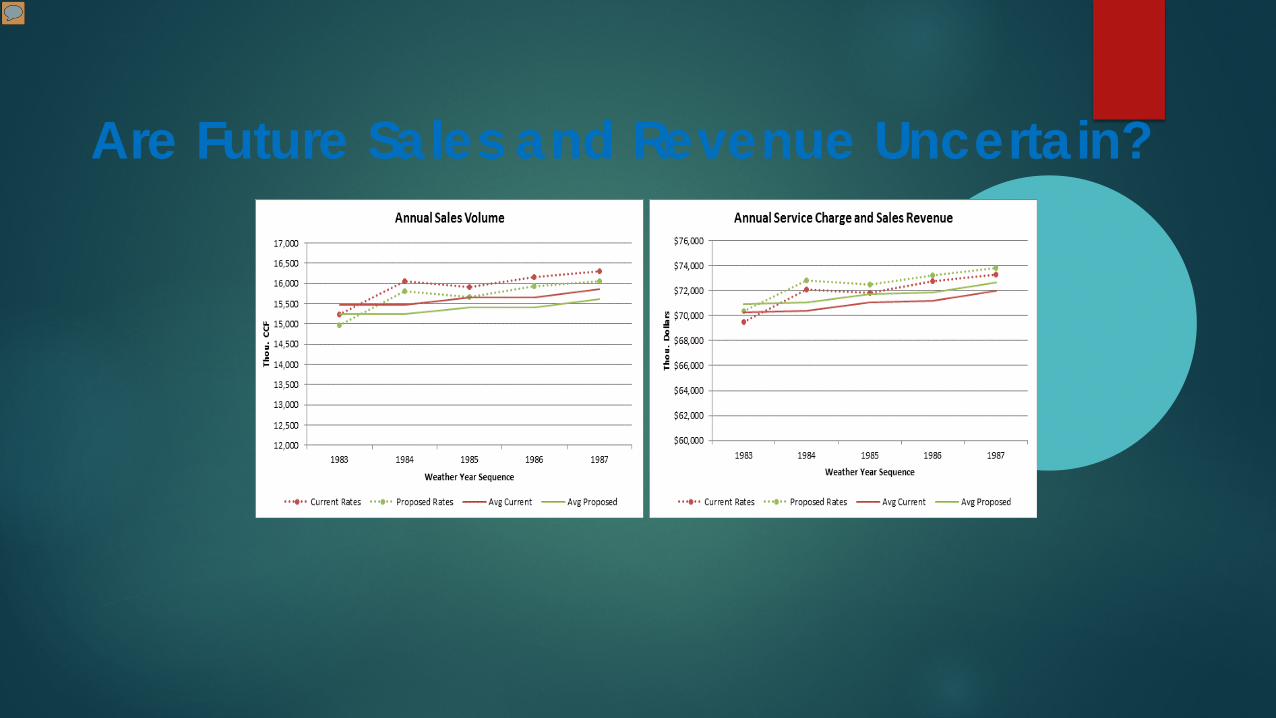
Are Future Sales and Revenue Uncertain?
Presenter
Presentation Notes
Note! This is an animated GIF. It will move when displayed.

HEDGING AGAINST REVENUE RISKS FROM VOLATILITY
Better Revenue PredictionChanging to more fixed revenue generation
political risks for customer disempowerment and affordability cost.Contingency funds
Including a reserve fund, a rate stabilization account, or the nest egg for (too many) rainy days.
Inclusion of a risk margin in the determination of revenue requirements
Contracts for Drought Derivatives (in which there is a thriving market for farmers)
Adjustment of rates on a more frequent basis.

Recall the default coping mechanism lies on the cost sidedeferring capital investment, laying off personnel, or avoiding expenditures on needed maintenance. Involuntary adjustments to agency expenses can disrupt the ability of water utilities to fulfill their mission of providing reliable, quality water service.Crisis-driven cutbacks can be avoided with better rate
design for an uncertain world.
HEDGING AGAINST REVENUE RISKS FROM VOLATILITY

Incremental/Marginal Costs
Direct Water Utility Avoided Costs Are only part of the picture
Wastewater Avoided CostsStormwater BenefitsEnvironmental Benefits

Planning Tools

Forecasting Avoided Water Costs
$0
$500
$1,000
$1,500
$2,000
$2,500
$3,000
$3,500
$4,000
$4,500
Avoi
ded
Cos
t ($
/mg)
Year
Total Direct Avoided Costs: Real Dollars
Peak Season
Off-Peak Season

Comprehensive Benefits and Costs
Source: Groves, D.G. et al., Estimating the Value of Water-Use Efficiency in the Intermountain West, RAND Tech. Report 504, 2008.

FINANCIAL POLICIES AND PLANNING FOR FISCAL SUSTAINABILITY
Revenues: Water resource efficiency (conservation)Revenue
reduction is bad
O&M expenses: Focus on short-term minimization Rate pressure = sub-optimization
Capital project costing (excludes externalities) Life-cycle costing ≠ TBL
Returns: (GF transfers or Allowed RoR)Economies of
Scale Size Matters
Depreciation expense (based on Historical Costs) Understatement of liability

Drought Pricing Shortages are when, not if. Imposing curtailments on
customers affects revenues This can be planned for,
communicated, and effectively implemented.
Tomch
Stamp

Drought Rates
Evaluate rate performance under water use curtailment Up to 4 drought stages can be specified Curtailment levels can vary by customer class User can design rates “by hand”, OR Use built-in calculator to find revenue-neutral rates by drought stage

Specifying Curtailment Levels
1. Specify Curtailment Levels for Drought/Shortage Stages1. Enter the Customer Class curtailment levels for each stage. If you have fewer than 4 stages, enter the last curtailment level in the unused stages. Stage 0 is the default No
Shortage condition. Do not modify the settings for this stage.2. For each stage, enter the expected compliance rate. The compliance rate can vary by stage. For example, stages with voluntary curtailment may have lower compliance than
stages where curtailment is mandatory and enforced. The expected curtailment level for a stage is the product of the stage's curtailment level and the expected compliancerate.
Drought/Shortage Stage Customer Class Curtailment Levels Table Expected CurtailmentCustomer Class Stage 0 Stage 1 Stage 2 Stage 3 Stage 4 Stage 0 Stage 1 Stage 2 Stage 3 Stage 4Single Family 0% 10% 15% 20% 25% 0% 8% 12% 17% 21%Multi Family 0% 10% 15% 20% 25% 0% 8% 12% 17% 21%CII 0% 0% 10% 20% 25% 0% 0% 8% 17% 21%Landscape 0% 0% 10% 20% 25% 0% 0% 8% 17% 21%Not in use 0% 0% 0% 0% 0% 0%Not in use 0% 0% 0% 0% 0% 0%
Enter Expected Compliance % 100% 80% 80% 85% 85%
Requested curtailment level by stage
Expected compliance rate Expected curtailment

Designing Drought Rates
2. Rate Performance by Drought/Shortage StageThe tables in this section hold two sets of rates. Your proposed rates are carried over from Step 3. These cannot be modified on this worksheet. They provide the point of referencefor calculating the revenue impacts of drought stages. The Stage rates are the rates that would apply for a given drought/shortage stage. To see how your Proposed rates would perform ina drought stage, click the Reset Drought Stage Rates to Proposed Rates. This will copy your Proposed rates into the tables for the Stage Rates. You can then use the Select Drought Stagedrop-down list to cycle through the drought stages and see how your sales revenue would be impacted by each stage. Impacts to annual sales volume and revenue for each Customer Class Select Drought Stageare summarized to the right of the rate tables. You can adjust the Stage Rates to see how your annual sales volume and revenue would respond. You can adjust the size or number of blocksas well as the rates for each block. You can use trial and error to find rates appropriate to each drought/shortage stage, or you can use Excel's goal-seek or solver functionality to do this. Section 3 provides a calculator that can quickly identify rates for a given drought/shortage stage that are revenue neutral. Rate Performance by Customer Class
Single Family Off Peak Season Peak Season Annual Sales VolumeProposed Rates Stage 2 Rates Proposed Rates Stage 2 Rates Proposed Stage 2 % Change
Block Rate Block Rate Block Rate Block Rate CCF 8,913,705 7,844,060 -12.0%(CCF) ($/CCF) (CCF) ($/CCF) (CCF) ($/CCF) (CCF) ($/CCF)
Block 1 5 $2.50 5 $2.50 5 $3.75 5 $3.75 Annual Sales Revenue (Thou. $)Block 2 10 $2.50 10 $2.50 10 $3.75 10 $3.75 Proposed Stage 2 % ChangeBlock 3 15 $2.50 15 $2.50 15 $3.75 15 $3.75 Service $12,263 $12,263 0.0%Block 4 15 $2.50 15 $2.50 15 $3.75 15 $3.75 Volume $27,744 $24,415 -12.0%Block 5 15 $2.50 15 $2.50 15 $3.75 15 $3.75 Total $40,007 $36,678 -8.3%
AnnualSales Volume(% Change)
AnnualService & Volume Revenue
(% Change)
Impact of Drought Stage Rates Relative to Proposed Rates
0
0.2
0.4
0.6
0.8
1
1.2
-50%
-30%
-10%
10%
30%
50%
0
0.2
0.4
0.6
0.8
1
1.2
-50%
-30%
-10%
10%
30%
50%
Rate Design TablesRate Performance
Indicators
Drought Stage Selector

Drought Rate Calculator3. Calculate Revenue Neutral Rates by Drought StageThe revenue neutral rates calculator will quickly find a set of rates for a given drought/shortage stage that will generate the same revenue as your Proposed rates under a no shortagecondition. There are four steps to using the calculator:
1. Choose the drought/shortage stage you want to calculate rates for.2. Choose the method for calculating the rates. There are two choices. The first choice is to adjust your Proposed rates so that each customer class generates the same revenue
it would have generated under your Proposed rates assuming no use curtailment. This may result in significant differences across classes in the amount by which rates areadjusted. The second choice is to adjust your Proposed rates so that all classes when grouped together are revenue neutral. Rates across classes will be adjusted by the sameproportionate amount. Revenue neutrality may not hold for individual classes, but overall revenue will be neutral to the Proposed rates assuming no use curtailment.
3. Complete the Leave or Adjust Rate in Block table below. Choose Leave if you want the rate in the block to be the same as it is for your Proposed rates. Choose Adjust if youwant the calculator to adjust this rate. For example, if you only want to adjust the upper block rates, choose Leave for lower blocks and Adjust for upper blocks. If you havefewer than 5 blocks, set the unused blocks to the same setting used for your last block.
4. Make desired adjustments to the block widths for the Stage Rates in the Stage Rates tables above.5. Click the Find Revenue Neutral Rates button.
Note: The calculator will overwrite the rates that are in the Stage Rates tables above. If you want to preserve these rates, save them as a rate scenario by clicking the Save/Load Ratesbutton before using the calculator.
Choose Drought Stage to Evaluate:
Choose Method for Calculating Revenue Neutral Rates:
Leave or Adjust Rate in Block?
Class Block 1 Block 2 Block 3 Block 4 Block 5Single Family Leave Adjust Adjust Adjust AdjustMulti Family Leave Adjust Adjust Adjust AdjustCII Leave Adjust Adjust Adjust AdjustLandscape Leave Adjust Adjust Adjust AdjustNot in use Leave Leave Leave Leave LeaveNot in use Leave Leave Leave Leave Leave
Find Revenue Neutral Rates
Reset Drought Stage Rates to Proposed Rates
Save/Load Rates

Drought Let’s talk probability and evidence What is the probability of a more than one decade-
long drought? …Where? When? In the Southwest US Within a 50 year period,
1950 to 2000?
Or better 2050-2099?
Odds and “P” Value1 in 100 ≡ P011 in 10 ≡ 10 in 100 ≡ P101 in 5 ≡ 20 in 100 ≡ P20
50

Answer - P80 [I’m not making this up.]
advances.sciencemag.org/content/advances/1/1/e1400082.full.pdf
This will be on the test…new vocabulary
• Megadrought• Semi-permanent drought
51
Presenter
Presentation Notes
Fig. 1. Top: Multimodel mean summer (JJA) PDSI and standardized soil moisture (SM-30cm and SM-2m) over North America for 2050–2099 from 17 CMIP5 model projections using the RCP 8.5 emissions scenario. SM-30cm and SM-2m are standardized to the same mean and variance as the model PDSI over the calibration interval from the associated historical scenario (1931–1990). Dashed boxes represent the regions of in-terest: the Central Plains (105°W–92°W, 32°N–46°N) and the Southwest (125°W–105°W, 32°N–41°N). Bottom: Regional average time series of the summer season moisture balance metrics from the NADA and CMIP5 models. The observational NADA PDSI series (brown) is smoothed using a 50-year loess spline to emphasize the low-frequency variability in the paleo-record. Model time series (PDSI, SM-30cm, and SM-2m) are the multimodel means averaged across the 17 CMIP5 models, and the gray shaded area is the multi-model interquartile range for model PDSI. Fig. 5. Risk (percent chance of occurrence) of decadal (11-year) and multidecadal (35-year) drought, calculated from the multimodel ensemble for PDSI, SM-30cm, and SM-2m. Risk calculations are conducted for two separate model intervals: 1950–2000 (historical scenario) and 2050–2099 (RCP 8.5). Results for the Central Plains are in the top row, and those for the South-west are in the bottom row.

Financing Sustainable Water Building Better Rates in an
Uncertain World: A Handbook to explain key concepts, provide case studies and implementation advice
AWE Sales Forecasting and Rate Model: An innovative, user-friendly tool to model scenarios, solve for flaws, and incorporate uncertainty into rate making
FinancingSustainableWater.org: Web-based resources to convene the latest research and information in one location

Marginal/Incremental Cost Pricing for Water & Drought Pricing
THOMAS W. CHESNUTT, PH.D., CAP®
[email protected] 760.942.5149
A&N TECHNICAL SERVICES, INC.839 Second Street, Suite 5, Encinitas CA 92024