March 2018 NDIS Performance Report - NAT · Early Intervention supports for early childhood...
42
National - 31 March 2018 Quarterly Performance Report Disability Reform Council COAG
Transcript of March 2018 NDIS Performance Report - NAT · Early Intervention supports for early childhood...

National - 31 March 2018
Quarterly Performance ReportDisability Reform Council
COAG

COAG Disability Reform Council Performance Report - National 31 March 2018 2
This report is the seventh quarterly report during the NDIS Transition period, which commenced on 1 July 2016.
PARTICIPANTS & PLANNING
PROVIDERS & MARKETS
COMMITTED SUPPORTS & PAYMENTS
INFORMATION, LINKAGES &
CAPACITY BUILDING
MAINSTREAM INTERFACE
FINANCIAL SUSTAINABILITY
Overview

Executive summary
COAG Disability Reform Council Performance Report - National 31 March 2018 3
SummaryParticipants and Planning
Committed Supports and Payments
Financial Sustainability
Providers and Markets
Information, Linkages and Capacity Building
Mainstream Interface
19,228 additional participants with plans this quarter.
As at 31 March 2018, plans approved and ECEI referrals represent:• 70% of year to date bilateral estimate met (1 July 2017 - 31 March 2018)• 78% of scheme to date bilateral estimate met (1 July 2013 - 31 March 2018)
Satisfaction rating remained high with 84% of participants surveyed in the quarter rating their satisfaction with the Agency's planning process as either good or very good.
$6.4 billion has been paid to providers and participants since Scheme inception.
Overall, • 64% of committed supports were utilised in 2013-14, • 75% in 2014-15,• 75% in 2015-16,• 66% in 2016-17.2017-18 experience is still emerging.
Lower utilisation in 2016-17 is predominantly driven by the large number of participants who received their first plan in this year. Participants utilise less of their first plan compared with their second and subsequent plans, as it takes time to familiarise with the NDIS and decide which supports to use.
14,271 approved providers, a 16% increase for the quarter.
80-90% of payments made by the NDIA are received by 25% of providers.
43% of service providers are individual/sole traders.
The NDIS Insurance approach allows pressures on the scheme to be identified early and management responses put in place to respond to these pressures. This actuarial monitoring occurs continuously and allows management to put in place strategies as required.
Specific strategies include: - Participant and provider pathway review- Early Childhood Early Intervention (ECEI) - Typical support packages- Increased risk-based quality assurance - Increased staff training.
The NDIA is developing an ILC Investment Strategy aimed at ensuring ILC funds are used most effectively in supporting people with disability in the community to guide ILC investment from full scheme in 2019-20.
A second national readiness grants round and a grant round for the delivery of ILC activities in NSW, SA and the ACT from 1 July 2018 was run in late 2017, with announcements due by the end of May.
91% of active participants with a plan approved in 2017-18 Q3 access mainstream services.

National - 31 March 2018
PART 1
Participants and Planning
As the transition phase to full scheme continues, the NDIS nationally continues to grow with 19,228 additional participants with approved plans this quarter.

PART 1 - Participants and Planning
COAG Disability Reform Council Performance Report - National 31 March 2018 5
The NDIS is transitioning to full-scheme according to phasing schedules bilaterally agreed by State/Territory and Commonwealth governments.
Summary
Key Statistics
ACCESS DECISIONS IN 2017-18 Q3 (INCLUDING BOTH ACCESS MET AND ACCESS NOT MET)
37,373INITIAL PLANS APPROVED IN 2017-18 Q3
OF THE 19,228 INITIAL PLANS APPROVED THIS QUARTER, 3,220 WERE PREVIOUSLY CONFIRMED AS ECEI AT 31 DECEMBER 2017
19,228ADDITIONAL CHILDREN WITH A CONFIRMED ECEI GATEWAY REFERRAL IN 2017-18 Q3
4,186
OF SCHEME TO DATE BILATERAL ESTIMATE MET (1 JULY 2013 - 31 MARCH 2018)
78%OF PARTICIPANTS WITH AN INITIAL PLAN APPROVED IN 2017-18 Q3 HAVE A REPORTED PRIMARY DISABILITY OF AUTISM
28%OF PARTICIPANTS WITH AN INITIAL PLAN APPROVED IN 2017-18 Q3 ARE CHILDREN AGED 7 TO 14 YEARS
21%OF TRANSITION TO DATE BILATERAL ESTIMATE MET (1 JULY 2016 - 31 MARCH 2018)
75%
OF YEAR TO DATE BILATERAL ESTIMATE MET (1 JULY 2017 - 31 MARCH 2018)
70%

PART 1 - Participants and Planning
COAG Disability Reform Council Performance Report - National 31 March 2018 6
Of the 26,429 participants deemed 'eligible' this quarter 54% entered from an existing State/Territory program.
Of the 19,228 plan approvals this quarter, 61% had transitioned from an existing State/Territory program, 85% entered with a permanent disability and 3,220 were previously confirmed as ECEI at 31 December 2017.
2017-18 Q3
Quarterly Intake
9,684
14,318
2,427
New
State/Territory
Commonwealth
Participant Entry point
ACC
ESS
MET
PLAN
AP
PRO
VALS
5,335
11,775
2,118
4,186
New
State/Territory
Commonwealth
ECEI
Participant Entry point
2,854
16,374
4,186
Early Intervention
Permanent Disability
ECEI
Participant Pathway type
access decisions
37,373
access met
26,429
planapprovals(excluding ECEI)
19,228
ECEI4,186

PART 1 - Participants and Planning
COAG Disability Reform Council Performance Report - National 31 March 2018 7
Plan approval numbers have increased from 132,742 at the end of 2017-18 Q2 to 151,970 by the end of 2017-18 Q3, an increase of 19,228 approvals.
As at 31 March 2018 there were 10,253 children with a confirmed ECEI referral bringing the total number to 162,223. Overall, 3,017 participants with approved plans have exited the Scheme.
Of the 10,253 children with a confirmed ECEI referral as at 31 March 2018, 6,067 were previously confirmed as ECEI at 31 December 2017 and an additional 4,186 entered the gateway this quarter.
Change in plan approvals between 31 December 2017 and 31 March 2018
Plan approvals as at 31 March 2018
Quarterly Intake Detail
In the quarter of 2017-18 Q3 there were 30,362 plan reviews. This figure relates to all participants who have entered the scheme.
19,228
132,742151,970
10,253
162,223
-3,017
159,206
0
20,000
40,000
60,000
80,000
100,000
120,000
140,000
160,000
180,000
Participantplans approved
as at31 December
2017
Plan approvalsin
2017-18 Q3
Total participantplans approvedas at 31 March
2018
ECEI confirmedas at
31 March 2018
Participantplans approved
(includingECEI) as at 31
March 2018
Total exits as at
31 March 2018
Activeparticipants
with approvedplans (including
ECEI) as at31 March 2018

PART 1 - Participants and Planning
COAG Disability Reform Council Performance Report - National 31 March 2018 8
Plan approvals as at 31 March 2018
Cumulative plan approvals compared with bilateral estimate
As at the end of 2017-18 Q3, the cumulative total number of participants receiving support was 162,223 (including 10,253 children supported through the ECEI gateway). Of these, 93,305 transitioned from an existing State/Territory program and 13,720 transitioned from an existing Commonwealth program.
In addition, 28,993 participants were awaiting a plan as at 31 March 2018.
Overall, since 1 July 2013, there have been 217,894 people with access decisions.
Cumulative Position
of scheme to date bilateral estimate met (1 July 2013 - 31 March 2018)
78%
plan approvals to date; 162,223 including 10,253 ECEI confirmed
151,970
Cumulative position reporting is inclusive of trial participants for the reported period and represents participants who have or have had an approved plan.
30,27937,861
63,461
77,988
96,760
119,493
142,265
162,223
0
20,000
40,000
60,000
80,000
100,000
120,000
140,000
160,000
180,000
200,000
ECEI
Total (excluding ECEI)
Bilateral estimate as at 31 March 2018
93,305
13,720
44,945
10,253
010,00020,00030,00040,00050,00060,00070,00080,00090,000
100,000
Plan approvals by participant referral pathway
of year to date bilateral estimate met (1 July 2017 - 31 March 2018)
70%
of transition to date bilateral estimate met (1 July 2016 - 31 March 2018)
75%

PART 1 - Participants and Planning
COAG Disability Reform Council Performance Report - National 31 March 2018 9
Of the individuals receiving existing State/Territory services, 2,430 did not meet the access criteria and 13,625 could not progress to planning for other varied reasons, such as being unable to contact. This means there were 48,463 State/Territory clients available to progress to planning.
As at 31 March 2018 there were 3,169 access decisions in progress and 11,071 participants with access met but yet to receive an approved plan. An additional 7,531 State/Territory clients who were due to receive a plan in other quarters received an approved plan during this period. Thus, there were 41,754 State/Territory clients who received an approved plan in 2017-18 to date.
Lastly there were 23,498 New and Commonwealth clients that received an approved plan during this period bringing the total plan approvals in 2017-18 to date to 65,252 (70% of the bilateral estimate for 2017-18).
Breakdown of cumulative 2017-18 bilateral progress
There have been 65,252 plans approved in the 2017-18 year to date, including ECEI. This represents 70% of the 2017-18 bilateral estimate to 31 March 2018.
Progress against bilateral estimates
59,843
33,851
59,8434,675 2,430
13,625
48,463 3,16911,071
7,531 41,754
23,498 65,252
93,694
(70%)
0
10,000
20,000
30,000
40,000
50,000
60,000
70,000
80,000
90,000
100,000
End of Q3S/T
bilaterals
Recordsprovided inexcess ofbilaterals
Access notmet
Could notbe
contacted,declined orwithdrew
S/T clientsavailable
toprogress
to planning
Access inprogress
Accessmet but
plan still tobe
approved
Approvalsin 2017/18for prior &
futurequarters
End of Q3Plan and
ECEIapprovals
New/CwthPlan and
ECEIapprovals
Approvalsas at 31
Mar 2018
End of Q3combinedbilaterals
State/Territory (S/T) New/Commonwealth (New/Cwth)
Access and planning in progress
Prior and future clients
approved
State/Territory clients unavailable to progress
to access

PART 1 - Participants and Planning
COAG Disability Reform Council Performance Report - National 31 March 2018 10
Note: The age eligibility requirements for the NDIS are based on the age as at the access request date. Participants with their initial plan approved aged 65+ have turned 65 since their access request was received.
Active participants with a plan approved in the quarter of 2017-18 Q3 by age group
% of active participants with a plan approved by age group
Around 21% of participants entering in this quarter are aged 0 to 6 years. This is higher compared to 12% in prior quarters.
Around 21% of participants entering in this quarter are aged 7 to 14 years. This is lower compared to 26% in prior quarters.
Demographic profile of active participants with a plan approved in the quarter of 2017-18 Q3, compared with plan approvals as at 31 December 2017, by age group.
Participant Profiles by Age Group
3,979
4,098
1,322
1,412
1,642
1,637
2,234
2,708
180
0 1,000 2,000 3,000 4,000 5,000
0 to 6
7 to 14
15 to 18
19 to 24
25 to 34
35 to 44
45 to 54
55 to 64
65+
12%
26%
9%
10%
10%
9%
11%
11%
2%
21%
21%
7%
7%
9%
9%
12%
14%
1%
0% 10% 20% 30%
0 to 6
7 to 14
15 to 18
19 to 24
25 to 34
35 to 44
45 to 54
55 to 64
65+
% of active participants with a plan approved in prior quarters% of active participants with a plan approved in 2017-18 Q3

PART 1 - Participants and Planning
COAG Disability Reform Council Performance Report - National 31 March 2018 11
Note: Of the 4,492 active participants identified as having an intellectual disability, 606 (13%), have down syndrome.
Demographic profile of active participants with a plan approved in the quarter of 2017-18 Q3, compared with plan approvals as at 31 December 2017, by disability group.
% of active participants with a plan approved by disability group
Active participants with a plan approved in the quarter of 2017-18 Q3 by disability group
28% of participants entering in the quarter of 2017-18 Q3 have a primary disability group of Autism, slightly lower than prior quarters.
In this quarter, 10% entered with Psychosocial Disability as their primary disability group, compared to 7% in previous quarters.
Participant Profiles by Disability Group
5,398
4,492
1,984
1,323
980
839
752
638
632
613
468
302
281
244
233
33
0 2,000 4,000 6,000
Autism
Intellectual Disability
Psychosocial disability
Developmental Delay
Other Neurological
Other Physical
Cerebral Palsy
Hearing Impairment
Acquired Brain Injury
Visual Impairment
Multiple Sclerosis
Global Developmental Delay
Stroke
Other Sensory/Speech
Spinal Cord Injury
Other
29%
29%
7%
4%
5%
4%
5%
3%
3%
2%
2%
1%
1%
2%
1%
0%
28%
23%
10%
7%
5%
4%
4%
3%
3%
3%
2%
2%
1%
1%
1%
0%
0% 20% 40%
Autism
Intellectual Disability
Psychosocial disability
Developmental Delay
Other Neurological
Other Physical
Cerebral Palsy
Hearing Impairment
Acquired Brain Injury
Visual Impairment
Multiple Sclerosis
Global Developmental Delay
Stroke
Other Sensory/Speech
Spinal Cord Injury
Other
% of active participants with a plan approved in prior quarters% of active participants with a plan approved in 2017-18 Q3

PART 1 - Participants and Planning
COAG Disability Reform Council Performance Report - National 31 March 2018 12
For participants with a plan approval in the current quarter: • 31% of active participants had a relatively high level of function• 44% of active participants had a relatively moderate level of function • 25% had a relatively low level of function
These relativities are within the NDIS participant population, and not comparable to the general population.
Demographic profile of active participants with a plan approved in the quarter of 2017-18 Q3, compared with plan approvals as at 31 December 2017, by level of function.
% of active participants with a plan approved by level of function
Participant Profiles by Level of Function
2%
0.2%
5%
8%
15%
14%
8%8%
1%
11%
5%
15%
5%
3%
0.0%
8.6%
0.3%
7% 7%
9%
16%
7%
8%
0.6%
12%
3%
15%
5%
1%0.0%
0%
2%
4%
6%
8%
10%
12%
14%
16%
18%
% of active participants with a plan approved in prior quarters 2017-18 Q3
1 2 3 4 5 6 7 8 9 10 11 12 13 14 15
Medium level of function Low level of functionHigh level of function

PART 1 - Participants and Planning
COAG Disability Reform Council Performance Report - National 31 March 2018 13
Demographic profile of active participants with a plan approved in the quarter of 2017-18 Q3, compared with plan approvals as at 31 December 2017, by gender.
The majority of participants are males.
Participant Profiles by Gender
61%
11,755+
38%
7,332+
0.7%
+ 125
63%
81,759
37%
47,572
0.3%
410
GENDER
Mal
eFe
mal
eIn
dete
rmin
ate
2017-18 Q3Up to 31 December 2017

PART 1 - Participants and Planning
998
16,987
1,227
382
18,830
1,430
17,778
4
COAG Disability Reform Council Performance Report - National 31 March 2018 14
Demographic profile of active participants with a plan approved in 2017-18 Q3, compared with plan approvals as at 31 December 2017.
Of the participants with a plan approved in 2017-18 Q3:
• 5.2% were Aboriginal or Torres Strait Islander, compared with 5.1% for prior periods.
• 2.0% were young people in residential aged care, compared with 1.3% for prior periods.
• 7.4% were culturally and linguistically diverse, compared with 7.2% for prior periods.
Young people in residential aged care
Young people not in residential aged care
Culturally and Linguistically Diverse
Not Culturally and Linguistically Diverse
Not Stated
Aboriginal & Torres-Strait Islander status
Aboriginal and Torres Strait Islander
Not Aboriginal and Torres Strait Islander
Not Stated
Young people in residential aged care status
Culturally and Linguistically Diverse Status
5.1%
91.0%
3.8%
5.2%
88.4%
6.4%
Prior Quarters
2017-18 Q3
2017-18 Q3 % of active participants
2017-18 Q3 % of active participants
1.3%
98.7%
2.0%
98.0%
Prior Quarters2017-18 Q3
Participant Profiles
2017-18 Q3 % of active participants
7.2%
92.0%
0.8%
7.4%
92.5%
0.0%
Prior Quarters2017-18 Q3

PART 1 - Participants and Planning
COAG Disability Reform Council Performance Report - National 31 March 2018 15
The proportion of participants who are fully or partly self-managing their plan was higher in 2017-18 Q3 (22%) compared with the prior quarters of transition (19%).
41% of participants who have had a plan approved in 2017-18 Q3 have support coordination in their plan, compared with 37% in prior quarters during transition.
Plan Management Support Co-ordination
9.6% 9.5% 14.0% 66.9%
0% 10% 20% 30% 40% 50% 60% 70% 80% 90% 100%
10.7% 11.6% 20.6% 57.1%
0% 10% 20% 30% 40% 50% 60% 70% 80% 90% 100%
Self Managed fully Self Managed Partly
Plan Managed/Agency Managed Fully Agency Managed
2017-18 Q3
Prior quarters (transition only)
Support Co-ordination
2017-18 Q3 Prior quarters
41% 37%

PART 1 - Participants and Planning
COAG Disability Reform Council Performance Report - National 31 March 2018 16
Note: Given that plans approved since 2017-18 Q1 are relatively new, it is too early to examine the duration to plan activation for these plans and hence these have been excluded from the charts.
Plan activation refers to the amount of time between plan approval and the commencement of the participant receiving support.
The percentage of plans activated within 90 days of approval were: • 74% of plans approved in prior quarters• 77% of plans approved in 2017-18 Q1.
Plan Activation
Plan activation can only be approximated using data on payments. As there is a lag between when support is provided and payments made, these statistics are likely to be conservative. That is, it is likely that plan activation is faster than presented. Further, in-kind supports have been excluded from the calculation, which further contributes to the conservative figures.
Duration to Plan activation for initial plans
51.8% 14.4% 7.4%
4.5%
8.5% 13.4%
0% 10% 20% 30% 40% 50% 60% 70% 80% 90% 100%
2017-18 Q1
Prior Quarters (Transition Only)
57.3% 13.9% 6.0%
3.1%
5.0%
14.8%
0% 10% 20% 30% 40% 50% 60% 70% 80% 90% 100%
Less than 30 days 30 to 59 days 60 to 89 days90 to 119 days 120 days and over No payments

PART 1 - Participants and Planning
COAG Disability Reform Council Performance Report - National 31 March 2018 17
Selected key baseline indicators for participants
• 66% of participants aged 0 to before school are able to make friends outside of family/carers, compared to 63% of participants from school age to 14• 56% of participants aged 0 to before school are engaged in age appropriate community, cultural or religious activities, compared to 32% - 36% for other age groups• 55% of participants from school age to 14 attend school in a mainstream class, compared to 28% of participants aged 15 to 24• 26% of participants aged 25 and over have a paid job, compared to 18% of participants aged 15 to 24• 62% of participants aged 25 and over choose what they do every day, compared to 44% of participants aged 15 to 24
Baseline outcome measures were collected from 99% of participants receiving their initial plan since 1 July 2016.
Participant Outcomes
66%
56%
63%
35%
55%
32%28%
18%
44%
36%
26%
62%
0%
10%
20%
30%
40%
50%
60%
70%
80%
90%
100%
% able to makefriends outside offamily (or carers)
% in age appropiatecommunity, culturalor religious activities
% attending schoolin mainstream class
% with a paid job % that choose whatthey do every day
0 to before school School to 14 15 to 24 25 and over

PART 1 - Participants and Planning
Selected key baseline indicators for families and carers of participants
COAG Disability Reform Council Performance Report - National 31 March 2018 18
The percentage of participants' family/carers:• working in a paid job was highest for participants aged 15 to 24 (48%)• able to advocate for their child/family member was highest for participants aged 0 to 14 (78%)• who have friends and family they can see as often as they like was highest for participants aged 25 and over (46%)• who feel in control selecting services was highest for participants aged 25 and over (43%)• who support/plan for their family member through life stage transitions was highest for participants aged 0 to 14 (86%)
Family/Carers Outcomes
46%
78%
45%
86%
48%
74%
45%41%
43%
33%
70%
46%43%
38%
0%
10%
20%
30%
40%
50%
60%
70%
80%
90%
100%
% working in a paidjob
% able to advocatefor their child/family
member
% with friends andfamily they see asoften as they like
% who feel in controlselecting services
% who support/planfor their family
member through lifestage transitions
0 to 14 15 to 24 25 and over
PART 1 - Participants and Planning
"Has the NDIS helped?" questions for participants
COAG Disability Reform Council Performance Report - National 31 March 2018 19
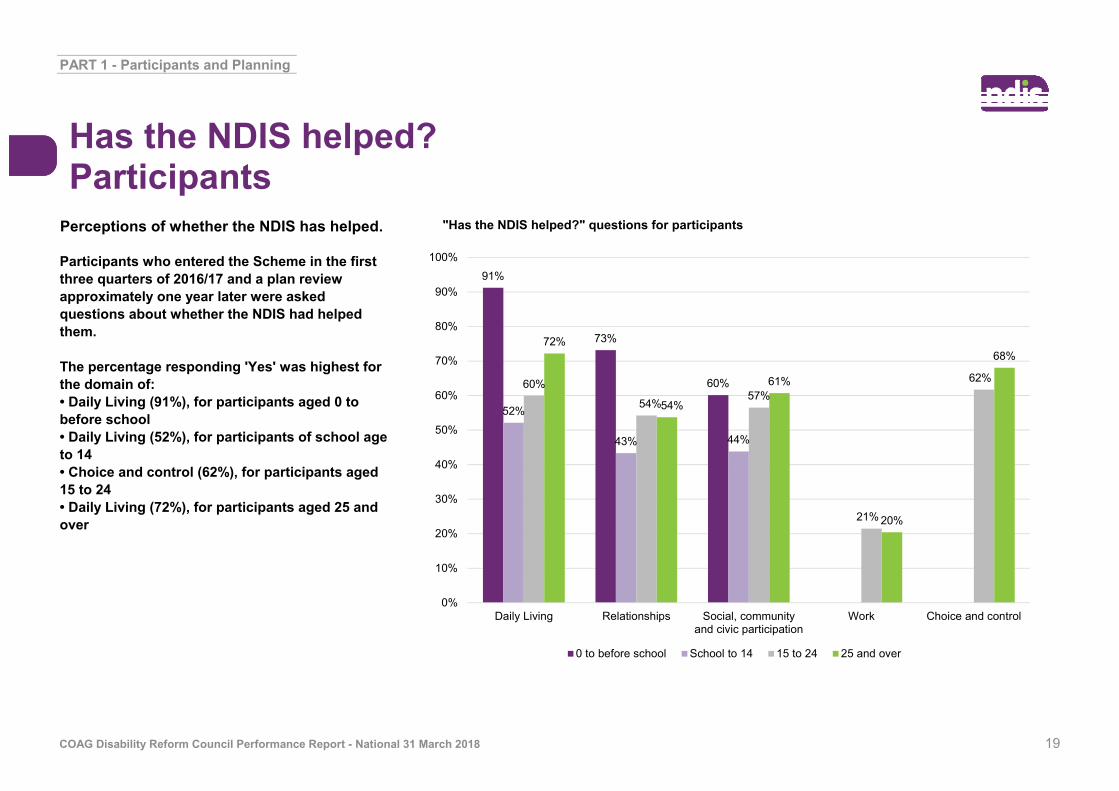
Perceptions of whether the NDIS has helped.
Participants who entered the Scheme in the first three quarters of 2016/17 and a plan review approximately one year later were asked questions about whether the NDIS had helped them.
The percentage responding 'Yes' was highest for the domain of:• Daily Living (91%), for participants aged 0 to before school• Daily Living (52%), for participants of school age to 14• Choice and control (62%), for participants aged 15 to 24• Daily Living (72%), for participants aged 25 and over
Has the NDIS helped? Participants
91%
73%
60%
52%
43% 44%
60%
54%57%
21%
62%
72%
54%
61%
20%
68%
0%
10%
20%
30%
40%
50%
60%
70%
80%
90%
100%
Daily Living Relationships Social, communityand civic participation
Work Choice and control
0 to before school School to 14 15 to 24 25 and over

PART 1 - Participants and Planning
"Has the NDIS helped?" questions for families and carers of participants
COAG Disability Reform Council Performance Report - National 31 March 2018 20
Perceptions of whether the NDIS has helped.
Families and carers of participants who entered the Scheme in the first three quarters of 2016/17 and a plan review approximately one year later were asked questions about whether the NDIS had helped them.
The percentage responding 'Yes' was higher in all areas for family/carers of participants aged 0 to 14 than participants aged 15 and over.
The NDIS has helped families and carers of participants most with accessing services, programs and activities, and with life stage transitions.
Has the NDIS helped? Family/Carers
55%
63%66%
69%
39%
46%
57% 57%
34%
0%
10%
20%
30%
40%
50%
60%
70%
80%
90%
100%
Families/carers knowtheir rights and can
advocate
Families/carers feelsupported
Families/carers areable to access
services, programsand activities
Families/carers helpwith life stage
transitions
Families/carers enjoyhealth and wellbeing
0 to 14 15 and over

PART 1 - Participants and Planning
COAG Disability Reform Council Performance Report - National 31 March 2018 21
Proportion of participants describing satisfaction with the Agency's planning process as good or very good - by quarter
84% of participants rated their satisfaction with the Agency's planning process as either good or very good in the current quarter. This is approximately the same as the last quarter.
The Participant Pathway Review aims to improve the participant experience.
Participant Satisfaction
Participant satisfaction continues to be high, but has dropped during transition, compared with trial site experience.
94% 96% 98%93%
100%95%
85% 84%88%
84% 84% 83% 84%
0%
10%
20%
30%
40%
50%
60%
70%
80%
90%
100%
Prop
ortio
n of
Par
ticip
ants
%
Quarter

National - 31 March 2018
PART 2
Committed Supports and Payments
Both committed and paid supports to participants are increasing in line with the growing scheme.To date funding committed to participants with an approved plan amounts to $15.0 billion (including support periods in the future), of which $6.4 billion has been paid.

PART 2 - Committed Supports and Payments
^Note: The $7.2 billion in respect of 2017-18 only includes approved plans to date.*Note: The $3.0 billion committed in future years is due to current plans in place that have an end date past 30 June 2018.COAG Disability Reform Council Performance Report - National 31 March 2018 23
This section presents information on the amount committed in plans and payments to service providers and participants.
Summary
Key Statistics
BILLION OF SUPPORTS HAS BEEN COMMITTED TO 151,970 PARTICIPANTS
$15.0
BILLION HAS BEEN PAID TO PROVIDERS & PARTICIPANTS
$6.4 OVERALL, 64% OF COMMITTED SUPPORTS WERE UTILISED IN 2013-14, 75% IN 2014-15, 75% IN 2015-16 AND 66% IN 2016-17.
THE 2017-18 EXPERIENCE IS STILL EMERGING.
BILLION OF SUPPORTS IN RESPECT OF PRIOR FINANCIAL YEARS INCLUDING TRIAL
$4.8BILLION OF SUPPORTS IN RESPECT OF 2017-18^
$7.2BILLION OF SUPPORTS IN RESPECT OF LATER YEARS*
$3.0

PART 2 - Committed Supports and Payments
COAG Disability Reform Council Performance Report - National 31 March 2018 24
Committed and paid by expected support year
Committed amount by year that the support is expected to be provided, compared with committed supports that have been used (paid).
Of the $15.0 billion that has been committed in participant plans, $6.4 billion has been paid to date.
In particular, for supports provided in:2013-14: $85.3m has been paid2014-15: $370.4m has been paid2015-16: $702.2m has been paid2016-17: $2,125.1m has been paid2017-18 to date: $3,129.0m has been paid
Committed Supports and Payments
0
1,000
2,000
3,000
4,000
5,000
6,000
7,000
8,000
2013-14 2014-15 2015-16 2016-17 2017-18 2018-19 andbeyond
$ M
illion
s
Total paid Total committed
$Million 2013-14 2014-15 2015-16 2016-17 2017-182018-19
and beyond
Total
Total committed 132.8 496.8 939.4 3,210.3 7,243.6 2,968.7 14,991.6Total paid 85.3 370.4 702.2 2,125.1 3,129.0 0.0 6,412.0

PART 2 - Committed Supports and Payments
COAG Disability Reform Council Performance Report - National 31 March 2018 25
A higher proportion of initial plan approvals in 2017-18 Q3 have average annualised committed supports between $10,001 and $20,000 compared with participants who entered in prior quarters when participants with shared supported accommodation (SSA) supports are included.
This is also the case when SSA participants are excluded.
Committed Supports by Cost Band
0%
5%
10%
15%
20%
Distribution of average annualised committed supports by cost band (including SSA)
0%
5%
10%
15%
20%
Distribution of average annualised committed supports by cost band (excluding SSA)
As at Q2 2017-18 Q3 2017-18

PART 2 - Committed Supports and Payments
COAG Disability Reform Council Performance Report - National 31 March 2018 26
Note: The age eligibility requirements for the NDIS are based on the age as at the access request date. Participants with their initial plan approved aged 65+ have turned 65 since their access request was received.
Average annualised committed supports increase steeply up to age 25, stabilises to age 55 and then reduces at older ages.
The average annualised committed supports for participants was lower in 2017-18 Q3 compared to previous quarters for most age groups.
Average annualised committed supports by age band
Committed Supports by Age Band
0
20,000
40,000
60,000
80,000
100,000
120,000
0 to 6 7 to 14 15 to 18 19 to 24 25 to 34 35 to 44 45 to 54 55 to 64 65+
As at Q2 2017-18 Q3 2017-18

PART 2 - Committed Supports and Payments
COAG Disability Reform Council Performance Report - National 31 March 2018 27
Average annualised committed supports by primary disability group
Participants with Spinal Cord Injury, Cerebral Palsy and Acquired Brain Injury have the highest average annualised committed supports.
Participants with an intial plan approval in 2017-18 Q3 had lower average annualised committed supports across most disability types when compared with participants who entered in prior quarters.
Committed Supports by Disability Group
0 20,000 40,000 60,000 80,000 100,000 120,000 140,000
Acquired Brain Injury
Autism
Cerebral Palsy
Developmental Delay
Global Developmental Delay
Hearing Impairment
Intellectual Disability
Multiple Sclerosis
Psychosocial Disability
Spinal Cord Injury
Stroke
Visual Impairment
Other Neurological
Other Physical
Other Sensory/Speech
Other
As at Q2 2017-18 Q3 2017-18

PART 2 - Committed Supports and Payments
COAG Disability Reform Council Performance Report - National 31 March 2018 28
Note 1: Average annualised committed supports are not shown if there are insufficient data in the group.Note 2: High, medium and low function is relative within the NDIS population and not comparable to the general population.
Average annualised committed supports by level of function
The average annualised committed supports generally increase with lower levels of function.
The average annualised committed supports for participants with an initial plan approval in 2017-18 Q3 is lower compared with participants who entered in prior quarters for participants across low, medium and high levels of function.
Committed Supports by Level of Function
0
20,000
40,000
60,000
80,000
100,000
120,000
140,000
160,000
180,000
As at Q2 2017-18 Q3 2017-18
1 2 3 4 5 6 7 8 9 10 11 12 13 14 15
Medium level of function Low level of functionHigh level of function

PART 2 - Committed Supports and Payments
COAG Disability Reform Council Performance Report - National 31 March 2018 29
Utilisation of committed supports as at 31 December 2017 and 31 March 2018
Utilisation of committed supports by year that the support was expected to be provided as at 31 December 2017, compared with 31 March 2018.
As there is a lag between when support is provided and when it is paid, the utilisation in 2017-18 will increase.
Lower utilisation in 2016-17 is predominantly driven by the large number of participants who received their first plan in this year. Participants utilise less of their first plan compared with their second and subsequent plans, as it takes time to familiarise with the NDIS and decide which supports to use.
EXPERIENCE IS STILL EMERGING
The utilisation of committed supports in 2017-18 YTD is still emerging and the utilisation rate is expected to increase as there is a lag between when support is provided and when it is paid.
Utilisation of Committed Supports
64%
75%
75%
64%
75%
75%
66% 66%56%
59%
0
1,000
2,000
3,000
4,000
5,000
6,000
$ M
illio
n
Paid (as at 31 December 2017) Remaining (as at 31 December 2017)Paid (as at 31 March 2018) Remaining (as at 31 March 2018)

National - 31 March 2018
PART 3
Providers and MarketsThe scale and extent of the market continues to grow, with a 16% increase in the number of providers during the quarter to 14,271.

PART 3 - Providers and Markets
COAG Disability Reform Council Performance Report - National 31 March 2018 31
This section contains information on registered service providers and the market, with key provider and market indicators presented.
Summary
Key Statistics
OF SERVICE PROVIDERS ARE INDIVIDUAL/SOLE TRADERS
THERAPEUTIC SUPPORTS HAS THE HIGHEST NUMBER OF APPROVED SERVICE PROVIDERS, FOLLOWED BY HOUSEHOLD TASKS AND ASSISTANCE WITH TRAVEL/TRANSPORT ARRANGEMENTS
Provider registration
• To provide supports to NDIS participants, a service provider is required to register and be approved by the NDIA.
• Providers register with the NDIA by submitting a registration request, indicating the types of support (registration groups) they are accredited to provide.
How providers interact with participants
• NDIS participants have the flexibility to choose the providers who support them.
• Providers are paid for disability supports and services provided to the participants.
APPROVED PROVIDERS
OF PAYMENTS MADE BY THE NDIA ARE RECEIVED BY 25% OF PROVIDERS
14,271 80-90% 43%

PART 3 - Providers and Markets
COAG Disability Reform Council Performance Report - National 31 March 2018 32
Approved providers over time by type of provider
As at 31 March 2018, there were 14,271 registered service providers of which 6,175 were individual/sole trader operated business while the remaining 8,096 providers were registered as a company or organisation.
Providers over time
0
2,000
4,000
6,000
8,000
10,000
12,000
14,000
16,000
As at 30Jun 2016
As at 30Sep 2016
As at 31Dec 2016
As at 31Mar 2017
As at 30Jun 2017
As at 30Sep 2017
As at 31Dec 2017
As at 31Mar 2018
Individual / sole trader Company / organisation
The number of approved service providers increased by 16% from 12,328 to 14,271 in the quarter. Currently, 43% of approved service providers are individual/sole traders.
1.53AVERAGE NUMBER OF PROVIDERS PER
PARTICIPANT

PART 3 - Providers and Markets
COAG Disability Reform Council Performance Report - National 31 March 2018 33
Change in the activity status of providers.
As at 31 March 2018, 52% of providers were active and 48% were yet to have evidence of activity. Of the overall stock of providers, 2,258 providers began delivering new supports in the quarter.
Proportion of Active Providers
Active (52%)
Not yet active (48%)
PROPORTION OF ACTIVE / INACTIVE
PROVIDERS
2,258NUMBER OF PROVIDERS
DELIVERING NEW SUPPORTS

PART 3 - Providers and Markets
COAG Disability Reform Council Performance Report - National 31 March 2018 34
Therapeutic Supports has the highest number of approved service providers and has seen a 16% increase since the previous quarter.
The largest percentage increase in approved providers was for the Innovative Community Participation registration group in the quarter, increasing from 1607 as at 31 December 2017 to 1982 as at 31 March 2018. This was followed by Specialised Disability Accommodation, Interpreting and translation and Vehicle Modifications.
Approved providers by registration group and percentage change over the quarter
The number of approved providers has increased for most registration groups over the quarter.
Approved Registration Groups
14%0%
9%14%
11%10%9%
19%19%
9%16%
15%14%
14%13%
9%0%
14%0%
15%12%12%
16%8%
15%15%
23%9%
16%15%
20%19%
13%14%
5%2.7%
0 2,000 4,000 6,000 8,000
Accommodation / Tenancy AssistanceAssistance Animals
Assistance with daily life tasks in a group or shared living arrangementAssistance with travel/transport arrangements
Daily Personal ActivitiesGroup and Centre Based Activities
High Intensity Daily Personal ActivitiesHousehold tasks
Interpreting and translationParticipation in community, social and civic activities
Assistive equipment for recreationAssistive products for household tasks
Assistance products for personal care and safetyCommunication and information equipment
Customised ProstheticsHearing Equipment
Hearing ServicesPersonal Mobility Equipment
Specialised Hearing ServicesVision Equipment
Assistance in coordinating or managing life stages, transitions and supportsBehaviour Support
Community nursing care for high needsDevelopment of daily living and life skills
Early Intervention supports for early childhoodExercise Physiology and Physical Wellbeing activities
Innovative Community ParticipationSpecialised Driving Training
Therapeutic SupportsHome modification design and construction
Specialised Disability AccommodationVehicle Modifications
Management of funding for supports in participants planSupport Coordination
Assistance to access and/or maintain employment and/or educationSpecialised Supported Employment
Assi
stan
ce s
ervi
ces
Assi
stiv
e Te
chno
logy
Cap
acity
Bui
ldin
g Se
rvic
esC
apita
lse
rvic
es
Oth
erR
egis
tratio
nG
roup
s
As at 31 March 2018 As at 31 December 2017

PART 3 - Providers and Markets
COAG Disability Reform Council Performance Report - National 31 March 2018 35
Therapeutic Supports has the highest number of active service providers and has seen an 18% increase since the previous quarter.
The largest percentage increase in active providers was for the Innovative Community Participation registration group in the quarter, increasing from 771 as at 31 December 2017 to 952 as at 31 March 2018. This was followed by Interpreting and translation, Assistive products for household tasks and Community nursing care for high needs.
Active providers by registration group and percentage change over the quarter
The number of providers active in each registration group has increased for most registration groups over the quarter.
Active Registration groups
13%0%
9%13%
11%10%10%
17%23%
9%18%
20%17%
16%15%
8%0%
15%2%
12%12%
11%20%
9%16%
19%23%
9%18%
19%19%
14%14%
14%6%
4%
0 1,000 2,000 3,000 4,000 5,000
Accommodation / Tenancy AssistanceAssistance Animals
Assistance with daily life tasks in a group or shared living arrangementAssistance with travel/transport arrangements
Daily Personal ActivitiesGroup and Centre Based Activities
High Intensity Daily Personal ActivitiesHousehold tasks
Interpreting and translationParticipation in community, social and civic activities
Assistive equipment for recreationAssistive products for household tasks
Assistance products for personal care and safetyCommunication and information equipment
Customised ProstheticsHearing Equipment
Hearing ServicesPersonal Mobility Equipment
Specialised Hearing ServicesVision Equipment
Assistance in coordinating or managing life stages, transitions and supportsBehaviour Support
Community nursing care for high needsDevelopment of daily living and life skills
Early Intervention supports for early childhoodExercise Physiology and Physical Wellbeing activities
Innovative Community ParticipationSpecialised Driving Training
Therapeutic SupportsHome modification design and construction
Specialised Disability AccommodationVehicle Modifications
Management of funding for supports in participants planSupport Coordination
Assistance to access and/or maintain employment and/or educationSpecialised Supported Employment
Assi
stan
ce s
ervi
ces
Assi
stiv
e Te
chno
logy
Cap
acity
Bui
ldin
g Se
rvic
esC
apita
lse
rvic
es
Oth
erR
egis
tratio
nG
roup
s
As at 31 March 2018 As at 31 December 2017

PART 3 - Providers and Markets
COAG Disability Reform Council Performance Report - National 31 March 2018 36
Market share of the top 25% of providers by registration group.25% of service providers received 80-90% of the dollars paid for major registration groups.
Market share oftop providers
25% of providers have received 85% of payments during the quarter of 2017-18 Q3 for Daily Personal Activities.
DAILY PERSONAL ACTIVITIES
(%)
EARLY INTERVENTION
SUPPORTS FOR EARLY CHILDHOOD
(%)
PARTICIPATION IN COMMUNITY,
SOCIAL AND CIVIC ACTIVITIES
(%)
ASSISTANCE WITH DAILY LIFE TASKS
IN A GROUP OR SHARED LIVING ARRANGEMENT
(%)
THERAPEUTIC SUPPORTS
(%)
85% 88% 83%
88% 86%

National - 31 March 2018
PART 4
Information, Linkages and Capacity BuildingThe focus of effort in Information Linkages and Capacity building will be to ensure that people with disability have the information they need to make decisions and are connected to appropriate
Furthermore, the intent is for them to have the skills and confidence to participate, contribute to and benefit from activities that everyone else in the community has access to.

PART 4 - Information, Linkages and Capacity Building
COAG Disability Reform Council Performance Report - National 31 March 2018 0
ILC has been implemented to date through a combination of open and direct grants processes and through supporting jurisdictions as they maintain existing ILC effort, as agreed in ILC Transition Plans. The NDIA is developing an ILC Investment Strategy which will guide ILC investment from full scheme in 2019-20. The Investment Strategy will be aimed at ensuring ILC funds are used most effectively in supporting people with disability in the community and supporting scheme sustainability.
A range of stakeholders will have input into the ILC Investment Strategy, including State and Territory governments. The NDIA is exploring several implementation options, including direct procurement, targeted procurement (e.g. for thin markets) and open or targeted grants rounds. All funding will be outcomes focused and funded organisations will be required to report against the relevant NDIS Outcomes and ILC Outcomes. A second national readiness grants round and a grant round for the delivery of ILC activities in NSW, SA and the ACT from 1 July 2018 was run in late 2017, with announcements due by the end of May.
Information, Linkages and Capacity Building (ILC)

National - 31 March 2018
PART 5
Mainstream Interface
The proportion of participants entering in the current quarter accessing mainstream services is slightly higher compared to prior quarters.
PART 5 - Mainstream Interface
COAG Disability Reform Council Performance Report - National 31 March 2018 40
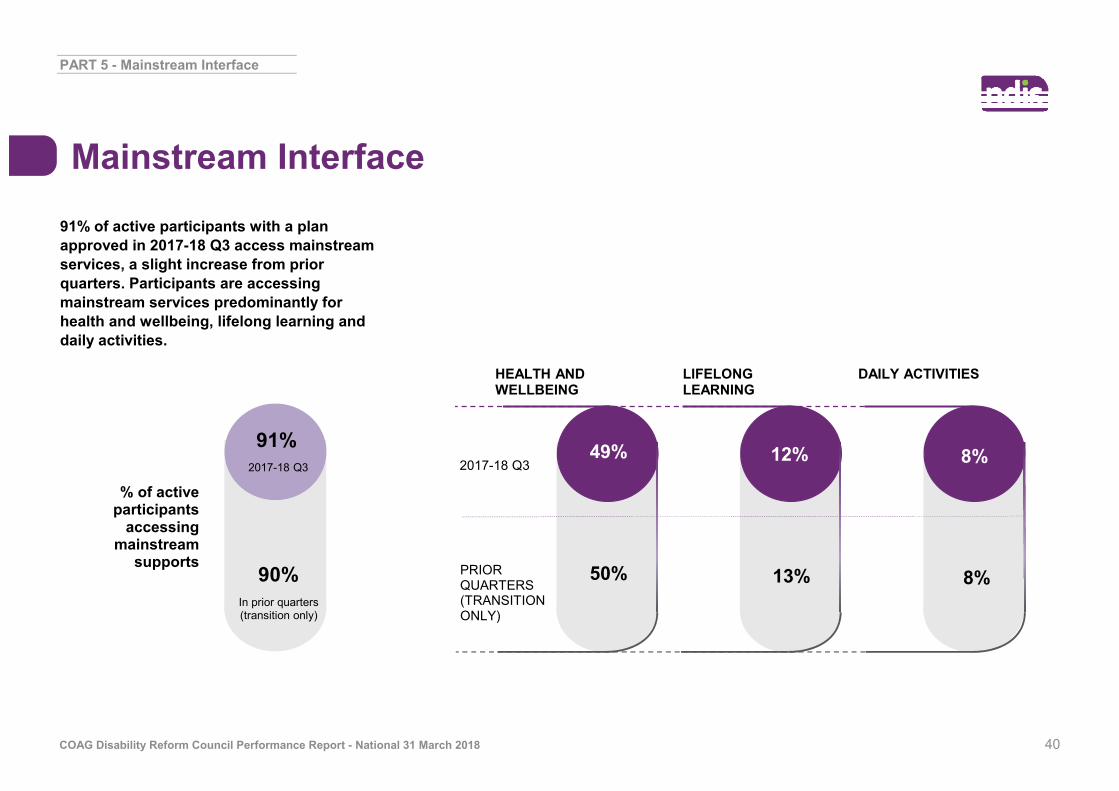
91% of active participants with a plan approved in 2017-18 Q3 access mainstream services, a slight increase from prior quarters. Participants are accessing mainstream services predominantly for health and wellbeing, lifelong learning and daily activities.
Mainstream Interface
daily activities
0%health and wellbeing
0%lifelong learning
0%
2017-18 Q3
LIFELONG LEARNING
DAILY ACTIVITIES
PRIOR QUARTERS (TRANSITION ONLY)
8%49%
50%
12%
13%
HEALTH AND WELLBEING
8%
91%
% of active participants
accessing mainstream
supports
2017-18 Q3
90%In prior quarters (transition only)

National - 31 March 2018
PART 6
Financial Sustainability
The NDIS Insurance approach allows pressures on the scheme to be identified early and management responses put in place to respond to these pressures.
Currently, the best estimate of the longer-term cost of a well-managed NDIS is $22 billion a year at full scheme. The Productivity Commission’s report on NDIS Costs, released on 19 October 2017, indicates that this remains appropriate and is consistent with the Commission’s own 2011 modelling after accounting for wage and

PART 6 - Financial sustainability
COAG Disability Reform Council Performance Report - National 31 March 2018 42
Specific strategies to address pressures on financial sustainability include:
Financial Sustainability
Key Statistics
HIGHER THAN EXPECTED NUMBERS OF POTENTIAL PARTICIPANTS CONTINUING TO APPROACH THE SCHEME
HIGHER THAN EXPECTED NUMBERS OF CHILDREN ENTERING THE SCHEME
INCREASING PACKAGE COSTS OVER AND ABOVE THE IMPACTS OF INFLATION AND AGEING
A MISMATCH BETWEEN BENCHMARK PACKAGE COSTS AND ACTUAL PACKAGE COSTS
COMMITTED SUPPORT FOR PARTICIPANTS IN SHARED SUPPORTED ACCOMMODATION IS HIGHER THAN EXPECTED (FIRST PLAN) AMOUNT AND HIGHER THAN REVENUE RECEIVED
LOWER THAN EXPECTED PARTICIPANTS EXITING THE SCHEME
• The introduction of the Early Childhood Early Intervention (ECEI) which aims to support children within mainstream services and the community, with only the children requiring an individual support package gaining entry to the scheme.
• The introduction of typical support packages which establish a benchmark amount of support for participants with specific characteristics.
• Increased risk-based quality assurance at access and plan approval.
• Increased staff training.• Redesign of the participant pathway,
which will provide a stronger focus on participant outcomes and goals, and sustainability.