March 1968 - apps.dtic.mil · ABSTRACT iii NOMENCLATURE vii I. INTRODUCTION 1 II. FLIGHT TEST...
83
AEDC-TR-67-238 7 APR 12.196t *?* 29.1968 POSTFLIGHT (AS-202) APOLLO COMMAND MODULE AERODYNAMIC SIMULATION TESTS B. J. Griffith and D. E. Boylan ARO, Inc. March 1968 =p- This document has been approved for public release and sale; its distribution is unlimited. 1LO VON KÄRMÄN GAS DYNAMICS FACILITY ARNOLD ENGINEERING DEVELOPMENT CENTER AIR FORCE SYSTEMS COMMAND ARNOLD AIR FORCE STATION, TENNESSEE PROPERTY OF U. S. AIR FORCE AEDC LIBRARY AF 40(600)1200
-
Upload
duongquynh -
Category
Documents
-
view
212 -
download
0
Transcript of March 1968 - apps.dtic.mil · ABSTRACT iii NOMENCLATURE vii I. INTRODUCTION 1 II. FLIGHT TEST...

AEDC-TR-67-238
7 APR 12.196t
*?* 29.1968
POSTFLIGHT (AS-202) APOLLO COMMAND
MODULE AERODYNAMIC SIMULATION TESTS
B. J. Griffith and D. E. Boylan
ARO, Inc.
March 1968
=p-
This document has been approved for public release and sale; its distribution is unlimited.
1LO
VON KÄRMÄN GAS DYNAMICS FACILITY
ARNOLD ENGINEERING DEVELOPMENT CENTER
AIR FORCE SYSTEMS COMMAND
ARNOLD AIR FORCE STATION, TENNESSEE
PROPERTY OF U. S. AIR FORCE AEDC LIBRARY
AF 40(600)1200

mim When U. S. Government drawings specifications, or other data are used for any purpose other than a definitely related Government procurement operation, the Government thereby incurs no responsibility nor any obligation whatsoever, and the fact that the Government may have formulated, furnished, or in any way supplied the said drawings, specifications, or other data, is not to be regarded by implication or otherwise, or in any manner licensing the holder or any other person or corporation, or conveying any rights or permission to manufacture, use, or sell any patented invention that may in any way be related thereto.
Qualified users may obtain copies of this report from the Defense Documentation Center.
References to named commercial products in this report are not to be considered in any sense as an endorsement of the product by the United States Air Force or the Government.

AEDC-TR.67-238
POSTFLIGHT (AS-202) APOLLO COMMAND
MODULE AERODYNAMIC SIMULATION TESTS
B. J. Griffith and D. E. Boylan
ARO, Inc.
This document has been approved for public release and sale; its distribution is unlimited.

AEDC-TR-67-238
FOREWORD
The research reported herein was done at the request of the Arnold Engineering Development Center (AEDC), Air Force Systems Command (AFSC), under System 920E in cooperation with the NASA Manned Spacecraft Center, Houston, Texas.
The results presented were obtained by ARO, Inc. (a subsidiary of Sverdrup & Parcel and Associates, Inc. ), contract operator of Arnold Engineering Development Center (AEDC), AFSC, Arnold Air Force Station, Tennessee, under Contract AF 40(600)-1200. The tests were conducted from December 1966 through May 1967, under ARO Project No. VT0744, and the manuscript was submitted for publication on Octo- ber 13, 1967.
The authors wish to acknowledge contributions to this research work by many of their colleagues at the von Karman Gas Dynamics Facility (VKF), AEDC. Among the many who assisted in this work, L. K. Ward of the Supersonic Branch (VKF), R. H. Burt of the Hypersonic Branch (VKF), W. R. Lawrence of the Aerophysics Branch (VKF), and W. S. Norman of the Hypervelocity Branch (VKF), contributed mate- rially in obtaining and analyzing the experimental results. The authors are also grateful to Bass Redd and Ralph Graham of the NASA Manned Space Center for providing helpful information and encouragement during the course of the research and to Jack D. Moote of North American Aviation for providing the pertinent details of Apollo Spacecraft 011.
This technical report has been reviewed and is approved.
Donald H. Meyer Leonard T. Glaser Major, USAF Colonel, USAF AF Representative, VKF Director of Test Directorate of Test
li

AEDC-TR-67-238
ABSTRACT
A comprehensive postflight wind tunnel investigation of the Apollo Command Module was conducted to resolve several anomalies between flight (AS-202) and preflight aerodynamic data. Attention was focused on (1) simulating the actual vehicle "as flown", (2) obtaining consistent pitch plane force measurements in the angle-of-attack range 150 < a < 180 deg, (3) the effect of Mach number over a range of 3 to 20, (4) the effect of Reynolds number, and (5) possible sting effects. Results indicated that prior failure to duplicate the asymmetrical wavy heat shield in preflight testing resulted in a significant error in trim angle-of - attack prediction. In addition, a strong viscous influence was found to extend down to an altitude of about 220, 000 ft. Also, a Mach number in- fluence to a value of about 14 was found which is substantially higher than previous blunt body investigations have indicated,
in

AEDC-TR-67-238
CONTENTS
Page
ABSTRACT iii NOMENCLATURE vii
I. INTRODUCTION 1 II. FLIGHT TEST PROGRAM 2
III. WIND TUNNEL PROGRAM 3. 1 Brief History of AWTTP (1962-1966) 3 3. 2 Brief Analysis of Data Taken under the AWTTP ... 4 3. 3 Postflight (AS-202) Wind Tunnel Program 4 3.4 Flight AS-202 Wind Tunnel Models 4 3. 5 Test Facilities for Current Investigation 5 3. 6 Procedure 6 3. 7 Accuracy and Repeatability 8
IV. WIND TUNNEL CORRELATION PARAMETER 8 V. WIND TUNNEL DATA CORRELATION AND
COMPARISON 10 VI. APOLLO FLIGHT-WIND TUNNEL DATA
COMPARISONS 12 VII. CONCLUDING REMARKS 13
REFERENCES 13
APPENDIXES
I. ILLUSTRATIONS
Figure
1. Photograph of Spacecraft Oil Prior to Mission AS-202. . 17
2. Apollo CM Forces and Dimensions a. Orientation of Forces and Moments 18 b. Apollo Spacecraft (Symmetrical Smooth
Heat Shield Dimensions) 18
3. Time History of Apollo Mission AS-202 19
4. Re-Entry Flight Parameters for Apollo Mission AS-202 20
5. Apollo Heat Shield Asymmetry 21
6. Apollo Models 22

AEDC-TR-67-238
Figure Page
7. Toepler- Schlieren Photograph of Face of Tunnel F Models 23
8. Model and Sting Dimensions Used in Postflight Wind Tunnel Program 24
9. Model External Protuberances a. Location of Protuberances 25 b. Protuberance Details 26
10. Shock Reynolds Number Flight Simulation 27
11. Mach Number and Shock Reynolds Number Flight Simulation 28
12. Typical Data Plot Showing Basis of Data Correlation 29
13. Variation of Axial-Force Coefficient (CA)
with M. and Re2d 30
14. Variation of Normal-Force Coefficient (C^) with M,,, and Re2d 31
15. Variation of Pitching-Moment Coefficient (Cmcg) with M0 and Re2d 32
16. Variation of Pitching Moment Referenced to Heat Shield (Cmj^s) with Re2d 33
17. Effect of Shock Reynolds Number on Lift-to-Drag Ratio 34
18. Photographic History of Range G Shot 35
19. Flight of Apollo Model in Range G, Shot 620 a. Variation of a and j3 (Body Angles) 36 b. Variation of 0 and ty (Range Angles) 37
20. Comparison of Free-Flight (AEDC-Range G) to Sting Mounted Tunnel Data 38
21. Comparison of Free-Flight (Ames Shock Tunnel) to Sting Mounted Tunnel Data 39
22. Comparison of Present Results with Previous Data, Symmetrical Smooth Heat Shield 40
23. Variation of Afterbody Pressures with Reynolds Number, M_ > 14 41
VI

AEDC-TR-67-238
Figure Page
24. Comparison of Apollo Mission AS-202 Flight Data with AEDC-VKF Tunnel Data
a. Trim Angle of Attack 42 b. Normal- to Axial-Force Ratio, ....... 43 c. Lift-to-Drag Ratio 44
25. Summary of (L/D)rp and 0"r Data 45
26. Effect of Center-of-Gravity Location at Three Flow Conditions 46
II. BASIC DATA PLOTS 47
III. TABLES
I. Postflight (AS-202) Wind Tunnel Program .... 57
II. Nominal Test Flow Conditions 58
III. Tabulated Basic Wind Tunnel Data 59
IV. Typical Apollo Mission AS-202 Flight Data. ... 70
NOMENCLATURE
(See Fig. 2 for Sign Convention)
a 2 Speed of sound downstream of a Rankine-Hugoniot normal shock
CB Chapman-Rub es in viscosity coefficient {nw/nm = C00TW/T00)
C^ Axial-force coefficient
Cj3 Drag-force coefficient
C-L Lift-force coefficient
CN Normal-force coefficient
Cm Pitching-moment coefficient referenced to Apollo Mission Cg AS-202 CM center of gravity (see Fig. 2)
Cm Pitching-moment coefficient referenced to e/d = 0. 035 and Cgl x/d = 0.2688
Cmuc Pitching moment referenced to e/d = 0 and x/d = 0
CM Command Module
d Maximum diameter of CM
e Center-of-gravity offset from CM centerline (see Fig. 2)
vn

AEDC-TR-67-238
e/d Ratio of offset to CM diameter
K„0 . Knudsen number based on conditions downstream of a normal n2 d shock and CM diameter
L/D Lift-to-drag ratio
M2 Mach number downstream of a normal shock
M^ Free-stream Mach number
p Local surface pressure
p' Impact pressure
p Stagnation pressure
Re0 , Free-stream Reynolds number based on CM diameter
Renj Reynolds number downstream of a normal shock based on CM diameter
Rewcj Reynolds number based on local flow and temperature at model surface and CM diameter
SA Surviving antenna
T Stagnation temperature
T, Wall temperature w T^ Free-stream temperature
U2 Velocity downstream of a normal shock
U„, Free-stream velocity
UH Umbilical housing 1 /2
Vo,, Viscous interaction parameter defined as M^C^/Re ^
X Distance aft of heat shield
x Center-of-gravity location measured longitudinally from aft heat shield (see Fig. 2)
x/d Ratio of longitudinal center-of-gravity location to CM diameter
a Angle of attack, body axis
Effective angle of attack = "\/(180 - a)2 + ß2
ttrp Trim angle of attack
ß Angle of side slip, body axis
y Ratio of specific heats
viii

AEDC-TR-67-23B
0 Measured angle of model referenced to the (x, z) plane of Range G
0^ Local inclination angle of body
X 2 Mean free path downstream of a normal shock
^s Free-stream viscosity
jUg Viscosity downstream of a normal shock
Hw Viscosity based on wall temperature
p^ Free-stream density
P2 Density downstream of a normal shock
a Shock inclination angle
0 Measured angle of model referenced to (x, y) plane of Range G
IX

AEDC-TR-67.238
SECTION I INTRODUCTION
The motion of a spacecraft in flight is determined by the propulsive forces supplied, the force of gravity, the inertial characteristics of the spacecraft, and the aerodynamic forces. The wind tunnel is generally recognized as being almost indispensable in obtaining the aerodynamic information necessary to predict the motion of the spacecraft. However, the validity of wind tunnel data depends on the minimization of the pos- sible sources of error and the simulation of the flow around the spacecraft in flight. The purpose of this report is to present a direct comparison between flight and wind tunnel data pertaining to the Apollo Command Module (CM) during the re-entry phase. Attention is focused on (1) simu- lating Apollo spacecraft Oil (AS-202) "as flown" in model construction, * (2) obtaining consistent pitch plane force measurements in the angle-of- attack range of interest, (3) defining the effect of Mach number on the resulting aerodynamics of the spacecraft, (4) defining the effect of Reynolds number, and (5) possible sting effects.
The aerodynamic model data reported herein were obtained in the 40-in. supersonic Tunnel A, the 50-in. hypersonic Tunnels B and C, the 100-in. hypersonic Tunnel F, the low-density hypersonic Tunnel L, and the hyper- velocity Range G (Gas Dynamic Wind Tunnels, Supersonic A, Hypersonic B, C, F, L, and 1000-ft Hypervelocity Range G) of the von Karmän Gas Dynamics Facility (VKF), Arnold Engineering Development Center (AEDC). Other Apollo wind tunnel data utilized in this report were taken from Ref. 1. The Apollo flight test results were obtained from Ref. 2.
A previous investigation (Ref. 3) on the Gemini re-entry spacecraft indicated how useful a systematic and carefully analyzed wind tunnel pro- gram could be in the prediction of flight aerodynamics of re-entry space- crafts. The strong viscous effects which could be expected to influence the aerodynamics of blunt bodies during the initial portion of re-entry were reported in Ref. 4.
*The simulated shape was that of the spacecraft 011 before re-entry; the shape changes attributable to heat shield ablation were not simulated.

AEDC-TR-67-238
SECTION II FLIGHT TEST PROGRAM
Apollo mission AS-201 was flown on February 26, 1966, to demon- strate the structural integrity of the spacecraft (009) and to evaluate heat-shield performance during re-entry (see Ref. 5). The spacecraft was not fully instrumented for re-entry flight aerodynamic data. In addition, a failure in the reaction control system resulted in a positive rolling re-entry rather than the planned lifting re-entry. Therefore, no comparisons between flight AS-201 and wind tunnel data are made in this report.
Apollo mission AS-202 was flown on August 25, 1966, using Space- craft Oil. A photograph of Spacecraft Oil prior to flight AS-202 is shown in Fig. 1. A considerable amount of detailed aerodynamic re- entry data resulted from this flight (Ref. 2). Inertial-platform acceler- ations and attitude angles were used in conjunction with a best-estimated trajectory, obtained from the onboard guidance and navigation system and from radar data, to calculate flight aerodynamic angles and force- coefficient ratios. Atmospheric data were obtained in the re-entry area. These measurements allowed a quantitative analysis between flight and preflight wind tunnel data to be made.
The sign conventions used in this report along with the equations for the lift and drag coefficients are presented in Fig. 2a. Figure 2b gives pertinent full-scale dimensions of the CM (also see Ref. 2).
A summary of pertinent aerodynamic flight data (AS-202) at high Mach numbers and preflight wind tunnel data is given in the following table:
Remarks
eg Location
x/d z/d e/d
0.2703 0. 0039 0. 0338
See Fig. 2a
L/D
Preflight Flight
0.320 0.27 - 0.30
Of deS
Preflight Flight
159 162. 5
Average trim angle at hypersonic Mach numbers
Impact Point Error
205 n.m. uprange
AS-202 was lifting re-entry

AEDC-TR-67-238
With one exception, comparison of preflight Apollo CM aerodynamic data and actual flight AS-202 data was good. The one anomaly which re- sulted was the decreased flight L/D ratio. Postflight determination of the CM center of gravity confirmed the accurate determination of its loca- tion. The decreased flight L/D could then be traced to the fact that the vehicle trimmed at an angle of attack about 3. 5 deg more than preflight moment data indicated. The resulting error in L/D was one reason that a large uprange error in splashdown position occurred. Figures 3 and 4 show altitude and flight parameters versus time from liftoff for the re- entry of mission AS-202.
SECTION III WIND TUNNEL PROGRAM
3.1 BRIEF HISTORY OF AWTTP (1962-1966)
The earlier Apollo Wind-Tunnel Testing Program (AWTTP), con- ducted prior to the present investigation, was established as part of the design and development program initiated in support of the Apollo space- craft program. The AWTTP was designed to obtain the necessary aero- dynamic data for detailed flight planning, flight analyses, and abort trajectories to meet various mission requirements. The tests were con- ducted in 25 different tunnels having Mach number range capabilities from near 0 to Mach number 19. The program was the responsibility of North American Aviation as prime spacecraft contractor. Moseley and Martino (Ref. 6) have given an excellent comprehensive chronological summary of the wind tunnel test program. Moseley, Moore, and Hughes (Ref. 1) pre- sent stability characteristics of the Apollo CM. A detailed summary of these two reports is beyond the scope of the present report. Rather, attention is drawn only to the Apollo Command aerodynamics in the attitude of heat shield forward, i. e. , the re-entry attitude.
The CM aerodynamics are important since the spacecraft is designed to employ a low L/D ratio for flight path control during re-entry into the earth's atmosphere. Since the CM will experience a wide variation of flow regimes from high altitude, high Mach number flight to low altitude, low Mach number flight, many different facilities were employed in an effort to provide the necessary flow regimes. Reference 6 includes a tabulation of the various wind tunnel facilities employed in the investiga- tion of the Apollo CM aerodynamics. In addition, two free-flight wind tunnel tests (Refs. 7 and 8) for which the heat shield was maintained in a forward attitude have been reported in the open literature. Primary parameters studied in these investigations were influence of model con- figuration, Mach number, and Reynolds number. Various studies have

AEDC-TR-67-238
been devoted to the influence of sting mount and base pressure effects, heat shield geometry, and center-of-gravity location.
3.2 BRIEF ANALYSIS OF DATA TAKEN UNDER THE AWTTP
Static stability data were taken over a Mach number range of 0. 20 to -19. Tests were made using both the smooth CM and models with surface modifications. These modifications included antennas, umbili- cal fairing (including pad 5 fairing), vent protuberances, and window and tower-leg cavities. However, on flight AS-202, the 205 miles uprange landing was in some part attributable to the aerodynamic performance of the spacecraft. The flight L/D ratio was significantly less than predicted. The primary reasons have been determined to be: (1) The actual heat shield asymmetry and surface condition of spacecraft Oil were different from that used in the preflight wind tunnel program. All wind tunnel models tested during the AWTTP had smooth symmetrical heat shields; (2) The high Mach number data taken during the AWTTP were taken early in the program. Both the Cornell Aeronautical Laboratory (CAL) Mach 15. 8 data and the AEDC-VKF Mach 18. 7 data were taken in 1962 (see Ref. 1). The accuracy of these data was such that high Mach num- ber effects could not clearly be defined.
3.3 POSTFLIGHT (AS-202) WIND TUNNEL PROGRAM
A comprehensive wind tunnel program was undertaken in order to obtain additional wind tunnel data on the CM. Only the CM in the re- entry attitude was tested in order that a systematic and carefully analyzed wind tunnel program could be completed in a short period of time. The program was a correlated effort between NASA and AEDC. Attention was focused on (1) simulating the actual vehicle ''as flown1' in model construc- tion, (2) obtaining consistent pitch plane force measurements in the angle- of-attack range 150 < a < deg, (3) the effect of Mach number over a range of from 3 to 20, (4) the effect of Reynolds number, and (5) possible sting effects. Table I presents a brief description of the wind tunnel program and the AEDC-VKF test facilities utilized during the investigation. The first test was initiated in Tunnel L during the month of December 1966. The final test entry was in Tunnel A during the month of May 1967. A detailed listing of nominal test conditions is shown in Table II.
3.4 FLIGHT AS-202 WIND TUNNEL MODELS
A number of models were constructed for use in the correlation program. The models ranged from 0. 60 in. in diameter (heat shield) to

AEDC-TR.67-238
8. 01 in. in diameter. For the Tunnels A, B, C, and F tests, the actual vehicle (spacecraft Oil) "as flown" was simulated in model construction.* Detail templates drawn to model scale were furnished to AEDC by the North American Aviation Company. These templates were computer fair- ings of actual vehicle measurements (spacecraft Oil) after installation of the ablation material over the heat shield and afterbody. Pertinent de- tails of the spacecraft ablation heat shield configuration are shown in Fig. 5. Added ablation material on the windward surfaces of the space- craft produces an asymmetrical configuration. Ablation material over the pressure pads (supporting structure) makes the heat shield wavy. Figure 6 shows a photograph of the models. A view of the asymmetrical wavy heat shield model produced by the classical Toepler-Schlieren technique is compared with the symmetrical heat shield model in Fig. 7. To the authors1 knowledge, no previous experimental investigation has been considered concerning the asymmetrical wavy heat shield shown in Fig. 7. Both smooth symmetrical and asymmetrical wavy models were studied in the present investigation to provide consistent comparative data.
Pertinent model and sting measurements are presented in Fig. 8. The asymmetrical configurations were constructed according to the templates to station X/d = 0. 30 (see Fig. 8). Hence, the symmetrical and asymmetrical configurations are identical aft of this station. Figure 9 gives the details of the umbilical fairing and surviving antenna. The nonsurviving antenna was not included on any of the models. The first series of tests in Tunnel F was inadvertently run with the umbilical housing upside down (at </> = 286 deg). However, no difference between the data for varying positions of the fairing could be noted. The Tunnel F asymmetrical model included only the umbilical housing, and the Tun- nel L and Range G models were constructed with symmetrical heat shields and no protuberances because of scale limitations.
3.5 TEST FACILITIES FOR CURRENT INVESTIGATION
The current investigation was conducted in Tunnels A, B, C, F, L, and Range G.
Tunnel A is a continuous, closed- circuit, variable density, super- sonic wind tunnel with a Mach number range of 1.5 to 6. The tunnel operates at stagnation pressures between 1. 5 to 200 psia and stagnation temperatures of 70 to 290°F.
*The simulated shape was that of spacecraft 011 before re-entry; the shape changes attributable to heat shield ablation were not simulated.

AEDC-TR-67-238
Tunnel B (a continuous closed-circuit wind tunnel) operates at a nominal Mach number of 6 or 8 at stagnation pressures from 20 to 280 or from 50 to 900 psia, respectively, at stagnation temperatures up to 890°F.
Tunnel C (similar to Tunnel B) operates at a nominal Mach number of 10 or 12 at stagnation pressures from 200 to 2000 or from 600 to 2400 psia, respectively, at stagnation temperatures up to 1440°F. The data presented in this report at Mach 12 represent the first test (except for calibration) with the Mach 12 nozzle.
Tunnel F is an arc-driven hotshot-type wind tunnel with a 100-in. test section. Nitrogen, initially confined in an arc chamber by a dia- phragm located near the throat of an attached 8-deg conical nozzle, is heated and compressed by an electric arc discharge and expanded through the conical nozzle to the test section. A useful run time between 50 and 100 msec is attained.
Tunnel L is a low density, hypersonic, continuous flow, arc heated, ejector-pumped facility, normally using nitrogen or argon as the test gas. Nitrogen was used for all the tests reported herein. Contoured nozzles provide gradient free flow at nominal Mach numbers of 4, 9, and 10 at varying free-stream Reynolds numbers.
Range G is a 1000-ft-long, 10-ft-diam, variable density tube wholly contained within an underground tunnel. Launching capability ranges from in-gun weights of 498 gm at 12, 000 ft/sec to 130 gm at 23, 000 ft/sec. Instrumentation includes provisions for pressure and temperature meas- urements, 43 dual-axis shadowgraph stations, schlieren photography, microwave and R-F cavity measurements, radiometric and spectrographic measurements, and high speed photography.
3.6 PROCEDURE
The broad range of flight conditions during flight AS-202 demanded that several of the AEDC-VKF tunnels be utilized. In order to keep the experimental program to a minimum, the results of a completed test entry were analyzed before the next test was started. For example, tests in Tunnel L were started prior to the Tunnel F tests in order to determine the viscous influence at simulated altitudes up to 350,000 ft. These tests resulted in a more meaningful experimental program in Tunnel F. However, the AEDC-VKF postflight tests still required 515 hr of testing. Selected basic data from the present investigation are plotted in Appendix II and tabulated in Table III. A summary of the testing program is as follows:

AEDC-TR-67-238
1. Viscous Effects at High Simulated Altitudes
Tests were conducted in Tunnel L at Mach numbers of 9. 37 and 10. 15. The free-stream Reynolds number (based on heat shield diameter) ranged between 234 and 1283 by varying test conditions and model size. These tests were conducted during the period of 5 December 1966 to 9 January 1UÜ7.
2. Viscous and Mach Number Effects at Simulated Altitudes of 220, 000 to 280, 000 ft, plus a Study of the Influence of the Ablator (Heat Shield Geometry)
These tests were conducted during the period of 26 December 1966 to 24 January 1967 in Tunnel F. Data were obtained over a Mach number range of 14. 6 to 20 at free-stream Reynolds num- bers of 13, 700 to 377, 000.
3. Viscous and Mach Number Effects at Simulated Altitudes of 150, 000 to 200, 000 ft, plus a Study of the Influence of the Ablator (Heat Shield Geometry)
The first tests were conducted at Mach 8 in Tunnel B over a Reynolds number range (ReaDj d) of 0. 36 x 106 to 1. 8 x 10⁶ on 17 January 1967. The tests were conducted using a small am- plitude (±3 deg), free-oscillation, cross-flexure pivot balance in order to better define the trim angle. The data indicated the need for force coefficients at similar conditions. Additional tests were conducted on 23 February 1967 with a six-component, force-type, strain-gage balance.
4. Additional Data in the High Mach Number, Low Reynolds Number Range
Additional data were obtained in Tunnel F during the week of 15 February 1967 in order to better define the variation of the Apollo force and moment coefficients with Reynolds number.
5. Verification of the Apparent Mach Number Effect
Tests were conducted in Tunnel A on 18 May 1967 at Mach 3, 4, and 6 and on 26 May 1967 in Tunnel C at Mach 12. These data were necessary in order to better define the effect of Mach num- ber on the force and moment coefficients of the CM.
6. Sting Effects
Concurrent with the tests on the sting mounted models, con- figurations with the symmetrical smooth heat shield were being launched in Range G in order to study any possible in- fluence of the sting. Shots were made with models that had full eg offsets (same as spacecraft AS-202), half eg offsets, and

AEDC-TR-67-238
zero eg offsets. The shots were made as near as possible to the Tunnel B test conditions and were made from 25 January to 25 March 1967.
3.7 ACCURACY AND REPEATABILITY
The accuracy of the data is, of course, a function not only of the uncertainty of the direct measurements but also of the test section flow properties. Except for the Mach 6 data in Tunnel A, the wind tunnel test section static temperatures were kept above the theoretical liquefaction value in order to add validity to the calculated flow properties. Assess- ments of the estimated uncertainties in individual data points are as follows:
CA 'D 'N 'm
Tunnel A ±0.01 ±0.01 ±0. 002 ±0.0012
Tunnel B ±0.01 ±0.01 ±0. 002 ±0.0012
Tunnel C ±0.01 ±0.01 ±0. 002 ±0.0012
Tunnel F ±0.03 ±0.04 ±0. 005 ±0.0018
Tunnel L ±0.03 ±0.03 ±0. 02 ±0.0025
Range G ±0.02 -- --
<*T« deg
±1. 2
SECTION IV WIND TUNNEL CORRELATION PARAMETER
The comparison of wind tunnel or range data with flight data requires the determination of a suitable correlation parameter. The need for a correlation parameter, of course, is attributable to the fact that flight conditions and model size can seldom be duplicated in the wind tunnel.
Viscous effects are sometimes scaled using free-stream Reynolds number as the scaling parameter, but it is well known that this Is not always the best procedure. Higher altitude viscous interaction effects have been successfully accounted for using the parameter v,,, (Ref. 9 and 10). Both an Re,, and v^ parameter appear to be applicable to either blunt or sharp slender bodies or for configurations for which viscous effects are of second-order importance. However, the flow field of in- terest about a very blunt body such as the Apollo CM is the flow which is separated from the free stream by the bow shock wave.
If the bow shock is strong everywhere (M,,, sin 0]-, » 1), the density ratio e approaches the limit (7- l)j{y+ 1), and the flow quantities

AEDC-TR.67-238
immediately behind the shock become dependent upon only p^, U^, and cr.* In addition, the local Mach number downstream of a normal shock M2 is always a low subsonic value with only about a 2-percent variation between M,,, = 10 and 25. The shock Reynolds number Re2cj may be expressed as
Re 2d = P2Uad//i2
= (pooL'oodVpij
where d is the characteristic length chosen as the diameter of the heat shield in the present case.
Very high altitude rarefaction effects can be shown to be inversely proportional to the shock Reynolds number by noting:
Kn2d = Vd = (ny/2) ji,/paa2d
which reduces to
Kn2d = 1-483 M,/Re2d
where y = 1.4. For free-stream Mach numbers of practical interest (10 < M,,, < 25), the local Knudsen number may be expressed as
Kn2d = 0.569/Re2d
to an accuracy of about ±1 percent.
An improved parameter would be one which would account for wall temperature effects (Ref. 11) such as:
Rewd = (Re2d) ^/>w
However, lack of accurate wind tunnel and flight wall temperature values and the fact that
(/*oo///„)wind lunnel ~ W/Oflight
in the present case suggests that Re2d should be an adequate correlation parameter between flight and wind tunnel data as long as the free-stream Mach number is high. Flight values of Re2d for mission AS-202 are shown in Fig. 10. The velocity profile from the flight data was used in conjunction with the 1962 standard atmosphere and the viscosity values of Ref. 12 and Ref. 13 for the calculation of Re,d. Calculations based on flight values of free-stream pressure and temperature gave essentially the same results. For the flight data, real gas normal shock relation- ships from Lewis and Burgess (Ref. 13) were employed. VKF wind
*Neglects effects of shock and boundary layer merging at the higher simulated altitudes.

AEDC-TR-67-238
tunnel data reduction programs include calculation of shock Reynolds number. Nominal facility test conditions obtained during the present investigation are indicated in Fig. 10 and tabulated in Table II to illustrate the regions of flight simulation achieved. Figure 11 compares both the Mach number (M0) and Reynolds number variation (Re2d) of mission AS-202 with the facility test conditions. Note that although a variation of nearly five orders of magnitude in Reynolds number is shown, actual Mach number and Reynolds number simulation are achieved only at Mg, = 6 and 8. However, it will be shown that this lack of simulation, although undesirable, is not serious.
The basis of the correlation presented in this report is illustrated in Fig. 12. When the pitching-moment data from the present investigation at a given angle of attack are plotted versus Re2d> a consistent trend at values of Re2d above 10^ does not exist. However, plotting the same data (Re2(j > 10^) versus Mach number presents a consistent variation. The other aerodynamic data (C]\j, C^) on the Apollo CM exhibit similar trends. The wind tunnel data at values of Re2d < 200 were at Mach numbers of 9. 4 and 10. 2 (see Fig. 11). However, the strong viscous effects in this regime should make variations in free-stream Mach number rather in- significant.
These observations indicate that Apollo flight AS-202 aerodynamic data should be correlated on the basis of Re2d down to an altitude of 177, 000 ft (M„ > 14) and on Mach number below this altitude (Re2d > !05).
SECTION V WIND TUNNEL DATA CORRELATION AND COMPARISONS
The AEDC-VKF data are correlated over a free-stream Reynolds number range of 234 to 1. 9 x 10^ based on heat shield diameter and a Mach number range of 2. 98 to approximately 20. The resulting correla- tions are shown in Figs. 13 through 15. The data points presented repre- sent fairings of the basic data.
Figure 13 shows the variation of the axial-force coefficient of the Apollo CM with Re2d anc* Mach number. Note the significant increase in C-A at values of Re2d below 1000 and the slight increase at the lower free- stream Mach numbers. The reference area of the symmetrical smooth heat shield is used in data reduction which, in part, accounts for the higher axial force of the asymmetrical wavy heat shield configuration. Model scale limitations did not permit the asymmetrical wavy heat shield to be studied at low values of Re2d- Therefore, the aerodynamics of the
10

AEDC-TR-67-238
symmetrical and asymmetrical models are assumed to be identical below a Re2d of 200 since viscous effects should dominate in this flow regime.
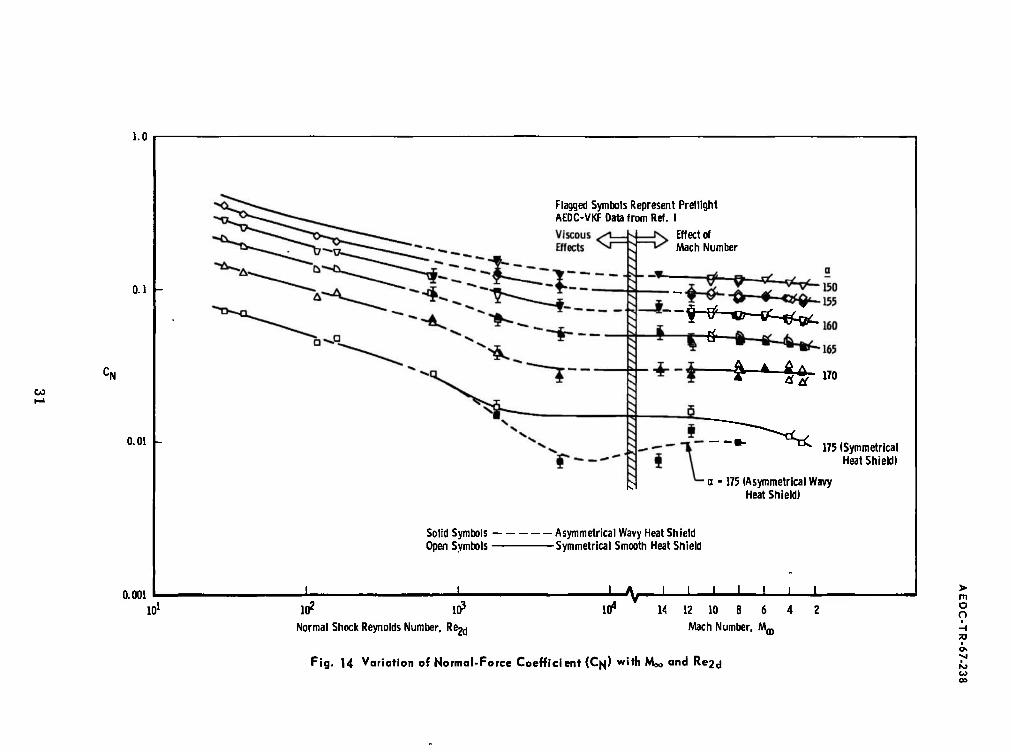
The normal-force coefficient (C]\j) is presented in Fig. 14. Viscous effects are significant below a Re2d value of about 7000, whereas varia- tions of Cjq attributable to Mach number are generally slight. The asymmetrical wavy heat shield causes a decrease in the normal force (Cjq) only at angles of attack between 170 and 180 deg.
Significant variations in the pitching moment (Cm ) of the Apollo CM with Reynolds number, Mach number, and heat shield configuration are shown in Fig. 15. The effect of the asymmetrical wavy heat shield is greater at the high Mach number-high Reynolds number flight condi- tion (M,,, > 14 and Re2<j — 5000) which represents a major portion of Apollo flight AS-202. Additional data in this important test regime would have been helpful. The strong viscous effect on pitching moment can be observed in Fig. 16, where the reference point is the most forward point on the heat shield centerline.
The effect of the normal shock Reynolds number (Re2^) on L/D ratio of the Apollo CM is shown in Fig. 17. At a given angle of attack, over a 40- percent decrease is noted in L/D between a simulated altitude of 130, 000 and 350, 000 ft. The figure illustrates the importance of viscous effects at high altitudes.
In order to determine if the wind tunnel data were free of signifi- cant sting effects, several models were launched in the 1000-ft Range G at AEDC-VKF. Figure 18 is a photographic history of a typical Range G shot. Figure 19a shows the variation of a and ß as the model flies downrange, during shot 620. Figure 19b presents the same shot in terms of the measured range angles 0 and ^. A second-order computer fit of the data is shown to illustrate the typical data fit. A comparison of the free-flight Range G data with the wind tunnel data is shown in Fig. 20. Note the good agreement and thus apparent lack of sting effects. Also, Fig. 21 compares the low density free-flight data of Horstmann and Kussoy (Ref. 7) from the Ames 1 -ft shock tunnel with the present sting mount data from AEDC-VKF Tunnel L. Again, no apparent effect of the sting is noted.
Comparisons of the present symmetrical heat shield data with the previous data of Moseley, Moore, and Hughes (Ref. 1) are given in Fig. 22. Generally, good agreement is noted.
11

AEDC-TR-67-238
Balance cavity pressures were measured during the Tunnel A, B, C, and F test entries in order to monitor the flow in the base region of the model. In addition, a windward and leeward pressure on the afterbody were measured during the Tunnel F test entry. Figure 23 presents selected data from these measurements. No trend with Reynolds num- ber or Mach number on the leeward or windward surfape is noted, pos- sibly indicating that the flow remained separated over the aft portion of the re-entry module.
SECTION VI APOLLO FLIGHT-WIND TUNNEL DATA COMPARISONS
A comparison between the Apollo AS-202 flight trim angle of attack and wind tunnel data is presented in Fig. 24a. Note the good agree- ment of the asymmetrical wavy model wind tunnel data with the flight test data over the regime of trimmed flight. The correlation was made by using Re2d as the correlation parameter from re-entry to an altitude (177, 000 ft) at which MB = 14 was reached and a Mach number correla- tion below this altitude. The correlation curves were obtained by cross plots of Fig. 15. The flight test data were obtained from the paper by Hillje (Ref. 2). The postflight symmetrical model correlation along with the preflight estimate (Ref. 2) are given for completeness. The pre- flight estimate was based on previous symmetrical model data. A sum- mary of CJ^/CA,.
and tne L/f} ratios for Flight AS-202 is shown in Figs. 24b and c. Again, good agreement is noted between the flight and asymmetrical wavy model wind tunnel data. The offset eg of spacecraft 011 changes during the final re-entry phase attributable, in part, to fuel usage. The effect of this variation on the correlated wind tunnel data is also shown in Figs. 24 and 25.
Figure 25 compares the present trim angle of attack and corresponding L/D to Apollo Mission AS-202 flight data. However, the comparison is shown in terms of Re2cj and M,,, rather than flight time, as shown in Fig. 24, to illustrate the strong viscous influences found in the present study. Typi- cal flight data from Mission AS-202 are tabulated in Table -IV.
In order to demonstrate the extreme sensitivity of the aerodynamic characteristics of the Apollo CM to variations in flow regimes and eg location, Fig. 26 was constructed from the present data. Three flow conditions were selected to represent the range encountered as the CM re- enters the earth's atmosphere. The data were then referenced to various
12

AEDC-TR-67-238
e/d and x/d locations with the resulting curves shown in Fig. 26. In- cluded are the experimentally determined L/D ratios as a function of angle of attack at the three flow conditions selected. For a center-of - gravity location corresponding to the AS-202 flight, an L/D variation from 0. 320 to 0. 225 (30 percent) could be expected over the flow regime selected. Newtonian calculations would give a 10-percent increase in L/D attributable to the trim angle change from 159. 4 to 157. 4. Hence viscous effects cause a 40-percent decrease in L/D over the selected regime. Figure 17 clearly illustrates the strong viscous influence on L/D.
SECTION VII CONCLUDING REMARKS
A post-flight investigation was undertaken in order to obtain static stability characteristics of the Apollo CM "as flown" during flight AS-202. The principal conclusions of the investigation can be sum- marized as follows:
1. The influence of the ablator (heat shield) geometry causes a significant change in trim angle of attack and thus a decrease in available L/D ratio.
2. Wind tunnel data indicate that a very strong viscous influence exists on the Apollo CM in the initial portion of re-entry extending down to a simulated altitude of about 220, 000 ft.
3. The Mach number influence extends to a value of about 14, which is substantially higher than previous blunt body investiga- tions have indicated.
4. Based on the agreement between wind tunnel data, where real gas effects were not simulated, and full-scale flight data, where real gas effects were present, it may be concluded that real gas effects are not significant on the static stability of the Apollo CM at velocities up to 27, 000 ft/sec.
REFERENCES
1. Moseley, William C., Jr., Moore, Robert H. , Jr., and Hughes, Jack E. "Stability Characteristics of the Apollo Command Module." NASA TN D-3890, March 1967.
2. Hillje, Ernest R. "Entry Flight Aerodynamics from Apollo Mission AS-202." NASA TN D-4185, October 1967.
13

AEDC-TR-67-238
3. Griffith, B. J. "Comparison of Aerodynamic Data from the Gemini Flights and AEDC-VKF Wind Tunnels. " AIAA Journal of Spacecraft, Vol. 4, No. 7, pp. 919-924, July 1967.
4. Boylan, David E. and Potter, J. Leith. "Aerodynamics of Typical Lifting Bodies under Conditions Simulating Very High Altitudes." AIAA Journal, Vol.5, No. 2, pp. 226-232, February 1967.
5. Postlaunch Report for Mission AS-201, MSC-A-R-66-4, May 6, 1966.
6. Moseley, William C., Jr., and Martino, Joseph C. "Apollo Wind Tunnel Testing Program-Historical Development of General Configurations." NASA TN D-3748, December 1966.
7. Horstmann, C. C. and Kussoy, M. I. "Free-Flight Measurements of Aerodynamic Viscous Effects on Lifting Re-Entry Bodies. " AIAA Paper No. 67-165, Presented at the 5th Aerospace Sciences Meeting, January 23, 1967.
8. Seiff, Alvin. "Current and Future Problems in Earth and Planetary Atmosphere Entry. " AIAA Paper No. 67-803, October 1967.
9. Whitfield, J. D. and Griffith, B. J. "Viscous Drag Effects on Slender Cones in Low-Density Hypersonic Flow. " AIAA Journal, Vol. 2, No. 6, June 1965, pp. 1165-1166.
10. Whitfield, Jack D. and Griffith, B. J. "Hypersonic Viscous Drag Effects on Blunt Slender Cones. " AIAA Journal, Vol. 2, No. 10, October 1964, pp. 1714-1722.
11. Potter, J. Leith. "The Transitional Rarefied-Flow Regime. " Rarefied Gas Dynamics (C. L. Brundin, ed. ), Vol. 2, pp. 881-937, Academic Press, New York, 1967.
12. Yos, Jerrold M. "Transport Properties of Nitrogen, Hydrogen, Oxygen, and, Air to 30, 000°K. " AVCO Report RAD-TM-63-7, March 1963.
13. Lewis, Clark H. and Burgess, E. G. , III. "Altitude Velocity Table and Charts for Imperfect Air. " AEDC-TDR-64-214 (AD454078), January 1965.
14

AEDC-TR-67-238
APPENDIXES
I. ILLUSTRATIONS II. BASIC DATA PLOTS
III. TABLES
15

AEDC-TR-67-238
Fig. 1 Photograph of Spacecraft Oil Prior to Mission AS-202
17

AEDC-TR-67-238
e/d - 0.0338) v,iah+ x/d = 0.2703 >!"|" z/d = 0.0039} AS"ZW
z Normal to ^
Cn = Cv sin (180 - a) - C. cos (180 - a) 'N C, = CN cos (180 - a) - CA sin (180 - a)
a. Orientation of Forces and Moments
142.57 H
All Dimensions in Inches
b. Apollo Spacecraft (Symmetrical Smooth Heat Shield Dimensions)
Fig. 2 Apollo CM Forces and Dimensions
18

400
300
©
X) 3
■H
200
100
Significant Re-Entry Events
a. Entry b. Main Parachute
L-L o 4300 4500 4700 4900
Time from Liftoff, sec
Fig. 3 Time History of Apollo Mission AS-202
5100 5300 * -i 10

40 ._
to o
30 -
30,000 i—
3
m 20,000 a
■H o o
10,000
o ■—
20
10
o n
± I 1 4400 4500 4600 4700 4800 4900
Time from Liftoff, sec
5000 5100
Fig. 4 Re-Entry Flight Parameters for Apollo Mission AS-202

AEDC-TR-67-238
Pad 4 (Recessed)
Pad 3 (Flush)
270 ymmetrical Smooth
Heat Shield
Approximated Ablator
Asymmetrical Wavy Heat. Shield
1.8450 (Maximum Ablator Thickness)
Relative Velocity
Pad 6 (Recessed)
Pad 2 (Recessed)
Pad 1 (Step)
All Dimensions in Inches
<t> = 90 View Looking Forward
Mission 202
Fig. 5 Apollo Heot Shield Asymmetry
21

NO CO
A E D C 3636-67
> m o r> H 70
Fig. 6 Apollo Models

AEDC-TR-67-238
a. Symmetrical Smooth Heat Shield
b. Asymmetrical Wavy Heat Shield
Fig. 7 Toepler-Schlieren Photograph of Face of Tunnel F Models
23

AEDC-TR-67-238
x/d =0.30 x/d =0.30
Spacecraft Oil Simulated to Here
1.25
Tunnels A, B. and C
Smooth Heat Shield and Asymmetrical Wavy Heat Shield
Tunnel F
Smooth Heat Shield and Asymmetrical Wavy Heat Shield
Roll Pins
0.160
d = 0.60, 0.80
Range G
Smooth Heat Shield
Tunnel L
Smooth Heat Shield
All Dimensions in Inches
Fig. 8 Model and Sting Dimensions Used in Postflight Wind Tunnel Program
24

AEDC-TR.67-238
0 " 270 deg
Umbilical Housing (UH) Surviving
Antenna (SA)
0=0 deg <t> = 180 deg
0 = 90 deg
Tunnel Heat Shie Id Protuberances Used Model
Designation
A Smooth Wavy Wavy
None UH and SA
SA I
II III
B Smooth Wavy
None UH and SA
C Smooth Wavy Wavy
None SA UH and SA
F Smooth Wavy
None UH IV
G Smooth None
L Smooth None
a. Location of Protuberances
Fig. 9 Model External Protuberances
25

AEDC-TR-67-238
0.281
Tangent to Basic Mold at Structural <£ 0.750
Tunnels A, B, and C Umbilical Housing
All Dimensions in Inches
Ablation Material 1.845 Full-Scale Thickness
0.150
X y
0 0 0 0.115
0.012 0.203 0.051 0.255 0.153 0.353 0.305 0.407 0.407 0.415 0.509 0.407 0.661 0.366 0.814 0.251 0.865 0.180 0.915 0.069 0.938 0
1.288 to Tangent Line
Tunnels A, B, and C Model Surviving Antenna
b. Protuberances Details ■ Tunnel A, B, and C Model
Fig. 9 Concluded
26

10<
105-
104-
to Re 2d
10"
10'
20
300 250
~i—r 214
Altitude ft x 10
250 257
(AS-202)
200
r
Sym
D Facility
VKF-A
00
"3.0-6.0
X VKF-B ~8.0
A VKF-C ~12
a VKF-F "14.6-20
0 VKF-G "6.0-8.0
o VKF-L "9.4-10.2
150 122
4400 4500 4600 4700 4800
Time from Liftoff, sec
4900 5000 5100
> m o O
TO ■
■vl I ro
Fig. 10 Shock Reynolds Number Flight Simulation

a n
40 r
10
4.0h
M CO 00
0D
1.0
L Apollo Mission AS-202 Trajectory
•• ••
Sym AEDC Facility
D VKF-A(40in. Supersonic) x VKF-B (50 in. Supersonic) A VKF-C(50in. Supersonic) D VKF-F(100in. Hypersonic) 0 VKF-G (1000-ft Range) • VKF-L (Low Density)
10* 103
Re 104 Iff5 Iff6
2d
Fig. 11 Mach Number and Shock Reynolds Number Flight Simulation

0.01
Apparent Reynolds ^i K. Apparent Mach Number Effect >J i> Number Effect
a - 160 deg "14.6
0 _ eg
-0.01
H " 18
J
T x*-° M > 14—7
"12. -%±-_^_..§._ — — ~8
Asymmetrical Wavy Heat Shield Model (6-Component Balance Data)
J I I I I I I II I ' I I I I III
5 ~G 5-- ~4 ) ~3
J_L 10" 10^ 10
Re 2d
10" 10v
DO CO 0.01
"eg
-0.01
I a - 160 deg
J I L J I I I I L 16 14 12 10
Fig. 12 Typical Data Plot Showing Basis of Data Correlation
m O n
•si
U

AEDC-TR-67-238
Ur
1.6
<k >-°
1.8
1.6
- l.d
s 1.4 - l.Sr
1.2 - 1.6
1.4
1.2
1.2
1.0
s - 1.8 -
1.6
1.0U 1.4 a ■ D
1.2
1.0
Syrr g
o 180 □ 175 A 170 & 165 D 160
■ O 155 V 150
Open Symbols- Solid Symbols -
-Symmetrical Smooth Heat Shield -Asymmetrical Wavy Heat Shield
Flagged Symbols Represent Preflight AEDC-VKF Data
Viscous Effects <=!=>
1.6
1.4
1 2 ~l 1 8
1.6
1 8 " 1.4 '
1.2
1.4E-I 1 0
Effect of Mach Number - 1 0
20 102 105
Normal Shock Reynolds Nuirber, Re^
1A-I I I I I L .,4 » ~77^.....
j-i 104 14 12 10 8 6 4 7
Ma;h Nuirber, Mm
Fig. 13 Variation of Axial-Force Coefficient (C^) with M^and Re2j
30
1.0
Co
0.1
0.01
Flagged Symbols Represent Preflight AEDC-VKF Data from Ref. I
Effect of Mach Number
-$-&-*>-*-*&&.
-ft 4 ÜA *tf 170
175 (Symmetrical Heat Shield)
• a -175 (Asymmetrical Wavy Heat Shield)
Solid Symbols Open Symbols
Asymmetrical Wavy Heat Shield -Symmetrical Smooth Heat Shield
0.001 101
J. 102 103
Normal Shock Reynolds Number, Re^
J I I I I ' ' 104 14 12 10 8 6 4 2
Mach Number, tAw
Fig. 14 Variation of Normal-Force Coefficient (C^) with M«, and Re2d
> m o n ■

AEDC-TR-67-238
0.04
0.03
0.02
0.01
-0.01
"eg
-0.02
-0.03
-0.04
-0.06
-0.05 -
-0.07
Open Symbols Symmetrical Smooth Heat Shield Solid Symbols Asymmetrical Wavy Heat Shield
Flagged Symbols Represent Pref light AEDC-VKF Data from Ref. 1
-■S-~
:-»....
-4*-s
r—i-k.
i __* Lt
Viscous
-i^
«=H>
^
* ^
* „-^ *
>^>-, □v
165
170
175
:*-- 180
Effect of Mach Number
J L J L 30 102 103
Normal Shock Reynolds Number, Re2(j
104 14 12 10 8 6 4 2
Mach Number, Mg,
Fig. 15 Variation of Pitching-Moment Coefficient (Cmc ) with M» and Re2j
32

AEDC-TR-67-238
0.18
0.16
0.14
0.12
0.10
m HS
0.08
0.06
0.04
0.02 -
Sym 00 "c2d AEDC Facility
O 10.2 30 VKF-L
fc. 10.2 40 VKF-L
D 9.4 120 "VKF-L
O 9.4 160 VKF-L
0 18 680 VKF-F A 20 1800 VKF-F
Symmetrical Smooth Heat Shield Model
180 170 160 150
a, deg
Fig. 16 Variation of Pitching Moment Referenced to Heat Shield (Cm^j) with Re2d
33

AEDC-TR-67-238
0.50 r
0.40
0.30
L/D
0.20
0.10
Sym AEDC
Facility M 00
Re2d AS-202 Simulated „ Altitude, ft x 10
A VKF-A 6.0 500,000 130
• VKF-F 14.6 21,000 225
■ D VKF-F 20.0 1,800 280
V VKF-L 9.4 160 325
0 VKF-L 10.2 30 350
Closed Symbols - Asymmetrical Wavy Model Open Symbols - Symmetrical Smooth Model
I
180 170 160
Angle of Attack, deg
150
Fig. 17 Effect of Shock Reynolds Number on Lift-to-Drog Ratio
34

AEDC-TR-67-238
APOLLO COMMAND MODULE ■ VELOCITY* 6700 FT/SEC; RANGE PRESSURE ' 14.82 MM H,; WEIGHT = 184.56 GM; C OF G AXIAL'27.6% OF OVERALL LENGTH; C OF G TRANSVERSE * 3.84% OF THE DIAMETER
MODEL IN SABOT
143 FT.
HORIZONTAL X-RAY
p 4 ^H ^w
UBJU
1 1 ..
243 FT.
VERTICAL X-RAY
*
343 FT.
atlfifi r-w n
245 135 25
Fig. 18 Photographic History of Range G Shot
o ■ f
35

AEDC-TR-67-238
Shot 620 M
00
e/d 8.38
0.0339 Re
oo, d 90,900 x/d - 0.2713
aE - 157.2
D
O
a 4 159.6
158.96
1.268
150 (Corrected to Zero Roll Rate)
170 -10 0
P, cleg
a. Variation of a and ß (Body Angles)
Fig. 19 Flight of Apollo Model in Range G, Shot 620
10
36

AEDC-TR.67-238
30
20 -
10 -
CD
-10 -
-20 -
-30
— ^&*"^
Shot 620
O Measured Angles
(Second Order) ~ Roll Rate =0.32 °/ft
1 1 \J !
-30 -20 -10 10 0
t/j, deg
b. Variation of 0 and ift (Range Angles)
Fig. 19 Concluded
20 30
37

AEDC-TR-67-238
'S.
-P 03 tß
«W tH o
■p
0.04
0.03
-i 0.02 > u O
O I u
0) ■p Ö 0) o
0.01
O Range G Data
R*2d ? 104
-4? #
:# «J^Z
!s£
jt° >—Correlation of Wind
Flight AS-202 e/d Location
I
Tunnel Data, M ~ 8.5, 00
Fig. 15
I I
Trim Angle of Attack, ou,
1.50 ._
1.25 -
o
1.00 -
180 170 160
Effective Angle, a£
150
Fig. 20 Comparison of Free-Flight (AEDC-Range G) to Sting Mounted Tunnel Data
38

AEDC-TR-67.238
0.3i-
Sym Facility Reference
O Ames 1* Shock 7
D VKF-L Present
L/D 0.2
0.1
0.40
14 Free Flight
10 Sting Mounted
O.
a = 160 deg
CT 0.20 - ±10 percent
180 150 170 160 Effective Angle, cu.
Fig. 21 Comparison of Free-Flight (Ames Shock Tunnel) to Sting Mounted Tunnel Data
39

o
0.05
m c8.
-0.05 -
-0.10 -
O Average Data from Fig. 8(d), 8(f), and 8(h) of Ref. 1 Present Data Correlation Curves of Fig. 13, 14, and 15
0.05
MB - 4.oj o
0.05
-[■„ = 5-°) 0
- MM = 7.33] 0
M = 9. 00
-0.10 140 160 180 200
a
-2.0 140 160 180 200
a
140 160 180 200
a
n
ON
Fig. 22 Comparison of Present Results with Previous Data, Symmetrical Smooth Heat Shield

£i
0.05 w-
0.04
0.03
P/Po
0.02
0.01
a = 155 deg
(AEDC-VKF-F)
JE.
*•
M ~ 20
10"
Open Symbols - Symmetrical Smooth Heat Shield
Closed Symbols - Asymmetrical Wavy Heat Shield
19
x/d = 0.390
x/d ■= 0.472
14.6
lO" 10'
> m D
Re 2d
Fig. 23 Variation of Afterbody Pressures with Reynolds Number, M^ >14

to
Sym
o o A D
0 a o
166
Facility
NASA Typical Flight Data, Ref. 2 AEDC VKF-F AEDC VKF-C AEDC VKF-B AEDC VKF-A AEDC VKF-G AEDC VKF-L
kv^sxvM Spacecraft May Not Be Aerodynamically Trimmed-
Open Symbols - Symmetrical Smooth Model durin9 These Re9ions
Closed Symbols - Asymmetrical Wavy Model
> m O n
340 250 Apollo Mission AS-202 Re-Entry Altitude, ft x 10"3
220 250 200 150 120
° 164
& 162 < o o> en
160
158
156 -
154
Asymmetrical Wavy Model
-l 1 1 Effect of Flight e/d Variation with Time
-Symmetrical Smooth Model Correlation Curves
(e/d-0.03384, x/d - 0.2703)
SSSSSSSSSU. Pref light Estimate (Ref. 2)
J£5SE5SSSL_J I 4400 4500 4600 4900 5000 4700 4800
Time from Liftoff, sec
a. Trim Angle of Attack
Fig. 24 Comparison of Apollo Mission AS-202 Flight Data with AEDC-VKF Tunnel Data
5100

00
cN/cA
-0.24
-0.22
-0.20
-0.18
-0.16
-0.14
-0.12
-0.10
-0.08
-0.06
-0.04
-0.02
Sym O
Facility
NASA Typical Flight Data, Ref. 2 AEDC-VKF-F AEDC-VKF-C AEDC-VKF-B AEDC-VKF-A AEDC-VKF-L
Asymmetrical Wavy Model
Symmetrical Smooth Model
Note: All Tunnel Data at atrjm
Aerodynamically Trimmed
A_ o ° ° <?>
Correlation Curve Asymmetrical Wavy Model
Mm = 14 Effect of e/d Variation with
I
4400 4500 4600 4700 4800
Time from Liftoff, sec
b. Normal to Axial-Force Ratio
Fig. 24 Continued
4900 5000 5100
> m
n
■ ro u

n
0.4
to
i 0-3 i o
0.2
Sym
o
▲ ■
r o
\
Facility
NASA Typical Flight Data, Ref. 2 AEDC-VKF-F AEDC-VKF-C AEDC-VKF-B AEDC-VKF-A AEDC-VKF-L
Asymmetrical Wavy Model
Symmetrical Smooth Model
Notes: For Time < 4480 sec, Tunnel Data Plotted at af|jght
For Time > 4480 sec, Tunnel Data Plotted at a trim
FlightData Very Erratic for Time < 4480 sec
Pref light Estimate (Ref. 2)
Aerodynamically Trimmed Correlation Curve Asymmetrical Wavy Model
I I
Mo, = 14
Effect of e/d- Variation with Time
U 09
4400 4500 4600 4700 4800 Time from Liftoff, sec
c. Lift to Drag Ratio
Fig. 24 Concluded
4900 5000 5100

0.40
0.30 -
0.20
ff 162 -
158 -
154
Sym Facility
o NASA Typical Flight Data, Ref. 2 ♦ AEDC-VKF-L Symmetrical Smooth Model • AEDC-VKF-F ) ▲ AEDC-VKF-C Asymmetrical ■ AEDC-VKF-B Wavy Model ▼ AEDC-VKF-A /
Estimated Accuracy
Fig. 25 Summary of (L/D)j and aT Data
> m o n
ro w ao

> m o r>
0.50
8.0
6.0 _ 0.04 -
£ 4.0
2.0 -
01-
■10
■50
Symmetrical Smooth Model' 'The aerodynamics of the asymmetrical and symmetrical models are assumed to be identical at this flow condition.
160 170
Trim Angle of Attack, deg
Fig. 26 Effect of Center-of-Gravity Location at Three Flow Conditions

AEDC-TR.67-238
'm eg
0.012
0.008
0.004
0
-0.0M
-0.008
-0.012 h
Sym MOD Re^dXlO3 Re^xlO3
-0.016
•O 7.88 36' I 38.3 ♦o 7.91 590 64.5 AA 7.95 1100 120 (AEDC-VKF-B) ■ O 7.99 180 3 192
±0.35 deg—*
.*&,' ^>< M
Asymmetrical .■*». Wavy Heat Shield J&%'*
•d$ß^'^~\ r ±0-35 deg
\v Symmetrical Smooth Heat Shield
o
1 1 1 1 1 1 1 1 1 165 160
a, deg
a. Data from Free Oscillation, Cross-Flexure Pivot Balance
Fig. 11-1 Basic Wind Tunnel Data Showing Effect of Heat Shield
155
47

AEDC-TR-67-238
0.02
0.01
0
-0.01
Cm -0.02 mcg
CA
o Symmetrical Smooth Heat Shield • Asymmetrical Wavy Heat Shield
Mo, "4.0
Re^a-l^xlO6
Re2d = 0.48xl06
(AEDC-VKF-A
b. Six-Component Balance Data, Mr,
Fig. 11-1 Continued
4.0
48

AEDC-TR-67-238
0.03
o Symmetrical Smooth Heat Shield • Asymmetrical Wavy Heat Shield
'm eg
c. Six-Component Balance Data, M„
Fig. 11 — 1 Concluded
= 20
49

AEDC-TR-67-238
■cA
2.0
1.8
1.6
1.4
1.2
Sym *e2d moo AEDC Facility
O 28.9 10.15 VKF-L D 38.5 10.15 VKF-L o 118.0 9.37 VKF-L A 157.0 9.37 VKF-L o 680 18 VKF-F & 1800 20 VKF-F
Symmetrical Smooth Heat Shield Model (Model I)
1.6
-cA
1.4 -
1.2
1.0
Sym Ke2d ^ AEDC Facility o 31,300 11.76 VKF-C D 55,200 11.88 VKF-C o 112,000 7.94 VKF-B A 210,000 7.99 VKF-B o 483,000 4.00 VKF-A & 466,000
Model 1
2.98 VKF-A
M^ - 8 to 12
1 1 l Mgj^.OO
180 175 170 160 155 165
a, deg a. Variation of CA with a. Symmetrical Model
Fig. 11-2 Variation of Aerodynamic Forces with Re2j, Basic Data
150
50
AEDC-TR-67-238
0.32
0.28
0.24
0.20
cN a 16
0.12
0.08
0.04
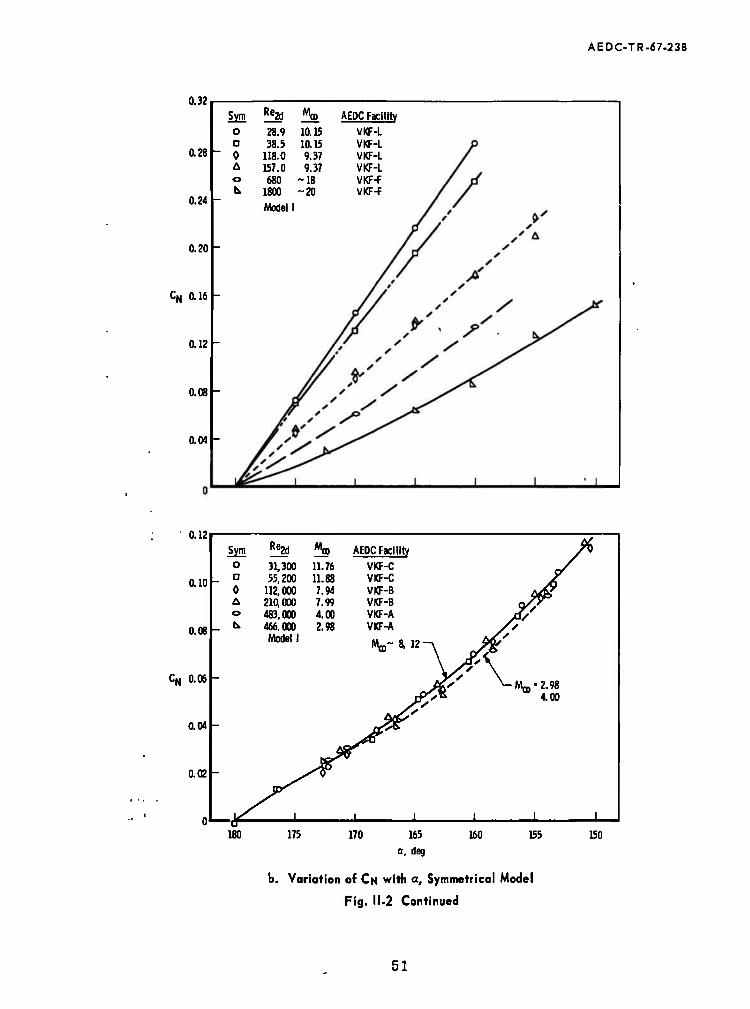
Sym Re^ %> AEDC Facility
o 28.9 10.15 VKF-L a 38.5 10.15 VKF-L 0 118.0 9.37 VKF-L A 157.0 9.37 VKF-L © 680 -IB VKF-F b. 1800
Model
-20 VKF-F
0.12
0.10 -
0.08 -
CN 0.06 -
0.04 -
0.02 -
Sym Rea % AEDC Facility o 31,300 11.76 VKF-C a 55,200 11.88 VKF-C 0 112,000 7.94 VKF-B A 210,000 7.99 VKF-B o 483.000 4.00 VKF-A J&/ G. 466.000 2.98 VKF-A //
Modell S*
4.00
npyoT
-
i i 1 1 1 1
180 175 170 165
a, deg
160 155
b. Variation of CN with a, Symmetrical Model
Fig. 11-2 Continued
150
51

Ül N3
0.03
0.02 -
0.01 -
0
-0.01
"eg -0.02 -
-0.03 -
-0.04
-0.05
-0.06
Rea"! 800^. .
- Re« ' 118 157 4
Re-M»680-\ / v4 t Q
'^-Re2d-28.9
_
-Re^^S
4 i
* Sym o a 0 A o
Re^i
28.9 38.5
118.0 157.0 680
1800
Modell
10.15 10.15 9.37 9.37
~18 -20
AEDC Facility
VKF-L VKF-L VKF-L VKF-L VKF-F VKF-F
l
180 170 160 150 a. deg
.
X s
M-, ' 11.76 —V S* 11.88 \ S.'Ss~
7.99 \>s T _ S? *j( j&<&7\ x— M,,,-4.00
Xsss -
J?X X%r
^-MflD »2.98
- aß? sym Re2d Mffl AEDC Facility
y& o 31,300 11.76 VKF-C ' D 55,200 11.88 VKF-C
0 112,000 7.94 VKF-B * 2iaooo 7.99 VKF-B © 483,000 4.00 VKF-A ü 466,000 2.98 VKF-A
1 Model 1
_. i
180 170 160 150 a, deg
c. Variation of Cm with a. Symmetrical Smooth Model
Fig. 11-2 Continued
> m o n
U

-1.6
-1.4 -
■1.2 -
■1.0
-1.6
-1.4
-1.2
-1.0
AEDC-TR- 67-238
Sym Re2d Moo AEDC Facility
o 680 -18 VKF-F o 1,800 -20 VKF-F O 4,700 -19 VKF-F A 21,000 -14.6
Model IV
VKF-F
ft -0-- /^Rea-680
1—y-1*-^- U
— *- Re2d
a 1700 to 21, 000 ^^""-^ID
1 1 I II 1 1
Sym Ke2d ^ AEDC Facility
o 31,300 11.76 VKF-C a 55,200 11.88 VKF-C o 112,000 7.94 VKF-B A 210,000 7.99 VKF-B o 496,000 5.92 VKF-A D 483,000 4.00 VKF-A V 466,000
Model 11
2.98 VKF-A
Mm-2.98
MQ, - 6 to 12
M^M.OO
180 175 170 165
a, deg
160 155 150
d. Variation of CA with a. Asymmetrical Model
Fig. 11-2 Continued
53

AEDC-TR-67-238
0.Z0
0.16
0.12
Sym "ea, Mo, AEDC Facility o 680 -18 VKF-F D 1,800 ~20 VKF-F 0 4,600 -19 VKF-F A 21,000 -14.6
Model IV
VKF-F
CN 0.08
0.04 Re?d ■ 4.600 to 20, 000
-0.04
0.12
0.10 h
0.08 h
0.06h
0.02 h
oh
-0.02
Sym Re2d «a. AEDC Facility
O 31,300 11.76 VKF-C D 55,200 11.88 VKF-C 0 112.000 7.94 VKF-B d** A 210,000 7.99 VKF-B Als o 496,000 5.92 VKF-A y&/£> k 483,000 4.00 VKF-A A' V 466,000 2.98 VKF-A
Model II M,,,-12-. A Jgv
"^ Mg,-3 to 6
^Mm-8
-
*$£/£'
l_ L 1 1 1 1 " 180 175 170 165
a, deg 160 155
e. Variation of CN with a. Asymmetrical Model
Fig. 11-2 Continued
150
54

en on
O.03
0.02
0.01 -
o -
-0.01 -
"eg ■0.02 -
-0.03 -
-0.04 -
-0.05 -
-0.06
- A'? -
V' . y - A
f J
Svm Re2d Mco
o 680 ~ 18 a 1,800 -20 0 4,700 -19 A 21,000 -14.6
Model IV
AEDC Facility
VKF-F VKF-F VKF-F VKF-F
1
180 170 160 150 a, deg
- %-»-\
«\D~8-\\? /fa's.
jffJK \*b* -
/y^*\ ^-5.92
As/'/ \ ̂ - 4.00
- ^- 2.98
yi
— Arts
&Br Sym ^2d _Mffl AEDC Facility
JW © 31,800 11.76 VKF-C A'' ° 54,700 11.88 VKF-C f 0 112,000 7.94 VKF-B
A 210,000 7.99 VKF-B VKF^« o 4%, 000 5.92
fc, 483,000 4.00 VKFjß'
1 1
298,000 2.98
Modelll l
VKFj^
1
180 170 160 150
a, deg
f. Variation of Cm with a. Asymmetrical Wavy Model ■ = 9
Fig. 11-2 Concluded
m D n
U

AEDC-TR-67-238
Sym Symmetrical Smooth Heat Shield with No External Protuberances, Model I
Asymmetrical Wavy Heat Shield with Umbilical Housing and Surviving Antenna, Model II
Asymmetrical Wavy Heat Shield with Only Surviving Antenna on Model, Model III
m eg
'm eg
0.03
0.01
-0.01
-0.C3
M^M.OO Re^ d =■ 1195 x 103
Re2d' ■ 483 x 103
(AEDC-VKF-A)
180 170 160 150 a, deg
Fig. 11-3 Effect of Protuberances
56

AEDC-TR-67-238
TABLE I
POSTFLIGHT (AS-202) WIND TUNNEL PROGRAM
(1) Effect of Asymmetry Heat Shield and Simulated Pressure Pads
(2) Effect of Flight Angle
(3) Mach Number Effects
(4) Effect of Reynolds Number
(6) Possible Sting Effects
AEDC-VKF Tunnels A, B, C, and F M_ = 3, 4, 8, 12, 14.6, 19 to 20
a = 180 to 150 deg (All Tunnels)
Mw = 3, 4, 6, 8, 10, 12, 14. 6, 19 to 20
ReOJ = 29 to 500, 000 (All Tunnels) 2d
M, - 8 AEDC-VKF Range G AEDC-VKF Tunnel B
57

AEDC-TR-67-238
TABLE II NOMINAL TEST FLOW CONDITIONS
VKF Facility
p0, psia T0.°K GD Remd Re2d
A 94 345 6.0 1900 : if 103 500 x 103
21 310 4. 0 1200 480 9 310 3.0 870 470
B 600 730 8.0 1800 210 300 700 8.0 1000 110 175 690 8.0 590 65 100 670 8.0 360 38
C 2020 1270 12.0 730 55 1120 1270 12. 0 420 30
F 6000 2000 14. 6 380 21.0 6500 2350 19 110 4.7 6500 3500 20 50 1.8 3300 5000 18 14 0.68
L 25 1660 9.4 1. 28 0. 16 25 1660 9.4 0.96 0. 12 18 3100 10. 2 0. 31 0.04 18 3100 10. 2 0. 23 : x 103 0.03 x 10³
Velocity
6700
M. Re, »d Re2d
G -6 240 x 103 80 x 103
9700 -8.5 170 40 6600 -6 120 40 9300 ~8 90 20 9700 -8.5 50 10
58

TABLE III TABULATED BASIC WIND TUNNEL DATA
Model Configuration
I. Summetrical Smooth Heat Shield with No External Protuberances
II. Asymmetrical Wavy Heat Shield with Umbilical Housing and Surviving Antenna
III. Asymmetrical Wavy Heat Shield with Only Surviving Antenna on Model
to
IV. Asymmetrical Wavy Heat Shield with Only Umbilical Housing on Model
Facility Model
VKF-A
Mm
2.08
4. ÜÜ
Re-,dXlO-3
868
1195
ReowxlO"3 -2d
466
483
a, deg
154 158.5 162. 6 166. 6 170. 6 172. 2 154 158.5 162. 6 166. 5 170. 6 172. 2
-cA
1. 306 1. 368 1. 40Ü 1.436 1.463 1. 468 1. 267 1. 336 1.382 1.416 1. 442 1. 450
-N
0.0957
0.0720 0.0528 0.0395 0.029U 0. 0247
0. 09420 0.07137 0.05447 0.04187 0.03062 0.02538
'm. ■&.
0.0038 0.0053 •0.0141 0.0224
■0.0306 ■0.0339 0.0058
•0.0038 ■0.0123 0.0207
■0.02Ü5 ■0.0330
L/D
0.3999 0. 3339 0. 2732 0. 2096 0.1456 0.1192 0. 3989 0.3329 0.2715 0.2082 0.1445 0.1186
o r> H 70

TABLE III (Continued)
> m o n
O
Facility Model M,,, Re(1>)dxl0-3 Re2dxl0-3 a, dcg -cA CM Cracg L/D
VKF-A II 2.98 868 466 154 1. 345 0.09251 0.0088 0.4043 158.6 1.406 0.06823 -0.0001 0.3370 162. 6 1.447 0.05088 -0.0097 0.2747 166.6 1.478 0.03733 -0.0188 0.2114 170. 6 1. 504 0.02742 -0.0285 0.1466 172.3 1.514 0. 02375 -0.0325 0. 1195
II 4.00 1195 483 154 1. 311 0.09160 0.0102 0.4032 158. 6 1. 379 0. 06897 0. 0010 0.3354 162. 6 1.427 0.05275 -0.0080 0.2733 166. 6 1.463 0.03945 -0. 0174 0.2096 170.6 1.490 0.02872 -0.0270 0.1457 172. 3 1. 500 0. 02338 -0.0310 0.1195
II 5.92 1900 496 154 1. 262 0.08804 0.0112 0.4034 158.6 1. 332 0.06773 0.0018 0.3351 162. 6 1.379 0.05265 -0.0065 0.2722 166. 6 1.419 0.03886 -0.0157 0. 2093 170. 6 1.448 0.02769 -0.0253 0. 1457 172. 3 1.456 0.02379 -0.0293 0. 1195
III 2.98 868 466 154 1. 340 0.09259 0. 0097 0.4042 158.6 1.403 0.06909 0.0008 0.3366 162. 6 1.447 0.05192 -0.0086 0.2742 166. 6 1.480 0.03989 -0.0177 0.2096 170.6 1. 508 0.02791 -0.0268 0.1466

TABLE III (Continued)
Facility Model Re.idxl0"3 Re2dxl0-3 a, deg -cA CJN Cmcg L/D
VKF-A III 4.00 11Ü5 483 154 158. 6 162.6 166. 6
1.304 1. 367 1.411 1.452
0.09240' 0.0111 0. 07082 j 0.0020 0.05310 j-0.0068 0. 04200 ' -0. 0164
0.4025 0. 3340 0.2727 0.2079
170.6 1.480 0.03076 -0.0254 0. 1444
VKF-B 1 7.88 362 38.3 150. 2 1. 151 0.1183 0.0183 0. 4445 154.2 1.221 0.0979 0.0099 0.3888 157. 2 1. 275 0.0851 0.0030 0.3440 160. 2 1. 318 0.0715 -0.0037 0.3000 164.2 1. 357 0.0486 -0.0139 0. 2443 168.2 1. 393 0.0338 -0.0229 0.1834 174. 2 1.430 0.0169 -0.0364 0.0895
I 7.94 964 112 150.4 1. 173 0.1144 0.0180 0.4455 154.5 1.244 0.0936 0.0089 0.3881 158. 5 1. 309 0.0757 -0.0008 0.3279 162.6 1. 364 0.0555 -0.0107 0.2695 166.6 1.403 0.0427 -0. 0202 0.2063 170.6 1.431 0.0279 -0.0298 0.1458 172. 6 1.440 0.0202 -0.0345 0. 1154
VKF-B I 7.99 1810 210 150.9 1. 180 0.1161 0.0171 0.4343 155.0 1.252 0.0950 0.0078 0.3770 159. 1 1. 316 0.0758 -0.0022 0.3176 163. 1 1. 368 0.0573 -0.0118 0.2577 167.2 1. 406 0.0431 -0.0210 0.1959 171.2 1.438 0. 0293 -0.0308 0.1340
> m O n

03 CO
TABLE III (Continued)
> m
n
70 ■
Facility Model at) Re^dxlO"3 Rc2dxl0-3 a, deg -cA CM Cmcg L,/D VI
KJ U 00
VKF-B II 7.88 362 38. 3 150. 1 154.2 157. 2 160. 2 164. 2 168. 2 172. 2
1. 174 1.251 1. 302 1.344 1. 397 1.433 1.451
0.1157 0.0928 0.0819 0.0637 0.0495 0.0341 0.0172
0.0229 0.0145 0.0081 0.0007
-0. 0092 -0.0189 -0.0302
0.4505 0.3959 0.3491 0.3076 0.2448 0.1845 0.1252
II 7.94 964 112 150. 5 154.5 158.6 162.6 166. 6 170. 6 174. 6
1. 183 1. 262 1. 326 1.379 1.421 1.449 1.468
0. 1099 0. 0904 0.0713 0.0552 0.0398 0.0247 0.0136
0.0222 0.0138 0.0046
-0.0054 -0.0154 -0.0259 -0.0359
0.4500 0.3916 0.3320 0.2703 0.2119 0.1485 0.0855
11 7.99 1810 210 151. 0 155. 1 159. 1 163.2 167.2 171. 2
1. 209 1. 284 1. 347 1.397 1.441 1.470
0.1099 0.0898 0.0719 0.0559 0.0388 0.0266
0.0217 0.0127 0.0032
-0.0063 -0.0172 -0.0257
0.4418 0.3822 0.3213 0.2588 0.1985 0.1355
I 7.88 362 38.3 155. 9 157.95 159.4 160.9 162. 9
0.0033 -0.0009 -0. 0042 -0.0077 -0. 0124

TABLE III (Continued)
en CO
Facility Model Rc^dxlO-3 Re2dxl0-3 Q.deg -cA CN cmcg L/D
VKF-B I 7.91 590 64.6 157.35 158. 8 159. 4 1G0. 0 161.33
0.0006 -0.0021 -0.0033 -0.0045 -0.0076
I 7. 95 1100 120 157.75 158.92 159. 4 160.15 161. 4
0 -0.0022 -0.0031 -0.0043 -0.0070
I 7.99 1800 192 158. 9 159. 4 159.9 160.65 161. 10
-0.0019 -0.0033 -0.0039 -0.0053 -0.0063
•VKF-B II 7.88 362 38.3 158. 9 160. 4 J61.4 162.9 163.9
0.0025
-0.0009 -0.0031 -0.0065 -0.0089
II 7.91 590 64.6 159.05 0.0035
160.95 -0.0015 > 161.68 -0.0031 m
162.Ü5 -0.0061 n ■
i 163. 8 -0.0081
^1

en
TABLE III (Continued) n ■
Facility Model Ma Re. dxl0-3 Re2dxl0-3 Q.deg -CA cN Cmcg L/D
•
Ki
as VKF-B II 7.95 1100 120 159. 2
161. 1 161.95 162.05 163.0
0.0027 -0.0014 -0.0033 -0.0037 -0.0058
II 7.99 1800 192 160.75 161.75 162.20 163.10 163.60
-0.0003 -0.0026 -0.0036 -0.0056 -0.0067
VKF-C I 11. 76 417 31. 30 153. 1 156. 1 160. 1 164. 3 168. 2 172. 2 176.3 180. 3
1.219 1.267 1.322 1.380 1.419 1.441 1.450 1.450
0.1040 0.0904 0.0702 0.0528 0.0378 0.0224 0.0133
-0.0007
0.0141 0.0083
-0.0024 -0.0121 -0.0211 -0.0312 -0.0402 -0.0480
0. 4049 0.3601 0.3024 0.2410 0.1820 0.1210 0.0559
-0.0051
I 11.88 746 55.20 153. 5 156.4 160. 5 164.6 168. 5 172.4 176.5 180. 6
1.222 1.272 1. 332 1.380 1. 420 1.446 1.453 1.456
0.0988 0.0857 0.0671 0.0509 0.0341 0.0230 0.0130
-0.0014
0.0134 0.0061
-0.0034 -0.0141 -0.0228 -0.0322 -0.0408 -0.0497
0.4022 0.3584 0.2986 0.2371 0.1790 0.1169 0.0528
-0.0100

TABLE III (Continued)
<J5
Facility Model CD Rea)(dxl0-3 Re2dxl0"3 a, dcg -cA CN Cmcg
L/D
VKF-C I 11. 76 423 31.80 153. 3 1.241 0.1000 0.0185 0.4064 156. 3 1.291 0.0846 0.0127 0.3631 160. 3 1.349 0.0670 0.0013 0.3023 164.3 1.404 0.0456 -0.0082 0.2456 168. 3 1.442 0.0308 -0.0178 0.1851 172. 3 1.458 0.0138 -0.0281 0.1245 176. 3 1.480 0.0079 -0.0387 0.0585 180.4 1.480 -0.0063 -0.0484 -0.0031
II 11.88 739 54.70 153.4 1.253 0.0964 0.0185 0.4075 156.4 1.302 0.0816 0.0118 0.3650 160.4 1.366 0.0651 0.0025 0.3024 164. 5 1.414 0.0475 -0. 0087 0.2416 168.6 1.454 0.0319 -0.0192 0.1791 172. 5 1.480 0.0197 -0.0298 0.1176 176.5 1.489 0.0083 -0.0394 0.0555 180. 6 1.495 -0.0061 -0.0507 -0.0067
III 11.76 417 31.30 153.4 1.244 0.1002 0.0190 0.4047 156. 3 1.286 0.0849 0.0115 0.3623 160. 3 1.354 0.0676 0.0023 0.3023 164. 3 1.399 0.0514 -0.0073 0.2414 168. 4 1.444 0.0317 -0.0183 0.1818
VKF-F I 18.02 11.66 0.670 180 1.584 -0.0530 18.71 12.05 0.681 170 1.47 0.0605 -0.0285 0.1265 18.50 14.55 0.714 160 1.385 0.1330 -0.0068 0.2589 19.85 44.50 1.678 180 1.439 -0.0001 -0.0487
19.62 45.60 1.756 172.5 1.447 0.0298 -0.0322 0.1108
> m O n
TO
u

TABLE III (Continued)
Facility
VKF-F
Model
IV
05
M„
19. 63 20.30 20.35 19.91 14. 37 14.56 14.55
17. ai 18.28 19. 83 20.33 19. 96 19.87 19. 34 19.88 20.01 17.84 20.42 18.60 18.74 18.62 19. 12 18.68 18.68 14. 59 14.80
Re^dxlO-
45.25 59.20 57.48 45.15
434. 1 381.2 440.7
11.60 12.90 47.45 58.70 47.50 47.75 33.90 47.45 45.40 68.22 71.75
128.4 133.2 139.0 157. 6 135.4 135.4 401.8 381.4
Re2dxl0-3 a, deg -cA Cj\) Cmcg L/D
1.615 165 1.430 0.0633 -0.0163 0.2210 2.060 160. 3 1.375 0.0850 -0.0037 0.2898 1.960 155 1.250 0.1258 0.0089 0.3493 1.707 150 1. 180 0. 1522 0.0198 0.4126
24.82 180 1.425 0 -0.0482
21.55 165 1. 300 0.0550 -0.0139 0.2232 23.94 165 1.350 0.0566 -0.0143 0.2235
0. 703 170 1. 507 0.0640 -0.0257 0.1282 0.690 160 1.437 0.1283 -0.0027 0.2600 1. 813 180 1. 472 -0.0052 -0.0470 -0.0035 1.978 172. 5 1.455 0.0251 -0.0283 0.1141 1. 734 165 1.430 0.0669 -0.0117 0.2189 1.757 160 1.414 0.1030 0.0009
1.464 160. 3 1. 363 0.0950 -0.0008 0.2813 1.851 155 1.335 0.133 0.0115 0.3504 1. 748 150 1. 252 0. 162 0. 0230 0.4169 3.050 165 1.420 0.0504 -0.0093 0. 2303 2.533 160 1.409 0.0874 0.0023 0. 2954 4.917 172.5 1.473 0.0150 -0.0267 0. 1213 4.874 172. 5 1.498 0.0166 -0.0307 0.1203 5.099 165 1.427 0.0511 -0.0100 0.2299 5.224 160 1. 340 0.0777 0.0032 0.2997 5. 120 155 1.317 0.1087 0.0169 0.3695 5.077 150 1. 205 0. 1324 0. 0249 0.4396
22. 58 180 1.450 -0.0126 -0.0439
20.33 172.5 1.435 0.0152 -0.0243 0.1210
> m o n ■ H 70 ■

TABLE III (Continued)
CT>
Facility Model Mm Re.dxlO-3 Re2dxl0"3 a, deg -cA CN Cmcg L/D
VKF-F IV 14. 76 486.0 24.59 172. 5 1.460 0.0163 -0.0262 0.1196 14.67 408. 7 ' 22.44 172.5 1.415 0.0180 -0.0240 0.1187 14. 58 319. 8 18.07 165 1.419 0.0553 -0.0042 0.2266 14. 92 373. 7 19.40 165 1. 385 0.0531 -0.0049 0.2273 14. 73 358.0 19.84 165 1. 398 0.0545 -0.0040 0.2266 14.92 3G3. 0 19.42 160 1.340 0. 0806 0.0072 0.2974 14. 77 299. 5 16. 60 160 1.330 0.0793 0.0046 0.2979 14.70 374.2 20.36 155 1.303 0.1067 0.0185 0.3701
VKF-L I 10. 15 0. 233 0.0289 155 1.590 0.357 0.0007 0.2189 160 1. 670 0. 287 -0.0127 0. 1808 165 1.750 0. 216 -0.0225 0. 1399 170 1. 800 0. 145 -0.0300 0.0944 175 1.820 0.072 -0.0440 0.0478 180 1. 825 0 -0.0617 0
10. 15 0. 310 0.0385 155 1.520 0.310 +0.0059 0.2396 160 1. 600 0.255 -0.0105 0.1934 165 1.670 0. 195 -0.0198 0.1466 170 1. 710 0. 130 -0.0260 0.0830 175 1.740 0.070 -0.0400 0.0471 180 1.750 0 -0.0592 0
9.37 0. 960 0. 118 155 1.400 0.225 -0.0119 0.2843 160 1.470 0. 177 -0.0016 0.2333 165 1.530 0. 135 -0.0131 0. 1756
> m o n
u

TABLE III (Continued)
> m O n
ro u
03
Facility Model 00 Re. >dxl0"3 Rc2dxl0-3 a, deg -cA CN
0.090
eg L/D
VKF-L I 9. 37 0.960 0. 118 170 1.580 -0.0260 0.1182 175 1.610 0.045 -0.0400 0.0594 180 1.630 0 -0.0552 0
U. 37 1.280 0. 157 155 1.380 0.210 0.0122 0.2933 160 1.450 0. 177 -0.0010 0.2316 165 1.510 0.138 -0.0117 0.1723 170 1.570 0. 095 -0.0260 0.1146 175 1.600 0.048 -0.0400 0.0573 180 1.610 0 -0.0545 0

TABLE III (Concluded)
CD
Facility Model M. Rc^xlO"3 Re2dxl0-3 oE.deg cD e/d «!', deg Shot
Muinber
VKl-'-G I 8.57 55.0 13.0 169. 8 1.446 0.0157 168.52 615 8.46 52.0 12. 3 166. 6 1.418 0. 0162 168.88 617 8. 16 89. 6 21. 1 0.0163 168.69 619 8.66 160.0 35.9 166.5 1.416 0.0164 170.34 632 8.37 52. 4 12.5 0.0344 157.25 616 8.72 53.7 12.4 168. 2 1.430 0.0351 157.04 618 8.38 90.9 21. 2 0.0339 158.98 620 8.19 86. 2 20.3 0. 0332 159.01 633 8. 52 51.9 12. 3 174. 0 1.460 0. 0002 -180 614 8. 47 172 39.4 177. 4 1.494 0.0001 - 180 631 5. 93 80 23. 8 165. 7 1. 372 0.0002 - 180 600 5.47 108 33. 5 162. 6 1.328 0.0005 -180 601 5. 88 241 71.5 172. 9 1.437 0.0004 -180 602
m □ n

AEDC-TR-67-238
TABLE IV TYPICAL APOLLO MISSION AS-202 FLIGHT DATA
Altitude, * ft
Time,* sec
Velocity, +
fps L/D CN/CA o"r> deg
397, 293 4350 27,201 -0.4996 0.05790 155.4 363, 850 4370 27, 239 -1.2778 0.98088 155. 2
: 348,195 4380 27, 256 -0.0347 0.48258 155. 5 342, 133 4384 27, 263 0.6247 -0.55835 154. 9 333, 255 4390 27, 273 0.3528 -0.21549 154. 6 327, 430 4394 27, 279 0.3989 -0.49305 154.9 321, 820 4398 27, 284 0.2689 -0.23335 156. 1 319, 032 4400 27,287 0.2748 -0.15894 156.6 316, 274 4402 27,290 0.2982 -0.13276 157. 7 313,544 4404 27, 292 0.2904 -0.11296 158.9 310, 842 4406 27, 294 0.3017 -0.06333 159. 7 308, 168 4408 27,296 0.2483 -0.12424 160.4 305, 523 4410 27, 297 0.2601 -0.08263 161. 5 303, 319 4414 27,300 0.2536 -0.07934 161.4 292, 722 4420 27, 301 0.2838 -0.07688 160. 2 285, 374 4426 27, 300 0.2852 -0.05323 161. 2 280, 611 4430 27, 298 0.2631 -0.05585 162. 1 275, 956 4434 27, 291 0.2858 -0.06901 160.5 269, 167 4440 27,280 0.2646 -0.06061 161. 8 258, 346 4450 27, 238 0.2819 -0.04831 161. 5 238, 772 4470 26,998 0.2628 -0.03897 163.6 224, 078 4490 26,408 0.2693 -0.04538 162. 6 215, 682 4510 25,513 0.2703 -0.04622 162.9 213, 613 4530 24,498 0.2723 -0.05420 162.0 216, 712 4550 23, 569 0.2746 -0.05682 162. 0 223,210 4570 22, 845 0.2747 -0.05725 162. 1 231, 202 4590 22, 345 0. 2787 -0.05460 162. 2 239, 246 4610 22, 002 0.2785 -0.06094 161. 6
i
*Above ground
*Time zero is liftoff +Relative to ground
70

TABLE IV (Continued)
AEDC-TR-67-238
Altitude,* ft
Time,* sec
Velocity,"*" fps
L/D cK/cA arT, deg
246,379 4630 21, 779 0.2846 -0.06290 161.0 247,627 4634 21 744 0.2819 -0.04349 162.0 250,948 4646 21 650 0.2849 -0.05527 161.2 251,986 4650 21 622 0.2826 -0.05615 161.4 254,632 4664 21 531 0.2831 -0.03280 162.5 254, 935 4666 21 ,519 0.3067 -0.05132 160.0 255,473 4670 21 ,496 0. 2613 -0.01663 164.4 256,720 4688 21 ,400 0.2506 -0.04062 164.3 256, 740 4690 21 ,389 0.2613 -0.03642 163.6 256,196 4704 21 , 318 0.2861 -0.04946 161.3 255,592 4710 21 , 287 0.3075 -0.04403 160.4 253,706 4722 21 223 0.2801 -0.03156 162.6 251,940 4730 21 178 0.2848 -0.03582 162.1 247; 891 4744 21 088 0. 2937 -0.05203 160.7 245,810 4750 21 044 0.2917 -0.05685 160.6 241, 906 4760 20 960 0.2709 -0.05377 162.7 237,494 4770 20 854 0.2910 -0.05187 160.8 231,663 4782 20 891 0.2799 -0.04491 162.2 227,368 4790 20 557 0. 2878 -0.05987 160.6 217,206 4808 20 141 0.2810 -0.03703 162.5 216,041 4810 20 084 0.2831 -0.05214 161.4 214,875 4812 20 024 0.2815 -0.04269 162.7 204,428 4830 19 359 0.2826 -0.05333 161.4 198,865 4840 18 881 0.2837 -0.03686 162.3 193,639 4850 18 338 0.2830 -0.04822 161.5 186, 403 4866 17 291 0.2855 -0.04214 161.9 184,859 4870 17 004 0.2850 -0.04228 161.7
71

AEDC-TR-67-238
TABLE IV (Concluded)
Altitude,* ft
Time,* sec
. 1 Velocity,
fps L/D CN/CA ttT- deS
178, 648 4890 15,526 0.2865 -0.04568 161.6 176, 254 4900 14,788 0.2862 -0.04943 161. 3 174, 135 4910 14,074 0.2866 -0.05372 161. 8 172, 509 4918 13,520 0.2872 -0.05908 162.0 170,018 4930 12,704 0. 2919 •-0.05001 161. 3 167,838 4940 12,019 0.2959 -0.04478 161.5 165, 487 4950 11, 354 0.2984 -0. 04733 161.0 161,723 4964 10,458 0.3026 -0.05163 161.1 159, 874 4970 10,091 0.3037 -0.04248 160. 8 156,439 4980 9,470 0.3060 -0.04606 161.0 152,569 4990 8,849 0.3033 -0.04362 160.9 145, 313 5006 7,847 0.3080 -0.04318 161. 2 143, 342 5010 7,588 0.3083 -0.05173 159.9 134, 044 5028 6, 379 0. 3117 -0.03978 160.5 132,984 5030 6,240 0.3117 -0.04886 160.0 122,279 5050 4, 864 0.3152 -0.04973 160. 5 116,879 5060 4, 207 0.3105 -0.05273 160. 1 111, 386 5070 3, 599 0.3311 -0.04139 159.9 104,652 5082 2,934 0.3194 -0.04974 159.6 100, 062 5090 2, 532 0.3344 -0.04599 159.0 98, 902 5092 2,439 0.3388 -0.04260 159.6 88, 321 5110 1, 707 0.3528 -0.05008 158. 2 76, 090 5130 1, 177 0.3429 -0.02321 160.6 63,666 5150 845 0.2210 -0.04026 168. 2 51, 048 5170 693 0.2522 -0.04282 163. 6 39,559 5190 573 0.0000 0.00000
29, 682 5210 484 0.2720 -0.02584 163.3 ' 21, 712 5230 320 0.1466 -0.24114 159. 1
72

Security Classification
DOCUMENT CONTROL DATA R&D (Security claaaltlcatlon of title, body of ebatract and Indexing annotation muat be entered when the overall report la classified)
1. ORIGINATING *CTI VITY (Corporate author)
Arnold Engineering Development Center ARO, Inc., Operating Contractor Arnold Air Force Station, Tennessee
2». REPORT SECURI TY CLASSIFICATION
UNCLASSIFIED 2b. CROUP
N/A 3 REPORT TITLE
POSTFLIGHT (AS-202) APOLLO COMMAND MODULE AERODYNAMIC SIMULATION TESTS
«■ DESCRIPTIVE NOTES (Type of report and inclusive dates)
December 1966 to May 1967 - Final Report 5- AUTHOR(S) (Firat name, middle Initial, taal name)
B. J. Griffith and D. E. Boylan, ARO, Inc
8 REPORT DATE
March 1968 7a. TOTAL NO. OP PAGES
81 lb. NO. OP REFS
13 »a. CONTRACT OR GRANT NO.
AF 40(600)-1200 b. PROJEC T NO.
c System 920E
•a. ORIGINATOR'S REPORT NUMBERIS)
AEDC-TR-67-238
fib. OTHER REPORT NO(S) (Any other number» that may be assigned thi* report)
N/A 10 DISTRIBUTION STATEMENT
This document has been approved for public release and sale; its distribution is unlimited.
II SUPPLEMENTARY NOTES
Available in DDC
12. SPONSORING MILITARY ACTIVITY Arnold Engineering Development Center, Air Force Systems Command Arnold Air, Force Station, Tennessee
is ABSTRACT £ comprehensive postf light wind tunnel investigation of the Apollo Command Module was conducted to resolve several anomalies between flight (AS-202). and preflight aerodynamic data. Attention was focused on (1) simulating the actual vehicle "as flown", (2) obtaining consistent pitch plane force measurements in the angle-of-attack range 150 < a < 180 deg, (3) the effect of Mach number over a range of 3 to 20, (4) the effect of Reynolds number, and (5) possible sting effects. Results indicated that prior failure to duplicate the asymmetrical wavy heat shield in preflight testing resulted in a significant error in trim angle-of-attack prediction. In addition, a strong viscous influence was found to extend down to an altitude of about 220,000 ft. Also, a Mach number influence to a value of about 14 was found which is substantially higher than previous blunt body investigations have indicated.
DD FORM l NOV es 1473
Security Classification

Security Classification
K cv WORDS ROLE WT
postflight testing
Apollo Command Module
spacecrafts
sting effects
Security Classification