Mapping Technology in Wilderness Search and...
111
Mapping Technology in Wilderness Search and Rescue by Caroline Rose A thesis submitted in partial fulfillment of the requirements for the degree of Master of Science Cartography and Geographic Information Systems at the UNIVERSITY OF WISCONSIN—MADISON 2015
Transcript of Mapping Technology in Wilderness Search and...

MappingTechnologyinWildernessSearchandRescue
by
CarolineRose
Athesissubmittedinpartialfulfillmentof
therequirementsforthedegreeof
MasterofScience
CartographyandGeographicInformationSystems
atthe
UNIVERSITYOFWISCONSIN—MADISON
2015
i
Acknowledgements
My thanks are most especially due to Dr. Robert Roth and Dr. Paul Doherty for
tremendous amounts of guidance throughout this project. I would like to thank
Dr. Qunying Huang for her support and insight as part of my committee. I am grateful to
my study team member Rose Carlson for her cheerful and tremendously helpful work in
making the study data manageable.
I would like to express my gratitude to my interview participants for their time
and their patience in teaching me, and to the many other SAR specialists who imparted
their insight. In two months of traveling and conducting interviews, I stayed in far more
guest beds (or couches, or porches) than hotel rooms. I owe a huge thank-you to the
many generous hosts who welcomed me into their spaces during the summer of 2014.
I would like to thank the members of the UW Cartography Lab throughout the
past several years for the friendship and community that make this program a great
place to learn. In particular, I would like to thank Chelsea Nestel for sharing countless
hours of work and motivation. I would like to recognize Justin Randall for all of his
support and understanding throughout this project. Finally, I am tremendously grateful
to my parents and my grandparents for their support and encouragement of my
academic pursuits.
This research was funded in part by the UW—Madison Geography Department’s
Trewartha Graduate Research Award.
ii
Table of Contents
Acknowledgements ........................................................................................................................................... i
List of Figures ..................................................................................................................................................... iv
List of Tables ........................................................................................................................................................ v
List of Abbreviations ....................................................................................................................................... vi
Abstract ................................................................................................................................................................ vii
Chapter 1: Introduction .................................................................................................................................. 1
1.1 Context: Wilderness Search and Rescue ..................................................................................... 1
1.2 The Problem: Mapping Technology for Wilderness Search and Rescue ....................... 3
1.3 Purpose and Scope ................................................................................................................................ 6
Chapter 2: Background ................................................................................................................................... 8
2.1 Search Use Case/Context ................................................................................................................... 8
2.2 Functional Requirements of Mapping Technology for WiSAR ....................................... 19
2.3 Challenges & Non-Functional Requirements of Mapping Technology for WiSAR . 27
Chapter 3: Methods ....................................................................................................................................... 31
3.1 Participants ........................................................................................................................................... 31
3.2 Materials and Procedure ................................................................................................................. 33
3.3 Qualitative Data Analysis ................................................................................................................ 36
Chapter 4: Results .......................................................................................................................................... 41
4.1 Paper Maps ............................................................................................................................................ 45
4.2 Handheld GPS devices ...................................................................................................................... 50
4.3 GIS Software .......................................................................................................................................... 54
4.4 Desktop Mapping Programs .......................................................................................................... 63
4.5 Web Maps............................................................................................................................................... 66
4.6 Mobile Applications ........................................................................................................................... 70
4.7 Other Technology ............................................................................................................................... 73
4.8 General Mapping Technology........................................................................................................ 76
iii
Table of Contents
Chapter 5: Summary and Future Directions........................................................................................ 83
5.1 Results Summary ................................................................................................................................ 83
5.2 Limitations ............................................................................................................................................ 90
5.3 Future Directions ............................................................................................................................... 92
5.4 The Case for GIS in WiSAR .............................................................................................................. 93
Glossary ............................................................................................................................................................... 94
References .......................................................................................................................................................... 99

iv
List of Figures
Figure 1: Cutter’s Emergency Response Cycle .................................................................................... 3
Figure 2: Use contexts for mapping software in emergency response. ................................ 11
Figure 3: WiSAR search segments . ....................................................................................................... 14
Figure 4: The scope of functional requirements for each of the six forms of mapping
technology . ....................................................................................................................................................... 20
Figure 5: Visual variables, demonstrated graphically. .................................................................. 22
Figure 6: Non-functional challenges. .................................................................................................... 28
Figure 7: Coding logic for each statement. . ....................................................................................... 38
Figure 8: Code frequency and volume of connections . ................................................................ 44
v
List of Tables
Table 1: Examples of geocollaboration in four place/time scenarios ..................................... 18
Table 2: Examples of the six forms of WiSAR mapping technology ......................................... 19
Table 3: Roth’s definitions of Bertin and MacEachren’s visual variables. ............................. 22
Table 4: Map elements ................................................................................................................................. 24
Table 5: Roth’s (2013) Operator-based Interaction Primitives ................................................ 26
Table 6: Participants’ level of familiarity with six types of mapping tech ............................ 32
Table 7: Interview Protocol ....................................................................................................................... 35
Table 8: Coding Scheme .............................................................................................................................. 39
Table 9: Extensiveness, frequency, and percentage of total discussion for each code. ... 43
Table 10: Current uses of paper maps .................................................................................................. 45
Table 11:Current uses of GPS devices .................................................................................................. 50
Table 12: Current uses of GIS software ................................................................................................ 54
Table 13: Current uses of desktop mapping programs ................................................................. 63
Table 14: Current uses of web maps ..................................................................................................... 66
Table 15: Current uses of mobile apps ................................................................................................. 70
Table 16: Current uses of general mapping tech. ............................................................................ 76
Table 17: Requirements of general mapping tech. ......................................................................... 79
Table 18: Current uses of six forms of mapping technology ...................................................... 83
Table 19: Advantages, limitations, suggestions, and notes by technology ........................... 85
vi
List of Abbreviations
AFRCC — Air Force Rescue Coordination Center CASP — Computer-Assisted Search Planning COP — Common operating picture ELT — Emergency Locator Transmitter GIS — Geographic Information Systems GPS — Global Positioning System IC — Incident Commander ICP — Incident Command Post ICS — Incident Command System IPP — Initial planning point ISRID — International Search and Rescue Incident Database LAST — Locate, Access, Stabilize, Transport LKP — Last known point MGRS — Military Grid Reference System MRA — Mountain Rescue Association NASAR — National Association for Search and Rescue NIMS — National Incident Management System NPS — National Park Service NWCG — National Wildfire Coordinating Group PLB — Personal locator beacon PLS — Point last seen POA — Probability of area POD — Probability of detection POS — Probability of success PSAR — Preventative search and rescue ROW — Rest of the world SAR — Search and rescue SAROPS — Search and Rescue Optimal Planning System USFS — United States Forest Service USGS — United States Geological Survey USNG — United States National Grid UTM — Universal Transverse Mercator WiSAR — Wilderness or wildland search and rescue
vii
Abstract
Wilderness or wildland search and rescue (WiSAR) managers and planners create
and use maps to plan searches, collaborate on strategy, decide where to distribute
resources, and communicate tasks to searchers in the field. Although maps and
geographic information play a major role in WiSAR, current digital mapping technology
has not been widely adopted to support WiSAR efforts.
The ultimate objectives of this research are to inform the development of useful
mapping solutions to support WiSAR and to facilitate their adoption by the WiSAR
community. To this end, I address the following three research questions: (1) How is
mapping technology currently used to facilitate WiSAR operations, including
geocollaborative situations? (2) Are there any key gaps or unmet user needs in existing
mapping functionality for WiSAR? (3) What are the key challenges to the adoption and
use of new mapping technology within WiSAR teams?
To answer these questions, I conducted an interview study with map users
working or volunteering in WiSAR. The results enumerate participants’ observations
about different forms of mapping technology and their current uses, limitations,
advantages, and potential directions for improvement. This study captures a snapshot
of mapping technology for WiSAR in 2014. Findings indicate that non-functional
considerations—or factors beyond the mapping functionality such as human resources,
cost, usability, interoperability, and efficiency—are crucial factors in the usefulness and
adoption of mapping technology for WiSAR. Different use contexts and tasks within the
mission of a search are better served by particular forms of mapping technology. This
study enumerates several opportunities to improve mapping technology for WiSAR.
1
Chapter 1: Introduction
1.1 Context: Wilderness Search and Rescue
In this study, I address the use of mapping technology to support Wilderness
Search and Rescue, including the unique demands of the Search and Rescue map-use
context, the potential contribution that mapping technology can offer for Search and
Rescue, and the many challenges to map design and implementation in Search and
Rescue. Search and Rescue (SAR) is an emergency situation in which trained
professionals are called upon to locate a missing person(s) and assist them to safety
(National Association for Search and Rescue 2005). Wilderness or Wildland SAR
(WiSAR) occurs in largely uninhabited land regions lacking access to manmade
amenities, such as shelter and medical facilities. Wildland settings include rural areas,
large public spaces such as National Parks, wilderness areas, and mountainous terrain,
but also may include urban environments in the wake of a large-scale natural disaster,
such as an earthquake or hurricane (Durkee and Glynn-Linaris 2012, NASAR 2005).
Most WiSAR personnel are volunteers with training or professional certification
in search, specialized rescue techniques, and/or first aid (NASAR 2005). In the United
States and Canada, these volunteers are usually members of WiSAR teams associated
with a local political unit such as a county. Other SAR personnel may be employed by a
unit of an agency such as the National Park Service (NPS) or the US Forest Service
(USFS). Volunteer teams and agency units offer the necessary training and certifications
for members, and are called upon by local emergency services to respond to a search or
rescue incident. These teams may join associations of SAR teams, such as the Mountain
2 Rescue Association (MRA) or the National Association for Search and Rescue (NASAR),
to share resources for training, recruiting, and advocacy (NASAR 2005). At the federal
level, land-based SAR is overseen by the Air Force Rescue Coordination Center (AFRCC),
which may provide additional federal support when needed (AFRCC 2014). Heggie and
Amundsen (2009) report that an average of 4,090 SAR incidents occurred per year from
1992 to 2007 within National Parks alone, costing the NPS an average of $3.7 million
annually. The annual number of searches in the United States is not tracked, but has
been estimated to be above 100,000 (Adams et al. 2007).
Search and Rescue is a special case within the broader field of emergency
response (or some combination of the closely-related and oft-interchanged terms
emergency/disaster with response/management), or the study and practice of the
actions taken following an event to relieve suffering and aid recovery. The mission of
SAR often is described by the acronym LAST, standing for Locate the missing subject of
the search, Access their location, Stabilize the subject medically so they can be moved,
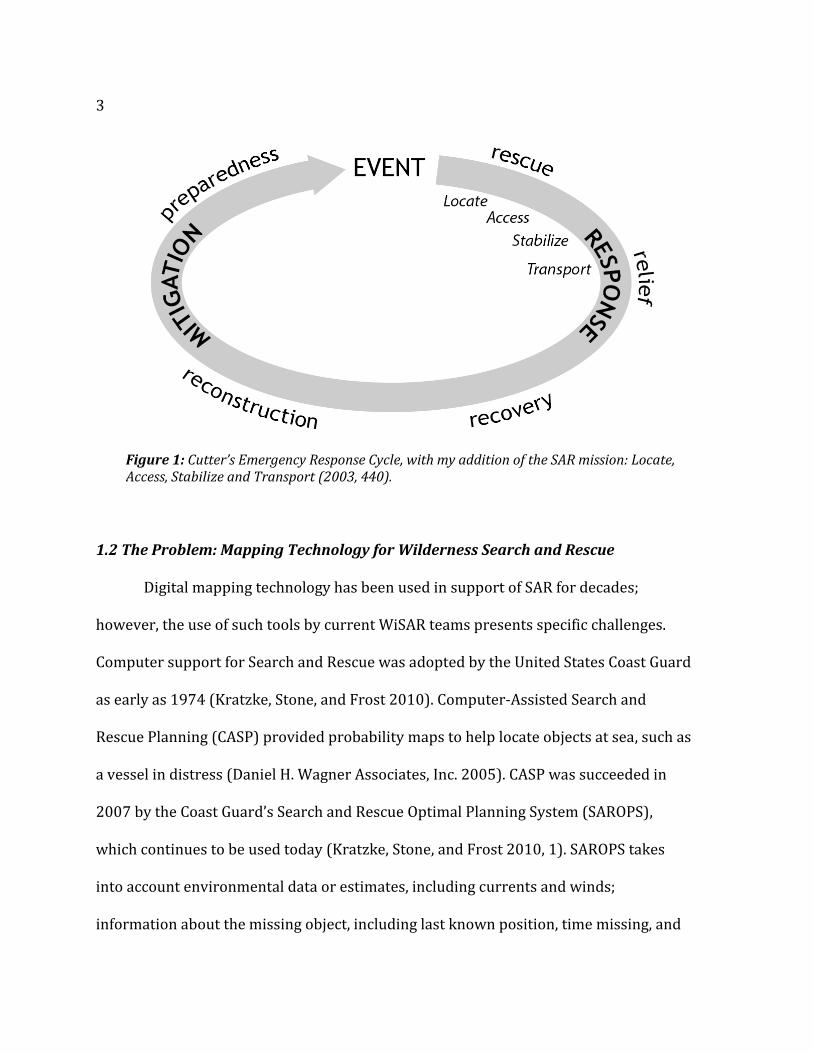
and Transport the subject to safety (Doherty et al. 2014). SAR teams also participate in
other parts of the emergency response cycle (see Figure 1), defined by Cutter (2003) as
EVENT → RESPONSE (rescue → relief → recovery) → MITIGATION (reconstruction →
preparedness). While ‘locate’, ‘access’, ‘stabilize’, and ‘transport’ components of LAST
are primarily part of Cutter’s ‘rescue’ and ‘relief’ stages, SAR teams also put great
emphasis on ‘preparedness’, and also may take other actions towards mitigation,
including Preventative Search and Rescue (PSAR) measures such as improving signage
and public sources of information or re-routing trails in problem areas (Koester 2008).
3
1.2 The Problem: Mapping Technology for Wilderness Search and Rescue
Digital mapping technology has been used in support of SAR for decades;
however, the use of such tools by current WiSAR teams presents specific challenges.
Computer support for Search and Rescue was adopted by the United States Coast Guard
as early as 1974 (Kratzke, Stone, and Frost 2010). Computer-Assisted Search and
Rescue Planning (CASP) provided probability maps to help locate objects at sea, such as
a vessel in distress (Daniel H. Wagner Associates, Inc. 2005). CASP was succeeded in
2007 by the Coast Guard’s Search and Rescue Optimal Planning System (SAROPS),
which continues to be used today (Kratzke, Stone, and Frost 2010, 1). SAROPS takes
into account environmental data or estimates, including currents and winds;
information about the missing object, including last known position, time missing, and
Figure 1: Cutter’s Emergency Response Cycle, with my addition of the SAR mission: Locate, Access, Stabilize and Transport (2003, 440).
4 intended route; and unsuccessful searches, or areas of verified absence, as a search
progresses. The system produces a probability distribution for an object’s location
correlated to time and suggests “operationally feasible search plans that maximize the
increase in probability of detecting the object” (Kratzke, Stone and Frost 2010, 1).
Modern Geographic Information Systems (GIS) software can offer forms of spatial
modeling similar to CASP and SAROPS. However, probability models are not the only
way in which computer-based mapping technology can support search and rescue
today. Tomaszewski (2015) states that GIS software is an information management tool
in emergency response, serving to collect and disseminate information. SAR-specific GIS
toolsets for civilian, land-based SAR first emerged in 2006 (Doke 2012). Current SAR-
specific GIS tools include extensions to Esri’s ArcMap program: MapSAR and Integrated
Geospatial Tools for SAR (IGT4SAR); SARX, a custom toolset for Esri’s ArcGIS Explorer;
the website SARTopo.com and its offline version SARsoft, and other commercial and
non-commercial products. GIS software currently is used to varying degrees by WiSAR
teams across North America (Pfau 2013). Some WiSAR teams have put GIS to extensive
use and integrate it with other mapping technology as a routine part of their incident
management (Pedder 2012). However, many other WiSAR teams lack domain
knowledge about the geographic information properties, sources, formats, applications,
and programs needed to make the most effective use of a full GIS software package
possible. Teams also encounter other barriers to adopting new mapping technology,
including time and money constraints, lack of adequate training, and technological
incompatibility, all of which result in path dependence on familiar systems (Pfau 2013).

5
Further, the time elapsed during a search is a critical factor in subject survival (Adams
et al. 2007). Research on emergency response and map symbol standards suggests that
such a time-sensitive mission may demand having a familiar and reliable system in
place at all times, limiting the capacity for flexible experimentation with new
technology (Robinson, Roth, and MacEachren 2011).
Doherty (2014, para. 3) notes that “GIS is still not widely used in missing person
search operations and other SAR functions,” and proposes a vision to establish GIS as
part of the “standard of care” in WiSAR incident management. Existing policy in
wildland fire management is one potential model of established industry-wide
guidelines for GIS technology. The National Wildfire Coordinating Group (NWCG)—
consisting of the National Park Service, US Forest Service, and other federal and state
agencies—mandates GIS-based methods of data management as part of its Standard
Operating Procedures (NWCG 2014) for wildland fire incidents. Though such standards
may offer lessons about GIS for incident management in a wildland context, the unique
challenges of WiSAR demand unique mapping solutions.
Considering such challenges to adoption, Pfau (2013, 11) suggests that “the
functionality common in many full GIS packages is not a necessity for all search and
rescue missions” emphasizing that different forms of technology should “coexist and
complement one another” (14). GIS is not a replacement for existing tools; The
Fundamentals of Search and Rescue textbook (NASAR 2005) maintains that paper maps
are indispensable for WiSAR teams in the field, citing concerns with the reliability of
electronic devices. It is clear that a comprehensive examination of mapping technology
6forWiSARmustaddressmanyformsofmappingtechnology,frompapermapsto
analytically‐capableGISsoftware,andthatmappingsolutionsforWiSARmustintegrate
variousformsintoasystem,drawingontheadvantagesofeachtosupportWiSAR
efforts.CasestudiesdemonstratethatGIScanplayacriticalroleincertaindifficult
WiSARsituations(Ferguson2008;ClelandandJohnson2014).Thus,proponentsofGIS
useinWiSARarguethatteamswouldbenefitfromanawarenessofGIScapabilitiesand
theabilitytouseGISincombinationwithotherformsofmappingtechnologyinsuch
situations.
1.3PurposeandScope
Inordertoofferusefulmappingsolutionsandtofacilitatetheiradoptionby
WiSARteams,wemustidentifythewaysinwhichmappingtoolscontributeorcould
contributetoWiSARmissiongoalsaswellasthebarriersimpedingtheadoptionand
useofmappingtechnologybyWiSARteams.Tothisend,Icontributeasketchof
mappingtechnologyuseinWiSARtoday,asdescribedthroughinterviewswithWiSAR
specialists,definedasindividualswithtrainingorprofessionalcertificationinWiSAR.
Theseinterviewsallowedmetocapturethewidevarietyofwaysthatmappingtools
canbeusedtosupportWiSAR,tocharacterizethediversityofopinionamongWiSAR
specialists,andtodiscusstheproblems,limitations,andbarrierstousethatWiSAR
specialistsencounterwhenusingorconsideringthesetools.Specifically,Iaddressthe
followingthreeresearchquestions:

7
1) HowismappingtechnologycurrentlyusedtofacilitateWiSARoperations,includinggeocollaborativesituations?
2) ArethereanykeygapsorunmetuserneedsinexistingmappingfunctionalityforWiSAR?
3) WhatarethekeychallengestotheadoptionanduseofnewmappingtechnologywithinWiSARteams?
Iinterviewedtwenty‐four(n=24)WiSARspecialistsabouttheirexperienceand
opinionsregardingthedesignanduseofmappingtechnologyinsupportofWiSAR.I
focusedontechnologythatsupportsthesearchersintheirtasks,choosingnotto
discussatlengthanygeo‐enableddevicesthatasubjectmightcarrywiththem(e.g.,
PersonalLocatorBeacons,e911).ThisstudywaslimitedtoadiscussionofWiSARinthe
UnitedStatesandCanadaanddidnotaddressotherbranchesofSearchandRescue,
suchasurbanandmaritimesituations.
Idescribethedetailsofthisstudyinthefollowingchapters.Chapter2reviews
therelevantbackgroundliterature,introducingframeworksfromWiSAR,distributed
cognitionandgeocollaboration,cartographicinteractionandGISfunctions,software
engineering,andemergencyresponse.Idrawonthisexistingliteraturetocreatea
codingschemeusedtoanalyzetheinterviews.Idiscusstheparticipants,theinterview
method,andqualitativedataanalysisinChapter3.Ipresenttheresultsoftheanalysis
andsubsequentconclusionsinChapter4.Finally,Iprovideasummaryofresultsand
relateddiscussioninChapter5,suggestingdirectionsforfurtherresearch.
8
Chapter 2: Background
This chapter is organized into three sections, providing background for each of
the three research questions listed in Section 1.3, respectively. First, I introduce the use
case of WiSAR, including the standards for initiating a search, decision-making tools for
search management, and the related concepts of distributed cognition and
geocollaboration. In the second section, I define functional requirements of mapping
technology, summarizing considerations for geographic information, visual
representation, cartographic interaction, and GIS functions. Finally, in the third section,
I introduce non-functional requirements and related challenges encountered in the use
of mapping technology for emergency response and Wildland Search and Rescue.
2.1 Search Use Case/Context
Although WiSAR teams frequently conduct rescue missions in which the
subject’s location is known, this study focuses on the ‘search’ component of WiSAR.1 A
search begins with a report of a missing person, which activates a WiSAR response
team. Typically, a WiSAR team then will conduct the following initial actions (Phillips
et al. 2014), also known as reflex tasking (Koester 2008):
• Investigation: A WiSAR team member collects information about the missing
person, or the subject, and the reporting party, or the person who reported them
as missing, as well as the specifics of the event, including the subject’s plan or
intentions, the Point Last Seen (PLS) verified by an eyewitness, or the
1 Rescue can also be a geographic problem; see Doherty, Guo, and Alvarez’s (2013) suitability analysis of helicopter landing zones.
9
Last Known Point (LKP), suggested by an indication of the subject’s presence,
such as their car at a trailhead parking lot, or their signature in a summit ledger.
Defining the search area: An Initial Planning Point (IPP) is designated, which may
be the PLS or the LKP. Based on the IPP, the time the subject has been missing, the
subject’s mobility, and other factors, a theoretical search area is designated,
although there is always consideration that the subject may be somewhere in the
rest of the world (ROW), or anywhere outside of the search area.
Establishing the Incident Command System (ICS): As specified in the National
Incident Management System (NIMS), trained search personnel assume roles
within the Incident Command System (ICS), which structures the responsibilities
of each individual. An Incident Commander (IC) takes responsibility for all
response activities. For each of the standard management functions—Planning,
Operations, Logistics, and Administration/Finance—a section chief may be
designated as needed. The ICS expands with the scope of operations (Federal
Emergency Management Agency 2013). An Incident Command Post (ICP) is
designated to serve as the location from which operations and resources are
coordinated. At the beginning of a search, actions are considered to be in the first
operational period of time during the incident; operational periods are used to
structure actions taken through time and usually last 12 or 24 hours (FEMA 2013).
Containment: Measures known as containment are taken to prevent the subject
from leaving the search area, including placing WiSAR team members at locations
such as trailheads and roads.
Hasty Search: To conduct a hasty search, groups of searchers, or field teams, are
deployed to look for the subject in the field, or in the physical space of the search
area, as soon as is reasonable. Phillips et al. (2014, 169) note that “the term [hasty]
refers to deployment of resources and not to the tactic of actual searching.” These
groups may traverse the area on foot or may use another form of transportation
such as horseback, all-terrain vehicle (ATV), snowmobile, or helicopter.
10
These initial actions often are all that is needed to resolve the situation. Phillips
et al. (2014, 167) state that “A 10-year review of US National Park Service search
incidents (2003–2012) found that 96% of all search incidents were resolved in less
than 1 day through initial actions.” Koester reports that 93% of 12,900 searches that
reported search time were resolved within the first 24 hours (2008, 47). Although
infrequent, searches that do extend beyond the first operational period can become
very data-intensive (Durkee and Glynn-Linaris 2012) and increase in urgency as the
subject’s chance of survival decreases over time (Adams et al. 2007). Additional
resources and personnel may be called upon, including more field teams, search dogs
and their handlers, helicopters, and airplanes. Throughout, WiSAR mission goals are to
locate and help the missing person and to keep search personnel safe while doing so. A
search ends in discovery of the subject at the found location—whether uninjured/not-
ill, injured/ill, or dead—and may require subsequent rescue; however, if the subject is
not found after a suitable period, search activities may be suspended or reduced due to
risk to the searchers or exhaustion of search resources.
Mapping technology plays an important role in accomplishing the mission goals
of a search. Tomaszewski (2015) describes a framework for the tasks that mapping
technology supports in emergency response generally, as shown in Figure 2. First,
mapping technology fills a reference use role to provide geographic context. Second,
mapping technology is used to gather situation inputs, or incident-specific
information from various sources. Mapping technology allows responders to perform
data analytics, including filtering, querying and modeling, and is also employed to
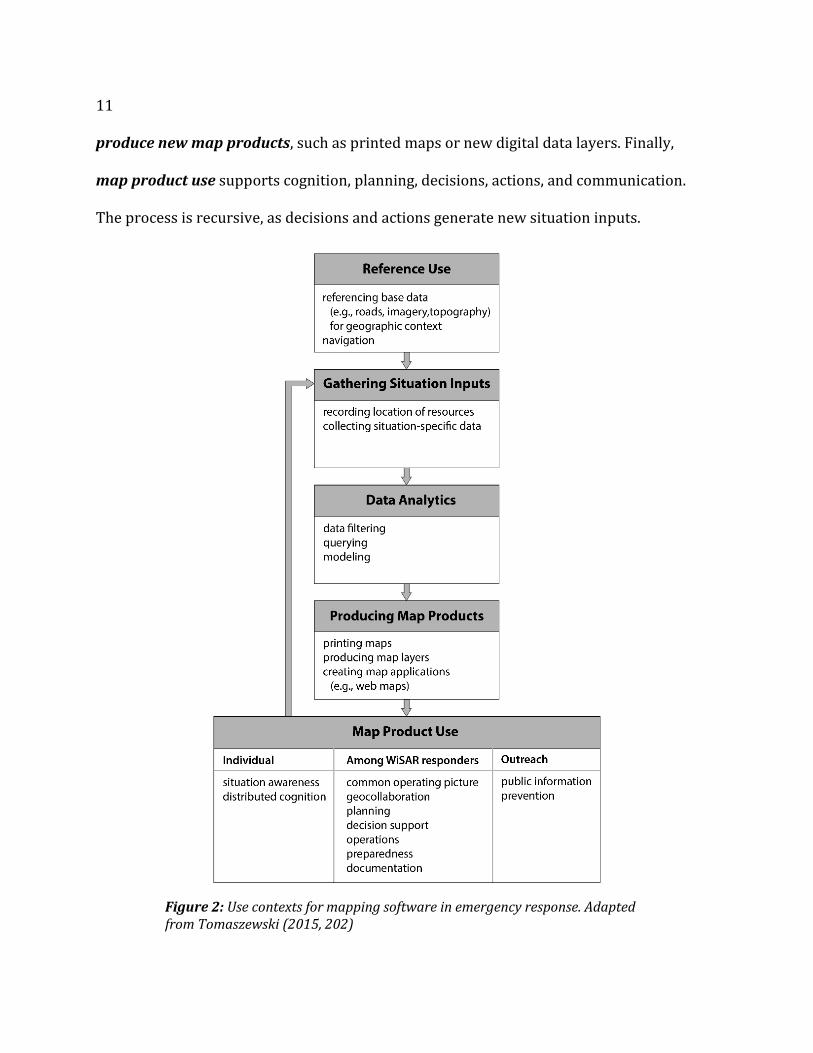
11
produce new map products, such as printed maps or new digital data layers. Finally,
map product use supports cognition, planning, decisions, actions, and communication.
The process is recursive, as decisions and actions generate new situation inputs.
Figure 2: Use contexts for mapping software in emergency response. Adapted from Tomaszewski (2015, 202)
12
Mapping technology may be referenced for context throughout a wildland
search, including by personnel in the field for navigation. Field teams commonly carry
both paper maps and handheld Global Positioning System (GPS) devices, which
connect to satellite systems to sense the user’s geographic location. WiSAR training
manuals emphasize the limitations of GPS devices that make them potentially
unreliable, such as signal reception, susceptibility to heat, cold, or water damage, and
battery life. Therefore, standard training for field team personnel includes land
navigation with a paper map and a compass; United States Geological Survey (USGS)
topographic quadrangles at a scale of 1:24,000 are frequently used by WiSAR field
teams (NASAR 2005).
The integrated use of paper maps and GPS devices requires consistent use of a
geodetic datum, which describes a reference shape, often a spheroid, used to represent
the Earth’s surface (NASAR 2005). WiSAR teams in the United States commonly use the
North American Datum of 1927 (NAD27), the World Geodetic System 1984 (WGS84), or
the North American Datum of 1983 (NAD83) (Pfau 2013). Determining geographic
location also requires a coordinate system to describe any specific position on the
datum. Common coordinate systems used in SAR include geographic coordinates
(latitude/longitude or lat/lon), Universal Transverse Mercator (UTM), and UTM
derivatives, specifically the Military Grid Reference System (MGRS) and the United
States National Grid (USNG). While geographic coordinates are conventionally used to
communicate with aviation resources, UTM and its derivative systems are better suited
for field teams because UTM coordinates use meters to specify locations, a more
13
tangible and consistent unit of measures when navigating in the field. The MGRS and
USNG reference the UTM grid, but specify different alphanumeric codes to describe
location (Studt and Scott 2012). The US National Grid was designated as the US federal
standard for civilian land SAR in 2011; however, it has not been widely implemented
(Studt and Scott 2012). In a survey of 74 SAR teams, including 91.8% teams based in the
United States, Pfau (2013) found that the most commonly used coordinate system is
UTM, used by 72% of teams; 26% of teams used geographic coordinates, and only 1% of
teams used the MGRS or USNG.
Mapping technology also plays an important role in the command post; while
directing a search, the incident commander and section chiefs add situation-specific
information to the reference data and use newly assembled map products to decide
how and where to allocate resources. To differentiate geographic space, the search area
is divided into search segments, or areas that are designed to be searched by a single
field team during one operational period. During each operational period, each field
team receives an assignment, or designated task, consisting of a segment to be
searched and instructions such as a target POD for the degree of thoroughness. WiSAR
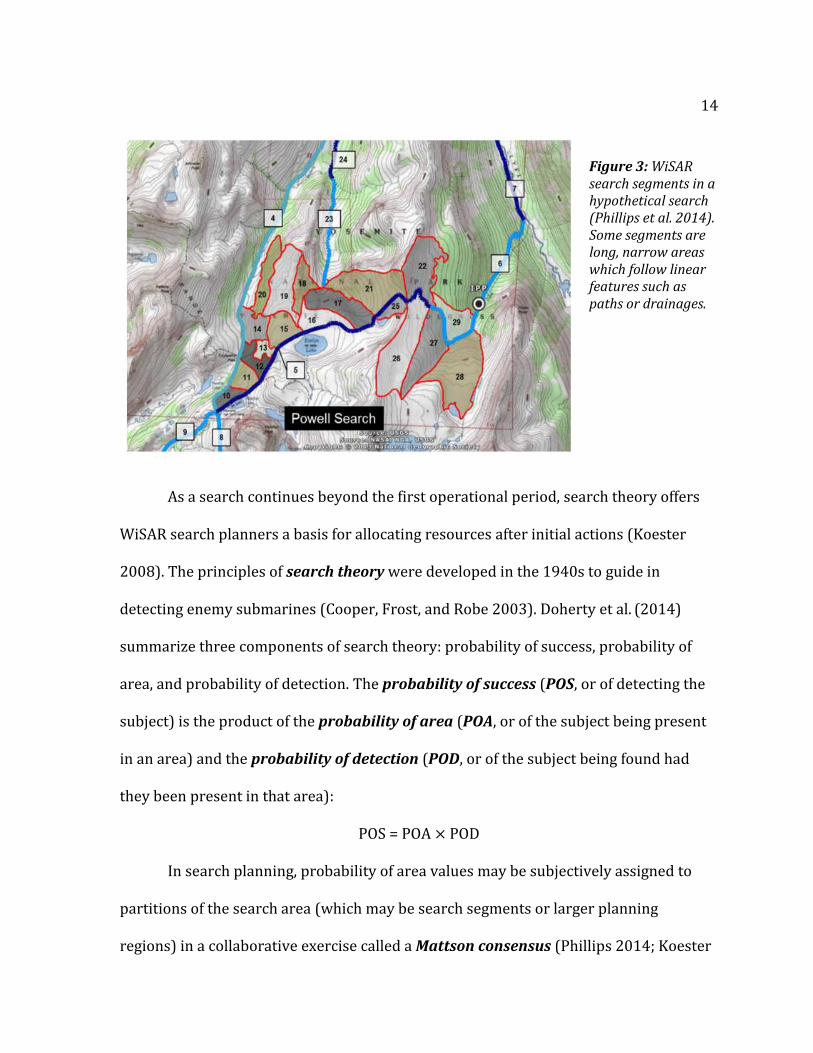
search segments often are irregularly shaped2 (see Figure 3) due to a preference for
segment boundaries to be visibly identifiable in the field and the ability of a field team
to traverse the assigned area (e.g., a search segment should not be split by a sizeable
cliff unless the team is trained and equipped for technical climbing).
2 As opposed to rectilinear grid cells
14
As a search continues beyond the first operational period, search theory offers
WiSAR search planners a basis for allocating resources after initial actions (Koester
2008). The principles of search theory were developed in the 1940s to guide in
detecting enemy submarines (Cooper, Frost, and Robe 2003). Doherty et al. (2014)
summarize three components of search theory: probability of success, probability of
area, and probability of detection. The probability of success (POS, or of detecting the
subject) is the product of the probability of area (POA, or of the subject being present
in an area) and the probability of detection (POD, or of the subject being found had
they been present in that area):
POS = POA × POD
In search planning, probability of area values may be subjectively assigned to
partitions of the search area (which may be search segments or larger planning
regions) in a collaborative exercise called a Mattson consensus (Phillips 2014; Koester
Figure 3: WiSAR search segments in a hypothetical search (Phillips et al. 2014). Some segments are long, narrow areas which follow linear features such as paths or drainages.

15
2008). In this “mathematical approach to aggregating opinions,” (Koester 2008, 312)
several WiSAR specialists—each holding requisite search experience and an
understanding of the current search circumstances—independently assign a POA value
to each partition. A value is also assigned to ROW (rest of the world)—i.e., the
possibility that the subject is not within the search area. All submitted POA values are
averaged for each partition, and those with the greatest average POA are prioritized
when allocating search resources. While paper maps may be leveraged in such an
exercise, mapping software is not commonly employed for search theory. Electronic
mapping tools can help in search management after initial actions by increasing POD
(i.e., increasing the likelihood that the subject will be found) through interventions such
as identifying potential hazards that may have given the subject trouble or by
improving the accuracy of POA or POD estimates. For instance, Ferguson (2008)
suggests that GPS can offer the most reliable documentation of the ground actually
covered by a field team, improving estimates of POD (Doherty et al. 2014; Cooper, Frost,
and Robe 2003).
The incident commander also may draw on analysis to produce new information
and inform decisions. Another aid for search resource allocation is emerging research
on lost person behavior, which examines the actions taken by the subject(s) of a
search. Statistical analysis of incident data has been used to characterize typical
behavior of missing subjects according to subject category (e.g., hiker, hunter, climber).
Search predictions and decisions may be made based on the subject’s category and
associated statistics. Koester (2008) documents thirty-four subject categories, primarily
16 derived from the International Search and Rescue Incident Database (ISRID). The ISRID
is a collection of SAR incident data which included more than 50,600 incidents as of
2008 (Koester 2008). Although the ISRID is a large dataset, it is incomplete, and there is
no comprehensive record of SAR incidents compiled nationally. Along with category-
based behavioral trends, Koester summarizes average geographic attributes for each
subject category, such as distance between the IPP and found location, elevation
difference between IPP and found location, dispersion angle from the intended route,
and distance from the closest linear feature, referred to as track offset. These statistics
can aid in search planning; however, a global dataset must be used with caution when
applied to one local instance. This is emphasized by Doke’s (2012) comparison of
geographic statistics from the ISRID against incident data from Yosemite National Park,
which reveals a significant difference in average horizontal distance between found
location and IPP as well as a significant difference in average track offset. This finding
highlights the importance of the unique intersection of terrain, climate, land use, and
circumstances in any individual search situation. Familiarity with the local terrain,
knowledge of local search incident history, and the specifics of the case at hand
contribute significantly to the success of searches.
The appropriate time to call off a search without finding the subject is a
controversial and context-dependent topic discussed within the SAR community.
Following a study of 2,302 past searches, Adams et al. (2007) recommended a 51-hour
cutoff time for searches, after which only 1% of survivors remained missing. In a Letters
to the Editor exchange, multiple SAR experts expressed disappointment at such a

17
definitive guideline (Fortini et al. 2008; Van Tilburg 2008). As a follow-up, Adams,
Schmidt, and Newgard (2008) acknowledged:
…the 41 real people who were still missing at the end of the 50th hour (1.2% of all missing) and their friends and families and the rescuers will not be comforted by these numbers. All that matters to them, very understandably, is the 1 person who hasn’t yet been found… We acknowledge that a statistical model… cannot account for the emotional value we all place on saving a single life whenever possible. (75)
The very real consideration of a human life at stake leads to an understandable aversion
to reliance on statistics and probability models in the WiSAR community. In any
incident, an incident commander may be dealing with the case that defies all odds.
Mapping technology allows newly generated map products and geographic
information to inform planning, decision making, and communication. Integrating
information and events throughout a search incident requires a high level of contextual
understanding known as situation(al) awareness. Situation awareness is described as
“a state of knowledge… pertaining to the state of a dynamic environment” that is
achieved through continuous assessment (Endsley 1995, 36). Though generally defined
as “knowing what is going on,” situation awareness is more than perception; it is a
holistic comprehension of relevant information, contributing to the ability to anticipate
imminent events and respond according to incident management goals (Endsley 1995,
36-37). Throughout a search incident, maps are used to collect, process, and visualize
information, helping to build situation awareness. One useful approach to exploring
how maps can be used as cognitive tools in search is distributed cognition, a
framework that considers the role of an individual’s surrounding environment and
objects therein, during cognition. Hollan, Hutchins, and Kirsh (2000) suggest that,
18 through distributed cognition, the human reasoning process can be supported and
extended by interaction with external artifacts, including the act of arranging objects in
space as well as the creation of visuals, such as maps and other interactive
visualizations. During a search incident, a member of the search team may leverage
distributed cognition, externalizing his or her thinking, by sketching a map of clue
locations to better understand the clue distribution and improve situation awareness.
Distributed cognition becomes collaborative when search planners share and co-
develop their reasoning processes through manipulation of a common visual
representation. In Cartography and Geographic Information Science, this group activity
is described as geocollaboration, or the process of multi-person problem solving using
geographic information (MacEachren et al. 2005). In emergency response, collaboration
can help build a common operating picture (COP), or consistently shared situation
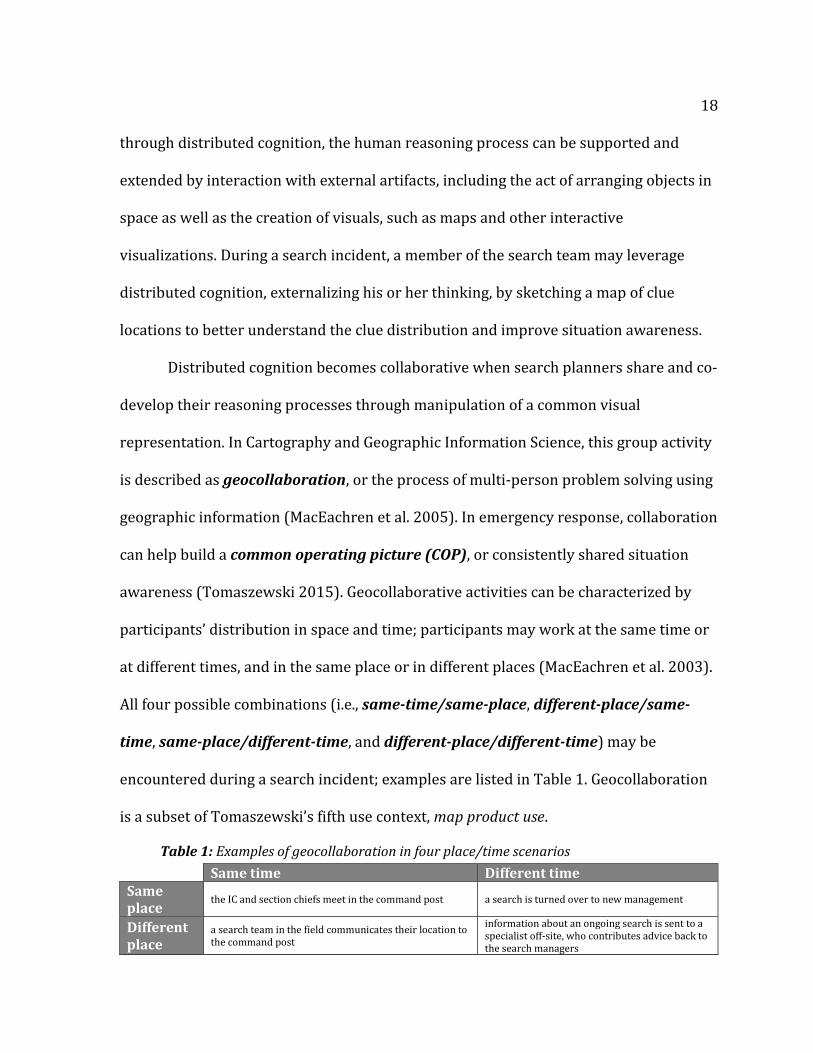
awareness (Tomaszewski 2015). Geocollaborative activities can be characterized by
participants’ distribution in space and time; participants may work at the same time or
at different times, and in the same place or in different places (MacEachren et al. 2003).
All four possible combinations (i.e., same-time/same-place, different-place/same-
time, same-place/different-time, and different-place/different-time) may be
encountered during a search incident; examples are listed in Table 1. Geocollaboration
is a subset of Tomaszewski’s fifth use context, map product use.
Same time Different time Same place
the IC and section chiefs meet in the command post a search is turned over to new management
Different place
a search team in the field communicates their location to the command post
information about an ongoing search is sent to a specialist off-site, who contributes advice back to the search managers
Table 1: Examples of geocollaboration in four place/time scenarios
19
2.2 Functional Requirements of Mapping Technology for WiSAR
Identifying gaps or unmet user needs in existing mapping functionality requires
an examination of the functionality currently offered, used, and needed in the WiSAR
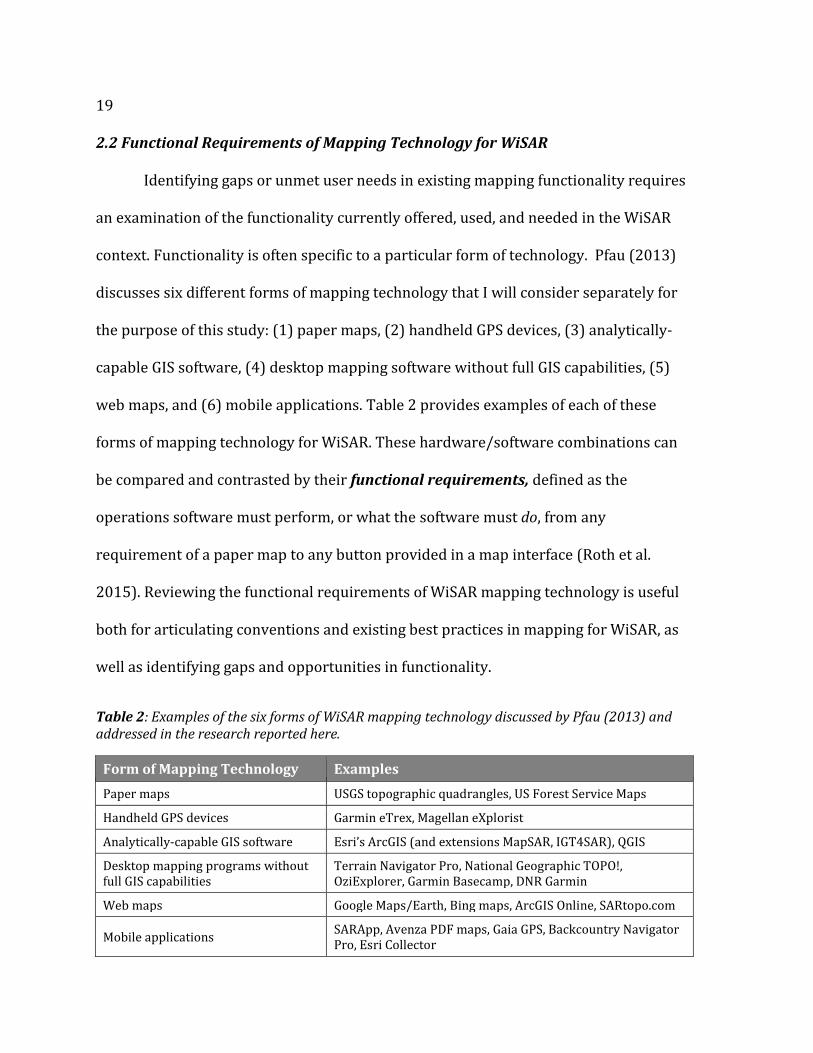
context. Functionality is often specific to a particular form of technology. Pfau (2013)
discusses six different forms of mapping technology that I will consider separately for
the purpose of this study: (1) paper maps, (2) handheld GPS devices, (3) analytically-
capable GIS software, (4) desktop mapping software without full GIS capabilities, (5)
web maps, and (6) mobile applications. Table 2 provides examples of each of these
forms of mapping technology for WiSAR. These hardware/software combinations can
be compared and contrasted by their functional requirements, defined as the
operations software must perform, or what the software must do, from any
requirement of a paper map to any button provided in a map interface (Roth et al.
2015). Reviewing the functional requirements of WiSAR mapping technology is useful
both for articulating conventions and existing best practices in mapping for WiSAR, as
well as identifying gaps and opportunities in functionality.
Table 2: Examples of the six forms of WiSAR mapping technology discussed by Pfau (2013) and addressed in the research reported here.
Form of Mapping Technology Examples
Paper maps USGS topographic quadrangles, US Forest Service Maps
Handheld GPS devices Garmin eTrex, Magellan eXplorist
Analytically-capable GIS software Esri’s ArcGIS (and extensions MapSAR, IGT4SAR), QGIS
Desktop mapping programs without full GIS capabilities
Terrain Navigator Pro, National Geographic TOPO!, OziExplorer, Garmin Basecamp, DNR Garmin
Web maps Google Maps/Earth, Bing maps, ArcGIS Online, SARtopo.com
Mobile applications SARApp, Avenza PDF maps, Gaia GPS, Backcountry Navigator Pro, Esri Collector
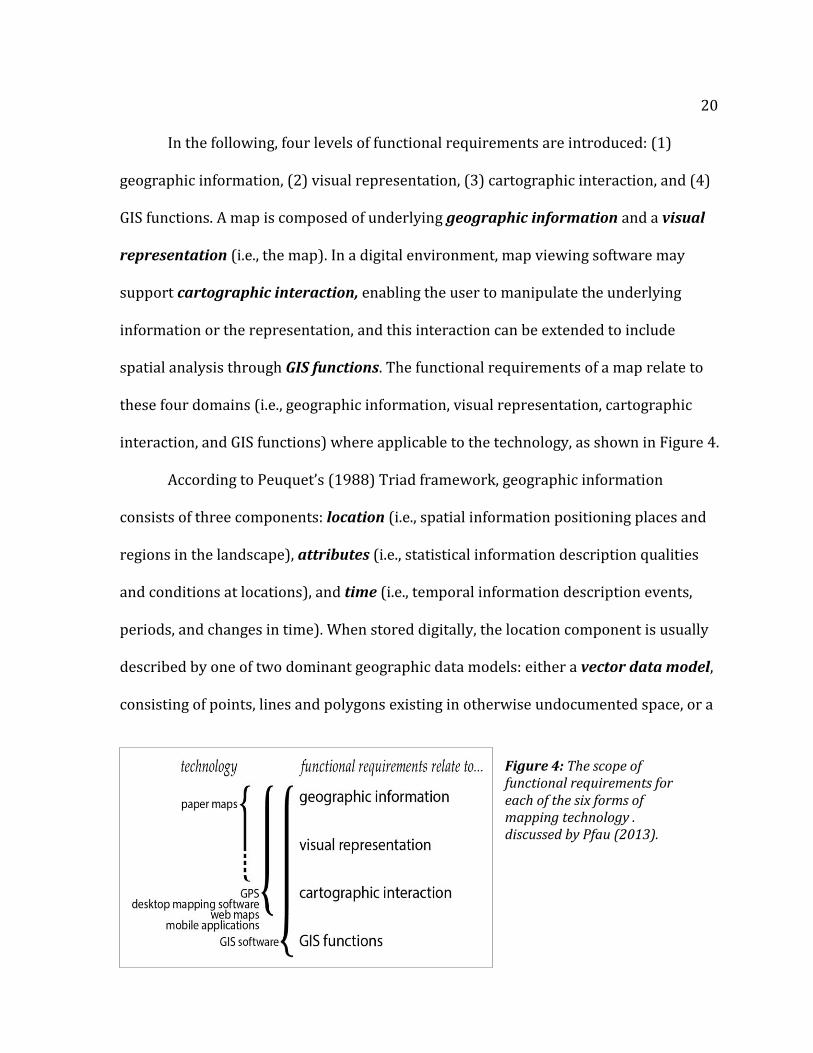
20 In the following, four levels of functional requirements are introduced: (1)
geographic information, (2) visual representation, (3) cartographic interaction, and (4)
GIS functions. A map is composed of underlying geographic information and a visual
representation (i.e., the map). In a digital environment, map viewing software may
support cartographic interaction, enabling the user to manipulate the underlying
information or the representation, and this interaction can be extended to include
spatial analysis through GIS functions. The functional requirements of a map relate to
these four domains (i.e., geographic information, visual representation, cartographic
interaction, and GIS functions) where applicable to the technology, as shown in Figure 4.
According to Peuquet’s (1988) Triad framework, geographic information
consists of three components: location (i.e., spatial information positioning places and
regions in the landscape), attributes (i.e., statistical information description qualities
and conditions at locations), and time (i.e., temporal information description events,
periods, and changes in time). When stored digitally, the location component is usually
described by one of two dominant geographic data models: either a vector data model,
consisting of points, lines and polygons existing in otherwise undocumented space, or a
Figure 4: The scope of functional requirements for each of the six forms of mapping technology . discussed by Pfau (2013).
21
raster data model, consisting of a grid of cells comprehensively documenting space
(Longley et al. 2005). In a practical application like WiSAR, functional requirements
must extend beyond data models to address specific file formats. Common file formats
using the vector data model include the shapefile (a combination of the .shp, .shx, and
.dbf file formats) and the GPS Exchange Format (.gpx). Common file formats using the
raster data model include the Tagged Image File Format (TIFF), Digital Raster Graphic
(.drg), and Esri Grid. Pfau (2013) identifies both vector (e.g., field team coordinates, LKP
and clues) and raster data (e.g., terrain coverage models, digital elevation models,
satellite or aerial imagery) as valuable to WiSAR operations. An example of a functional
requirement related to geographic information might be “parse the GPS Exchange
Format (.gpx).”
The basic components of a visual representation can be described by its
constituent visual variables—such as size, shape, and color hue— the visual
dimensions by which a graphic can be varied to encode information, geographic or
otherwise (Bertin 1967|1983). Table 3 provides Roth’s (forthcoming) definition of each
of the common visual variables used in map design, and Figure 5 presents MacEachren
et al.’s (2012, 2497) pictorial demonstration of each of these visual variables.

22
Table 3: Roth’s (forthcoming) definitions of Bertin and MacEachren’s visual variables
Visual Variable Definition location the position of the map symbol relative to a coordinate frame Size the amount of space occupied by the map symbol
color hue the dominant wavelength of the map symbol on the visible portion of the electromagnetic spectrum (e.g., blue, green, red)
color value (lightness)
the relative amount of energy emitted or reflected by the map symbol
color saturation the spectral peakedness of the map symbol across the visible spectrum orientation the direction or rotation of the map symbol from ‘normal’. grain or texture the coarseness of the fill pattern within the map symbol arrangement the layout of graphic marks constituting a map symbol Shape the external form (i.e., the outline) of the map symbol fuzziness or crispness
the sharpness of the boundary of the map symbol
transparency the amount of graphic blending between a map symbol and the background or underlying map symbols
Figure 5: Visual variables, demonstrated graphically. (MacEachren et al. 2012, 2497).

23
Visual variables often are employed to encode attribute information in maps; for
instance, color lightness may be used to represent the population density of counties
across the country. In the WiSAR context, color-coding field teams’ assignments to
differentiate between types of field teams (e.g., showing air-scent canine teams’ routes
in blue while helicopter routes are shown in red) is an example of a functional
requirement related to visual representation.
The image of the map itself is frequently accompanied by map elements, or
common features of maps that also constitute part of the visual representation. Slocum
et al. (2009) provide a list of eight common map elements, as listed in Table 4.
Reference maps carried by field teams typically include the following components at a
minimum (NASAR 2005):
Map elements: an indication of north a coordinate grid an indication of scale —usually represented by a scale bar Geographic information: measurable elevation and contour — usually represented by contour lines water bodies and water courses manmade features such as roads, trails, and buildings
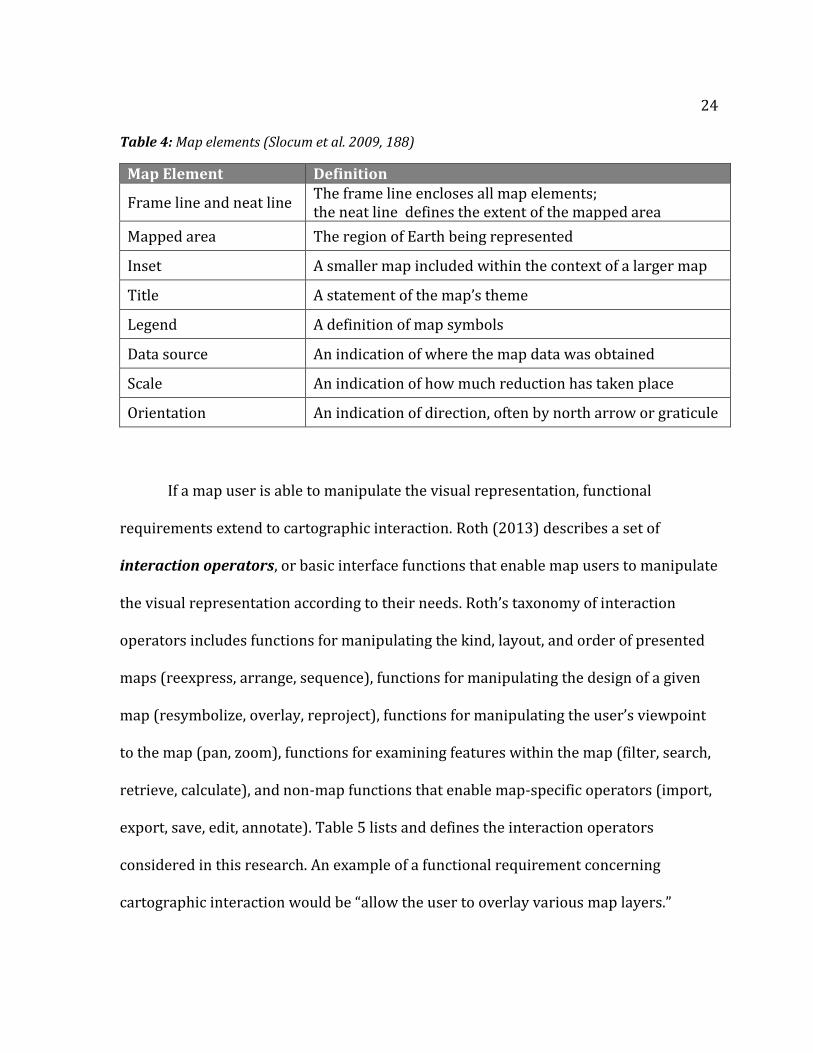
24 Table 4: Map elements (Slocum et al. 2009, 188)
Map Element Definition
Frame line and neat line The frame line encloses all map elements; the neat line defines the extent of the mapped area
Mapped area The region of Earth being represented
Inset A smaller map included within the context of a larger map
Title A statement of the map’s theme
Legend A definition of map symbols
Data source An indication of where the map data was obtained
Scale An indication of how much reduction has taken place
Orientation An indication of direction, often by north arrow or graticule
If a map user is able to manipulate the visual representation, functional
requirements extend to cartographic interaction. Roth (2013) describes a set of
interaction operators, or basic interface functions that enable map users to manipulate
the visual representation according to their needs. Roth’s taxonomy of interaction
operators includes functions for manipulating the kind, layout, and order of presented
maps (reexpress, arrange, sequence), functions for manipulating the design of a given
map (resymbolize, overlay, reproject), functions for manipulating the user’s viewpoint
to the map (pan, zoom), functions for examining features within the map (filter, search,
retrieve, calculate), and non-map functions that enable map-specific operators (import,
export, save, edit, annotate). Table 5 lists and defines the interaction operators
considered in this research. An example of a functional requirement concerning
cartographic interaction would be “allow the user to overlay various map layers.”
25
Paper map functionality may extend to cartographic interaction when
annotation is allowed or through other manual methods of manipulating the
representation. In WiSAR, a traditional way to manage the visual representation of
many, often overlapping, layers of information is to use transparent sheets of plastic
material.3 These sheets are placed over paper basemaps, with the incident data
manually drawn on these overlays (LaValla and Stoffel 1989). This manual method may
quickly become unmanageable due to increasing data quantities; thus, streamlining the
preparation, management, and interpretation of such overlays is a natural application
of GIS software (Ferguson 2008).
GIS software can further extend cartographic interaction through various spatial
analysis capabilities. Roth’s (2013) calculate operator encapsulates the broad range of
user-defined spatial analysis capabilities available when the mapping technology does
have GIS support. Albrecht (1995) identifies 144 GIS functions, which allow
manipulation of the representation or the underlying information. Ferguson (2008)
illustrates ways in which three of these GIS functions—buffer, hillshade, and
viewshed—can generate additional geographic information to help in search
management. Given the IPP, a buffer, or an area within a specified distance of some
feature, can be used to map the distances at which certain percentiles of similar
subjects have been found, according to ISRID data. A buffer also can be used to
approximate the geographic area covered by a field team following a linear feature such
3 Such sheets are sometimes referred to by the trademarked name for one such product, Mylar, or alternatively referred to as ‘acetate,’ referencing another clear sheet material, cellulose acetate
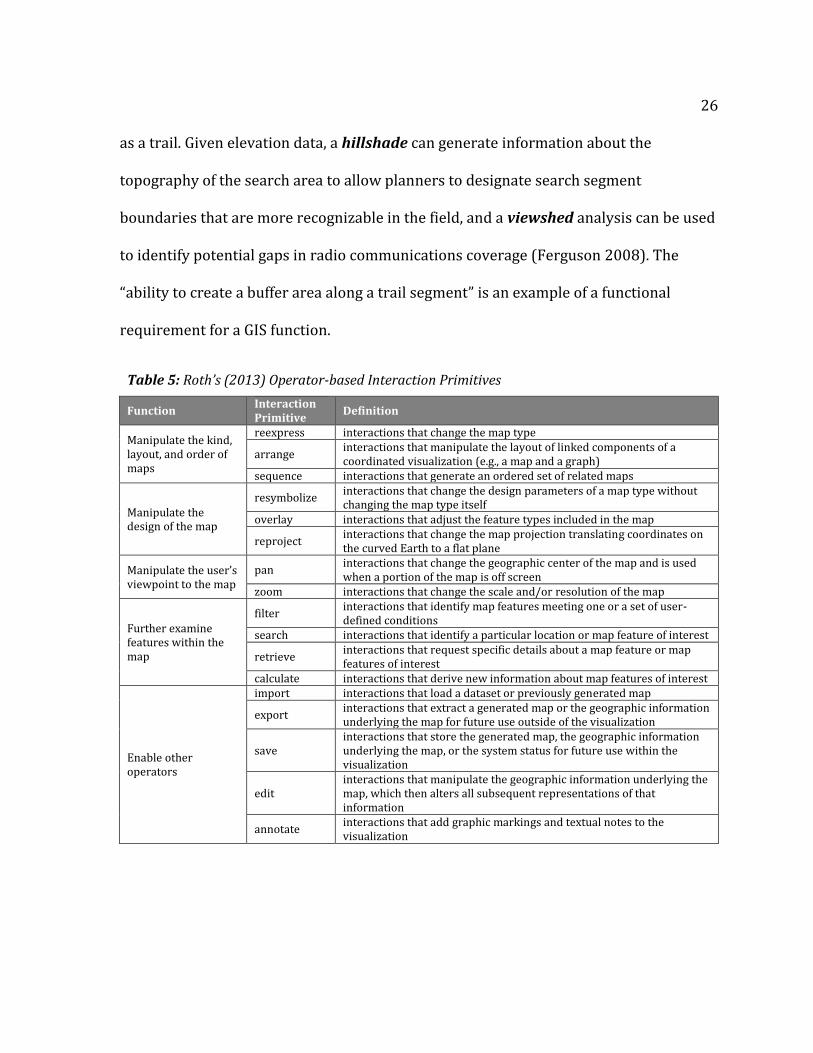
26 as a trail. Given elevation data, a hillshade can generate information about the
topography of the search area to allow planners to designate search segment
boundaries that are more recognizable in the field, and a viewshed analysis can be used
to identify potential gaps in radio communications coverage (Ferguson 2008). The
“ability to create a buffer area along a trail segment” is an example of a functional
requirement for a GIS function.
Table 5: Roth’s (2013) Operator-based Interaction Primitives
Function Interaction Primitive
Definition
Manipulate the kind, layout, and order of maps
reexpress interactions that change the map type
arrange interactions that manipulate the layout of linked components of a coordinated visualization (e.g., a map and a graph)
sequence interactions that generate an ordered set of related maps
Manipulate the design of the map
resymbolize interactions that change the design parameters of a map type without changing the map type itself
overlay interactions that adjust the feature types included in the map
reproject interactions that change the map projection translating coordinates on the curved Earth to a flat plane
Manipulate the user’s viewpoint to the map
pan interactions that change the geographic center of the map and is used when a portion of the map is off screen
zoom interactions that change the scale and/or resolution of the map
Further examine features within the map
filter interactions that identify map features meeting one or a set of user-defined conditions
search interactions that identify a particular location or map feature of interest
retrieve interactions that request specific details about a map feature or map features of interest
calculate interactions that derive new information about map features of interest
Enable other operators
import interactions that load a dataset or previously generated map
export interactions that extract a generated map or the geographic information underlying the map for future use outside of the visualization
save interactions that store the generated map, the geographic information underlying the map, or the system status for future use within the visualization
edit interactions that manipulate the geographic information underlying the map, which then alters all subsequent representations of that information
annotate interactions that add graphic markings and textual notes to the visualization
27
2.3 Challenges & Non-Functional Requirements of Mapping Technology for WiSAR
Mapping experts who seek to improve the effectiveness and aid the adoption of
mapping technology for WiSAR also must understand the challenges beyond functional
requirements that make adoption and effectiveness difficult in the WiSAR context. Non-
functional requirements, or conditions and constraints of software beyond its
functionality that impact its viability and adoption, may be named as solutions to these
challenges (Sidlar and Rinner 2009). Examples of non-functional requirements include
usability, flexibility, interoperability, security, cost, coherence, and reliability (Chung
and do Prado Leite 2009). I extend the concept of non-functional requirements past its
original software-based definition to include any design considerations for mapping
technology that are distinct from the basic mapping functionality supporting
representation and interaction described in Section 2.2. An example of a non-functional
requirement might be a need for a paper map to be water resistant for use by a field
team. This non-functional requirement is necessitated by a context-specific challenge
that WiSAR field teams face: that of exposure to weather conditions.
Multiple scholars have enumerated specific non-functional challenges for
emergency response GIS (Cutter 2003, Zerger and Smith 2003, Tomaszewski 2015),
with some specifically addressing WiSAR (Ferguson 2008, Pfau 2013). These challenges
encompass what Cutter (439) calls “constraints on the utilization of GI Science,” what
Pfau (1) calls “barriers to teams adopting full GIS,” and what Zerger and Smith (123)
call “limitations of GIS” and “non-technical GIS impediments.” Figure 6 provides a
summary of five contributions (Cutter, Zerger and Smith, Tomaszewski, Ferguson and
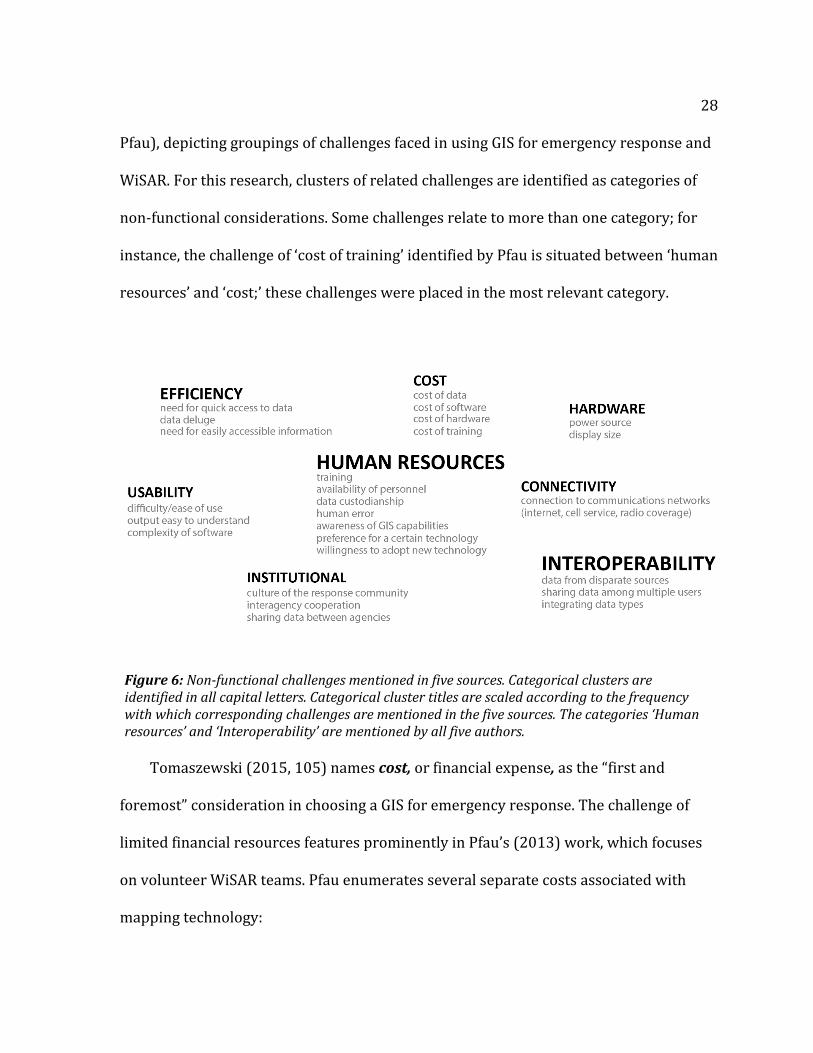
28 Pfau), depicting groupings of challenges faced in using GIS for emergency response and
WiSAR. For this research, clusters of related challenges are identified as categories of
non-functional considerations. Some challenges relate to more than one category; for
instance, the challenge of ‘cost of training’ identified by Pfau is situated between ‘human
resources’ and ‘cost;’ these challenges were placed in the most relevant category.
Tomaszewski (2015, 105) names cost, or financial expense, as the “first and
foremost” consideration in choosing a GIS for emergency response. The challenge of
limited financial resources features prominently in Pfau’s (2013) work, which focuses
on volunteer WiSAR teams. Pfau enumerates several separate costs associated with
mapping technology:
Figure 6: Non-functional challenges mentioned in five sources. Categorical clusters are identified in all capital letters. Categorical cluster titles are scaled according to the frequency with which corresponding challenges are mentioned in the five sources. The categories ‘Human resources’ and ‘Interoperability’ are mentioned by all five authors.
29
…many search and rescue organizations are volunteer groups that are self-funded (i.e. through donations, fundraising and memberships) and may not have sufficient funds to purchase software, hardware, data and training therefore resulting in lack of expertise in operating GIS. (5)
As a consequence of cost, Pfau notes a resultant problem: a lack of expertise. I grouped
challenges relating to personnel, such as expertise, training, and availability, into a
category labeled human resources. Human resources challenges appear in all five of
the publications listed above. The category also encompasses the issue of awareness (or
lack thereof) of the capabilities of GIS among emergency responders, a factor
emphasized by Cutter, Zerger and Smith, and Tomaszewski. Tomaszewski names
awareness of GIS as one of two primary areas for improvement in emergency response,
describing the other as the need for “coordination, sharing, and interoperability of GIS
resources” (9). Inter-agency cooperation and related institutional challenges are most
strongly emphasized by Cutter and include rules and regulations, willingness of
agencies to cooperate, and other issues that arise from the culture of the response
community.
Interoperability challenges, defined here as pertaining to the ability of different
technologies to exchange information (not in the interagency cooperation sense that
Tomaszewski uses), are mentioned in all five sources. Interoperability challenges
include the transfer of data to other programs and the ability of a technology to allow
sharing of data with other users (i.e., the concept of geocollaboration introduced in
Section 2.1).
Challenges of connectivity to communication networks, including local servers, cell
phone networks, and the internet, relate to both a device’s ability to connect and the
30 wilderness setting of WiSAR operations. As Ferguson (2008) points out, such networks
often are unavailable in the WiSAR context. The environment in which searchers work,
particularly for outdoor teams in the field, calls attention to the properties of a
technology as a material object. Hardware traits, or physical properties of a device
including display size and power sources, are identified by Zerger and Smith (2003),
Cutter (2003), and Ferguson.
Due to the context of an emergent situation, efficiency concerns are of particular
importance. The ability to access data quickly, was identified by Cutter, Pfau, and Zerger
and Smith (2003) as an important factor in the effectiveness of GIS for emergency
response. Efficiency of tasks may be facilitated by the design of a technology’s user
interface. Ease of use, or usability, is discussed by Cutter (2003) and Pfau (2013), both
pointing out the importance of an understandable user interface given the complexity
of GIS software.
The interviews conducted in this study discuss many problems, advantages, and
solutions that pertain to the categories described above. A problem in a particular
category does not necessarily demand a solution specific to that category; deficiency in
one category may be resolved by improvement in another. For instance, problems with
ease of use or software complexity may be addressed through training solutions.
Additionally, a non-functional consideration may be addressed by a functional solution.
Identifying problems in these areas as well as suggested solutions (which may pertain
to a separate category) in a WiSAR context will help direct efforts in technology design,
in education, and in other measures to improve mapping technology for WiSAR.
31
Chapter 3: Methods
In this study, I used the qualitative interview method to elicit expert experiences
and opinions about the role of mapping technology for WiSAR. Suchan and Brewer
(2000) assert that qualitative methods are well suited to cartographic researchers
studying map design and use in real-world contexts, as broad questions asked of a small
set of expert participants offer great insight. Further, as Cutter observes “[in emergency
response] there is a large disconnect between the language used and needs of the
research and the applications communities” (2003, 442). Thus, a qualitative study
capturing the needs of the WiSAR community in the words of practicing WiSAR
specialists is both timely and important.
3.1 Participants
Twenty-four (n=24) WiSAR specialists participated in the interview study,
discussing their experience using mapping technology for WiSAR and their opinions on
how mapping technology could be improved to better support WiSAR. An individual
was eligible for participation if he/she had training or professional certification in
Wilderness Search and Rescue (i.e., could be considered a WiSAR specialist) and had
observed the use of mapping technology to support real WiSAR missions (i.e., not just
training exercises, but situations in which a subject genuinely was believed to be
missing or in distress). Two additional interviews were recorded, but were not included
in the analysis due to eligibility. Participants discussed their experience with WiSAR in
seven US states and two Canadian provinces: nine in California, six in Colorado, two in
Virginia, two in Minnesota, and one participant each in Arizona, Oregon, Utah, British
32 Columbia and New Brunswick. Participants represented at least 17 separate WiSAR
team affiliations, including four National Parks.
One participant did not report background information. Of the rest, most
participants (22/23) currently were active with a WiSAR team, and many (15/23) had
filled the position of search manager or incident commander. Participants had a
cumulative total of 422 years of SAR experience, individually ranging from 3 to 44
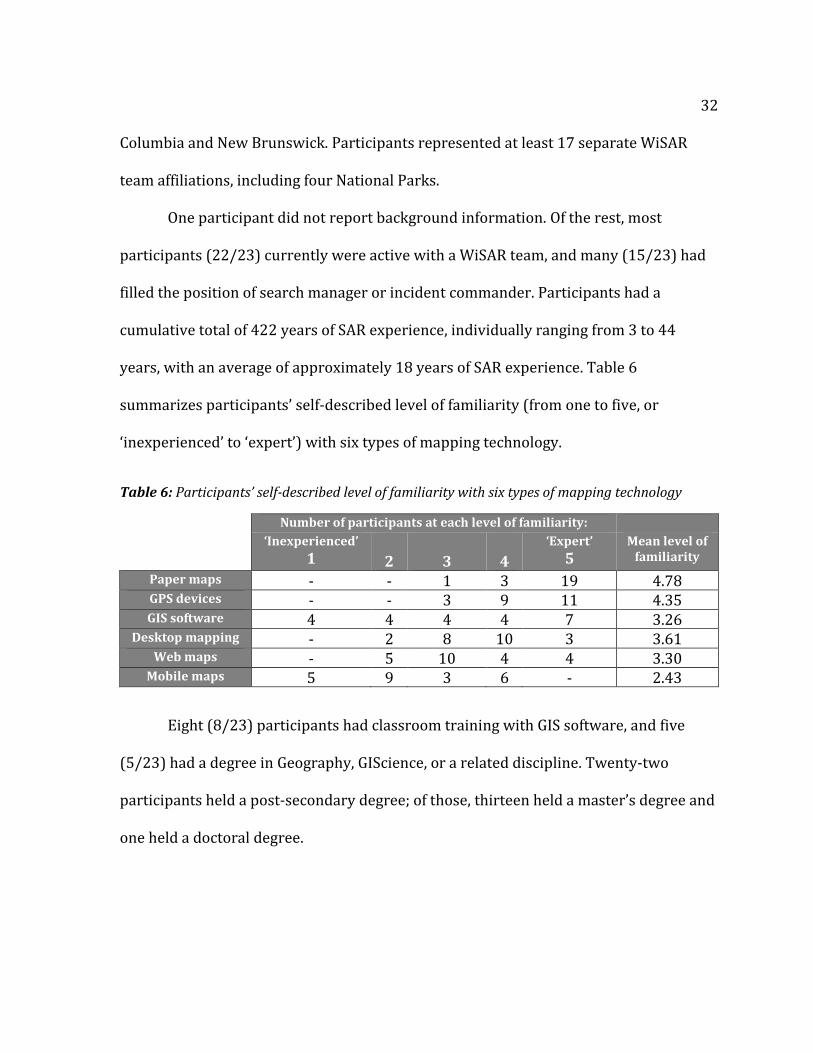
years, with an average of approximately 18 years of SAR experience. Table 6
summarizes participants’ self-described level of familiarity (from one to five, or
‘inexperienced’ to ‘expert’) with six types of mapping technology.
Table 6: Participants’ self-described level of familiarity with six types of mapping technology
Number of participants at each level of familiarity: ‘Inexperienced’
1
2
3
4
‘Expert’
5 Mean level of
familiarity
Paper maps - - 1 3 19 4.78 GPS devices - - 3 9 11 4.35 GIS software 4 4 4 4 7 3.26
Desktop mapping - 2 8 10 3 3.61 Web maps - 5 10 4 4 3.30
Mobile maps 5 9 3 6 - 2.43
Eight (8/23) participants had classroom training with GIS software, and five
(5/23) had a degree in Geography, GIScience, or a related discipline. Twenty-two
participants held a post-secondary degree; of those, thirteen held a master’s degree and
one held a doctoral degree.
33
3.2 Materials and Procedure
Interviews followed a semi-structured protocol in which a similar set of key
questions is presented to each participant, while allowing opportunity for follow-up
probe questions throughout the interview (Suchan and Brewer 2000; Rubin and Rubin
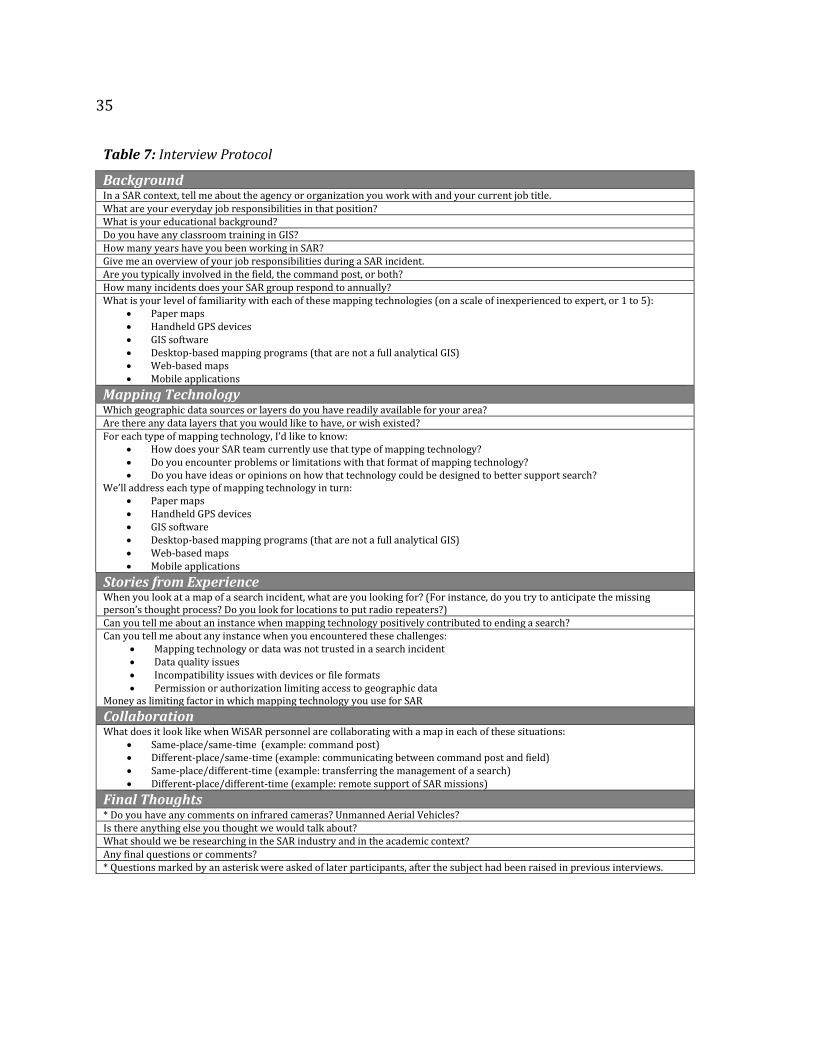
1995). Table 7 details key and probe questions included in the interview protocol.
Interview questions were organized into five sections. Following an initial
background section, participants were asked to discuss the six forms of mapping
technology as identified in Pfau (2013). Questions in this second section asked
participants to describe the current use of these mapping technologies in WiSAR
(Research Question #1). Participants then were asked to discuss problems and
limitations encountered in the SAR context, which served to identify unmet needs in
mapping functionality (Research Question #2) as well as non-functional considerations
(Research Question #3) specific to each form of technology. The second section of
questions also sought opinions on how each technology could be designed to better
support search, driving the discussion toward approaches for overcoming the
difficulties in using mapping technology for WiSAR. The third interview section then
enriched this discussion by eliciting stories from experience using mapping technology
for WiSAR, including inquiry about specific challenges related to functional and non-
functional requirements. The fourth section of questions circled back to the current
state of practice using mapping technology for WiSAR (Research Question #1), focusing
the discussion on multi-user geocollaborative use contexts. Each interview finished
with a short debriefing section to collect final thoughts.
34
Twelve interviews (12/24) were conducted in person and twelve (12/24)
interviews were conducted by phone. I received permission to audio record twenty-
three (23/24) interviews, with one captured by handwritten notes only. The interview
protocol was designed to last approximately 60 to 90 minutes; recorded interviews
lasted between 55 and 140 minutes with an average of approximately 81 minutes.
Audio recordings were transcribed, either through a transcription service or by
members of the study team. The cumulative length of the transcripts and notes was
approximately 204,266 words. Qualitative analysis (see Section 3.3) was applied to
both the transcripts and the handwritten notes.
35
Table 7: Interview Protocol
Background In a SAR context, tell me about the agency or organization you work with and your current job title. What are your everyday job responsibilities in that position? What is your educational background? Do you have any classroom training in GIS? How many years have you been working in SAR? Give me an overview of your job responsibilities during a SAR incident. Are you typically involved in the field, the command post, or both? How many incidents does your SAR group respond to annually? What is your level of familiarity with each of these mapping technologies (on a scale of inexperienced to expert, or 1 to 5):
Paper maps Handheld GPS devices GIS software Desktop-based mapping programs (that are not a full analytical GIS) Web-based maps Mobile applications
Mapping Technology Which geographic data sources or layers do you have readily available for your area? Are there any data layers that you would like to have, or wish existed? For each type of mapping technology, I’d like to know:
How does your SAR team currently use that type of mapping technology? Do you encounter problems or limitations with that format of mapping technology? Do you have ideas or opinions on how that technology could be designed to better support search?
We’ll address each type of mapping technology in turn: Paper maps Handheld GPS devices GIS software Desktop-based mapping programs (that are not a full analytical GIS) Web-based maps Mobile applications
Stories from Experience When you look at a map of a search incident, what are you looking for? (For instance, do you try to anticipate the missing person’s thought process? Do you look for locations to put radio repeaters?) Can you tell me about an instance when mapping technology positively contributed to ending a search? Can you tell me about any instance when you encountered these challenges:
Mapping technology or data was not trusted in a search incident Data quality issues Incompatibility issues with devices or file formats Permission or authorization limiting access to geographic data
Money as limiting factor in which mapping technology you use for SAR
Collaboration What does it look like when WiSAR personnel are collaborating with a map in each of these situations:
Same-place/same-time (example: command post) Different-place/same-time (example: communicating between command post and field) Same-place/different-time (example: transferring the management of a search) Different-place/different-time (example: remote support of SAR missions)
Final Thoughts * Do you have any comments on infrared cameras? Unmanned Aerial Vehicles? Is there anything else you thought we would talk about? What should we be researching in the SAR industry and in the academic context? Any final questions or comments? * Questions marked by an asterisk were asked of later participants, after the subject had been raised in previous interviews.
36 3.3 Qualitative Data Analysis
I followed tenets of qualitative data analysis to organize the interview
responses according to important concepts or themes related to the research questions
(Miles and Huberman 1994, Rubin and Rubin 1995). The interviews first were unitized,
or separated into phrases, by splitting the complete transcript into statements
representing a single experience or opinion. Codes representing concepts or themes
significant to the research then were applied to all statements that discussed mapping
technology in terms of current uses, limitations, advantages, or suggestions for
improvement. The codes used in this study are concept-driven as they are derived
from the relevant literature discussed in Chapter 2 and not primarily from the
transcripts themselves (Brinkman 2013).
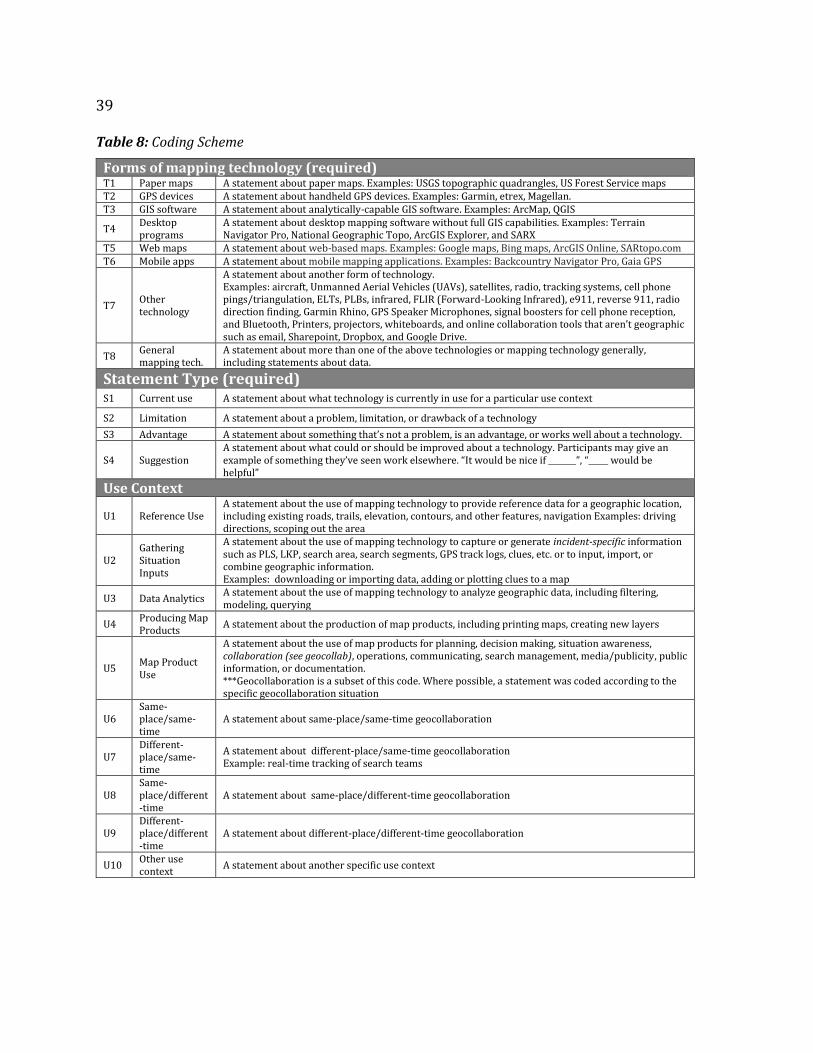
Table 8 lists and defines the complete list of 36 codes used for qualitative data
analysis in this study. This table also lists a short identifier used throughout this text to
refer to each code (e.g., the identifier for the paper maps code is T1). Codes fall into four
categories:
(1) forms of mapping technology, based on Pfau (2013) (See Table 2);
(2) statement types, or whether the statement pertained to a current use, a
limitation, an advantage, or a suggestion;
(3) use contexts, based on Tomaszewski (2015) (See Figure 2) and including the
geocollaborative situations from MacEachren (2003) (see Table 1);
(4) requirements, including both mapping functionality requirements and non-
functional considerations, which are mutually exclusive. Mapping
37
functionality codes are drawn from cartographic literature (see Figure 4),
and non-functional considerations codes are drawn from the literature on
emergency response and GIS (see Figure 6).
The first two code categories organize statements for comparison, the third relates to
Research Question #1, and the final category relates to Research Questions #2 and #3.
All transcript statements received a code relating to the first category (forms of
mapping technology; Category #1), enabling comparative discussion by form of
mapping technology. The second category (statement types; Category #2) also
facilitates comparison of statements, and dictated the application of codes in the latter
categories, as shown in Figure 7. Statements describing a current use required a code in
the use contexts category (Category #3) and did not receive any further codes. For
example, the statement “each of the primary search teams uses a GPS so we’re actually
creating a [record] of where that team searched” was coded: GPS devices (T2), current
use (S1), gathering situation inputs (U2). Statements either describing a problem or
limitation or, alternatively, identifying an issue as not being a problem or actually being
an advantage, could optionally have a use context code (Category #3), but needed to
include a requirements code (Category #4). For example, the statement “web maps are
a great tool; their only drawback is the connectivity” was coded: web maps (T5),
limitation (S2), connectivity (NFR5), and was not specific to a particular use context. The
following statement is specific to a particular use context: “just open Terrain Navigator
and you can quickly and easily print maps right out of there,” and was coded: desktop
mapping (T4), advantage (S3), producing map products (U4), usability (NFR7). Finally,
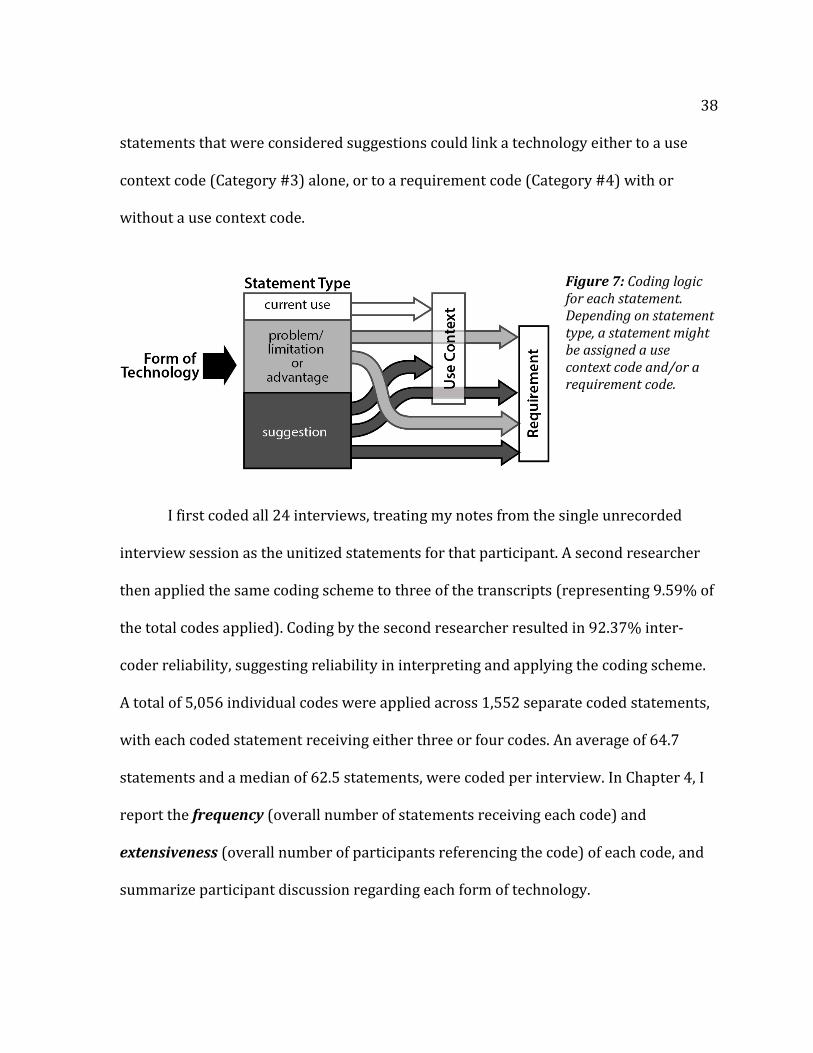
38 statements that were considered suggestions could link a technology either to a use
context code (Category #3) alone, or to a requirement code (Category #4) with or
without a use context code.
I first coded all 24 interviews, treating my notes from the single unrecorded
interview session as the unitized statements for that participant. A second researcher
then applied the same coding scheme to three of the transcripts (representing 9.59% of
the total codes applied). Coding by the second researcher resulted in 92.37% inter-
coder reliability, suggesting reliability in interpreting and applying the coding scheme.
A total of 5,056 individual codes were applied across 1,552 separate coded statements,
with each coded statement receiving either three or four codes. An average of 64.7
statements and a median of 62.5 statements, were coded per interview. In Chapter 4, I
report the frequency (overall number of statements receiving each code) and
extensiveness (overall number of participants referencing the code) of each code, and
summarize participant discussion regarding each form of technology.
Figure 7: Coding logic for each statement. Depending on statement type, a statement might be assigned a use context code and/or a requirement code.
39
Table 8: Coding Scheme
Forms of mapping technology (required) T1 Paper maps A statement about paper maps. Examples: USGS topographic quadrangles, US Forest Service maps T2 GPS devices A statement about handheld GPS devices. Examples: Garmin, etrex, Magellan. T3 GIS software A statement about analytically-capable GIS software. Examples: ArcMap, QGIS
T4 Desktop programs
A statement about desktop mapping software without full GIS capabilities. Examples: Terrain Navigator Pro, National Geographic Topo, ArcGIS Explorer, and SARX
T5 Web maps A statement about web-based maps. Examples: Google maps, Bing maps, ArcGIS Online, SARtopo.com T6 Mobile apps A statement about mobile mapping applications. Examples: Backcountry Navigator Pro, Gaia GPS
T7 Other technology
A statement about another form of technology. Examples: aircraft, Unmanned Aerial Vehicles (UAVs), satellites, radio, tracking systems, cell phone pings/triangulation, ELTs, PLBs, infrared, FLIR (Forward-Looking Infrared), e911, reverse 911, radio direction finding, Garmin Rhino, GPS Speaker Microphones, signal boosters for cell phone reception, and Bluetooth, Printers, projectors, whiteboards, and online collaboration tools that aren’t geographic such as email, Sharepoint, Dropbox, and Google Drive.
T8 General mapping tech.
A statement about more than one of the above technologies or mapping technology generally, including statements about data.
Statement Type (required) S1 Current use A statement about what technology is currently in use for a particular use context
S2 Limitation A statement about a problem, limitation, or drawback of a technology
S3 Advantage A statement about something that’s not a problem, is an advantage, or works well about a technology.
S4 Suggestion A statement about what could or should be improved about a technology. Participants may give an example of something they’ve seen work elsewhere. “It would be nice if _______”, “_____ would be helpful”
Use Context
U1 Reference Use A statement about the use of mapping technology to provide reference data for a geographic location, including existing roads, trails, elevation, contours, and other features, navigation Examples: driving directions, scoping out the area
U2 Gathering Situation Inputs
A statement about the use of mapping technology to capture or generate incident-specific information such as PLS, LKP, search area, search segments, GPS track logs, clues, etc. or to input, import, or combine geographic information. Examples: downloading or importing data, adding or plotting clues to a map
U3 Data Analytics A statement about the use of mapping technology to analyze geographic data, including filtering, modeling, querying
U4 Producing Map Products
A statement about the production of map products, including printing maps, creating new layers
U5 Map Product Use
A statement about the use of map products for planning, decision making, situation awareness, collaboration (see geocollab), operations, communicating, search management, media/publicity, public information, or documentation. ***Geocollaboration is a subset of this code. Where possible, a statement was coded according to the specific geocollaboration situation
U6 Same-place/same-time
A statement about same-place/same-time geocollaboration
U7 Different-place/same-time
A statement about different-place/same-time geocollaboration Example: real-time tracking of search teams
U8 Same-place/different-time
A statement about same-place/different-time geocollaboration
U9 Different-place/different-time
A statement about different-place/different-time geocollaboration
U10 Other use context
A statement about another specific use context
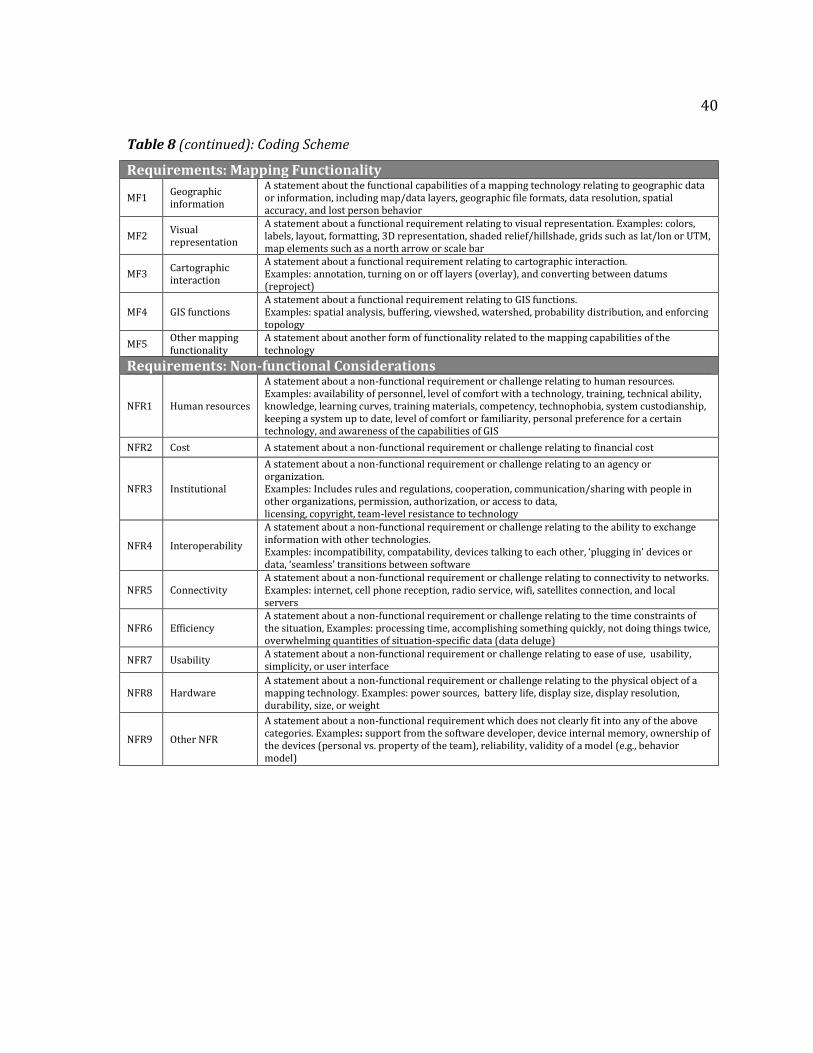
40
Table 8 (continued): Coding Scheme
Requirements: Mapping Functionality
MF1 Geographic information
A statement about the functional capabilities of a mapping technology relating to geographic data or information, including map/data layers, geographic file formats, data resolution, spatial accuracy, and lost person behavior
MF2 Visual representation
A statement about a functional requirement relating to visual representation. Examples: colors, labels, layout, formatting, 3D representation, shaded relief/hillshade, grids such as lat/lon or UTM, map elements such as a north arrow or scale bar
MF3 Cartographic interaction
A statement about a functional requirement relating to cartographic interaction. Examples: annotation, turning on or off layers (overlay), and converting between datums (reproject)
MF4 GIS functions A statement about a functional requirement relating to GIS functions. Examples: spatial analysis, buffering, viewshed, watershed, probability distribution, and enforcing topology
MF5 Other mapping functionality
A statement about another form of functionality related to the mapping capabilities of the technology
Requirements: Non-functional Considerations
NFR1 Human resources
A statement about a non-functional requirement or challenge relating to human resources. Examples: availability of personnel, level of comfort with a technology, training, technical ability, knowledge, learning curves, training materials, competency, technophobia, system custodianship, keeping a system up to date, level of comfort or familiarity, personal preference for a certain technology, and awareness of the capabilities of GIS
NFR2 Cost A statement about a non-functional requirement or challenge relating to financial cost
NFR3 Institutional
A statement about a non-functional requirement or challenge relating to an agency or organization. Examples: Includes rules and regulations, cooperation, communication/sharing with people in other organizations, permission, authorization, or access to data, licensing, copyright, team-level resistance to technology
NFR4 Interoperability
A statement about a non-functional requirement or challenge relating to the ability to exchange information with other technologies. Examples: incompatibility, compatability, devices talking to each other, ‘plugging in’ devices or data, ‘seamless’ transitions between software
NFR5 Connectivity A statement about a non-functional requirement or challenge relating to connectivity to networks. Examples: internet, cell phone reception, radio service, wifi, satellites connection, and local servers
NFR6 Efficiency A statement about a non-functional requirement or challenge relating to the time constraints of the situation, Examples: processing time, accomplishing something quickly, not doing things twice, overwhelming quantities of situation-specific data (data deluge)
NFR7 Usability A statement about a non-functional requirement or challenge relating to ease of use, usability, simplicity, or user interface
NFR8 Hardware A statement about a non-functional requirement or challenge relating to the physical object of a mapping technology. Examples: power sources, battery life, display size, display resolution, durability, size, or weight
NFR9 Other NFR
A statement about a non-functional requirement which does not clearly fit into any of the above categories. Examples: support from the software developer, device internal memory, ownership of the devices (personal vs. property of the team), reliability, validity of a model (e.g., behavior model)

41
Chapter 4: Results
Chapter 4 describes the results of the qualitative analysis applied to the
interviews. The chapter is organized into eight sections. The first six sections address
each of Pfau’s (2013) six forms of WiSAR mapping technology, with the seventh section
capturing discussion about other mapping technologies; the eighth section synthesizes
participant discussion that applies across technologies. In each section, I first
summarize how the given technology currently is used in support of WiSAR (Research
Question #1). I then enumerate the perceived advantages and limitations of the given
mapping technology (Research Questions #2 and #3), and include suggestions for
improving the technology and promoting adoption.
Table 9 lists the frequency, extensiveness, and percentage of all coded
statements corresponding to each of the 36 key codes described in Chapter 3. Figure 8
presents a Sankey diagram of code relations across the four categories. In the diagram,
dark rectangles are scaled according to each code’s frequency. A technology code was
applied to every coded statement. As shown in the final column of Table 9, the most
commonly applied technology code was general mapping technology (T8), representing
24.0% of all statements. The limitations (S2) code stands out as the most-applied code
in the statement type category. Codes in the final two categories—use context and
requirements—were not required for every statement (though every statement
required at least one or the other); for 42.8% of statements, use context was not
specified, and for 31.4% of coded statements, a requirements code was not applicable.
The most-discussed use context was gathering situation inputs (U2), followed by map
42 product use (U5) and reference use (U1). In the requirements category, one code in each
subset stood out as the most-discussed: geographic information (MF1) in the mapping
functionality subset, and human resources (NFR1) in the non-functional subset.
In Figure 8, the lighter, curved lines connecting the dark rectangles illustrate the
frequency of the combination of two codes that they connect. For instance, at the top of
the figure, there is a strong connection between general mapping technology (T8) and
problems or limitations (S2). The diagram also indicates a strong connection between
problems or limitations (S2) and the non-functional consideration human resources
(NFR1). This graphic does not indicate the frequency of full combinations of three or
four codes, and instead only illustrates the volume of connection between particular
pairs of key codes; an interactive version of the Sankey diagram enabling exploration
across all four categories of codes is available at:
http://cmrRose.github.io/Thesis/Sankey_allConnections.html. Codes applied to the
interviews represented 494 unique combinations across the four code categories,
instantiated from 3,856 possible combinations.
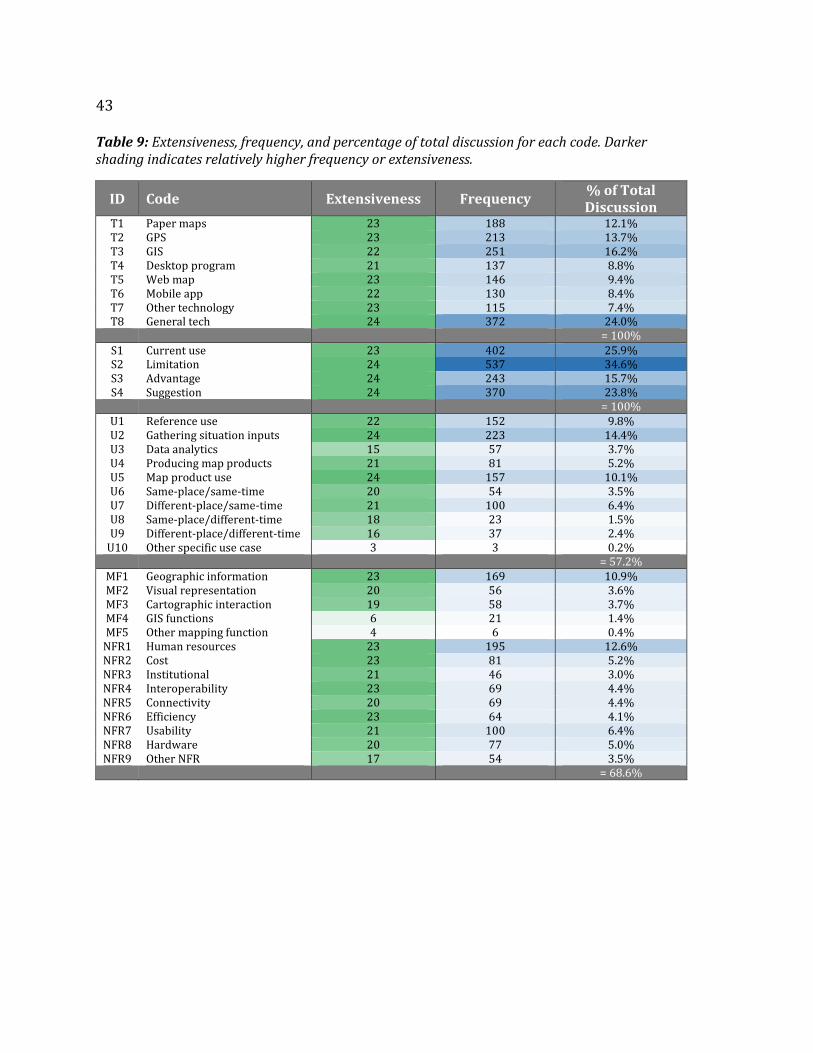
43
Table 9: Extensiveness, frequency, and percentage of total discussion for each code. Darker shading indicates relatively higher frequency or extensiveness.
ID Code Extensiveness Frequency % of Total Discussion
T1 Paper maps 23 188 12.1% T2 GPS 23 213 13.7% T3 GIS 22 251 16.2% T4 Desktop program 21 137 8.8% T5 Web map 23 146 9.4% T6 Mobile app 22 130 8.4% T7 Other technology 23 115 7.4% T8 General tech 24 372 24.0%
= 100% S1 Current use 23 402 25.9% S2 Limitation 24 537 34.6% S3 Advantage 24 243 15.7% S4 Suggestion 24 370 23.8%
= 100% U1 Reference use 22 152 9.8% U2 Gathering situation inputs 24 223 14.4% U3 Data analytics 15 57 3.7% U4 Producing map products 21 81 5.2% U5 Map product use 24 157 10.1% U6 Same-place/same-time 20 54 3.5% U7 Different-place/same-time 21 100 6.4% U8 Same-place/different-time 18 23 1.5% U9 Different-place/different-time 16 37 2.4%
U10 Other specific use case 3 3 0.2% = 57.2%
MF1 Geographic information 23 169 10.9% MF2 Visual representation 20 56 3.6% MF3 Cartographic interaction 19 58 3.7% MF4 GIS functions 6 21 1.4% MF5 Other mapping function 4 6 0.4%
NFR1 Human resources 23 195 12.6% NFR2 Cost 23 81 5.2% NFR3 Institutional 21 46 3.0% NFR4 Interoperability 23 69 4.4% NFR5 Connectivity 20 69 4.4% NFR6 Efficiency 23 64 4.1% NFR7 Usability 21 100 6.4% NFR8 Hardware 20 77 5.0% NFR9 Other NFR 17 54 3.5%
= 68.6%
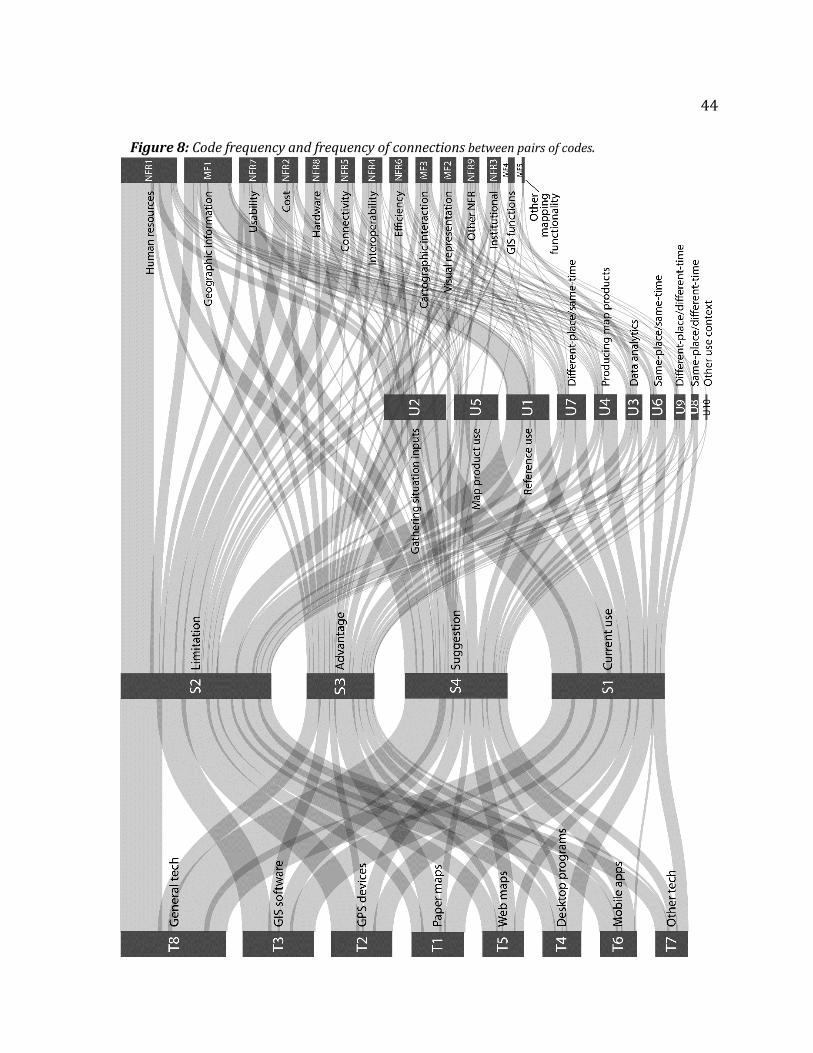
44 Figure 8: Code frequency and frequency of connections between pairs of codes.
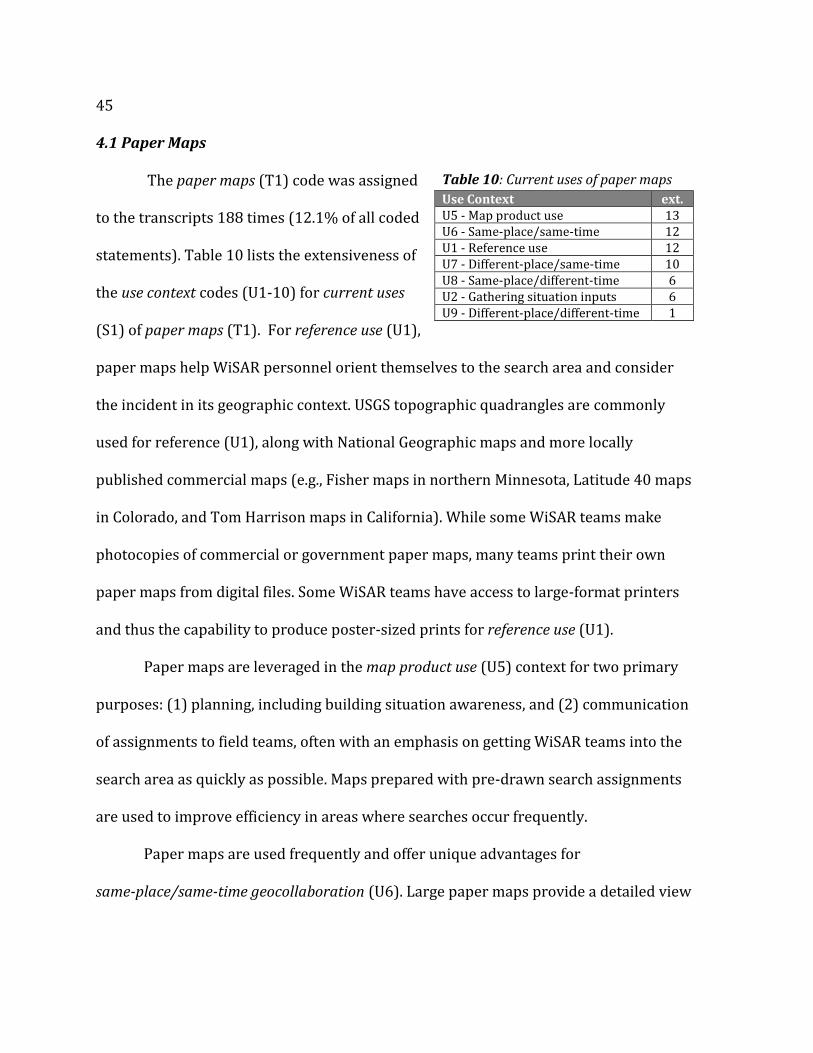
45
4.1 Paper Maps
The paper maps (T1) code was assigned
to the transcripts 188 times (12.1% of all coded
statements). Table 10 lists the extensiveness of
the use context codes (U1-10) for current uses
(S1) of paper maps (T1). For reference use (U1),
paper maps help WiSAR personnel orient themselves to the search area and consider
the incident in its geographic context. USGS topographic quadrangles are commonly
used for reference (U1), along with National Geographic maps and more locally
published commercial maps (e.g., Fisher maps in northern Minnesota, Latitude 40 maps
in Colorado, and Tom Harrison maps in California). While some WiSAR teams make
photocopies of commercial or government paper maps, many teams print their own
paper maps from digital files. Some WiSAR teams have access to large-format printers
and thus the capability to produce poster-sized prints for reference use (U1).
Paper maps are leveraged in the map product use (U5) context for two primary
purposes: (1) planning, including building situation awareness, and (2) communication
of assignments to field teams, often with an emphasis on getting WiSAR teams into the
search area as quickly as possible. Maps prepared with pre-drawn search assignments
are used to improve efficiency in areas where searches occur frequently.
Paper maps are used frequently and offer unique advantages for
same-place/same-time geocollaboration (U6). Large paper maps provide a detailed view
Table 10: Current uses of paper maps
Use Context ext. U5 - Map product use 13 U6 - Same-place/same-time 12 U1 - Reference use 12 U7 - Different-place/same-time 10 U8 - Same-place/different-time 6 U2 - Gathering situation inputs 6 U9 - Different-place/different-time 1
46 of a large search area, enabling WiSAR teams to build a common operating picture; as
one participant noted,
it’s about the only format you can really see a whole lot of the map, all at once. And you have the advantage of everybody looking at exactly the same thing, all non-verbals are picked up on, people can communicate at their best.
Participants also stated that annotation, or drawing and writing on paper maps (a form
of cartographic interaction; MF3), is common and helpful for same-place/same-time
(U6) geocollaboration. A second participant stated that a paper map is “incredibly
useful, it gets thoughts and collaboration going, so in my opinion there’s no better tool
than a large format map that people can gather around and talk to each other and mark
on.” A third participant discussed advantages to paper maps over electronic devices for
same-place/same-time (U6) geocollaboration, stating:
where somebody's sitting behind the computer driving and doing all that, the people observing are kind of at the mercy of what that person is doing. The paper map [allows] you to interact with the map at your own pace and not at somebody else's pace.
Thus, the nature of the paper medium itself may make paper maps better suited than
digital technology to facilitate distributed cognition.
For different-place/same-time (U7) geocollaboration, paper maps often are used
by field teams to communicate their location to the command post verbally over radio.
Location may be reported as coordinates or as a description, either with respect to
geographic features on the ground (e.g., ‘at the junction of trail Y and trail Z’) or in
reference to labels on a paper map (e.g., ‘at the e in River’). In the latter scenario, it is
important that spatially distributed collaborators have access to an identical visual
representation (MF2). For same-place/different-time (U8) geocollaboration, paper maps
47
were noted as part of the standard documentation for transfer of command in the
Incident Command System. Paper maps are used to gather situation inputs (U2) when
field teams annotate paper maps with clues and other significant landmarks.
Several advantages of paper maps make them a continuing staple of WiSAR
teams. Reliability (NFR9) was emphasized as an advantage of paper maps by many
participants. One participant stated: “We can always come back to that no matter what;
it works.” Many participants also cited the importance of being independent from
power sources in the field, a hardware consideration (NFR8). As a second participant
emphasized, “They’re reliable, they’re portable, they don’t run out of electricity, they’re
not subject to electronic failure.” Some participants also stated that paper maps were
relatively inexpensive (NFR2) and easy to use (NFR7), or that inexperienced users
could be taught to use them quickly (NFR1).
Certain aspects of paper maps presented problems for some participants, while
other participants already had solutions in place to avoid these disadvantages. Some
participants listed the print quality and readability (issues with visual representation;
MF2) or durability of material (a hardware consideration; NFR8) as disadvantages of
paper maps, while others indicated that they do not encounter such problems. One
participant suggested that paper maps could be improved by allowing erasable
annotation (MF3), wanting “maps you could draw on and more easily erase…like a
whiteboard.” However, other participants stated that they already use laminated maps
to support annotation, with one participant critiquing dry-erase markings as being too
easily erased or overwritten. Regarding considerations for human resources (NFR1),
48 four participants noted a lack of expertise with paper maps among volunteers, but six
participants reported greater familiarity or preference for paper maps over other forms
of mapping technology.
The most commonly-cited problems with paper maps related to their static
nature. The currency of the geographic information (MF1) was a frequent complaint, as
trails, roads, and even terrain could change in the years since a paper map had been
published. Participants reported challenges in maintaining a physical collection of
maps, such as storage space, finite quantities of maps (limitations of the physical form,
or hardware; NFR8), and the human resources (NFR1) needed to keep a map collection
up-to-date. Another participant emphasized the dynamic nature of a search, stating,
“the moment you print [a paper map], it becomes outdated,” suggesting a demand for
more a more dynamic form of mapping technology.
To some participants, paper maps offered a limited picture of the geography
when compared to the wide variety of available geographic information (MF1) layers
available digitally. For instance, several participants mentioned problems with the
newest editions of USGS topographic maps eliminating features that were previously
shown, such as built structures and other infrastructure. As one participant stated:
“now power lines and pipelines and things we really need in SAR have magically
disappeared off the map.” Providing multiple sets of custom-printed maps, including
aerial imagery, was a solution used by one participant and suggested by others.
The static paper map form also results in a limited capacity for cartographic
interaction (MF3). As a participant stated, “One of the advantages of the digital world is
49
being able to turn layers on and off. You can't do that very well on the paper map.” No
data analytics (U3) are directly available in the paper format, and information transfer,
or interoperability (NFR4), with digital technology (e.g., manual digitization, scanning,
etc.) is limited. Manual methods of overlay (e.g., transparencies) (a simple form of data
analytics; U3) and paper map annotation (e.g., drawing or writing)—which are both
cartographic interactions (MF3)—are limited in terms of precision and encounter
scaling issues as increasing incident information clutters the maps. Finally, one
participant indicated that paper was a poor method of documentation (an example of
the map product use context; U5) as a single definitive paper copy posed a risk of
becoming lost.
Suggestions for the improvement of paper maps primarily coincided with the
map content (MF1-2). Participants suggested that paper maps could be improved by
more up-to-date, more detailed, or more accurate geographic information (MF1). While
some participants suggested that paper maps should simply depict more geographic
information—with one saying, “show more data” and another claiming, “more
information on the maps is always better”—a third participant preferred that paper
maps be more selective, stating “the thing that comes to my mind is clarity, that
sometimes you'd like to get rid of some layers.” In terms of visual representation (MF2),
the inclusion or improvement of graticule and scale bar map elements was
recommended.
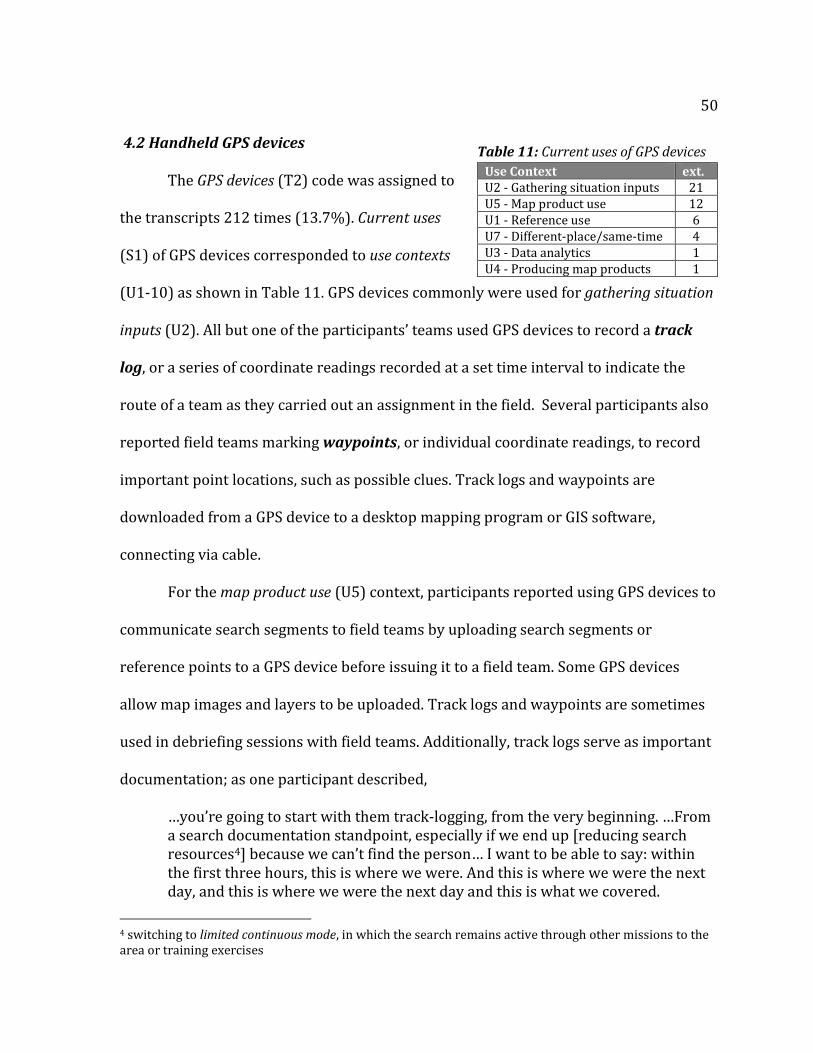
50 4.2 Handheld GPS devices
The GPS devices (T2) code was assigned to
the transcripts 212 times (13.7%). Current uses
(S1) of GPS devices corresponded to use contexts
(U1-10) as shown in Table 11. GPS devices commonly were used for gathering situation
inputs (U2). All but one of the participants’ teams used GPS devices to record a track
log, or a series of coordinate readings recorded at a set time interval to indicate the
route of a team as they carried out an assignment in the field. Several participants also
reported field teams marking waypoints, or individual coordinate readings, to record
important point locations, such as possible clues. Track logs and waypoints are
downloaded from a GPS device to a desktop mapping program or GIS software,
connecting via cable.
For the map product use (U5) context, participants reported using GPS devices to
communicate search segments to field teams by uploading search segments or
reference points to a GPS device before issuing it to a field team. Some GPS devices
allow map images and layers to be uploaded. Track logs and waypoints are sometimes
used in debriefing sessions with field teams. Additionally, track logs serve as important
documentation; as one participant described,
…you’re going to start with them track-logging, from the very beginning. …From a search documentation standpoint, especially if we end up [reducing search resources4] because we can’t find the person… I want to be able to say: within the first three hours, this is where we were. And this is where we were the next day, and this is where we were the next day and this is what we covered.
4 switching to limited continuous mode, in which the search remains active through other missions to the area or training exercises
Table 11: Current uses of GPS devices
Use Context ext. U2 - Gathering situation inputs 21 U5 - Map product use 12 U1 - Reference use 6 U7 - Different-place/same-time 4 U3 - Data analytics 1 U4 - Producing map products 1
51
For reference use (U1), GPS devices allow searchers in the field to orient themselves and
become familiar with the search area, to navigate, and to determine their coordinate
location. For different-place/same-time (U7) geocollaboration, searchers in the field
reference GPS devices to determine their coordinate location and subsequently report
the coordinates verbally to the command post through radio communication.
One generally agreed-upon advantage of GPS devices was their durability, an
important hardware (NFR8) consideration also raised with paper maps. As one
participant stated “GPSs were manufactured to be rugged from the start. They’re
intended to be used outside and dropped and beat around.” Although the need for
batteries was seen as a drawback in comparison to paper maps, the ability to replace
GPS batteries (normally standard AA) was seen as an advantage over mobile devices
(T6) with integrated batteries. Participants also noted that GPS devices had small
screens and poor display resolution compared to mobile devices (T6)—both hardware
(NFR8) limitations. The positional accuracy of geographic information (MF1) collected
from GPS devices was called into question by some participants, but most found GPS
information accurate enough for the needs of search, provided that the GPS could
connect with satellites. Some participants encountered problems with losing satellite
signal (a connectivity issue; NFR5) either in isolated areas or for short periods of time.
A field team member must be able to accomplish three basic tasks with the GPS
interface: (1) clearing a track log (so that it does not record coordinates while searchers
are in transit to and from their assignment), (2) creating a waypoint if needed, and (3)
setting the coordinate system and datum. Problems with messy track logs and data
52 collected in the wrong coordinate system or datum were attributed to training issues (a
human resources consideration; NFR1). Some participants emphasized the need for
clear instruction during briefings to ensure that all search personnel used a consistent
datum and coordinate system, and one mentioned the use of a brief ‘cheat sheet’
document to improve GPS data consistency.
Many participants had encountered problems with the interoperability (NFR4) of
GPS devices, most commonly with the issue of missing the appropriate cable to connect
certain GPS devices to a computer. This issue often pertained to older models of GPS
devices, with one participating stating:
We still have some people who have the older [GPS devices] that require serial cables and we struggle a little bit with those … that's getting to be less and less, but there was a time where it was a real struggle to keep enough cables.
Although the interoperability of GPS devices is becoming less of a problem, the issue
still is encountered frequently. WiSAR teams had different strategies for mitigating this
problem, including stocking as many different GPS cables as possible or requiring every
searcher to bring a cable for their individual GPS device. Some teams resolve such
interoperability (NFR4) issues by providing or requiring particular models of GPS;
however, other teams have little control over which devices are used when receiving
support from other search organizations.
Participants reported problems to varying degrees with the inefficiency (NFR6)
of downloading track logs from GPS devices, ranging from “Sometimes a bit of delay
[occurs] when you have a bunch of teams coming in at the end of the day” to “the
downloading is a big bottleneck that we currently have.” Efficiency of downloads also
53
depended on the availability of someone familiar with the procedure, a human resources
(NF1) limitation.
Three participants stated that GPS devices were user-friendly (NFR7), but six
participants found GPS interfaces unintuitive or suggested that GPS interfaces could be
improved. Three participants specifically mentioned the difficulty of entering
information associated with waypoints. As one participant phrased it, “I don’t know if
you’ve ever tried to enter character strings into a GPS, but it’s a real pain in the neck.”
Specific suggestions for improving GPS user interfaces included making waypoint entry
easier, including a prompt to remind users to clear the track log, and making the
interface simpler.
Other suggested improvements for GPS included hardware factors (NFR8):
larger screens, lighter weight, and longer battery life. Suggestions related to geographic
information (MF1) included improving accuracy and including additional basemap
information with the devices. One suggestion was made that a person be designated to
handle GPS and reduce the workload for a GIS specialist.
Mirroring discussion about current limitations of GPS devices for WiSAR, many
of the suggestions for improving GPS devices related to uploading or downloading and
interoperability (NFR4). Some participants suggested making downloads from GPS
faster and easier, and two participants suggested that a wireless download method
could improve efficiency (NFR6). Another participant proposed a method of pre-
configuring the datum, coordinate system, and track log settings, asking for “an
application where you plug the GPS into the computer and you hit a button and the GPS
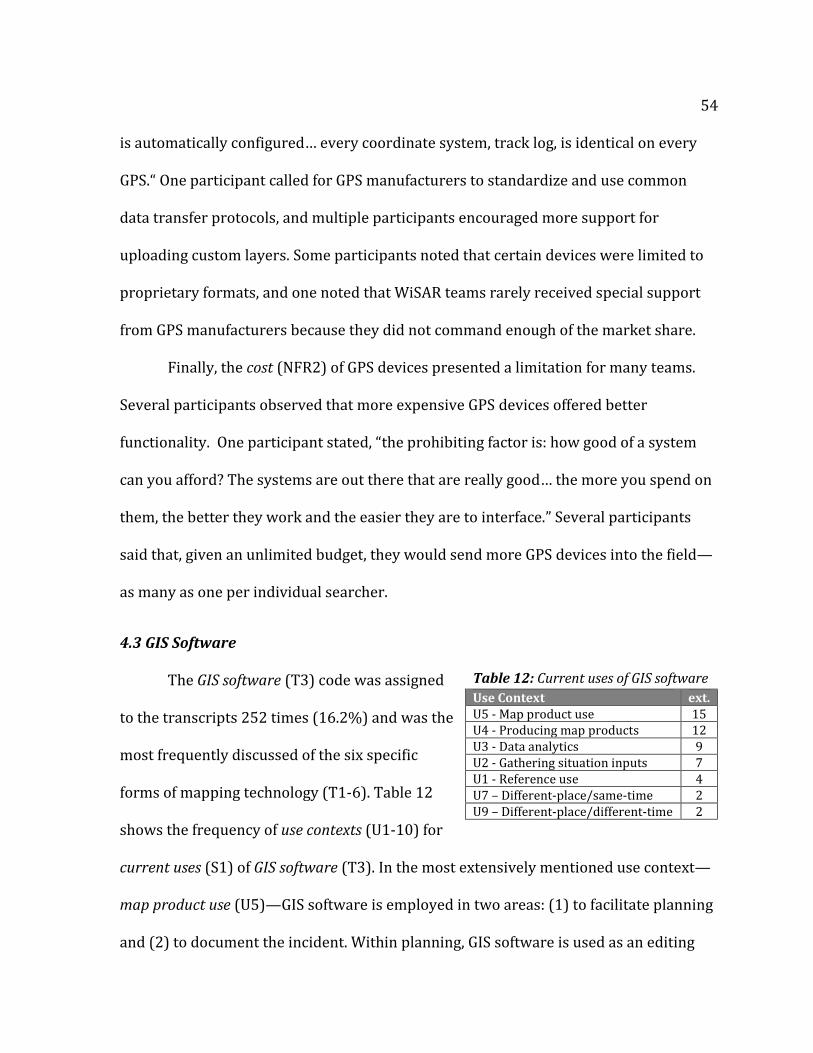
54 is automatically configured… every coordinate system, track log, is identical on every
GPS.“ One participant called for GPS manufacturers to standardize and use common
data transfer protocols, and multiple participants encouraged more support for
uploading custom layers. Some participants noted that certain devices were limited to
proprietary formats, and one noted that WiSAR teams rarely received special support
from GPS manufacturers because they did not command enough of the market share.
Finally, the cost (NFR2) of GPS devices presented a limitation for many teams.
Several participants observed that more expensive GPS devices offered better
functionality. One participant stated, “the prohibiting factor is: how good of a system
can you afford? The systems are out there that are really good… the more you spend on
them, the better they work and the easier they are to interface.” Several participants
said that, given an unlimited budget, they would send more GPS devices into the field—
as many as one per individual searcher.
4.3 GIS Software
The GIS software (T3) code was assigned
to the transcripts 252 times (16.2%) and was the
most frequently discussed of the six specific
forms of mapping technology (T1-6). Table 12
shows the frequency of use contexts (U1-10) for
current uses (S1) of GIS software (T3). In the most extensively mentioned use context—
map product use (U5)—GIS software is employed in two areas: (1) to facilitate planning
and (2) to document the incident. Within planning, GIS software is used as an editing
Table 12: Current uses of GIS software
Use Context ext. U5 - Map product use 15 U4 - Producing map products 12 U3 - Data analytics 9 U2 - Gathering situation inputs 7 U1 - Reference use 4 U7 – Different-place/same-time 2 U9 – Different-place/different-time 2
55
interface to create search segments or as an information management system to
organize both geographic and non-geographic incident information. GIS is used to
organize geographic incident information including track logs, clues, witness
statements, hazards, and assignments, which facilitate planning by: (1) helping to
estimate the searchers’ degree of coverage, or the thoroughness with which completed
assignments had been searched, (2) drawing attention to areas that had not yet been
searched, and (3) allowing queries of incident data by location. As one participant
described:
you may be reporting about… activity done in a segment in operational period one, and then in the same segment have activity in operational period three or four…through GIS we can relate all that activity together to help us understand everything that's going on in that particular region.
Non-geographic incident information also could be integrated with the geographic
information, such as search team member sign-in and reporting party information.
Documentation (a component of map product use; U5) using GIS was considered
important for after-incident review and record-keeping. GIS-based documentation can
enable follow-up efforts in unresolved searches. One participant described the use of
GIS software as a record of local search history:
because [a long search] happens so rarely in the lifetime of a searcher or an agency, how do you capture something that happens [only] every ten years or so but may recur because the terrain hasn’t changed? …That’s another use for GIS: capturing the long-term geospatial memory of your people and the history of your searches.
Documentation using GIS also proved valuable in illustrating the efforts of the search
team to the families of lost subjects and to news media, and in highlighting the
professionalism of the search organization.
56 For reference use (U1), GIS offered access to the greatest selection of base data.
This base data often was leveraged to produce map products (U3). Printing paper maps
from GIS software allows WiSAR teams to incorporate relevant base layers and
incident-specific data as well as customize the visual representation (MF2). GIS could
offer the greatest degree of control over the content and layout of a map. One
participant emphasized the value of map customization for WiSAR, describing an
experience as a GIS specialist for WiSAR:
You could see people come to the realization that I could get them a customized map … People would start coming in and asking for a specific thing… changing the maps to more closely represent what’s going on in the search. The whole point of that is to allow the overhead team to visualize what’s happening on the ground. You can make the maps fancier or less fancy depending on what you want to represent.
Several participants had used GIS to print assignment-specific maps for field teams, and
some had produced maps for briefings or for pre-planning. GIS software also was used
to prepare files for upload to a GPS device.
In the data analytics (U3) context, cartographic interaction (MF3) had been
leveraged in GIS to overlay and filter incident data and to narrow search areas based on
GIS functions (MF4) by assessing cell phone coverage, terrain barriers to travel, and
simple ring models of the distance a subject could have traveled. Analysis of elevation
data was used in at least five ways: (1) to create search segments, (2) to assess the
difficulty of traversing areas for field teams, (3) to identify areas of avalanche risk for
searcher safety, (4) to optimize placement of radio repeaters, which extends the area of
coverage for radio communications, and (5) to evaluate wind patterns for air-scent
canine teams. Data analytics in GIS software also had been used to estimate the
57
probability of detection (POD) for completed search assignments based on track logs
collected from field teams.
Participants reported using GIS to gather situation inputs (U2) by downloading
track logs and collecting other incident data. In this use context, GIS software helps to
ensure that nothing ‘falls through the cracks.’ Participants noted that GIS offers an
advantage where systems of paper debrief forms had failed. One participant
remembered a clue on a paper form becoming “buried” and “never followed up on;” in
retrospect, it was found that the forgotten slip of paper might have ended the search
earlier. A second participant described the unreliability of annotating paper maps with
sticky (or post-it) notes, stating:
[GIS] gets around the problem of somebody put a sticky up on the map on the wall and the sticky blew down and was found on the floor. Now where does the sticky go? …There have been searches where a significant sticky has fallen to the floor.
The ability to collect all situation inputs in one place, organize them geographically, and
subsequently categorize, filter, and turn on or off layers (overlay) using cartographic
interaction (MF3) enabled better search management. Participants noted that GIS
software becomes more important for handling situation inputs as an incident extends
beyond the first or second day.
Nearly all discussion (86/90 of the coded statements) regarding the limitations
(S2) of GIS software (T3) corresponded to non-functional considerations (NFR1-9).
While some participants noted that GIS software can be expensive (NFR2), participants
from three separate search teams stated that the Esri Nonprofit Organization Program
provided a significantly reduced cost license of ArcGIS. Regarding efficiency (NFR6) of
58 GIS to support initial actions, one participant asserted that GIS could be deployed
quickly, stating that “after the computer's booted up basically within ten minutes we've
had five or six tasks written up and printed that are then ready to go into the field.”
However, another participant stated that GIS did not always produce map products
quickly enough for the very first field teams, commenting that “after the initial
assignments are out there, then MapSAR pretty much runs the show. Because it does
take a while to put [incident data] into the GIS software.” For many WiSAR teams, the
timing of deploying GIS depended on the availability of personnel with GIS experience,
again pointing to a bottleneck related to human resources (NFR1).
Many participants described GIS software as complicated, difficult to use, or not
user-friendly (NFR7). Several participants noted that GIS software takes a significant
investment of time and effort to learn, an investment that may not be possible for many
WiSAR team members. Participants noted that both WiSAR volunteers and non-
volunteer park rangers in the National Park Service are busy with many other
obligations and need to invest their time in maintaining other search-related
certifications, such as first aid. Search organizations that use GIS software tend to rely
on specific people with the expertise to use it (NFR1). In the absence of a trained
specialist, teams employed alternative mapping technologies, which leads to efficiency
(NFR6) problems when transitioning to a GIS later. Further, despite training directed at
WiSAR team members, some of those without a GIS background from their profession
or education may choose not to use GIS software, even when available, due to a lack of
confidence. One participant stated, “when push comes to shove, it’s really only
59
somebody who has it in their background who has the confidence to do it in the middle
of a mission.” Finally, participants noted that some WiSAR personnel were either
disinterested in committing the time or intimidated by the perceived difficulty of
learning the software (NFR1).
Participants acknowledged the possibility of seeking GIS specialists to aid in
WiSAR, but that the GIS specialist would require training in search to be useful to the
team. One participant stated, “I’ve got one person I’ve been training and she’s a GIS
tech… It’s taking her a bit of time to understand how we do things in search and rescue
rather than a city work environment.” Some participants noted a recent program in
which members of the GISCorps, a volunteer organization for GIS professionals, were
trained to volunteer in WiSAR. Referring to the GISCorps volunteers, another
participant explained the crucial approach that GIS specialists need to adopt:
They’re not searchers and there’s just that piece that they’re missing. When we say, ‘there’s [a search] going on, we need somebody out here to get this thing going’…[they respond,] ’well okay, let me finish what I’m doing out here at work’ …they just don’t get the concept of, ‘we’ve got to get out there’ or the concept of ‘we have hundreds of people coming in tomorrow morning, so we need to have everything ready at six a.m.’ ...that’s the training issue.
The GISCorps effort was in its first year of implementation, and SAR-trained GISCorps
volunteers had not yet been deployed to help on any WiSAR searches. The project may
require more buy-in from WiSAR teams; as one participant pointed out, even seasoned
WiSAR specialists trying to incorporate GIS into WiSAR are sometimes met with
skepticism and resistance.
There was controversy among participants over the validity or usefulness of
modeling lost person behavior or subject mobility using GIS software (leveraging GIS
60 functions; MF4 ). I identified four different positions that participants articulated on the
issue. Some participants (Position #1) were using GIS software to generate heat maps
of probability of area (POA) based on ISRID data collected in a similar ecoregion and
terrain. There then were participants (Position #2) who felt that POA modeling could
be useful, but that only local lost person behavior data should be considered relevant.
Many participants called for more local lost person behavior data collection and
analysis.
Some participants felt that the behavior of past subjects had no relevance in a
new search and objected to POA modeling. Of these, some participants (Position #3) did
believe that the terrain imposed predictable (i.e., model-able) physical limits to travel;
as one participant said:
The actions they took were not going to apply to anybody but them. People are so different… I lean more towards terrain analysis rather than prior victim subject behavior because the terrain isn’t going to change. There are just certain things people cannot do in certain terrain and that’s what you have to work with. So I like the models that are coming out for distance and travel costs… but to try and take what people have done before and use that to predict what people will do again is very difficult.
Finally, another critic (Position #4) felt that too many situation-specific factors affect
the behavior and movement of a subject and thus too many assumptions are made in
modeling both POA and subject mobility. This participant also worried that critical
search management decisions would be made based on these limited models:
there are too many human variables involved in that. If you have an inexperienced search manager and the computer says, ‘Go look over here,’ they're going to because the computer said to, not because of any other input.”

61
When discussing whether such models remove some of the judgment in search
management, a proponent of statistical behavior modeling argued that models offer a
valuable alternative perspective on the situation, stating that “It moves closer to
preventing bias, personal bias and team bias … by considering the evidence more
holistically than just based on personal opinion.” This participant went on to explain
that ISRID statistics are just one of many factors that contribute to a suggestion—not a
prediction—to help establish priority areas to direct search resources. A fourth
participant felt that POA models could supplement, rather than supplant, judgments,
stating:
I think anybody who has experience is going to use their own experience anyhow and look at what the computer suggests…and [say] ‘well, that [suggested segment is] nice, that one’s okay, that one’s silly and then one got left out so I will just add that myself.’ But after watching what new people who have no experience sometimes come up with… they need all the help they can get. Critics of POA and mobility models (Position #4) still felt that GIS could offer
valuable data analytics (U3) by providing objective spatial analysis through GIS
functions (MF4) such as viewshed, slope, and aspect. One participant stated, “a
viewshed is an analytical tool driven by data, not by any supposition,” Another
participant advised that any data analytics (U3), even those based solely on terrain, are
limited by assumptions and by the underlying data. Using the example of a radio
coverage map approximated by simple viewsheds5 from radio repeater locations, this
participant stated, “It doesn’t tell us for real what happens in the field… if you don’t
5 Radio coverage is more complex than line-of-sight; a viewshed is not a precise model of radio wave propagation.
62 realize it’s a model and not fact, then you run into problems.” This participant and
others emphasized the importance of understanding the uncertainty and assumptions
of all geographic information (MF1).
As with the discussion on limitations, suggestions for improving GIS software
also pertained primarily to non-functional considerations (NFR1-9). Many participants
suggested making GIS software easier to use, simpler, or more intuitive (NFR7), while
retaining its analytical capability. One participant suggested an interface tailored to
automatically suggest search segments based on a probability model; other participants
objected to the use of probability models or automated planning suggestions.
Many suggestions pertained to personnel knowledge or expertise (NFR1).
Awareness of GIS capabilities is one of the first hurdles to adopting GIS software in
WiSAR. One participant described a search manager’s unfamiliarity with GIS, stating
“She didn’t know enough to understand how you could use GIS. She just understood it
to mean literally making a map, basically copying a USGS map into a poster size,” This
participant went on to say that practical examples are the best way to facilitate
adoption, continuing “you’ve got to demonstrate this stuff. You can talk about it all you
want, but you’ve got to show folks who aren’t technically-oriented how it’s useful.”
Some participants believed that more training in GIS is needed across WiSAR
teams (NFR1). Some participants articulated a need for more availability of trained GIS
experts (NFR1). Other participants emphasized that training also is needed in basic
geographic concepts, such as coordinate systems. One participant called for recognition
of the need for fundamentals, stating that “I think the disconnect is…from the highly
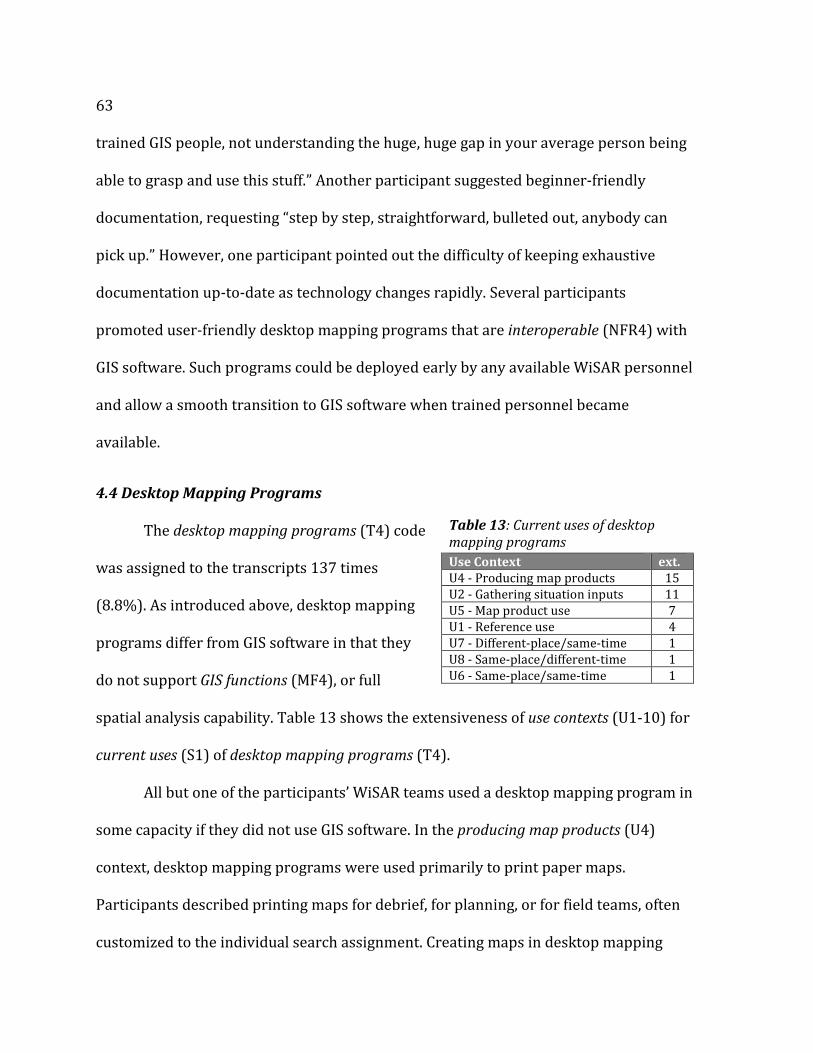
63
trained GIS people, not understanding the huge, huge gap in your average person being
able to grasp and use this stuff.” Another participant suggested beginner-friendly
documentation, requesting “step by step, straightforward, bulleted out, anybody can
pick up.” However, one participant pointed out the difficulty of keeping exhaustive
documentation up-to-date as technology changes rapidly. Several participants
promoted user-friendly desktop mapping programs that are interoperable (NFR4) with
GIS software. Such programs could be deployed early by any available WiSAR personnel
and allow a smooth transition to GIS software when trained personnel became
available.
4.4 Desktop Mapping Programs
The desktop mapping programs (T4) code
was assigned to the transcripts 137 times
(8.8%). As introduced above, desktop mapping
programs differ from GIS software in that they
do not support GIS functions (MF4), or full
spatial analysis capability. Table 13 shows the extensiveness of use contexts (U1-10) for
current uses (S1) of desktop mapping programs (T4).
All but one of the participants’ WiSAR teams used a desktop mapping program in
some capacity if they did not use GIS software. In the producing map products (U4)
context, desktop mapping programs were used primarily to print paper maps.
Participants described printing maps for debrief, for planning, or for field teams, often
customized to the individual search assignment. Creating maps in desktop mapping
Table 13: Current uses of desktop mapping programs
Use Context ext. U4 - Producing map products 15 U2 - Gathering situation inputs 11 U5 - Map product use 7 U1 - Reference use 4 U7 - Different-place/same-time 1 U8 - Same-place/different-time 1 U6 - Same-place/same-time 1

64 programs was described as quick and easy (NFR6,7); as one participant put it, “that
software does an excellent job at what it was intended to do, which is typically produce
a map for you.”
When gathering situation inputs (U2), desktop mapping programs were most
frequently used to download track logs from GPS devices. While some participants
noted that this process was efficient (NFR6) and easy (NFR7), others found that the
efficiency (NFR6) could be overwhelmed by data volume. Desktop mapping programs
also were used to record clues and field team locations reported verbally by radio. In
the map product use (U5) context, desktop mapping applications were leveraged to
organize incident-specific information (e.g., track logs, waypoints, clues, and segments)
and for planning, including drawing search segments. They sometimes were used for
general reference (U1) of the terrain.
Desktop mapping programs encompass several different programs, each with
different functionality and intended purpose. Lacking the GIS functions which define
GIS software, desktop mapping programs rely on cartographic interaction (MF3) for on-
the-fly map interpretation, including overlay, filter, calculate distance, and edit (used to
draw segments). However, many participants found the implementation of these
interaction operators limited, indicating that certain programs could not efficiently
overlay, filter, or reproject the map, and some programs had frustratingly limited ability
to edit features (e.g., polygons during the process of drawing segments). Some
participants noted that certain desktop mapping programs are limited to built-in
basemaps, which impacts the available geographic information (MF1) in that program

65
and on any paper maps printed from it. Regarding interoperability (NFR4), some
desktop programs can readily exchange files with GIS software, while others cannot.
Good usability (NFR7) and familiarity among WiSAR teams (NFR1) were noted
as benefits of desktop mapping programs, but programs that offer more mapping
functionality (MF1-5) were noted as more difficult to use (NFR7). Unlike GIS software,
participants did not associate any special training prerequisite with proficiency in
desktop mapping programs. However, participants still correlated expertise with time
spent using the programs; as one participant stated, “your ability to use this software is
a function of how much you personally use it.” Another participant observed that “it’s a
perishable skill, if you’re not operating it on an ongoing basis, it’s almost like you have
to relearn it again when a search comes up.” Participants reported that cost (NFR2) was
a limiting factor for WiSAR teams to access certain programs and that cost could also
impact expertise:, noting that “they might be able to afford one copy [of a desktop
program], [but] not enough for everybody to play with, in which case it becomes less
useful because nobody has experience with it.”
There was little consistency among suggestions (S4) for desktop mapping
programs. Like paper maps, two participants suggested that SAR-specific needs for
visual representation (MF2) could be better met through inclusion of ICS symbology or
more readily available map elements (graticule, legend, etc.). One participant proposed
extending desktop program functionality to GIS functions (MF4); however, another
participant objected:
I have seen people try to push the limits on some of the desktop software and I find it’s just not the way to go... only real GIS software can handle many models.
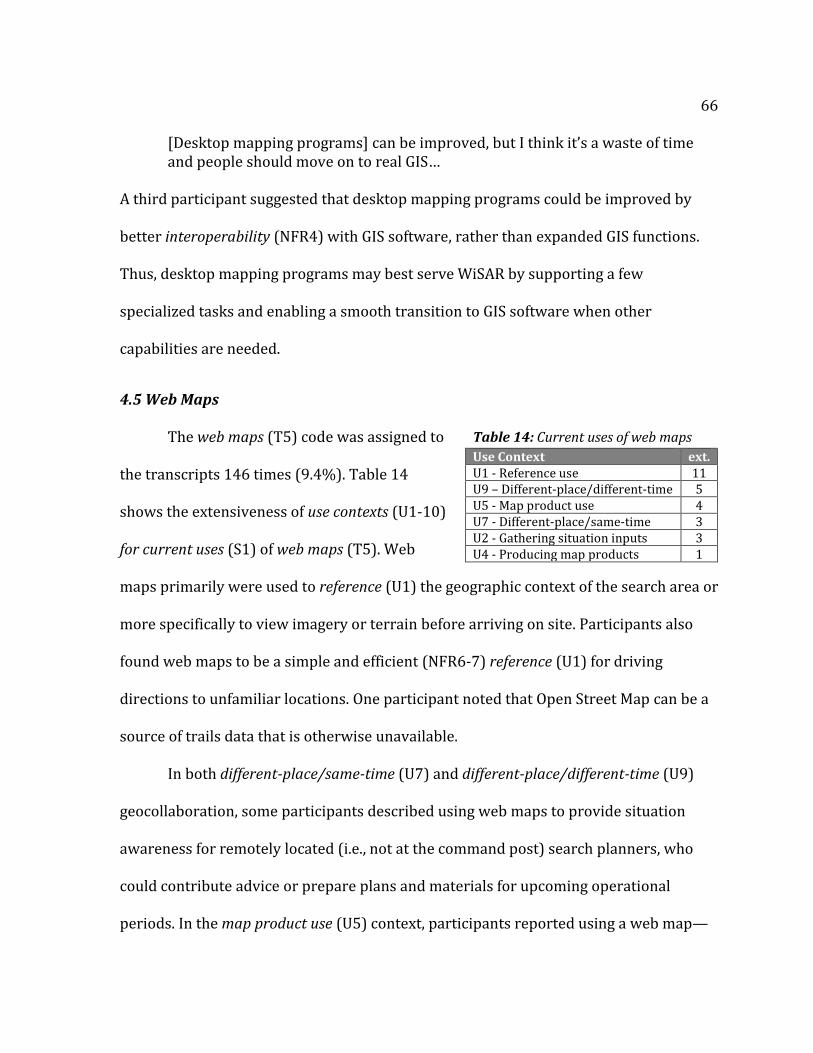
66
[Desktop mapping programs] can be improved, but I think it’s a waste of time and people should move on to real GIS…
A third participant suggested that desktop mapping programs could be improved by
better interoperability (NFR4) with GIS software, rather than expanded GIS functions.
Thus, desktop mapping programs may best serve WiSAR by supporting a few
specialized tasks and enabling a smooth transition to GIS software when other
capabilities are needed.
4.5 Web Maps
The web maps (T5) code was assigned to
the transcripts 146 times (9.4%). Table 14
shows the extensiveness of use contexts (U1-10)
for current uses (S1) of web maps (T5). Web
maps primarily were used to reference (U1) the geographic context of the search area or
more specifically to view imagery or terrain before arriving on site. Participants also
found web maps to be a simple and efficient (NFR6-7) reference (U1) for driving
directions to unfamiliar locations. One participant noted that Open Street Map can be a
source of trails data that is otherwise unavailable.
In both different-place/same-time (U7) and different-place/different-time (U9)
geocollaboration, some participants described using web maps to provide situation
awareness for remotely located (i.e., not at the command post) search planners, who
could contribute advice or prepare plans and materials for upcoming operational
periods. In the map product use (U5) context, participants reported using a web map—
Table 14: Current uses of web maps
Use Context ext. U1 - Reference use 11 U9 – Different-place/different-time 5 U5 - Map product use 4 U7 - Different-place/same-time 3 U2 - Gathering situation inputs 3 U4 - Producing map products 1
67
usually Google Earth— to view terrain at oblique angles for planning. For instance,
oblique views supported estimation of avalanche hazards in areas with heavy snow
pack and steep terrain. Oblique views of the terrain also allowed search planners to
approximate the subject’s perspective as they moved through the landscape, helping to
suggest possible decisions and scenarios leading to the subject’s disappearance. Web
maps also were used during meetings or training (U5) to give an overview of a past
incident.
The crucial limitation of web maps was a lack of internet connectivity (NFR5) at
the location of WiSAR operations, frequently even at the command post. During a
WiSAR search, the command post might not be housed in a building, with WiSAR teams
instead using a specially-equipped vehicle. Further, many participants noted inaccuracy
in the geographic information (MF1) of web maps, including a lack of detail or
occasionally completely incorrect features. Other problems with mapping functionality
in web maps included: (1) a limited ability to edit features and to encode attributes and
relationships in the data (MF3), (2) limited support for different coordinate systems
and projections (MF3), and (3) a frustration with labels being omitted at certain scales
(MF2). Though often described as easy and user-friendly (NFR7), web maps sometimes
required expertise (NFR1), especially in transferring data from or to another mapping
technology. Participants mentioned cloud-based incident management systems,
including D4H and Mission Manager, which were noted as expensive (NFR2) and not
widely used due to lack of connectivity (NFR5).
68 One advantage of web maps is the ability to access the same map from multiple
computers, facilitating collaboration. One SAR-specific web mapping tool—
SARTopo.com—allows edits simultaneously for same-time (U6, U8) geocollaboration. If
internet access could be improved (NFR5), participants suggested using web maps for
different-place (U7,9) geocollaboration.
A recent effort by the Mountain Rescue Association (MRA) is just beginning to
show the benefits of web mapping for data collection (U5). Annual reports of search
incidents from MRA member organizations are now submitted through a web-based
form with embedded map input—Esri’s GeoForm. Each form updates a web map
displaying the results of the survey across all MRA teams. One participant noted that
collecting location information is a step in the right direction:
Until the Esri app [GeoForm] there wasn’t any kind of geographic information in it except where the team was [based]. I think that’s an opportunity…kind of crying out for national data collection with the opportunity for people to see their own data and share it in their region.
The ability to view the data as a visual product contributes to user adoption and makes
the reporting process more beneficial to individual teams. As another participant said,
People can see value of showing where all their searches are and using this as a live map that they can show… it wasn’t until we came up with the mapping idea last year where people say…oh, so this puts dots on a map, and that I get, and I can see that real-time… The visual aspect was really exciting.
The former participant also noted, however, that collecting a single point location for
each incident might be unclear and that a more comprehensive set of well-defined
attributes could help build a database of local lost person behavior, which could be even
more valuable:
69
In [this] county, if we were doing that, we’d have in 10 years something that would be useful to train our search members on. I know this is true. People get lost in the same places and they often end up in similar places, and if we were tracking that better we could analyze it and make use of that information.
Recording local lost person behavior was just one of the many uses that the latter
participant envisioned for the new MRA dataset—other opportunities extended beyond
the immediate search incident to include other parts of Cutter’s emergency response
cycle: (1) documentation for team fundraising and budgets (preparedness), (2) records
for improving wilderness medical training (preparedness), or (3) public information
maps as preventative measures (mitigation).
As the last potential use of the MRA map indicates, web maps create
opportunities to interface with a wide audience of the public. One participant stated
that “the big advantage of a web map is communicating that information to a wider
audience.” One application of web maps that was tested, but only used a few times, was
to inform visitors of an unresolved, ongoing search and to crowd-source witnesses. One
participant explained, “hundreds, thousands of people, are out hiking. …they are all
searchers, whether they see something or whether they don’t see something. So, if you
can capture where they go… you’re starting to eliminate terrain that you have to
search.” This participant went on to note that a dedicated person was needed to update
and maintain such projects, which can be difficult to find among volunteers.
To improve web maps for WiSAR, participants suggested better integration with
other technology (NFR4), including GIS as well as standard ICS forms. One participant
suggested that map tilesets, or the collection of image files that mosaic at particular
scales (i.e., zoom levels) to form a ‘slippy’ web map, could be licensed and made
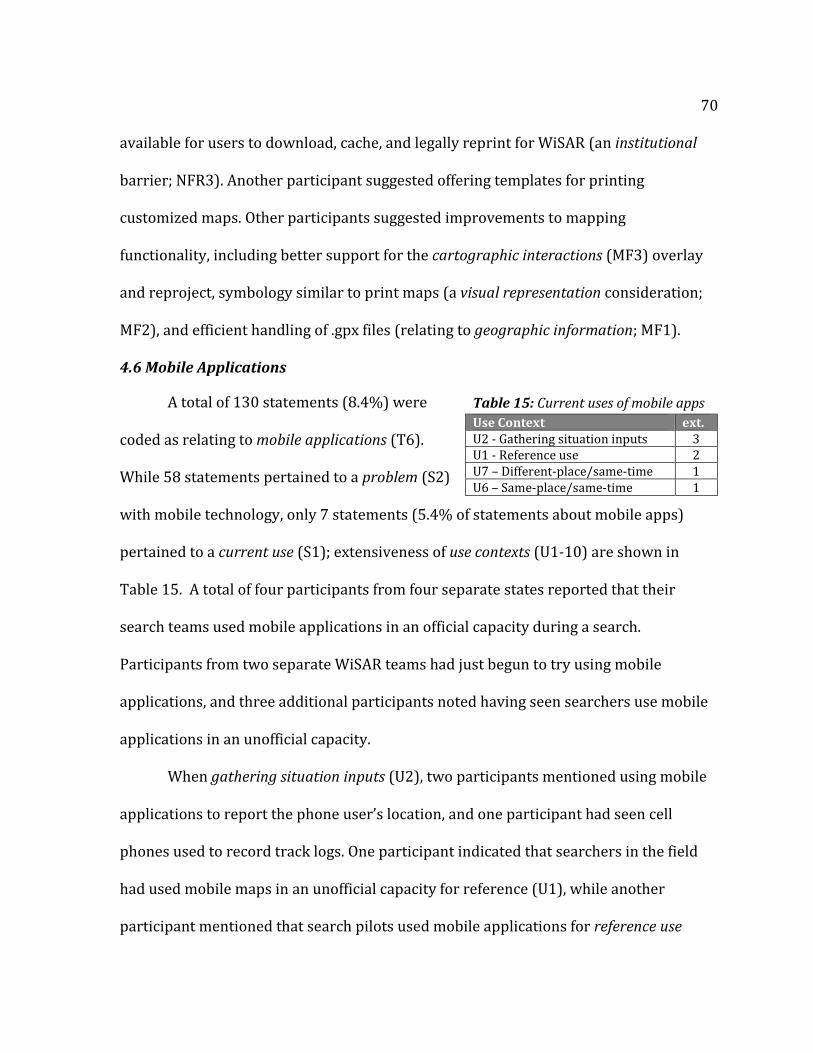
70 available for users to download, cache, and legally reprint for WiSAR (an institutional
barrier; NFR3). Another participant suggested offering templates for printing
customized maps. Other participants suggested improvements to mapping
functionality, including better support for the cartographic interactions (MF3) overlay
and reproject, symbology similar to print maps (a visual representation consideration;
MF2), and efficient handling of .gpx files (relating to geographic information; MF1).
4.6 Mobile Applications
A total of 130 statements (8.4%) were
coded as relating to mobile applications (T6).
While 58 statements pertained to a problem (S2)
with mobile technology, only 7 statements (5.4% of statements about mobile apps)
pertained to a current use (S1); extensiveness of use contexts (U1-10) are shown in
Table 15. A total of four participants from four separate states reported that their
search teams used mobile applications in an official capacity during a search.
Participants from two separate WiSAR teams had just begun to try using mobile
applications, and three additional participants noted having seen searchers use mobile
applications in an unofficial capacity.
When gathering situation inputs (U2), two participants mentioned using mobile
applications to report the phone user’s location, and one participant had seen cell
phones used to record track logs. One participant indicated that searchers in the field
had used mobile maps in an unofficial capacity for reference (U1), while another
participant mentioned that search pilots used mobile applications for reference use
Table 15: Current uses of mobile apps
Use Context ext. U2 - Gathering situation inputs 3 U1 - Reference use 2 U7 – Different-place/same-time 1 U6 – Same-place/same-time 1
71
(U1). One participant described the use of mobile apps for different-place/same-time
(U7) tracking of searchers by the command post. One participant had used maps on a
tablet to collaborate in a same-place/same-time (U6) briefing scenario.
The most commonly mentioned drawback to mobile devices was the lack of
connectivity to cell phone reception or internet service (NFR5). No participant
confirmed consistently having widespread cell phone reception in search areas.
Opinions were divided regarding the accuracy of mobile coordinate readings (MF1).
Five participants considered mobile devices accurate enough for WiSAR and one noted
stronger satellite connectivity on a mobile device compared to a handlheld GPS device,
while six participants considered mobile devices too inaccurate (MF1). As one
participant stated, “the accuracy… I don’t trust them. …because the people that are
using them are the people that we're going for in the field that are lost.” Hardware
concerns (NFR8) with mobile devices also were commonly noted. Battery life is limited
and consumed quickly by mapping applications, and an integrated battery is not as
readily replaced as the standard AA batteries in GPS devices. Many participants did not
consider mobile devices to be durable, weather-resistant, or ‘rugged’ enough for field
teams. Many mobile devices currently used for WiSAR were personally owned, and one
participant noted that searchers preferred to use their personal devices. These factors
raised the question of team responsibility for replacement in the case of a damaged
device (NFR9).
One key advantage of mobile applications is their ability to wirelessly exchange
data (NFR4). Some participants had used email or Bluetooth technology to efficiently
72 (NFR6) collect track logs from field team members. Participants found mobile devices
familiar and user-friendly to volunteers (NFR1, 7). Participants noted that mobile
devices were less expensive than both radios and GPS devices, and that applications
were also inexpensive (NFR2). Certain mobile applications had the ability to cache map
data (coded as other mapping functionality; MF5) for reference use (U1) without
connectivity to cell phone reception or internet service.
One participant suggested a need for mobile apps and devices tailored to WiSAR
use, and/or support from the app or device developers for requested features (NFR9).
As another participant put it, “understand who the end user is, especially in SAR.”
Various participants named specific features that they would want supported: (1) a
default view of coordinate readings for their location (not just the ‘blue dot’
conventionally displayed to show the user’s location), (2) improved durability and
battery life or replaceable batteries, and (3) an efficient method for transferring data
from the device to a computer. Some participants suggested incorporating features
common in mobile devices, such as high resolution screens or cameras, into GPS devices
(NFR8). However, one participant stated that there is not enough of a market to support
devices or apps developed specifically for WiSAR.
Suggestions were made to improve the geographic information (MF1) available
through mobile applications by supporting GIS-friendly file formats and by providing
more base datasets, ideally accessed through an organized catalog to make them easy to
browse and to make users aware of what is available. It was clear that any mobile

73
device for field teams must be able to cache data (MF5) and function with intermittent
or complete lack of connectivity (NFR5).
Some participants suggested improving connectivity (NFR5) in the command
post or even throughout the entire search area. Such signal boosting was recognized as
possible, but prohibitively expensive (NFR2). Given some method of connectivity,
participants saw potential for live synchronization of individual devices with a
centralized, updating source of incident data to facilitate same-time (U6, U8)
geocollaboration for planning and situation awareness. Similarly, real-time tracking of
individual devices from the command post could facilitate same-time collaboration
between the command post and field teams.
4.7 Other Technology
A final other technology code (T7) captured notable statements relating to a
specific technology used for mapping in WiSAR that was not discussed above. A total of
115 statements (7.4%) were coded as other technology (T7), and the following themes
were consistently mentioned. Statements about other technology included: thirty-one
statements (27.0%) related to real-time tracking (U7), which is addressed in Section 4.8
due to its relevance to GPS (T2) and mobile devices (T6); thirty-one statements (27.0%)
pertaining to Unmanned Aerial Vehicles (UAVs); seventeen statements (14.8%) related
to technologies that detect a transmission from the missing subject; and thirteen
statements (11.3%) describing the use of email and other web-based file-sharing tools
for different-place (U7,9) collaboration.

74
Although legal restrictions (an institutional limitation; NFR3) precluded most
current use of UAVs by WiSAR teams, two participants had seen UAVs used in search,
although the UAVs did not contribute to finding the subject. Other participants
discussed the possibility of future use. Although UAVs called to mind a live video feed
for many participants, one participant stressed that using a UAV to directly search for
the subject was currently not the most effective use of the technology, saying “in my
view, the thing it does the worst is flying around there looking for someone… there are
lots of uses for [a UAV] that are better.” This participant went on to suggest alternative
uses for UAVs that enhance a WiSAR team’s geographic information or mapping
capabilities: (1) obtaining up-to-date aerial imagery of the search area for situation
awareness—an instance of gathering situation inputs (U2)—or (2) serving as a platform
for equipment to extend a communications network and improve connectivity (NFR5).
Other participants also suggested that real-time aerial imagery from a UAV could be an
efficient (NFR6) method of gathering situation inputs (U2) in open fields or a desert
environment, where a subject might be easy to spot. Some participants suggested that
there is potential for obtaining an initial look at treacherous terrain such as swift water
creeks, gullies, or cliff bands to seek an indication of a subject, but a UAV would not be
trusted to confirm the subject’s absence.
UAVs are limited by short flight times and sensitivity to weather conditions such
as wind (hardware considerations; NFR8). They also require a competent operator (a
human resources limitation; NFR1). UAVs were considered expensive (NFR2), although
less expensive than a helicopter for situations in which they might be a viable

75
substitute. Some felt that a public wariness of UAVs, or drones, would prevent teams
from adopting them, while others felt that having UAVs as a resource (as with search
dogs now) may eventually become an expectation.
Another form of other technology (T7) consisted of systems that receive a
transmission from an electronic device carried by the search subject. Although these
were intentionally excluded from the scope of this study’s interview questions, several
subjects mentioned their use. Participants reported increasing use of data from the
subject’s cell phone as well as some use of Personal Locator Beacons (PLBs) (e.g., SPOT)
to aid in searches. Participants reported inaccuracy of geographic information (MF1)
(“as much as a half mile or a mile”) from Phase II Enhanced 911, a location-reporting
system for emergency calls, as well as PLBs on some occasions. Though many
participants reported no problems in obtaining cell phone data (NFR3), usually through
law enforcement, some had encountered trouble. One participant stated, “You can’t go
Sunday night in a rainstorm saying oh, I need this stuff, you have to do your homework
ahead of time,” emphasizing that WiSAR teams need to preemptively establish
procedures for obtaining such data.
Finally, email and online file-sharing tools (e.g., Sharepoint, Dropbox, Google
Drive, wiki sites) were essential in different-place (U7,9) geocollaborative contexts to
exchange geographic files or map images. This file sharing was used to seek opinions
from search experts who could not be present at the incident command post. One
notable example was the use of a wiki site to allow multiple collaborators to share
opinions and build upon others’ ideas. Online file-sharing also allowed WiSAR managers
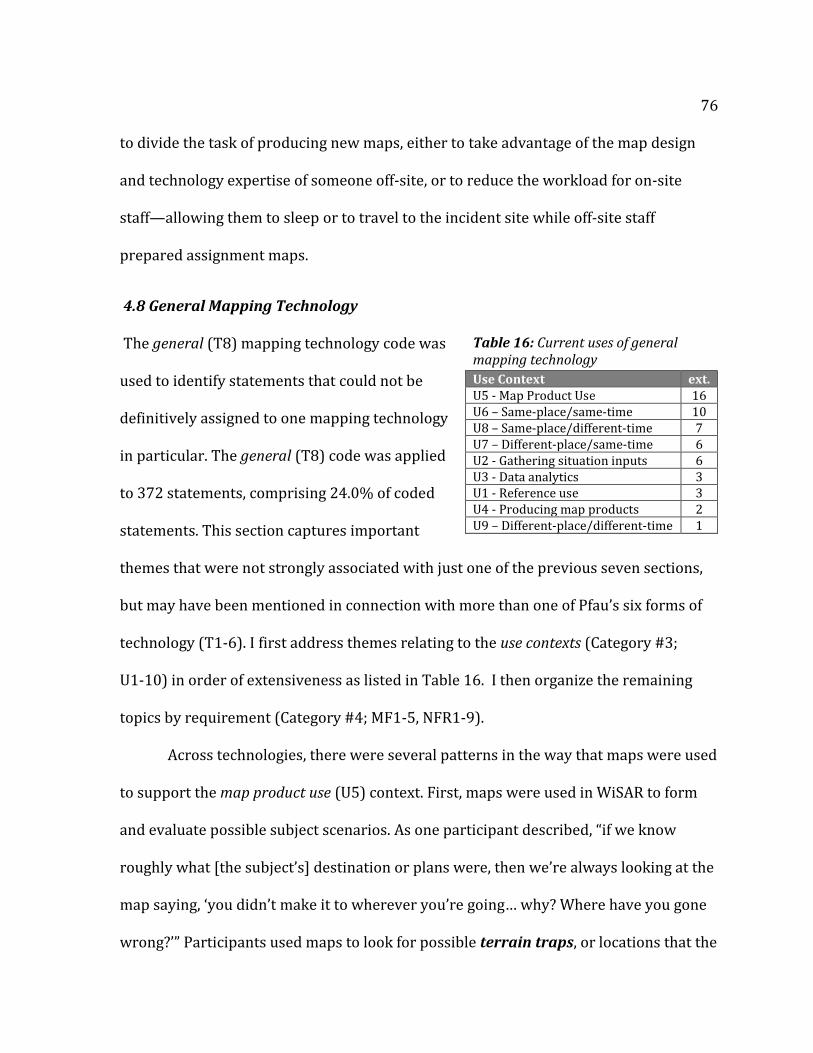
76 to divide the task of producing new maps, either to take advantage of the map design
and technology expertise of someone off-site, or to reduce the workload for on-site
staff—allowing them to sleep or to travel to the incident site while off-site staff
prepared assignment maps.
4.8 General Mapping Technology
The general (T8) mapping technology code was
used to identify statements that could not be
definitively assigned to one mapping technology
in particular. The general (T8) code was applied
to 372 statements, comprising 24.0% of coded
statements. This section captures important
themes that were not strongly associated with just one of the previous seven sections,
but may have been mentioned in connection with more than one of Pfau’s six forms of
technology (T1-6). I first address themes relating to the use contexts (Category #3;
U1-10) in order of extensiveness as listed in Table 16. I then organize the remaining
topics by requirement (Category #4; MF1-5, NFR1-9).
Across technologies, there were several patterns in the way that maps were used
to support the map product use (U5) context. First, maps were used in WiSAR to form
and evaluate possible subject scenarios. As one participant described, “if we know
roughly what [the subject’s] destination or plans were, then we’re always looking at the
map saying, ‘you didn’t make it to wherever you’re going… why? Where have you gone
wrong?’” Participants used maps to look for possible terrain traps, or locations that the
Table 16: Current uses of general mapping technology
Use Context ext. U5 - Map Product Use 16 U6 – Same-place/same-time 10 U8 – Same-place/different-time 7 U7 – Different-place/same-time 6 U2 - Gathering situation inputs 6 U3 - Data analytics 3 U1 - Reference use 3 U4 - Producing map products 2 U9 – Different-place/different-time 1
77
topography might funnel a moving subject into based on likely routes or paths of least
resistance. Maps also were used to delineate the search area, to identify important
locations for containment, to design search segments, and to make logistical decisions
as far as how to get field teams safely into and out of their assigned areas. As the search
unfolds, they are used to plot clues and completed assignments. Participants
highlighted the importance of maps in documentation of search incidents. Participants
emphasized that maps are essential across WiSAR tasks; as one participant stated,
“spatial information [has] relevance in basically all aspects of search.”
Mapping technology broadly was acknowledged as important in all four WiSAR
geocollaboration contexts (U6-9). In same-place/same-time (U6) geocollaboration, the
emphasis was placed on building a common operating picture. For same-
place/different-time (U8) geocollaboration, digital mapping files were transferred to the
incoming collaborators. Maps supported different-place/same-time (U7)
geocollaboration through verbal communication with spatially-distributed
collaborators using the same visual representation. For different-place (U7,9)
geocollaboration, two participants reported using remote support command staff in
both same-time (U7) and different-time (U9) contexts.
Mapping technology was used to gather situation inputs (U2) from verbal radio
communications, track logs, debriefing sessions, and witness interviews. A notable topic
that arose from this area of discussion was the possibility for automated transmission
of coordinates. Most participants reported that field team locations are currently
obtained through verbal communication, which is vulnerable to mistakes. Participants
78 had observed mistakes in recording coordinates including misinterpreted handwritten
numbers, misrecorded coordinate formats (degrees-minutes-seconds instead of
degrees decimal minutes), and mismatched datums. As one participant stated:
“coordinates lend themselves to transmission other than by voice.” Participants noted
that devices with this capability (e.g., GPS speaker microphones) are available; however
they were not widely used among participants’ WiSAR teams.
Real-time tracking of field teams by the command post—an instance of different-
place/same-time geocollaboration (U7)—was mentioned in connection with GPS (T2)
and mobile (T6) devices, along with other technology (T7), including GPS speaker
microphones, satellite trackers including Personal Locator Beacons (PLBs) (e.g., SPOT,
DeLorme inReach), amateur (or ham) radio, and two-way radio (e.g., Garmin Rhino), all
of which can facilitate this capability. There was some debate over the usefulness of
real-time tracking of teams in the field. Although some participants felt that real-time
tracking was unnecessary, other participants suggested ways in which real-time
tracking could improve search efficiency or management. Participants suggested that
real-time tracking of field teams (U7) could improve search efficiency (NFR6) in a least
three ways: (1) by eliminating the need for downloading track logs upon the field
teams’ return (although it was unclear whether a real-time tracking would be as
detailed as a GPS track log), (2) by saving field teams the trouble of plotting and
reporting their coordinate, or (3) by allowing staff in the command post to consider the
progress of teams in planning decisions, especially in the (rare) case of teams spending
more than a day in the field completing an assignment. Participants also indicated that
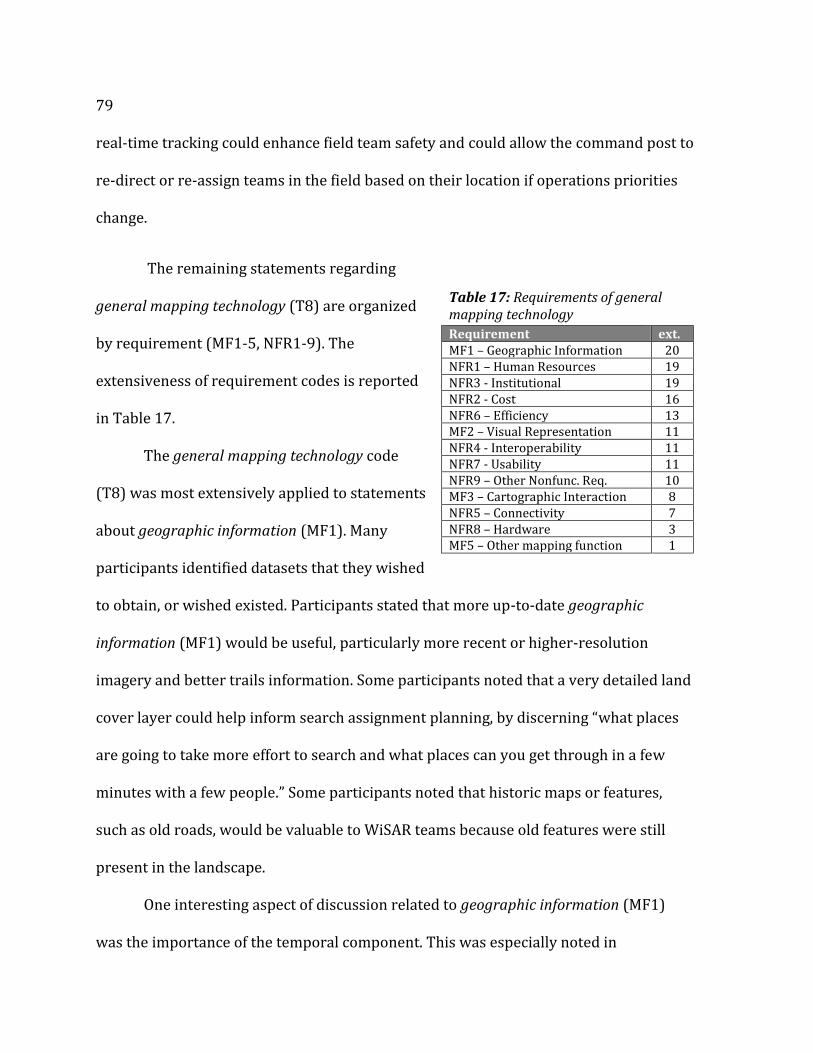
79
real-time tracking could enhance field team safety and could allow the command post to
re-direct or re-assign teams in the field based on their location if operations priorities
change.
The remaining statements regarding
general mapping technology (T8) are organized
by requirement (MF1-5, NFR1-9). The
extensiveness of requirement codes is reported
in Table 17.
The general mapping technology code
(T8) was most extensively applied to statements
about geographic information (MF1). Many
participants identified datasets that they wished
to obtain, or wished existed. Participants stated that more up-to-date geographic
information (MF1) would be useful, particularly more recent or higher-resolution
imagery and better trails information. Some participants noted that a very detailed land
cover layer could help inform search assignment planning, by discerning “what places
are going to take more effort to search and what places can you get through in a few
minutes with a few people.” Some participants noted that historic maps or features,
such as old roads, would be valuable to WiSAR teams because old features were still
present in the landscape.
One interesting aspect of discussion related to geographic information (MF1)
was the importance of the temporal component. This was especially noted in
Table 17: Requirements of general mapping technology
Requirement ext. MF1 – Geographic Information 20 NFR1 – Human Resources 19 NFR3 - Institutional 19 NFR2 - Cost 16 NFR6 – Efficiency 13 MF2 – Visual Representation 11 NFR4 - Interoperability 11 NFR7 - Usability 11 NFR9 – Other Nonfunc. Req. 10 MF3 – Cartographic Interaction 8 NFR5 – Connectivity 7 NFR8 – Hardware 3 MF5 – Other mapping function 1
80 connection with same-place/different-time geocollaboration (U8) for transition of
command, but also important for general situation awareness (U5). One participant
noted that their team created timelines of events, in addition to maps, to better
understand an incident as it unfolded. Another participant suggested that temporal
information should be better integrated into geographic file formats and better
supported by mapping technology, including GIS software.
An overarching theme throughout the discussion of mapping technology was the
idea that expertise, or the available human resources (NFR1), is just as important as
having access to a technology. As one participant said of GPS devices, “they’re only as
good as you know how to use them.” Illustrating this point, another participant
mentioned “I’ve seen somebody put a post-it note on a computer screen because they
didn’t know how to make the dot on the computer screen.” Mapping functionality only
can be leveraged if the requisite expertise is available; as one participant put it,
“Sometimes I’m not 100 percent sure how much it is that the program has the problem
and how much of it is just that the people using the programs don’t have enough
familiarity to do what we want to do.” Another participant felt that when functionality
exceeded the limits of available expertise, it could become a disadvantage: “Anytime
you get overloaded with technology, it’s as much of a barrier as not having enough
technology.” One participant emphasized that this is analogous to other areas of
technical expertise in WiSAR, stating that “like any other skill in SAR, if you’ve got
people that know how to do it, it's going to go smooth…if they don’t, then that’s a little
bit more difficult. But it’s that way with everything.”
81
Some participants had encountered institutional (NFR3) barriers to obtaining
geographic information. Fourteen participants stated that permission or authorization
had not been a problem in accessing geographic information; however, seven
participants stated that their teams did not have access to certain potentially-useful
datasets, such as closed trails, social trails, infrastructure, and real-time satellite images.
Participants had encountered data access restrictions with private companies as well as
agencies at all levels of government, including cities, counties, state parks, and federal
agencies. Participants noted that working on federal agency computers restricted
administrator privileges to the computer system and hindered the sharing of files with
non-government agencies, presenting an institutional (NFR3) barrier to collaboration.
Participants also noted a lack of standards for aggregating incident information or
exchanging geographic information with other WiSAR teams or cooperating agencies.
Finally, some participants noted resistance of WiSAR teams to the use of certain
mapping technology; thus, institutional (NFR3) challenges may come from within an
agency or team.
The issue of financial cost (NFR2) was raised in connection to every form of
mapping technology. Cost is always a factor for volunteer organizations and public
agencies. A tension exists between the limited resources of most WiSAR teams, an
expectation of free labor (volunteering), and the difficulty of providing free labor and
inexpensive tools. One participant stated, “if you’re offering a valuable and useful
[mapping technology] that you’re going to update and maintain; the free model just
doesn’t work… it takes time to develop these things. …people want them for free…and

82 there’s not enough ad[vertisement] money there either.” Participants also noted that
there is not enough of a market in WiSAR to fund research and development of new
technology.
Finally, some participants made recommendations for organizing mapping
workflows during a search, and many of these solutions aimed to improve efficiency
(NFR6). Emphasis was placed on distributing tasks to relieve the demand on a single
computer and user. To prevent crowding around the GIS computer, some participants
recommended the use of a separate monitor or a projector to display an updated map in
the command post for general situation awareness, or in the debriefing area, ideally
accessing a definitive, updated data source such as a central database. Participants also
suggested a dedicated computer or screen for the debriefing field teams or a dedicated
computer and operator for downloading track logs. One participant had tried this
system and encountered difficulty: “if you have a track download machine and then a
planning machine … they wind up with information silos on each machine and it’s
harder to get a common operational picture where you see all the information at once.”
This participant had also tried a local networking solution, and noted problems with
adoption due to the technical expertise (NFR1) required to set it up:
I was trying to build a remote server software that somebody could run and then have several machines access through the browser and I had a lot of trouble with adoption there… it requires technical savvy to get up and running.
Improving the coordination of many simultaneous, map-related tasks in WiSAR may
prove to be either a human resources issue (NFR1) or a challenge of blending
interoperability (NFR4) with usability (NFR7).
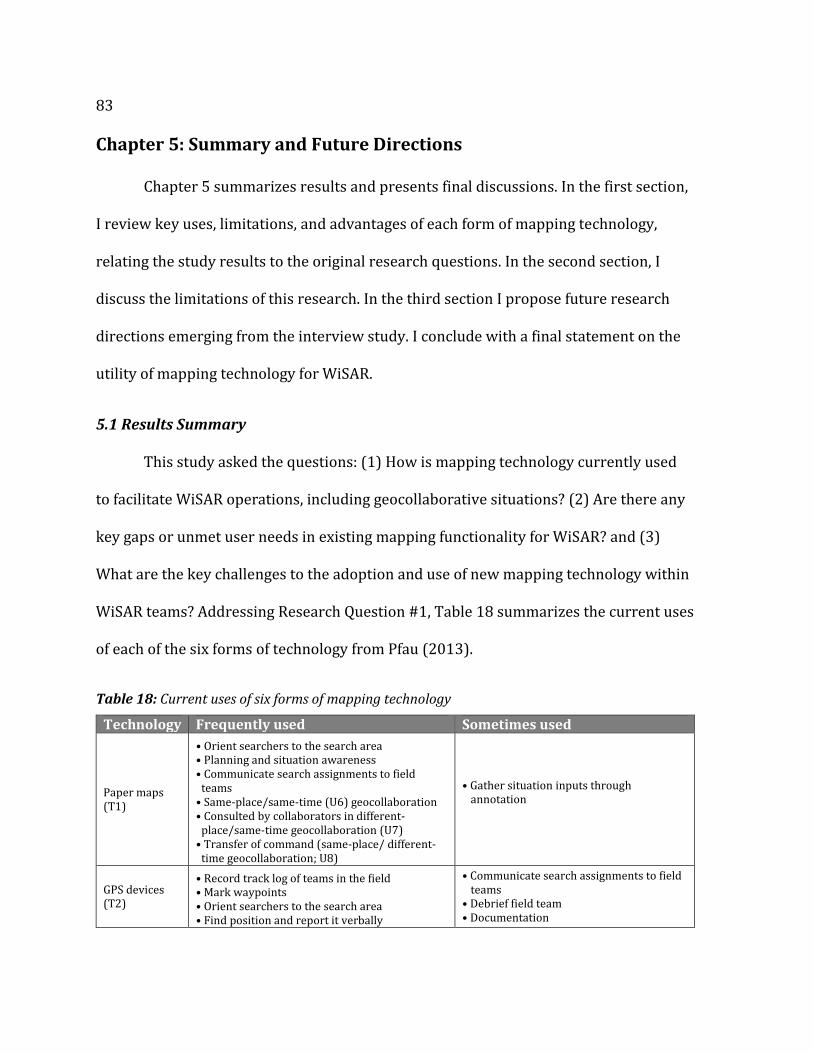
83
Chapter 5: Summary and Future Directions
Chapter 5 summarizes results and presents final discussions. In the first section,
I review key uses, limitations, and advantages of each form of mapping technology,
relating the study results to the original research questions. In the second section, I
discuss the limitations of this research. In the third section I propose future research
directions emerging from the interview study. I conclude with a final statement on the
utility of mapping technology for WiSAR.
5.1 Results Summary
This study asked the questions: (1) How is mapping technology currently used
to facilitate WiSAR operations, including geocollaborative situations? (2) Are there any
key gaps or unmet user needs in existing mapping functionality for WiSAR? and (3)
What are the key challenges to the adoption and use of new mapping technology within
WiSAR teams? Addressing Research Question #1, Table 18 summarizes the current uses
of each of the six forms of technology from Pfau (2013).
Table 18: Current uses of six forms of mapping technology
Technology Frequently used Sometimes used
Paper maps (T1)
• Orient searchers to the search area • Planning and situation awareness • Communicate search assignments to field
teams • Same-place/same-time (U6) geocollaboration • Consulted by collaborators in different-
place/same-time geocollaboration (U7) • Transfer of command (same-place/ different-
time geocollaboration; U8)
• Gather situation inputs through annotation
GPS devices (T2)
• Record track log of teams in the field • Mark waypoints • Orient searchers to the search area • Find position and report it verbally
• Communicate search assignments to field teams
• Debrief field team • Documentation
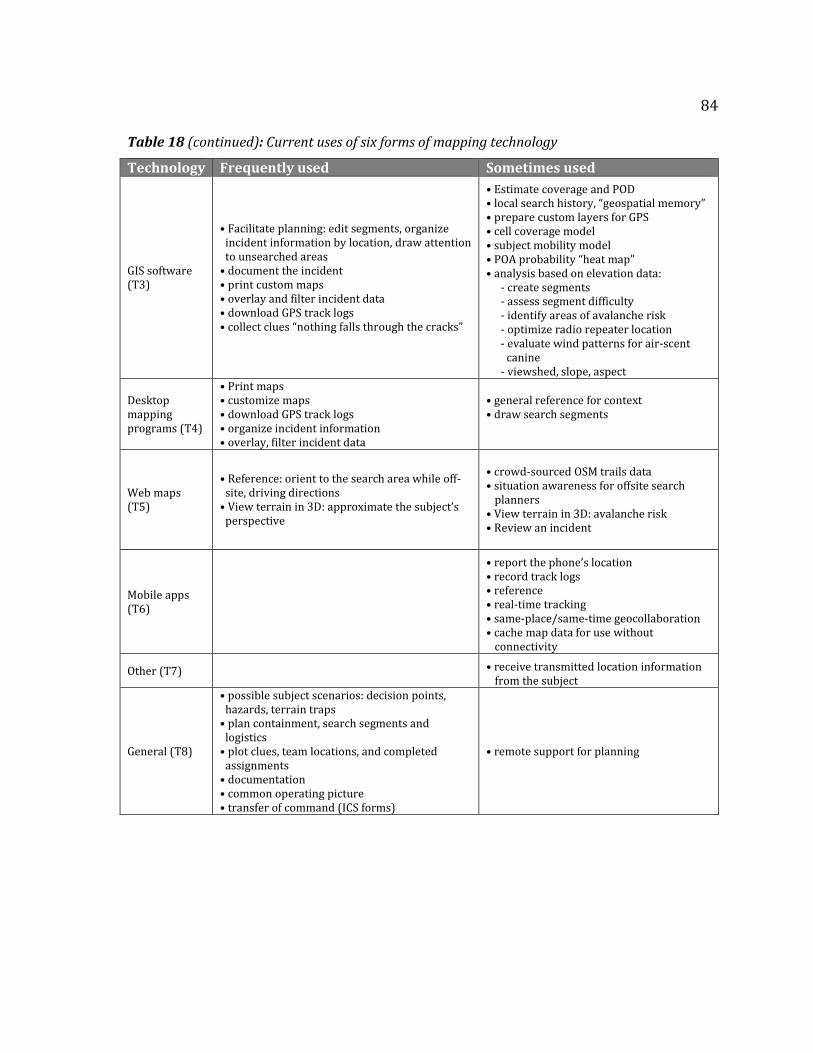
84
Table 18 (continued): Current uses of six forms of mapping technology
Technology Frequently used Sometimes used
GIS software (T3)
• Facilitate planning: edit segments, organize incident information by location, draw attention to unsearched areas
• document the incident • print custom maps • overlay and filter incident data • download GPS track logs • collect clues “nothing falls through the cracks”
• Estimate coverage and POD • local search history, “geospatial memory” • prepare custom layers for GPS • cell coverage model • subject mobility model • POA probability “heat map” • analysis based on elevation data:
- create segments - assess segment difficulty - identify areas of avalanche risk - optimize radio repeater location - evaluate wind patterns for air-scent
canine - viewshed, slope, aspect
Desktop mapping programs (T4)
• Print maps • customize maps • download GPS track logs • organize incident information • overlay, filter incident data
• general reference for context • draw search segments
Web maps (T5)
• Reference: orient to the search area while off-site, driving directions
• View terrain in 3D: approximate the subject’s perspective
• crowd-sourced OSM trails data • situation awareness for offsite search
planners • View terrain in 3D: avalanche risk • Review an incident
Mobile apps (T6)
• report the phone’s location • record track logs • reference • real-time tracking • same-place/same-time geocollaboration • cache map data for use without
connectivity
Other (T7) • receive transmitted location information from the subject
General (T8)
• possible subject scenarios: decision points, hazards, terrain traps
• plan containment, search segments and logistics
• plot clues, team locations, and completed assignments
• documentation • common operating picture • transfer of command (ICS forms)
• remote support for planning

85
Addressing Research Questions #2 and #3, Table 19 presents a summary of
limitations, advantages, suggestions for improvement, and notes relating to each form
of technology. The table is followed by a short summary of advantages, limitations, and
future directions for each technology.
Table 19: Advantages, limitations, suggestions, and notes by technology
Tech Advantages Limitations Suggestions Notes
Paper (T1)
Same-place/same-time (U6) + easy annotation + large format + detail across a large area + space to gather around + user interacts at their own
pace
Reliability (NFR9) + no batteries + no electronic failure
Human Resources (NFR1) + familiar and preference
Efficiency (NFR6) + quick access
Usability (NFR7) + easy to use and learn
Geographic Information (MF1) - out of date - limited layers - static
Cartographic Interaction (MF3) - limited precision - not scalable - no interaction with the data
Documentation (U5) - single master copy may be
lost
Interoperability (NFR4)
Geographic Info. (MF1) • more up-to-date • more accurate or
detailed
Visual Representation (MF2)
• include scale bar • improve graticule
Ability to print custom maps allows inclusion of more current data and control over both the visual representation and the material
GPS (T2)
Hardware (NFR8) + durable + batteries easily replaced
Geographic Information (MF1) + accurate
Gathering Situation Inputs (U2) + track logs
Hardware (NFR8) - small screen - poor display resolution
Human Resources (NFR1) - training - availability of someone
familiar with downloads
Interoperability (NFR4) - cables
Efficiency (NFR6) - downloads
Usability (NFR7) - difficult to enter info.
Cost (NFR2)
Interoperability (NFR4)
Efficiency (NFR6) • wireless download • automatic settings
sync
Usability (NFR7) • user interface
Hardware (NFR8) • larger screen • lighter weight • longer battery life
Standardizing equipment, when possible, improves
GIS (T3)
Geographic Info. (MF1) + greatest selection of data
Visual Representation (MF2) + control over representation
and map elements
Data analytics (U3) + query data by location + modeling + spatial analysis
Gathering situation inputs (U2) + nothing falls through the
cracks + scalability
Human Resources (NFR1) - requires investment to learn - reliance on expert users
Usability (NFR7) - difficult to use
Cost (NFR2)
Usability (NFR7)
Human Resources (NFR1)
• awareness of GIS • training • availability of trained
personnel
Interoperability (NFR4) • integration with
simpler programs
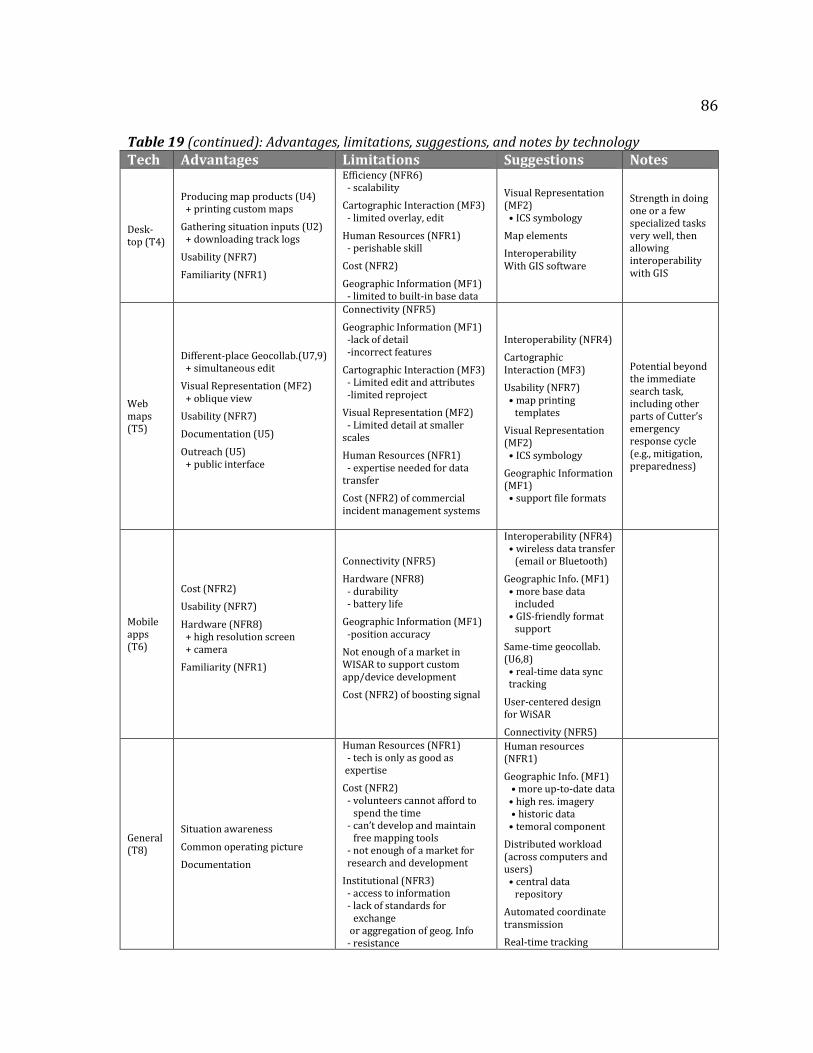
86
Table 19 (continued): Advantages, limitations, suggestions, and notes by technology Tech Advantages Limitations Suggestions Notes
Desk-top (T4)
Producing map products (U4) + printing custom maps
Gathering situation inputs (U2) + downloading track logs
Usability (NFR7)
Familiarity (NFR1)
Efficiency (NFR6) - scalability
Cartographic Interaction (MF3) - limited overlay, edit
Human Resources (NFR1) - perishable skill
Cost (NFR2)
Geographic Information (MF1) - limited to built-in base data
Visual Representation (MF2)
• ICS symbology
Map elements
Interoperability With GIS software
Strength in doing one or a few specialized tasks very well, then allowing interoperability with GIS
Web maps (T5)
Different-place Geocollab.(U7,9) + simultaneous edit
Visual Representation (MF2) + oblique view
Usability (NFR7)
Documentation (U5)
Outreach (U5) + public interface
Connectivity (NFR5)
Geographic Information (MF1) -lack of detail -incorrect features
Cartographic Interaction (MF3) - Limited edit and attributes -limited reproject
Visual Representation (MF2) - Limited detail at smaller scales
Human Resources (NFR1) - expertise needed for data transfer
Cost (NFR2) of commercial incident management systems
Interoperability (NFR4)
Cartographic Interaction (MF3)
Usability (NFR7) • map printing
templates
Visual Representation (MF2)
• ICS symbology
Geographic Information (MF1)
• support file formats
Potential beyond the immediate search task, including other parts of Cutter’s emergency response cycle (e.g., mitigation, preparedness)
Mobile apps (T6)
Cost (NFR2)
Usability (NFR7)
Hardware (NFR8) + high resolution screen + camera
Familiarity (NFR1)
Connectivity (NFR5)
Hardware (NFR8) - durability - battery life
Geographic Information (MF1) -position accuracy
Not enough of a market in WISAR to support custom app/device development
Cost (NFR2) of boosting signal
Interoperability (NFR4) • wireless data transfer
(email or Bluetooth)
Geographic Info. (MF1) • more base data
included • GIS-friendly format
support
Same-time geocollab. (U6,8)
• real-time data sync tracking
User-centered design for WiSAR
Connectivity (NFR5)
General (T8)
Situation awareness
Common operating picture
Documentation
Human Resources (NFR1) - tech is only as good as
expertise
Cost (NFR2) - volunteers cannot afford to
spend the time - can’t develop and maintain
free mapping tools - not enough of a market for
research and development
Institutional (NFR3) - access to information - lack of standards for
exchange or aggregation of geog. Info - resistance
Human resources (NFR1)
Geographic Info. (MF1) • more up-to-date data • high res. imagery • historic data • temoral component
Distributed workload (across computers and users)
• central data repository
Automated coordinate transmission
Real-time tracking
87
Paper maps will continue to be a staple of the field team due to efficiency, non-
dependence on power sources, and reliability. In the command post, the large format
paper map may uniquely facilitate planning and situation awareness, particularly in the
same-place/same-time (U6) geocollaboration context. The ability to customize and print
maps during a search incident is an important factor in their usefulness, but paper maps
will remain limited by their static form and relative lack of interoperability (NFR4) with
other forms of mapping technology.
Like paper maps, GPS are a nationwide standard in WiSAR and are very familiar
to WiSAR teams. They are needed for their durability, accuracy, and the essential ability
to capture the precise route of a field team. They are limited by interoperability (NFR4)
issues, such as a lack of support for custom uploaded layers, and related efficiency
(NFR6) issues with data exchange, including data transfer exclusively by cable. Usability
(NFR7) and hardware (NFR8) are potential areas for improvement, where GPS
manufacturers might draw from new developments in mobile technology.
WiSAR needs do not often exceed the mapping functionality (MF1-5) offered in
GIS software (T3); but GIS falls short in terms of non-functional considerations (NFR1-
9). The advantages of information management, analysis, and scalability come at a cost
of investment. Usability (NFR7) and interoperability (NFR4) improvements can boost
the effectiveness of GIS software for routine tasks; however, human resources (NFR1)
remain the greatest challenge to taking full advantage of its analytical capability. GIS
skills should be recognized as a technical specialty within WiSAR, and volunteer teams
should pursue ways to bring GIS experts into WiSAR. The human resources (NFR1) non-
88 functional requirement encompasses not only expertise and training, but also the issue
of awareness of GIS capabilities throughout WiSAR. As one participant stated, “more so
than teaching people how to use GIS, there's teaching people what GIS can do for them.”
The fact also remains that WiSAR searches extending past the first few operational
periods are few and far between, which results in both little practice in deploying GIS
and a reinforced perception of it as unnecessary—these may prevent GIS from being
deployed in the critical instances when data management or analysis are key to ending
a search.
Desktop mapping programs play an important part in the efficiency (NFR6) of at
least two essential WiSAR tasks: (1) printing maps with some degree of customization
and (2) downloading track logs. WiSAR teams also have widespread familiarity with
these types of programs. Users do not need to be specially trained to use most desktop
mapping programs, although they require practice to build and maintain proficiency. A
desktop program that is strong in both usability (NFR7) and interoperability (NFR4)
with GIS systems can prove useful by allowing users with limited proficiency to create
or work with GIS-friendly data formats. Desktop programs may be best deployed to
accomplish just a few tasks very well.
Given consistent and reliable internet access, web maps would be used much
more commonly in WiSAR. Lack of connectivity will continue to limit their usefulness
during the emergent event of a search; however, they have great potential to be used
as-is more effectively in other parts of Cutter’s emergency response cycle (see Figure 1),
such as documentation and public outreach. Many of the suggested mapping
89
functionalities are either supported by existing tools—indicating a need for more
familiarity with the available web mapping interfaces—or possible with some expertise
in web maps; these could be made more accessible through tailored user interfaces for
WiSAR. The need for offline mapping tools in WiSAR runs counter to the current trend
in cartography towards web-based applications; therefore, the immediate search
component of WiSAR may become a more isolated use case, and see less benefit from
forthcoming advancements in cartography.
Overall, many participants expressed optimism about the potential of mobile
apps (T6), but were hesitant to invest in or rely upon mobile technology due to
connectivity (NFR5) limitations. There may be overlooked potential for the use of
mobile devices in the command post as they offer the possibility for individuals to
interact with a map at their own pace (a noted advantage of paper maps), combined
with the possibility of better integration with digital file formats and live
synchronization. Desirable features of mobile devices might be blended with the
advantages of GPS devices to improve mapping technology for field teams. The
increasing ubiquity of mobile technology helps to drive the development of features for
compact devices (e.g., cameras, high-resolution screens) that the handheld GPS market
did not support.
Other types of mapping technology (T7) are emerging and will have increasing
relevance in WiSAR, especially location-reporting devices carried by the subject (e.g.,
cell phones, PLBs). WiSAR teams will need to build an understanding of the uncertainty
and potential uses of these technologies. Overarching limitations of mapping
90 technology included human resources (NFR1), cost (NFR2), and institutional barriers
(NFR3). The most suggested areas for improvement across all technologies were human
resources (NFR1), including training, availability, and awareness, and geographic
information (MF1), with participants articulating a need for more or better base data.
5.2 Limitations
There were several necessary limitations to the research design that scope the
findings and restrict the generalizability of results. First, the interview questions in this
study focused on the ‘search’ component of search and rescue, or the ‘Locate’
component of the acronym LAST. It was evident from interview responses that mapping
technology plays a significant role in other parts of the emergency response cycle,
including documentation, preparedness, and prevention.
My concept-driven qualitative analysis represents only one of many possible
ways to organize a large amount of interview data. The transcribed statements could
have been organized in many other ways to reveal different themes not treated in this
research. My coding scheme represents a simplified model of mapping technology for
WiSAR: the discussed forms of technology rarely are clear-cut; the use contexts for
these technologies are complex, overlapping, and constantly shifting; and the
advantages and limitations of the discussed mapping requirements impact each other
significantly in practice. Further, the coding scheme conflates related but not-identical
concepts such as ‘easy to use,’ ‘simple,’ ‘intuitive,’ and ‘user-friendly;’ abstracting such
terminology blurs the more nuanced opinions that participants expressed. My concept-
driven coding scheme, derived from the literature, omitted some concepts that became

91
evident during the coding process—notably the non-functional requirement reliability
and the forms of technology designated as other technology (T7). The coding scheme
also offered little differentiation within broad categories such as the map product use
(U5) context or general mapping technology (T8), an active decision to keep the coding
scheme manageable during qualitative data analysis.
Further limitations are linked to this study’s sample of participants. The
participant sample may be biased towards WiSAR specialists with a particular interest
in GIS. Age of participants was not recorded, but some discussion pointed to age as a
factor in familiarity and comfortability with certain forms of mapping technology (e.g.,
older WiSAR team members being less comfortable with GIS, and younger WiSAR team
members being more familiar with mobile technology, less comfortable with paper
maps, or too trusting of digital technology). Additionally, with a sample size of 24
participants, there were several important ideas that were each articulated by only one
individual participant; thus, a larger sample size, or a different set of 24 participants,
might have yielded slightly different results.
The environments in which this study’s participants conducted WiSAR could be
consistently described as varied terrain (e.g., mountains, canyons, hills). Most
participants also dealt with WiSAR in forested areas. There are wildly different
environments (e.g., desert, tundra, or humid-tropical) that are also considered
wilderness or wildland, which may present different challenges for search and rescue.
92 5.3 Future Directions
This study describes current practice and opinions regarding mapping
technology for WiSAR. The results suggest many future research directions. Refinement
of lost person behavior and subject mobility models, and evaluation of the appropriate
ways to use these models in search, would improve existing mapping functionality.
Participants emphasized an understanding of the end user, indicating a need for user-
centered design. One participant proposed a need for a system of plugin-based tools to
allow WiSAR teams to choose specific mapping functionality to meet their needs.
Although I asked about all four geocollaborative situations, these use contexts
did not appear as a major theme in my results. There are further research opportunities
in examining use contexts, such as geocollaborative situations, in greater depth through
participant observation of actual searches in progress. Wondering how other WiSAR
teams put mapping technology to use, participants seemed to suggest a need for forums
to discuss and compare their use of mapping technology with other teams across the
country.
Considering the broader context of WiSAR as a subset of emergency response
leads to questions about the applicability of developments in other fields. For instance,
can WiSAR borrow and adapt mapping technology and practices from other fields of
emergency response, such as wildland fire? What are the key ways in which WiSAR is
different from those fields, and how might the borrowed mapping technology be
adapted? Finally, one participant suggested that, rather than redesign mapping
93
technology for WiSAR, WiSAR operations could be modified to take better advantage of
mapping technology.
5.4 The Case for GIS in WiSAR
One participant stated that “searches are still solved by people out on foot,
thrashing around in terrain. GIS is just a tool... it’s not some magic something where
technology saves the day.” What GIS technology offers is another tool in the searcher’s
toolbox—a tool with unique advantages that no other form of mapping technology can
replace. If GIS can help focus resources, spark a key insight, or streamline incident
management, it may make an important difference in an emergency situation. As one
participant put it, “any tool that is going to be there for the betterment of the search and
the potential of saving that life, why wouldn't you use it?” GIS capability also can be a
benefit to WiSAR teams outside of the emergent search event, supporting
documentation, prevention, and preparation.
The challenges to GIS use in WiSAR are surmountable, and many efforts are
already underway to improve the usability of, provide training in, contribute expertise
from, and promote awareness of GIS. There also have been efforts to expand
interoperability across mapping technology, working toward what I suggest is the ideal:
not one prescribed system, but a range of compatible tools that leverage the benefits of
several different forms of mapping technology, scale to meet the demands of an
incident, and facilitate data aggregation across WiSAR incidents.
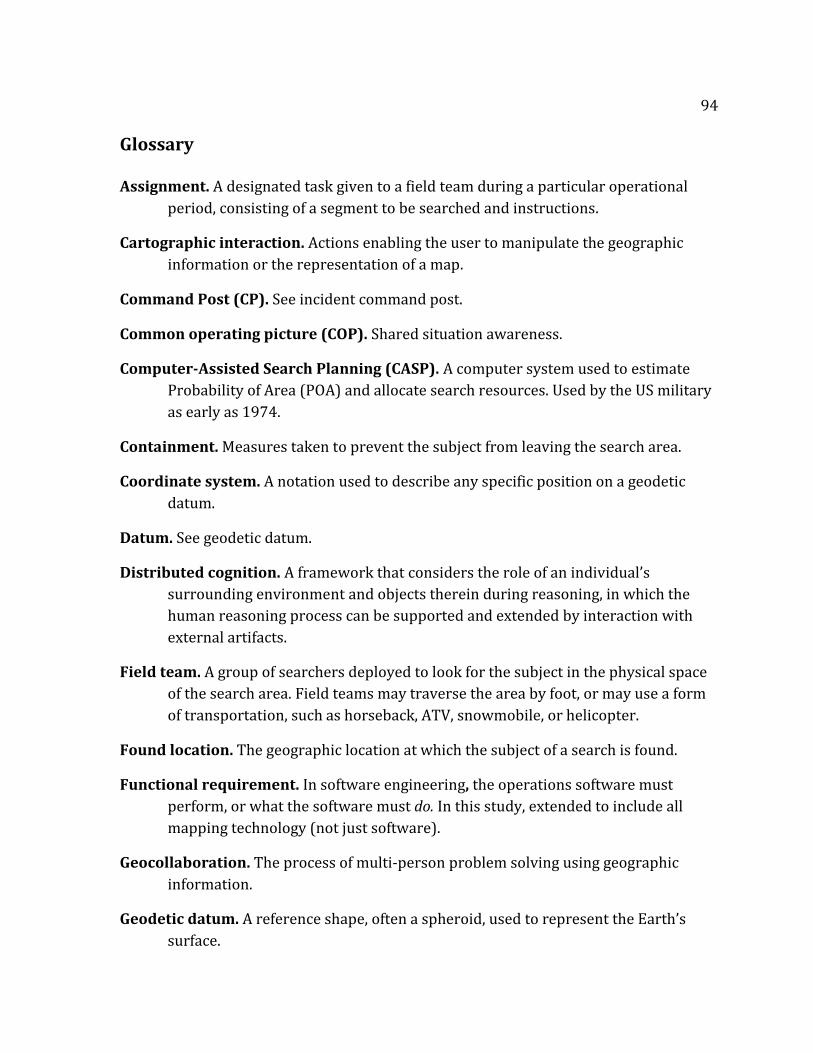
94
Glossary
Assignment. A designated task given to a field team during a particular operational
period, consisting of a segment to be searched and instructions.
Cartographic interaction. Actions enabling the user to manipulate the geographic
information or the representation of a map.
Command Post (CP). See incident command post.
Common operating picture (COP). Shared situation awareness.
Computer-Assisted Search Planning (CASP). A computer system used to estimate
Probability of Area (POA) and allocate search resources. Used by the US military
as early as 1974.
Containment. Measures taken to prevent the subject from leaving the search area.
Coordinate system. A notation used to describe any specific position on a geodetic
datum.
Datum. See geodetic datum.
Distributed cognition. A framework that considers the role of an individual’s
surrounding environment and objects therein during reasoning, in which the
human reasoning process can be supported and extended by interaction with
external artifacts.
Field team. A group of searchers deployed to look for the subject in the physical space
of the search area. Field teams may traverse the area by foot, or may use a form
of transportation, such as horseback, ATV, snowmobile, or helicopter.
Found location. The geographic location at which the subject of a search is found.
Functional requirement. In software engineering, the operations software must
perform, or what the software must do. In this study, extended to include all
mapping technology (not just software).
Geocollaboration. The process of multi-person problem solving using geographic
information.
Geodetic datum. A reference shape, often a spheroid, used to represent the Earth’s
surface.

95
Geographic information. Information with a location component.
Geographic coordinates. A coordinate system using latitude and longitude.
GIS functions. Spatial analyses which calculate new geographic information; performed
by a GIS software.
Global Positioning System (GPS) device. A device which connects to satellite systems
to sense the user’s geographic location.
Hasty search. Part of the initial actions, in which groups of searchers are deployed to
the field to look for the subject as quickly as is reasonable. Phillips et al. (2014,
169) note that “the term [hasty] refers to deployment of resources and not to the
tactic of actual searching.”
Incident Command Post (ICP). The location from which emergency response
operations and resources are coordinated.
Incident Command System (ICS). A system for designating the authority and
responsibilities of emergency response personnel. See Incident Commander and
section chief.
Incident Commander (IC). Within the Incident Command System (ICS), the person
responsible for the overall response activities in an emergency response
situation. Oversees the section chiefs.
Initial actions. The first actions which are carried out at the beginning of a search.
Synonymous with reflex tasking.
Initial Planning Point (IPP). The geographic location used to plan a search, at which
the subject was most recently believed to be present. May be the Last Known
Point (LKP) or the Point Last Seen (PLS).
Interaction operator. A basic interface function that enables map users to manipulate
the visual representation of a map according to their needs.
International Search and Rescue Incident Database (ISRID). A collection of search
and rescue incident data from around the world.
Last known point (LKP). The location at which the subject of a search was most
recently believed to be present, as suggested by some indication of the subject’s
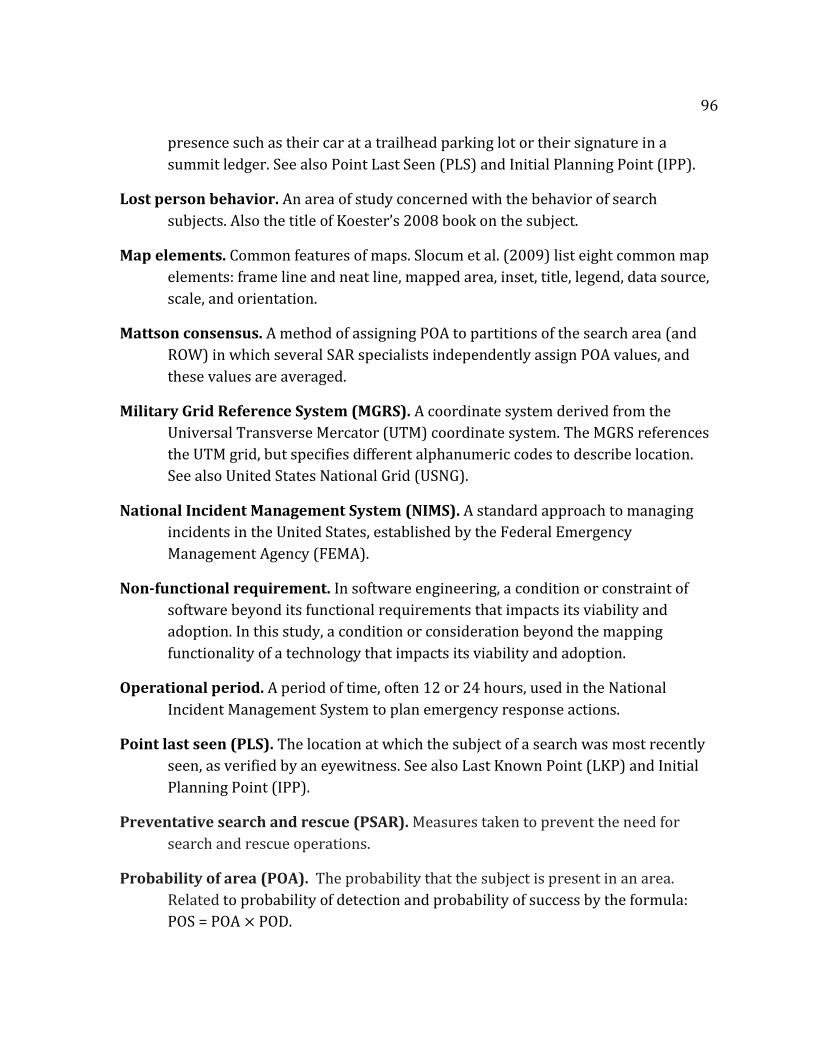
96
presence such as their car at a trailhead parking lot or their signature in a
summit ledger. See also Point Last Seen (PLS) and Initial Planning Point (IPP).
Lost person behavior. An area of study concerned with the behavior of search
subjects. Also the title of Koester’s 2008 book on the subject.
Map elements. Common features of maps. Slocum et al. (2009) list eight common map
elements: frame line and neat line, mapped area, inset, title, legend, data source,
scale, and orientation.
Mattson consensus. A method of assigning POA to partitions of the search area (and
ROW) in which several SAR specialists independently assign POA values, and
these values are averaged.
Military Grid Reference System (MGRS). A coordinate system derived from the
Universal Transverse Mercator (UTM) coordinate system. The MGRS references
the UTM grid, but specifies different alphanumeric codes to describe location.
See also United States National Grid (USNG).
National Incident Management System (NIMS). A standard approach to managing
incidents in the United States, established by the Federal Emergency
Management Agency (FEMA).
Non-functional requirement. In software engineering, a condition or constraint of
software beyond its functional requirements that impacts its viability and
adoption. In this study, a condition or consideration beyond the mapping
functionality of a technology that impacts its viability and adoption.
Operational period. A period of time, often 12 or 24 hours, used in the National
Incident Management System to plan emergency response actions.
Point last seen (PLS). The location at which the subject of a search was most recently
seen, as verified by an eyewitness. See also Last Known Point (LKP) and Initial
Planning Point (IPP).
Preventative search and rescue (PSAR). Measures taken to prevent the need for
search and rescue operations.
Probability of area (POA). The probability that the subject is present in an area.
Related to probability of detection and probability of success by the formula:
POS = POA × POD.
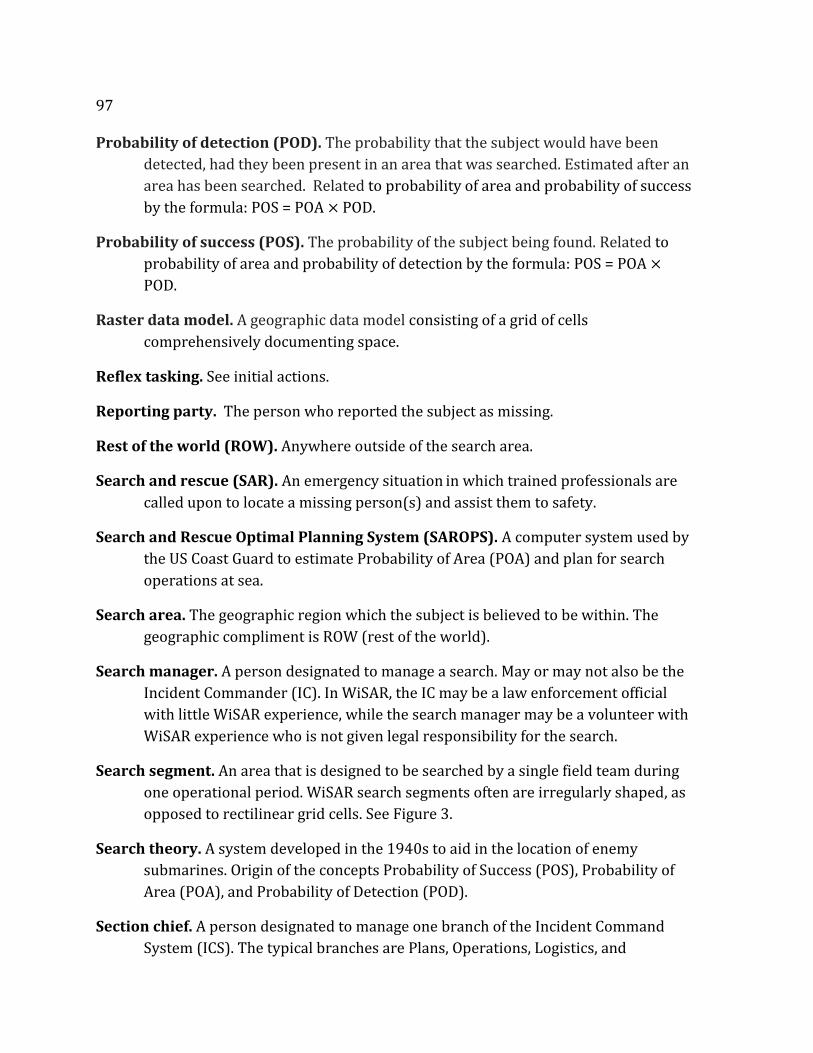
97
Probability of detection (POD). The probability that the subject would have been
detected, had they been present in an area that was searched. Estimated after an
area has been searched. Related to probability of area and probability of success
by the formula: POS = POA × POD.
Probability of success (POS). The probability of the subject being found. Related to
probability of area and probability of detection by the formula: POS = POA ×
POD.
Raster data model. A geographic data model consisting of a grid of cells
comprehensively documenting space.
Reflex tasking. See initial actions.
Reporting party. The person who reported the subject as missing.
Rest of the world (ROW). Anywhere outside of the search area.
Search and rescue (SAR). An emergency situation in which trained professionals are
called upon to locate a missing person(s) and assist them to safety.
Search and Rescue Optimal Planning System (SAROPS). A computer system used by
the US Coast Guard to estimate Probability of Area (POA) and plan for search
operations at sea.
Search area. The geographic region which the subject is believed to be within. The
geographic compliment is ROW (rest of the world).
Search manager. A person designated to manage a search. May or may not also be the
Incident Commander (IC). In WiSAR, the IC may be a law enforcement official
with little WiSAR experience, while the search manager may be a volunteer with
WiSAR experience who is not given legal responsibility for the search.
Search segment. An area that is designed to be searched by a single field team during
one operational period. WiSAR search segments often are irregularly shaped, as
opposed to rectilinear grid cells. See Figure 3.
Search theory. A system developed in the 1940s to aid in the location of enemy
submarines. Origin of the concepts Probability of Success (POS), Probability of
Area (POA), and Probability of Detection (POD).
Section chief. A person designated to manage one branch of the Incident Command
System (ICS). The typical branches are Plans, Operations, Logistics, and

98
Administration or Finance. Branches and their section chiefs are designated as
needed; a small operation may not require all branches.
Situation awareness (or situational awareness). A holistic comprehension of
information that is relevant to a situation, contributing to the ability to anticipate
imminent events and respond according to incident management goals.
Subject. In this study, the term ‘subject’ is used to denote the missing person, or the
subject of a search.
Terrain traps. Locations that the topography might funnel a moving subject into, based
on likely routes or paths of least resistance.
Track offset. In land-based SAR, the minimum distance between the found location and
the nearest linear feature.
United States National Grid (USNG). A coordinate system derived from the Universal
Transverse Mercator (UTM) coordinate system. The USNG references the UTM
grid, but specifies different alphanumeric codes to describe location. See also
Military Grid Reference System (MGRS).
Universal Transverse Mercator (UTM). A coordinate system consisting of a 2-
dimensional grid.
Vector data model. A geographic data model consisting of points, lines, and polygons
in otherwise undocumented space.
Visual representation. The graphical depiction of a map or its map elements. Visual
variable. The visual dimensions by which a graphic can be varied to encode
information. See Table 3 and Figure 5.
Wilderness or Wildland Search and Rescue (WiSAR). Search and rescue that occurs
in largely uninhabited land regions lacking access to manmade amenities, such
as shelter and medical facilities. Wildland settings include rural areas, large
public spaces such as National Parks, wilderness areas, and mountainous terrain,
but also may include urban environments in the wake of a large-scale natural
disaster, such as an earthquake or hurricane.

99
References
Adams,A.L.,T.Schmidt,andC.Newgard.2008.LettertotheEditor.WildernessandEnvironmentalMedicine19(1):74‐76.doi:10.1580/07‐WEME‐LE‐146.1.
Adams,A.L.,T.Schmidt,C.D.Newgard,C.S.Federiuk,M.Christie,S.Scorvo,andM.DeFreest.2007.“SearchisATime‐CriticalEvent:WhenSearchandRescueMissionsMayBecomeFutile.”WildernessandEnvironmentalMedicine18:95–101.doi:10.1580/06‐WEME‐OR‐035R1.1.
AirForceRescueCoordinationCenter(AFRCC).2014.“AirForceRescueCoordinationCenterFactSheet.”CONR‐1AF(AFNORTH).LastmodifiedApril4,2014.http://www.1af.acc.af.mil/library/factsheets/factsheet.asp?id=7497.
Albrecht,Jochen.1995.“SemanticNetofUniversalElementaryGISFunctions.”InProceedings,TwelfthInternationalSymposiumonComputer‐AssistedCartography:232–241.
Bertin,J.(1967)1983.Semiologyofgraphics:Diagrams,networks,maps.Madison,WI:UniversityofWisconsinPress.
Brinkman,S.2013.QualitativeInterviewing.NewYork:OxfordUniversityPressUSA.
Chung,L.,andJ.C.S.doPradoLeite.2009.“OnNon‐FunctionalRequirementsinSoftwareEngineering.”InConceptualModeling:FoundationsandApplications:EssaysinHonorofJohnMylopoulos,editedbyAlexanderT.Borgida,VinayK.Chaudhri,andPaoloGiorgini,363‐379.Berlin:SpringerScience&BusinessMedia.
Cleland,Wes,andShelbyJohnson.2014.“GISUseintheLargestSearch&RescueMissioninArkansasHistory.”presentedatthe6thAnnualSearchandRescueGISMeeting,Dunsmuir,CA,June2014.
Cooper,DonaldC.,JohnR.Frost,andR.QuincyRobe.2003.CompatibilityofLandSARProcedureswithSearchTheory.PotomacManagementGroup,Inc.http://www.uscg.mil/hq/cg5/cg534/nsarc/LandSearchMethodsReview.pdf.
Cutter,Susan.2003.“GIScience,Disasters,andEmergencyManagement.” TransactionsinGIS7(4):439–445.
100 Daniel H. Wagner Associates, Inc. 2005. Computer Assisted Search Planning (CASP) 2.0.
Accessed March 1, 2015. http://www.wagner.com/technologies/
missionplanning/search-optimization/casp2.html.
Doherty, Paul. 2014. “2014 WiSAR GIS Year in Review: Map Tour.” WiSAR and GIS Blog.
Accessed December 16, 2014. http://wisarandgis.blogspot.com/2014/12/2014-
wisar-gis-year-in-review.html.
Doherty, Paul, Qinghua Guo, and Otto Alvarez. 2013. “Expert versus Machine: A
Comparison of Two Suitability Models for Emergency Helicopter Landing Areas in
Yosemite National Park.” The Professional Geographer 65(3).
doi:10.1080/00330124.2012.697857.
Doherty, Paul, Q. Guo, J. Doke, and D. Ferguson. 2014. “An analysis of probability of area
techniques for missing persons in Yosemite National Park.” Applied Geography 47,
99–110. http://www.sciencedirect.com/science/article/pii/S0143622813002506.
Doke, Jared. 2012. “Analysis of Search Incidents and Lost Person Behavior in Yosemite
National Park.” Master’s thesis, University of Kansas.
http://kuscholarworks.ku.edu/dspace/handle/1808/10846.
Durkee, G., and V. Glynn-Linaris. 2012. Using GIS for Wildland Search and Rescue.
Redlands, CA: Esri.
Endsley, Mica R. 1995. “Toward a Theory of Situation Awareness in Dynamic Systems.”
Human Factors 37 (1): 32–64.
Federal Emergency Management Agency (FEMA). 2013. “Incident Commander and
Command Staff Functions.” In ICS100. Accessed February 25, 2015.
https://training.fema.gov/is/coursematerials.aspx?code=IS-100.b.
Ferguson, D. 2008. “GIS for Wilderness Search and Rescue.” In Proceedings of the Esri
Federal User Conference. Accessed September 10, 2014.
http://proceedings.esri.com/library/userconf/feduc08/papers/gis_for_wilderness
_search_and_rescue.pdf.
Fortini, A., K. Zafren, F. Sharp, and C. Shimanski. 2008. Letter to the Editor. Wilderness
and Environmental Medicine 19(1):73. doi:10.1580/07-WEME-LE-146.1.
101
Heggie, T. W., and M. E. Amundson. 2009. “Dead men walking: search and rescue in US
National Parks.” Wilderness and Environmental Medicine 20 (3): 244–249.
doi:10.1580/08-WEME-OR-299R.1.
Hollan, J., E. Hutchins, and D. Kirsh. 2000. “Distributed Cognition: Toward a New
Foundation for Human-Computer Interaction Research.” ACM Transactions on
Computer-Human Interaction 7 (2): 174-196.
Koester, Robert. 2008. Lost Person Behavior. Charlottesville, VA: dbS Productions, LLC.
Kratzke, T. M., L. D. Stone, and J. R. Frost. 2010. “Search and Rescue Optimal Planning
System (SAROPS).” Paper presented at the 13th International Conference on
Information Fusion, Edinburgh, UK, July.
http://www.dtic.mil/dtic/tr/fulltext/u2/a564779.pdf.
LaValla, Patrick, and Robert Stoffel. 1989. "Search and Rescue." In Management of
Wilderness and Environmental Emergencies. 2nd ed, by Paul S. Auerbach, edited by
Edward C. Geehr, 321-358. St. Louis: C.V. Mosby.
Longley, Paul, Michael F. Goodchild, David J. Maguire, and David W. Rhind. 2005.
Geographic Information Systems and Science. 2nd Ed. Hoboken, NJ: John Wiley &
Sons.
MacEachren, Alan M. 2003. “Moving Geovisualization toward Support for Group Work.”
In Exploring Geovisualization, edited by D. Jason, Alan M. MacEachren, and
Menno-Jan Kraak. Amsterdam: Elsevier Ltd.
MacEachren, Alan M., Isaac Brewer, Guoray Cai, and Jin Chen. 2003. “Visually-Enabled
Geocollaboration to Support Data Exploration and Decision-Making.” In
Proceedings of the 21st International Cartographic Conference: 10–16.
MacEachren, Alan M., Guoray Cai, Rajeev Sharma, Ingmar Rauschert, Isaac Brewer,
Levent Bolelli, Benyah Shaparenko, Sven Fuhrmann, and Hongmei Wang. 2005.
"Enabling collaborative geoinformation access and decision‐making through a
natural, multimodal interface." International Journal of Geographical Information
Science 19 (3): 293-317.
MacEachren, Alan M., Robert E. Roth, James O'Brien, Bonan Li, Derek Swingley, and
Mark Gahegan. 2012. “Visual Semiotics and Uncertainty Visualization: An
102
Empirical Study.” IEEE Transactions on Visualization and Computer Graphics 18
(12): 2496-2505. doi:10.1109/TVCG.2012.279.
Miles, Matthew B., and A. Michael Huberman. 1994. Qualitative Data Analysis: An
Expanded Sourcebook. 2nd Ed. Thousand Oaks, CA: SAGE Publications.
National Association for Search and Rescue (NASAR). 2005. Fundamentals of Search and
Rescue. Sudbury, MA: Jones and Bartlett Publishers.
National Wildfire Coordinating Group (NWCG). 2014. GIS Standard Operating
Procedures on Incidents. Accessed April 20, 2015.
http://gis.nwcg.gov/documents/gstop/documents/gstop.pdf.
Pedder, John. 2012. “MapSAR-- Life-Saving Maps.” Presented at Geodesign Summit.
Redlands, CA. http://video.arcgis.com/watch/1001/mapsarlife_dash_saving-
maps.
Peuquet, Donna J. 1988. “Representations of Geographic Space: Toward a Conceptual
Synthesis.” Annals of the Association of American Geographers 78(3): 375-394.
http://www.jstor.org/stable/2563746.
Pfau, L. D. 2013. “Wilderness Search and Rescue: Sources and Uses of Geospatial
Information.” Master’s capstone, Pennsylvania State University.
Phillips, Ken, Maura J. Longden, Bill Vandergraff, William R. Smith, David C. Weber, Scott
E. McIntosh, and Albert R. Wheeler III. 2014. “Wilderness Search Strategy and
Tactics.” Wilderness and Environmental Medicine 25: 166–176.
Robinson, A. C., R. E. Roth, and A. M. MacEachren. 2011. “Understanding User Needs for
Map Symbol Standards in Emergency Management.” Journal of Homeland Security
and Emergency Management 8 (1). doi:10.2202/1547-7355.1811.
Roth, R. E. 2013. “An empirically-derived taxonomy of interaction primitives for
interactive cartography and geovisualization.” IEEE Transactions on Visualization
and Computer Graphics 19 (12): 2356–65. doi:10.1109/TVCG.2013.130.
Roth, R. E. Forthcoming. “Interactive Mapping: What We Know and What We Need to
Know” Journal of Spatial Information Science.
103
Roth, R. E., R. Donohue, C. Sack, T. Wallace, and T. Buckingham. 2015. “A Process for
Keeping Pace with Evolving Web Mapping Technologies.” Cartographic
Perspectives 78, 25-52. doi:10.14714/CP78.1273.
Rubin, Herbert J., and Irene S. Rubin. 1995. Qualitative Interviewing: The Art of Hearing
Data. Thousand Oaks, CA: SAGE Publications.
Sidlar, C. L., and C. Rinner. 2009. “Utility assessment of a map-based online geo-
collaboration tool.” Journal of Environmental Management. 90 (6): 2020–6.
doi:10.1016/j.jenvman.2007.08.030.
Slocum, T. A., R. B. McMaster, F. C. Kessler, and H. H. Howard. 2009. Thematic
Cartography and Geovisualisation. New Jersey: Prentice Hall.
Studt, Al, and Bruce Scott. 2012. “The USNG: It’s Time to Stop Adopting and Start
Implementing.” Florida Fire Service Magazine, October.
Suchan, Trudy A., and Cynthia A. Brewer. 2000. “Qualitative Methods for Research on
Mapmaking and Map Use.” Professional Geographer 52 (1): 145–154.
doi:10.1111/0033-0124.00212.
Tomaszewski, Brian. 2015. Geographic Information Systems (GIS) for Disaster
Management. Boca Raton, FL: CRC Press.
Van Tilburg, Christopher. 2008. Letter to the Editor. Wilderness and Environmental
Medicine 19(1):73-74. doi:10.1580/07-WEME-LE-146.1.
Zerger, Andre, and David Ingle Smith. 2003. “Impediments to Using GIS for Real-Time
Disaster Decision Support.” Computers, Environment and Urban Systems 27: 123–
141. doi:10.1016/S0198-9715(01)00021-7.