MAPPING FOOD GAP - Amazon Web Services · 2015-05-01 · Mapping the Food Gap 2 July 2012 The new...
23
MAPPING THE FOOD GAP: A STUDY OF FOOD INSECURITY IN BREVARD COUNTY, FLORIDA
Transcript of MAPPING FOOD GAP - Amazon Web Services · 2015-05-01 · Mapping the Food Gap 2 July 2012 The new...

MAPPING THE FOOD GAP: A STUDY OF FOOD INSECURITY IN BREVARD COUNTY, FLORIDA

1 Mapping the Food Gap
July 2012
Executive Summary
Dave Krepcho, President/CEO, Second Harvest Food Bank of Central Florida, reported to the 2011 Hunger Summit attendees that in 2006, 51,000 people received food in Brevard County and by 2010, the number had grown to 125,000. This statistic along with other data prompted a closer look at what is happening in Brevard County. The goal of this project was to try to better understand the issues and needs. This study began in late 2011, and identified geographic areas and the populations that may be insufficiently served by the existing food distribution network to work toward reduction and even elimination of food insecurity. The information collected validates that the issue of food insecurity and hunger is complex. We have reported the data available regarding food insecurity and hunger and mapped information that can be mapped, and we encourage a deeper study beyond this report. This study and its findings are thanks to a combined effort by the representatives of the Community Foundation for Brevard, Second Harvest Food Bank of Central Florida, United Way of Brevard, Congregations for Community Action, Harris Corporation, and the Space Coast Health Foundation with underwriting for the web site development work by The Urban Institute National Center for Charitable Statistics from the Schuler Family Fund of the Community Foundation for Brevard. Children’s food insecurity is closely tied to family income levels. In the 2011‐2012 school year, the number of children qualifying for free and reduced lunch, a measure based largely on family income, was 32,306 or 45% of the 71,209 Brevard public school students‐‐ an increase from 2010‐2011 of just more than 2 percentage points or 1,426 children. Of the 32,306 children registered for the program; 20,777 are Pre‐K through elementary school aged. Of the 110 public schools, 23 schools had 70% or more of students qualifying for free and reduced lunch in 2011‐2012. The percentage of children enrolled in the program varied widely among public schools from a low program enrollment of 8% at Edgewood Jr/Sr High School in Merritt Island to a high of 96% at Endeavor Elementary in Cocoa. Measuring food insecurity for the elderly is more difficult. Although the poverty rates for seniors in Brevard (as well as nationwide) are lower than for other age groups, other factors need to be considered. Besides lacking income or liquid assets to cover ordinary monthly food, occupancy, and living expenses, seniors are also at higher risk of having large out‐of‐pocket health care expenditures or mobility issues that may leave them with insufficient food.

2 Mapping the Food Gap
July 2012
The new link on the www.connectbrevard.org web site maps 128 food pantries and a phone survey of the pantries provided additional insights. Most pantries are clustered along a north‐south line running down the center of the county and most are on the public transit route. The heaviest concentrations of pantries are in Titusville, Melbourne, Palm Bay, and Cocoa. One zip code of Palm Bay has no pantries and indicators suggest high poverty rates. Only a small percentage of the food pantries regularly distribute fresh fruits and vegetables. Few pantries offer “wrap around services” to address issues creating the emergency food need. While we mapped accessibility of food pantries to public transportation routes, we did not study other transportation issues, such as the ease of food distribution to the pantries or the challenges faced by recipients faced with limited pantry hours and locations. The food pantries themselves face transportation issues. What happens next? Many new initiatives are already underway, launched soon after data for this report became available. Some of these initiatives are listed in this report. Florida Today has already covered the topic of food insecurity extensively in its community reporting this year. Congregations for Community Action has started convening meetings of food pantries – particularly the smaller, faith‐based pantries– to promote communication, opportunities to learn from and work with each other, and to develop strategies for meeting the needs of underserved areas. Additional groups have indicated a plan to use the report in planning other services. And outreach and communication about this report’s findings will continue. No one organization can alone solve the issues of food insecurity in Brevard County. Food insecurity touches every aspect of community services including homelessness, childhood obesity, health care and health management, elder care, education, family services, and even crime. The Hunger Alliance will continue to develop and launch strategies to address emergency food distribution in Brevard County. Yet, we encourage all organizations to consider how food insecurity impacts their clients and services and consider strategies with volunteers and donors to not only meet the emergency needs, but to begin to look upstream to address the root causes. Feeding America estimated that it will take nearly $39 million dollars to meet the meal gap in Brevard in 2010 – and the numbers are still growing.i
In early 2013, Feeding America will begin work with Second Harvest Food Bank of Central
Florida to conduct an extensive, on‐the‐ground study of its six‐county service area. The last
such report was produced in January 2010. For an extra cost, the outcomes can include
additional interviews and analysis to produce a report of exclusively Brevard County. Our
work concluded with a recommendation for just this kind of follow‐up. In the meantime, we
are encouraged by the focus of the many individuals and organizations using this study to
address emergency food distribution needs in Brevard County.

3 Mapping the Food Gap
July 2012
Contents
Executive Summary ........................................................ 1
Introduction………………………………………………………………….4
Defining Food and Insecurity………………………………………..6
Brevard Indicators of Need ............................................. 7
Children .................................................................... 8
Elderly ..................................................................... 13
Food Distribution .......................................................... 14
Food pantries ......................................................... 15
Soup Kitchens and Other Prepared Meals ............. 16
Weekend and Summer Programs for Children ...... 17
SNAP Recipients ..................................................... 17
SNAP Recipients & Pantries.................................... 19
New Initiatives .............................................................. 18
The Web Site and Other Information Resources .......... 20
Final Thoughts ............................................................... 21
References .................................................................... 22

4 Mapping the Food Gap
July 2012
INTRODUCTION
In the fall of 2011, United Way of Brevard convened community leaders for a Summit around
the topic of Hunger. At the Hunger Summit, data was presented depicting indicators of
growing food insecurity in Brevard County. Small group discussions were initiated to address
the growing needs. Dave Krepcho, Director of Second Harvest Food Bank in Central Florida
presented troubling statistics. In 2006, 51,000 people received food in Brevard County. By
2010, the number of people receiving food jumped to 125,000.ii He illustrated the yearly
Second Harvest food distribution trend line for Brevard, in pounds, on the following chart.
TABLE 1
Source: Second Harvest Food Bank of Central Florida
Dave Krepcho concluded with his agency’s goal to try to conduct a gap study – a map that
illustrated the gap in geographic food distribution and in service, with the purpose to better
understand demand and supply and inform distribution.
Also in the fall of 2011, the Community Foundation for Brevard in partnership with the
Urban Institute’s National Center for Charitable Statistics launched Connect Brevard, a web
site of all Brevard‐registered nonprofits, population data, and other resources and tools
available in Brevard County. A collaborative effort in the food gap study seemed a cost‐
effective and expedient solution. Second Harvest Food Bank and the Community Foundation
leaders met and determined that the most efficient way to literally map the food gap was to
build upon the Connect Brevard platform. A team of advisors assembled that included
representatives of United Way, Congregations for Community Action, Harris Corporation,
Second Harvest, the Community Foundation, and the Urban Institute’s National Center for
Charitable Statistics. Space Coast Health Foundation joined the team later upon

5 Mapping the Food Gap
July 2012
volunteering to assist in the study with a survey of food pantries. Following several months
of data collection, development work, and meetings, the sub‐site of Connect Brevard now
literally maps the data including the known food pantries, public transportation routes, and
public schools. The site also provides the ability to overlay hundreds of community indicators
such as poverty and SNAP/food stamp participation.
The following report summarizes the findings from our analysis of the data and the maps.
The primary goal of the project was to provide more information about Brevard County’s
food insecurity and hunger issues. The goal included identifying geographic areas and the
populations insufficiently served by the existing food distribution network to work toward
reduction and even elimination of food insecurity. The information collected validated that
the issue of food insecurity and hunger is complex. (See section Defining Food Insecurity
and Hunger). Yet, the ability to now see the geographic relationships among risk indicators
may help organizations translate the various reports into priorities for emergency relief and
development.
Local data include food distribution programs and locations and community indicators that
suggest potential food insecurity within zip codes or census tracks. Yet, the local data
provides limited insight regarding household food availability, individual anxiety or
perceptions about food access or quality, disrupted eating patterns or food intake, issues
within existing distribution or resources, or the causes.
We use some state and national data to estimate – albeit with limited precision – answers to
some of these questions, but much remains unknown about both the status of Brevard
residents as well as answers to some more difficult questions – questions that require
deeper research beyond the scope and resources available for this study. The answers from
deeper research will inform solutions that move beyond emergency relief to development
initiatives to address the cause.

6 Mapping the Food Gap
July 2012
DEFINING FOOD INSECURITY AND HUNGER
The terms hunger and food insecurity are often used interchangeably. In 2006, the US
Department of Agriculture asked the Committee on National Statistics of the National
Academies to help further define the issue and the language used. From the USDA website…
“Food insecurity is a household‐level economic and social condition of limited or uncertain access to adequate food.
Hunger is an individual‐level physiological condition that may result from food insecurity.” iii
The Census Bureau conducts the Current Population Survey (CPS) every month; once a year
it includes a supplemental survey on food security completed by approximately fifty
thousand households. The measure of household food security status falls within a range
from "high food security to very low food security based on responses to survey questions.
Table 2 summarizes the four categories:
TABLE 2: USDA's revised labels describe ranges of food securityiv
General categories
(old and new labels
are the same)
Detailed categories
Old label New label Description of conditions in the household
Food security Food security
High food
security
No reported indications of food‐access problems
or limitations
Marginal
food
security
One or two reported indications—typically of
anxiety over food sufficiency or shortage of food in
the house. Little or no indication of changes in
diets or food intake
Food insecurity
Food insecurity
without hunger
Low food
security
Reports of reduced quality, variety, or desirability
of diet. Little or no indication of reduced food
intake
Food insecurity
with hunger
Very low
food
security
Reports of multiple indications of disrupted eating
patterns and reduced food intake
Placement on this continuum is determined by the household’s responses to a series of
questions about behaviors and experiences associated with difficulty in meeting food needs
over a period of 12 months. The questions cover a wide range of severity of food insecurity.v

7 Mapping the Food Gap
July 2012
Most of the data and information collected and discussed in this report relate to the issues
of food insecurity. While a substantial proportion of people who are “food insecure” –
especially those in the ”very low food security” category – may have experienced hunger at
some point in the year, we can only provide rough estimates based on state and national
numbers on the magnitude of this problem in Brevard County.
BREVARD INDICATORS OF NEED
Before looking at the individual indicators that suggest need, consider the most recent
available data on food insecurity. Feeding America’s 2010 Hunger Study found that in
Brevard, 16.4% of the population are food insecure or 88,660 people.vi The percentage
compares with a Florida rate of 19.2% and a national rate of 16.1%. The child food insecurity
rate is estimated to be substantially higher: 24.2% or 25,880 children in Brevard County,
compared to 21.6% nationally and 28.4% in Florida. The rates have dropped nationally since
2009, but increased in Florida. In Brevard, the percentage of the total population increased
in 2010, but the rate for children decreased.
TABLE 3: FOODINSECURITYRATE
Brevard Florida National
2010 2009 2010 2009 2010 2009
TotalPopulation 16.4% 88,660 16.0% 85,460 19.2% 17.1% 16.1% 16.6%
Children 24.2% 25,880 26.2% 28,760 28.4% 27.5% 21.6% 23.2%
Source: Feeding America, Map The Meal Gap Study
The Census Bureau’s Current Population Survey (CPS) Food Security Supplement asked
specifically whether a household ‘was hungry but did not eat’ in the past twelve months.
Applying the national percentage of responses from this question in the December 2010 CPS
Food Security Supplement to Brevard County population statistics, we estimate that
approximately 26,000 Brevard residents went hungry at some point during the twelve
months leading up to the survey. Further, if the national percentages are similar to Brevard,
we would expect approximately 9,000 of those 26,000 residents to have experienced hunger
every month in 2010 while another 11,000 experienced hunger between three and eleven
months of that year.
8 Mapping the Food Gap
July 2012
Two populations are particularly vulnerable to issues of food insecurity – children and the
elderly. The advisory group collected and mapped data on each of these populations. Some
of the information collected is reported in the following sections.
CHILDREN
To determine areas of the county with higher risks of food insecurity among children, the
study advisory group identified several indicators of need, including children enrolled in free
and reduced lunch programs at schools, children benefitting from the federal Supplemental
Nutrition Assistance Program (SNAP ‐‐ formerly Food Stamps), homelessness, and poverty.
The group collected the data available for each of these indicators and, where possible,
mapped the data on the web site by zip code or census tract. The following summarizes
some of the findings.
Free and Reduced Lunch Program
Through a federal government program, schools offer free or reduced price lunch to children
based on their household income. The program’s assumption is that children of lower
income households are more likely food insecure. The percentage of children enrolled in the
free and reduced lunch program varied widely among public schools from a low program
enrollment of 8.32% at Edgewood Jr/Sr High School in Merritt Island to a high of 96% at
Endeavor Elementary in Cocoa.
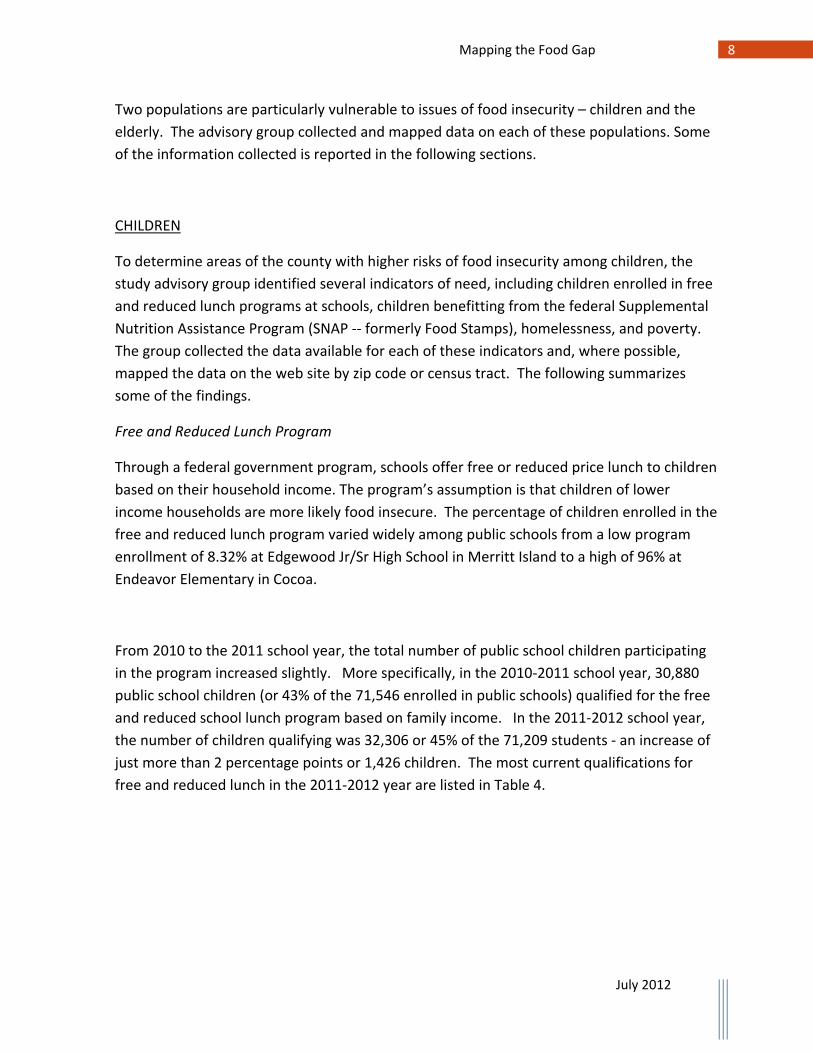
From 2010 to the 2011 school year, the total number of public school children participating
in the program increased slightly. More specifically, in the 2010‐2011 school year, 30,880
public school children (or 43% of the 71,546 enrolled in public schools) qualified for the free
and reduced school lunch program based on family income. In the 2011‐2012 school year,
the number of children qualifying was 32,306 or 45% of the 71,209 students ‐ an increase of
just more than 2 percentage points or 1,426 children. The most current qualifications for
free and reduced lunch in the 2011‐2012 year are listed in Table 4.

9 Mapping the Food Gap
July 2012
TABLE 4
FLORIDA INCOME ELIGIBILITY GUIDELINES
FOR FREE AND REDUCED-PRICE SCHOOL MEALS
Effective From July 1, 2011 To June 30, 2012
FREE MEAL SCALE
Household Size Annual Monthly Weekly
1 14,157 1,180 273
2 19,123 1,594 368
3 24,089 2,008 464
4 29,055 2,422 559
5 34,021 2,836 655
6 38,987 3,249 750
7 43,953 3,663 846
8 48,919 4,077 941
For each additional family member, add
4,966 414 96
REDUCED-PRICE MEAL SCALE
Household Size Annual Monthly Weekly
1 20,147 1,679 388
2 27,214 2,268 524
3 34,281 2,857 660
4 41,348 3,446 796
5 48,415 4,035 932
6 55,482 4,624 1,067
7 62,549 5,213 1,203
8 69,616 5,802 1,339
For each additional family member, add
7,067 589 136
Child Poverty
The 2010 census reports that there are 107,590 children under the age of 18. According to
the US Census Bureau, 2009 American Community Survey, 16.1% of Brevard’s children under
the age of 18 live in poverty. In the 2000 Census, this percentage was 13%, signaling a rising
trend in child poverty.

10 Mapping the Food Gap
July 2012
Based on the 2009 American Community Survey, child poverty rates are highest (28.94%+) in
the entire county area north of Port St. John; West
of I‐95 north of Viera; in Cocoa; in north Rockledge
between Rt. 1 and I‐95; the area surrounding the
corner of Eau Gallie Blvd and Wickham; Indian
River Bluff and south to Vista Grand and west to
Dairy Road; Lund Gardens south to Malabar Rd SW.
(See Graph 1)
Homelessness
Another indicator of food insecurity is
homelessness, a figure that has grown substantially
in Brevard over the past few years. Florida Today
reported in May 2011 that the number of homeless
children more than doubled from 2009 to 2010,
from 478 to 965. In 2011, the number grew to
1093. Forty‐nine Brevard schools (45%) have 10 or
more homeless students. A total of 88 schools
(80%) have at least one homeless child. The HUD
definition of the condition of homelessness has
been modified over the past few years, which may
account for some of the increase.vii Generally, the
term refers to those without a regular dwelling.
Children Benefitting from SNAP ‐ Supplemental Nutrition Assistance Program
The number of children registered as SNAP recipients is 27,558. In the 2002‐2008 American
Community Survey, the total number of SNAP recipients (food stamps) – including adults,
was 48,595. In 2011, the number was 77,349. SNAP is further discussed later in this report,
but mentioned here as an indicator of need. SNAP enrollment is collected by zip code; thus,
it can be mapped and correlated with other geographic indicators.
Putting It All Together
Of the 110 Brevard public schools reporting free and reduced lunch qualification data, 23
schools had 70% or more of students qualifying for free and reduced lunch in 2011‐2012.
These schools are reported in Table 5 comparing the 2010‐2011 and 2011‐2012 school years
and other indicators mentioned, underscoring a high risk of food insecurity among children
in these schools.
GRAPH 1: Child Poverty Rate

11 Mapping the Food Gap
July 2012
TABLE 5
Public School
Zip Code & City/Town
No. of students qualifying for
Free & Reduced Lunch (FAR) (School
Year)
% of students Free & Reduced
Lunch
Number
of children on SNAP in zip code
Pantry within 1 mile?
Public Transport Access within 1 mile?
No. of Home‐less students
USDA Food Desert Year
2010‐2011
Year2011‐2012
Year 2010‐2011
Year2011‐2012
Endeavor Elementary
32922 Cocoa
747 747 96%
96% 2446 Yes Yes 16 Yes
Cambridge Elementary
32922 Cocoa
499 521 90% 92% 2446 Yes Yes 47 Yes
Riverview Elementary
32780 Titusville
300 242 90% 90% 2177 Yes Yes 13 Yes
Crosswinds Alternative
32922 Cocoa
9 8 82% 89% 2446 Yes Yes Yes
Riverdale Country
32907 Palm Bay
101 108 80% 86% 2770 Yes Yes 4 partial
South Lake Elementary
32796 Titusville
322 342 82% 84% 1161 Yes Yes 11 Yes
University Park
32901 Melbourne
441 480 81% 83% 1607 Yes Yes 17 No
Palm Bay Elementary
32905 Palm Bay
659 713 80% 82% 3505 Yes Yes 24 Yes
Fieldston 32780 Titusville
53 63 74% 82% 2177 Yes Yes 3 Yes
Imagine Elementary
32904 Melbourne
398 308 69% 81% 753 No No 5 No
Golfview Elementary
32955 Rockledge
505 555 78% 82% 1411 Yes Yes 13 Partial
Riviera Elementary
32905 Palm Bay
510 599 79% 81% 3505 No Yes 18 Partial
Horace Mann
32955 Rockledge
94 103 78% 80% 1411 Yes Yes 3 Yes
Columbia Elementary
32909 Palm Bay
464 560 77% 79% 2210 No Yes 23 No
John F. Turner, Sr. Elementary
32909 Palm Bay
519 576 77% 79% 2210 Yes Yes 23 No
Saturn Elementary
32926 Cocoa
576 633 73% 78% 1374 No Yes 29 Yes
Coquina Elementary
32780 Titusville
355 393 75% 76% 3871 Yes Yes 7 Yes

Public School
Zip Code & City/Town
No. of students qualifying for
Free & Reduced Lunch
(FAR) (School Year)
% of students
Free & Reduced Lunch
Number
of children on SNAP in zip code
Pantry within
1 mile?
Public
Transport Access within 1 mile?
No. of Home‐less students
USDA Food Desert
Year 2010‐2011
Year2011‐2012
Year 2010‐2011
Year2011‐2012
Jupiter
Elementary
32908
Palm Bay
567 598 75% 75% 1055 No Yes 41 No
Mila
Elementary
32953
Merritt Isl
361 394 72% 74% 1095 Yes Yes 20 No
Discovery
Elementary
32907
Palm Bay
497 550 67% 73% 2770 No Yes 10 No
Harbor City
Elementary
32935
Melbourne
299 323 69% 72% 2300 Yes Yes 10 Yes
Roy Allen
Elementary
32935
Melbourne
378 372 68% 72% 2300 Yes Yes 24 Yes
Campus
Charter
32927
Port St. John
90 94 63% 71% 1384 Yes Yes Yes
Free & Reduced Lunch Data Source: Florida Department of Education, Homeless Students and SNAP Recipients: United Way of
Brevard: USDA
Of the 32,306 children on free and reduced lunch in Brevard Public Schools; 20,777 are Pre‐K
through elementary school aged; 4,715 are middle school students; and 6,814 are high school
students. The number of elementary school children qualifying for the lunch program nearly
doubles all other grades.
Schools with 55% or more of the students qualifying for free and reduced lunch are classified as
Title I schools and eligible for federal funds to improve academic achievement. During the 2011‐
2012 school year, 47 schools had more than 55% of students qualifying for free and reduced
lunch. Of the 47 schools, 34 are elementary schools.
Table 6 cites additional indicators that may be contributing to household food insecurity found
among the 47 schools where 55% of the student population qualifying for free and reduced
lunch.

13 Mapping the Food Gap
July 2012
Table 6
Three (3) of the schools are not within one mile radius of public transportation or a food
pantry.
Heritage High, Palm Bay
Imagine Schools, Melbourne/West Melbourne
Westside Elementary, Palm Bay
Fourteen (14) of these schools are not within a 1‐mile radius of a food pantry:
Clearlake Elementary, Cocoa
Cocoa High, Cocoa
Columbia, Palm Bay
Discovery, Palm Bay
Fairglen, Cocoa
Imagine, Melbourne/West Melbourne
Heritage, Palm Bay
Jupiter, Palm Bay
Odyssey, Palm Bay
Pinewood, Mims
Riviera, Palm Bay
Roy Allen, Melbourne
Saturn, Cocoa
Westside, Palm Bay
Eleven of the fourteen schools without a pantry within a one‐mile radius are located in Palm Bay
and Cocoa.
ELDERLY
Food insecurity among the elderly is not simply a
function of wealth or income but also functional
limitations, as the reports affirm. viii
The elderly in Brevard represent 20.4% of the
population or 110,849 individuals. Most recent
poverty statistics (ACS 2005‐2009) cite 7,413
living in poverty or 6.7% of the elderly
population.
Elderly Poverty
Census tract mapping displays the highest rates
of elderly poverty as 15.07% or greater (ACS 5
year average ‐ 2009). At this definition the
highest elderly poverty rates are nearly the
entire area west of I‐95 and there are very few –
if any – known food pantries west of I‐95. Most
of this geographic area is undeveloped or
conservation and wildlife preserves – but not all.
GRAPH 2: Brevard Elderly Poverty Rate
14 Mapping the Food Gap
July 2012
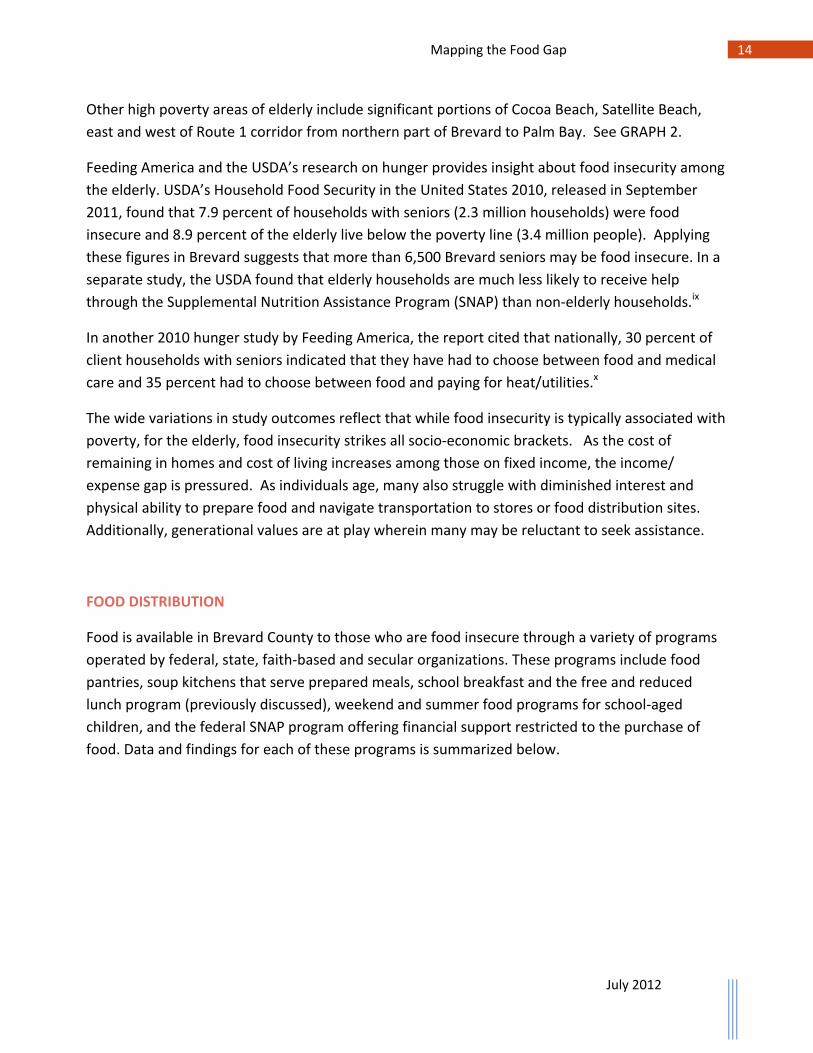
Other high poverty areas of elderly include significant portions of Cocoa Beach, Satellite Beach,
east and west of Route 1 corridor from northern part of Brevard to Palm Bay. See GRAPH 2.
Feeding America and the USDA’s research on hunger provides insight about food insecurity among
the elderly. USDA’s Household Food Security in the United States 2010, released in September
2011, found that 7.9 percent of households with seniors (2.3 million households) were food
insecure and 8.9 percent of the elderly live below the poverty line (3.4 million people). Applying
these figures in Brevard suggests that more than 6,500 Brevard seniors may be food insecure. In a
separate study, the USDA found that elderly households are much less likely to receive help
through the Supplemental Nutrition Assistance Program (SNAP) than non‐elderly households.ix
In another 2010 hunger study by Feeding America, the report cited that nationally, 30 percent of
client households with seniors indicated that they have had to choose between food and medical
care and 35 percent had to choose between food and paying for heat/utilities.x
The wide variations in study outcomes reflect that while food insecurity is typically associated with
poverty, for the elderly, food insecurity strikes all socio‐economic brackets. As the cost of
remaining in homes and cost of living increases among those on fixed income, the income/
expense gap is pressured. As individuals age, many also struggle with diminished interest and
physical ability to prepare food and navigate transportation to stores or food distribution sites.
Additionally, generational values are at play wherein many may be reluctant to seek assistance.
FOOD DISTRIBUTION
Food is available in Brevard County to those who are food insecure through a variety of programs
operated by federal, state, faith‐based and secular organizations. These programs include food
pantries, soup kitchens that serve prepared meals, school breakfast and the free and reduced
lunch program (previously discussed), weekend and summer food programs for school‐aged
children, and the federal SNAP program offering financial support restricted to the purchase of
food. Data and findings for each of these programs is summarized below.

15 Mapping the Food Gap
July 2012
FOOD PANTRIES
A food pantry is a physical location whereby individuals can
pick up food (often canned and nonperishable foods) to take
away and consume off‐site. Nationwide, approximately five
percent of people obtained food from food pantries in 2010.
We don’t have precise numbers for Brevard County but we do
know that the county has 128 food pantries that collect, store,
and distribute food. Eighty‐one, or 63%, are congregations.
Most/all of remaining pantries are part of secular nonprofit
organizations such as the Women’s Center and the Central
Brevard Sharing Center. Many of the faith‐based pantries are
open only a limited number of hours or days per week. Some,
for example, are only open two or three hours per week for
food distribution.
Most pantries are clustered along a north‐south line running
down the center of the county and most are on the public
transit route. The heaviest concentrations of pantries are in
Titusville (24), Melbourne (30) and Palm Bay (16); Cocoa (19).
These are also higher population centers. One zip code of Palm
Bay (south west) has no pantries and indicators suggest higher
poverty rates (SNAP/school free lunch data). (See Graph 3)
The staff of Space Coast Health Foundation conducted a phone survey with results from 47 of the
128 pantries – most Second Harvest partners with Second Harvest supplying the food. Of the 47
participating in the survey, 16 pantries reported food distribution amounts in weight and these 16
pantries collectively distributed 1,445 tons of food in 2011. As a frame of reference, the average
American eats nearly 2,000 pounds or 1 ton of food per year (USDA). Only 6 of the 44 pantries
(14%) ever experienced running out of food. 12 of the 44 pantries report distributing fresh fruits
and vegetables; another 18 distribute fresh fruit and vegetables on occasion based on cost and
availability. About half of the current pantries surveyed could expand with additional space or
equipment (freezers and refrigerators). Sources of financial support include church donations,
thrift store proceeds, and United Way grants. Most of the responding pantries (82%) are staffed
entirely by volunteers. Not all pantries count the number of volunteers that work in the pantry.
Yet, more than 750 volunteers were reported by 22 of the pantries. Thirty seven (37) pantries
GRAPH 3: Brevard Food Pantries
16 Mapping the Food Gap
July 2012
reported specific hours of operation, which averaged 10 hours per week. Of the 37 pantries, 20
pantry sites reported that they are open for distribution 5 hours or less per week.
Second Harvest Food Bank cites distributing in Brevard County more than 4 million pounds of food
in 2011 or 2,000 tons of food.
Few distribution sites provide “wrap‐around services”, i.e. services which go beyond emergency
food relief and walk alongside the recipient and assist in developing strategies to eliminate the
need for emergency food relief. But a few do. One example is Love INC. Those utilizing Love INC
food pantries are flagged at the third visit for a call and home visit to determine the full scope of
recipient issues resulting in the need for emergency food relief. Volunteers are assigned to work
with the recipient after the third food pantry visit to eliminate or reduce reliance on emergency
food distribution.
SOUP KITCHENS AND OTHER PROGRAMS OFFERING PREPARED MEALS
A soup kitchen is the term given to physical locations that offer a prepared meal to eat at the
facility. Twenty one locations throughout Brevard serve a prepared meal daily. Fifteen of the sites
are operated by Aging Matters and serve lunch to senior citizens through its program, Seniors at
Lunch. An additional 6 organizations offer prepared meals to the public. All of the soup kitchens
offer prepared meals at least five days per week.
Aging Matters, a nonprofit organization serving the elderly of Brevard County, cites that there are
approximately 800 individuals receiving Meals on Wheels. Based on the poverty statistics, the
number of elderly receiving these services appears low compared with risk factors.
Aging Matters’ Brevard Community Kitchen prepares and delivers meals ‐ 459,921 meals in 2011 ‐
supporting:
Meals on Wheels Seniors at Lunch Seniors attending Adult Daycare Centers At‐risk children received 12,582 lunches at Brevard County Parks and Recreation Summer
Lunch program A partnership with United Way of Brevard and local corporations, with corporate
employees delivering 2,219 meals on 36 Saturdays
Daily Bread, a nonprofit organization in Melbourne, provided an additional snapshot from an
annual census conducted by the agency each June. In 2011, they interviewed 1,495 meal
recipients during the survey week – an increase from 1,173 people served in the same week in
17 Mapping the Food Gap
July 2012
2010. 35% of those interviewed were new to Daily Bread since the prior year. Currently, they
serve an average of 213 meals a day, 365 days a year or ~76,600 meals per year. In 2011, 60% of
those served were homeless; 72% were males (1,076) and 8% served were children (115). Of the
115 children, 34 were homeless. Of the clients interviewed, 61% take a bus or walk, 15% bike and
24% arrive at the facility in a vehicle. Interesting to note, Daily Bread had a decrease in numbers
served from 2010, which they attribute to the increased number of resources available for food.
WEEKEND AND SUMMER FOOD PROGRAMS FOR CHILDREN
Children’s backpack programs are gaining in community awareness and support. These programs
discreetly provide food for children to take home from school for meals over the weekend. In the
2011‐2012 school year, these programs existed in only 5 schools.
The USDA provides lunch for children during the summer – in 2012 called the Summer Break Spot.
Brevard 211 is handling the marketing of and referral to the program. In 2012, the program is
designed to serve all children – regardless of family income, 18 years old and younger at no
charge. Brevard Public Schools is offering the program at 6 school locations where 50 percent or
more of the children qualify for free and reduced lunch. Free breakfast is also available at these six
school locations. In addition, another 15 sites are located at selected Department of Parks and
Recreation locations. As a base of comparison, Orange County Public Schools has a student
population approximately 2 ½ times larger than Brevard County and in 2012, will have 220
summer lunch locations compared to Brevard’s 21 locations. xi
Previous year statistics suggest only a small percentage of qualifying students participate in
summer feeding programs. This mirrors national trends. Reasons for low participation include lack
of transportation, lack of awareness and lack of available programs.
SNAP RECIPIENTS (Supplemental Nutrition Assistance Program – replaced ‘Food Stamps’)
March 2011 figures report 77,349 SNAP recipients in Brevard County or approximately 14.2% of
the County’s 543,376 residents; 35.6% of the recipients are children. The number of SNAP
recipients in Brevard County is slightly higher than the 2010 state average of 13.8%.xii
Feeding America cites that nationally, 48% of all SNAP participants are children (2009). The
average benefit in Brevard is approximately $100 per person per month. Basic income eligibility for
the program is listed in Table 7. Income exclusions are not noted.

18 Mapping the Food Gap
July 2012
“Households have to meet income tests unless all members are receiving TANF, SSI, or in some places general
assistance. Most households must meet both the gross and net income tests, but a household with an elderly person
or a person who is receiving certain types of disability payments only has to meet the net income test. Households,
except those noted, that have income over the amounts listed below cannot get SNAP benefits.” – USDA xiii
TABLE 7: SNAP Eligibility Guide
(Oct. 1, 2011 through Sept. 30, 2012)
Household size Gross monthly income
(130 percent of poverty)
Net monthly income
(100 percent of poverty)
1 $1,180 $ 908
2 1,594 1,226
3 2,008 1,545
4 2,422 1,863
5 2,836 2,181
6 3,249 2,500
7 3,663 2,818
8 4,077 3,136
Each additional member +414 +319
Source: USDA
The zip codes with the top 10 highest SNAP recipient enrollments as of December 2011 are listed
in Table 8. Melbourne, Palm Bay, and Cocoa zip codes have the highest number of SNAP
recipients.
TABLE 8: Top 10 SNAP Recipient Zip Codes
Zip Code ‐ Jurisdiction Adult Children Total
32935- Melbourne (north of Lake Washington Road,
south of Parkway) 4548 2295 6843
32907 – Palm bay 3918 2770 6688 32922 - Cocoa 4199 2439 6638 32780 - Titusville 3849 2177 6026 32909 – Palm Bay 3214 2202 5416 32905 – Palm bay 3500 1913 5413 32901 - Melbourne 3492 1603 5095 32926 - Cocoa 2483 1374 3857 32927 - Cocoa 2298 1384 3682 32955 - Rockledge 2216 1405 3621

19 Mapping the Food Gap
July 2012
SNAP RECIPIENTS & PANTRIES
Commonly we hear comments and questions about the number of pantries, implying that perhaps
we have too many. Given the wide variation in operational factors, this study did not attempt to
answer that question. Instead, we compared indicators to perhaps identify zip codes wherein the
number of pantries may be insufficient. In Brevard, there is an average of 604 SNAP recipients per
pantry. If the average is considered an acceptable ratio, then the zip codes in Table 9 illustrate
areas where the number of pantries may be below average.
TABLE 9: THE RATIO OF PANTRIES TO SNAP RECIPIENTS PER ZIP CODE GREATER THAN
AVERAGE OF 1 PANTRY PER 604 SNAP RECIPIENTS
Ratio # of Schools #Schools w/ 30%+ #Schools w/ 50%
Zip Code/Town Pantry/ Per Zip FAR FAR
SNAP Recipients
32908 Palm Bay 0/2416 3 3 2
32754 Mims 1/2003 2 2 2
32926 Cocoa 1/1929 3 2 2
32927 Cocoa 1/1841 7 6 4
32952 Merritt Island 1/1571 4 3 0
32920 Cape Canaveral 1/1567 1 1 1
32907 Palm Bay 1/1338 5 5 4
32909 Palm Bay 1/1093 6 6 5
32931 Cocoa Beach 1/1007 3 1 0
32905 Palm Bay 1/903 4 4 4
32935 Melbourne 1/712 11 9 6
32903 Indialantic 0/576 3 0 0
NEW INITIATIVES
Since the Hunger Summit and the work of this study, several organizations have met and
continued discussion and planning. The preliminary maps developed by NCCS in this study have
been used in many of the discussions. Several new initiatives are now underway to further
address the issue of food insecurity in Brevard. These include:
United Way of Brevard convened a Hunger Alliance of community leaders to develop strategies and activities to address hunger. The first goal of the Alliance is putting children’s backpack programs in the top 20 schools of greatest need in the next two years. The United Way is funding the marketing and community outreach to encourage school adoption providing backpack programs for the top 20, high‐need schools.

20 Mapping the Food Gap
July 2012
The Community Foundation for Brevard has funded a grant to Congregations for Community Action to work specifically with smaller pantries and with congregations to improve coordination and service and to engage and develop neighborhood leaders to address the gaps.
The Harris Corporation Charitable Fund of the Community Foundation is providing matching funds to expand the Second Harvest Food Bank facility in Brevard.
The Community Foundation has identified additional resources to support food from Second Harvest for an emerging children’s backpack program.
Second Harvest Food Bank is contemplating a mobile unit to reach areas where pantries do not exist.
United Way is considering the purchase of a truck to aid the northern pantries in acquiring and stocking food.
THE WEB SITE AND OTHER INFORMATION RESOURCES
The original purpose of this study was to map the food gap in Brevard and the goal of mapping has
been accomplished. The Urban Institute, National Center for Charitable Statistics converted a
variety of the data presented herein to a visual map and database on www.connectbrevard.org.
The map includes the following data:
Food pantries, soup kitchens, and summer feeding program sites for children.
Brevard’s Public Schools, school boundaries and one mile radii
Bus routes and stops of public transportation and 1 mile radii
Community Indicators – a significant list of data, generally by zip code or census tracts. Data includes Housing, Poverty, SNAP recipients, USDA Food Deserts – and much more.
Congregations and other nonprofit organizations
The mapping tool enables users to identify the physical location of needs and services as well as
other resource organizations that may be convened to solve issues within proximity. The map was
used extensively to identify gaps cited in this report.
There are many other studies and reports available – many that were used in preparing this
report. Specifically, the USDA also has extensive research and reports available on its website,
http://www.ers.usda.gov/Briefing/FoodSecurity/. Feeding America also collects and reports on
food insecurity, http://feedingamerica.org/hunger‐in‐america/hunger‐studies/map‐the‐meal‐
gap.aspx.

21 Mapping the Food Gap
July 2012
FINAL THOUGHTS
This study and report was designed to compile and present data to better understand and inform
the many organizations and individuals who invest time and resources in addressing the issues and
needs of hunger and/or food insecurity in Brevard County. The new web site serves as a resource
and tool for analysis, mapping and planning. The information is based on data available to the
team from a variety of sources. Some information may be missing. As an example, we may not be
aware of some organizations that provide food distribution for a discrete community and are
unpublicized. Yet, the growing size of food distribution deserved mapping and reporting what we
do know as a first step in planning for improved efficiency and effectiveness in serving the food
insecurity needs.
Some of the new initiatives are already discovering that dialogue among food distributors is
valuable to share best practices, find opportunities for collaboration and mutual support, and
eliminate barriers to access for those in need. The current network of distribution is designed for
emergency relief, yet many users of the network are chronically in need and the system does not
adequately address longer‐term strategies to reduce need and prolonged dependency among
those who may be capable of self‐sufficiency.
There is more to be learned. The significant and growing amount of food collected and
distributed throughout the County coupled with increased rate of food insecurity in the total
population suggests a worsening condition for Brevard County. The estimated funding needed to
fully address the issue is staggering— estimated by Feeding America in the 2010 study as $38
million dollars a year for Brevard County alone. Such estimates compel an equally important
understanding of the demand side of this issue – which this study did not undertake. Additional
study questions might include who are the recipients and what is driving the growth in food
distribution? To what degree are residents food insecure – and by USDA definition, hungry? How
can services be modified to address client conditions that result in food insecurity? What do we
need to understand upstream about the root causes of food insecurity, and what solutions will
help Brevard residents become more secure, more self‐sufficient or less dependent on food
support? Feeding America conducted such a study in 2008 for the five counties served by Second
Harvest Food Bank of Central Florida. The study will be repeated in early 2013 and may serve as a
good starting place to better understand the needs of those who are food insecure to create
additional strategies beyond emergency assistance to eliminate/reduce chronic food insecurity.
As we ask these questions, we are mindful of the needs of children, those with disabilities, those
with unexpected changes in income, and the elderly on fixed incomes who are victims of
circumstances. While we work toward answers, it remains important to ensure that these
individuals ‐ who are in need ‐ do not go hungry.

22 Mapping the Food Gap
July 2012
Report prepared by:
Sandi Scannelli
Community Foundation for Brevard
Advisor: Tom Pollak, The Urban Institute, National Center for Charitable Statistics
June 22, 2012
Website Development:
The Urban Institute, National Center for Charitable Statistics
Project Team:
Karen Boussard, Second Harvest Food Bank, Central Florida
Janice Everson, Congregations for Community Action
Sheldon Fox, Harris Corporation
Johnette Gindling, Space Coast Health Foundation
Keith Heinly, United Way of Brevard
Kevin Howald, Harris Corporation
Dave Krepcho, Second Harvest Food Bank, Central Florida
Liz Lee, United Way of Brevard
Jennifer Masson, Community Foundation for Brevard
Tom Pollak, The Urban Institute, National Center for Charitable Statistics
Sandi Scannelli, Community Foundation for Brevard
Project Funding:
The Schuler Family Fund of the Community Foundation for Brevard
i http://feedingamerica.org/hunger‐in‐america/hunger‐studies/map‐the‐meal‐gap.aspx ii Hunger in Central Florida, Second Harvest Food Bank of Central Florida, 2011 iii http://www.ers.usda.gov/Briefing/FoodSecurity/labels.htm (6/18/2012) iv http://www.ers.usda.gov/Briefing/FoodSecurity/labels.htm (6/18/2012) v http://www.ers.usda.gov/Briefing/FoodSecurity/measurement.htm#how vi http://feedingamerica.org/hunger‐in‐america/hunger‐studies/map‐the‐meal‐gap.aspx. The county
estimates from Feeding America are based on a model developed using the Current Population Survey
Food Security Supplement. vii http://www.hudhre.info/documents/HEARTH_HomelessDefinition_FinalRule.pdf viii http://feedingamerica.org/hunger‐in‐america/hunger‐facts/senior‐hunger.aspx ix http://frac.org/initiatives/addressing‐senior‐hunger/seniors‐and‐snapfood‐stamps/ x http://feedingamerica.org/hunger‐in‐america/hunger‐facts/senior‐hunger.aspx xi Second Harvest Food Bank of Central Florida, 2012 Summer Food Service Program Report xii http://frac.org/reports‐and‐resources/reports‐2/ xiii http://www.fns.usda.gov/snap/applicant_recipients/eligibility.htm (6/18/2012)