Mapping European lobster (Homarus gammarus) movement and ... · The European lobster, Homarus...
15
Lobster movement via Acoustic Telemetry October 2013 1 Mapping European lobster (Homarus gammarus) movement and habitat-use via acoustic telemetry – Implications for management Final Progress Report Daniel J. Skerritt 1 , Clare Fitzsimmons 1 , Mike H. Hardy 2 , Nicholas V.C. Polunin 1 1) School of Marine Science & Technology Newcastle University Newcastle upon Tyne NE1 7RU 2) Northumberland Inshore Fisheries & Conservation Authority Unit 60B South Nelson Road Cramlington Northumberland NE23 1WF Final Report to The Marine Management Organisation October 2013
Transcript of Mapping European lobster (Homarus gammarus) movement and ... · The European lobster, Homarus...

Lobster movement via Acoustic Telemetry October 2013
1
Mapping European lobster (Homarus gammarus) movement and
habitat-use via acoustic telemetry – Implications for
management
Final Progress Report Daniel J. Skerritt1, Clare Fitzsimmons1, Mike H. Hardy2, Nicholas V.C. Polunin1
1) School of Marine Science & Technology
Newcastle University
Newcastle upon Tyne NE1 7RU
2) Northumberland Inshore Fisheries & Conservation Authority
Unit 60B South Nelson Road
Cramlington
Northumberland
NE23 1WF
Final Report to
The Marine Management Organisation
October 2013

Lobster movement via Acoustic Telemetry October 2013
2
Report to be cited as:
Skerritt, D.J., Fitzsimmons, C., Hardy, M.H., Polunin, N.V.C. (2013) Mapping European lobster (Homarus
gammarus) movement and habitat-use via acoustic telemetry – Implications for management. Progress
report to the Marine Management Organisation. Oct 2013

Lobster movement via Acoustic Telemetry October 2013
3
INTRODUCTION AND RATIONALE
1.1 Introduction
The reported collapse of many major finfish stocks underscores the immediate importance of managing
remaining shellfish stocks that could experience increased fishing pressure as fishing efforts are diverted
from fin-fisheries to shellfisheries [1, 2]. The European lobster, Homarus gammarus, supports one of the
most valuable fishery in the UK, yet stocks of several shellfish species, including European lobster are
considered to be fully exploited, and the UK government is seeking improved management of key shellfish
resources [3, 4]. It is recognised that there are significant gaps in knowledge regarding habitat-use and
movements of H. gammarus [5], which directly influences our ability to determine distribution, an important
determinant of stock structure [6]. Published material on demographic, temporal and spatial patterns of
distribution and movement are insignificant compared to that of fin-fish or H. americanus [7] (Fig.1). Despite
shellfisheries accounting for 35% of total UK landings by weight, studies that do exist are either limited
spatially [8] or methodologically [7, 9], conducted on hatchery reared lobster [10], ex situ [11], or more often
inferred from the American species. There is a danger in freely interpreting results from one species to
another [12], and accurate information on Homarus gammarus is urgently required.
One of the largest foreseeable changes to future marine management and enforcement will undoubtedly be
the introduction of a network of MPAs throughout UK waters; however, we still know relatively little about
the potential ecological, environmental, and social affects, in comparison to the wealth of knowledge
accrued in tropical or coral reef environments [13]. To understand how MPAs impact shellfish stocks, it is
vital that data on movements and distributions is made available. Traditionally shellfish studies are
conducted using baited traps, which restrict the user to discrete point data at the risk of misinterpreting
0
20
40
60
80
100
120
140
1970 1975 1980 1985 1990 1995 2000 2005 2010
Publications per Year
H. americanus
0
20
40
60
80
100
120
140
1970 1975 1980 1985 1990 1995 2000 2005 2010
Publishings per Year
H. gammarus
H. americanus
0
20
40
60
80
100
120
140
1970 1975 1980 1985 1990 1995 2000 2005 2010
Publishings per Year
H. gammarus
H. americanus
Figure 1. Search results from Web of Knowledge for “Homarus gammarus” and “Homarus americanus”
showing number of published papers by year.
050100150
1970
H. gammarus
Lobster movement via Acoustic Telemetry October 2013
4
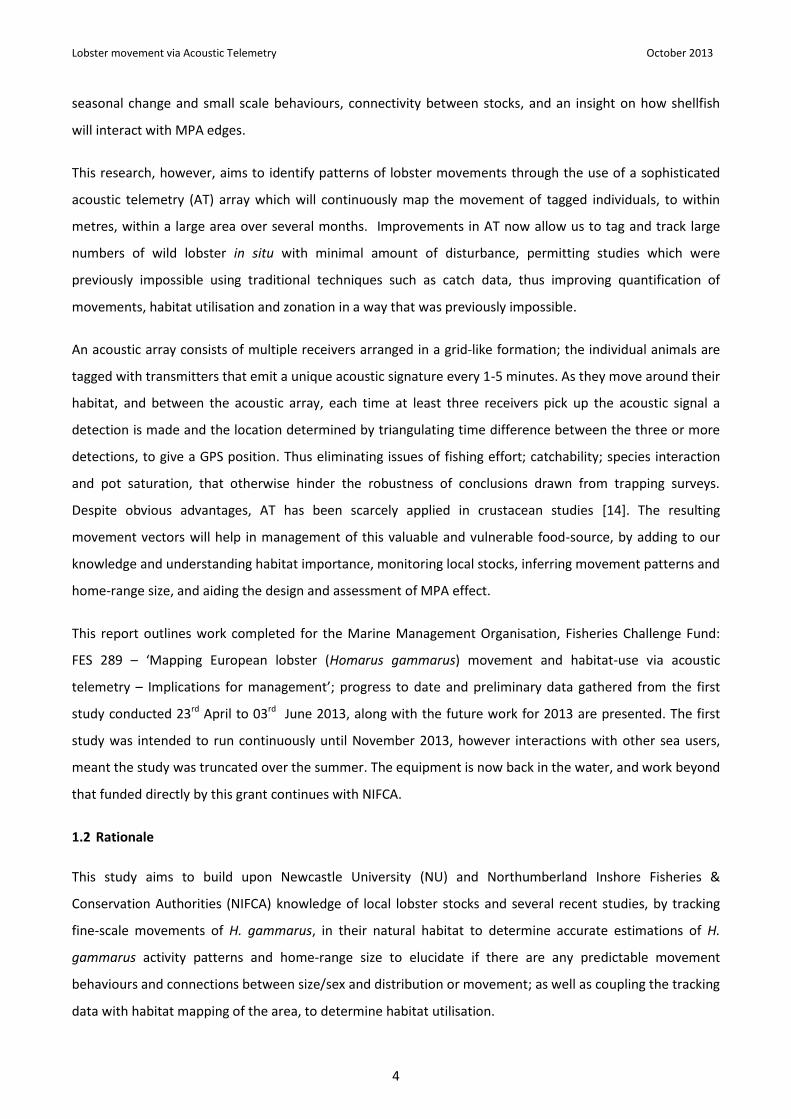
seasonal change and small scale behaviours, connectivity between stocks, and an insight on how shellfish
will interact with MPA edges.
This research, however, aims to identify patterns of lobster movements through the use of a sophisticated
acoustic telemetry (AT) array which will continuously map the movement of tagged individuals, to within
metres, within a large area over several months. Improvements in AT now allow us to tag and track large
numbers of wild lobster in situ with minimal amount of disturbance, permitting studies which were
previously impossible using traditional techniques such as catch data, thus improving quantification of
movements, habitat utilisation and zonation in a way that was previously impossible.
An acoustic array consists of multiple receivers arranged in a grid-like formation; the individual animals are
tagged with transmitters that emit a unique acoustic signature every 1-5 minutes. As they move around their
habitat, and between the acoustic array, each time at least three receivers pick up the acoustic signal a
detection is made and the location determined by triangulating time difference between the three or more
detections, to give a GPS position. Thus eliminating issues of fishing effort; catchability; species interaction
and pot saturation, that otherwise hinder the robustness of conclusions drawn from trapping surveys.
Despite obvious advantages, AT has been scarcely applied in crustacean studies [14]. The resulting
movement vectors will help in management of this valuable and vulnerable food-source, by adding to our
knowledge and understanding habitat importance, monitoring local stocks, inferring movement patterns and
home-range size, and aiding the design and assessment of MPA effect.
This report outlines work completed for the Marine Management Organisation, Fisheries Challenge Fund:
FES 289 – ‘Mapping European lobster (Homarus gammarus) movement and habitat-use via acoustic
telemetry – Implications for management’; progress to date and preliminary data gathered from the first
study conducted 23rd April to 03rd June 2013, along with the future work for 2013 are presented. The first
study was intended to run continuously until November 2013, however interactions with other sea users,
meant the study was truncated over the summer. The equipment is now back in the water, and work beyond
that funded directly by this grant continues with NIFCA.
1.2 Rationale
This study aims to build upon Newcastle University (NU) and Northumberland Inshore Fisheries &
Conservation Authorities (NIFCA) knowledge of local lobster stocks and several recent studies, by tracking
fine-scale movements of H. gammarus, in their natural habitat to determine accurate estimations of H.
gammarus activity patterns and home-range size to elucidate if there are any predictable movement
behaviours and connections between size/sex and distribution or movement; as well as coupling the tracking
data with habitat mapping of the area, to determine habitat utilisation.

Lobster movement via Acoustic Telemetry October 2013
5
Results will help in management of this valuable and vulnerable food-source, by adding to our knowledge
and understanding by locating habitats of importance, monitoring local stocks, inferring movement patterns
and home-range size, and aiding the design and assessment of MPA effect.
Objectives are to:
use an AT array to track small scale movements of H. gammarus
determine relationships between habitat and movement
establish connections between size/sex and movements
determine size of home range
METHODOLOGY
2.1 Study Area
The study is being conducted within the NIFCA district, specifically the south of the district, focused around
the port of Blyth (Fig. 2). Potting within the region is restricted by the available habitat for target species and
potential conflict with other gear types, particularly trawlers. The trap fishery targets four main species:
European lobster (H. gammarus), brown crab (Cancer pagurus), velvet swimming crab (Necora puber) and
prawns (Nephrops norvegicus). Many fishers use an assortment of trap type; the majority being multi-
purpose, and deployed on various ground types at different times of year to target particular species. There
are ~132 shellfish permit holders operating within the district with ~31 vessels <10m in length registered at
the Port of Blyth, of which 12 are potting vessels. Each has the ability to fish up to 800 traps within 6 nm of
shore, and 95% of all Blyth potting activity occurs within the surrounding 190km2 [15].
Figure 2. Northumberland coastline, the NIFCA district boundaries and major fishing ports

Lobster movement via Acoustic Telemetry October 2013
6
The study site was identified based on previous survey sites and NIFCA and NU knowledge; the location has
been well studied and is positioned 2 km due East of the Port of Blyth, allowing for easy access (approx.
55°07’46N, -01°26’89W) (Fig. 3). The site ranges in depth from ~20 m at the south eastern end to maximum
depths of no greater than 31 m, habitat also with the site composed of a mixture of hard and soft substrate,
but predominated by rock and cobble forming distinct areas of complex habitat; one large rocky-reef runs
from the north-west to southern centre of the site, with coarse sand and mud throughout (Fig. 3). Remote
from any significant features this site is regarded as a “typical” inshore habitat. In previous fishing studies
within the area, the catch of crab and lobster has been predictable by the underlying habitat, with the
largest lobster catches coming from within the rocky habitat, and much lower lobster catch and
subsequently larger crab catches coming from within the softer sediment areas.
2.2 Range Test
The concept of the range-test is to determine the range that the VR2W’s (Fig. 4a) can accurately detect the
acoustic signal from the V13 tags (Fig. 4c), as benthic complexity and the presence of hard objects can
interfere with an acoustic signal the range test was split firstly, over softer more homogenous habitat and
secondly over hard more complex habitat. The array consisted of using nine receivers arranged in an ‘L’
shape, with receivers approximately 100 m apart and the V13 tags at either end of the line of six receivers
Figure 3. Study site showing the locations of the hydrophones (●), overlaid on top of a habitat map of hardness for
the area, showing rock in red, sand in yellow and green and silt in blue and purple.

Lobster movement via Acoustic Telemetry October 2013
7
Range test fieldwork commenced on the 21st November 2012, and involved three days at sea; to set the first
test situated over soft sediment (21/11/2012); to download data from the first range-test and to relocate
the receivers for the second range-test over harder sediment (30/11/2012); and to download data from the
second range-test (12/12/2012).
At both sites higher tides produced a decrease in detection %, with a variation between 50-80 % detection
for Test 1 (hard substrate), and from 60-100 % detection for Test 2 (soft substrate), during rising or falling
tides. During Test 2 high tides also showed a calming effect to hourly variations in detection %. Tidal and
wave noise were found not to have an effect, especially as distance from transmitter increases, but this is
unavoidable. Wind and poor weather, however, had no discernible effect during both tests, despite very
strong winds being present.
The range tests showed the tags to be well suited to the location, with the softer sediment test having good
(~50 % detection) range up to 600 m and very good range (~80 % detection) at 300 m. Test 2 on the harder
substrate, had good range (~85 % detection) up to 400 m and poor range (~20 % detection) up to 580 m.
Therefore receivers were spaced approximately 300-400 m apart during the full study.
2.3 Data Collection
Figure 4. Images of a. VR2W acoustic receiver; b. Receiver and transmitter rigged to a hard trawl float and surface dahn and buoy; c. V13 range test tag (transmitter)
a. b.
c.

Lobster movement via Acoustic Telemetry October 2013
8
Several days prior to the setting of the array of 12 VR2W receivers, two strings of eight baited parlour traps
were set in the middle of the site, to catch a range of lobsters for tagging. Lobster from the subsequent catch
were selected, tagged with Hallprint, T-bar ID tags and also fitted with a Vemco, V13 Coded Transmitters (6g
in water, ~10% body weight), and released in their capture location with as little disturbance and time out of
water as possible. Catching, tagging and releasing the lobster at least one day prior to the start of the study
meant they would be accustomed to the tag, and would have fallen back into natural behavioural routine.
The lobsters were selected to get an equal ratio of male and females, and to get a size distribution similar to
that of the natural population. The morphometric data of the tagged lobsters is shown in Table 1, it shows
that the male lobsters tagged were slightly smaller on average than the females.
Table 1. Showing Tag ID’s, sex, size and release date and location for all tagged lobster
Figure 5. Boxplots showing the size distribution of the two sexes tagged.

Lobster movement via Acoustic Telemetry October 2013
9
Once tagged and released the V13 tags will emit an acoustic ‘ping’ at 69 kHz and delay of 200-400 seconds,
to give high resolution data, considering their walking speeds (2.5m^-min max [16]). This ping includes an ID
number which allows identification of the specific tag, which will stop pinging after 12 months, to avoid lost
tags, through ecdysis or other, impeding future data.
The approach to continuously and accurately monitor the movements of lobsters over a large area, used an
array of 12 Vemco, VR2W Single Channel Receivers (consisting a hydrophone, receiver, ID detector, data
logging memory, and battery in submersible case), arranged in a grid-like formation, approximately 350 m
apart, covering an area upwards of 1km^2 (Fig. 3) [17]. Each hydrophone was also set with a unique synctag
co located, and receiver R6 also had a second synctag that monitored, salinity, depth and temperature.
However, due to interactions with local commercial drift net fishermen, this was not achievable, and to
avoid equipment loss for both parties it was decided to withdraw the array for the months of June, July and
August. The equipment was replaced on 17/10/2013; giving us one month of data at the beginning of the
season, and over one month of data at the end of the season. For this reason we have only received data
from the first period of data gathering (23/04/2013 – 03/06/2013).
2.4 Analysis
Full analysis of the data will not be conducted until after all data from the study has been collected in early
2014. Analysis of the preliminary set of data from the first study period will be kept to a minimum, but will
include; elucidating the movements of each individual from the raw data, mapping of 50 % and 95 % home
range of each individual. Once all data is collected the full analysis will be much more sufficient, and will
include looking at the habitat hardness in relation to movements and distributions, looking at size and sex
related differences between movement and home range.
PRELIMINARY RESULTS
In the VEMCO Positioning System the nature of error is very complex, and understanding error in VPS results
has been a challenge. VPS does not provide calibrated accuracy estimates for calculated positions measured
in terms of distance. Instead, it provides a relative, unitless estimate of how sensitive a calculated position is
to errors in its inputs; this is referred to as horizontal position error (HPE).
Therefore, the first process once we received the raw data, which comprised of 112,623 individual positions
for both the 42 tagged animals and the 13 synctags, was to eliminate positions with large HPE values, which
are the positions with the most error. These positions tend to be those from outside the immediate study
area, as animals are moving from the area, therefore removing these data points, is not believed to impact
the results at all, we removed 1,1882, (~1.7%) of the positions.

Lobster movement via Acoustic Telemetry October 2013
10
Figure 6. All female positions, individuals are distinguished by the colour of the marks. The
underlying habitat layer shows hardness, from rock (red) to mud (purple)
Figure 7. All male positions, individuals are distinguished by the colour of the marks. The
underlying habitat layer shows hardness, from rock (red) to mud (purple)

Lobster movement via Acoustic Telemetry October 2013
11
Of the 42 animals tagged, data was collected for 41 of them; one male was not observed in the study, they
may have migrated from the study area prior to the setting of the hydrophones, their tags may have stopped
working, or they could have been removed in another manner.
In total there were 23,504 verified and accurate positions for the 20 female tagged lobsters (min; 45, max;
3,970), and 22,006 for the 21 male tagged lobsters (min; 12, max; 2,506), these can be seen in figures 6 and
7 respectively.
From the remaining positions we estimated both the 95 % and 50 % utilisation distribution, using kernel
density estimator, for males and females (Worton 1989). 95 % and 50 % utilisation distribution can be seen
for males only in figure 8 and 9 respectively.
Further analysis will be conducted once all the data has been gathered; this will include the estimation of a
minimum convex polygon of average daily home ranges for both males and females for both time periods
(beginning of summer and end of summer). It will also include much more in depth analysis of the
relationships between home range, and utilisation distribution and size and sex, as well as looking at the
time spent on each of the various habitat hardness’ within the array.
Figure 8. Map showing individual male lobster 95% UD, overlaid on a map of hardness

Lobster movement via Acoustic Telemetry October 2013
12
PROBLEMS AND ASSUMPTIONS
Several problems arose during the study, many of which restricted the scope of achievement in the short
term. However, initial results are positive and the MMO will be provided with copies of all resultant
publications on the basis of the full data set in the coming year.
Delays in funding and the subsequent ordering of the equipment meant the range test could not be
completed on schedule and was delayed until the winter of 2012. Further restrictions meant the full array
was not implemented until the end of April 2013. Only six weeks into the full array deployment, interactions
with other sea users forced the project to be suspended temporarily until September 2013. It is thought that
with no further delays or interruptions the study will be complete by early 2014.
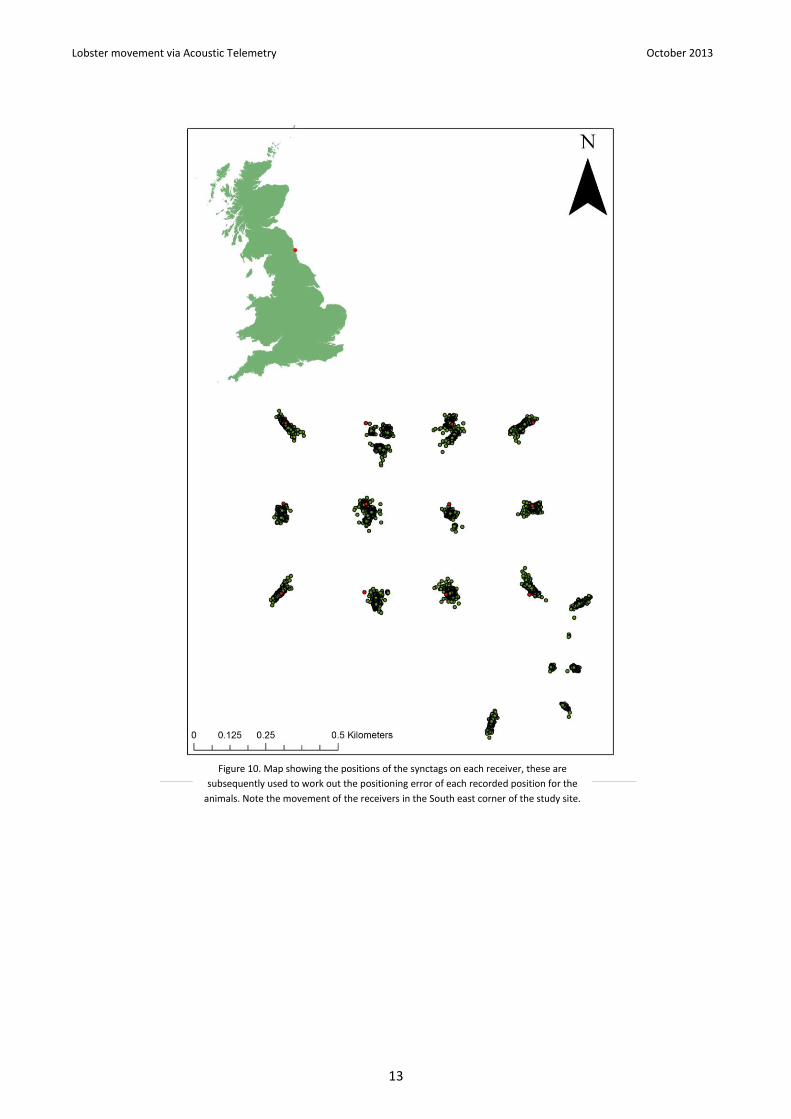
Further interactions with other sea users, has also added some degree of error to the position data, as the
hydrophone receivers were dragged and moved about by other vessels (figure 10.), however, much of this
error is able to be removed, by the complex processing carried out by VEMCO. The placement of the
synctags on the receivers themselves means that the movement can be accounted for in the subsequently
recorded positions of each animal tag.
Figure 9. Map showing individual male lobster 50% UD, overlaid on a map of hardness
Lobster movement via Acoustic Telemetry October 2013
13
Figure 10. Map showing the positions of the synctags on each receiver, these are
subsequently used to work out the positioning error of each recorded position for the
animals. Note the movement of the receivers in the South east corner of the study site.
Lobster movement via Acoustic Telemetry October 2013
14
THE NEXT STEPS
Once all the data has been gathered, processed and erroneous positions removed, full and in depth analysis
will be able to commence. The results from which will be the first of their kind in England, and will help to
inform fisheries managers, and spatial planners on the distribution and small scale movements of lobster
within the North Sea, which is paramount when attempting to manage shellfish stocks or implement marine
protected areas.
The project so far has successfully completed the two planned range tests for the primary site, and the full
study using 42 tagged animals in April-June 2013. As previously mentioned, interactions with other sea users
put a risk to leaving the equipment in the water for the entire duration planned. So two short study periods
will be analysed instead, due to this interruption for more than three months, the project is now planned for
completion by early 2014.
This document forms the final report to the Marine Management Organisation, for the project; BH120694–
‘Mapping European lobster (Homarus gammarus) movement and habitat-use via acoustic telemetry –
Implications for management’.

Lobster movement via Acoustic Telemetry October 2013
15
REFERENCES
1. Myers, R.A. and B. Worm, Rapid worldwide depletion of predatory fish communities. Nature, 2003. 423(6937): p. 280-283.
2. Pauly, D., et al., Fishing down marine food webs. Science, 1998. 279(5352): p. 860-863. 3. Lake, N. and S. Utting, English Shellfish Industry Development Strategy: 'Securing the industry's
future'. Shellfish Association of Great Britain, Seafish, 2007. 4. Bannister, R.C.A., Towards a National Development Strategy for Shellfish in England, Report for the
Sea Fish Industry Authority. 2006. 5. Bannister, R.C.A. and J.T. Addison, Enhancing lobster stocks: A review of recent European methods,
results, and future prospects. Bulletin of Mar. Sci., 1998. 62(2): p. 369-387. 6. Bowlby, H.D., J.M. Hanson, and J.A. Hutchings, Stock structure and seasonal distribution patterns of
American lobster, Homarus americanus, inferred through movement analyses. Fisheries Research, 2008. 90(1-3): p. 279-288.
7. Smith, I.P., et al., Movement of wild European lobsters Homarus gammarus in natural habitat. Marine Ecology-Progress Series, 2001. 222: p. 177-186.
8. Sheehy, M.R.J. and A.E. Prior, Progress on an old question for stock assessment of the edible crab Cancer pagurus. Marine Ecology-Progress Series, 2008. 353: p. 191-202.
9. Lindley, S.T., et al., Marine migration of North American green sturgeon. Transactions of the American Fisheries Society, 2008. 137(1): p. 182-194.
10. Cote, D., et al., Microhabitat use of juvenile Atlantic cod in a coastal area of Newfoundland determined by 2D telemetry. Marine Ecology-Progress Series, 2003. 265: p. 227-234.
11. Holthuis, L.B., BIOLOGICAL RESULTS OF UNIVERSITY OF MIAMI DEEP-SEA EXPEDITIONS .106. LOBSTERS OF SUPERFAMILY NEPHROPIDEA OF ATLANTIC OCEAN (CRUSTACEA-DECAPODA). Bulletin of Marine Science, 1974. 24(4): p. 723-884.
12. Mercer, J.P., et al., An overview of the LEAR (Lobster Ecology and Recruitment) project: results of field and experimental studies on the juvenile ecology of Homarus gammarus in cobble. Marine and Freshwater Research, 2001. 52(8): p. 1291-1301.
13. Sale, P.F., et al., Critical science gaps impede use of no-take fishery reserves. Trends in Ecology & Evolution, 2005. 20(2): p. 74-80.
14. Guerra-Castro, E., C. Carmona-Suarez, and J.E. Conde, Biotelemetry of crustacean decapods: sampling design, statistical analysis, and interpretation of data. Hydrobiologia, 2011. 678(1): p. 1-15.
15. Turner, R.A., et al., Defining the Northumberland Lobster Fishery. Report to the Marine and Fisheries Agency, London., 2009.
16. Aiken, D.E. and S.L. Waddy, Aquaculture. In: Factor, J.R. ed. Biology of the lobster Homarus americanus. New York, Academic Press., 1995: p. 153-175.
17. Tremblay, M.J., et al., Associations of lobsters (Homarus americanus) off southwestern Nova Scotia with bottom type from images and geophysical maps. Ices Journal of Marine Science, 2009. 66(9): p. 2060-2067.


![Understanding Ocean Acidification: what will be the ... · Palamon elegans 30 days Kurihara (2008) Palamon serratus 30 days Lobster (European) Hommarus gammarus (larvae) [8.10, 7.84]](https://static.fdocuments.in/doc/165x107/5e2462d3707e4f09b8333ed7/understanding-ocean-acidification-what-will-be-the-palamon-elegans-30-days.jpg)