Ageing the European lobster Homarus gammarus by the lipofuscin ...

Northeast Fisheries Science Center Reference Document 21-03
Economic Profile for American Lobster (Homarus Americanus) Fleets
in the Northeastern United States
March 2021

Northeast Fisheries Science Center Reference Document 21-03
Economic Profile for American Lobster (Homarus Americanus) Fleets
in the Northeastern United States
by Chao Zou1, Eric Thunberg2, Greg Ardini2
1Integrated Statistics, 16 Sumner Street, Woods Hole, MA 02543 (in support of NOAA Fisheries, Greater Atlantic Regional Fisheries Office)
2NOAA Fisheries, Northeast Fisheries Science Center, 166 Water Street, Woods Hole, MA 02543
US DEPARTMENT OF COMMERCE National Oceanic and Atmospheric Administration
National Marine Fisheries Service Northeast Fisheries Science Center
Woods Hole, Massachusetts
March 2021

Northeast Fisheries Science Center Reference Documents This series is a secondary scientific series designed to assure the long-term documentation and to enable the timely transmission of research results by Center and/or non-Center researchers, where such results bear upon the research mission of the Center (see the outside back cover for the mission statement). These documents receive internal scientific review, and most receive copy editing. The National Marine Fisheries Service does not endorse any proprietary material, process, or product mentioned in these documents. If you do not have Internet access, you may obtain a paper copy of a document by contacting the senior Center author of the desired document. Refer to the title page of the document for the senior Center author’s name and mailing address. If there is no Center author, or if there is corporate (i.e., nonindividualized) authorship, then contact the Center’s Woods Hole Laboratory Library (166 Water St., Woods Hole, MA 02543-1026). Information Quality Act Compliance: In accordance with section 515 of Public Law 106-554, the Northeast Fisheries Science Center completed both technical and policy reviews for this report. These predissemination reviews are on file at the NEFSC Editorial Office. This document may be cited as:
Zou C, Thunberg E, Ardini G. 2021. Economic profile for American lobster (Homarus Americanus) fleets in the Northeastern United States. US Dept Commer, Northeast Fish Sci Cent Ref Doc. 21-03; 24 p.

1
This document provides an economic profile for the American lobster vessels in the Northeastern United States by using cost surveys conducted by the Social Sciences Branch (SSB) of the Northeast Fisheries Science Center (NEFSC) for calendar years 2011, 2012 and 20151. Results from this analysis could inform fishermen, fishery managers, researchers, and the general public about the economic health of the American lobster (Homarus Americanus) fishery.
INTRODUCTION The American lobster fishery in the Northeastern United States is one of the most valuable
fisheries in the country. Atlantic Coastal Cooperative Statistics Program (ACCSP) data show that before 1980, total lobster landings remained stable between 30 and 40 million pounds per year. From 1980 to 2000 the annual landings almost doubled, reaching 86 million pounds in 2000 (ACCSP 2019). Since then, landings have continued to increase through 2016, reaching a record high of 158 million pounds with a dockside value of $670 million. From 2014 to 2018, the ex-vessel value of American lobster has surpassed the sea scallop fishery to become the most valuable single-species fishery in the Northeast United States. (Figure 1).
For years, the lobster fishery has not only generated consistent revenue for fishing fleets along coastal New England and Mid-Atlantic states, but it also created large economic impacts in fishing-related industries such as distributing, processing, gear manufacturing, vessel building and maintainance, marine supplies, tourism, and so on. For example, Maine landed more than 130 million pounds of lobsters in 2016 with a dockside value of $538 million. The wholesale distribution network of Maine lobster dealers contributed more than $1 billion to the state’s economy and supports more than 4,000 jobs (Donihue and Tselikis 2018).
However, changes in lobster stock distribution has greatly altered the landscape of the fishery in the past 2 decades. From the 1980s to 1990s, lobster fishing effort and landings kept increasing in all 3 stock assessement areas: Gulf of Maine (GOM), Georges Bank (GBK), and South of Cape Cod and Long Island Sound (SCCLIS). During this time period, all stock units remained stable or increased from high recruitment rates. In SCCLIS, recruit abundance increased almost threefold since the mid-1980s, but the fishing mortality rate in SCCLIS was much higher than in the other 2 assessment areas (Ennis et al. 2000). The Southern New England 2 (SNE) stock has been declared depleted since the mid-2000s (Correia et al. 2005; McKown et al. 2009; Hoenig et al. 2015). For the GOM/GBK stocks, stock assessment model results show a dramatic overall increase in stock abundance, however, young-of-year estimates, which indicate future population are trending downward. This trend indicates a potential decline in recruitment and landings in the coming years (Hoenig et al. 2015).
Both GOM/GBK and SNE have inshore and offshore components to the fishery; about 80% of the landings are caught in state waters (0-3 nautical miles from shore, Ennis et al. 2000). Even so, with the depletion of the inshore stock in SNE, lobster vessels have been gradually moving to deeper waters. Anecdotal evidence shows a similar situation in the GOM lobster fishery. If this trend continues, structural change in fleet size, gear configuaration, and operating practices would be likely. Understanding the cost structure and profitability of lobster fleets by vessel size and area fished is critical to policy analysis and future decision-making. Yet, there have been relatively few economic studies of sufficient scope to evaluate the potential impact of management changes or resource conditions on lobster fishery profitability. 1 For the remainder of this paper, we will refer to the survey year as the year when costs were incurred (e.g. 2011, 2012, and 2015) and not the years in which surveys were sent (e.g. 2012, 2013, 2016). 2 New stock units defined in 2005 Stock Assessment Report were Gulf of Maine, Georges Bank, and Southern New England.

2
This document constructs an economic profile for lobster fleets from Maine to the Mid-Atlantic by using cost survey data collected by the SSB for calendar years 2011, 2012, and 2015, which include both fixed costs and operating costs. The remainder of this report is organized as follows: a brief summary of the history of lobster fishery management is followed by a summary of past cost and earnings studies for American lobster businesses. Next, we describe the survey methods and statistical summaries of data that were collected. We end with estimated financial profiles including cash flow and profitability by vessel size class.
HISTORY OF LOBSTER FISHERY MANAGEMENT
Prior to 1999, authority for managing the American lobster fishery was delegated to the New England Fishery Management Council (NEMFC) in waters of the exclusive economic zone (EEZ) under the Magnuson-Stevens Act (MSA) and to the Atlantic States Marine Fisheries Commission (ASMFC) in state waters under the Atlantic Coastal Fisheries Cooperative Management Act (ACFCMA). The NEFMC’s American Lobster Fishery Management Plan was adopted in 1983 while the ASMFC’s Interstate Fishery Management Plan (ISFMP) for lobster was adopted in 1978. Initially, the NEFMC and ASMFC actions were coordinated but began to diverge over differing schedules for minimum gauge size increases and effort reductions. By 1995 it became evident that maintaining separate management authority under ACFCMA and MSA was not leading to a uniform approach to lobster management. Management authority was transferred from MSA to ACFCMA in 1999. Under ACFCMA, the ASMFC now has the lead responsibility for developing management measures for the lobster fishery in both state and federal waters. Within this setting, the ASMFC develops measures to be implemented by its member states and recommends complementary action to be taken by National Marine Fisheries Service (NMFS) for federal waters. This arrangement retains the jurisdictional boundaries between regulatory actions taken by individual states and actions by NMFS but assures coordination throughout the range of the resource.
Today, lobster management is undertaken by the ASMFC under Amendment 3 to the Interstate Fishery Management Plan For American Lobster (Lockhart and Estrella 1997). Amendment 3 reaffirmed the principle that management measures be uniform to the extent possible but that some measures should be developed on a regional basis. The ASMFC identified 7 Lobster Conservation Management Areas (LMA) that have been used ever since (Figure 2). The ASMFC also approved the formation of Lobster Conservation Management Teams (LCMT) for each of the 7 LMAs that make recommendations for management measures affecting fishing practices within the LMA. Since Amendment 3 was adopted, the ISFMP has been modified as addenda to Amendment 3 on 24 occasions.
With Addendum 1 Areas 1, 2, and the Outer Cape opted for trap caps while Areas 3, 4, 5, and 6 elected to base trap allocations on historic use by establishing qualification criteria for indidivial trap allocations. Only Area 3 included transferrablality of traps. With Addendum 3 the Outer Cape adopted individual allocations with annual transferrability, and Area 2 transitioned from reliance on trap caps to individual trap allocations with transferrability with Addendum 7. Currently, Area 1 is the only remaing LMA that has retained trap caps.
In addition to measures affecting the number of traps that may be used in each LMA, the current management measures include a suite of coastwide (See appendix) and area specific measures. The area specific measures include variations across LMAs in the minimm and
3
maximum harvestable size, size of escape vents, V-notch requirements, and closed seasons (ASMFC 2020).
SUMMARY OF PAST COSTS AND EARNINGS STUDIES FOR AMERICAN LOBSTER BUSINESSES
Financial data for lobster fishing operations have not been part of any systematic data collection program either among different states or at the federal level. Although surveys of annual operating and fixed costs were conducted by the SSB in 2011, 2012, and 2015, these surveys were sent to anyone that owned a federally permitted vessel, including owners of lobster vessels. A substantial number of owners of federally permitted lobster vessels responded to these surveys, and statistical summaries and financial profiles for these 3 surveys are the subject of this report. In addition to the surveys conducted by the SSB, there have been a small number of special studies that have attempted to measure the level of investment and financial performance of lobster fishing businesses. These studies include some limited information provided in Northeast Marine Fisheries Board (NMFB 1978), a survey of lobster businesses in Massachusetts and Rhode Island conducted by the Atlantic Offshore Lobstermen’s Association (Liebzeit and Allen 1989), a set of focus group interviews conducted during 1993 by researchers at the University of Rhode Island (Gates and Sutinen personal communication 1995), a telephone survey of lobster businesses from Maine to Rhode Island that was conducted during 2006 for expenses incurred during 2005 (Thunberg 2007), and most recently a survey of lobster businesses in Maine that was conducted in 2011 for expenses incurred during 2010 (GMRI, 2014). Since each of these studies was conducted with different methods, covered different components of the lobster fishery, and did not collect the same financial data, it is difficult to use these studies to construct a reliable indicator of how profitability in the lobster fishery may have changed over time. The following provides a brief summary of the sources of data followed by a summary of costs and net returns. Since the cost data come from multiple sources over 30 years, we standardize reporting by computing cost and returns as a percent of net lobster revenue (Table 1).
Northeast Marine Fisheries Board 1978
The Northeast Marine Fisheries Board was a policy group formed in 1972 to develop recommendations for fishery management plans under a state-federal program in the Northeast Region. The NMFB submitted an American Lobster Fishery Management Plan (FMP) to be considered by the New England and Mid-Atlantic Fishery Management Councils with New England being designated the lead council. The FMP included an estimate of cost and net returns for calendar year 1976 that was limited to costs and net return for a typical or representative inshore fishing business, but the source of data is uncertain, and whether there were differences in net return among states or vessel size was not noted.
Liebzeit and Allen 1989
A survey of lobster fishing operations in MA and RI was conducted to collect data on fishery participant characteristics, level of capital investment, and cost and earnings. The survey was administered by telephone during calendar year 1988. The purpose of the survey was to identify differences in operating scale based on vessel length as well as financial differences between the limited access Massachusetts fishery and the open access Rhode Island fishery.

4
Gates and Sutinen, Personal Communication 1995 Researchers, John Gates and Jon Sutinen from the Department of Environmental and
Natural Resource Economics of the University of Rhode Island conducted a series of focus group style interviews during 1993 with lobstermen from ports in Maine through Long Island, New York. In each case, questions were asked regarding typical lobster businesses including vessel characteristics, initial investment and replacement costs, operating costs, fixed expenses, and seasonal characteristics of trap management. These data were collected as part of a larger project to build a computer simulation model of the lobster fishery. A focus group approach was adopted because it was considered to be more cost-effective than a formal statistically based survey. The researchers also reasoned that the focus group approach would yield more reliable and complete information since participants would be speaking to what they believed to be average or representative for their port rather than revealing personal financial information about their own business. For this reason, the data cannot be used to create financial profiles of lobster fishing businesses of different sizes because individual financial information was not collected. Rather, data were representative of all lobster businesses in the focus group participant’s port. Note that this also means that the information collected cannot be readily extrapolated beyond the ports where focus groups were held. Further, it is likely that much of the data are representative of full-time operators since the focus group participants themselves were likely to be full-time participants. For purposes of analysis, the focus group data were further broken down into regional aggregations comprising a Northern Inshore, a Southern Inshore, and an Offshore fleet.
Thunberg 2007
Researchers at the Gulf of Maine Research Institute (GMRI) designed a telephone survey of state and federal commercial lobster license holders that was administered during calendar year 2006. The survey objective was to collect baseline social and economic information from a sample of active (defined as having landed at least 1,000 pounds of lobster during calendar year 2005) and inactive lobster license holders in the states of Maine, New Hampshire, Massachusetts, and Rhode Island. Data were collected on demographics, education and training, vessel characteristics, involvement in the lobster fishery, other fishing activities, seasonal fishing practices, business characteristics, financing of investments, household income, health insurance coverage, and plans for retirement.
Data collected through the survey instrument were used to subdivide lobster fishing businesses into categories reflecting different seasonal and part-time/full-time fishing practices. Individuals that either fished traps in all 4 quarters of calendar year 2005 or that fished in 3 consecutive quarters were considered full-time operators. Individuals that fished lobster traps in only quarters 2 and/or 3 (April – September) were considered part-time/seasonal participants. For reporting purposes, businesses in this category were labeled summer season participants. Individuals that fished in only quarter 1 (January – March) and/or 4 (October to December) were also considered part-time seasonal participants but were labeled as fall/winter participants for discussion purposes. Separate estimates of cost and earnings were calculated for these 2 types of “seasonal” participants since the operating conditions of a summer fishery may be likely to differ substantially from that of a fall/winter fishery. Based on these definitions, all offshore (Area 3) lobster businesses Area 3 were categorized as full-time where 83% operated in every quarter of calendar year 2005. Survey statistics and analysis of cost and earnings data are reported in Thunberg 2007.

5
Gulf of Maine Research Institute 2014 The GMRI conducted a telephone survey during 2011 for fishing activity during 2010 of
LMA 1 lobster permit holders including Maine, New Hampshire, and Massachusetts. The survey was similar to the GMRI survey conducted during 2005 but included more detailed information on vessel characteristics, fishing practices, and both operating and fixed costs. Although the survey included NH and MA permit holders, net returns only for ME lobster businesses are reported in GMRI (2014).
Although the differences among surveys noted above in terms of states, vessel size, and operational characteristics are clearly evident in Table 1, there are several notable consistent patterns that emerge. First, with the exception of outliers and excluding Liebitz and Allen who combined sternman payments with the cost of bait and fuel, operating costs ranged from 19% to 29% of net lobster revenue and in most cases were between 20% and 26%. Second, in most cases net profit as a percent of net revenue is higher than net profit estimated for ME vessels in 2010. However, the 2010 GMRI survey collected more detailed cost data. For this reason, the cost in the earlier studies may have been underestimated, which would result in overestimated positive net profit. Last, most lobster businesses surveyed by the GMRI in 2005 and 2010 were earning below their opportunity cost of labor. Economic profit was negative for all ME LMA 1 vessel size classes during 2010 and was positive during 2005 only for LMA 3 and for full-time and fall/winter operators that also had at least 1 sternman.
SURVEY METHODS AND DATA DESCRIPTION
The SSB surveyed a split-sample in 2011 and 2012 using a stratified approach. Strata were defined by principal gear and vessel length for both years3. This approach was repeated in 2015, though slightly modified so as to only survey a vessel owner once in the case where they owned multiple vessels.4 For these more recent surveys, vessel owners were asked to report their costs in the previous year. The surveys were administered by independent contractors- Eastern Research Group in 2011 and 2012, and ICF International in 2015. For each of these 3 years, survey recipients were given the option to respond by mail or online. The 3 cost surveys, by years in which costs were incurred, are presented in Table 2. Further details on the cost survey methods can be found in Das (2016).
In each survey year, a survey was considered complete if the respondent had answered at least one cost-related question. As shown in Table 2, the overall response rates were 30%, 21%, and 6.59% for 2011, 2012, and 2015 respectively. Because the strata were defined by principal gear, we use ports and trap gear to represent the lobster fishery here. For the lobster fishery, response rates tracked similarly to the overall sample for each of the 3 survey years, falling from 30.61% in 2011 to 21.23% in 2012 and a low of 6.51% in 2015. However, because of the the large number of vessels that participate in the lobster fishery, they have always represented a substantial portion of the survey sample.
Owners of lobster vessels who responded to the SSB cost surveys were representative of the population in terms of both spatial and fleet size distribution. Table 3 compares the percentage 3 Strata were assigned by using principal gear fished in the calendar year of study (gear which was utilized to generate the highest revenue) and vessel length (above/below average length for the gear group). 4 The 2016 sampling strategy was modified so as to survey each business entity once, with entities being defined in accordance with the Regulatory Flexibility Act (RFA). In cases of an owner having multiple vessels, the vessel chosen to request cost data for was force-chosen if it was in a stratum with a small population. The rationale was to survey as much of the population as possible without sending multiple surveys to an owner of multiple vessels.
6
of lobster vessels by state/area between dealer data (considered as the population of active vessels) and survey data. Maine vessels consist of more than 75% of total vessels in both dealer and survey respondents. The percentage of Maine respondents’ vessels were slightly lower than that in the population because the survey sample only covered federally permitted vessels while a substantial number of Maine lobster boats only fish in state waters. Most vessels in NH, MA, and RI are federally permitted, so their ratios in the survey data are slightly higher than that in the population except for NH in 2011.
In terms of vessel size, Table 4 compares the percentage of lobster vessels in different size classes between dealer data and survey data. Survey data in 2011 match the available dealer data; for 2012, the small size vessels (35 ft or below) are under-represented; for 2015, vessels between 45 and 55 ft are underrepresented. As a whole, the survey data can be considered representative, especially for vessels below 45 ft, which consist of more than 90% of the population.
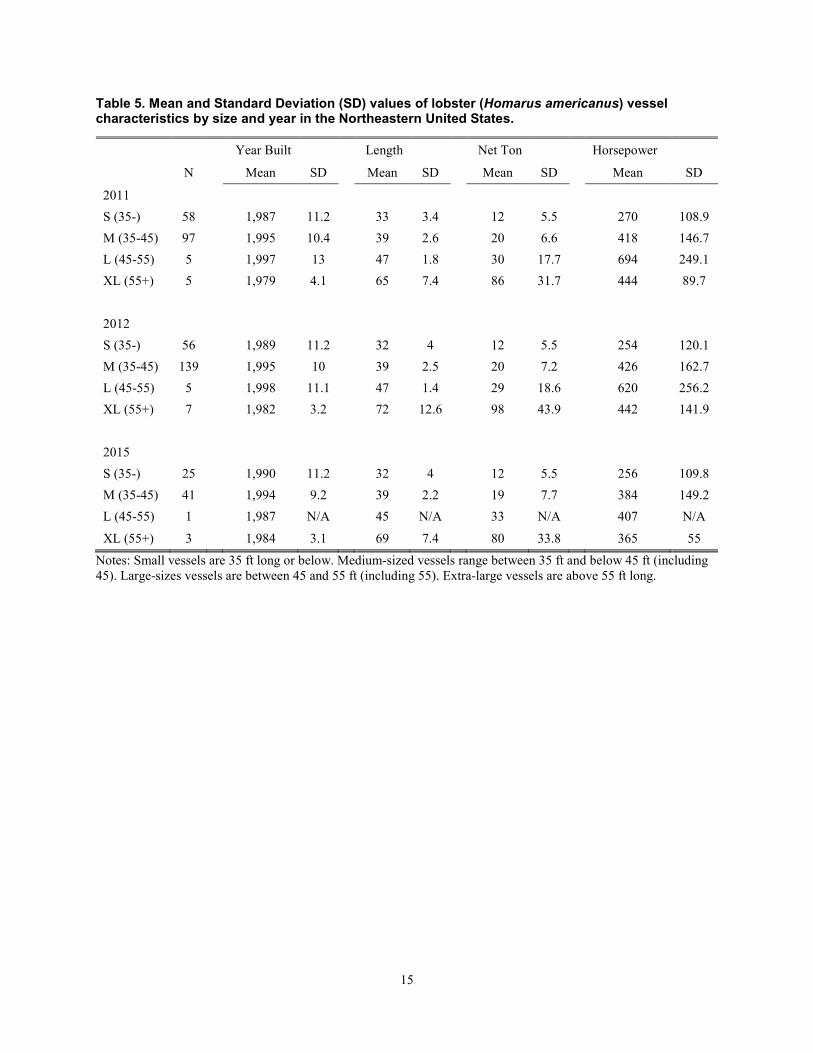
Vessel characteristics like length and horsepower are important indicators for fishing capacity and cost structure. Vessels were classified by length overall where vessels with length of 35 ft or below were classified as “small”; vessels longer than 35 ft but equal to or shorter than 45 ft were classified as “medium”; vessels between 45 and 55 ft were classified as “large”; and vessels over 55 ft were classified as “extra-large.” Table 5 reports the mean and standard deviation of vessel characteristics by size class and survey year. Most medium to large vessels were built around 1995, relatively newer than small vessels and extra-large vessels. The small vessels were mainly built around 1990, and the extra-large vessels were built in the early 1980s. The average size for small and medium vessels were around 32 and 39 ft, respectively. Most large vessels were just above 45 f. Extra-large vessels averaged over 65 ft but with a big variation. Net tonnage and horsepower varied greatly within the same size class, meaning that even though some vessels were similar in length, they could have different width, thus fish different gear configurations and areas depending on their engine power and hold capacity.
We matched the survey data to federal permit data by using hull number, and most survey respondents were permitted for lobster fisheries in LMA1. A few vessels were permitted to fish in LMA2 (SNE), and fewer vessels had LMA3 permits (offshore). There were also a small number of active vessels fishing in Mid-Atlantic waters and Outer Cape Cod (Table 6).
SURVEY RESULTS: REVENUE, COSTS, AND PROFITABILITY
Cash flow indicates a company’s flow of money, whether or not it is a cost component. For a lobster vessel, the inflow mainly comes from the sale of harvested seafood, and the outflow consists of vessel repair and maintenance, vessel upgrade and improvement, other vessel related costs, business related costs, fishing operation costs, crew payments, loan principal payment, and loan interest payment. Detailed items of each component can be found in Table 7.
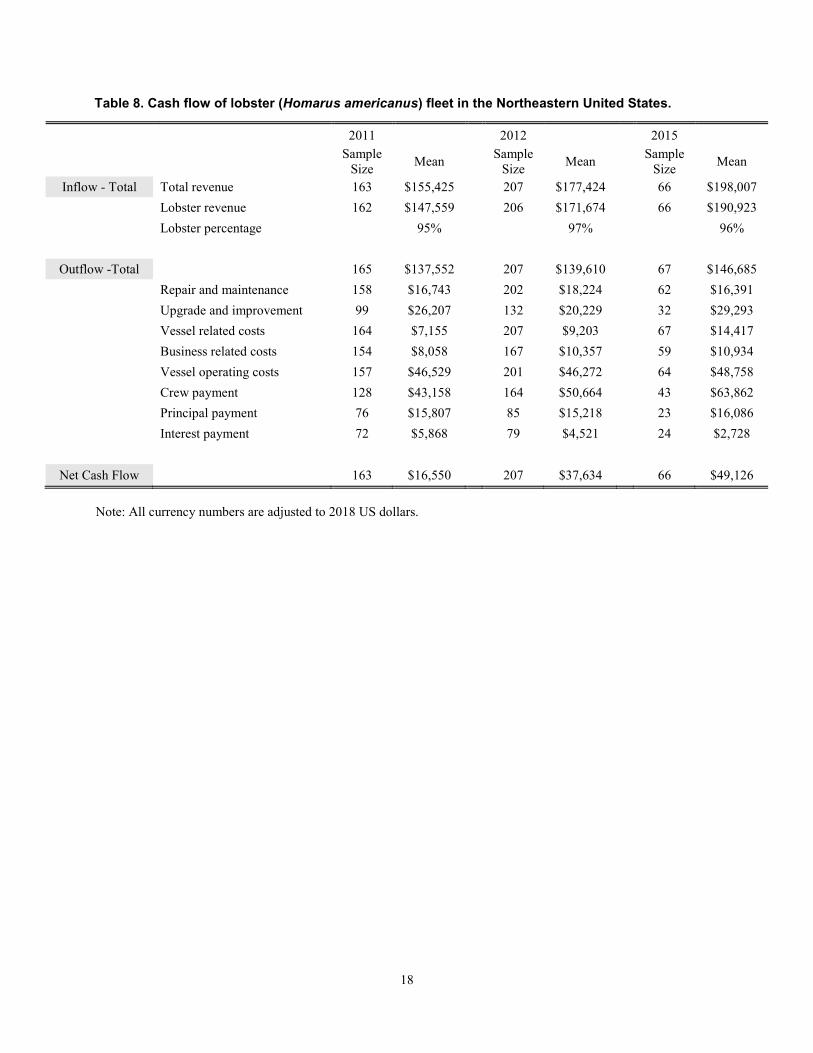
Table 8 displays cash flow of lobster vessels by year. Because of limited sample size, data were pooled across states and vessel size to estimate average cash flow by year. The average revenue per vessel was $155,4255 in 2011. Average revenue increased by 16% from 2011 to 2012, and another 16% from 2012 to 2015. Lobster landings contributed more than 95% of total revenue. Other harvested species included Jonah crab (Cancer borealis), conch and whelk, black sea bass
5 If not otherwise noted, all currency numbers in this section are adjusted to 2018 U.S. dollars using Price Indexes for Net Domestic Product data from Bureau of Economic Analysis (2010-2018). Data accessed on Nov 18, 2019. Available from https://apps.bea.gov/iTable/iTable.cfm?reqid=19&step=3&isuri=1&1921=survey&1903=11#reqid=19&step=3&isuri=1&1921=survey&1903=11

7
(Centropristis striata), scup (Stenotomus chrysops), and so on. Cash outflow remained steady through the years rising slightly from 2011 to 2012 and stayed constant from 2012 to 2015. Fishing operating costs and crew payments together consisted of more than 65% of total cash outflow.
The average net cash flow steadily increased from 2011 to 2015, primarily because of rising fishing revenue. According to ACCSP dealer data (ACCSP 2019), lobster price dropped from 2011 to 2012, but landings increased from 126 million pounds to 151 million pounds. As a result, the total revenue increased from $423 to $432 million. In 2015, high lobster price and landings boosted the total revenue to a record high of $622 million. Fishing operating costs were the biggest component of cash outflow, consisting of about 34% of total outflow. Repair and maintenance also accounted for a significant part of cash outflow, about 13% in all 3 years. Surveys showed that most lobster vessels used a share system: crew and hired captains received a percentage of total revenue after deducting expenses like fuel, bait, and food, thus a vessel’s crew payment varies year by year depending upon the revenue and costs. Crew payments in 2011 and 2012 were much lower than 2015.
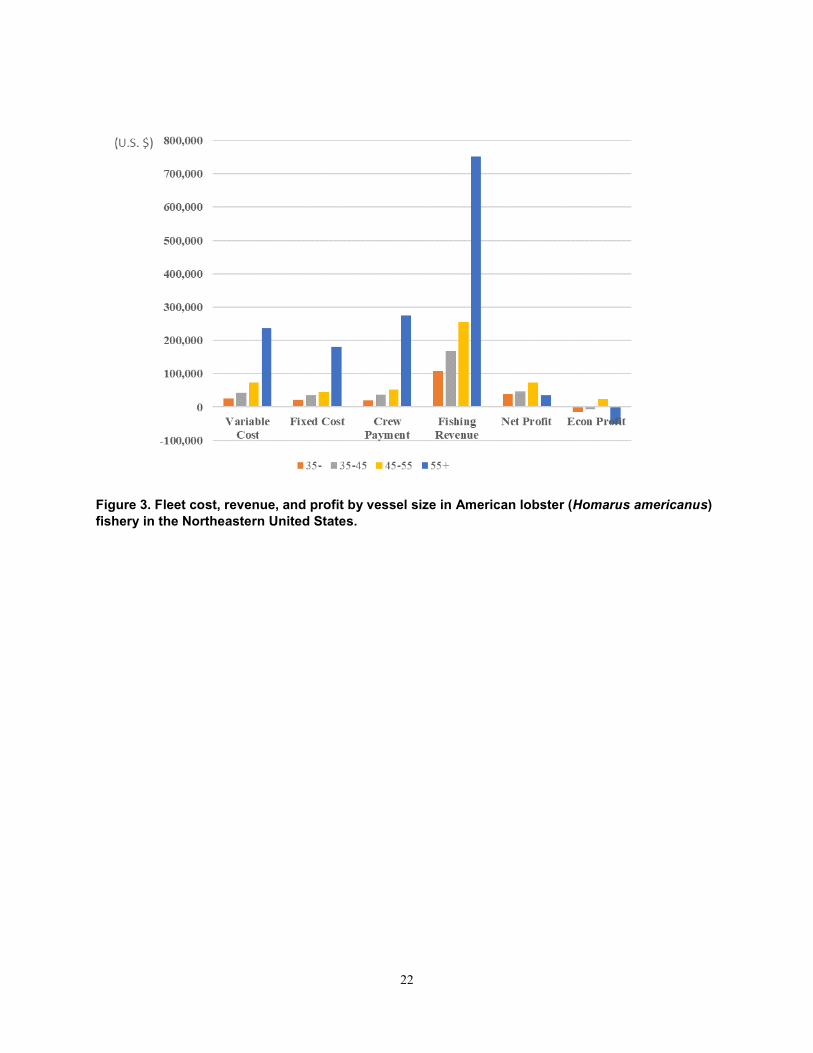
Cash flow focuses on inflows and outflows, which includes some expenses such as vessel upgrades and loan payments that are transfers of assets from one account to another; Net profit removes these transfer payments and accounts for depreciation. The resulting mean and standard deviations for net profit and economic profit are reported in Table 9. Table 9 reports average profit by vessel size. Once again, data by vessel size class were pooled across all 3 years to meet confidentiality reporting requirements. Small vessels mostly fish inshore waters. They have lower fishing revenue but also have lower operating costs resulting in an average net profit of $38,446 per year. The majority of lobster vessels were midsize vessels. These vessels were able to fish in both inshore and nearshore waters and made an average profit of $47,404. Large vessels have the capability to fish in a wide range of waters, and the estimated annual average profit was $73,063, which was the highest among all vessel classes. However, the sample size for this size class was low (11 respondents over the 3 surveys), so our estimate of profit may not be representative. Extra-large vessels usually fish offshore waters exclusively. They take longer trips and earn higher revenue but carry more crew and incur higher operating and fixed costs than vessels in any other size class (Figure 3). For this reason, our estimated average annual net profits were $34,463, which is the lowest among all other size classes considered in this study.
A full accounting of economic profit accounts for both the opportunity cost of capital and the opportunity cost of labor. For this study, the opportunity cost of capital was calculated as the potential interest that could have been generated by the total invested capital into fishing vessel and permits. We used Moody's Seasoned Baa Corporate Bond Yield6 as the interest rate. Because some vessels had loans and paid interest, we took that part of interest cost off the opportunity cost of capital of those vessels. The opportunity cost of labor used data collected during the 2010 GMRI survey. Specifically, for vessels under 30 ft, the opportunity cost of labor was $33,742 in 2010. It was $49,823 and $43,513 for vessels between 30-40 ft and vessels over 40 ft respectively. These values were applied to each vessel according to their size. After applying the opportunity costs, the average economic profit turned negative for all but large vessels. Large vessels still have a positive economic profit of $23,873. Because of the high capital value of extra-large vessels, they experience a negative economic profit of $51,013. The small and mid-sized vessels have negative economic profit of $14,758 and $7,642, respectively. Figure 4 shows the distribution of economic profit by vessel class. Corresponding to the results in Table 9, the economic profit of small vessels
6 Moody's Seasoned Baa Corporate Bond Yield [BAA], retrieved from FRED, Federal Reserve Bank of St. Louis; https://fred.stlouisfed.org/series/BAA, November 12, 2019.

8
centers slightly below zero, and medium vessels center around zero. Large and extra-large classes have fewer samples and show a disperse profit distribution.
SUMMARY
American lobster has been one of the most valuable fishery resources in the Northeastern United States for many years, yet little comprehensive research has been conducted on the economic health of lobster fleets across the region. Considering the rapid environmental changes happening in the North Atlantic Ocean, especially in SNE and GOM, adaptive lobster fishery management will be critical to fishery sustainability in the future. Economic and profitability data on these lobster fleets are the basis for policy analysis and decision-making. This report provides an economic review for lobster vessels in the Northeastern United States based on cost surveys conducted for calendar years 2011, 2012, and 2015. Results suggest that during year 2011 to 2015, the average vessel net cash flow increased from the increase of annual revenue. On average, all size classes earned positive net profit. Extra-large (55+) vessels made the least profit because they had the highest costs, including an average crew payment of $275,800. Large vessels (45-55) generated the most profit, averaging $73,063. The majority of the fleet, medium sized vessels (35-45), made a net profit of $47,404, and small vessels made a net profit of $38,446. However, when deducting the opportunity costs of capital and labor from the net profit, more than half of the vessels incurred negative economic profit. Extra-large vessels experienced an average loss of $51,013, the most among all size classes. Small vessels also had a negative economic profit. Medium vessels just broke even and only large vessels made a positive profit of $23,873.

9
REFERENCES CITED ACCSP. 2019. Data Warehouse, Confidential, Commercial Landings, Summary (1950-2019);
generated by Chao Zou; using Data Warehouse [online application]. Arlington (VA): Atlantic Coastal Cooperative Statistics Program. [Accessed Jun-Nov, 2019]. Available from: https://www.accsp.org.
ASMFC. 2020. Review of the Interstate Fishery Management Plan for American Lobster (Homarus americanus) 2019 Fishing Year. Available from: http://www.asmfc.org/uploads/file/5f9afd292019AmericanLobsterFMP_Review.pdf.
Correia S, Glenn R, Howell P, Jacobson L, Wilson C. 2005. American Lobster Stock Assessment for Peer Review. Boston (MA): Atlantic States Marine Fisheries Commission. Final report on NOAA Award No. NA05NMF4741025. Available from: http://www.asmfc.org/uploads/file/americanLobsterStockAssessmentReport06.pdf.
Das C. 2016. Fisheries Annual Fixed Cost Data Collection and Estimation Methodology: An Application in the Northeast, U.S. Marine Policy. Volume 71: 184-193.
Donihue M, Tselikis. A. 2018. From Lobsters to Dollars: An Economic Analysis of the Distribution Supply Chain in Maine. [Internet]. Waterville (ME): Colby College. [cited 2020 Feb 10]. Available from: http://colbycollege.maps.arcgis.com/apps/Cascade/index.html?appid=e0c247dcb1a34d8293d953f92f360eb9.
Ennis G, Hoenig H, Lawton P, Muller R, Saila S, Sampson D. 2000. American Lobster Stock Assessment Report for Peer Review. Providence (RI): Atlantic States Marine Fisheries Commission. Final report on NOAA Award Nos. NA97 FGO 0034 and NA07 FGO 024. Available from: http://www.asmfc.org/uploads/file/2000LobsterStockAssmtReport.pdf.
GMRI. 2005. Taking the Pulse of the Lobster Industry: A Socioeconomic Survey of New England Lobster Fishermen. [Internet]. Portland (ME): Gulf of Maine Research Institute. [cited 2020 Feb 11]. Available from: http://www.lobstermen.com/wp-content/uploads/2009/10/RES_DH_reports_Lobster-Socioec-Survey.pdf.
GMRI. 2014. Understanding Opportunities and Barriers to Profitability in the New England Lobster Industry. [Internet]. Portland (ME): Gulf of Maine Research Institute. [cited 2020 Feb 11]. Available from: http://134.209.208.5/sites/default/files/resource/gmri_2014_lobster_survey.pdf
Hoenig H, Muller R, Trembaly J. 2015. American Lobster Benchmark Stock Assessment and Peer Review Report. Wood Hole (MA): Atlantic States Marine Fisheries Commission. Final report on NOAA Award No. NA10NMF4740016. Available from: http://www.asmfc.org/uploads/file//55d61d73AmLobsterStockAssmt_PeerReviewReport_Aug2015_red2.pdf

10
Liebzeit A, Allen D. 1989. Investment Decision-Making in the American Lobster Fishery: A Comparison between Limited Entry and Open Access Regimes. Salstonstall-Kennedy Grant #NA86AA-H-SK131. Available from: National Marine Fisheries Service.
Lockhart F, Estrella B. 1997. Amendment 3 to the Interstate Fishery Management Plan for American Lobster. Atlantic States Marine Fisheries Commission. Final report on NOAA Award Nos. NA77 FGO 029 and NA87 FGO 025. Available from: http://www.asmfc.org/uploads/file/lobsterAmendment3.pdf.
McKown K, Glenn R, Howell P, Jacobson L, Nesslage G, Wilson C. 2009. American Lobster Stock Assessment Report for Peer Review. Boston (MA): Atlantic States Marine Fisheries Commission. Final report on NOAA Award No. NA05NMF4741025. Available from: http://www.asmfc.org/uploads/file/2009LobsterStockAssessmentReport.pdf.
NMFB. 1978. American Lobster Fishery Management Plan. Boston (MA). Available from: Atlantic States Marine Fisheries Commission. http://www.asmfc.org/publications/fishery-management-reports
Thunberg EM. 2007. Demographic and Economic Trends in the Northeastern United States Lobster (Homarus americanus) Fishery, 1970–2005. Wood Hole (MA). Available from: National Marine Fisheries Service, CRD 07-17. 64p.

11
Table 1. Summary of cost and earning as a percent of net American lobster (Homarus americanus) revenue by data source.
Survey (Year)
Reference (Year)
Unit of Observation
Operating Costs Sternman
Other & Fixed Costs
Net Profit Economic Profit
NMFB (1976)
NMFB (1978)
Inshore trap fishery 24% 43% 21% 12%
Liebitz and Allen
Liebitz and Allen MA 20'-29' 36% 27% 37% -45%
(1988) (1989) RI 20'-29' 52% 26% 22% -58% MA 30'-40' 30% 16% 54% 15% RI 30'-40' 38% 24% 39% 13% MA 41'-50' 40% 20% 41% 18% RI 41'-50' 42% 30% 28% 11%
URI (1993) Gates and Sutinen*
Northern Inshore 20% 14% 17% 49% 29%
(1995) Southen Inshore 19% 13% 30% 38% 23%
Offshore 27% 44% 15% 14% 9% GMRI (2005) LMA 1
Thunberg (2007)
Full-Time No Sternman 26% 0 42% 32% -36%
Full-Time w/ Sternman 23% 21% 23% 33% 2%
Fall/Winter No Sternman 29% 0 42% 29% -34%
Fall/Winter w/ Sternman 24% 17% 22% 37% 7%
Summer Season No Sternman
20% 0 49% 31% -24%
Summer Season w/ Sternman
47% 10% 19% 24% -8%
GMRI (2005) LMA 2
Thunberg (2007)
Full-Time No Sternman 23% 0 45% 32% -49%
Full-Time w/ Sternman 21% 17% 30% 32% 0%
Fall/Winter No Sternman 20% 0 50% 30% -17%
Summer Season No Sternman
13% 0% 52% 35% -48%
GMRI (2005) LMA 3
Thunberg (2007) Full Time 24% 32% 23% 21% 12%
GMRI (2010)
GMRI (2014)
29' and under 24% 19% 33% 24% -47%
30 to 39' 26% 20% 30% 24% -32% 40' plus 24% 19% 28% 29% -15%
*From personal communication with Gates and Sutinen from URI

12
Table 2. Social Science Branch cost survey design and response rates for pots/traps vessels.
Year Survey Administrator
Survey Sample Sample Response Response
Rate
Overall Response Rate
2011 Independent
Contractor (Eastern Research Group)
Stratified Split
Sample* 575 176 30.61% 30.00%
2012 Independent
Contractor (Eastern Research Group)
Stratified Split
Sample* 1,036 220 21.23% 20.98%
2015 Independent Contractor (ICF)
Stratified Sample 1,536 100 6.51% 6.59%
*Half the population was surveyed for 2011; the other half was surveyed for 2012

13
Table 3. The number of lobster (Homarus americanus) vessels by state in the Northeastern United States in National Marine Fisheries Service dealer report and cost survey data.
2011 2012 2015
State Dealer Survey Dealer Survey Dealer Survey
Freq. Percent Freq. Percent Freq. Percent Freq. Percent Freq. Percent Freq. Percent
ME 4,356 78.80% 125 75.80% 4,312 79.60% 145 70.10% 4,139 80.20% 46 65.70%
NH 153 2.80% 2 1.20% 146 2.70% 6 2.90% 134 2.60% 2 2.90%
MA 757 13.70% 27 16.40% 727 13.40% 42 20.30% 709 13.70% 17 24.30%
RI 151 2.70% 7 4.20% 124 2.30% 7 3.40% 101 2.00% 2 2.90%
CT 42 0.80% 1 0.60% 39 0.70% 1 0.50% 24 0.50% 2 2.90%
Mid-Atlantic 68 1% 3 2% 71 1% 6 2.80% 56 1% 1 1%
Total 5,527 100.00% 165 100.00% 5,419 100.00% 207 100.00% 5,163 100.00% 70 100.00%
Note: As dealer reports are mandatory to all lobster vessels, it is assumed the number of unique vessels (identified by hull number) in dealer report is the population. Vessels in cost survey data are samples. Mid-Atlantic states are from NY to VA.

14
Table 4. The number of lobster (Homarus americanus) vessels in the Northeastern United States by size in National Marine Fisheries Service dealer report and cost survey data.
2011 2012 2015
Dealer Survey Dealer Survey Dealer Survey
Length Freq. Percent Freq. Percent Freq. Percent Freq. Percent Freq. Percent Freq. Percent
S (35-) 649 35% 58 35% 518 32% 56 27% 440 29% 25 36% M (35-45) 1,097 59% 97 59% 994 61% 139 67% 964 63% 41 59% L (45-55) 51 3% 5 3% 61 4% 5 2% 66 4% 1 1% XL (55+) 75 4% 5 3% 69 4% 7 4% 66 4% 3 4%
Total 1,872 100% 165 100% 1,642 100% 207 100% 1,536 100% 70 100% Notes: Small vessels are 35 ft long or below. Medium-sized vessels range between 35 ft and below 45 ft (including 45). Large-sizes vessels are between 45 and 55 ft (including 55). Extra-large vessels are above 55 ft long.
15
Table 5. Mean and Standard Deviation (SD) values of lobster (Homarus americanus) vessel characteristics by size and year in the Northeastern United States.
Year Built Length Net Ton Horsepower
N Mean SD Mean SD Mean SD Mean SD
2011
S (35-) 58 1,987 11.2 33 3.4 12 5.5 270 108.9 M (35-45) 97 1,995 10.4 39 2.6 20 6.6 418 146.7 L (45-55) 5 1,997 13 47 1.8 30 17.7 694 249.1 XL (55+) 5 1,979 4.1 65 7.4 86 31.7 444 89.7
2012
S (35-) 56 1,989 11.2 32 4 12 5.5 254 120.1 M (35-45) 139 1,995 10 39 2.5 20 7.2 426 162.7 L (45-55) 5 1,998 11.1 47 1.4 29 18.6 620 256.2 XL (55+) 7 1,982 3.2 72 12.6 98 43.9 442 141.9
2015
S (35-) 25 1,990 11.2 32 4 12 5.5 256 109.8 M (35-45) 41 1,994 9.2 39 2.2 19 7.7 384 149.2 L (45-55) 1 1,987 N/A 45 N/A 33 N/A 407 N/A
XL (55+) 3 1,984 3.1 69 7.4 80 33.8 365 55 Notes: Small vessels are 35 ft long or below. Medium-sized vessels range between 35 ft and below 45 ft (including 45). Large-sizes vessels are between 45 and 55 ft (including 55). Extra-large vessels are above 55 ft long.

16
Table 6. Distribution of lobster (Homarus americanus) vessel permits by Lobster Conservation Management Area (LMA).
2011 2012 2015
Sample Size Percent Sample Size Percent Sample Size Percent LMA 1 133 89.2% 166 87.4% 50 82.0% LMA 2 7 4.7% 10 5.3% 6 9.8% LMA 3 5 3.4% 7 3.7% 3 4.9% LMA 4-6 3 2.0% 7 3.7% 9 14.4% Outer Cape 3 2.0% 5 2.6% N/A N/A
Note: the percentage may add up over 100% because some vessels have multiple permits. LMA 4-6 vessels are combined to maintain confidentiality.

17
Table 7. Detail items of lobster (Homarus americanus) vessel costs in the Northeastern United States.
Repair & Maintenance, Upgrade & Improvement Costs Vessel Related Costs Business Related Costs Operating Costs
Engine Haul Out Fees Office Expenses Fuel and bait Deck Equipment Mooring/Dockage Fees Permit /License Fees Food and Drinking Water Hull Workshop/Storage Expenses Business Vehicle Usage Costs Ice and fresh water Gear Vessel Insurance Premium Business Travel Costs Communication Costs Wheelhouse & Gear Electronics Quota or Das Lease Association Fees General Fishing Supplies Processing/Refrigeration Monitoring Costs Professional Fees General Crew Supplies Safety Equipment Crew Benefits Advertising Costs Catch Handling Costs
Non-Crew Labor Services Other Costs
18
Table 8. Cash flow of lobster (Homarus americanus) fleet in the Northeastern United States.
2011 2012 2015 Sample
Size Mean Sample Size Mean Sample
Size Mean
Inflow - Total Total revenue 163 $155,425 207 $177,424 66 $198,007 Lobster revenue 162 $147,559 206 $171,674 66 $190,923 Lobster percentage 95% 97% 96%
Outflow -Total 165 $137,552 207 $139,610 67 $146,685 Repair and maintenance 158 $16,743 202 $18,224 62 $16,391 Upgrade and improvement 99 $26,207 132 $20,229 32 $29,293 Vessel related costs 164 $7,155 207 $9,203 67 $14,417 Business related costs 154 $8,058 167 $10,357 59 $10,934 Vessel operating costs 157 $46,529 201 $46,272 64 $48,758 Crew payment 128 $43,158 164 $50,664 43 $63,862 Principal payment 76 $15,807 85 $15,218 23 $16,086 Interest payment 72 $5,868 79 $4,521 24 $2,728
Net Cash Flow 163 $16,550 207 $37,634 66 $49,126 Note: All currency numbers are adjusted to 2018 US dollars.

19
Table 9. Lobster (Homarus americanus) fleet profitability by size class in the Northeastern United States.
Fishing Revenue Operation Costs Net Profit Economic Profit # of Vessels Mean SD Mean SD Mean SD Mean SD
S (35-) 138 107,793 77,468 68,858 47,663 38,446 61,609 -14,758 60,155
M (35-45) 275 168,108 123,707 120,704 81,849 47,404 93,097 -7,642 92,485
L (45-55) 11 255,200 127,331 182,137 90,508 73,063 135,249 23,873 135,500
XL (55+) 15 752,497 550,849 718,034 470,783 34,463 175,843 -51,013 160,709
Notes: Small vessels are 35 ft long or below. Medium-sized vessels range between 35 ft and below 45 ft (including 45). Large-sizes vessels are between 45 and 55 ft (including 55). Extra-large vessels are above 55 ft long. Standard deviation = SD. All numbers are adjusted to 2018 US dollars. Because of lack of data availability, revenue from non-fishing not reported here. Operation costs include fixed costs, variable costs, financial costs, crew payment, and depreciation.

20
Figure 1. Annual lobster (Homarus americanus) and scallop (Placopecten magellanicus) fishery ex-vessel value* (2012-2018).

21
Figure 2. Lobster conservation management areas (LMAs) and stock boundaries for American lobster (Homarus americanus).
22
Figure 3. Fleet cost, revenue, and profit by vessel size in American lobster (Homarus americanus) fishery in the Northeastern United States.

23
Figure 4. Distribution of economic profit by vessel size in American lobster (Homarus americanus) fishery in the Northeastern United States.

24
APPENDIX: COASTWIDE LOBSTER (HOMARUS AMERICANUS) MANAGEMENT MEASURES FOR 2019
• Prohibition on possession of berried or scrubbed lobsters • Prohibition on possession of lobster meats, detached tails, claws, or other parts of lobsters by fishermen • Prohibition on spearing lobsters • Prohibition on possession of v-notched female lobsters • Requirement for biodegradable “ghost” panel for traps • Minimum guage of 3-1/4” • Limits on landings by fishermen using gear or methods other than traps to 100 lobsters per day or 500
lobsters per trip for trips 5 days or longer • Requirements for permits and licensing • All lobster traps must contain at least one escape vent with a minimum size of 1-15/16” by 5-3/4” • Maximum trap size of 22,950 cubic inches in all areas except area 3, where traps may not exceed a volume
of 30,100 cubic inches.
Source: ASMFC 2020 (Review of the Interstate Fishery Management Plan for American Lobster (Homarus americanus) 2019 Fishing Year)

Procedures for Issuing Manuscripts in the
Northeast Fisheries Science Center Reference Document (CRD) and the Technical Memorandum (TM) Series
The mission of NOAA’s National Marine Fisheries Service (NMFS) is “stewardship of the nation's ocean resources and their habitat.” As the research arm of the NMFS’s Greater Atlantic Region, the Northeast Fisheries Science Center (NEFSC) supports the NMFS mission by “conducting ecosystem-based research and assessments of living marine resources, with a focus on the Northeast Shelf, to promote the recovery and long-term sustainability of these resources and to generate social and economic opportunities and benefits from their use.” Results of NEFSC research are largely reported in primary scientific media (e.g., anonymously peer reviewed scientific journals). However, to assist itself in providing data, information, and advice to its constituents, the NEFSC occasionally releases its results in its own series. NOAA Technical Memorandum NMFS-NE -- This series is issued irregularly. The series typically includes: data reports of long-term field or lab studies of important species or habitats; synthesis reports for important species or habitats; annual reports of overall assessment or monitoring programs; manuals describing program-wide surveying or experimental techniques; literature surveys of important species or habitat topics; proceedings and collected papers of scientific meetings; and indexed and/or annotated bibliographies. All issues receive internal scientific review and most issues receive technical and copy editing. Northeast Fisheries Science Center Reference Document -- This series is issued irregularly. The series typically includes: data reports on field and lab studies; progress reports on experiments, monitoring, and assessments; background papers for, collected abstracts of, and/or summary reports of scientific meetings; and simple bibliographies. Issues receive internal scientific review and most issues receive copy editing. CLEARANCE All manuscripts submitted for issuance as CRDs must have cleared the NEFSC’s manuscript/abstract/webpage review process. If your manuscript includes material from another work which has been copyrighted, then you will need to work with the NEFSC’s Editorial Office to arrange for permission to use that material by securing release signatures on the “NEFSC Use-of-Copyrighted-Work Permission Form.” For more information, NEFSC authors should see the NEFSC’s online publication policy manual, “Manuscript/abstract/webpage preparation, review, and dissemination: NEFSC author’s guide to policy, process, and procedure.” STYLE The CRD series is obligated to conform with the style contained in the current edition of the United States Government Printing Office Style Manual. That style manual is silent on many aspects of scientific manuscripts. The CRD series relies more on the CSE Style Manual. Manuscripts should be prepared to conform with these style manuals. The CRD series uses the Integrated Taxonomic Information System, American Fisheries Society’s guides, and the Society for Marine Mammalogy’s guide for verifying scientific species’names.
For in-text citation, use the name-date system. A special effort should be made to ensure that all necessary bibliographic information is included in the list of references cited. Personal communications must include date, full name, and full mailing address of the contact. PREPARATION Once your document has cleared the review process, the Editorial Office will contact you with publication needs – for example, revised text (if necessary) and separate digital figures and tables if they are embedded in the document. Materials may be submitted to the Editorial Office as email attachments or intranet downloads. Text files should be in Microsoft Word, tables may be in Word or Excel, and graphics files may be in a variety of formats (JPG, GIF, Excel, PowerPoint, etc.). PRODUCTION AND DISTRIBUTION The Editorial Office will perform a copyedit of the document and may request further revisions. The Editorial Office will develop the inside and outside front covers, the inside and outside back covers, and the title and bibliographic control pages of the document. Once the CRD is ready, the Editorial Office will contact you to review it and submit corrections or changes before the document is posted online. A number of organizations and individuals in the Northeast Region will be notified by e-mail of the availability of the document online.