Mapping and fuzzy classification of macromolecular images using self-organizing neural networks
15
* Corresponding author. Tel: #34-91-585-4543; fax: #34- 91-585-4506. E-mail addresses: pascual@cnb.uam.es (A. Pascual), carazo@cnb.uam.es (J.-M. Carazo). Ultramicroscopy 84 (2000) 85}99 Mapping and fuzzy classi"cation of macromolecular images using self-organizing neural networks Alberto Pascual!, Montserrat Ba H rcena!, J.J Merelo", Jose H -Marm H a Carazo!,* !Centro Nacional de Biotecnologn & a-CSIC, Universidad Auto & noma, 28049 Madrid, Spain "GeNeura Team, Dpto Arquitectura y Tecnologn & a de Computadores, Facultad de Ciencias, Campus Fuentenuevas/n, 18071 Granada, Spain Received 23 September 1999; received in revised form 13 January 2000 Abstract In this work the e!ectiveness of the fuzzy kohonen clustering network (FKCN) in the unsupervised classi"cation of electron microscopic images of biological macromolecules is studied. The algorithm combines Kohonen's self-organizing feature maps (SOFM) and Fuzzy c-means (FCM) in order to obtain a powerful clustering technique with the best properties inherited from both. Exploratory data analysis using SOFM is also presented as a step previous to "nal clustering. Two di!erent data sets obtained from the G40P helicase from B. Subtilis bacteriophage SPP1 have been used for testing the proposed method, one composed of 2458 rotational power spectra of individual images and the other composed by 338 images from the same macromolecule. Results of FKCN are compared with self-organizing feature maps (SOFM) and manual classi"cation. Experimental results prove that this new technique is suitable for working with large, high-dimensional and noisy data sets and, thus, it is proposed to be used as a classi"cation tool in electron microscopy. ( 2000 Elsevier Science B.V. All rights reserved. Keywords: Image processing; Cluster analysis; Neural networks; Self-organizing maps; Fuzzy logic 1. Introduction Image classi"cation is a very important step in the three-dimensional study of biological macro- molecules using electron microscopy (EM) because three-dimensional reconstruction methods require that the set of images that is going to be considered correspond to di!erent views of the same biological specimen. Obtaining homogeneous set of images corresponding to views from the same direction of the same biological specimen is a hard task due to several factors, mainly the low signal/noise ratio of the images obtained in the electron microscope and the potential structural heterogeneity of the biolo- gical specimen under study. Image classi"cation plays a central role as a pre- processing step in the three-dimensional analysis, as it is intended to separate the original population of images into di!erent homogeneous sub-popula- tions or classes. This classi"cation is generally di$- cult in the sense that in most cases no prior information about the data structure is available, in this way unsupervised techniques must be used. In the context of pattern recognition and classi- "cation in electron microscopy di!erent approaches 0304-3991/00/$ - see front matter ( 2000 Elsevier Science B.V. All rights reserved. PII: S 0 3 0 4 - 3 9 9 1 ( 0 0 ) 0 0 0 2 2 - X
-
Upload
alberto-pascual -
Category
Documents
-
view
214 -
download
2
Transcript of Mapping and fuzzy classification of macromolecular images using self-organizing neural networks

*Corresponding author. Tel: #34-91-585-4543; fax: #34-91-585-4506.
E-mail addresses: [email protected] (A. Pascual),[email protected] (J.-M. Carazo).
Ultramicroscopy 84 (2000) 85}99
Mapping and fuzzy classi"cation of macromolecularimages using self-organizing neural networks
Alberto Pascual!, Montserrat BaH rcena!, J.J Merelo", JoseH -MarmHa Carazo!,*!Centro Nacional de Biotecnologn&a-CSIC, Universidad Auto& noma, 28049 Madrid, Spain
"GeNeura Team, Dpto Arquitectura y Tecnologn&a de Computadores, Facultad de Ciencias, Campus Fuentenueva s/n, 18071 Granada, Spain
Received 23 September 1999; received in revised form 13 January 2000
Abstract
In this work the e!ectiveness of the fuzzy kohonen clustering network (FKCN) in the unsupervised classi"cation ofelectron microscopic images of biological macromolecules is studied. The algorithm combines Kohonen's self-organizingfeature maps (SOFM) and Fuzzy c-means (FCM) in order to obtain a powerful clustering technique with the bestproperties inherited from both. Exploratory data analysis using SOFM is also presented as a step previous to "nalclustering. Two di!erent data sets obtained from the G40P helicase from B. Subtilis bacteriophage SPP1 have been usedfor testing the proposed method, one composed of 2458 rotational power spectra of individual images and the othercomposed by 338 images from the same macromolecule. Results of FKCN are compared with self-organizing featuremaps (SOFM) and manual classi"cation. Experimental results prove that this new technique is suitable for working withlarge, high-dimensional and noisy data sets and, thus, it is proposed to be used as a classi"cation tool in electronmicroscopy. ( 2000 Elsevier Science B.V. All rights reserved.
Keywords: Image processing; Cluster analysis; Neural networks; Self-organizing maps; Fuzzy logic
1. Introduction
Image classi"cation is a very important step inthe three-dimensional study of biological macro-molecules using electron microscopy (EM) becausethree-dimensional reconstruction methods requirethat the set of images that is going to be consideredcorrespond to di!erent views of the same biologicalspecimen. Obtaining homogeneous set of imagescorresponding to views from the same direction of
the same biological specimen is a hard task due toseveral factors, mainly the low signal/noise ratio ofthe images obtained in the electron microscope andthe potential structural heterogeneity of the biolo-gical specimen under study.
Image classi"cation plays a central role as a pre-processing step in the three-dimensional analysis,as it is intended to separate the original populationof images into di!erent homogeneous sub-popula-tions or classes. This classi"cation is generally di$-cult in the sense that in most cases no priorinformation about the data structure is available, inthis way unsupervised techniques must be used.
In the context of pattern recognition and classi-"cation in electron microscopy di!erent approaches
0304-3991/00/$ - see front matter ( 2000 Elsevier Science B.V. All rights reserved.PII: S 0 3 0 4 - 3 9 9 1 ( 0 0 ) 0 0 0 2 2 - X
have been previously used: classical statisticalmethods, clustering techniques and neural net-works. Multivariate statistical analysis (MSA)[1,2], was "rst proposed as a way to reduce thenumber of variables characterizing an image and,in some cases, a visual inspection was enough toenable the manual identi"cation of the clusters inthe data set under analysis. Visual inspection, how-ever, is not suitable for all kind of data, so moreobjective clustering methods were applied: Hier-archical ascendant classi"cation [3], hybrid (k-means and ascendant classi"cation approach) [4],Fuzzy c-means [5], estimation of the probabilitydensity function and skeleton by in#uence zones[6]. For a review see Ref. [7].
Neural networks, such as Kohonen's self-or-ganizing feature maps (SOFM) have also been suc-cessfully applied in classi"cation of electronmicroscopic images [8,9], creating a new andpowerful methodology for classi"cation in this"eld. One of the advantages of this approach is thatit does not need any prior knowledge of the numberof clusters present in the data set. However, the usermust de"ne several parameters that have a directimpact on the results [10]. For instance, topologyof the map (square, rectangular, etc.), horizontaland vertical size (number of neurons), dimension(usually two dimension is used, but dimensionsgreater than two can also be used), the size of theupdate neighborhood and learning rate strategy.A bad choice of parameters can lead to negativeresults, specially the map size and updatingneighborhood, that's why several attempts tooptimize the selection of these parameters havealso been reported [11}13]. Using SOFM fordirect classi"cation is also di$cult because the par-tition of the candidate clusters should be accomp-lished and usually this operation is manuallycarried out.
Since electron microscopic images of isolatedbiological specimens (single particles) are a goodexample of objects with an intrinsic degree of varia-bility, cluster analysis using fuzzy logic seems to beappropriate for dealing with such problem. Thefuzzy concept has been useful in situations dealingwith non-well-separated clusters, which include hy-brid points situated in the midst of two disjointcompact clusters. In fuzzy clustering, objects do not
belong exclusively to one cluster, but partially to allof them with a di!erent degree of membership. Inelectron microscopy image classi"cation fuzzy clus-ter analysis has proved to be a powerful tool [5].However, this technique has an important draw-back: it can be easily trapped in an undesired localminimum of the cost function being minimized(cost function refers to a criterion describing thequality of the partition) during the convergenceprocess, specially when dealing with noisy andhigh-dimensional data sets, where the `curse ofdimensionalitya (the quantity of data needed toachieve good classi"cation performance grows ex-ponentially with the dimension) [14] plays an im-portant role.
In the present work we describe the applicationto electron microscopic images of biological speci-mens of a hybrid approach in which both theKohonen's self organizing feature map (SOFM)[10] and the fuzzy c-means clustering algorithm(FCM) [15] have been integrated. We will refer tothis approach as the fuzzy kohonen clustering net-work (FKCN). This method attempts to overcomesome of the di$culties described above by takingadvantage of the best features of the self-organizingstructure of the SOFM and the fuzzy clusteringmodel of the FCM. The methodology was "rstproposed in Ref. [16] and has also been successfullyapplied in the "eld of image processing [17,18]. Theapplication of SOFM in exploratory data analysis(EDA) is also presented as an initial step of theclassi"cation process. During this stage, a graphicalrepresentation of the data under analysis is used forthe determination of the number of clusters to befurther extracted.
2. Materials and methods
2.1. Experimental data sets
We have used a set of images of negativelystained hexamers of the bacteriophage SPP1 G40Phelicase obtained in the electron microscope [19].2458 images were translationally and rotationallyaligned and their rotational power spectra werecalculated using the technique described in Ref.[20]. For experimental purposes, we created two
86 A. Pascual et al. / Ultramicroscopy 84 (2000) 85}99

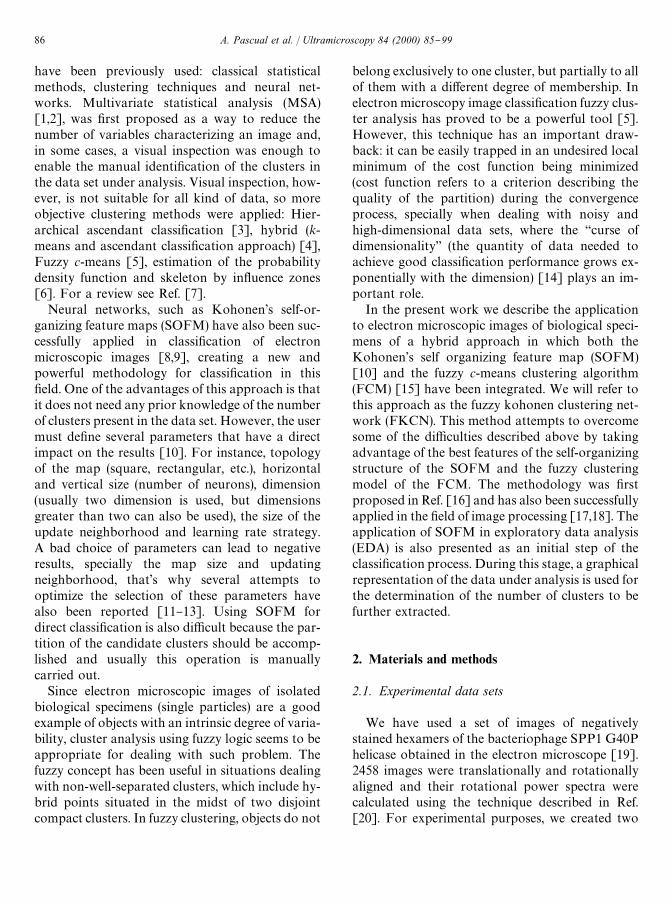
Fig. 1. Two examples of the images used for experiments. As it isevident, they have a low signal/noise ratio, making visual classi-"cation impossible.
data sets:
f Composed of 2458 rotational power spectra.Only the "rst 15 harmonics were considered,forming in this way a data set composed by 245815-dimensional feature vectors. Each spectrumwas classi"ed manually and was assigned a labelcorresponding to the most prominent harmonic(e.g. 6, 3, 2, etc.).
f Composed of 338 images that were extractedfrom a visually homogeneous 6-fold symmetricpopulation. Original images have a very lowsignal/noise ratio (Fig. 1). The dimension of eachimage is 50]50 pixels. As explained in Ref. [19]a ring mask with minimal radius of 12 pixels andmaximal radius of 20 pixels was applied to eachimage. In this way 338 818-dimensional featurevectors were obtained (each feature vector isformed by the pixels inside the mask). In this casea previous classi"cation was done using a non-supervised self-organizing map [19], dividing theset of images in two groups according to theirhandedness.
2.2. Kohonen's self-organizing feature maps
The Kohonen model is a neural network thatsimulates the hypothesized self-organization pro-cess carried out in the human brain when someinput data are presented [10]. The structure of thisneural network is composed of two layers: an inputlayer formed by a set of units (on for each feature ofthe input) and an output layer formed by units orneurons arranged in a two-dimensional grid. Thealgorithm maps a set of input vectors onto a set of
output vectors (neurons), but unlike other mappingalgorithms, the output response is ordered accord-ing to some characteristic feature of the input vec-tors. It can be interpreted as a nonlinear projectionof the p-dimensional input data onto an outputarray of nodes. Each neuron has a vector of coe$-cients associated with it (v
i3R1). In the future we
will refer to this vector as `weighta.The functionality of the algorithm can be de-
scribed as follows: when an input vector (xi3R1) is
presented to the net, the neurons in the output layercompete with each other and the winner (whoseweight has the minimum distance from the inputvector) as well as a prede"ned set of neighborsupdate their weights. This process is continueduntil some stopping criterion is met, usually, whenweight vectors `stabilizea or when a number ofiterations are completed.
The update rule for the output vectors used inthis algorithm can be mathematically described asfollows:
v*,t"v
*,t~1#a
thr,t
(xk!v
*,t~1) (1)
here, the learning rule atis a decreasing function of
t (time, or iteration number) that control the mag-nitude of the changes with time, and h
rtis a func-
tion that controls the size of the neighborhood(according to radius r) of the winning node to beupdated during training. Both a
tand h
r,tdecrease
monotonically during training in order to achieveconvergence. The explicit forms of a
tand h
r,tused
in this paper are as follow:
at"a
0Aiter!t
iter B, (2)
where iter is the maximum number of iterationsand a
0is the initial learning rate value.
hrt"exp (!Er
j!r
cE2/2p2
t) (3)
and
pt"1#(R
0!1)A
iter!t
iter B . (4)
R0
is the initial neighborhood radius and Erj!r
cE
is the distance in the map (output space) between
A. Pascual et al. / Ultramicroscopy 84 (2000) 85}99 87

node j (the node been updated) and node c (thewinning node).
2.3. Fuzzy c-means (FCM)
Fuzzy c-means clustering is a process of group-ing similar objects into the same class, but theresulting partition is fuzzy, which means that in thiscase images are not assigned exclusively to a singleclass, but partially to all classes. The goal is tooptimize the clustering criteria in order to achievea high intracluster similarity and a low interclustersimilarity using p-dimensional feature vectors. Thetheoretical basis of these methods has been re-ported in detail elsewhere [15,16] and will only bebrie#y reviewed here.
Let X"Mx1, x
2, x
3,2, x
nN denote a set of n fea-
ture vectors in R1. The data set X is going to bepartitioned into c fuzzy clusters, where 1(c(n.A c-partition of X can be represented by u
i(x
k) or
uik, where u
ikis a continuous function in the [0,1]
interval and represents the membership of xkin the
cluster i, 1)i)c, 1)k)n. In general [uik] can
be denoted by a c]n matrix; and must satisfy thefollowing conditions:
c+i/1
uik"1, (5)
0(n+k/1
uik(n. (6)
The Fuzzy c-means algorithm consists of an iter-ative optimization of an objective function
Jm(;, v)"
n+k/1
c+i/1
(;ik)mD
ik, (7)
where v"(v1, v
2, v
3, 2, v
c), with v
i3 R1 being the
cluster center of class i, 1)i)c, and:
Dik"(d
ik)2"Ex
k!v
iE2A
(8)
is the distance in the A norm from xkto v
i(A is any
positive de"nite p]p matrix) and
Exk!v
iEA"(x
k!v
i)5A(x
k!v
i). (9)
In this work we used euclidean distance (A"I).Other matrics are also possible.
The parameter m3(1,R). determines the `fuzzi-nessa of the partition. The performance of FCM isquite dependent of a good choice of m. Even if somestudies have been carried out in order to "nd somegood ways to "nd an optimum value of m [21], thischoice still depends on the data under analysis andit is rather heuristic.
For a given partition, the cluster centers can becalculated as follows:
vi"
+nk/1
(uik)mx
k+n
k/1(u
ik)m
, (10)
a new partition is obtained as
uik"C
c+j/1Cdik
djkD
2@(m~1)
D~1
, (11)
which completes one step of the algorithm. Theiterative optimization of the objective function con-tinues until a stopping criterion is met, usuallywhen the euclidean distance between;-matrices atsuccessive iterations falls below a threshold e (suc-cessive iterations show little change), that is
Et"E;
t!;
t~1E2(e, (12)
2.4. Fuzzy Kohonen clustering network (FKCN)
Fuzzy Kohonen clustering network [16] is a typeof neural network that combines both methodsdescribed above: SOFM and FCM. The structureof this self-organization network model consists oftwo layers: input and output (no hidden layer ispresent). The input layer is composed of n nodes,where n is the number of features and the outputlayer is formed by c nodes, where c is the number ofclusters to be found. Every single input node is fullyconnected to all output nodes with an adjustableweight v
iassigned to each connection. Given an
input vector, the neurons in the output layer updatetheir weights based on a pre-de"ned learning rate a.This approach integrates the fuzzy membershipuik
from the FCM in the following update rule:
vi,t"v
i,t~1#a
ik,t(x
k!v
i,t~1), (13)
where the learning rate a is de"ned as
aik,t
"(uik,t
)mt, (14)
mt"(m
0!t*m), (15)
88 A. Pascual et al. / Ultramicroscopy 84 (2000) 85}99

where *m can be
*m"(m0!1)/t
.!9. (16)
Any other values for *m are possible. m0
is anypositive constant greater than one, t is the currentiteration and t
.!9is the iteration limit.
This method shows several interesting proper-ties:
f The learning rate a is a function of the iterationt and its e!ect is to distribute the contribution ofeach input vector x
kto the next update of the
neuron weights in an inverse proportion to theirdistance from x
k. The winner node (whose weight
has the minimum distance from the input) up-dates its weight favored by the learning rate asthe iteration increases. In this way the Kohonenconcept of neighborhood size and neighborhoodupdating are embedded in this new learning rate.
f FKCN is a truly Kohonen-type algorithm, be-cause it features a well-de"ned method for ad-justing both the learning rate distribution andupdate neighborhood as function of time. Hence,FKCN inherits the `self-organizinga structure ofSOFM-type algorithms.
f FKCN it's not sequential: di!erent sequences ofthe data do not alter the results of the algorithm.
f For a "xed mt'1 FKCN is a truly Fuzzy
c-means algorithmf In the limit (m
t"1), the update rule reverts to
the classical Hard c-means rule (winners take all).
The steps for the algorithm are:
1. Fix c, and e to any small positive constants (i.e.e"0.0001).
2. Initialize the weight vector (cluster centers)v0"(v
1,0, v
2,0,2, v
c,0). Choose m
0'1 and
t.!9
.3. For t"1,2,2, t
.!9
(a) Compute all learning rates aik
as de"ned inEq. (14).
(b) Update all weight vectors vi,t
with:
vit"v
i,t~1#
+nk/1
aik,t
(xk!v
i,t~1)
+ns/1
ais,t
. (17)
(c) Compute Etfor the stopping criterion as
Et"Ev
t!v
t~1E2"+
i
Evi,t!v
i,t~1E2. (18)
(d) If Et)e then stop else next t.
3. Results
We have tested the proposed method on twodi!erent data sets: one composed of the rotationalpower spectra of a large set of images and the otherone composed directly by a set of images as de-scribed in materials and methods. In the "rst caseeach data had 15 components (15 "rst harmonics)and, therefore, the dimensionality of each data wasnot very high, however, the second data set wascomposed by images, which results into a poten-tially very high dimensionality problem. Whiletechniques such a MSA or PCA could have beenused for certain reduction of the dimension of thesecond data set, we have chosen instead to workdirectly with the images. The rationale has beenaimed at testing our newly proposed method undervery demanding conditions of large, noisy and highdimension data sets, a situation very common inelectron microscopy image analysis.
3.1. Experiment using rotational power spectra
3.1.1. Results using fuzzy Kohonen clustering net-work (FKCN)
In this example, 2458 images from puri"ed G40Pprotein samples were used for analysis. The rota-tional power spectrum [20] of each particle wascalculated taking into consideration only the "rst15 harmonics. Rotational symmetry analysis hasbeen previously used in this "eld [22,23]. Someother improvements over using rotational spectraanalysis for classi"cation have also been proposed[24,25], specially for dealing with misalignmentproblems (invariant classi"cation). However, theseinvariant methods su!er some problems [26], basi-cally the phase information from the Fourier trans-form when calculating the double autocorrelationand double self-correlation functions is eliminated,therefore a classi"cation of the invariants does not
A. Pascual et al. / Ultramicroscopy 84 (2000) 85}99 89

Fig. 2. 7]7 SOFM output manually clustered into four regions. Group A: particles with a prominent 6-fold component and a small, butnoticeable, 3-fold component. Group B: 2-fold symmetry. Group C: 3-fold symmetry and Group D: lack of a predominant symmetry.The number of elements assigned to each code vector is printed in the upper-right corner of each spectrum.
necessarily induce a correct classi"cation of theimages themselves. In our work, we deal with mis-alignment problems by doing several rotationaland translational alignment steps previous to thedetermination of the rotational power spectra.Since only the "rst 15 harmonics were calculated,a 2458 15-dimensional data set was generated.
Repeating the steps followed in a previous workon the G40P helicase by Barcena et al. [19], a 7]7SOFM was applied to the data set and the resultingmap was manually clustered into four classes. Theresults are shown in Fig. 2. Group A shows a pre-dominant 6-fold symmetry with a small, but notice-
able, component on harmonics 3 that must betaken into account. Group B represents 2-fold sym-metric images. Group C is closely related to 3-foldsymmetric particles and Group D shows onlya prominent harmonic in 1, which can be inter-preted as a lack of symmetry in this group ofimages.
In the "rst experiment FKCN was applied to thewhole set of particles' spectra, therefore it was usedwith the following con"guration: 15 input nodes(each node representing a component in the spec-trum) and 4 nodes in the output layer (representingfour clusters). A partition into 4 clusters was carried
90 A. Pascual et al. / Ultramicroscopy 84 (2000) 85}99

Fig. 3. Four cluster centers obtained from FKCN (m"1.5, stopping criterion e"10~6 and 500 iterations). The number of elementsassigned to each cluster is printed in the upper-right corner of each spectrum. Cluster 1 presents a predominant 6-fold harmonic witha week 3-fold one. Cluster 2 shows a predominant 2-fold harmonic. Cluster 3 shows a clear 3-fold symmetry and cluster 4 shows nosymmetry at all.
Table 1Comparison between FKCN and SOFM. m"1.5, t (iter-ations)"500!
SOFM FKCN Coincidence (%)
Group A Cluster 1 92.87%Group B Cluster 2 85.86%Group C Cluster 3 96.24%Group D Cluster 4 90.97%Group E" Cluster 4 63.36%
!Coincidence is de"ned as the percent of the spectra that wereclassi"ed in the same classes by both, manual clustering ofSOFM map and FKCN."Group E is formed by the elements eliminated from the
SOFM due to the fact of being at the borders of the clusters.
out in order to compare the results obtained by thenew FKCN with the results of the previous analysisperformed in Ref. [19]. The fuzzy constant m wasset to 1.5, stopping criterion e was set to 10~6 and500 iterations were used. The resulting code vectors(cluster centers) are shown in Fig. 3. As can bededuced from the observation of the cluster centers,the four groups visualized by the SOFM were alsosuccessfully extracted by FKCN (compare Figs.2 and 3). Quantitative results of coincidence areshown in Table 1. As it is evident, a high coincid-ence is obtained for the four clusters obtained byboth SOFM and FKCN. Nevertheless, a majordi!erence in the sets extracted by both algorithmsshould be noticed. When SOFM output was man-ually clustered, a set of code vectors that werebounding the groups was not considered in orderto avoid an erroneous classi"cation at the borders.However, FKCN considered the whole data setand as a result of this di!erence in behavior, thereexist a subset of the data that were eliminated fromthe SOFM that has been e!ectively classi"ed byFKCN. To study how this subset was classi"ed byFKCN, an additional group } Group E } has beenincluded in Table 1. Clearly, the majority of imagesin group E has been now classi"ed as belonging tocluster 4 (see Fig. 3), whose cluster center is a noisyspectrum with no discernible special features.
Another experiment using this data set was alsocarried out, but in this case and for comparisonpurposes, each spectrum was manually classi"edaccording to its most prominent harmonic withoutbeing presented to the SOFM. Essentially, the
spectra were classi"ed according to the almost pre-dominant occurrence of harmonic 1, or 2, or 3, or 4,or 5, or 6, or, "nally 7, as well as by the followingsequence of frequent combinations:
f Combination 1: predominant 6 and a minor 3 (inthis case 3 cannot be a harmonic of 6).
f Combination 2: predominant 6 with a high peakin 5 or in 7. This can be an error in the calcu-lation of the spectrum because of the choice ofthe center that was used for the expansion of theimage into the corresponding Fourier}Besselfunctions [20].
f Combination 3: High 10- and 11-fold compo-nents (maybe noise).
A number of individual spectra were impossibleto classify into the groups de"ned above and were
A. Pascual et al. / Ultramicroscopy 84 (2000) 85}99 91

labeled as N, standing for (Noise). The interpreta-tion of the rotational aspects of the data set isbeyond the scope of this paper.
The comparison of the results of FKCN usingfour clusters and this manual classi"cation of thespectra into the most typical harmonics was notobvious. While cluster 1 of FKCN matched verywell (89.30%) with those spectra corresponding tothe predominant occurrences of harmonic 6, cluster2 of FKCN matched reasonably well (72.72%) with2-fold spectra, and cluster 3 matched well (89.81%)with the 3-folded spectra, cluster 4 of FKCN} whose center in Fig. 3 presents a predominant1-fold component } was formed by spectra whichhad been manually classi"ed in di!erent manners.
We have used four clusters in our data set inorder to reproduce SOFM results, however, thefact that we obtained a cluster in which there isa mixture of manually classi"ed spectra, tends tosuggest that a partition into four clusters is not thebest for this data set. The initial partition of theSOFM into four clusters was probably very in-#uenced by the small size of the output array usedin Ref. [19]. Indeed, for data with important vari-ations among them, large output arrays are prefer-red, in order to have the needed #exibility in thenetwork to follow the trends of variations in theinput data (a point that will be addressed more indepth below). In this case, the initial SOFM analy-sis carried out using a 7]7 output array was ableto detect some of the more prominent trends ofvariability, but lacked the capability to detectsubtle changes. In an e!ort to provide a systematicframework to the task of classifying large and com-plex data sets, in the following section a new tooloperating on large SOFM output arrays will bepresented as a way to detect detailed trends ofvariability.
3.1.2. Exploratory data analysis (EDA) and FKCNAutomatic determination of the number of clus-
ters is known as cluster validity and it is a verycomplex topic in pattern recognition. It is knownthat most cluster validation approaches followsome assumptions about the data set and the algo-rithm used to generate the clusters [15,27}30]. Fur-thermore, it may be physically plausible to expectgood and logical results using di!erent number of
clusters, as the data are separated into increasingly"ner substructures. Several classical and new clus-ter validity techniques have already been applied inthe context of electron microscopy [5,27], andsome of them (partition coe$cient, partition en-tropy, non-fuzzy index, compactness and separ-ation index and Moreau and Jain functional) werealso used with these data sets, although, they didnot provide conclusive results: most of them sug-gested the use of two clusters. This behavior wasexpected because these functionals give their opti-mal values when clusters are compact and wellseparated, situation rarely found in real situations.
In this work we present a di!erent approach tocluster analysis by using SOFM for the task ofvisual exploratory data analysis [31}34]. Due to itslearning algorithm the SOFM forms a non-linearregression of the ordered set of output vectors(neurons) into the input space. In fact, it can beconsidered that the two-dimensional grid of outputvectors acts like an `elastic networka that followsthe distribution of the data [10]. The ordered na-ture of this regression justi"es the use of the SOFMas a display for data items, this is so because nearbyoutput neurons will have similar data mapped ontothem, so the density of vectors of an organized mapwill be an approximate re#ection of the density ofthe input samples [10,35]. In this way, the clusterstructure of the data can be visually detected by anappropriate display of the distances between thereference vectors (code vectors) of neighboringneurons in the map. One of the simplest method[31,36,37] is to sum up the distances of code vec-tors of adjacent neurons. Summing up the so-cal-culated distances gives a measure of dissimilaritybetween the neurons in the p-dimensional inputspace. The distances can be displayed for exampleas heights, giving a landscape appearance or codingdi!erent colors (gray levels). We used the latter inthis work.
For this purpose we have used a self-organizingmap of 64]64 neurons arranged in a rectangularlattice. The choice of the optimal map's parametersis a di$cult task, so we decided to generate 10di!erent map con"gurations and use the minimumweighted quantization error as the selection cri-terion as suggested in Ref. [10]. Fig. 4 showsthe distances between neighboring neurons on the
92 A. Pascual et al. / Ultramicroscopy 84 (2000) 85}99

Fig. 5. Ten cluster centers obtained from FKCN (m"1.5, stopping criterion e"10~6 and 500 iterations). The number of elementsassigned to each cluster is printed in the upper-right corner of each spectrum.
Fig. 4. Display of a 64]64 square SOFM. The label of eachneuron coincides with the label of the closest spectrum accord-ing to manual classi"cation previously carried out. The label ofeach group is arbitrary and indicates the number of the cluster(see Fig. 5).
resulting map. Light areas represent zones of highdegree of clustering, while dark areas representgaps between clusters. It should be noticed that inthis application SOFM was trained in two stages,as suggested by Kohonen [10]. The "rst stage iscalled the `ordering phasea, where the code vectorsare "rst ordered, for this purpose a large initial
neighborhood radius (usually the whole neighbor-hood) and a large learning rate is used. In this caseinitial radius (R
0) was set to 64 and initial learning
rate (a0) was set to 0.05. One thousand iterations
were used. The second phase is used for "ne-tuningthe code vectors, hence a smaller initial neighbor-hood radius and a smaller learning rate are used(R
0was set to 4 and a
0was set to 0.03). Five
thousand iterations were used during this phase.Because of the very small neighborhood radiusused in the second run, the resulting map was notvery smooth; in this way `compact clustersa witha small light area inside a black border were ob-tained. There is also a big white area in the mapwhere virtually no images have been assigned, thisis therefore a zero-density zone which was obvious-ly not included in the analysis.
The visual inspection of the map suggested theuse of 10 clusters for new computations and Fig.5 shows the 10 cluster centers obtained when ap-plying FCKN with m"1.5, stopping criterione"10~6 and 500 iterations.
The interpretation of these new results, as well asthe comparison with the manual classi"cation is asfollows:
Cluster 1: 100% of coincidence. This clustershowed 232 individual spectra with a high andpredominant 6-fold symmetry, there is a full coin-cidence with the manual classi"cation.
Cluster 2: This cluster is composed of a mixtureof spectra with the common property of havinga predominant peak in the 6 component but with
A. Pascual et al. / Ultramicroscopy 84 (2000) 85}99 93

high peaks at others components like 8 and 9.54.86% of the spectra was manually classi"ed as6 with components at 4, 8 and 9, 26.84% wasclassi"ed as 8-fold symmetry and the rest is noise(peaks everywhere). This group can be consideredas a noisy 6-fold symmetric subset that because ofbeing so populated requires special treatment (itcould then be a candidate for an even "ner degreeof classi"cation).
Cluster 3: 99.66% of coincidence. 297 spectrashowed a high 2-fold component. 296 matched withmanual classi"cation.
Cluster 4: 82.09% of coincidence. This cluster iscomposed of 229 spectra and shows a clear 5-foldsymmetry, 188 matched the manual classi"cation.By looking at the individual cases of the spectrafalling in this cluster, it could be noticed that a highcomponent in 6 is also present. This e!ect in thespectrum could be produced by a wrong alignmentof 6-fold symmetric images. The wide peak aroundthe 5 component in the cluster center corroboratesthis. By looking at the 41 individual spectra thatwere incorrectly assigned to this cluster, it could benoticed that 28 of them were manually classi"ed as6-fold symmetry, however, in most of them a bigcomponent in 5 is also present.
Cluster 5: 85.34%. This cluster is composed by307 spectra and shows a 3-fold symmetry, 262 ofthem matched the manual classi"cation. As it isclearly shown in the cluster center, a predominantbut not very high 3-fold component, with a notice-able harmonic in 9, is detected. However, by ana-lyzing individual spectra of erroneously classi"eddata, all of them were manually classi"ed either asNoise or 1-fold symmetry, although they also pre-sented high 3 and 9 components, which explain theclassi"cation into this group.
Cluster 6: 74.73% of coincidence. This cluster isformed by 190 7-fold symmetric spectra, and 142 ofthem coincided with manual classi"cation. Sim-ilarly to Cluster 4, a high peak around 6 was alsonoticed in the whole set of data falling in thiscluster. 17 cases that were incorrectly classi"ed as7-fold symmetry were manually classi"ed as 6-foldsymmetry. Again, the images whose spectra wereclassi"ed in this cluster could be incorrectly alignedproducing this subset of 7-fold symmetry. (See alsothe wide peak around 7 in the cluster center.)
Cluster 7: 100%. 233 spectra were classi"ed as1-fold symmetry (maybe a lack of clear rotationalsymmetry in the images). All of them matched withmanual classi"cation.
Cluster 8: 100%. 201 spectra showed a high andpredominant 3-fold symmetry. All of them matchedwith manual classi"cation.
Cluster 9: 94.51%. 237 spectra were classi"ed as4-fold symmetry, 224 of these matched with manualclassi"cation.
Cluster 10: 100% of coincidence. This clusterholds an interesting group of 6-fold and 3-foldsymmetric images. There are 274 spectra in thiscluster, where the 58.39% were manually classi"edas 6- and 3-fold symmetry (in this case 3 is nota harmonic of 6), the rest was manually classi"ed as3-fold but with a very high 6 component.
3.2. Experiment using 3- and 6-fold symmetricimages
In this experiment, 338 images representinghigh-dimensional data and very noisy data wereused for testing the algorithms. In this case all theseimages share similar rotational symmetry (6-foldwith a minor 3-fold component) and belong toGroup A of the former rotational symmetry experi-ments, see Ref. [19] for details. Classi"cation of thiskind of particle is very di$cult because of the lowsignal/noise ratio and the apparent structural sim-ilarity of the population. Two representative im-ages from this data set are shown in Fig. 1.
For comparison purposes with previous work[19], a 7]7 SOFM was applied to the data set andthe resulting map was manually clustered in twodi!erent classes that visually exhibited an oppositehandedness. This result is shown in Fig. 6, wherethe SOFM was clustered in two classes whose maindi!erence is in the handedness of the periphery ofthe particles.
In the "rst experiment using FKCN we clusteredthe data set into two clusters in order to reproducethe results obtained by SOFM (di!erent values form, stopping criterion e and iterations were used).However, FCKN could not "nd two clusters re-lated only to variations in handedness of the par-ticle as obtained by SOFM. Fig. 7 shows the clustercenters and the average images belonging to both
94 A. Pascual et al. / Ultramicroscopy 84 (2000) 85}99

Fig. 6. 7]7 SOFM output visually clustered in two regionswith di!erent handedness. The number of particles assigned toeach code vector is printed in the lower-right corner of eachimage.
Fig. 7. Top: two cluster centers obtained from FKCN (m"1.5,stopping criterion e"10~6 and 500 iterations). Bottom: Aver-age images of the particles assigned to each cluster.
Fig. 8. Display of a 15]7 hexagonal SOFM. The label of eachunit coincides with the label of the closest image according tovisual classi"cation previously carried out by SOFM.
Fig. 9. Three cluster centers obtained from FKCN (m"1.5,stopping criterion e"10~6 and 500 iterations). The number ofparticles assigned to the cluster is printed in the lower-rightcorner of each image.
clusters. It is evident that cluster 1 contains a mix-ture of particles with di!erent handedness.
In order to get a better idea of the underlyingdistribution of this data set, we again used SOFMfor exploring the data. A 15]7 map was selectedfrom 10 di!erent candidate maps with di!erentsizes, using the quantization error as the selection
criterion. The resulting map was again trained intwo phases. In the ordering phase the radius (R
0,)
was set to 13 and initial learning rate (a0) was set to
0.05. 1000 iterations were used. The "ne-tuningphase was carried out with R
0set to 7, a
0set to 0.03
and 5000 iterations. Fig. 8 shows the distancematrix of the resulting map.
The distance map suggested a distribution of thedata in three apparently homogeneous clusters(light areas in the map). Group A obtained byvisually clustering of the 7]7 map is clearly iso-lated in this 15]7 map, however, Group B seemsto be composed by two di!erent classes. We thenclustered the data set with FKCN into three groupsusing m"1.5, stopping criterion e"10~6 and 500iterations. Cluster centers obtained are shown inFig. 9. Classi"cation accuracy is also shown inTable 2.
Analyzing the results of the algorithm with threeclusters. It is clear that FKCN now correctly clus-tered Group A in SOFM, since this group is ac-counted for by cluster 3, however, Group B hasbeen split into clusters 1 and 2. Then a questionarises: why FKCN needed three clusters to `"nda
A. Pascual et al. / Ultramicroscopy 84 (2000) 85}99 95

Fig. 10. Average Images and rotational spectra of clusters derived by FKCN.
Table 2Comparison between FKCN and SOFM in image classi"cation.m"1.5. t (iterations)"500!
FKCN SOFM
Cluster 1 Group B 93.23%Cluster 2 Group B 96.15%Cluster 3 Group A 89.3%
!Coincidence is de"ned as the percent of the images that wereclassi"ed in the same classes by both, manual clustering ofSOFM map and FKCN.
this structure of the data? The answer can be foundby analyzing the particles assigned to these clusters.The images from the three classes were indepen-dently realigned to obtain their average. Fig. 10shows the average image and rotational spectra ofsubsets belonging to each cluster. In the case ofcluster 3, a counterclockwise handedness is clearlyobserved which is in agreement with group A ofSOFM. In the case of clusters 1 and 2 the averageimages show the same handedness (which in thiscase is clockwise) in agreement with Group B ofSOFM. However, even if the handedness is thesame for clusters 1 and 2, a deeper analysis re#ectsdi!erences in the rotational symmetry spectra be-tween these two clusters. To be precise, both ofthem have a predominant 6-fold symmetry, but
cluster 2, as oppose to cluster 1, is in#uenced bya noticeable 3-fold component. This very subtledi!erence could not be visually detected in theSOFM classi"cation carried out in Ref. [19], andprobably explains the need to use three clusters forthe run of FKCN. Indeed, these new results indi-cate that there are two trends of variability in thisdata set, symmetry and handedness, that naturallywere better handled by classifying the particles intothree classes than into two. This small symmetryvariation in the data set may also be the cause ofmisclassi"cation obtained when using two clusters:symmetry was in#uencing the results more thanhandedness.
3.3. Fuzzy c-means algorithm
Fuzzy c-means clustering algorithm (FCM) wasalso tested on both data sets in order to compare itsperformance with FKCN. In both cases severalparameters were tried: fuzzy constant (ranging from1.1 up to 5), iterations (ranging from 500 up to10 000), termination criteria (stopping when cha-nges of cluster center values fell below 0.000001 andstopping when all iterations where completed),number of clusters (ranging from 2 up to 10) anddi!erent cluster centers initializations (random,zero and using the values of some randomly se-lected feature vectors). Not acceptable results were
96 A. Pascual et al. / Ultramicroscopy 84 (2000) 85}99

obtained. In the case of the rotational spectra,a great instability was observed when varying thefuzzy constant, and only the 6- and 3-fold symmet-ries (which corresponded to the most populatedgroups) were approximately detected by the algo-rithm, while the rest of the clusters were erroneous-ly selected. When using the image pixels directly,FCM was unable to detect any cluster tendency,even with di!erent parameters. In both cases anearly termination was observed (changes at success-ive iterations fell below a threshold), meaning thatthe algorithm probably converged to a local min-imum far away from the optimal solution.
4. Discussion and conclusion
In this paper, a new fuzzy classi"cation techniquehas been applied to the study of biological speci-mens by electron microscopy. This technique usesa special type of Neural Network named fuzzykohonen clustering network that successfully com-bines the well-known self-organizing feature mapsand the fuzzy c-means clustering technique.
The need of classi"cation tools suitable for work-ing with large sets of noisy images is evident in theelectron microscopy "eld. In this work we haveproposed a new approach which is the combinationof two methods already applied in this context. Theproposed method combines the ideas of fuzzy mem-bership values for calculating the learning rates,while it has the parallelism of FCM and the struc-ture of the update rules of SOFM, producing arobust clustering technique with a self-organizingstructure.
In this work we have stressed the importanceof the selection of good parameters in SOFM, suchas the size of the output grid. The experimentscarried out showed that using small and squareself-organizing map on large data sets might loosesome details of the mapped probability densityfunction (pdf), suggesting the use of a larger map toallow the `elastic networka formed of the codevectors to be oriented along with the pdf. [10].At the same time, large self-organizing maps arevery useful for exploring the data sets and gettinga better idea of the data distribution by showingthe distances between neighboring neurons of the
map [31,32] in the framework of exploratory dataanalysis.
EDA is a set of tools for illustrating the intrinsicstructure in any statistical data set, its main goal isto present a data set in a such a way that it can beeasily understandable and at the same time pre-serve the essential information of the original dataset. SOFM is a method that combines both, projec-tion and clustering, two very important features forexploration. However, even if in some cases theclustering structure is evident, the border betweenclusters is not easy to determine, for that reason inthis work we proposed the use FKCN for theautomatic extraction of clusters once we know thenumber of clusters in the data set by previousexploration. SOFM has been successfully appliedin visually exploring large data sets in other context[32,33], but to the best of our knowledge; this is the"rst time that this kind of exploration is used inlarge image data sets.
FKCN have been fully tested in this work usingtwo kinds of data sets that are very common inmany Electron Microscopy studies: the rotationalpower spectra and the images of individual par-ticles (In this case images of the G40P helicase wereused). In both cases FKCN was able to discrimi-nate both, evident and subtle variation in the dataset. It should be noted that detailed analysis like theone carried out in this work allows a "ner charac-terization of big data sets. For instance, in the caseof the rotational spectra where 10 apparent clusterswere extracted, it is obvious that some of the clus-ters were produced by a wrong rotational align-ment of the images (clusters 4 and 6), the imagesassigned to those clusters could be re-aligned againto be used as part of other groups. Similarly, noisyimages (the ones labeled with 1 or Noise) can de"-nitely be excluded from the population. Clusterslike 5 and 9 could be merged because both of themrepresent 3-fold symmetric particles, although withsome intrinsic di!erences. The same occurs withclusters 1 and 2 (6-fold symmetry), but the decisioncould be taken after a detailed analysis of thoseindividual clusters. The results demonstrate thesuitability of this method for working with thesekind of high-dimensional and noisy data sets.
It is important to note that FKCN can also beconsidered as an optimization algorithm like FCM,
A. Pascual et al. / Ultramicroscopy 84 (2000) 85}99 97

so the possibility of falling into local minimumbefore converging to the solution is present. How-ever, the experiments carried out in this workshow that FKCN has properly converged in allthe analyzed cases. On the contrary, FCM fell ina local minimum with these data. The explanationof this behavior can be found in the good propertiesof the self-organization structure of the FKCNalgorithm.
It is also important to point out that FKCNmakes assumptions concerning the shape of theclusters. These assumptions are implicit in the dis-tance function used (hyperspherical shape if euclid-ean distance is used). However, in practicalsituations, the clusters' shape is not always hyper-spherical. Furthermore, the use of SOFM as a pre-vious exploration step before clustering might beproblematic in some special cases due to the factthat the non-linear mapping carried out by SOFMmight distort the real shape of the clusters. In futurework several other clustering approaches are goingto be explored to partially solve this problem,specially those that make no assumptions about theshape of the clusters.
Comparing this clustering approach with otherspreviously proposed in the "eld for structure-basedclassi"cation, we should emphasize that thismethod, like SOFM, directly performs a classi"ca-tion (assignment of data to cluster centers), while atthe same time o!ers a direct visualization by inspect-ing the cluster centers. Also, the fuzzy nature of thealgorithm allows a better classi"cation of inputdata to clusters, in this way confusing data (e.g.input vectors that fall in the border of two clusters)can be assigned to the one which higher fuzzymembership or they can even be excluded from thepopulation to avoid classi"cation mistakes.
We propose that this type of neural computationapproaches (self-organizing networks) properlycombined with FKCN can be successfully em-ployed for exploration of data and classi"cation inthe electron microscopy "eld.
Acknowledgements
The developments described here have been par-tially supported by the Spanish Plan Nacional de
BiotecnologmHa through grant number BIO 98-0761.We would also like to thank Prof. Noel Bonnetfrom INSERM Unit 314 and University of Reims(LERI) for his comments on the present work, therelationship with him having been supported by thelateral Spanish}French travel grant No. HF 1998-0065.
References
[1] M. Van Heel, J. Frank, Ultramicroscopy 6 (1981) 187.[2] J. Frank, M. Van Heel, J. Mol. Biol. 161 (1982) 134.[3] M. Van Heel, Ultramicroscopy 13 (1984) 165.[4] J. Frank, J.P. Betraudiere, J.M. Carazo, A. Verschoor, T.
Wagenknecht, J. Microsc. 150 (1988) 99.[5] J.M. Carazo, F.F. Rivera, E.L. Zapata, M. Radermacher, J.
Frank, J. Microsc. 157 (1990) 187.[6] M. Herbin, N. Bonnet, P. Vautrot, Pattern Recognition
Lett. 17 (1996) 1141.[7] N. Bonnet, J. Microsc. 190 (1998) 2.[8] R. Marabini, J.M. Carazo, Biophys. J 66 (1994) 1804.[9] H. Zuzan, J.A. Holbrook, J.A. Kim, G. Harauz. Optik 109
(1998) 181.[10] T. Kohonen, Self-Organizing Maps, 2nd edition, Springer,
Berlin, 1997.[11] H. Zuzan, J.A. Holbrook, P.T. Kim, G. Harauz, Ultramic-
roscopy 68 (1997) 201.[12] H.P. Siemon, Artif. Neural Networks 2 (1992) 1573.[13] T. Villmann, R. Der, M. Herrmann, T.M. Martinetz, IEEE
Trans. Neural Networks 8 (1997) 256.[14] R. Bellman, Adaptive Control Processes: A Guided Tour,
Princeton University Press, Princeton, NJ, 1961.[15] J.C. Bezdek, Pattern Recognition with Fuzzy Objective
Function Algorithms, Plenum Press, New York, 1984.[16] E. Chen Kuo Tsao, J.C. Bezdek, N.R. Pal, Pattern Recog-
nition 27 (1994) 757.[17] Jin Shin Chou, Chin-Tu Chen, Wei-Chung Lin, Image
Process 1998 (1993) 220.[18] L.A. Diago, A. Pascual, A. Ochoa, A genetic algorithm for
automatic determination of the Cup/Disc ratio in eyefundus images. Proceedings TIARP'98, Mexico, 1998, pp461}472.
[19] M. Barcena, C. San MartmHn, F. Weise, S. Ayora, J.C.Alonso, J.M. Carazo, J. Mol. Biol. 283 (4) (1988) 809.
[20] R.A. Crowther, L.A. Amos, J. Mol. Biol. 60 (1971) 123.[21] H. Choe, J. Jordan, On the optimal choice of parameters in
a fuzzy c-means algorithms, Proceedings of the First IEEEConference on Fuzzy Systems, San Diego, 1992.
[22] E. Kocsis, M.E. Cerritelli, B.L. Trus, T. Cheng, A.C.Steven, Ultramicroscopy 60 (1995) 219.
[23] G. Harauz, Micron 29 (1998) 161.[24] M. Schatz, M. van Heel, Ultramicroscopy 32 (1990)
255.[25] M. Schatz, M. van Heel, Ultramicroscopy 45 (1992) 15.
98 A. Pascual et al. / Ultramicroscopy 84 (2000) 85}99

[26] J. Frank, Three-Dimensional Electron Microscopy ofMacromolecular Assemblies, Academic Press, New York,1996.
[27] F.F. Rivera, E.L. Zapata, J.M. Carazo, Pattern Recogni-tion Lett. 11 (1990) 7.
[28] R.C. Dubes, J. Pattern Recognition 20 (1987) 645.[29] R.C. Dubes, A.K. Jain, J. Pattern Recognition 11 (1979)
235.[30] B.S. Everit, J. Biometrics 35 (1979) 169.[31] A. Ultsch, H.P. Siemon, Kohonen's self organizing feature
maps for exploratory data analysis. Proceedings ofICNN'90, International Neural Network Conference,1990, pp. 305.
[32] S. Kaski, Data exploration using self-organizing maps,Acta Polytechnica Scandinavica, Mathematics, Comput-ing and Management in Engineering Series No. 82,Dr.Tech. Thesis, Helsinki University of Technology,Finland, 1997.
[33] S. Kaski, T. Kohonen, Exploratory data analysis by theself-organizing map: Structures of welfare and poverty inthe world, in: A.-P.N. Refenes, Y. Abu-Mostafa, J. Moody,A. Weigend (Eds.), Neural Networks in Financial Engin-eering, World Scienti"c, Singapore, 1996, pp. 498}507.
[34] S. Kaski, J. NikkilaK , T. Kohonen, Methods for interpretinga self-organized map in data analysis, in: M. Verleysen(Ed.): Proceedings of ESANN'98, 6th European Sympo-sium on Arti"cial Neural Networks, Brussels, 1998pp. 185}190.
[35] H. Ritter, IEEE Trans. Neural Networks 2 (1991)173.
[36] A. Ultsch, Knowledge extraction from self-organizing neu-ral networks, in: O. Opitz, B. Lausen, R. Klar (Eds.),Information and Classi"cation, Spriger, Berlin, 1993, pp.309}313.
[37] M.A. Kraaijveld, J. Mao, A.K. Jain, IEEE Trans. NeuralNetworks 6 (1995) 548.
A. Pascual et al. / Ultramicroscopy 84 (2000) 85}99 99

![[8] Dipolar Couplings in Macromolecular Structure ... · [8] DIPOLAR COUPLINGS AND MACROMOLECULAR STRUCTURE 127 [8] Dipolar Couplings in Macromolecular Structure Determination By](https://static.fdocuments.in/doc/165x107/605c24b70c5494344557be4f/8-dipolar-couplings-in-macromolecular-structure-8-dipolar-couplings-and.jpg)