
Mapping a new system for outdoor GSM signal strength
10
Computational Methods for Differential Equations http://cmde.tabrizu.ac.ir Vol. 7, No. 4 (Special Issue), 2019, pp. 535-544 Mapping a new system for outdoor GSM signal strength Lway Faisal Abdulrazak * University Research Center, Computer Science Department, Cihan University Sulaimaniya, Iraq. E-mail: [email protected] Kusay Faisal Al-Tabatabaie University Research Center, Computer Science Department, Cihan University Sulaimaniya, Iraq. E-mail: [email protected] Abstract The Analysis of radio wave propagation is a crucial part in designing an efficient wireless communication system. The Geographic information system (GIS) can be incorporated into this procedure because most of the factors in radio wave propa- gation are geographic features. For reliable cellular mobile communication received signal level must be above the receiver sensitivity. Determining of network zone in which this requirement is satisfied is done in the phase of planning of the mo- bile network by using various methods of field strength prediction. In this Paper, a system for automatic measurement of signal level in Global System for Mobile Communication (GSM) 900/1800 MHz channel with Global Position System (GPS) localization is tested in a field driving test carried out in Suaimania City, Kurdis- tan Region, Iraq. The result indicates that through the use of GSM, GPS and GIS (G3) technologies a map could be developed and used to study the signal strength of a particular location. In addition, the multipath fading phenomena effect of the mobile radio coverage could be also analyzed based on the wireless communication principles. Keywords. GSM, Mobile networks, GIS, Signal strength. 2010 Mathematics Subject Classification. 65L05, 34K06, 34K28. 1. Introduction Wireless communication has developed into one of the most exciting technologies of the last century since its birth in 1897 as the radio telegram see [1]. Wireless communication in the past several decades is better known as cellular network com- munication. Currently, requirements for providing wireless communication services can be simply described as the 5Ws. That means, not only the availability, but also the quality of the network has become a key parameter of wireless communication service. In this case, cellular network design is becoming more and more important since the network quality is highly dependent on the distribution of base stations [2]. To design a cellular network for a particular region efficiently and accurately, the analysis of radio wave propagation is an important determination. This process is * Corresponding author. 535
Transcript of Mapping a new system for outdoor GSM signal strength

Computational Methods for Differential Equationshttp://cmde.tabrizu.ac.ir
Vol. 7, No. 4 (Special Issue), 2019, pp. 535-544
Mapping a new system for outdoor GSM signal strength
Lway Faisal Abdulrazak∗University Research Center, Computer Science Department,Cihan University Sulaimaniya, Iraq.E-mail: [email protected]
Kusay Faisal Al-TabatabaieUniversity Research Center, Computer Science Department,Cihan University Sulaimaniya, Iraq.E-mail: [email protected]
Abstract The Analysis of radio wave propagation is a crucial part in designing an efficient
wireless communication system. The Geographic information system (GIS) can beincorporated into this procedure because most of the factors in radio wave propa-
gation are geographic features. For reliable cellular mobile communication received
signal level must be above the receiver sensitivity. Determining of network zonein which this requirement is satisfied is done in the phase of planning of the mo-
bile network by using various methods of field strength prediction. In this Paper,a system for automatic measurement of signal level in Global System for Mobile
Communication (GSM) 900/1800 MHz channel with Global Position System (GPS)
localization is tested in a field driving test carried out in Suaimania City, Kurdis-tan Region, Iraq. The result indicates that through the use of GSM, GPS and GIS
(G3) technologies a map could be developed and used to study the signal strength
of a particular location. In addition, the multipath fading phenomena effect of themobile radio coverage could be also analyzed based on the wireless communication
principles.
Keywords. GSM, Mobile networks, GIS, Signal strength.
2010 Mathematics Subject Classification. 65L05, 34K06, 34K28.
1. Introduction
Wireless communication has developed into one of the most exciting technologiesof the last century since its birth in 1897 as the radio telegram see [1]. Wirelesscommunication in the past several decades is better known as cellular network com-munication. Currently, requirements for providing wireless communication servicescan be simply described as the 5Ws. That means, not only the availability, but alsothe quality of the network has become a key parameter of wireless communicationservice. In this case, cellular network design is becoming more and more importantsince the network quality is highly dependent on the distribution of base stations[2]. To design a cellular network for a particular region efficiently and accurately,the analysis of radio wave propagation is an important determination. This process is
∗ Corresponding author.
535

536 L. ABDULRAZAK AND K. AL-TABATABAIE
also called wireless planning. Hence to meet the mobile network planning efficiency inSulaimanyia City Center, a useful map that illustrates the Global System for MobileCommunication (GSM) signal strength and shows the coverage of the GSM operatorswithin the Sulaimanyia City is necessary [3, 4, 5]. The important of obtaining a sat-isfactory coverage of locations is of great interest, however, random previous studiesand incomplete data on GSM coverage have hindered the progress in obtaining GSMsignal strength coverage map. Furthermore unreliable data of GSM coverage regard-ing Sulaimanyia cause a delay in information on GSM radio coverage in Sulaimanyia.Mapping the GSM level is a great of interest in which plotting the mobile radio cov-erage in a particular area by visualizing in a digital map gives better mobile networkplanning and standard level in radio maintenance quality control [2, 6, 7, 8]. Mostpeople would like to have very good GSM signal coverage around the day regardlessthe mobile propagation problems such as multipath fading. This paper is carried outto solve this type of problem [9]. Geographic Information System (GIS) technology iscritical to the success of the planning process in a cellular network operation, hencedemographic and customer problems analyses are needed. Plotting the mobile radiocoverage by visualizing it in the map provides better level in quality control by de-veloping the predictive aspects of the implementation process [10, 11, 12]. Customercare locates coverage or quality-specific customer claims by placing reported signalproblems for example on an Intranet Web page. Transmission engineers analyze theincident reports and produce terrain profiles for transmission planning. Thereforedue to that maintaining up-to-date coverage map of the network is must and veryuseful. Accordingly this paper first objective is to use economical developed systemfor automatic measurement of signal level in GSM 900/1800 MHz channel with GPSlocalization [13]. Then, to carry out empirical data collection needed for the mapdevelopment and to analyze the empirical data for radio propagation of coverage areain GSM cellular system.
2. GIS in Wireless Signal Propagation
In this paper, GIS-aided data analysis was implemented in an experimental derivetest to study the influence of geographic features on the predicted wireless signalstrength along roadways in 5 km radius of Sulaimaniya City center, Iraq. Datawere collected by the G3 Integration system that recorded the strength of the GSM900/1800 MHz signal received from the Mobile operator towers (Asiacell, Zain Iraq,Korek Telecom) while driving [14]. GIS mapping also performed a significant role inthe analysis of driving test data. Terrain, land cover types and radio wave propagationpath were hypothesized among the factors affecting the signal strength at each spotin the study area. Propagation mechanisms are very complex and diverse. Becauseof the separation between the receiver and the transmitter, attenuation (reduction orloss) of the signal strength occurs. It is important to understand radio propagation forland mobile radio for a number of reasons. Multipath propagation between a vehicleand a base station prevents %100 reliable communications throughout a service area.Free-space propagation takes place between a transmitting and a receiving antennain empty space with no interfering bodies between. There are no ground reflectionor diffraction losses. Free-space attenuation occurs during the first few miles of path.

CMDE Vol. 7, No. 4 (Special Issue), 2019, pp. 535-544 537
Free-space loss is 6 dB per octave of distance (doubling the distance) [15]. The formulafor free-space attenuation using a dipole antenna for both antenna and receiver is:
Attenuation(dB) = 32.6 + 20logf + 20logd . (2.1)
Where; F = frequency in megahertz, d = distance in miles between the transmittingand receiving antennas. Diffraction losses as the radio wave passes over an obstacleis one limitation to free-space propagation. Plane-earth propagation is the multipathpropagation due to the reflection from a smooth earth. Plane-earth attenuation istwice that of free space attenuation with distance. That is, plane-earth propagationis attenuated 12 dB per octave of distance compared to the 6 dB per octave of distancefor free space. The formula for plane earth attenuation is decibels is:
Attenuation(db) = 144.6 + 40logD − 20log(HTHR) . (2.2)
Where; D= distance between transmitting and receiver dipole antennas, miles, HT=height of the transmitting antenna, ft, HR= height of the receiving antenna, ft [16,17, 18]. To achieve the proposed objectives, there are some steps were followed asfollows: Collection of GSM signal level coupled with the GPS localization aroundCity Center. Collection of data in the form of map for City Center and build itsdata base. Collection the GPS coordinates of the GSM operator towers in the CityCenter Locations. Analysis of the signal strength level in City Center based on themultipath fading.
3. Data Collection and Analysis
Several data collection were done in which all of them were conducted inside thestudy area, the data collection are as follows: A derive test was done around Su-laimanyia City Center campus for collecting the signal strength data. Basic data wascollected in the form of AutoCAD drawing format. This data includes the map of thestudy area which contains the details of the buildings and the road network. GPSsurvey data collection for obtaining the contour lines was needed. Asiacell, Zain Iraq,Korek Telecom mobile towers GPS coordinate determined within City Center for ob-taining the coverage map for each. After the collection of the data sets , each data setwill be managed separately based on the available software tools in order to set up anintegration of the all the data sets layers to come with the G3 map. Regarding theCity Center map, it will be manipulated by applying some changes on it. The changesmay include the cleaning of drawing and development of building and network topol-ogy. After these changes the data base will be developed by defining the buildingswhich are collected from the master plan map. Regarding the GSM signal strength,each signal reading will be processed along with its GPS coordinates. Signal levelmeasurement along with the GPS localization would be saved as text document innotepad file which contains signal strength, cell ID, latitude, longitude, date and timerespectively. After that the next step to convert the text file document into a shapefile so that it can be processed by the GIS ArcView software. Moreover, Contour lineswill be subjected for processing by using Skypro software, since the contour line playsan active role in effecting the signal strength. For this data collection purpose a GPSsurvey will be conducted. After processing the above mentioned data collection an

538 L. ABDULRAZAK AND K. AL-TABATABAIE
integration of these sets will take place in ArcView software as overlaid themes. Oncethe G3 map is obtained it will be shown in Graphical and text formats. Graphicalformat will show the signal strength in Sulaimaniya City Center based on gradualcolor classes, while the text format will show the map data base [19]. The analysispart can be done based on the cellular network communication and multipath fadingproblem.
4. Classification of collected data
The data collected can be classified in few classes depending on its necessity asbelow:
• Measurement of the signal strength level.• Graphical data about the study area.• Featured data about the study area.• Attribute data about the buildings in the study area.• Attribute data about the Mobile towers.• Other features required for analysis.
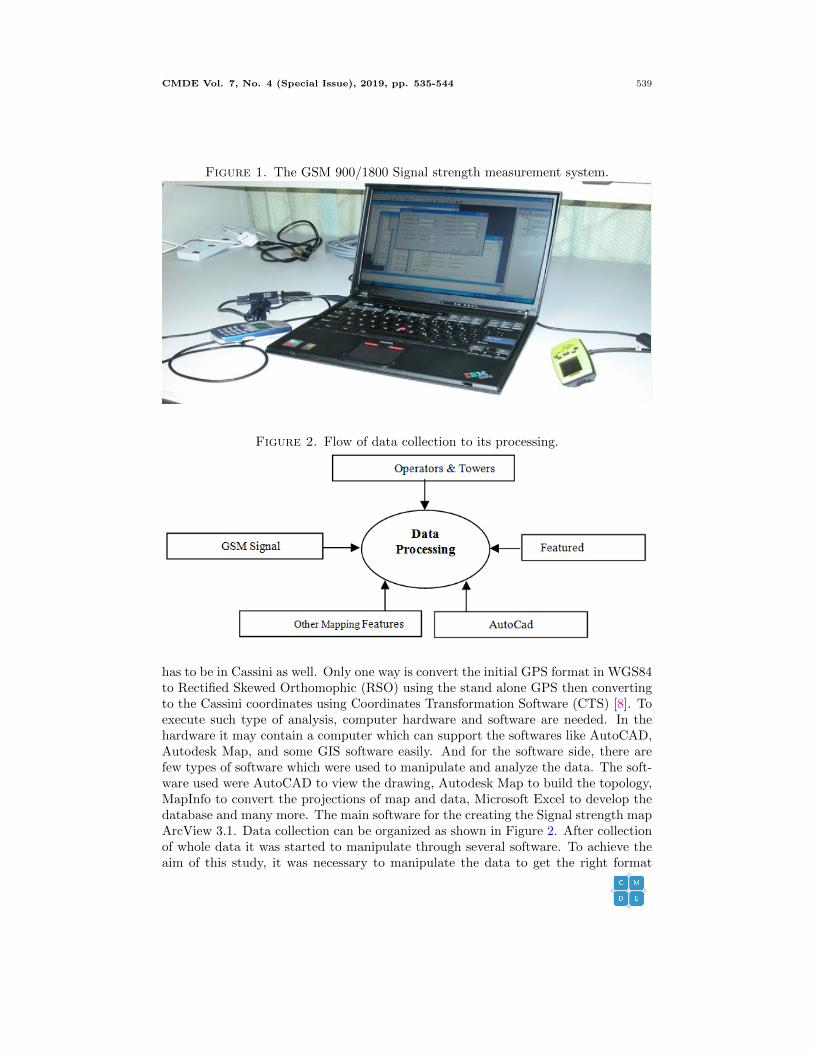
The measurement of signal strength in the study area was carried out by the devel-oped system for measurement of signal level. Its a system in which an integration ofGSM mobile is done with the GPS localization as shown in Figure 1. This integrationis done in steps as shown below: Step 1: Development of GSM module to collect thereceived signal strength. Netmonitor menu in the Nokia hand phone will be activated.This menu contains various network parameters which are sent by base station viathe air interface. Only received signal strength will be extracted. Step2: Develop-ment of GPS module to acquire position of measured data. NMEA0183 protocol isutilized to transmit the data from GPS to the PC. The data will then be processedin order to get the latitude and longitude of the desired locations. Step3: Integrationof the GSM and GPS along with the Visual Basic program in order to obtain therequired GSM signal level along with their GPS coordinates. Step 4: Conduct fieldmeasurement of signal strength of network provider, by carrying out test derive inSulaimaniya City Centre. Figure 1 Shows the GSM 900/1800 Signal strength mea-surement system. A derive test in the study area was conducted using developedsystem. The system had been taken into a personal car, with a non-stop constantspeed for better measurement reading by the system. The deriving test took placeon City center main road including the hills areas and valleys. Furthermore, roamingin the blockages area was done respectively. Signal level measurement along with theGPS localization would be saved as text document in notepad file. Graphical data ofthe study area was collected in the form of the plan map, which was in the AutoCADdrawing format (*.dwg). Nevertheless, that (*.dwg) file was obtained by digitizingthe ordinary map showing the plan printed on the paper. The AutoCAD drawing filehad certain layers about the study area like road network, academic buildings, river,residential buildings, parking spaces and other places showing their detailed infor-mation and graphic location [7]. GPS data collection was carried out for every BTSinside the Sulaimaniya City Center. The GPS format was in World Geodetic System(WGS84) and due to that the final map is in Cassini coordinates Towers attributes
CMDE Vol. 7, No. 4 (Special Issue), 2019, pp. 535-544 539
Figure 1. The GSM 900/1800 Signal strength measurement system.
Figure 2. Flow of data collection to its processing.
has to be in Cassini as well. Only one way is convert the initial GPS format in WGS84to Rectified Skewed Orthomophic (RSO) using the stand alone GPS then convertingto the Cassini coordinates using Coordinates Transformation Software (CTS) [8]. Toexecute such type of analysis, computer hardware and software are needed. In thehardware it may contain a computer which can support the softwares like AutoCAD,Autodesk Map, and some GIS software easily. And for the software side, there arefew types of software which were used to manipulate and analyze the data. The soft-ware used were AutoCAD to view the drawing, Autodesk Map to build the topology,MapInfo to convert the projections of map and data, Microsoft Excel to develop thedatabase and many more. The main software for the creating the Signal strength mapArcView 3.1. Data collection can be organized as shown in Figure 2. After collectionof whole data it was started to manipulate through several software. To achieve theaim of this study, it was necessary to manipulate the data to get the right format

540 L. ABDULRAZAK AND K. AL-TABATABAIE
of the respective GIS software for analysis. Data Manipulation was consisted of fewprocesses which are listed below:
• Editing of drawing file in Autodesk Map.• Cleaning and Building of topology of the drawing.• Application of drawing interchange file format (*.dxf) to ArcView.• Conversion of the (*.dxf) file to the ArcView format.• Inserting attribute data of buildings and the mobile towers in the database.
At the end, the drawing file was saved as drawing interchange file format (*.dxf) toapply in ArcView. Step by step processes of editing, cleaning of drawing in AutodeskMap and building of network topology in Autodesk Map.
5. Results and Analysis
Consumers of mobile cellular telephone in Sulaimaniya City Center are placingever higher demands on the quality of reception despite the hostile environment inwhich radio mobile receiver have to operate. Radio transmissions are expected tobe clear and uninterrupted for all GSM900/1800 MHz users. This chapter illustratesthe project results and analyze that various distortions that a signal may undergoduring its propagation between the transmitter (BS) and the receiver (MS). The firstmeasurement to be conducted in this project was the derive test around SulaimaniyaCity Center using the signal level measurement system, Figure 3 shows the way pointsof the derive test in the study area.
Figure 4 shows the final result map in which it contains several themes in shapefile format, themes which are listed below:
• Towers.• Signal Level contours.• Road network.• Buildings.• Sulaimaniya City Center signal strength level way points.• Signal strength level
The problem of fading and multipath fading in Sulaimaniya City Center result from anumber of different effects. However, as long as Sulaimaniya City Center is a concernthey can been categorized as attenuation, slow fading, multipath delay spread, andRayleigh and Racian fading. The received signal is usually a combination of directand indirect paths, that is, those paths in a line of sights and those that involvesdiffraction, refraction and reflection off buildings or other objects. Each signal isinfluenced strongly by its distance from the transmitter. Electromagnetic radiationfield strength varies in inverse proportion to the square of the distance, but whenatmospheric attenuation effects and absorption of the terrain are taken into accountthe attenuation can be as high as the inverse sixth power of the distance. The map isvery clear and understandable by everyone for instance mobile radio engineer, radiosignal propagation analyzer, etc. The user easily can distinguish between the campusareas based on their signal strength, for example if the user wants to know whicharea in Sulaimaniya City Center got the strongest area then simply those areas withthe white color are best areas that got very good GSM900/1800 radio coverage as

CMDE Vol. 7, No. 4 (Special Issue), 2019, pp. 535-544 541
Figure 3. Test derive result.
illustrated in the legend. Most of the Sulaimaniya City Center area got mediumsignal level that ranges between -54.151 to -69.260, its deemed to be a good coverage,nevertheless, its effected by the multipath problem. In Figure 4 the yellow legendindicates the signal level that ranges from -62.069 to - 83.972 which can be classifiedas low medium range. These above mentioned areas are located in very congestedzone where lots of buildings are available and heavy traffic motion exists. In suchurban-up multipath occurs due many factors in which the most important is duereflection from the ground and surrounding structures. Hence the signal receivedby the mobile at any point in space may consist of a large number of plane waveshaving randomly distributed amplitudes, phases, and angles of a large number ofarrivals. Finally the last legend in Figure 4 indicates the poorest signal strength levelin Sulaimaniya City Center, from -83.972 to -98.882 with green color. In other wordsthe GSM signal in such area in a deep fade due to many reasons like movement ofthe receiver at high speed can pass through several fades in a small period of time,movement of the surrounding objects at high speed and the combination of the arrivalsignals in constructively manner which cause cancellation of the signals. These factorsalong with others don’t cause the receiver to go in deep feed merely, but may stopin a particular location (within the green colored area) at which the receiver cannotfunctioning any more. Multipath creates difficult reception problems. The threesignificant in the mobile network of the study area are delay spreading, Ray fading

542 L. ABDULRAZAK AND K. AL-TABATABAIE
Figure 4. Mapping the signal strength level in City Centre.
and random Doppler shifts. Multipath propagation occurs when signals arrive at thereceiver both directly from the transmitter and via reflections from, or transmissionthrough, an obstacle. Large reflectors, and hence long path difference, cause multipathor frequency-selective fading. The amount of signal reflected depends on a number offactors, including the polarization of the incident wave, the angle of arrival, the carrierfrequency and the relative permittivity of the surfaces. ArcView Query Builder letsthe user by text input to query for specific signal strength data and shows the relevantinformation. In this query, a feature named as query builder is used to input text.To start the query, the user has to click the Theme properties icon on the tool bardisplayed on the top. Query Builder button is available in the theme properties dialogin which the user by clicking on it can build a query expression to specify which signalstrength level is needed to be highlighted. By default, the query is contained withinparentheses, but the parentheses may not be required, depending on the complexity ofthe query. The Query Builder dialog in which can be utilized in finding the strongestsignal strength level waypoints, to do so the surface signal strength level legend hasto be ticked off and the Sulaimaniya City Center waypoints.shp has to be activated.By following the above method, the result looks like as shown in Figure 5.

CMDE Vol. 7, No. 4 (Special Issue), 2019, pp. 535-544 543
Figure 5. Signal strength level of -54 dBm around the SulaimaniyaCity Center.
6. Conclusion
The success and rapid growth of cellular system has been foremost in establishinga critical need for maintaining a standard quality of GSM signal strength level thatwill greatly increase mobile communication coverage. Moreover wireless design, alsoknown as wireless planning, is a very complicated task for engineers and most resultsdo not inspire a high level of confidence since there has never been a general theorythat can be used in every geographic location because of the diversity of circum-stances. This project made an attempt to map the GSM900/1800 signal strength inSulaimanyia City Center and to analyze the effecting factors of the multipath fadingon the signal strength. The integration of the GIS,GPS and GSM (G3) forming apowerful system that helps in managing the wireless design platform by boosting andmarinating an excellent radio coverage between the operator base station and themobile Receiver, taking into account the geographic land factors and their relevantproblems.
References
[1] Edward N. Singer, Land Mobile Radio System, PTR Prentice Hall Prentice-Hall,Inc, second
edition 1994.

544 L. ABDULRAZAK AND K. AL-TABATABAIE
[2] J D. Parsons, J. G. Gardiner, Mobile Communication Systems, John Eiley and Sons, Inc, New
York 1989.
[3] Theodore S. Rappaport, Wireless communication Priciples and Practice, Prentice Hall PTR,Upper Saddle River, New Jersey 2002.
[4] Neskovic A., Neskovic, N., and Paunovic, G, Modern Approaches in Modeling of Mobile Radio
Systems Propagation Environment, IEEE Commun. Surveys. 34 (2000), 1127–1151.[5] Matthias Patzold, Mobile Fading Channels, John Wiley and Sons, LTD, 2002.
[6] Raymound C. V. Macario, Cellular Radio , second edition, McGraw-Hill, 1997.
[7] Bekkers and Smits, Mobiele Telecommunicatie in Nederland en Belgie in Dutch, Kluwer Tech-niek, 1995.
[8] Bi, Q., Zysman, G. and Menkes, H. Wireless mobile communications at the start of the 21st
century. IEEE Communications Magazine, January 2001, pp 110-116.[9] S. Prakash, Madhav N. Kulkarni,. Fleet Management: A GPS-GIS integrated approach, Artech
House Publishers, 2003.[10] Kaplan, and D. Elliott, Understanding GPS: Principles and Applications, Artech House Pub-
lishers, Boston, 1996.
[11] Gao, J. Non-differential GPS as an alternative source of planimetric control for rectifyingsatellite imagery, Photogrammetric Engineering b Remote Sensing, 67(1):49-55, 2001.
[12] Edward, W. Tennant, Global Positioning Systems (GPS) in the Field: A Practical Guide to
the Theory and Application of GPS technologies, McGraw-Hill, 2004.[13] Ouyang Hongzhi, Wang Xinlin, Zhu Weihua, Li Yuehua, Design of auto-guard system based on
RFID and network, Electric Information and Control Engineering (ICEICE) 2011 International
Conference on, pp. 1292-1295, 2011.[14] Blcskei, H. Paulraj, A. Hari, K. and Nabar, R. Fixed broadband wireless access: Stateof the art,
challenges and future directions. IEEE Communications Magazine, January 2001.
[15] M. Wen, X. Cheng, L. Yang, Index Modulation for 5G Wireless Communications, Berlin, Ger-many:Springer, 2017.
[16] Mazurek Pawe A. Michaowska Joanna, Kozie Joanna, Gad Radoslaw, Wdowiak Artur, The
intensity of the electromagnetic fields in the coverage of GSM 900, GSM 1800 DECT, UMTS,WLAN in built-up areas, Applications of Electromagnetics in Modern Techniques and Medicine
(PTZE), 2018, PP: 159 162, IEEE Conferences.[17] John C. Guerrero, Cristhian Q. V, Diego C. Troya, Design and Implementation of an Intelligent
Cane, with Proximity Sensors, GPS Localization and GSM Feedback, 2018 IEEE Canadian
Conference on Electrical and Computer Engineering (CCECE), PP: 1 4.[18] L. F. Abdulrazak, FSS shielding and antenna discrimination effect on interference mitigation
techniques, Proc. CSSCC, Mar. 2014, pp. 248-253 .
[19] Lway F Abdulrazak And Tharek Abd. Rahman, Introduce the FWA in the band 3300-3400 MHz,Proceedings of World Academy of Science, Engineering and Technology (PWASET), Volume
36, December 2008 ISSN 2070-3740.


![An Ideal Base Station Sequence for Pattern Recognition ... · GSM Technical Specification GSM 08.08 [13] • The Hysteresis method [11] initiates a handoff only if signal strength](https://static.fdocuments.in/doc/165x107/5f9c995ffc8b6a19027720c2/an-ideal-base-station-sequence-for-pattern-recognition-gsm-technical-speciication.jpg)