Mannai Corporation QPSC FY‘16 Financial...
25
Mannai Corporation QPSC FY‘16 Financial Summary
Transcript of Mannai Corporation QPSC FY‘16 Financial...
Mannai Corporation QPSC
FY‘16 Financial Summary

Disclaimer Mannai Corporation Q.P.S.C. cautions investors that certain statements contained in this document state Mannai Corporation’s management's intentions, hopes, beliefs, expectations, or predictions of the future and, as such, are forward-looking statements.
Mannai Corporation management wishes to further caution the reader that forward-looking statements are not historical facts and are only estimates or predictions. Actual results may differ materially from those projected as a result of risks and uncertainties including, but not limited to:
– Future sales growth
– Market acceptance of our product and service offerings
– Our ability to secure adequate financing or equity capital to fund our operations
– Our ability to enter into strategic alliances or transactions
– Regulatory approval processes
– Changes in technology
– Price competition
– Other market conditions and associated risks
This presentation does not constitute an offering of securities or otherwise constitute an invitation or inducement to any person to underwrite, subscribe for or otherwise acquire or dispose of securities in any company within Mannai Corporation.
The Mannai Corporation undertakes no obligation to update publicly or otherwise any forward-looking statements, whether as a result of future events, new information, or otherwise.
2

• GFI Informatique Acquisition In France And Reduced In Operating Expenses Offsets Fall In Profits From Damas And Qatar
• GFI Contributes EBITDA Of 64m And Net Profit Of 37m
• Operating Expense Reduction Of 10% Contributes 80m Offsets Gross Profit Decline
• ICT Qatar Continues To Grow, Up 2%; Other Qatar Businesses Impacted By Slowdown Infrastructure Projects
• Outlook For 2017 Challenging Due To Ongoing Softness In UAE Retail And Qatar Projects
533 535
FY '15 FY '16
+ 0.4%
Net Profit QAR m
Profit Growth of 0.4% Under Challenging Conditions
3

Financial Highlights
4
FY 2015 FY 2016
Net Profit 533m 535m 0.4%
Revenues 5,935m 4,886 m (18)%
Gross Profit % 22.6% 24.2% 1.6pts
Net Profit % 9.0% 11.0% 2pts
Capital Employed 5,043m 6,403 27%
Earnings Per Share 11.68 11.73 0.4%
Return on Equity 24% 22% (2)pts
QAR m
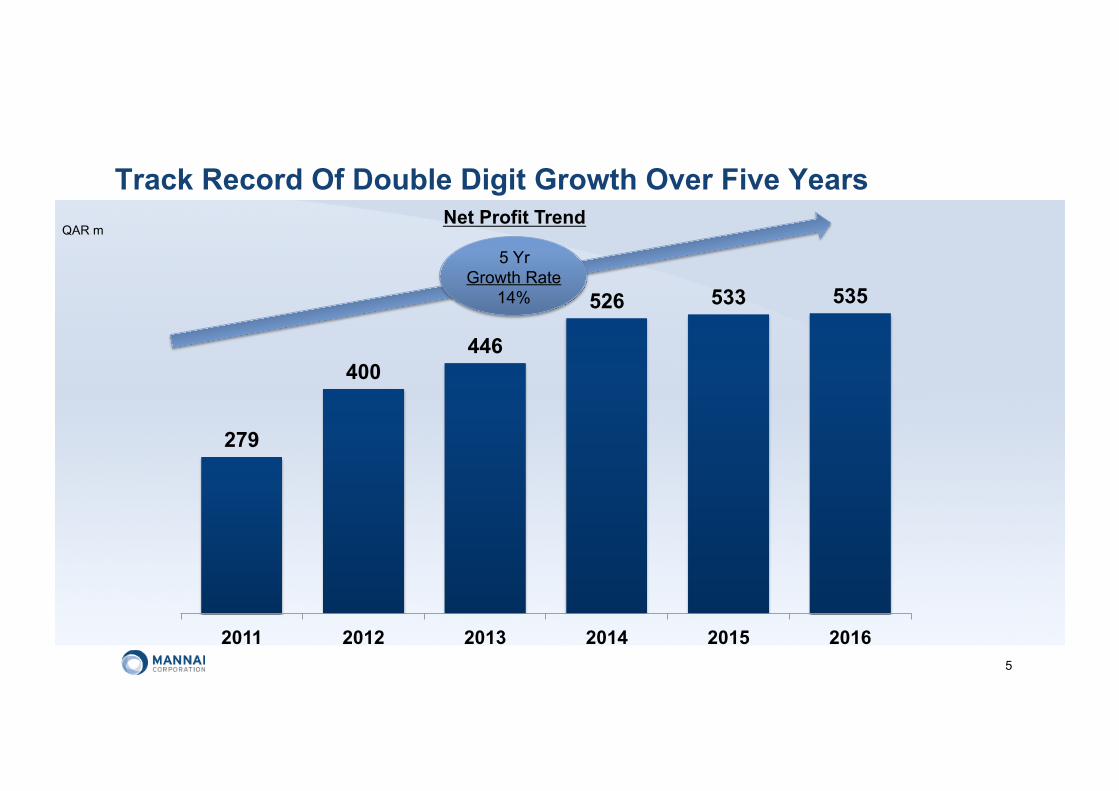
279
400 446
526 533 535
2011 2012 2013 2014 2015 2016
QAR m
Track Record Of Double Digit Growth Over Five Years Net Profit Trend
5 Yr Growth Rate
14%
5

5,935
4,886
FY '15 FY '16
• Damas Largest Contributor Down 18% or 395m In Sales Driven By Softness In UAE Luxury Segment
• Qatar Sales Impacted by Slowdown in Qatar Projects Momentum; Heavy Equipment And Energy And Industrial Markets Falling 33%
• ICT Down 9% As Strong 2014 Period of Originations Runs-Off
Revenue
(18)%
Revenue Pressures Impacting All Business Units QAR m
6

FY ‘16 FY ‘15
Auto 22%
ICT 31% Damas
35%
All Other 13%
Revenue Pressure Across Group Results In Minor Shift To ICT Revenue Mix
7
Auto 23%
ICT 28% Damas 35%
All Other 14%

• Shift To International As GFI Informatique Contribution Offsets Damas Shortfall
59% 56%
41% 44%
FY '15 FY '16
Net Profit
Int’l
Qatar
Growth In International Profits Driven By GFI Informatique
8

• Auto Group Growth Driven By Mix Shift To After Sales
• ICT Upside From Improved Productivity And Strong Project Closure
• Damas Margins Stable With Stable Gold Mix
• All Other Margins Driven By Sales Drop In Lower Margin Business Eg. Heavy Equipment
1,342 1,185
FY '15 FY '16
Gross Profit Gross Profit Margin % (12)%
2016% V pts
Auto Group 20.6% 3.2 pts
ICT 18.6% 2.1 pts
Damas 29.3% 0.3 pts
All Other 30.3% 3.0 pts
QAR m
Solid Margin Performance Across the Group
22.6% 24.2%
FY '15 FY '16
9
+1.6pts
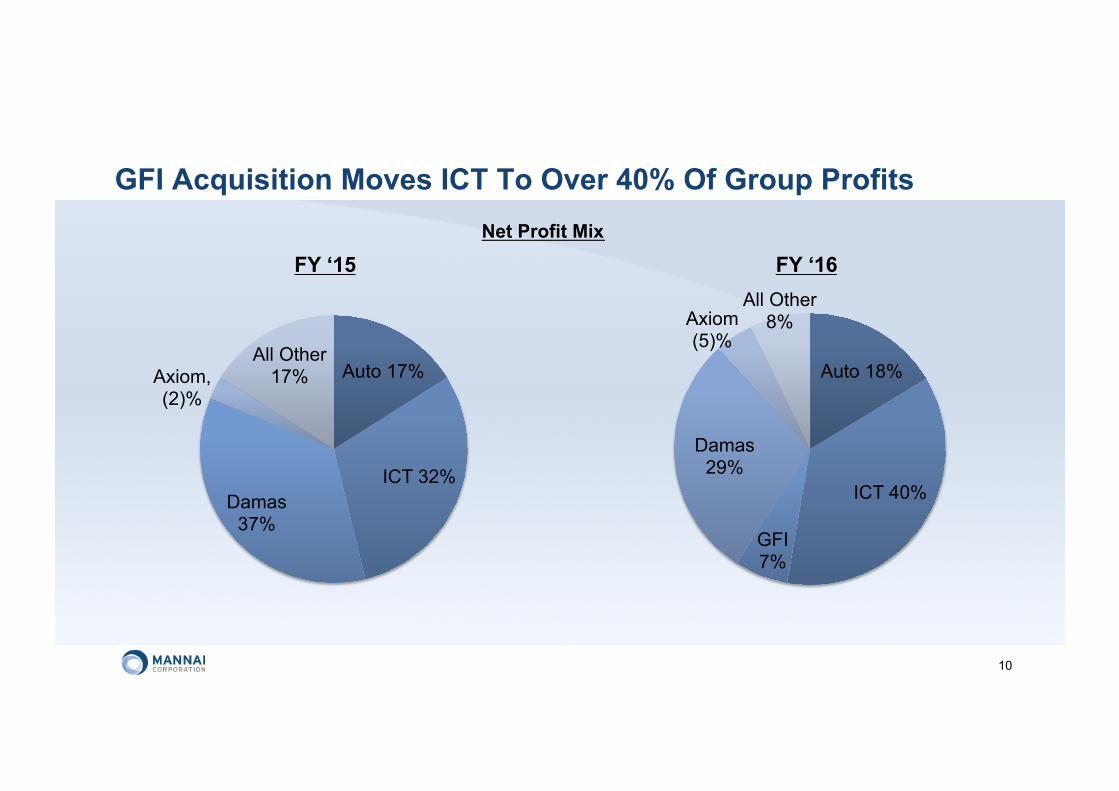
GFI Acquisition Moves ICT To Over 40% Of Group Profits Net Profit Mix
10
FY ‘16 FY ‘15
Auto 18%
ICT 40%
GFI 7%
Damas 29%
Axiom (5)%
All Other 8%
Auto 17%
ICT 32% Damas
37%
Axiom, (2)%
All Other 17%

Other Income Growth Due to Continued Recoveries in Damas
• Other Income driven by significant items in Damas; recoveries of previously provisioned receivables in Damas of 80m, up from 59m in prior year.
• Investment properties contributed 35m in FY’16, down from 40m FY’14
• One-off Foreign Exchange Gain Resulting from Funding of GFI Acquisition of 71m; Unrealised Treasury Gain of 18m in 2015
151
223
FY '15 FY '16
Other Income QAR m
11
+48%

2,097 1,702
FY '15 FY '16
(19)%
Revenue
196
146
FY '15 FY '16
(26)%
GP 608m 499m
GP% 29.0% 29.3%
Net Profit*
NP% 9.3% 8.6%
Net Inv. 1,987m 2,356m
• Reduction in net profit driven by 395m reduction in sales resulting in 109m fall in gross profit
• Restructuring actions lead to 70m of operating expense reduction over 2 years
• Gold mix falls 2pts to 52% resulting in 0.3 pts growth in gross profit margin rate
• Recoveries and other significant items grew from 99m to 112m; outlook reduced for 2017
• 246 existing stores with 14 new planned in FY’16 in UAE and KSA
Damas Jewellery QAR m
12
*after non-controlling interest
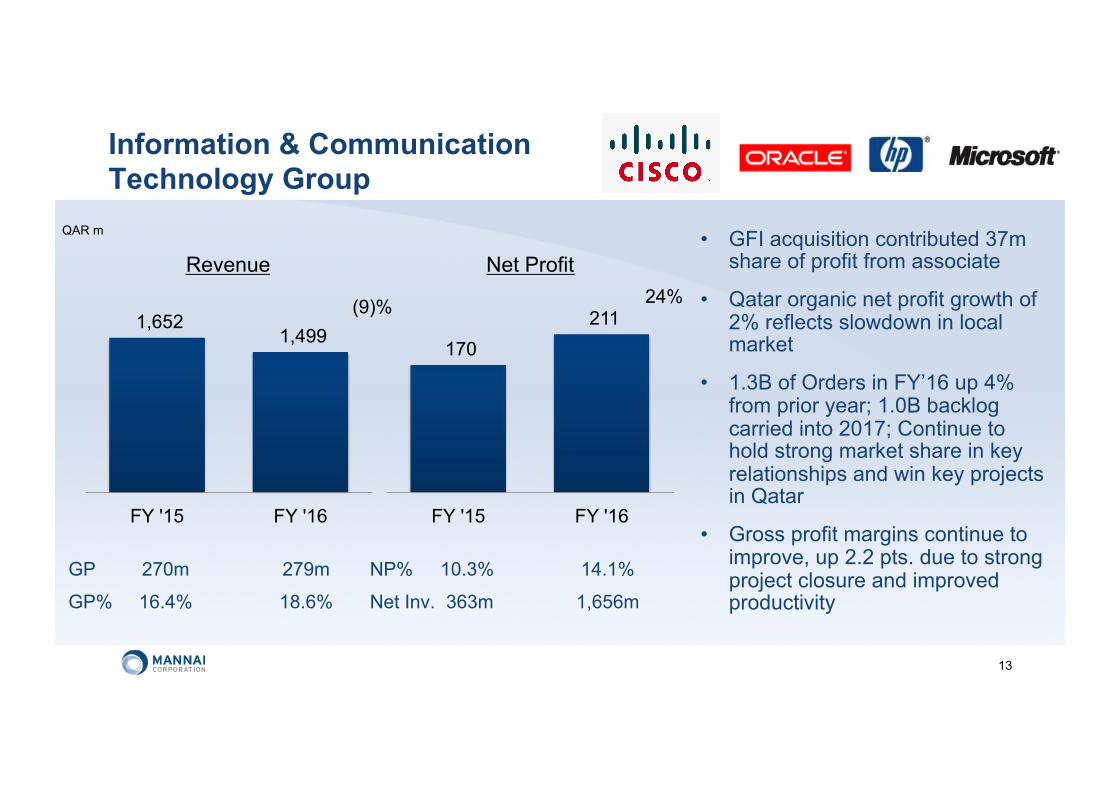
1,652 1,499
FY '15 FY '16
(9)%
Revenue
170 211
FY '15 FY '16
24%
GP 270m 279m
GP% 16.4% 18.6%
Net Profit
Information & Communication Technology Group
NP% 10.3% 14.1%
Net Inv. 363m 1,656m
• GFI acquisition contributed 37m share of profit from associate
• Qatar organic net profit growth of 2% reflects slowdown in local market
• 1.3B of Orders in FY’16 up 4% from prior year; 1.0B backlog carried into 2017; Continue to hold strong market share in key relationships and win key projects in Qatar
• Gross profit margins continue to improve, up 2.2 pts. due to strong project closure and improved productivity
QAR m
13

894 1,015
FY'15 FY'16
14%
Revenue
22
32
1H '15 1H '16
46%
OM 58.7m 61.8m
OM% 6.6% 6.1%
Net Profit
Gfi Informatique (France)
NP% 2.5% 3.2%
Net Assets 277m 301m
(Euro €m)
14
• Acquired 51.24% stake during Q2’16
• Revenue growth of 14% driven by organic growth of 8%, strongest since 2009, leading to 46% growth in net profit
• Acquisitions of Impaq in Eastern Europe, Efron in Spain and South America and Roff in Portugal, South America and Angola. International business now accounts for 25% of Sales
• Will continue to invest in innovation and new solutions and expand through both organic growth and acquisitions to become a EMEA leader in ICT

1,351
1,071
FY '15 FY '16
Revenue
88.1 81.1
FY'15 FY'16
GP 235m 221m
GP% 17.4% 20.6%
Net Profit
Auto Group
NP% 6.5% 7.6%
Net Inv. 362m 448m
QAR m
15
(21)% (8)% • Revenue pressure across group
following Heavy Equipment boom during 2014-2015; Revenues fall of 33%
• Auto Units sold down 23% driven by Yukon/Escalade launch boosting 1H’15 and softness in local market experienced since 2H’15
• Margins improved due to sales mix shift from new vehicles to higher margin after-sales

(2.9)
(10.8) FY ' 15 FY ' 16
Share of Associate Net Profit*
(15.2)
(23.1) FY '15 FY '16
Net Profit Contribution
Net Inv. 1,101 1,090
• Major restructuring actions taken in 2016 to reduce losses from underperforming UAE Retail
• Market normalising through consolidation and reduction of number of distributers in market
• 2017 break-even on normalised basis after adjusting for one-off restructuring costs, with positive net income trend in the fourth quarter
Axiom Telecom QAR m
16
*35% of Axiom profits

501
337
FY '15 FY '16
Revenue
74.4
42.2
FY '15 FY '16
GP 105.3m 69.1m
GP% 21.0% 20.5%
Net Profit
Energy & Industrial Markets
NP% 14.9% 12.5%
Net Inv. 104m 56m
QAR m
17
(33)% (43)%
• Revenue fall driven by run-off of infrastructure projects, in particular mega-reservoir deliveries executed in 2015
• Sharp decline in Gas Turbine Services revenues from O&G
• HVAC division delivered 4% revenue growth from Toshiba and SKM
• FY’16 orders of 196m across business unit down 39% on 2016 reflects softness in market

• Revenue down 15% due to fall in Geotechnical and Drilling projects as infrastructure projects slow in Qatar
• Laboratory Services maintaining revenue and profit growth; expanded premises to fit increased demand
• Exited Oman and Gulf Land Surveys businesses due to lack of projects
97 82
FY '15 FY '16
Revenue
18.2
11.5
FY '15 FY '16
GP 40.9m 32.6m
GP% 42.3% 39.5%
Net Profit
Geotechnical Services
NP% 18.9% 14.0%
Net Inv. 27m 28m
QAR m
18
(15)%
(37)%

• Drop in revenue driven by lower ticket sales coupled with reduction in average ticket price
• Lower revenues reduce capacity to reach airline incentive targets
• Continued pressure on ticket service fees driving deterioration
• Reduction in receivables due to shedding of loss-making customers to improve returns
• Visa Processing Services continues to perform well; added Netherlands to Schengen visa centre
43 36
FY '15 FY '16
Revenue
14.7
6.7
FY '15 FY '16
GP 38m 31.9m
GP% 88% 89.7%
Net Profit
Travel Division
NP% 34.1% 18.9%
Net Inv. 41m 18m
QAR m
19
(18)% (54)%
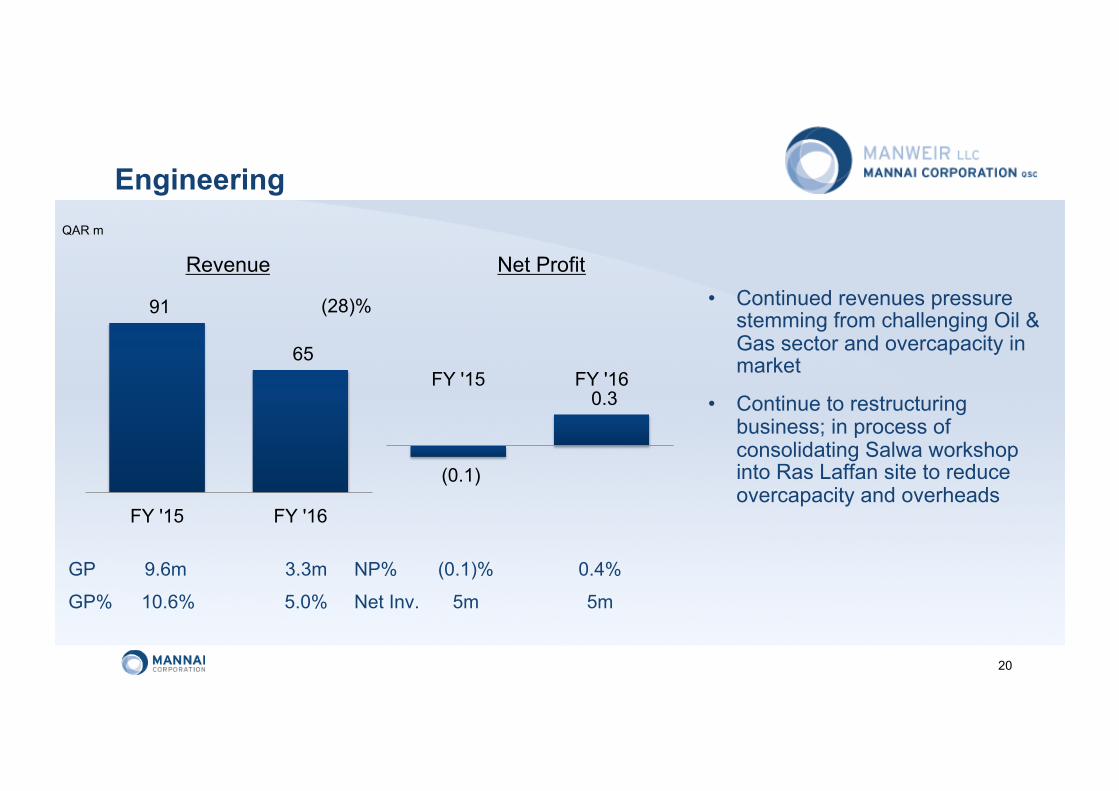
• Continued revenues pressure stemming from challenging Oil & Gas sector and overcapacity in market
• Continue to restructuring business; in process of consolidating Salwa workshop into Ras Laffan site to reduce overcapacity and overheads
91
65
FY '15 FY '16
Revenue
GP 9.6m 3.3m
GP% 10.6% 5.0%
Net Profit
Engineering
NP% (0.1)% 0.4%
Net Inv. 5m 5m
QAR m
20
(28)%
(0.1)
0.3 FY '15 FY '16

• Fall in revenues due to reduction of low returning freight-forwarding business
• Focus of business on more profitable warehousing segment; New Warehouse to open in 1H’17
49
35
FY ' 15 FY ' 16
Revenue
6.4 7.2
FY '15 FY '16
GP 12.0m 12.7m
GP% 24.3% 36.3%
Net Profit
Logistics
NP% 13.0% 20.6%
Net Inv. 9m 11m
QAR m
21
(29)%
12%

• Contains Consumer Product Division, CBMFM JV and corporate activity
• Significant foreign exchange-related gains due to the settlement of GFI Acquisition; 18m in 2015 and 71m in 2016
54 60
FY '15 FY '16
Revenue
(20)
52 FY '15 FY '16
Net Profit
Others QAR m
22
10%
GP 23.2m 36.8m
GP% 42.9% 61.9%

Net Debt Net Debt to Total Capital* QAR m
GFI Acquisition of 1.3B Offset by Operating Cash Flows of 519m Maintains Leverage in 50/50 Range
23
2,853 2,635
3,696
FY'14 FY'15 FY'16
50% 46% 53%
FY'14 FY'15 FY'16
*Total Capital adjusted for Acquisition Reserves

24
Normalisation of key lines for significant items
• Continued recoveries of previously provisions receivables in Damas
• One-off foreign exchange gains related to acquisition in France
• Gain on Damas property in KSA
• Normalised profits up 7% in 2H’16, following fall in first half due to strong 2015
Mannai Corporation QPSC
Tel: +974-4455 8888 Fax: +974 4455 8880
www.mannai.com
CONTACTS
Investor Relations
25
Ewan Cameron Chief Financial Officer
email: [email protected] Tel (Direct) : +974-44558844