MANHATTAN DECADE 2006-2015€¦ · 2006-2015. Visi u ebsit rows isting n ear or bou arke ends 1...
61
Prepared by Miller Samuel Inc. Appraisal and Consulting Services MANHATTAN DECADE 2006- 2015
Transcript of MANHATTAN DECADE 2006-2015€¦ · 2006-2015. Visi u ebsit rows isting n ear or bou arke ends 1...

Prepared by Miller Samuel Inc. Appraisal and Consulting Services
MANHATTAN DECADE
2006-2015
Visit our website to browse listings and learn more about market trends 1
MANHATTAN DECADE2006-2015
©2016 Miller Samuel Inc. and Douglas Elliman. All worldwide rights reserved.
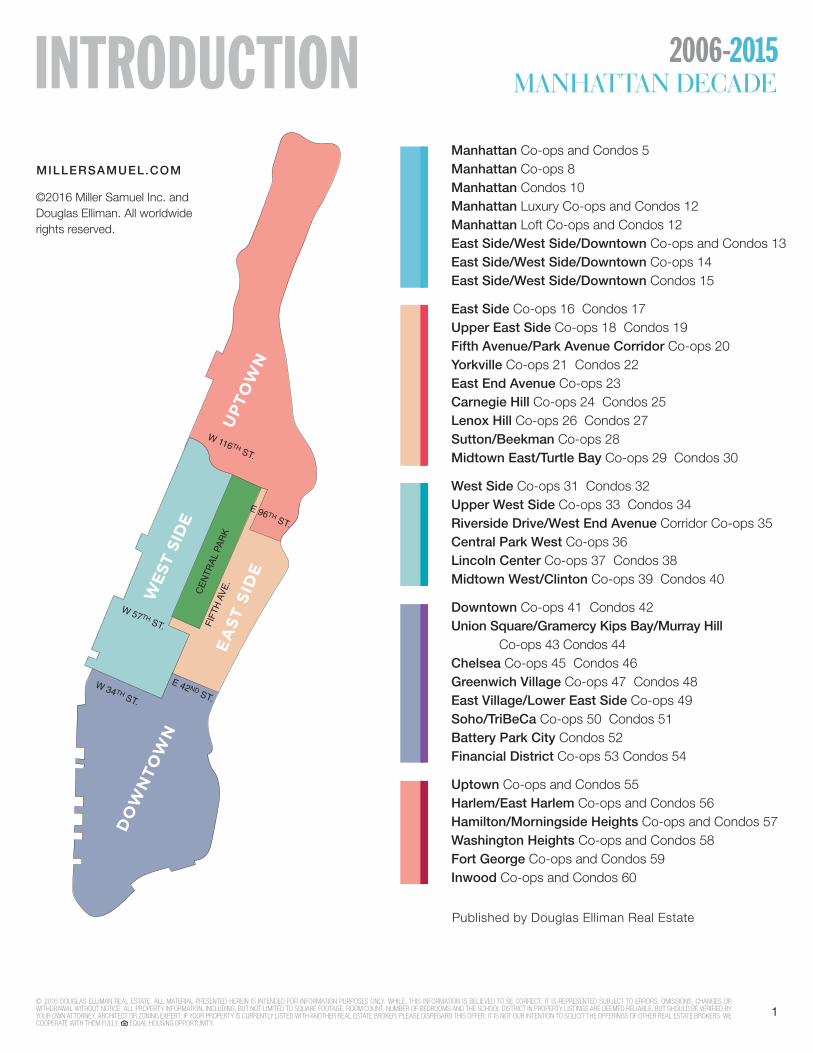
Manhattan Co-ops and Condos 5 Manhattan Co-ops 8 Manhattan Condos 10 Manhattan Luxury Co-ops and Condos 12 Manhattan Loft Co-ops and Condos 12 East Side/West Side/Downtown Co-ops and Condos 13 East Side/West Side/Downtown Co-ops 14 East Side/West Side/Downtown Condos 15
East Side Co-ops 16 Condos 17 Upper East Side Co-ops 18 Condos 19 Fifth Avenue/Park Avenue Corridor Co-ops 20 Yorkville Co-ops 21 Condos 22 East End Avenue Co-ops 23 Carnegie Hill Co-ops 24 Condos 25 Lenox Hill Co-ops 26 Condos 27 Sutton/Beekman Co-ops 28 Midtown East/Turtle Bay Co-ops 29 Condos 30
West Side Co-ops 31 Condos 32 Upper West Side Co-ops 33 Condos 34 Riverside Drive/West End Avenue Corridor Co-ops 35 Central Park West Co-ops 36 Lincoln Center Co-ops 37 Condos 38 Midtown West/Clinton Co-ops 39 Condos 40
Downtown Co-ops 41 Condos 42 Union Square/Gramercy Kips Bay/Murray Hill Co-ops 43 Condos 44 Chelsea Co-ops 45 Condos 46 Greenwich Village Co-ops 47 Condos 48 East Village/Lower East Side Co-ops 49 Soho/TriBeCa Co-ops 50 Condos 51 Battery Park City Condos 52 Financial District Co-ops 53 Condos 54
Uptown Co-ops and Condos 55 Harlem/East Harlem Co-ops and Condos 56 Hamilton/Morningside Heights Co-ops and Condos 57 Washington Heights Co-ops and Condos 58 Fort George Co-ops and Condos 59 Inwood Co-ops and Condos 60
Published by Douglas Elliman Real Estate
© 2016 DOUGLAS ELLIMAN REAL ESTATE. ALL MATERIAL PRESENTED HEREIN IS INTENDED FOR INFORMATION PURPOSES ONLY. WHILE, THIS INFORMATION IS BELIEVED TO BE CORRECT, IT IS REPRESENTED SUBJECT TO ERRORS, OMISSIONS, CHANGES OR WITHDRAWAL WITHOUT NOTICE. ALL PROPERTY INFORMATION, INCLUDING, BUT NOT LIMITED TO SQUARE FOOTAGE, ROOM COUNT, NUMBER OF BEDROOMS AND THE SCHOOL DISTRICT IN PROPERTY LISTINGS ARE DEEMED RELIABLE, BUT SHOULD BE VERIFIED BY YOUR OWN ATTORNEY, ARCHITECT OR ZONING EXPERT. IF YOUR PROPERTY IS CURRENTLY LISTED WITH ANOTHER REAL ESTATE BROKER, PLEASE DISREGARD THIS OFFER. IT IS NOT OUR INTENTION TO SOLICIT THE OFFERINGS OF OTHER REAL ESTATE BROKERS. WE COOPERATE WITH THEM FULLY. EQUAL HOUSING OPPORTUNITY.
MILLERSAMUEL.COM
INTRODUCTION

Visit our website to browse listings and learn more about market trends 2
MANHATTAN DECADE2006-2015
Manhattan Co-ops and Condos 5 Manhattan Co-ops 8 Manhattan Condos 10 Manhattan Luxury Co-ops and Condos 12 Manhattan Loft Co-ops and Condos 12 East Side/West Side/Downtown Co-ops and Condos 13 East Side/West Side/Downtown Co-ops 14 East Side/West Side/Downtown Condos 15
East Side Co-ops 16 Condos 17 Upper East Side Co-ops 18 Condos 19 Fifth Avenue/Park Avenue Corridor Co-ops 20 Yorkville Co-ops 21 Condos 22 East End Avenue Co-ops 23 Carnegie Hill Co-ops 24 Condos 25 Lenox Hill Co-ops 26 Condos 27 Sutton/Beekman Co-ops 28 Midtown East/Turtle Bay Co-ops 29 Condos 30
West Side Co-ops 31 Condos 32 Upper West Side Co-ops 33 Condos 34 Riverside Drive/West End Avenue Corridor Co-ops 35 Central Park West Co-ops 36 Lincoln Center Co-ops 37 Condos 38 Midtown West/Clinton Co-ops 39 Condos 40
Downtown Co-ops 41 Condos 42 Union Square/Gramercy Kips Bay/Murray Hill Co-ops 43 Condos 44 Chelsea Co-ops 45 Condos 46 Greenwich Village Co-ops 47 Condos 48 East Village/Lower East Side Co-ops 49 Soho/TriBeCa Co-ops 50 Condos 51 Battery Park City Condos 52 Financial District Co-ops 53 Condos 54
Uptown Co-ops and Condos 55 Harlem/East Harlem Co-ops and Condos 56 Hamilton/Morningside Heights Co-ops and Condos 57 Washington Heights Co-ops and Condos 58 Fort George Co-ops and Condos 59 Inwood Co-ops and Condos 60
DOUGLAS ELLIMAN Established in 1911, Douglas Elliman has grown to become the largest regional and the nation’s fourth largest real estate company, with a current network of more than 5,000 agents in over 70 offices throughout Manhattan, Brooklyn, Queens, Long Island (including the Hamptons and North Fork), Westchester and Putnam Counties, as well as South Florida, California, Connecticut, and Aspen, Colorado. In addition, through a strategic partnership with Knight Frank Residential, Douglas Elliman’s powerful network extends to 43 countries across six continents.
At Douglas Elliman, we are passionate about delivering exceptional consumer experiences. By offering a complete suite of real estate services, we ensure that we meet our consumers’ every need. From sales and rentals, to mortgage, new developments and title insurance, we have experts in every field to guide you skillfully from beginning to the end of your real estate journey. Douglas Elliman’s outstanding track record, unique brand promise, and exceptional agent support system attract top talent, ensuring that our team of experts represents the very best in the industry. At Douglas Elliman, we believe that access to the best and most timely information can dramatically shape our decisions. Today’s consumer needs a trusted resource that can separate signal from noise and help them navigate the complex process that real estate has become. With our extensive knowledge in every aspect of the field, and fueled by consumer research and insights, we are the go-to source for information and education.
MILLER SAMUEL Established in 1986, Miller Samuel is an independently owned business that provides appraisal and consulting services on residential property throughout the New York City metro area including New York City, Westchester County, Fairfield County and Long Island including the Hamptons and North Fork. With a certified or licensed appraisal staff that averages more than 18 years of experience, Miller Samuel is known for their neutral valuation perspective and professionalism, providing their clients with benchmark insights to enable them to make more informed decisions. Their clients include domestic and international financial institutions, law firms, consulting firms, developers, employee relocation companies, co-op boards and condo associations, managing agents, individuals and government agencies. Miller Samuel provides appraisal services for purchase and refinance mortgage origination, collateral management, foreclosure, estate, trust, gift, divorce, bankruptcy, litigation, buyer and seller valuations as well as expert witness services and extensive assignments covering roof, hallway, basement and other common area valuations and share allocations.
Miller Samuel publishes a series of sales and rental market studies that provide housing market transparency for New York City including Manhattan, Brooklyn, Queens & Northwest Queens; New York suburban areas including Westchester, Putnam & Dutchess Counties, Long Island, Hamptons and North Fork; South Florida including Miami and Miami Beach, Boca Raton, Fort Lauderdale and Palm Beach; Greater Los Angeles, including Westside and Downtown as well as Greenwich and Fairfield County, CT. Miller Cicero, their commercial affiliate, is an independent commercial real estate appraisal and consulting firm that serves the greater New York City metropolitan area. Miller Cicero performs advisory services concerning office, retail and multi-unit residential, new development, commercial, sales and lease analysis.
For questions regarding this report or for appraisal inquiries, please contact the report author, Jonathan J. Miller, CRE, CRP, President/CEO at [email protected] or follow him on twitter at @jonathanmiller
Published by Douglas Elliman Real Estate
Manhattan Sales Quarterly overview of co-op and condo sales
Manhattan, Brooklyn & Rentals Monthly overview of residential rentals
Manhattan Decade Annual 10-year overview of co-op and condo sales
Manhattan Townhouse Annual 10-year overview of townhouse sales
Brooklyn Sales Quarterly overview of residential sales
Queens Sales Quarterly overview of residential sales
Northwest Queens Sales Quarterly overview of residential sales
Westchester County Sales Quarterly overview of residential sales
Putnam & Dutchess County Sales Quarterly overview of residential sales
Fairfield County Sales Quarterly overview of residential sales
Greenwich, CT Sales Quarterly overview of residential sales
Long Island Sales Quarterly overview of residential sales
Long Island Decade Annual 10-year overview of residential sales
Hamptons Sales Quarterly overview of residential sales
North Fork Sales Quarterly overview of residential sales
Hamptons & North Fork Decade Annual 10-year overview of residential sales
Aspen Sales Quarterly overview of residential sales
Greater Los Angeles, including Westside & Downtown Sales Quarterly overview of residential sales
Miami Beach + Barrier Island Sales Quarterly overview of residential sales
Miami Coastal Mainland Sales Quarterly overview of residential sales
Boca Raton Sales Quarterly overview of residential sales
Fort Lauderdale Sales Quarterly overview of residential sales
Palm Beach Sales Quarterly overview of residential sales
The Elliman Report Series
INTRODUCTION

Visit our website to browse listings and learn more about market trends 3
MANHATTAN DECADE2006-2015
METHODOLOGY
The data used in this report is based on the aggregate of the four quarterly reports published during the year based on
the data available at the time of each quarterly report release. After the end of each quarter, because of the lag between
closing date and recording date, sales data continues to fall within those quarterly report time frames. As a result, this
report does not include all sales to occur during the year, but is based on a large enough sample size to be a reasonable
market trend reference. The primary data source is New York City public record known as ACRIS. This data has been
supplemented or complemented using services such as Property Shark, Streeteasy (as alternative sources of ACRIS data)
and data collected during the normal course of business by Miller Samuel and Douglas Elliman.
MARKET COVERAGE
The coverage of the Manhattan real estate market in this report includes the entire island of Manhattan. The areas
presented overlap in numerous ways because they reflect different markets, neighborhoods and sub-neighborhoods. The
totals from these breakdowns exceed the overall Manhattan statistics. For example, a condo sale in Carnegie Hill is also
included in the Upper East Side condo statistics, the East Side condo statistics, East + West + Downtown condo statistics,
Manhattan condo statistics and Manhattan co-op + condo statistics. The idea behind this coverage approach was to
parse market information in commonly accepted delineations that were most requested, practical, but most importantly,
had adequate depth of data to extract trends.
REFERENCE LINKS
elliman.com/marketreports
Download the current versions of all reports in the Elliman Report series.
millersamuel.com/reports-info/methodology
Additional information on how this report and others in the Elliman Report series are prepared included data sources and market
boundaries.
millersamuel.com/aggy-data
A number of the report metrics can be reviewed and generated as custom tables.
millersamuel.com/blog
For additional interpretation of this report and coverage of the real estate economy, please visit the Miller Samuel blog: Matrix:
Interpreting The Real Estate Economy.
Miller Samuel Inc.Real Estate Appraisers & Consultants21 West 38th Street,
New York, NY 10018
(212) 768-8100
millersamuel.com
Douglas Elliman Real Estate575 Madison Avenue
New York, NY 10022
(212) 891-7000
elliman.com
INTRODUCTIONMANHATTAN CO-OPS & CONDOS
4
MANHATTANMANHATTAN DECADE
2006-2015
Visit our website to browse listings and learn more about market trends
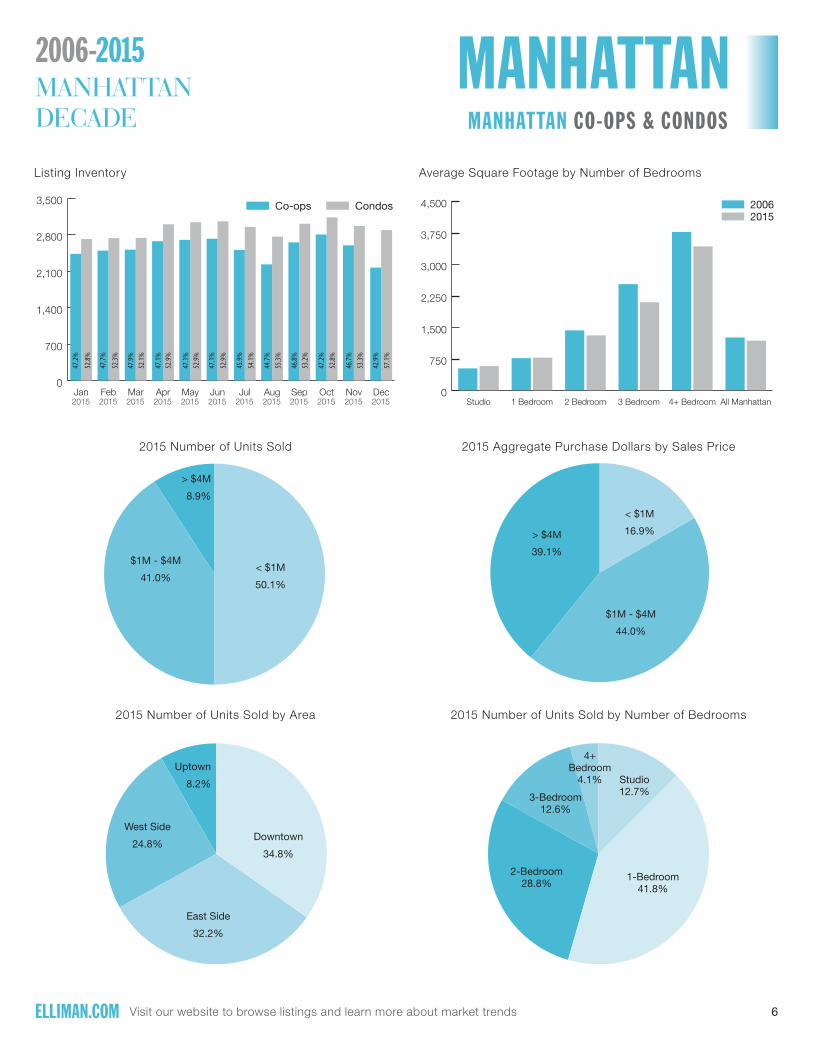
All three price trend indicators set new records in 2015, pushed higher by low inventory and significant new development closings during the year. The New York City economy remained robust helped by record employment growth. Median sales price increased 7.5% to a record $1,010,500 year-over-year. This was the first time median sales price broke the $1 million threshold and the first time it exceeded the pre-Lehman high. Before the beginning of the financial crisis in late 2008, median sales price set a 2008 record of $955,000. Average price per square foot jumped 20.5% to a record $1,563 over the same period. This price trend indicator was skewed higher from the influx of high-end new development closings that went to contract one to two years ago. Average sales price increased 6.6% to a record $1,832,069 above the prior year. The number of sales fell year-over-year for the second consecutive year after rising for four straight years. There were 11,955 sales, down 5.8% from the previous year. This was a larger decline in sales than the 0.3% decline in the preceding year. The larger decline reflected
the inelasticity of supply matched up against an improving economy. Listing inventory edged up a modest 1% from the prior year after reaching a record low in 2013. Declining sales and the slight uptick in supply slowed the pace of the market slightly. The absorption period, the number of months to sell all inventory at the current rate of sales, increased to 5.1 months from 4.7 months in the prior year. This remains well below the 7.4 month average pace for the decade. Despite the overall decline in sales, lower activity was attributable to the decline in co-op sales and rise in condo sales. The number of co-op sales fell 11% to 6,805 from the prior year to 56.9% market share. Condo sales rose 2% to 5,150 over the same period to a 43.1% market share. Days on market, the number of days from the last price change to the contract date, fell 14.7% to a record low of 87 days from the prior year. Listing discount, the percentage difference between the list price at time of contract and the sales price, increased to 3.9% from 2.2% in the prior year.
MANHATTAN CO-OPS & CONDOS
All price trend indicators set new records
Median sales price crosses $1 million threshold for the first time, rising 7.5% to $1,010,500 from the prior year.
Average sales price and average price per square foot followed the same pattern, setting records as well.
Number of sales fell short of prior year total as inventory edged higher
The annual sales total fell 5.8% to 11,955 from the prior year total, Listing inventory edged
1% higher to 5,046 over the same period.
Marketing time fell to the fastest rate in more than two decades
Days on market, the average number of days from the last price change to the contract date, fell 14.7% to 87 days
from the prior year. This was the fastest marketing time reached since 1995, when the metric was first tracked.

5
MANHATTANMANHATTAN DECADE
2006-2015
Visit our website to browse listings and learn more about market trends
Matrix Current Year % Chg Prior Year % Chg Prior Decade
Average Sales Price $1,832,069 6.6% $1,718,530 41.4% $1,295,445
Average Price Per Sq. Ft $1,563 20.5% $1,297 51.6% $1,031
Median Sales Price $1,010,500 7.5% $940,000 21.7% $830,000
Number of Sales 11,955 -5.8% 12,695 40.8% 8,493
Average Days on Market 87 -14.7% 102 -40.4% 146
Average Discountfrom List Price *
3.9% 2.2% 3.3%
Listing Inventory 5,046 1.0% 4,995 -15.0% 5,934
30 Year Fixed Mortgage(Freddie Mac) *
4.01% 3.83% 6.18%
1 Year Adjustable Rate Martgage (Freddie Mac)*
2.68% 2.39% 5.47%
Price/sq. ft Number of sales
$0
$400
$800
$1,200
$1,600
$2,000
20152015201320122011201020092008200720060
4,000
8,000
12,000
16,000
20,000
MANHATTAN CO-OPS & CONDOSMANHATTAN CO-OPS & CONDOS
Studio 1 Bedroom 2 Bedroom 3 Bedroom 4+ Bedroom ALL
2015 $435,749 $896,054 $1,879,731 $3,785,181 $8,692,542 $1,832,069
2014 $503,555 $847,071 $1,760,176 $3,728,034 $8,767,404 $1,718,530
2013 $474,854 $776,247 $1,596,242 $3,156,713 $6,087,628 $1,443,753
2012 $461,343 $745,308 $1,494,853 $2,802,284 $6,734,196 $1,417,080
2011 $419,522 $686,128 $1,508,974 $3,144,406 $6,685,595 $1,426,912
2010 $404,326 $661,511 $1,401,865 $3,003,612 $6,915,580 $1,457,255
2009 $428,948 $711,736 $1,535,836 $2,871,516 $6,431,198 $1,393,001
2008 $500,479 $814,811 $1,934,031 $4,632,348 $11,940,212 $1,591,823
2007 $449,128 $736,807 $1,655,185 $4,261,011 $8,601,960 $1,351,621
2006 $445,607 $705,439 $1,571,807 $3,559,657 $7,153,295 $1,295,445
Studio 1 Bedroom 2 Bedroom 3 Bedroom 4+ Bedroom ALL
2015 $411,500 $772,500 $1,634,146 $3,160,000 $6,500,000 $1,010,500
2014 $419,000 $718,000 $1,495,000 $2,925,000 $5,804,025 $940,000
2013 $425,000 $665,000 $1,350,000 $2,600,000 $5,080,127 $855,000
2012 $385,000 $650,000 $1,260,000 $2,370,000 $4,750,000 $835,000
2011 $390,000 $630,000 $1,285,126 $2,665,000 $5,200,000 $850,000
2010 $384,800 $622,647 $1,235,033 $2,595,000 $5,650,000 $880,000
2009 $395,460 $655,000 $1,272,812 $2,400,000 $5,113,562 $850,000
2008 $460,000 $750,000 $1,600,000 $3,790,000 $9,350,000 $955,000
2007 $415,000 $690,000 $1,387,000 $3,495,000 $6,450,000 $860,000
2006 $410,000 $650,000 $1,355,000 $3,150,000 $5,800,000 $830,000
Studio 1 Bedroom 2 Bedroom 3 Bedroom 4+ Bedroom ALL
2015 $765 $1,132 $1,452 $1,821 $2,592 $1,563
2014 $966 $1,061 $1,380 $1,826 $2,663 $1,297
2013 $892 $987 $1,197 $1,558 $1,921 $1,136
2012 $824 $938 $1,151 $1,398 $2,056 $1,086
2011 $837 $920 $1,140 $1,497 $1,940 $1,087
2010 $815 $877 $1,097 $1,390 $1,945 $1,060
2009 $826 $940 $1,144 $1,374 $1,924 $1,073
2008 $993 $1,087 $1,373 $1,800 $2,831 $1,251
2007 $924 $989 $1,215 $1,568 $2,328 $1,120
2006 $859 $922 $1,103 $1,409 $1,900 $1,031
Studio 1 Bedroom 2 Bedroom 3 Bedroom 4+ Bedroom ALL
2015 1,520 4,965 3,474 1,511 485 11,955
2014 1,824 4,979 3,902 1,515 475 12,695
2013 1,847 5,071 3,894 1,484 439 12,735
2012 1,596 4,023 3,137 1,356 396 10,508
2011 1,434 3,591 3,659 1,119 358 10,161
2010 1,144 3,525 3,605 1,416 370 10,060
2009 1,267 2,728 2,216 949 270 7,430
2008 1,903 3,587 4,139 477 193 10,299
2007 2,286 4,591 5,723 661 169 13,430
2006 1,272 3,031 3,631 392 167 8,493
Average Sales Price
Median Sales Price
Average Price Per Square Foot
Number of Sales
Average Price Per Square Foot / Number of Sales
6
MANHATTANMANHATTAN DECADE
2006-2015
Visit our website to browse listings and learn more about market trends
Matrix Current Year % Chg Prior Year % Chg Prior Decade
Average Sales Price $1,832,069 6.6% $1,718,530 41.4% $1,295,445
Average Price Per Sq. Ft $1,563 20.5% $1,297 51.6% $1,031
Median Sales Price $1,010,500 7.5% $940,000 21.7% $830,000
Number of Sales 11,955 -5.8% 12,695 40.8% 8,493
Average Days on Market 87 -14.7% 102 -40.4% 146
Average Discountfrom List Price *
3.9% 2.2% 3.3%
Listing Inventory 5,046 1.0% 4,995 -15.0% 5,934
30 Year Fixed Mortgage(Freddie Mac) *
4.01% 3.83% 6.18%
1 Year Adjustable Rate Martgage (Freddie Mac)*
2.68% 2.39% 5.47%
20152006
0
750
1,500
2,250
3,000
3,750
4,500
All Manhattan4+ Bedroom3 Bedroom2 Bedroom1 BedroomStudio
CondosCo-ops
0
700
1,400
2,100
2,800
3,500
DecNovOctSepAugJulJunMayAprMarFebJan2015 2015 2015 2015 2015 2015 2015 2015 2015 2015 2015 2015
47.2%
52.8%
47.7%
52.3%
47.9%
52.1%
47.1%
52.9%
47.1%
52.9%
47.1%
52.9%
45.9%
54.1%
44.7%
55.3%
46.8%
53.2%
47.2%
52.8%
46.7%
53.3%
42.9%
57.1%
MANHATTAN CO-OPS & CONDOS
Listing Inventory
2015 Number of Units Sold
2015 Number of Units Sold by Area
Average Square Footage by Number of Bedrooms
2015 Aggregate Purchase Dollars by Sales Price
2015 Number of Units Sold by Number of Bedrooms
> $4M
39.1%
2014 Volume
$1M - $4M
44.0%
< $1M
16.9%
2015 Number of Units Sold by area
East Side
32.2%
Uptown
8.2%
Downtown
34.8%
West Side
24.8%
> $4M
8.9%
2015 Number of Units Sold
$1M - $4M
41.0%< $1M
50.1%
2015 Number of Units Sold by bedrooms
2-Bedroom28.8%
1-Bedroom41.8%
Studio12.7%3-Bedroom
12.6%
4+Bedroom
4.1%

7
MANHATTANMANHATTAN DECADE
2006-2015
Visit our website to browse listings and learn more about market trends
MANHATTAN CO-OPS
Market Area Type % ChangeSutton + Beekman Condos 55.8%Fifth Ave + Park Ave Corridor Condos 55.2%Midtown West + Clinton Co-ops + Condos 43.5%Carnegie Hill Condos 38.4%Midtown West + Clinton Condos 38.0%Greenwich Village Co-ops + Condos 30.7%Midtown East + Turtle Bay Condos 28.6%Riverside Dr + West End Ave Corridor Co-ops + Condos 26.9%Greenwich Village Condos 26.8%Lincoln Center Co-ops + Condos 26.4%Yorkville Condos 24.7%East Side Condos 24.3%Downtown Co-ops + Condos 24.2%Hamilton + Morningside Heights Co-ops + Condos 23.9%Upper East Side Condos 23.8%Battery Park City Condos 23.3%Yorkville Co-ops + Condos 22.6%Uptown Co-ops + Condos 22.6%Midtown West + Clinton Co-ops 22.1%Inwood Co-ops + Condos 21.4%Lenox Hill Condos 21.3%Harlem + East Harlem Co-ops + Condos 21.1%Manhattan Condos 20.9%East Side + West Side + Downtown Condos 19.8%Manhattan Co-ops + Condos 19.0%Soho + Tribeca Co-ops + Condos 18.8%East Side + West Side + Downtown Co-ops + Condos 18.6%Downtown Condos 18.6%Midtown East + Turtle Bay Co-ops + Condos 18.5%Riverside Dr + West End Ave Corridor Condos 18.5%West Side Co-ops + Condos 18.3%Yorkville Co-ops 17.7%Soho + Tribeca Condos 17.3%East End Ave Co-ops 17.2%Washington Heights Co-ops + Condos 16.9%West Side Condos 16.7%Lenox Hill Co-ops + Condos 15.9%Chelsea Co-ops 15.7%Chelsea Co-ops + Condos 14.6%Central Park West Co-ops + Condos 14.6%
Market Area Type % ChangeSoho + Tribeca Co-ops 14.1%Riverside Dr + West End Ave Corridor Co-ops 13.7%Downtown Co-ops 13.5%East Side Co-ops + Condos 13.5%Upper East Side Co-ops + Condos 10.9%Fort George Co-ops + Condos 9.9%Financial District Condos 9.6%Greenwich Village Co-ops 9.3%Upper West Side Co-ops + Condos 9.0%East End Ave Co-ops + Condos 8.2%Sutton + Beekman Co-ops + Condos 8.2%Upper West Side Co-ops 8.1%Financial District Co-ops + Condos 8.0%Carnegie Hill Co-ops + Condos 7.8%Fifth Ave + Park Ave Corridor Co-ops + Condos 7.6%Lincoln Center Co-ops 7.6%West Side Co-ops 6.9%Lenox Hill Co-ops 6.3%Central Park West Co-ops 5.9%Union Square + Gramercy + Kips Bay + Murray Hill Co-ops + Condos 5.3%Manhattan Co-ops 5.2%East Side + West Side + Downtown Co-ops 5.1%Union Square + Gramercy + Kips Bay + Murray Hill Co-ops 4.5%Chelsea Condos 4.0%Lincoln Center Condos 3.7%Upper West Side Condos 2.2%Central Park West Condos 1.5%Upper East Side Co-ops -1.1%East Village + Lower East Side Condos -1.3%East Side Co-ops -1.7%East Village + Lower East Side Co-ops -1.8%East Village + Lower East Side Co-ops + Condos -2.5%Sutton + Beekman Co-ops -4.0%Fifth Ave + Park Ave Corridor Co-ops -5.2%Union Square + Gramercy + Kips Bay + Murray Hill Condos -5.5%Financial District Co-ops -6.6%Carnegie Hill Co-ops -7.5%East End Ave Condos -17.2%Midtown East + Turtle Bay Co-ops -18.8%
Market Area Ranking (percent change of average price per square foot, 2014-2015, co-ops, condos)
Days on Market Listing Discount
0
25
50
75
100
125
150
175
200
20152014201320122011201020092008200720060%
2%
4%
6%
8%
10%
12%Condos Co-ops
$0
$5,000,000,000
$10,000,000,000
$15,000,000,000
$20,000,000,000
$25,000,000,000
2015201420132012201120102009200820072006
MANHATTAN CO-OPS & CONDOS
Days on Market / Listing Discount Market Sales Volume
8
MANHATTANMANHATTAN DECADE
2006-2015
Visit our website to browse listings and learn more about market trends
MANHATTAN CO-OPS
Despite a new record median sales price reached in 2015, the price trend indicators showed mixed results, suggesting a relatively stable market. Median sales price increased 2% to a record $755,000 from the prior year, the highest level reached since this metric was tracked in first tracked in 1989. Average sales price fell 9.1% to $1,350,393 from the year ago record of $4,484,885. Average price per square foot followed the same pattern, slipping 2.6% to $1,113 from the prior year record of $1,143 and remaining above the $1,000 per square foot threshold for the second consecutive year.
There were 6,805 sales in 2015, 11% below the year ago total of 7,645 and the second consecutive year of declining sales. The annual sales total were 19.3% above the decade average of 5,703 sales. Co-op sales account for 56.9% of all apartment sales and 41.9% of all co-op dollar volume. Listing inventory was 2,164, down 6.2% from the year ago total, the lowest total since 1999, when this metric was first tracked. With sales declining at twice the rate of inventory, the pace of the market slowed. The absorption period, the number of months to sell all inventory and the current rate of sales, increased to 3.8 months from 3.6 months in the prior year, still nearly twice as fast as the 7.1 month average of the past decade.
Days on market, the number of days from the last price change to the contract date, fell 12.1% to a record low of 80 days. This was the fastest average marketing time since the metric was tracked beginning in 1999 and well below the 123-day average for the decade. Listing discount, the percentage difference between the list price at time of contract and the sales price, increased to 2.7% from 1.8% in the prior year and below the 4.3% ten-year average.
The three Manhattan neighborhoods showing the largest year-
over-year gains in average price per square foot for co-ops were:
Midwest West + Clinton +22.1%, Yorkville + 17.7%, East End
Ave +17.2%. The lagging co-op markets were: Financial District
-6.6%, Carnegie Hill -7.5%, Financial District - 6.6%
Price trend indicators were mixed, suggesting overall stability
Median sales price set a record, rising 2% to $755,000 from the prior year.
The remaining price trend indicators fell short of prior levels. Average price per square foot slipped
2.6% to $1,113 and average sales price declined 9.1% to $1,350,393 respectively from the prior year.
Sales fell faster than the decline in supply
There were 6,805 sales in 2015, down 11% from the prior year. Listing inventory fell 6.2% to 2,164
over the same period. As a result of sales falling faster than inventory, the pace of the market slowed.
Fastest marketing time in seventeen years
The average days on market dropped 12.1% to a record low of 80 days, the shortest
marketing time recorded since this metric was tracked beginning in 1999.Market Area Ranking (percent change of average price per square foot, 2014-2015, co-ops, condos)

9
MANHATTANMANHATTAN DECADE
2006-2015
Visit our website to browse listings and learn more about market trends
MANHATTAN CO-OPS MANHATTAN CONDOS
BoundaryNorth: Harlem RiverSouth: Battery ParkEast: East RiverWest: Hudson River
Studio 1 Bedroom 2 Bedroom 3 Bedroom 4+ Bedroom ALL
2015 $399,192 $749,710 $1,544,211 $3,205,749 $6,821,847 $1,350,393
2014 $423,717 $719,238 $1,531,903 $3,617,412 $9,043,822 $1,484,885
2013 $406,364 $642,570 $1,328,187 $2,700,043 $5,116,773 $1,130,846
2012 $380,450 $633,077 $1,295,137 $2,410,657 $6,500,994 $1,153,695
2011 $344,674 $582,547 $1,365,284 $2,708,686 $7,282,364 $1,147,561
2010 $355,926 $600,369 $1,279,413 $2,714,303 $6,697,584 $1,177,425
2009 $363,666 $617,241 $1,237,494 $2,342,791 $6,211,596 $1,030,630
2008 $432,468 $708,339 $1,632,387 $4,097,873 $11,611,743 $1,259,725
2007 $379,182 $631,648 $1,411,088 $3,482,993 $8,694,720 $1,134,954
2006 $389,430 $614,770 $1,325,048 $3,230,631 $7,014,014 $1,114,737
Studio 1 Bedroom 2 Bedroom 3 Bedroom 4+ Bedroom ALL
2015 $390,000 $675,000 $1,350,000 $2,685,000 $5,050,000 $755,000
2014 $375,000 $625,000 $1,280,000 $2,595,000 $5,753,112 $740,000
2013 $375,000 $576,000 $1,138,000 $2,200,000 $4,050,000 $680,000
2012 $345,000 $565,000 $1,075,000 $1,960,000 $4,175,000 $665,000
2011 $349,000 $550,000 $1,120,000 $2,295,250 $5,650,000 $672,500
2010 $349,000 $570,000 $1,110,000 $2,400,000 $5,300,000 $705,000
2009 $360,000 $580,000 $1,095,000 $1,975,000 $4,750,000 $625,000
2008 $420,000 $660,000 $1,400,000 $3,500,000 $9,000,000 $718,000
2007 $370,000 $599,000 $1,225,000 $3,250,000 $6,451,250 $675,000
2006 $375,000 $588,778 $1,150,000 $2,900,000 $5,600,000 $675,000
Studio 1 Bedroom 2 Bedroom 3 Bedroom 4+ Bedroom ALL
2015 $669 $939 $1,203 $1,565 $2,012 $1,113
2014 $853 $919 $1,226 $1,751 $2,735 $1,143
2013 $814 $865 $1,047 $1,378 $1,738 $985
2012 $748 $823 $1,027 $1,249 $2,061 $953
2011 $722 $801 $1,053 $1,308 $2,112 $946
2010 $733 $808 $1,017 $1,282 $1,830 $944
2009 $740 $839 $975 $1,174 $1,869 $910
2008 $918 $980 $1,221 $1,630 $2,732 $1,097
2007 $828 $890 $1,107 $1,411 $2,414 $1,006
2006 $773 $813 $993 $1,324 $1,949 $924
Studio 1 Bedroom 2 Bedroom 3 Bedroom 4+ Bedroom ALL
2015 1,180 2,974 1,769 711 171 6,805
2014 1,263 3,181 2,147 791 263 7,645
2013 1,296 3,210 2,216 780 212 7,714
2012 1,056 2,522 1,754 646 200 6,178
2011 908 1,948 1,726 389 138 5,109
2010 694 1904 1575 518 129 4,820
2009 791 1,352 836 329 93 3,401
2008 1,229 1,663 1,437 168 89 4,586
2007 1,402 2,349 2,291 299 120 6,461
2006 830 1,549 1,617 211 100 4,307
Average Sales Price
Median Sales Price
Average Price Per Square Foot
Number of Sales
Average Price Per Square Foot / Number of Sales
$0
$300
$600
$900
$1,200
$1,500
20152014201320122011201020092008200720060
2,000
4,000
6,000
8,000
10,000
Price/sq. ft Number of salesMatrix Current Year % Chg Prior Year % Chg Prior Decade
Average Sales Price $1,350,393 -9.1% $1,484,885 21.1% $1,114,737
Average Price Per Sq. Ft $1,113 -2.6% $1,143 20.5% $924
Median Sales Price $755,000 2.0% $740,000 11.9% $675,000
Number of Sales 6,805 -11.0% 7,645 58.0% 4,307

10
MANHATTANMANHATTAN DECADE
2006-2015
Visit our website to browse listings and learn more about market trends
MANHATTAN CONDOS
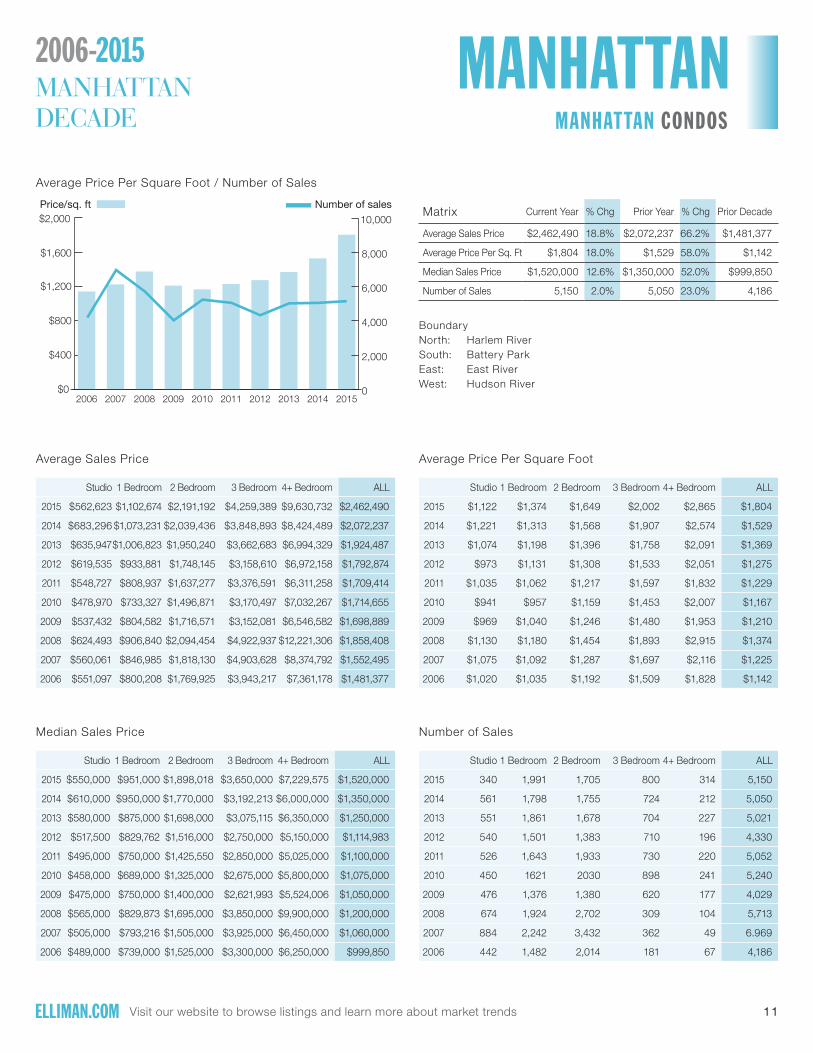
For the third consecutive year, all three price trend indicators rose to new records. Median sales price increased 12.6% to $1,520,000 from the prior year to the highest level since 1999 when the metric was first tracked. This metric was 26.6% aboive the “pre-Lehman” high of $1,2000,000 set in 2008. Average sales price rose 18.8% to a record of $2,462,490 from the prior year, the second consecutive quarter above the $2 million threshold. Average price per square foot jumped 18% to a new record of $1,804 over the same period. The rising pace of new development closings and limited supply of re-sale inventory contributed to the record setting prices.
After bottoming in 2013, condo inventory expanded in each of the past 2 years. In the second half of 2015, new development supply fell by half as the lower absorption rate of their contracts forced developers to place less supply into the market. With more resale inventory coming online, this softened the rise in supply. There were 2,882 listings on the market at the end of 2015, up 7.3% from the prior year. The number of sales increased 2% to 5,150 from 5,050 sales in the prior year bracketing the ten year sales average of 5,074. As a result of inventory rising faster than sales, the pace of the market eased. The absorption period, the
number of months to sell all inventory at the current rate of sales, was 6.7 months, 0.3 months slower than the prior year average of 6.4 months but well below the decade average of 7.9 months. Condo sales accounted for 43.1% of all apartment sales in 2015, up from 39.8% in the prior year. Condo sales dollars fell to a market share of 57.9% over from 48% in 2014. Days on market, the number of days between the date of the last price change and the contract date, slipped to 94 days from 119 in the previous year. Listing discount, the percentage difference between the list price at time of contract and the sales price, increased to 5% from 3% in the prior year.
The three Manhattan neighborhoods showing the largest year-over-year gains in average price per square foot for condos were: Sutton + Beekman +55.8%, Fifth Ave + Park Ave Corridor +55.2%, Carnegie Hill +38.4%. The lagging condo neighborhoods were: East End Ave -17.2%, Union Square + Gramercy + Kips Bay + Murray Hill -5.5%, East Village + Lower East Side -1.3%.
All price indicators set new records for the third consecutive year
Median sales price rose 12.6% to $1,520,000 from the prior year to the highest level since
1999 when the metric was first tracked. Average sales price rose 18.8% to a record of $2,462,490
from the prior year. Average price per square foot jumped 18% to a new record of $1,804 over the same period.
More sales and even more inventory
There were 5,150 condo sales in 2015, up 2% from the prior year.
Listing inventory increased 7.3% to 2,882.
Marketing time and negotiability expanded
Days on market fell 21% to 94 days, its lowest level in 16 years.
Listing discount increased to 5% from 3% in the prior year.
11
MANHATTANMANHATTAN DECADE
2006-2015
Visit our website to browse listings and learn more about market trends
MANHATTAN CONDOS MANHATTAN LUXURY CO-OPS & CONDOS
Average Price Per Square Foot / Number of Sales
Matrix Current Year % Chg Prior Year % Chg Prior Decade
Average Sales Price $2,462,490 18.8% $2,072,237 66.2% $1,481,377
Average Price Per Sq. Ft $1,804 18.0% $1,529 58.0% $1,142
Median Sales Price $1,520,000 12.6% $1,350,000 52.0% $999,850
Number of Sales 5,150 2.0% 5,050 23.0% 4,186
BoundaryNorth: Harlem RiverSouth: Battery ParkEast: East RiverWest: Hudson River
Studio 1 Bedroom 2 Bedroom 3 Bedroom 4+ Bedroom ALL
2015 $562,623 $1,102,674 $2,191,192 $4,259,389 $9,630,732 $2,462,490
2014 $683,296 $1,073,231 $2,039,436 $3,848,893 $8,424,489 $2,072,237
2013 $635,947$1,006,823 $1,950,240 $3,662,683 $6,994,329 $1,924,487
2012 $619,535 $933,881 $1,748,145 $3,158,610 $6,972,158 $1,792,874
2011 $548,727 $808,937 $1,637,277 $3,376,591 $6,311,258 $1,709,414
2010 $478,970 $733,327 $1,496,871 $3,170,497 $7,032,267 $1,714,655
2009 $537,432 $804,582 $1,716,571 $3,152,081 $6,546,582 $1,698,889
2008 $624,493 $906,840 $2,094,454 $4,922,937 $12,221,306 $1,858,408
2007 $560,061 $846,985 $1,818,130 $4,903,628 $8,374,792 $1,552,495
2006 $551,097 $800,208 $1,769,925 $3,943,217 $7,361,178 $1,481,377
Studio 1 Bedroom 2 Bedroom 3 Bedroom 4+ Bedroom ALL
2015 $550,000 $951,000 $1,898,018 $3,650,000 $7,229,575 $1,520,000
2014 $610,000 $950,000 $1,770,000 $3,192,213 $6,000,000 $1,350,000
2013 $580,000 $875,000 $1,698,000 $3,075,115 $6,350,000 $1,250,000
2012 $517,500 $829,762 $1,516,000 $2,750,000 $5,150,000 $1,114,983
2011 $495,000 $750,000 $1,425,550 $2,850,000 $5,025,000 $1,100,000
2010 $458,000 $689,000 $1,325,000 $2,675,000 $5,800,000 $1,075,000
2009 $475,000 $750,000 $1,400,000 $2,621,993 $5,524,006 $1,050,000
2008 $565,000 $829,873 $1,695,000 $3,850,000 $9,900,000 $1,200,000
2007 $505,000 $793,216 $1,505,000 $3,925,000 $6,450,000 $1,060,000
2006 $489,000 $739,000 $1,525,000 $3,300,000 $6,250,000 $999,850
Studio 1 Bedroom 2 Bedroom 3 Bedroom 4+ Bedroom ALL
2015 $1,122 $1,374 $1,649 $2,002 $2,865 $1,804
2014 $1,221 $1,313 $1,568 $1,907 $2,574 $1,529
2013 $1,074 $1,198 $1,396 $1,758 $2,091 $1,369
2012 $973 $1,131 $1,308 $1,533 $2,051 $1,275
2011 $1,035 $1,062 $1,217 $1,597 $1,832 $1,229
2010 $941 $957 $1,159 $1,453 $2,007 $1,167
2009 $969 $1,040 $1,246 $1,480 $1,953 $1,210
2008 $1,130 $1,180 $1,454 $1,893 $2,915 $1,374
2007 $1,075 $1,092 $1,287 $1,697 $2,116 $1,225
2006 $1,020 $1,035 $1,192 $1,509 $1,828 $1,142
Studio 1 Bedroom 2 Bedroom 3 Bedroom 4+ Bedroom ALL
2015 340 1,991 1,705 800 314 5,150
2014 561 1,798 1,755 724 212 5,050
2013 551 1,861 1,678 704 227 5,021
2012 540 1,501 1,383 710 196 4,330
2011 526 1,643 1,933 730 220 5,052
2010 450 1621 2030 898 241 5,240
2009 476 1,376 1,380 620 177 4,029
2008 674 1,924 2,702 309 104 5,713
2007 884 2,242 3,432 362 49 6.969
2006 442 1,482 2,014 181 67 4,186
Average Sales Price
Median Sales Price
Average Price Per Square Foot
Number of Sales
$0
$400
$800
$1,200
$1,600
$2,000
20152014201320122011201020092008200720060
2,000
4,000
6,000
8,000
10,000
Price/sq. ft Number of sales

12
MANHATTANMANHATTAN DECADE
2006-2015
Visit our website to browse listings and learn more about market trends
2015 $2,807,152 2010 $2,041,701
2014 $2,506,039 2009 $1,927,311
2013 $2,288,106 2008 $2,215,231
2012 $2,083,776 2007 $2,182,697
2011 $2,063,650 2006 $1,908,640
2015 $7,332,748 2010 $5,607,939
2014 $7,330,892 2009 $5,393,389
2013 $5,514,143 2008 $6,330,093
2012 $5,629,706 2007 $4,958,015
2011 $5,490,814 2006 $4,588,242
Average Sales Price
Average Sales Price
Average Price Per Sq. Ft
Average Price Per Sq. Ft
Median Sales Price
Median Sales Price
Number Of Sales
Number Of Sales
2015 $1,720 2009 $1,107
2014 $1,418 2009 $1,107
2013 $1,305 2008 $1,280
2012 $1,178 2007 $1,229
2011 $1,172 2006 $1,101
2015 $2,539 2010 $1,928
2014 $2,695 2009 $1,938
2013 $2,081 2008 $2,272
2012 $2,083 2007 $1,911
2011 $2,020 2006 $1,695
2015 $2,100,000 2010 $1,575,000
2013 $1,800,000 2009 $1,577,300
2012 $1,707,500 2008 $1,795,000
2011 $1,610,000 2007 $1,630,000
2010 $1,575,000 2006 $1,450,000
2015 $5,651,287 2010 $4,318,275
2014 $5,150,000 2009 $4,174,825
2013 $4,300,000 2008 $4,400,000
2012 $4,165,000 2007 $3,750,000
2011 $4,175,000 2006 $3,525,000
2015 562 2010 801
2014 823 2009 501
2013 1,017 2008 835
2012 849 2007 687
2011 793 2006 710
2015 1,199 2010 1,006
2014 1,270 2009 1,030
2013 1,274 2008 1,030
2012 1,051 2007 1,343
2011 1,016 2006 849
MANHATTAN LUXURY CO-OPS & CONDOS
MANHATTAN LOFT CO-OPS & CONDOS
Average Price Per Square Foot / Number of Sales
Average Price Per Square Foot / Number of Sales
Matrix Current Year % Chg Prior Year % Chg Prior Decade
Average Sales Price $2,807,152 12.0% $2,506,039 47.1% $1,908,640
Average Price Per Sq. Ft $1,720 21.3% $1,418 56.2% $1,101
Median Sales Price $2,100,000 7.1% $1,960,000 44.8% $1,450,000
Number of Sales 562 -31.7% 823 -20.8% 710
Matrix Current Year % Chg Prior Year % Chg Prior Decade
Average Sales Price $7,332,748 0.0% $7,330,892 59.8% $4,588,242
Average Price Per Sq. Ft $2,539 -5.8% $2,695 49.8% $1,695
Median Sales Price $5,651,287 9.7% $5,150,000 60.3% $3,525,000
Number of Sales 1,199 -5.6% 1,270 41.2% 849
Note: This sub-category is the analysis of the top ten percent of all co-op and condo sales. The data is also contained within the co-op and condo markets presented.
BoundaryNorth: Harlem RiverSouth: Battery ParkEast: East RiverWest: Hudson River
Note: This sub-category is the analysis of all co-op and condo loft sales available. The data is also contained within the co-op and condo markets presented.
BoundaryNorth: Harlem RiverSouth: Battery ParkEast: East RiverWest: Hudson River
$0
$700
$1,400
$2,100
$2,800
$3,500
20152014201320122011201020092008200720060
400
800
1,200
1,600
2,000
Price/sq. ft Number of sales
$0
$400
$800
$1,200
$1,600
$2,000
20152014201320122011201020092008200720060
400
800
1,200
1,600
2,000
Price/sq. ft Number of sales

13
MANHATTANMANHATTAN DECADE
2006-2015
Visit our website to browse listings and learn more about market trends
EAST SIDE/WEST SIDE/DOWNTOWN CO-OPS & CONDOS EAST SIDE/WEST SIDE/DOWNTOWN CO-OPS
Average Price Per Square Foot / Number of Sales
BoundaryNorth: West 116th Street and East 96th StreetSouth: Battery ParkEast: East RiverWest: Hudson River
Studio 1 Bedroom 2 Bedroom 3 Bedroom 4+ Bedroom ALL
2015 $445,408 $933,484 $1,985,997 $4,029,485 $8,946,807 $1,911,126
2014 $522,584 $883,983 $1,880,221 $4,010,302 $8,945,410 $1,823,272
2013 $487,889 $814,817 $1,704,326 $3,344,881 $6,320,064 $1,530,526
2012 $478,325 $772,713 $1,591,226 $3,011,775 $6,957,598 $1,495,851
2011 $431,798 $706,751 $1,583,359 $3,273,944 $6,817,480 $1,494,752
2010 $414,014 $680,784 $1,455,092 $3,088,525 $7,017,462 $1,522,410
2009 $439,769 $725,839 $1,581,638 $2,923,864 $6,472,663 $1,442,852
2008 $516,657 $841,202 $2,002,277 $4,658,831 $11,960,354 $1,663,925
2007 $464,979 $752,076 $1,719,420 $4,342,699 $8,603,757 $1,406,248
2006 $448,939 $715,790 $1,624,187 $3,631,161 $7,153,295 $1,325,226
Studio 1 Bedroom 2 Bedroom 3 Bedroom 4+ Bedroom ALL
2015 $418,000 $799,326 $1,716,376 $3,375,000 $6,676,629 $1,115,000
2014 $432,000 $740,000 $1,600,000 $3,100,000 $5,956,762 $999,950
2013 $430,000 $700,000 $1,443,750 $2,775,000 $5,205,000 $920,000
2012 $395,000 $670,000 $1,337,500 $2,506,000 $4,950,000 $885,000
2011 $395,000 $647,500 $1,338,998 $2,750,000 $5,252,800 $902,500
2010 $395,000 $635,000 $1,275,000 $2,647,450 $5,750,000 $935,000
2009 $400,000 $669,000 $1,300,000 $2,459,742 $5,181,110 $880,000
2008 $475,000 $768,778 $1,650,000 $3,798,500 $9,400,000 $996,766
2007 $430,000 $700,000 $1,437,500 $3,500,000 $6,450,000 $899,000
2006 $410,000 $660,000 $1,400,000 $3,200,000 $5,800,000 $850,000
Studio 1 Bedroom 2 Bedroom 3 Bedroom 4+ Bedroom ALL
2015 $772 $1,169 $1,502 $1,886 $2,624 $1,597
2014 $995 $1,095 $1,443 $1,910 $2,695 $1,346
2013 $907 $1,022 $1,247 $1,614 $1,960 $1,176
2012 $853 $968 $1,202 $1,459 $2,085 $1,125
2011 $858 $947 $1,182 $1,535 $1,965 $1,122
2010 $834 $897 $1,126 $1,412 $1,954 $1,088
2009 $842 $954 $1,168 $1,390 $1,929 $1,094
2008 $1,019 $1,113 $1,407 $1,808 $2,834 $1,284
2007 $944 $1,008 $1,250 $1,586 $2,330 $1,148
2006 $864 $934 $1,127 $1,430 $1,900 $1,047
Studio 1 Bedroom 2 Bedroom 3 Bedroom 4+ Bedroom ALL
2015 1,395 4,573 3,144 1,377 478 10,967
2014 1,685 4,598 3,527 1,374 464 11,648
2013 1,739 4,606 3,520 1,373 419 11,657
2012 1,482 3,735 2,841 1,225 381 9,664
2011 1,323 3,343 3,372 1,059 349 9,446
2010 1,051 3,255 3,376 1,361 364 9,407
2009 1,154 2,581 2,102 924 268 7,029
2008 1,729 3,316 3,905 472 192 9,614
2007 2,057 4,333 5,334 644 168 12,536
2006 1,242 2,926 3,434 378 167 8,147
Average Sales Price
Median Sales Price
Average Price Per Square Foot
Number of Sales
Price/sq. ft Number of sales
$0
$400
$800
$1,200
$1,600
$2,000
20152014201320122011201020092008200720060
4,000
8,000
12,000
16,000
20,000Matrix Current Year % Chg Prior Year % Chg Prior Decade
Average Sales Price $1,911,126 4.8% $1,823,272 44.2% $1,325,226
Average Price Per Sq. Ft $1,597 18.6% $1,346 52.5% $1,047
Median Sales Price $1,115,000 11.5% $999,950 31.2% $850,000
Number of Sales 10,967 -5.8% 11,648 34.6% 8,147

14
MANHATTANMANHATTAN DECADE
2006-2015
Visit our website to browse listings and learn more about market trends
EAST SIDE/WEST SIDE/DOWNTOWN CO-OPS
Average Price Per Square Foot / Number of Sales
Matrix Current Year % Chg Prior Year % Chg Prior Decade
Average Sales Price $1,357,827 -13.5% $1,569,473 18.6% $1,145,242
Average Price Per Sq. Ft $1,243 5.1% $1,183 32.4% $939
Median Sales Price $795,000 1.7% $782,071 15.1% $691,000
Number of Sales 6,104 -13.8% 7,079 48.8% 4,101
BoundaryNorth: West 116th Street and East 96th StreetSouth: Battery ParkEast: East RiverWest: Hudson River
Studio 1 Bedroom 2 Bedroom 3 Bedroom 4+ Bedroom ALL
2015 $408,291 $778,941 $1,630,398 $3,441,314 $7,221,067 $1,357,827
2014 $439,598 $746,051 $1,623,855 $3,886,830 $9,232,091 $1,569,473
2013 $416,542 $674,420 $1,414,896 $2,879,744 $5,400,995 $1,199,370
2012 $389,754 $655,181 $1,368,375 $2,568,428 $6,810,256 $1,211,698
2011 $353,977 $597,993 $1,408,572 $2,826,719 $7,326,768 $1,195,196
2010 $362,105 $616,530 $1,317,385 $2,787,989 $6,697,584 $1,222,073
2009 $369,457 $626,804 $1,266,366 $2,398,544 $6,267,972 $1,064,103
2008 $441,389 $729,254 $1,675,791 $4,124,655 $11,611,743 $1,312,037
2007 $392,852 $642,581 $1,450,513 $3,519,735 $8,694,720 $1,189,938
2006 $391,633 $623,606 $1,380,297 $3,290,253 $7,014,014 $1,145,242
Studio 1 Bedroom 2 Bedroom 3 Bedroom 4+ Bedroom ALL
2015 $399,000 $695,000 $1,400,000 $2,800,000 $5,190,000 $795,000
2014 $380,000 $645,000 $1,350,000 $2,750,000 $5,804,025 $782,071
2013 $380,000 $599,000 $1,200,000 $2,310,000 $4,350,000 $730,529
2012 $350,000 $580,000 $1,145,000 $2,085,000 $4,415,000 $700,000
2011 $350,000 $555,000 $1,152,000 $2,350,000 $5,650,000 $700,000
2010 $352,000 $580,000 $1,150,000 $2,450,000 $5,300,000 $750,000
2009 $362,833 $585,000 $1,100,000 $2,000,000 $4,750,000 $649,000
2008 $425,000 $675,000 $1,435,000 $3,526,000 $9,000,000 $748,480
2007 $380,000 $602,000 $1,250,000 $3,275,000 $6,451,250 $705,000
2006 $375,000 $595,000 $1,195,000 $2,900,000 $5,600,000 $691,000
Studio 1 Bedroom 2 Bedroom 3 Bedroom 4+ Bedroom ALL
2015 $675 $967 $1,243 $1,634 $2,064 $1,243
2014 $880 $944 $1,276 $1,828 $2,777 $1,183
2013 $830 $895 $1,089 $1,433 $1,796 $1,019
2012 $764 $848 $1,063 $1,294 $2,096 $981
2011 $736 $819 $1,073 $1,337 $2,119 $968
2010 $746 $825 $1,036 $1,298 $1,830 $964
2009 $746 $847 $989 $1,190 $1,876 $923
2008 $940 $997 $1,242 $1,638 $2,732 $1,121
2007 $845 $901 $1,127 $1,418 $2,414 $1,028
2006 $777 $824 $1,018 $1,339 $1,949 $939
Studio 1 Bedroom 2 Bedroom 3 Bedroom 4+ Bedroom ALL
2015 1,103 2,703 1,525 618 155 6,104
2014 1,169 2,958 1,970 725 257 7,079
2013 1,225 2,888 2,014 717 199 7,043
2012 1,002 2,334 1,614 594 190 5,734
2011 834 1,826 1,648 368 137 4,813
2010 642 1,782 1,505 499 129 4,557
2009 725 1,288 803 319 92 3,227
2008 1,127 1,548 1,374 166 89 4,304
2007 1,188 2,204 2,170 295 120 5,977
2006 807 1,484 1,504 206 100 4,101
Average Sales Price
Median Sales Price
Average Price Per Square Foot
Number of Sales
$0
$300
$600
$900
$1,200
$1,500
20152014201320122011201020092008200720060
2,000
4,000
6,000
8,000
10,000
Price/sq. ft Number of sales
15
MANHATTANMANHATTAN DECADE
2006-2015
Visit our website to browse listings and learn more about market trends
EAST SIDE/WEST SIDE/DOWNTOWN CONDOS
Average Price Per Square Foot / Number of Sales
BoundaryNorth: West 116th Street and East 96th StreetSouth: Battery ParkEast: East RiverWest: Hudson River
Studio 1 Bedroom 2 Bedroom 3 Bedroom 4+ Bedroom ALL
2015 $585,617$1,156,868 $2,320,950 $4,508,391 $9,774,949 $2,605,622
2014 $710,589$1,132,766 $2,204,590 $4,148,232 $8,589,482 $2,216,496
2013 $657,929$1,050,827 $2,091,385 $3,853,271 $7,151,403 $2,036,016
2012 $663,217 $968,517 $1,884,366 $3,429,125 $7,104,169 $1,910,440
2011 $564,524 $837,662 $1,750,440 $3,512,119 $6,488,365 $1,805,947
2010 $495,495 $758,518 $1,565,862 $3,262,501 $7,193,054 $1,804,603
2009 $558,594 $824,491 $1,776,529 $3,200,851 $6,579,660 $1,764,321
2008 $657,565 $939,219 $2,179,516 $4,948,612 $12,261,581 $1,949,146
2007 $563,584 $865,428 $1,903,847 $5,038,328 $8,376,350 $1,603,364
2006 $555,251 $810,658 $1,814,244 $4,039,458 $7,361,178 $1,507,657
Studio 1 Bedroom 2 Bedroom 3 Bedroom 4+ Bedroom ALL
2015 $565,000 $990,000 $1,997,543 $3,850,000 $7,250,000 $1,649,919
2014 $625,000 $985,000 $1,870,600 $3,400,000 $6,109,625 $1,450,000
2013 $590,000 $899,000 $1,800,000 $3,195,000 $6,400,000 $1,350,000
2012 $530,000 $850,000 $1,610,000 $2,950,000 $5,151,250 $1,230,000
2011 $505,000 $773,500 $1,525,000 $2,951,690 $5,125,000 $1,196,443
2010 $463,999 $705,000 $1,380,000 $2,785,000 $5,941,968 $1,170,000
2009 $495,000 $766,100 $1,450,000 $2,654,391 $5,526,877 $1,100,000
2008 $589,566 $850,000 $1,755,000 $3,900,000 $9,900,000 $1,270,000
2007 $509,000 $799,326 $1,575,000 $4,065,000 $6,450,000 $1,110,000
2006 $490,000 $745,000 $1,550,000 $3,390,394 $6,250,000 $1,047,000
Studio 1 Bedroom 2 Bedroom 3 Bedroom 4+ Bedroom ALL
2015 $1,174 $1,427 $1,711 $2,063 $2,882 $1,915
2014 $1,256 $1,368 $1,654 $2,001 $2,594 $1,598
2013 $1,092 $1,236 $1,459 $1,812 $2,108 $1,416
2012 $1,040 $1,169 $1,384 $1,615 $2,075 $1,336
2011 $1,066 $1,102 $1,287 $1,641 $1,866 $1,282
2010 $971 $983 $1,199 $1,478 $2,022 $1,204
2009 $1,005 $1,061 $1,279 $1,495 $1,957 $1,240
2008 $1,166 $1,215 $1,497 $1,900 $2,923 $1,416
2007 $1,080 $1,118 $1,334 $1,728 $2,120 $1,257
2006 $1,026 $1,047 $1,212 $1,540 $1,828 $1,157
Studio 1 Bedroom 2 Bedroom 3 Bedroom 4+ Bedroom ALL
2015 292 1,870 1,619 759 323 4,863
2014 516 1,640 1,557 649 207 4,569
2013 514 1,718 1,506 656 220 4,614
2012 480 1,401 1,227 631 191 3,930
2011 489 1,517 1,724 691 212 4,633
2010 409 1,473 1,871 862 235 4,850
2009 429 1,293 1,299 605 176 3,802
2008 602 1,768 2,531 306 103 5,310
2007 869 2,129 3,164 349 48 6,559
2006 435 1,442 1,930 172 67 4,046
Average Sales Price
Median Sales Price
Average Price Per Square Foot
Number of Sales
$0
$400
$800
$1,200
$1,600
$2,000
20152014201320122011201020092008200720060
2,000
4,000
6,000
8,000
10,000
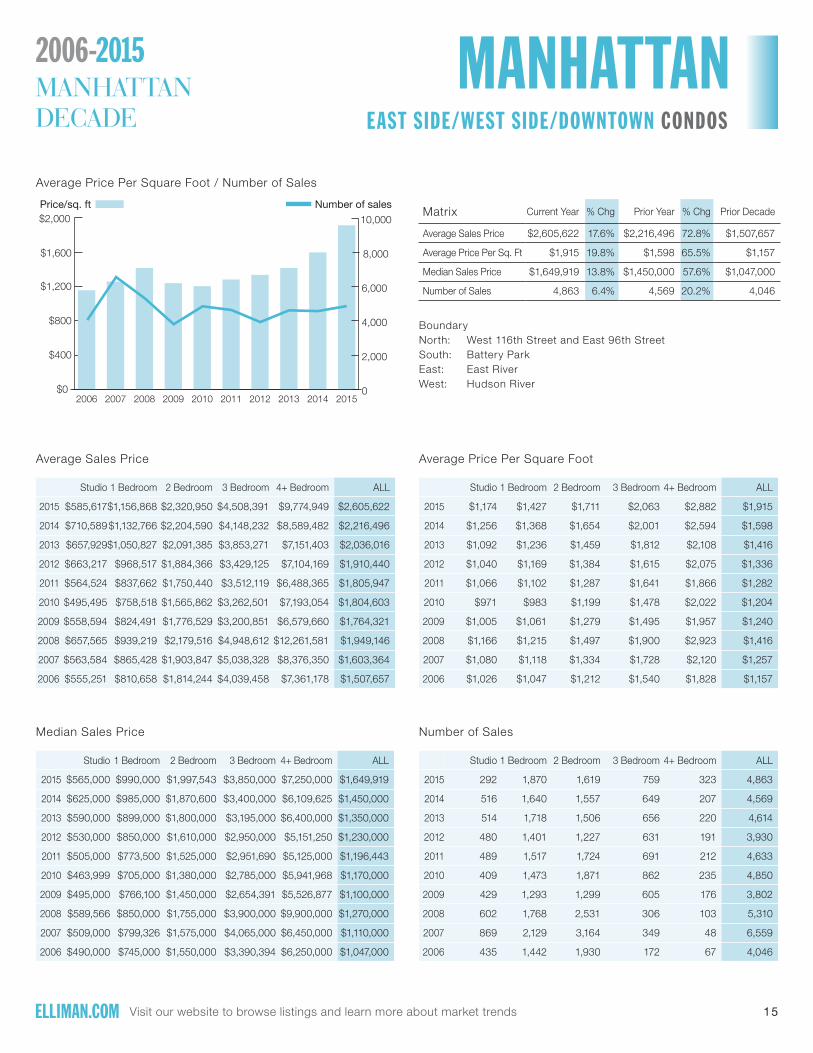
Price/sq. ft Number of salesMatrix Current Year % Chg Prior Year % Chg Prior Decade
Average Sales Price $2,605,622 17.6% $2,216,496 72.8% $1,507,657
Average Price Per Sq. Ft $1,915 19.8% $1,598 65.5% $1,157
Median Sales Price $1,649,919 13.8% $1,450,000 57.6% $1,047,000
Number of Sales 4,863 6.4% 4,569 20.2% 4,046

16
EAST SIDEMANHATTAN DECADE
2006-2015
Visit our website to browse listings and learn more about market trends
EAST SIDE CO-OPS
Average Price Per Square Foot / Number of Sales
BoundaryNorth: East 96th StreetSouth: East 42nd StreetEast: East River (including corridor between CPS, W 57th Street and Eighth
Avenue)
West: Avenue of the Americas
Studio 1 Bedroom 2 Bedroom 3 Bedroom 4+ Bedroom ALL
2015 $387,138 $723,976 $1,633,281 $3,605,774 $8,281,223 $1,526,580
2014 $367,213 $755,500 $1,774,007 $4,726,022 $11,149,988 $2,095,959
2013 $366,996 $624,364 $1,473,685 $3,085,842 $6,039,489 $1,408,485
2012 $358,821 $608,099 $1,403,949 $2,809,022 $8,767,712 $1,480,803
2011 $332,520 $588,985 $1,504,747 $2,967,939 $8,085,048 $1,464,316
2010 $338,897 $600,062 $1,339,049 $3,078,190 $6,887,979 $1,408,341
2009 $348,667 $636,501 $1,351,399 $2,576,737 $7,171,210 $1,350,556
2008 $440,993 $746,240 $1,739,097 $4,458,651 $12,747,625 $1,726,673
2007 $368,251 $627,131 $1,493,804 $3,598,052 $9,581,907 $1,457,612
2006 $367,398 $613,072 $1,489,895 $3,491,492 $6,817,241 $1,359,357
Studio 1 Bedroom 2 Bedroom 3 Bedroom 4+ Bedroom ALL
2015 $375,000 $652,500 $1,365,000 $2,767,500 $6,287,500 $815,000
2014 $350,000 $617,307 $1,350,000 $3,135,323 $7,850,000 $875,000
2013 $330,000 $565,000 $1,195,000 $2,400,000 $4,900,000 $790,000
2012 $325,000 $545,000 $1,150,000 $2,195,000 $5,175,000 $780,000
2011 $325,000 $547,500 $1,185,000 $2,600,000 $5,900,000 $810,000
2010 $320,000 $565,000 $1,150,000 $2,768,750 $6,050,000 $825,000
2009 $340,000 $590,000 $1,140,000 $2,200,000 $5,625,000 $745,000
2008 $418,800 $672,140 $1,470,000 $3,792,940 $9,550,000 $845,000
2007 $362,500 $595,000 $1,265,000 $3,375,000 $6,700,000 $750,000
2006 $357,500 $585,000 $1,275,000 $3,100,000 $5,250,000 $755,000
Studio 1 Bedroom 2 Bedroom 3 Bedroom 4+ Bedroom ALL
2015 $507 $908 $1,224 $1,708 $2,580 $1,302
2014 $758 $946 $1,360 $2,114 $3,224 $1,324
2013 $755 $830 $1,109 $1,504 $1,936 $1,043
2012 $712 $776 $1,078 $1,376 $2,491 $1,019
2011 $691 $793 $1,104 $1,370 $2,251 $1,018
2010 $694 $794 $1,043 $1,376 $1,819 $989
2009 $723 $834 $1,017 $1,249 $2,044 $978
2008 $905 $991 $1,284 $1,773 $2,902 $1,197
2007 $799 $868 $1,144 $1,453 $2,580 $1,067
2006 $730 $788 $1,079 $1,412 $1,888 $978
Studio 1 Bedroom 2 Bedroom 3 Bedroom 4+ Bedroom ALL
2015 414 1,019 679 306 86 2,504
2014 380 1,057 903 362 156 2,858
2013 386 1,114 953 370 128 2,951
2012 307 858 760 291 105 2,321
2011 264 634 719 183 83 1,883
2010 210 686 702 243 77 1,918
2009 233 476 380 173 62 1,324
2008 344 605 584 98 69 1,700
2007 430 837 935 170 95 2,467
2006 272 569 635 123 64 1,663
Average Sales Price
Median Sales Price
Average Price Per Square Foot
Number of Sales
$0
$300
$600
$900
$1,200
$1,500
20152014201320122011201020092008200720060
1,000
2,000
3,000
4,000
5,000
Price/sq. ft Number of salesMatrix Current Year % Chg Prior Year % Chg Prior Decade
Average Sales Price $1,526,580 -27.2% $2,095,959 12.3% $1,359,357
Average Price Per Sq. Ft $1,302 -1.7% $1,324 33.1% $978
Median Sales Price $815,000 -6.9% $875,000 7.9% $755,000
Number of Sales 2,504 -12.4% 2,858 50.6% 1,663

17
EAST SIDEMANHATTAN DECADE
2006-2015
Visit our website to browse listings and learn more about market trends
EAST SIDE CONDOS
Average Price Per Square Foot / Number of Sales
BoundaryNorth: East 96th StreetSouth: East 42nd StreetEast: East River (including corridor between CPS, W 57th Street and Eighth
Avenue)
West: Avenue of the Americas
Studio 1 Bedroom 2 Bedroom 3 Bedroom 4+ Bedroom ALL
2015 $580,337 $1,166,570 $2,431,517 $4,396,469$10,442,389 $2,740,756
2014 $579,714 $1,106,102 $2,142,778 $4,107,855 $8,649,893 $2,399,677
2013 $606,858 $1,051,986 $1,906,803 $3,766,118 $6,988,568 $2,167,684
2012 $493,121 $948,569 $1,961,966 $3,351,297 $6,588,155 $1,960,094
2011 $458,425 $824,001 $1,787,521 $3,498,894 $7,213,052 $1,879,814
2010 $434,371 $753,274 $1,761,368 $3,347,824 $8,027,826 $2,026,390
2009 $526,428 $802,650 $1,666,078 $3,478,877 $6,539,596 $2,015,733
2008 $675,671 $1,028,820 $2,544,497 $5,647,682 $13,317,065 $2,337,897
2007 $543,524 $933,050 $2,348,861 $6,765,986 $8,023,078 $2,017,807
2006 $510,808 $828,080 $1,990,142 $4,083,349 $9,408,005 $1,748,147
Studio 1 Bedroom 2 Bedroom 3 Bedroom 4+ Bedroom ALL
2015 $550,000 $960,000 $1,950,000 $3,600,000 $7,542,981 $1,640,678
2014 $565,000 $857,500 $1,800,000 $3,250,000 $6,900,000 $1,450,000
2013 $555,000 $845,000 $1,600,000 $3,150,000 $6,873,187 $1,350,000
2012 $452,500 $790,000 $1,550,000 $3,034,385 $5,000,000 $1,250,000
2011 $430,000 $725,000 $1,552,831 $2,925,000 $4,887,600 $1,190,000
2010 $425,000 $660,000 $1,400,000 $2,800,000 $6,500,000 $1,235,000
2009 $465,000 $698,371 $1,390,000 $2,825,000 $6,000,000 $1,200,000
2008 $540,000 $783,451 $2,050,000 $4,717,500 $11,500,000 $1,374,637
2007 $491,500 $789,143 $1,875,000 $5,075,000 $7,000,000 $1,250,000
2006 $470,000 $725,000 $1,790,000 $3,450,000 $6,500,000 $1,275,000
Studio 1 Bedroom 2 Bedroom 3 Bedroom 4+ Bedroom ALL
2015 $1,199 $1,459 $1,803 $2,074 $2,913 $1,998
2014 $1,123 $1,343 $1,613 $2,044 $2,590 $1,608
2013 $1,029 $1,264 $1,395 $1,833 $2,204 $1,444
2012 $963 $1,177 $1,453 $1,664 $2,041 $1,375
2011 $939 $1,092 $1,334 $1,712 $2,170 $1,317
2010 $911 $989 $1,318 $1,522 $2,324 $1,287
2009 $1,042 $1,040 $1,235 $1,567 $1,962 $1,275
2008 $1,341 $1,354 $1,675 $2,061 $2,962 $1,589
2007 $1,026 $1,178 $1,568 $2,354 $2,291 $1,446
2006 $1,029 $1,073 $1,303 $1,601 $2,263 $1,241
Studio 1 Bedroom 2 Bedroom 3 Bedroom 4+ Bedroom ALL
2015 79 523 436 198 104 1,340
2014 113 341 371 160 75 1,060
2013 117 375 333 177 84 1,086
2012 101 285 273 157 47 863
2011 103 324 424 148 54 1,053
2010 82 339 437 236 61 1,155
2009 94 309 317 171 83 974
2008 139 421 506 82 37 1,185
2007 496 792 1,498 2,874 3,502 1,395
2006 110 350 568 75 19 1,122
Average Sales Price
Median Sales Price
Average Price Per Square Foot
Number of Sales
$0
$400
$800
$1,200
$1,600
$2,000
20152014201320122011201020092008200720060
400
800
1,200
1,600
2,000
Price/sq. ft Number of salesMatrix Current Year % Chg Prior Year % Chg Prior Decade
Average Sales Price $2,740,756 14.2% $2,399,677 56.8% $1,748,147
Average Price Per Sq. Ft $1,998 24.3% $1,608 61.0% $1,241
Median Sales Price $1,640,678 13.2% $1,450,000 28.7% $1,275,000
Number of Sales 1,340 26.4% 1,060 19.4% 1,122

18
EAST SIDEMANHATTAN DECADE
2006-2015
Visit our website to browse listings and learn more about market trends
UPPER EAST SIDE CO-OPS
Average Price Per Square Foot / Number of Sales
BoundaryNorth: East 96th StreetSouth: East 59th StreetEast: East River West: Fifth Avenue
Studio 1 Bedroom 2 Bedroom 3 Bedroom 4+ Bedroom ALL
2015 $384,895 $741,044 $1,655,215 $3,460,820 $7,953,735 $1,657,421
2014 $358,472 $780,724 $1,720,175 $4,264,210 $10,007,127 $2,117,119
2013 $365,869 $626,962 $1,561,635 $3,257,456 $6,465,298 $1,558,194
2012 $348,550 $602,424 $1,477,271 $2,947,019 $9,469,289 $1,656,522
2011 $327,766 $587,041 $1,576,636 $3,051,403 $8,945,343 $1,633,556
2010 $344,939 $592,490 $1,352,871 $3,083,476 $7,317,491 $1,533,964
2009 $347,074 $640,787 $1,384,639 $2,749,650 $7,409,818 $1,492,724
2008 $435,668 $763,062 $1,816,910 $4,650,914$13,563,379 $2,008,976
2007 $372,684 $631,986 $1,533,806 $3,642,024 $10,241,428 $1,598,827
2006 $355,792 $604,600 $1,438,025 $3,287,408 $7,145,335 $1,410,310
Studio 1 Bedroom 2 Bedroom 3 Bedroom 4+ Bedroom ALL
2015 $375,000 $665,000 $1,423,275 $2,697,500 $6,225,000 $850,000
2014 $340,000 $615,000 $1,365,000 $3,309,312 $7,865,689 $960,375
2013 $325,000 $567,500 $1,237,500 $2,600,000 $5,157,777 $825,000
2012 $325,000 $542,500 $1,200,000 $2,280,000 $5,396,725 $830,000
2011 $325,000 $545,000 $1,240,000 $2,672,906 $6,364,062 $875,000
2010 $330,000 $560,000 $1,175,000 $2,795,000 $6,300,000 $877,200
2009 $345,000 $587,500 $1,150,000 $2,350,000 $6,000,000 $790,000
2008 $425,000 $680,000 $1,527,000 $4,050,000 $10,000,000 $900,000
2007 $370,000 $599,000 $1,295,000 $3,400,000 $7,495,000 $800,000
2006 $359,000 $580,000 $1,280,000 $2,950,000 $5,296,088 $755,000
Studio 1 Bedroom 2 Bedroom 3 Bedroom 4+ Bedroom ALL
2015 $377 $939 $1,223 $1,660 $2,528 $1,307
2014 $752 $975 $1,324 $1,931 $2,954 $1,322
2013 $756 $841 $1,169 $1,581 $2,044 $1,101
2012 $698 $775 $1,122 $1,432 $2,603 $1,069
2011 $683 $798 $1,148 $1,414 $2,391 $1,069
2010 $708 $792 $1,064 $1,389 $1,921 $1,025
2009 $740 $849 $1,050 $1,301 $2,103 $1,025
2008 $903 $1,004 $1,321 $1,850 $3,023 $1,261
2007 $821 $879 $1,174 $1,494 $2,691 $1,111
2006 $726 $800 $1,062 $1,344 $1,970 $988
Studio 1 Bedroom 2 Bedroom 3 Bedroom 4+ Bedroom ALL
2015 213 569 402 206 67 1,457
2014 236 745 664 280 136 2,061
2013 266 768 701 300 106 2,141
2012 211 590 569 236 89 1,695
2011 197 424 563 156 70 1,410
2010 138 469 509 204 66 1,386
2009 168 325 285 139 55 972
2008 226 394 418 84 61 1,183
2007 282 578 666 134 78 1,738
2006 194 386 449 100 55 1,184
Average Sales Price
Median Sales Price
Average Price Per Square Foot
Number of Sales
Price/sq. ft Number of sales
$0
$250
$500
$750
$1,000
$1,250
$1,500
20152014201320122011201020092008200720060
500
1,000
1,500
2,000
2,500
3,000Matrix Current Year % Chg Prior Year % Chg Prior Decade
Average Sales Price $1,657,421 -21.7% $2,117,119 17.5% $1,410,310
Average Price Per Sq. Ft $1,307 -1.1% $1,322 32.3% $988
Median Sales Price $850,000 -11.5% $960,375 12.6% $755,000
Number of Sales 1,457 -29.3% 2,061 23.1% 1,184

19
EAST SIDEMANHATTAN DECADE
2006-2015
Visit our website to browse listings and learn more about market trends
UPPER EAST SIDE CONDOS
Average Price Per Square Foot / Number of Sales
BoundaryNorth: East 96th StreetSouth: East 59th StreetEast: East RiverWest: Fifth Avenue
Studio 1 Bedroom 2 Bedroom 3 Bedroom 4+ Bedroom ALL
2015 $515,807 $980,694 $2,443,973 $3,962,052 $9,553,342 $3,006,912
2014 $559,725 $1,035,869 $2,048,921 $3,652,018 $9,247,685 $2,611,128
2013 $605,551 $984,691 $1,752,365 $3,805,020 $7,071,787 $2,391,821
2012 $497,077 $800,246 $1,778,776 $3,176,974 $6,254,350 $1,947,048
2011 $441,500 $797,802 $1,694,937 $3,297,873 $5,719,700 $1,838,923
2010 $406,768 $716,263 $1,618,079 $3,060,573 $6,869,843 $1,956,699
2009 $498,715 $738,443 $1,716,939 $3,308,468 $6,289,877 $2,115,026
2008 $528,282 $827,909 $2,209,495 $5,182,160 $11,363,942 $2,188,861
2007 $497,615 $865,436 $1,978,376 $5,888,876 $5,040,192 $1,692,970
2006 $532,805 $828,569 $1,964,315 $4,189,702 $7,514,286 $1,743,420
Studio 1 Bedroom 2 Bedroom 3 Bedroom 4+ Bedroom ALL
2015 $535,000 $875,000 $1,850,000 $3,350,000 $7,420,000 $1,700,000
2014 $535,000 $800,000 $1,750,000 $3,250,000 $8,247,825 $1,475,000
2013 $555,000 $770,000 $1,567,500 $3,287,500 $7,275,000 $1,375,000
2012 $450,000 $690,000 $1,450,000 $3,034,385 $4,887,600 $1,199,850
2011 $410,000 $690,000 $1,540,000 $3,125,000 $4,887,600 $1,250,000
2010 $410,000 $645,000 $1,382,500 $2,667,815 $6,300,000 $1,250,000
2009 $465,000 $699,000 $1,440,000 $2,825,000 $5,875,000 $1,300,000
2008 $525,000 $748,413 $1,875,000 $4,300,000$11,500,000 $1,275,000
2007 $490,000 $759,000 $1,670,000 $4,950,000 $5,000,000 $1,105,000
2006 $485,000 $725,000 $1,750,000 $3,950,000 $5,600,000 $1,200,000
Studio 1 Bedroom 2 Bedroom 3 Bedroom 4+ Bedroom ALL
2015 $1,040 $1,260 $1,812 $1,968 $2,635 $1,991
2014 $1,118 $1,284 $1,558 $1,886 $2,710 $1,608
2013 $965 $1,198 $1,294 $1,845 $2,270 $1,448
2012 $988 $1,034 $1,344 $1,647 $1,965 $1,315
2011 $901 $1,063 $1,254 $1,627 $1,771 $1,259
2010 $836 $937 $1,217 $1,393 $2,001 $1,206
2009 $985 $971 $1,263 $1,506 $1,922 $1,272
2008 $1,073 $1,137 $1,503 $1,922 $2,600 $1,413
2007 $1,017 $1,099 $1,375 $2,088 $1,775 $1,287
2006 $1,056 $1,069 $1,290 $1,628 $1,990 $1,236
Studio 1 Bedroom 2 Bedroom 3 Bedroom 4+ Bedroom ALL
2015 21 186 191 89 69 556
2014 60 194 214 113 65 646
2013 51 200 164 106 70 591
2012 60 158 161 100 40 519
2011 56 187 263 96 44 646
2010 44 205 266 169 46 730
2009 59 182 210 136 64 651
2008 66 195 248 50 24 583
2007 100 252 406 41 12 811
2006 59 235 355 52 14 715
Average Sales Price
Median Sales Price
Average Price Per Square Foot
Number of Sales
$0
$400
$800
$1,200
$1,600
$2,000
20152014201320122011201020092008200720060
200
400
600
800
1,000
Price/sq. ft Number of salesMatrix Current Year % Chg Prior Year % Chg Prior Decade
Average Sales Price $3,006,912 15.2% $2,611,128 72.5% $1,743,420
Average Price Per Sq. Ft $1,991 23.8% $1,608 61.1% $1,236
Median Sales Price $1,700,000 15.3% $1,475,000 41.7% $1,200,000
Number of Sales 556 -13.9% 646 -22.2% 715

20
EAST SIDEMANHATTAN DECADE
2006-2015
Visit our website to browse listings and learn more about market trends
FIFTH AVENUE/PARK AVENUE CORRIDOR CO-OPS
Average Price Per Square Foot / Number of Sales
BoundaryNorth: East 96th StreetSouth: East 59th StreetEast: Park AvenueWest: Fifth Avenue
Studio 1 Bedroom 2 Bedroom 3 Bedroom 4+ Bedroom ALL
2015 $396,605 $1,147,591 $2,509,513 $5,252,797$10,425,545 $3,932,480
2014 $556,657$1,081,779 $2,482,724 $5,179,345$11,926,992 $4,410,049
2013 $508,571 $801,322 $2,327,101 $4,049,598 $7,936,762 $3,099,304
2012 $785,791 $874,486 $2,122,656 $4,330,445 $12,027,262 $3,632,787
2011 $329,033 $777,429 $2,160,589 $3,802,541$10,338,949 $3,243,164
2010 $447,500 $782,523 $1,909,611 $3,696,654 $7,988,932 $2,953,936
2009 $357,586 $860,108 $2,023,784 $3,461,631 $8,560,494 $3,267,069
2008 $604,471$1,155,500 $2,580,083 $5,453,432 $14,936,217 $4,774,821
2007 $425,837 $712,240 $2,175,448 $4,468,596 $10,292,414 $3,499,225
2006 $519,857 $785,291 $1,914,951 $3,749,891 $8,567,472 $2,722,758
Studio 1 Bedroom 2 Bedroom 3 Bedroom 4+ Bedroom ALL
2015 $415,000 $849,500 $2,243,750 $4,500,000 $7,775,000 $2,580,000
2014 $528,500 $855,000 $2,126,000 $4,700,000 $10,000,000 $2,675,000
2013 $450,000 $725,000 $1,795,000 $3,450,000 $6,600,000 $2,039,666
2012 $495,000 $775,000 $1,761,572 $3,410,000 $7,200,000 $1,985,000
2011 $335,000 $739,000 $1,900,000 $3,625,000 $8,000,000 $2,140,000
2010 $415,000 $710,000 $1,578,287 $3,175,000 $7,000,000 $1,950,000
2009 $300,000 $775,000 $1,650,000 $2,950,000 $7,495,000 $2,200,000
2008 $500,000 $800,000 $2,300,000 $4,500,000 $12,000,000 $2,690,000
2007 $400,000 $675,000 $1,795,000 $4,075,000 $7,500,000 $2,150,000
2006 $525,000 $750,000 $1,660,000 $3,400,000 $6,000,000 $1,770,000
Studio 1 Bedroom 2 Bedroom 3 Bedroom 4+ Bedroom ALL
2015 $64 $1,257 $1,564 $2,173 $3,018 $1,850
2014 $1,142 $1,182 $1,677 $2,108 $3,288 $1,952
2013 $895 $964 $1,509 $1,744 $2,213 $1,529
2012 $1,393 $1,036 $1,400 $1,806 $2,960 $1,622
2011 $673 $962 $1,376 $1,630 $2,575 $1,492
2010 $1,073 $942 $1,312 $1,560 $2,081 $1,412
2009 $821 $992 $1,308 $1,484 $2,295 $1,450
2008 $1,194 $1,386 $1,640 $2,068 $3,254 $1,914
2007 $925 $950 $1,484 $1,740 $2,781 $1,615
2006 $936 $920 $1,283 $1,509 $2,302 $1,366
Studio 1 Bedroom 2 Bedroom 3 Bedroom 4+ Bedroom ALL
2015 16 88 132 115 52 403
2014 7 68 164 105 65 409
2013 21 83 176 121 55 456
2012 11 78 154 85 50 378
2011 12 45 157 70 39 323
2010 6 61 147 107 44 365
2009 7 40 69 61 36 213
2008 17 41 110 50 42 260
2007 19 60 177 68 58 382
2006 7 45 163 46 32 293
Average Sales Price
Median Sales Price
Average Price Per Square Foot
Number of Sales
$0
$500
$1,000
$1,500
$2,000
$2,500
20152014201320122011201020092008200720060
100
200
300
400
500
Price/sq. ft Number of salesMatrix Current Year % Chg Prior Year % Chg Prior Decade
Average Sales Price $3,932,480 -10.8% $4,410,049 44.4% $2,722,758
Average Price Per Sq. Ft $1,850 -5.2% $1,952 35.4% $1,366
Median Sales Price $2,580,000 -3.6% $2,675,000 45.8% $1,770,000
Number of Sales 403 -1.5% 409 37.5% 293

21
EAST SIDEMANHATTAN DECADE
2006-2015
Visit our website to browse listings and learn more about market trends
YORKVILLE CO-OPS
Average Price Per Square Foot / Number of Sales
BoundaryNorth: East 96th StreetSouth: East 86th StreetEast: York AvenueWest: Lexington Avenue
Studio 1 Bedroom 2 Bedroom 3 Bedroom 4+ Bedroom ALL
2015 $371,674 $553,473 $1,268,438 $2,147,923 $3,821,667 $910,808
2014 $335,825 $532,980 $1,094,914 $1,950,533 $2,644,167 $764,835
2013 $318,483 $475,210 $913,268 $1,725,533 $3,249,450 $749,718
2012 $328,089 $460,186 $946,905 $1,322,578 $3,456,900 $731,122
2011 $353,933 $491,224 $925,431 $1,574,867 $3,221,780 $745,161
2010 $287,314 $511,864 $838,802 $2,020,786 $647,274
2009 $317,916 $526,186 $821,935 $1,645,833 $614,854
2008 $395,037 $623,008 $1,052,005 $629,521
2007 $353,773 $535,774 $1,005,057 $2,353,000 $654,362
2006 $296,231 $462,091 $1,021,400 $3,400,000 $613,769
Studio 1 Bedroom 2 Bedroom 3 Bedroom 4+ Bedroom ALL
2015 $365,000 $540,000 $1,275,000 $2,050,000 $3,625,000 $629,000
2014 $320,000 $475,000 $990,000 $1,900,000 $2,162,500 $539,000
2013 $300,000 $449,000 $853,000 $1,746,448 $3,650,000 $549,000
2012 $300,000 $432,500 $850,000 $1,175,000 $3,465,720 $530,000
2011 $375,000 $430,000 $875,000 $1,375,000 $3,175,000 $550,000
2010 $270,000 $450,000 $818,000 $1,900,000 $505,000
2009 $325,000 $510,000 $785,000 $1,585,000 $519,000
2008 $418,000 $599,000 $921,516 $590,000
2007 $340,000 $485,000 $945,000 $2,375,000 $495,000
2006 $275,000 $455,000 $875,000 $340,000 $470,000
Studio 1 Bedroom 2 Bedroom 3 Bedroom 4+ Bedroom ALL
2015 $788 $797 $1,071 $1,177 $1,289 $992
2014 $714 $769 $983 $1,123 $1,095 $843
2013 $728 $705 $839 $1,017 $1,181 $784
2012 $680 $618 $801 $883 $1,210 $722
2011 $739 $698 $822 $960 $1,136 $777
2010 $654 $707 $776 $1,065 $737
2009 $660 $755 $783 $925 $744
2008 $892 $873 $943 $892
2007 $773 $837 $917 $950 $843
2006 $649 $716 $840 $1,063 $741
Studio 1 Bedroom 2 Bedroom 3 Bedroom 4+ Bedroom ALL
2015 23 49 35 7 3 117
2014 24 121 56 12 3 216
2013 36 109 84 12 8 249
2012 28 78 63 18 3 190
2011 39 55 52 9 5 160
2010 21 76 43 7 147
2009 32 35 31 6 104
2008 38 59 22 119
2007 59 102 56 6 223
2006 26 58 35 1 120
Average Sales Price
Median Sales Price
Average Price Per Square Foot
Number of Sales
$0
$300
$600
$900
$1,200
$1,500
20152014201320122011201020092008200720060
60
120
180
240
300
Price/sq. ft Number of salesMatrix Current Year % Chg Prior Year % Chg Prior Decade
Average Sales Price $910,808 19.1% $764,835 48.4% $613,769
Average Price Per Sq. Ft $992 17.7% $843 33.9% $741
Median Sales Price $629,000 16.7% $539,000 33.8% $470,000
Number of Sales 117 -45.8% 216 -2.5% 120

22
EAST SIDEMANHATTAN DECADE
2006-2015
Visit our website to browse listings and learn more about market trends
YORKVILLE CONDOS
Average Price Per Square Foot / Number of Sales
BoundaryNorth: East 96th StreetSouth: East 86th StreetEast: York AvenueWest: Lexington Avenue
Studio 1 Bedroom 2 Bedroom 3 Bedroom 4+ Bedroom ALL
2015 $480,417 $868,253 $1,680,254 $3,096,857 $1,298,679
2014 $516,583 $731,800 $1,381,826 $2,148,057 $2,874,750 $1,161,936
2013 $404,900 $717,670 $1,262,059 $2,055,392 $4,230,000 $1,244,548
2012 $434,183 $699,128 $1,032,446 $1,829,750 $2,705,000 $1,007,376
2011 $425,353 $583,239 $1,109,136 $2,039,385 $2,657,500 $955,323
2010 $423,033 $652,576 $1,101,068 $1,715,800 $3,880,000 $996,975
2009 $403,000 $645,953 $1,135,517 $2,066,071 $2,493,000 $1,071,242
2008 $492,067 $702,518 $1,567,830 $1,322,500 $994,184
2007 $461,670 $772,968 $1,278,144 $3,690,000 $3,250,000 $1,048,809
2006 $449,700 $712,953 $1,286,705 $2,070,100 $995,973
Studio 1 Bedroom 2 Bedroom 3 Bedroom 4+ Bedroom ALL
2015 $535,000 $852,500 $1,675,129 $2,800,000 $1,004,283
2014 $510,000 $738,000 $1,200,000 $2,117,750 $2,300,000 $928,000
2013 $440,000 $675,000 $1,175,000 $1,925,000 $4,000,000 $931,250
2012 $425,000 $630,000 $999,000 $1,637,500 $2,705,000 $826,250
2011 $400,000 $590,000 $1,100,000 $1,750,000 $2,657,500 $670,000
2010 $430,000 $617,000 $1,018,250 $1,575,000 $3,450,000 $735,000
2009 $400,000 $607,500 $980,000 $1,725,000 $2,575,000 $855,000
2008 $496,860 $657,000 $1,327,000 $1,322,500 $750,000
2007 $479,000 $650,000 $1,150,000 $3,690,000 $3,250,000 $844,000
2006 $465,000 $695,000 $1,160,000 $2,090,000 $883,000
Studio 1 Bedroom 2 Bedroom 3 Bedroom 4+ Bedroom ALL
2015 $1,014 $1,166 $1,421 $1,642 $1,350
2014 $1,013 $955 $1,160 $1,262 $1,310 $1,083
2013 $863 $914 $949 $1,221 $1,551 $1,000
2012 $838 $891 $906 $1,122 $1,404 $941
2011 $854 $793 $894 $1,187 $1,036 $888
2010 $873 $844 $915 $968 $1,280 $897
2009 $827 $848 $931 $1,150 $1,012 $924
2008 $1,042 $966 $1,183 $527 $1,045
2007 $918 $1,027 $1,025 $1,292 $1,016 $1,014
2006 $866 $932 $988 $1,029 $954
Studio 1 Bedroom 2 Bedroom 3 Bedroom 4+ Bedroom ALL
2015 6 40 25 7 78
2014 18 43 43 14 4 122
2013 5 47 29 13 6 100
2012 12 39 28 18 2 99
2011 17 41 44 13 2 117
2010 12 59 47 15 4 137
2009 14 32 30 14 5 95
2008 15 61 43 2 121
2007 23 53 90 2 1 169
2006 15 53 65 4 137
Average Sales Price
Median Sales Price
Average Price Per Square Foot
Number of Sales
$0
$400
$800
$1,200
$1,600
$2,000
20152014201320122011201020092008200720060
80
160
240
320
400
Price/sq. ft Number of salesMatrix Current Year % Chg Prior Year % Chg Prior Decade
Average Sales Price $1,298,679 11.8% $1,161,936 30.4% $995,973
Average Price Per Sq. Ft $1,350 24.7% $1,083 41.5% $954
Median Sales Price $1,004,283 8.2% $928,000 13.7% $883,000
Number of Sales 78 -36.1% 122 -43.1% 137

23
EAST SIDEMANHATTAN DECADE
2006-2015
Visit our website to browse listings and learn more about market trends
EAST END AVENUE CO-OPS
Average Price Per Square Foot / Number of Sales
BoundaryNorth: East 90th StreetSouth: East 79th StreetEast: East End Avenue (includes Gracie Square and Gracie Terrace)West: East End Avenue
Studio1 Bedroom 2 Bedroom 3 Bedroom4+ Bedroom ALL
2015 $317,500 $874,400 $1,511,923 $2,433,056 $4,427,750 $1,672,109
2014 $394,286 $603,577 $1,139,700 $2,042,500 $4,384,967 $1,393,718
2013 $568,737 $1,126,026 $1,723,738 $2,092,000 $1,106,871
2012 $238,850 $555,500 $1,009,136 $1,827,500 $2,149,250 $879,794
2011 $307,500 $502,222 $1,230,756 $2,036,700 $2,908,667 $1,392,397
2010 $530,000 $506,200 $1,230,233 $2,450,667 $2,950,000 $1,298,393
2009 $175,000 $559,643 $1,293,750 $1,842,500 $2,628,000 $1,282,346
2008 $437,667 $674,864 $1,763,625 $2,638,333 $9,300,000 $1,540,789
2007 $443,333 $627,179 $1,767,375 $2,634,357 $3,833,333 $1,604,223
2006 $414,700 $561,571 $1,297,393 $3,230,444 $3,537,500 $1,816,268
Studio1 Bedroom 2 Bedroom 3 Bedroom4+ Bedroom ALL
2015 $317,000 $720,000 $1,400,000 $2,425,000 $3,512,500 $1,390,000
2014 $312,500 $585,000 $1,050,000 $2,050,000 $3,700,000 $960,375
2013 $575,000 $1,090,000 $1,649,000 $1,885,000 $900,000
2012 $255,000 $540,000 $985,000 $2,000,000 $2,149,250 $650,000
2011 $307,500 $545,000 $950,000 $1,900,000 $2,265,000 $1,250,000
2010 $530,000 $525,000 $1,100,000 $2,220,000 $2,950,000 $1,050,000
2009 $175,000 $525,000 $1,250,000 $1,995,000 $2,628,000 $1,250,000
2008 $388,000 $640,000 $1,595,000 $2,715,000 $9,300,000 $860,000
2007 $440,000 $675,000 $2,000,000 $2,500,000 $4,300,000 $1,225,000
2006 $368,500 $544,000 $1,300,000 $2,700,000 $3,300,000 $1,300,000
Studio 1 Bedroom 2 Bedroom 3 Bedroom 4+ Bedroom ALL
2015 $684 $850 $1,163 $1,274 $1,337 $1,156
2014 $837 $768 $991 $1,106 $1,498 $986
2013 $704 $846 $1,029 $959 $833
2012 $607 $685 $766 $971 $896 $743
2011 $631 $648 $1,001 $1,040 $1,091 $906
2010 $964 $713 $953 $1,089 $951 $897
2009 $583 $808 $975 $927 $821 $892
2008 $921 $934 $1,181 $1,199 $1,632 $1,066
2007 $939 $810 $1,114 $1,066 $1,045 $1,000
2006 $801 $773 $970 $1,217 $998 $974
Studio 1 Bedroom 2 Bedroom 3 Bedroom 4+ Bedroom ALL
2015 4 13 13 9 4 43
2014 7 13 18 6 6 50
2013 19 19 8 5 51
2012 4 16 11 4 2 37
2011 2 9 9 11 3 34
2010 1 15 15 9 2 42
2009 1 7 10 6 2 26
2008 3 11 8 3 1 26
2007 3 14 20 7 3 47
2006 5 7 14 9 6 41
Average Sales Price
Median Sales Price
Average Price Per Square Foot
Number of Sales
$0
$300
$600
$900
$1,200
$1,500
20152014201320122011201020092008200720060
15
30
45
60
75
Price/sq. ft Number of salesMatrix Current Year % Chg Prior Year % Chg Prior Decade
Average Sales Price $1,672,109 20.0% $1,393,718 -7.9% $1,816,268
Average Price Per Sq. Ft $1,156 17.2% $986 18.7% $974
Median Sales Price $1,390,000 44.7% $960,375 6.9% $1,300,000
Number of Sales 43 -14.0% 50 4.9% 41

24
EAST SIDEMANHATTAN DECADE
2006-2015
Visit our website to browse listings and learn more about market trends
CARNEGIE HILL CO-OPS
Average Price Per Square Foot / Number of Sales
BoundaryNorth: East 96th Street (includes corridor between Fifth and Madison Avenues and East 110th Street)South: East 86th StreetEast: Lexington AvenueWest: Fifth Avenue
Studio 1 Bedroom 2 Bedroom 3 Bedroom 4+ Bedroom ALL
2015 $402,222 $692,241 $1,886,915 $3,191,827 $5,956,250 $1,864,070
2014 $405,000 $957,186 $1,729,228 $4,256,820 $7,342,595 $2,657,379
2013 $400,833 $601,422 $1,571,103 $3,255,752 $5,874,421 $2,258,916
2012 $976,200 $776,384$1,506,334 $3,069,974 $5,418,823 $2,180,438
2011 $396,117 $599,087 $1,740,433 $3,250,540 $5,954,231 $2,274,745
2010 $646,333 $634,638 $1,442,900 $3,482,961 $6,718,182 $2,171,782
2009 $475,000 $632,568 $1,451,147 $3,032,533 $6,279,000 $2,308,335
2008 $480,750 $684,375 $1,917,372 $4,118,864$11,361,364 $2,651,809
2007 $402,233 $595,666 $1,872,388 $4,073,869 $7,714,190 $2,534,127
2006 $487,500 $685,400 $1,681,954 $3,096,207 $8,322,594 $2,672,610
Studio 1 Bedroom 2 Bedroom 3 Bedroom 4+ Bedroom ALL
2015 $325,000 $580,000 $1,825,000 $2,725,000 $6,112,500 $1,425,000
2014 $405,000 $626,268 $1,662,500 $3,800,000 $4,950,000 $1,795,000
2013 $350,000 $535,000 $1,460,000 $3,375,000 $5,532,888 $1,585,000
2012 $444,000 $670,000 $1,450,000 $2,850,000 $4,743,122 $1,650,000
2011 $370,000 $550,000 $1,625,000 $3,320,000 $5,900,000 $1,900,000
2010 $549,000 $625,000 $1,345,000 $3,295,000 $6,050,000 $1,578,287
2009 $675,000 $550,000 $1,275,000 $2,800,000 $4,750,000 $1,500,000
2008 $507,500 $661,500 $1,850,000 $4,200,000 $8,950,000 $1,650,000
2007 $400,000 $610,000 $1,687,500 $3,700,000 $5,600,000 $1,600,000
2006 $487,500 $665,000 $1,395,000 $3,000,000 $6,000,000 $1,895,000
Studio 1 Bedroom 2 Bedroom 3 Bedroom 4+ Bedroom ALL
2015 $825 $920 $1,350 $1,605 $2,071 $1,396
2014 $900 $1,082 $1,315 $1,893 $2,579 $1,510
2013 $786 $815 $1,165 $1,485 $1,808 $1,231
2012 $1,838 $971 $1,099 $1,444 $1,818 $1,257
2011 $709 $796 $1,148 $1,445 $1,852 $1,217
2010 $1,182 $847 $1,079 $1,456 $1,804 $1,185
2009 $950 $812 $1,047 $1,316 $1,881 $1,177
2008 $957 $954 $1,399 $1,677 $2,674 $1,410
2007 $908 $859 $1,328 $1,650 $2,344 $1,367
2006 $848 $895 $1,181 $1,323 $2,378 $1,323
Studio 1 Bedroom 2 Bedroom 3 Bedroom 4+ Bedroom ALL
2015 9 33 41 26 4 113
2014 2 51 87 46 21 207
2013 12 49 86 58 29 234
2012 4 43 71 47 22 187
2011 6 23 73 42 13 157
2010 3 32 74 44 11 164
2009 4 22 34 30 13 103
2008 14 28 58 22 11 133
2007 18 38 78 39 20 193
2006 2 15 74 27 17 135
Average Sales Price
Median Sales Price
Average Price Per Square Foot
Number of Sales
$0
$400
$800
$1,200
$1,600
$2,000
20152014201320122011201020092008200720060
60
120
180
240
300
Price/sq. ft Number of salesMatrix Current Year % Chg Prior Year % Chg Prior Decade
Average Sales Price $1,864,070 -29.9% $2,657,379 -30.3% $2,672,610
Average Price Per Sq. Ft $1,396 -7.5% $1,510 5.5% $1,323
Median Sales Price $1,425,000 -20.6% $1,795,000 -24.8% $1,895,000
Number of Sales 113 -45.4% 207 -16.3% 135

25
EAST SIDEMANHATTAN DECADE
2006-2015
Visit our website to browse listings and learn more about market trends
CARNEGIE HILL CONDOS
Average Price Per Square Foot / Number of Sales
BoundaryNorth: East 96th Street (includes corridor between Fifth and Madison Avenues and East 110th Street)South: East 86th StreetEast: Lexington AvenueWest: Fifth Avenue
Studio 1 Bedroom 2 Bedroom 3 Bedroom 4+ Bedroom ALL
2015 $600,000 $968,524 $2,023,166 $4,471,727 $8,259,451 $3,410,915
2014 $713,720 $1,117,080 $1,788,410 $3,207,148 $5,080,714 $2,459,031
2013 $816,482 $1,220,933 $1,672,881 $2,330,100 $5,953,925 $1,885,314
2012 $533,563 $794,009 $1,946,471 $2,339,893 $4,550,000 $1,856,089
2011 $507,500 $700,714 $1,874,658 $3,820,700 $4,017,550 $2,032,097
2010 $455,000 $708,756 $1,644,688 $2,768,133 $1,269,813
2009 $754,375 $1,293,700 $3,516,250$11,000,000 $3,036,733
2008 $635,533 $806,500 $1,816,538 $4,119,600 $4,517,333 $2,012,642
2007 $547,333 $874,077 $2,482,747 $7,546,967 $6,450,000 $2,568,739
2006 $550,400 $754,214 $1,901,339 $2,653,750 $5,150,000 $1,678,519
Studio 1 Bedroom 2 Bedroom 3 Bedroom 4+ Bedroom ALL
2015 $600,000 $850,000 $1,725,000 $3,735,000 $7,316,156 $2,415,000
2014 $685,000 $1,080,000 $1,795,000 $2,986,970 $4,395,000 $1,895,000
2013 $699,000 $926,607 $1,695,000 $2,475,000 $6,372,199 $1,720,000
2012 $562,500 $785,000 $1,575,000 $2,475,000 $4,500,000 $1,400,000
2011 $510,000 $725,000 $1,555,000 $2,550,000 $4,350,000 $1,555,000
2010 $460,000 $675,000 $1,750,000 $3,254,428 $965,000
2009 $650,000 $1,250,000 $4,375,000$11,000,000 $1,370,000
2008 $525,000 $890,000 $1,550,000 $4,130,531 $4,500,000 $1,495,000
2007 $599,000 $825,000 $2,100,000 $4,900,000 $5,250,000 $1,543,361
2006 $557,500 $785,000 $1,800,000 $2,610,000 $5,150,000 $1,700,000
Studio 1 Bedroom 2 Bedroom 3 Bedroom 4+ Bedroom ALL
2015 $1,496 $1,315 $1,533 $2,074 $2,599 $2,015
2014 $1,240 $1,251 $1,389 $1,555 $1,769 $1,456
2013 $1,114 $1,339 $1,219 $1,394 $1,663 $1,276
2012 $1,016 $1,041 $1,446 $1,233 $1,753 $1,275
2011 $978 $987 $1,336 $1,912 $1,446 $1,331
2010 $931 $1,000 $1,350 $1,449 $1,171
2009 $1,007 $922 $1,496 $2,027 $1,245
2008 $1,170 $1,119 $1,464 $1,736 $1,355 $1,379
2007 $1,114 $1,005 $1,564 $2,742 $1,926 $1,495
2006 $1,129 $984 $1,284 $1,265 $1,550 $1,225
Studio 1 Bedroom 2 Bedroom 3 Bedroom 4+ Bedroom ALL
2015 1 9 15 11 7 43
2014 5 10 20 23 7 65
2013 11 6 36 16 4 73
2012 8 11 17 15 5 56
2011 3 7 19 5 4 38
2010 3 9 8 3 23
2009 4 5 4 2 15
2008 6 6 13 5 3 33
2007 9 13 15 6 3 46
2006 10 7 31 4 2 54
Average Sales Price
Median Sales Price
Average Price Per Square Foot
Number of Sales
$0
$400
$800
$1,200
$1,600
$2,000
20152014201320122011201020092008200720060
20
40
60
80
100
Price/sq. ft Number of salesMatrix Current Year % Chg Prior Year % Chg Prior Decade
Average Sales Price $3,410,915 38.7% $2,459,031 103.2% $1,678,519
Average Price Per Sq. Ft $2,015 38.4% $1,456 64.5% $1,225
Median Sales Price $2,415,000 27.4% $1,895,000 42.1% $1,700,000
Number of Sales 43 -33.8% 65 -20.4% 54
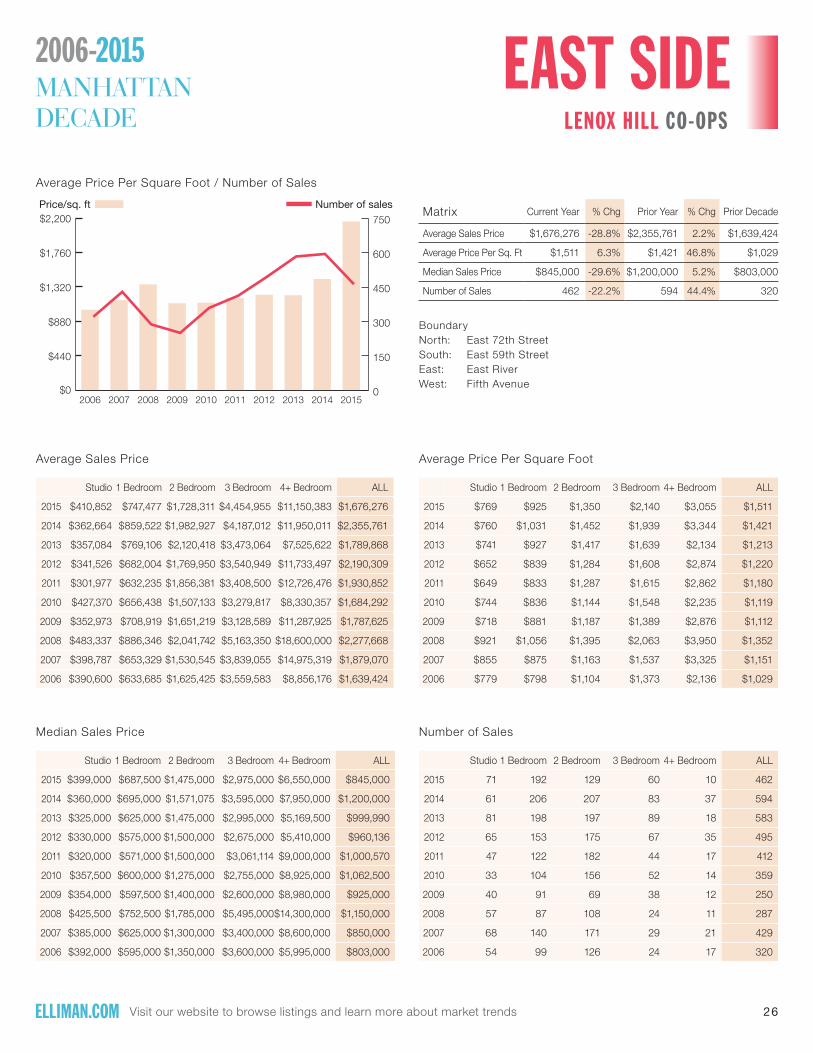
26
EAST SIDEMANHATTAN DECADE
2006-2015
Visit our website to browse listings and learn more about market trends
LENOX HILL CO-OPS
Average Price Per Square Foot / Number of Sales
BoundaryNorth: East 72th StreetSouth: East 59th StreetEast: East RiverWest: Fifth Avenue
Studio 1 Bedroom 2 Bedroom 3 Bedroom 4+ Bedroom ALL
2015 $410,852 $747,477 $1,728,311 $4,454,955 $11,150,383 $1,676,276
2014 $362,664 $859,522 $1,982,927 $4,187,012 $11,950,011 $2,355,761
2013 $357,084 $769,106 $2,120,418 $3,473,064 $7,525,622 $1,789,868
2012 $341,526 $682,004 $1,769,950 $3,540,949 $11,733,497 $2,190,309
2011 $301,977 $632,235 $1,856,381 $3,408,500 $12,726,476 $1,930,852
2010 $427,370 $656,438 $1,507,133 $3,279,817 $8,330,357 $1,684,292
2009 $352,973 $708,919 $1,651,219 $3,128,589 $11,287,925 $1,787,625
2008 $483,337 $886,346 $2,041,742 $5,163,350 $18,600,000 $2,277,668
2007 $398,787 $653,329 $1,530,545 $3,839,055 $14,975,319 $1,879,070
2006 $390,600 $633,685 $1,625,425 $3,559,583 $8,856,176 $1,639,424
Studio 1 Bedroom 2 Bedroom 3 Bedroom 4+ Bedroom ALL
2015 $399,000 $687,500 $1,475,000 $2,975,000 $6,550,000 $845,000
2014 $360,000 $695,000 $1,571,075 $3,595,000 $7,950,000 $1,200,000
2013 $325,000 $625,000 $1,475,000 $2,995,000 $5,169,500 $999,990
2012 $330,000 $575,000 $1,500,000 $2,675,000 $5,410,000 $960,136
2011 $320,000 $571,000 $1,500,000 $3,061,114 $9,000,000 $1,000,570
2010 $357,500 $600,000 $1,275,000 $2,755,000 $8,925,000 $1,062,500
2009 $354,000 $597,500 $1,400,000 $2,600,000 $8,980,000 $925,000
2008 $425,500 $752,500 $1,785,000 $5,495,000$14,300,000 $1,150,000
2007 $385,000 $625,000 $1,300,000 $3,400,000 $8,600,000 $850,000
2006 $392,000 $595,000 $1,350,000 $3,600,000 $5,995,000 $803,000
Studio 1 Bedroom 2 Bedroom 3 Bedroom 4+ Bedroom ALL
2015 $769 $925 $1,350 $2,140 $3,055 $1,511
2014 $760 $1,031 $1,452 $1,939 $3,344 $1,421
2013 $741 $927 $1,417 $1,639 $2,134 $1,213
2012 $652 $839 $1,284 $1,608 $2,874 $1,220
2011 $649 $833 $1,287 $1,615 $2,862 $1,180
2010 $744 $836 $1,144 $1,548 $2,235 $1,119
2009 $718 $881 $1,187 $1,389 $2,876 $1,112
2008 $921 $1,056 $1,395 $2,063 $3,950 $1,352
2007 $855 $875 $1,163 $1,537 $3,325 $1,151
2006 $779 $798 $1,104 $1,373 $2,136 $1,029
Studio 1 Bedroom 2 Bedroom 3 Bedroom 4+ Bedroom ALL
2015 71 192 129 60 10 462
2014 61 206 207 83 37 594
2013 81 198 197 89 18 583
2012 65 153 175 67 35 495
2011 47 122 182 44 17 412
2010 33 104 156 52 14 359
2009 40 91 69 38 12 250
2008 57 87 108 24 11 287
2007 68 140 171 29 21 429
2006 54 99 126 24 17 320
Average Sales Price
Median Sales Price
Average Price Per Square Foot
Number of Sales
$0
$440
$880
$1,320
$1,760
$2,200
20152014201320122011201020092008200720060
150
300
450
600
750
Price/sq. ft Number of salesMatrix Current Year % Chg Prior Year % Chg Prior Decade
Average Sales Price $1,676,276 -28.8% $2,355,761 2.2% $1,639,424
Average Price Per Sq. Ft $1,511 6.3% $1,421 46.8% $1,029
Median Sales Price $845,000 -29.6% $1,200,000 5.2% $803,000
Number of Sales 462 -22.2% 594 44.4% 320

27
EAST SIDEMANHATTAN DECADE
2006-2015
Visit our website to browse listings and learn more about market trends
LENOX HILL CONDOS
Average Price Per Square Foot / Number of Sales
BoundaryNorth: East 72th StreetSouth: East 59th StreetEast: East RiverWest: Fifth Avenue
Studio 1 Bedroom 2 Bedroom 3 Bedroom 4+ Bedroom ALL
2015 $540,830 $1,032,622 $2,511,555 $3,912,061 $11,276,979 $2,594,919
2014 $565,578 $1,030,653 $2,230,492 $3,653,362 $13,351,509 $2,505,681
2013 $733,938 $1,031,989 $2,050,414 $4,390,480 $7,755,067 $2,263,291
2012 $501,907 $934,031 $1,792,840 $3,453,173 $8,467,260 $2,191,195
2011 $456,158 $879,169 $1,722,855 $3,322,607 $8,108,571 $1,795,353
2010 $432,350 $768,227 $1,723,265 $3,328,737 $10,031,263 $2,081,113
2009 $485,400 $803,842 $1,807,234 $3,723,094 $12,000,000 $1,887,348
2008 $546,557 $959,670 $2,273,115 $6,575,714 $12,161,000 $2,041,060
2007 $532,500 $910,412 $2,106,167 $5,943,543 $12,800,000 $1,986,236
2006 $602,316 $893,140 $1,961,671 $4,815,167 $8,465,625 $1,999,228
Studio 1 Bedroom 2 Bedroom 3 Bedroom 4+ Bedroom ALL
2015 $530,000 $945,000 $1,974,000 $3,495,000 $9,500,000 $1,555,000
2014 $565,000 $895,000 $1,850,000 $3,200,000 $9,956,568 $1,600,000
2013 $675,000 $885,000 $1,630,000 $3,850,000 $4,350,000 $1,350,000
2012 $450,000 $825,000 $1,625,000 $3,050,000 $7,250,000 $1,450,000
2011 $425,000 $820,000 $1,600,000 $2,760,000 $6,100,000 $1,305,000
2010 $436,000 $725,000 $1,525,000 $3,200,000 $7,750,000 $1,400,000
2009 $499,999 $750,000 $1,550,000 $2,700,000$12,000,000 $1,250,000
2008 $529,000 $875,000 $1,875,000 $5,350,000 $12,219,000 $1,325,000
2007 $512,000 $850,000 $1,800,000 $5,075,000$12,800,000 $1,340,000
2006 $459,000 $799,000 $1,750,000 $4,895,000 $6,500,000 $1,400,000
Studio 1 Bedroom 2 Bedroom 3 Bedroom 4+ Bedroom ALL
2015 $1,059 $1,358 $1,892 $1,990 $3,038 $1,983
2014 $1,210 $1,297 $1,637 $1,931 $3,517 $1,635
2013 $1,003 $1,275 $1,477 $1,904 $2,455 $1,472
2012 $1,001 $1,155 $1,302 $1,773 $2,499 $1,406
2011 $948 $1,158 $1,269 $1,639 $2,260 $1,292
2010 $844 $1,016 $1,266 $1,523 $2,844 $1,294
2009 $986 $1,024 $1,314 $1,764 $2,406 $1,299
2008 $1,078 $1,260 $1,581 $2,296 $3,195 $1,478
2007 $1,056 $1,118 $1,476 $2,084 $2,558 $1,394
2006 $1,268 $1,143 $1,297 $1,885 $2,073 $1,326
Studio 1 Bedroom 2 Bedroom 3 Bedroom 4+ Bedroom ALL
2015 15 115 86 40 19 275
2014 18 73 78 39 11 219
2013 24 63 50 20 15 172
2012 15 48 47 33 10 153
2011 19 62 86 29 7 203
2010 10 62 82 51 8 213
2009 10 53 71 31 2 167
2008 21 53 71 7 4 156
2007 26 68 144 21 1 260
2006 19 65 106 18 8 216
Average Sales Price
Median Sales Price
Average Price Per Square Foot
Number of Sales
$0
$440
$880
$1,320
$1,760
$2,200
20152014201320122011201020092008200720060
100
200
300
400
500
Price/sq. ft Number of salesMatrix Current Year % Chg Prior Year % Chg Prior Decade
Average Sales Price $2,594,919 3.6% $2,505,681 29.8% $1,999,228
Average Price Per Sq. Ft $1,983 21.3% $1,635 49.5% $1,326
Median Sales Price $1,555,000 -2.8% $1,600,000 11.1% $1,400,000
Number of Sales 275 25.6% 219 27.3% 216

28
EAST SIDEMANHATTAN DECADE
2006-2015
Visit our website to browse listings and learn more about market trends
SUTTON/BEEKMAN CO-OPS
Average Price Per Square Foot / Number of Sales
BoundaryNorth: East 59th StreetSouth: East 48th StreetEast: East RiverWest: First Avenue
Studio 1 Bedroom 2 Bedroom 3 Bedroom 4+ Bedroom ALL
2015 $390,667 $725,142 $1,424,355 $2,532,415 $3,943,750 $1,194,569
2014 $383,550 $704,026 $1,544,567 $2,637,534 $10,308,333 $1,509,165
2013 $352,783 $672,693 $1,255,535 $2,241,325 $4,384,545 $1,265,281
2012 $398,875 $645,221 $1,142,689 $1,731,041 $2,257,500 $1,035,694
2011 $327,000 $589,864 $1,252,469 $2,700,385 $3,460,357 $1,189,927
2010 $328,700 $672,260 $1,238,262 $2,963,300 $5,120,333 $1,231,329
2009 $348,464 $696,193 $1,350,789 $2,070,500 $5,300,000 $1,224,060
2008 $463,709 $791,082 $1,507,842 $3,103,000 $7,320,000 $1,365,753
2007 $356,654 $680,866 $1,400,372 $2,623,940 $5,810,714 $1,334,870
2006 $466,750 $707,816 $1,459,541 $3,250,000 $3,239,167 $1,248,066
Studio 1 Bedroom 2 Bedroom 3 Bedroom 4+ Bedroom ALL
2015 $385,000 $674,000 $1,325,000 $2,272,500 $3,943,750 $869,298
2014 $399,000 $680,000 $1,305,000 $2,300,000 $5,275,000 $996,000
2013 $365,000 $650,000 $1,175,000 $1,970,000 $3,050,000 $995,000
2012 $343,000 $625,000 $1,090,000 $1,750,000 $2,400,000 $925,000
2011 $320,000 $575,139 $1,075,000 $2,275,000 $2,600,000 $934,915
2010 $332,000 $650,000 $1,125,000 $2,775,000 $4,550,000 $950,000
2009 $350,000 $650,000 $1,225,000 $1,666,146 $5,000,000 $930,000
2008 $475,000 $760,000 $1,350,000 $2,795,000 $9,450,000 $995,000
2007 $360,000 $660,000 $1,300,000 $2,500,000 $3,075,000 $995,000
2006 $395,000 $662,500 $1,300,000 $3,850,000 $2,900,000 $950,000
Studio 1 Bedroom 2 Bedroom 3 Bedroom 4+ Bedroom ALL
2015 $728 $820 $1,052 $1,300 $1,425 $1,037
2014 $716 $843 $1,197 $1,277 $2,890 $1,080
2013 $663 $809 $919 $1,141 $1,594 $923
2012 $701 $761 $877 $909 $927 $833
2011 $679 $734 $931 $1,148 $1,258 $880
2010 $637 $804 $915 $1,266 $1,052 $896
2009 $716 $830 $927 $1,171 $1,779 $927
2008 $932 $990 $1,150 $1,281 $1,812 $1,090
2007 $713 $851 $1,032 $1,025 $1,893 $977
2006 $771 $791 $962 $1,182 $883 $892
Studio 1 Bedroom 2 Bedroom 3 Bedroom 4+ Bedroom ALL
2015 12 64 44 18 2 140
2014 22 88 94 35 6 245
2013 18 81 115 32 11 257
2012 16 63 91 29 4 203
2011 8 55 70 13 7 153
2010 16 58 81 20 3 178
2009 14 43 47 15 4 123
2008 22 55 67 7 5 156
2007 13 79 111 20 7 230
2006 14 64 83 8 6 175
Average Sales Price
Median Sales Price
Average Price Per Square Foot
Number of Sales
Price/sq. ft Number of sales
$0
$250
$500
$750
$1,000
$1,250
$1,500
20152014201320122011201020092008200720060
50
100
150
200
250
300Matrix Current Year % Chg Prior Year % Chg Prior Decade
Average Sales Price $1,194,569 -20.8% $1,509,165 -4.3% $1,248,066
Average Price Per Sq. Ft $1,037 -4.0% $1,080 16.3% $892
Median Sales Price $869,298 -12.7% $996,000 -8.5% $950,000
Number of Sales 140 -42.9% 245 -20.0% 175

29
EAST SIDEMANHATTAN DECADE
2006-2015
Visit our website to browse listings and learn more about market trends
MIDTOWN EAST/TURTLE BAY CO-OPS
Average Price Per Square Foot / Number of Sales
BoundaryNorth: East 59th StreeetSouth: East 42nd StreetEast: East River (including corridor between CPS, W 57th Street and Eighth Avenue)West: Avenue of the Americas
Studio 1 Bedroom 2 Bedroom 3 Bedroom 4+ Bedroom ALL
2015 $389,585 $686,257 $1,503,847 $2,689,259 $9,090,000 $983,966
2014 $380,364 $697,364 $1,994,401 $6,602,843 $21,584,341 $2,062,577
2013 $369,495 $625,544 $1,248,031 $2,296,138 $3,954,167 $988,810
2012 $354,881 $610,866 $1,171,619 $2,059,656 $5,308,333 $946,019
2011 $343,235 $593,249 $1,226,616 $2,461,833 $3,344,583 $934,786
2010 $324,193 $614,727 $1,312,911 $3,026,419 $4,171,667 $1,056,807
2009 $352,785 $631,043 $1,269,242 $1,850,141 $5,296,429 $950,570
2008 $448,666 $719,797 $1,537,650 $3,303,833 $6,527,500 $1,072,016
2007 $360,739 $619,663 $1,404,747 $3,033,427 $6,192,255 $1,053,715
2006 $396,264 $630,942 $1,619,950 $4,923,094 $4,683,571 $1,191,422
Studio 1 Bedroom 2 Bedroom 3 Bedroom 4+ Bedroom ALL
2015 $369,000 $647,500 $1,250,000 $2,200,000 $8,400,000 $678,568
2014 $369,375 $640,000 $1,300,000 $2,325,000 $12,288,000 $745,000
2013 $345,000 $575,000 $1,100,000 $1,875,000 $3,050,000 $700,000
2012 $320,000 $549,000 $998,000 $1,750,000 $2,400,000 $650,000
2011 $320,000 $550,000 $992,500 $2,150,000 $2,600,000 $645,000
2010 $312,000 $575,000 $1,065,000 $2,550,000 $3,811,000 $715,253
2009 $340,000 $600,000 $1,150,000 $1,595,000 $4,400,000 $652,500
2008 $403,000 $672,140 $1,375,000 $3,475,000 $5,500,000 $728,080
2007 $355,000 $590,000 $1,235,000 $3,020,000 $4,850,000 $670,000
2006 $355,000 $590,100 $1,250,000 $3,850,000 $2,900,000 $749,000
Studio 1 Bedroom 2 Bedroom 3 Bedroom 4+ Bedroom ALL
2015 $784 $873 $1,154 $1,296 $2,527 $1,073
2014 $767 $877 $1,500 $2,803 $5,101 $1,321
2013 $752 $812 $945 $1,138 $1,417 $884
2012 $691 $763 $930 $1,056 $1,838 $847
2011 $713 $783 $929 $1,102 $1,206 $848
2010 $665 $796 $993 $1,303 $1,110 $889
2009 $683 $808 $926 $1,003 $1,563 $848
2008 $903 $971 $1,177 $1,269 $1,776 $1,040
2007 $757 $846 $1,072 $1,171 $1,936 $944
2006 $741 $766 $1,119 $1,786 $1,252 $943
Studio 1 Bedroom 2 Bedroom 3 Bedroom 4+ Bedroom ALL
2015 135 264 139 27 5 570
2014 143 302 220 74 17 756
2013 120 331 237 61 18 767
2012 95 252 179 43 12 581
2011 65 205 147 24 12 453
2010 71 211 181 36 9 508
2009 65 147 92 29 7 340
2008 112 204 153 12 8 489
2007 142 249 258 30 11 690
2006 78 183 179 17 7 464
Average Sales Price
Median Sales Price
Average Price Per Square Foot
Number of Sales
$0
$300
$600
$900
$1,200
$1,500
20152014201320122011201020092008200720060
300
600
900
1,200
1,500
Price/sq. ft Number of sales Matrix Current Year % Chg Prior Year % Chg Prior Decade
Average Sales Price $983,966 -52.3% $2,062,577 -17.4% $1,191,422
Average Price Per Sq. Ft $1,073 -18.8% $1,321 13.8% $943
Median Sales Price $678,568 -8.9% $745,000 -9.4% $749,000
Number of Sales 570 -24.6% 756 22.8% 464

30
EAST SIDEMANHATTAN DECADE
2006-2015
Visit our website to browse listings and learn more about market trends
MIDTOWN EAST/TURTLE BAY CONDOS
Average Price Per Square Foot / Number of Sales
BoundaryNorth: East 59th StreeetSouth: East 42nd StreetEast: East River (including corridor between CPS, W 57th Street and Eighth Avenue)West: Avenue of the Americas
Studio 1 Bedroom 2 Bedroom 3 Bedroom 4+ Bedroom ALL
2015 $640,749 $1,374,537 $2,525,361 $4,914,138$14,448,751 $2,669,496
2014 $598,541 $1,192,858 $2,309,116 $6,292,374 $4,839,629 $2,028,080
2013 $570,483 $1,133,410 $2,126,818 $3,952,003 $6,771,992 $1,909,124
2012 $480,358 $1,133,098 $2,273,822 $3,802,627 $8,495,614 $2,002,000
2011 $477,909 $864,202 $1,936,589 $3,832,292$13,783,800 $1,940,053
2010 $466,332 $813,756 $1,993,847 $4,084,776 $11,578,973 $2,152,095
2009 $573,143 $894,663 $1,567,344 $4,134,156 $6,957,467 $1,767,551
2008 $808,926 $1,202,173 $2,866,516 $6,498,463$16,922,831 $2,475,424
2007 $601,402 $1,032,111 $2,787,012 $7,856,279$13,988,850 $2,430,088
2006 $483,040 $827,078 $2,033,185 $3,842,900 $14,710,420 $1,765,612
Studio 1 Bedroom 2 Bedroom 3 Bedroom 4+ Bedroom ALL
2015 $565,000$1,150,000 $2,332,167 $3,972,500 $9,288,000 $1,680,112
2014 $600,000 $995,000 $1,920,000 $3,500,000 $4,995,000 $1,375,000
2013 $545,000 $920,000 $1,720,000 $3,100,000 $6,500,000 $1,250,000
2012 $480,000 $905,000 $1,600,000 $3,100,000 $5,250,000 $1,300,000
2011 $480,000 $770,000 $1,650,000 $2,900,000 $7,775,000 $1,100,000
2010 $460,000 $715,000 $1,400,000 $3,027,375 $11,250,000 $1,200,000
2009 $470,000 $692,410 $1,323,725 $2,775,000 $6,750,000 $1,040,000
2008 $580,000 $860,000 $2,221,450 $5,923,345$12,464,400 $1,495,000
2007 $492,500 $882,000 $2,150,000 $6,750,000$10,425,000 $1,491,736
2006 $455,000 $720,000 $1,850,000 $3,450,000$13,000,000 $1,395,000
Studio 1 Bedroom 2 Bedroom 3 Bedroom 4+ Bedroom ALL
2015 $1,311 $1,642 $1,831 $2,188 $4,231 $2,071
2014 $1,131 $1,420 $1,714 $2,769 $1,757 $1,611
2013 $1,065 $1,341 $1,541 $1,884 $2,055 $1,461
2012 $930 $1,339 $1,624 $1,737 $2,441 $1,470
2011 $989 $1,133 $1,472 $1,858 $3,692 $1,406
2010 $1,002 $1,070 $1,475 $1,853 $3,289 $1,428
2009 $1,138 $1,135 $1,181 $1,806 $2,052 $1,273
2008 $1,572 $1,526 $1,831 $2,285 $3,579 $1,745
2007 $1,189 $1,292 $1,779 $2,650 $2,900 $1,632
2006 $989 $1,079 $1,324 $1,538 $2,815 $1,245
Studio 1 Bedroom 2 Bedroom 3 Bedroom 4+ Bedroom ALL
2015 39 248 185 80 21 573
2014 51 143 144 31 7 376
2013 58 173 142 60 12 445
2012 38 127 107 52 7 331
2011 46 135 159 50 10 400
2010 38 133 170 66 15 422
2009 35 127 106 34 18 320
2008 73 226 258 30 13 600
2007 85 174 345 38 6 648
2006 48 115 213 23 5 404
Average Sales Price
Median Sales Price
Average Price Per Square Foot
Number of Sales
$0
$400
$800
$1,200
$1,600
$2,000
20152014201320122011201020092008200720060
200
400
600
800
1,000
Price/sq. ft Number of sales Matrix Current Year % Chg Prior Year % Chg Prior Decade
Average Sales Price $2,669,496 31.6% $2,028,080 51.2% $1,765,612
Average Price Per Sq. Ft $2,071 28.6% $1,611 66.3% $1,245
Median Sales Price $1,680,112 22.2% $1,375,000 20.4% $1,395,000
Number of Sales 573 52.4% 376 41.8% 404

31
WEST SIDEMANHATTAN DECADE
2006-2015
Visit our website to browse listings and learn more about market trends
WEST SIDE CO-OPS
Average Price Per Square Foot / Number of Sales
Matrix Current Year % Chg Prior Year % Chg Prior Decade
Average Sales Price $1,355,573 0.3% $1,351,894 13.0% $1,200,097
Average Price Per Sq. Ft $1,189 6.9% $1,112 25.8% $945
Median Sales Price $801,000 2.0% $785,000 10.5% $725,000
Number of Sales 1,551 -9.0% 1,704 58.3% 980
BoundaryNorth: West 116th StreetSouth: West 34th StreetEast: Avenue of the AmericasWest: Hudson River
Studio 1 Bedroom 2 Bedroom 3 Bedroom 4+ Bedroom ALL
2015 $388,404 $764,511 $1,534,287 $3,118,414 $6,361,848 $1,355,573
2014 $489,725 $672,845 $1,454,060 $3,103,934 $6,010,408 $1,351,894
2013 $383,104 $645,829 $1,288,948 $2,650,582 $3,931,062 $1,105,259
2012 $370,591 $598,140 $1,218,996 $2,236,094 $4,163,213 $1,071,773
2011 $345,103 $573,224 $1,330,536 $2,875,955 $5,774,321 $1,187,792
2010 $347,829 $623,614 $1,327,969 $2,412,999 $7,161,215 $1,255,596
2009 $366,338 $603,086 $1,107,358 $2,226,941 $4,209,179 $926,927
2008 $413,288 $673,511 $1,532,970 $3,586,575 $9,947,222 $1,067,323
2007 $377,357 $634,792 $1,365,634 $3,649,900 $7,199,375 $1,100,462
2006 $371,085 $598,215 $1,258,386 $3,001,870 $7,733,438 $1,200,097
Studio 1 Bedroom 2 Bedroom 3 Bedroom 4+ Bedroom ALL
2015 $382,000 $690,000 $1,388,885 $2,795,000 $4,900,000 $801,000
2014 $375,000 $630,000 $1,300,000 $2,580,000 $4,250,000 $785,000
2013 $360,000 $589,862 $1,165,000 $2,225,000 $3,200,000 $750,000
2012 $339,000 $569,000 $1,060,000 $1,955,000 $3,811,500 $699,000
2011 $350,000 $550,000 $1,135,000 $2,235,000 $5,100,000 $725,000
2010 $335,000 $595,000 $1,140,000 $2,100,000 $5,000,000 $800,000
2009 $368,000 $569,900 $999,000 $1,825,000 $3,400,000 $650,000
2008 $395,000 $649,000 $1,350,000 $3,150,000 $7,350,000 $715,000
2007 $375,000 $610,000 $1,200,000 $3,495,000 $6,280,000 $737,500
2006 $365,000 $570,000 $1,100,000 $2,710,000 $6,000,000 $725,000
Studio 1 Bedroom 2 Bedroom 3 Bedroom 4+ Bedroom ALL
2015 $760 $951 $1,197 $1,488 $1,445 $1,189
2014 $986 $890 $1,195 $1,553 $2,081 $1,112
2013 $811 $886 $1,049 $1,397 $1,461 $996
2012 $739 $803 $991 $1,189 $1,531 $922
2011 $732 $803 $1,045 $1,425 $1,862 $970
2010 $735 $836 $1,059 $1,253 $2,024 $990
2009 $749 $846 $921 $1,161 $1,403 $889
2008 $989 $972 $1,196 $1,458 $2,829 $1,085
2007 $843 $908 $1,092 $1,520 $2,281 $1,015
2006 $752 $820 $983 $1,287 $2,121 $945
Studio 1 Bedroom 2 Bedroom 3 Bedroom 4+ Bedroom ALL
2015 262 633 426 185 45 1,551
2014 247 712 480 202 63 1,704
2013 221 668 515 173 37 1,614
2012 224 530 422 175 46 1,397
2011 175 417 413 101 38 1,144
2010 119 438 400 134 34 1,125
2009 170 339 229 78 19 835
2008 304 371 396 32 9 1,112
2007 248 532 575 79 12 1,446
2006 158 328 409 53 32 980
Average Sales Price
Median Sales Price
Average Price Per Square Foot
Number of Sales
$0
$250
$500
$750
$1,000
$1,250
$1,500
20152014201320122011201020092008200720060
500
1,000
1,500
2,000
2,500
3,000
Price/sq. ft Number of sales

32
WEST SIDEMANHATTAN DECADE
2006-2015
Visit our website to browse listings and learn more about market trends
WEST SIDE CONDOS
Average Price Per Square Foot / Number of Sales
Matrix Current Year % Chg Prior Year % Chg Prior Decade
Average Sales Price $2,307,993 14.0% $2,024,534 66.5% $1,385,845
Average Price Per Sq. Ft $1,883 16.7% $1,614 58.6% $1,187
Median Sales Price $1,425,000 10.5% $1,290,122 50.8% $945,000
Number of Sales 1,418 18.2% 1,200 27.3% 1,114
BoundaryNorth: West 116th StreetSouth: West 34th StreetEast: Avenue of the AmericasWest: Hudson River
Studio 1 Bedroom 2 Bedroom 3 Bedroom 4+ Bedroom ALL
2015 $549,465$1,051,832 $2,089,884 $4,097,892 $10,157,159 $2,307,993
2014 $764,050$1,041,681 $2,019,086 $4,034,836 $7,844,658 $2,024,534
2013 $606,649 $954,506 $1,985,287 $3,512,488 $6,369,913 $1,805,043
2012 $612,476 $846,410 $1,810,495 $3,475,518 $7,906,629 $2,038,843
2011 $558,295 $805,183 $1,709,823 $3,880,803 $6,642,145 $1,877,799
2010 $472,583 $743,146 $1,450,830 $3,389,551 $7,119,452 $1,689,110
2009 $518,525 $774,017 $2,152,806 $3,444,945 $6,617,824 $1,821,540
2008 $630,851 $907,792 $2,396,346 $5,983,633 $13,736,629 $2,212,027
2007 $579,563 $830,135 $1,754,641 $6,056,800 $10,909,177 $1,470,662
2006 $543,620 $793,158 $1,697,615 $4,790,697 $8,166,805 $1,385,845
Studio 1 Bedroom 2 Bedroom 3 Bedroom 4+ Bedroom ALL
2015 $560,000 $983,746 $1,868,699 $3,471,141 $6,637,899 $1,425,000
2014 $627,000 $960,000 $1,680,000 $3,105,662 $4,873,575 $1,290,122
2013 $575,000 $875,000 $1,650,000 $2,749,275 $5,300,000 $1,180,000
2012 $520,000 $795,000 $1,512,500 $2,785,000 $5,390,000 $1,222,200
2011 $540,000 $785,254 $1,435,000 $3,048,000 $5,500,000 $1,141,500
2010 $458,000 $725,000 $1,300,000 $2,925,000 $5,273,466 $1,033,000
2009 $450,000 $740,000 $1,395,000 $2,600,000 $5,526,877 $995,000
2008 $640,000 $870,000 $1,731,025 $4,429,387 $10,691,625 $1,206,626
2007 $525,000 $801,871 $1,450,000 $5,050,000 $9,673,375 $982,000
2006 $499,000 $775,000 $1,395,999 $3,950,000 $7,195,000 $945,000
Studio 1 Bedroom 2 Bedroom 3 Bedroom 4+ Bedroom ALL
2015 $1,152 $1,370 $1,640 $2,071 $3,193 $1,883
2014 $1,403 $1,315 $1,656 $2,209 $2,667 $1,614
2013 $1,116 $1,191 $1,482 $1,876 $2,110 $1,399
2012 $1,068 $1,078 $1,452 $1,814 $2,518 $1,414
2011 $1,071 $1,063 $1,317 $1,897 $2,084 $1,333
2010 $953 $971 $1,184 $1,609 $2,036 $1,195
2009 $988 $1,024 $1,547 $1,670 $2,000 $1,331
2008 $1,191 $1,206 $1,705 $2,333 $3,424 $1,560
2007 $1,132 $1,113 $1,362 $2,079 $2,608 $1,271
2006 $1,102 $1,055 $1,259 $1,806 $2,079 $1,187
Studio 1 Bedroom 2 Bedroom 3 Bedroom 4+ Bedroom ALL
2015 85 598 442 215 78 1,418
2014 153 448 391 151 57 1,200
2013 142 483 387 139 60 1,211
2012 139 363 341 179 77 1,099
2011 146 464 471 201 77 1,359
2010 149 462 590 194 79 1,474
2009 112 372 361 144 38 1,027
2008 174 524 693 95 41 1,527
2007 208 688 755 63 13 1,727
2006 138 443 485 29 19 1,114
Average Sales Price
Median Sales Price
Average Price Per Square Foot
Number of Sales
$0
$400
$800
$1,200
$1,600
$2,000
20152014201320122011201020092008200720060
400
800
1,200
1,600
2,000
Price/sq. ft Number of sales

33
WEST SIDEMANHATTAN DECADE
2006-2015
Visit our website to browse listings and learn more about market trends
UPPER WEST SIDE CO-OPS
Average Price Per Square Foot / Number of Sales
BoundaryNorth: West 116th StreetSouth: West 57th StreetEast: Central Park WestWest: Hudson River
Studio 1 Bedroom 2 Bedroom 3 Bedroom 4+ Bedroom ALL
2015 $390,756 $780,958 $1,595,667 $3,183,950 $6,525,809 $1,492,061
2014 $504,046 $694,674 $1,478,760 $3,122,232 $6,133,638 $1,416,145
2013 $390,312 $653,905 $1,322,975 $2,659,312 $3,995,694 $1,148,553
2012 $378,336 $607,281 $1,232,414 $2,243,737 $4,285,632 $1,107,466
2011 $353,896 $581,009 $1,342,055 $2,878,715 $5,914,978 $1,236,157
2010 $354,776 $634,857 $1,353,425 $2,422,120 $7,466,134 $1,300,861
2009 $372,411 $610,106 $1,116,705 $2,244,239 $4,209,179 $952,984
2008 $418,105 $682,479 $1,572,359 $3,586,575 $9,947,222 $1,100,086
2007 $377,991 $646,368 $1,388,211 $3,672,625 $7,199,375 $1,146,785
2006 $371,074 $603,730 $1,296,882 $3,001,870 $7,925,000 $1,261,555
Studio 1 Bedroom 2 Bedroom 3 Bedroom 4+ Bedroom ALL
2015 $388,000 $711,000 $1,450,000 $2,812,500 $4,900,000 $880,000
2014 $378,111 $650,000 $1,329,750 $2,580,000 $4,325,000 $837,667
2013 $373,391 $595,000 $1,201,000 $2,250,000 $3,200,000 $775,000
2012 $347,500 $575,000 $1,080,000 $1,960,000 $3,900,000 $735,000
2011 $355,000 $558,000 $1,150,000 $2,235,000 $5,100,000 $760,000
2010 $345,000 $605,000 $1,161,000 $2,100,000 $5,750,000 $832,500
2009 $375,000 $580,000 $999,900 $1,825,000 $3,400,000 $675,000
2008 $399,000 $650,000 $1,385,000 $3,150,000 $7,350,000 $730,000
2007 $375,000 $625,000 $1,225,000 $3,495,000 $6,280,000 $760,000
2006 $365,000 $577,500 $1,115,000 $2,710,000 $6,000,000 $750,000
Studio 1 Bedroom 2 Bedroom 3 Bedroom 4+ Bedroom ALL
2015 $766 $978 $1,228 $1,519 $1,441 $1,235
2014 $1,017 $910 $1,212 $1,554 $2,126 $1,142
2013 $824 $898 $1,066 $1,404 $1,506 $1,016
2012 $745 $814 $1,002 $1,196 $1,554 $937
2011 $744 $811 $1,053 $1,424 $1,869 $987
2010 $752 $845 $1,074 $1,258 $2,090 $1,009
2009 $752 $852 $927 $1,165 $1,403 $898
2008 $1,002 $985 $1,220 $1,458 $2,829 $1,105
2007 $850 $920 $1,104 $1,549 $2,281 $1,034
2006 $754 $830 $1,004 $1,287 $2,170 $966
Studio 1 Bedroom 2 Bedroom 3 Bedroom 4+ Bedroom ALL
2015 163 453 335 154 41 1,146
2014 221 623 455 199 60 1,558
2013 197 593 477 172 35 1,474
2012 201 480 402 173 44 1,300
2011 146 383 400 100 37 1,066
2010 100 408 379 133 32 1,052
2009 152 320 224 77 19 792
2008 283 342 374 32 9 1,040
2007 212 472 547 77 12 1,320
2006 136 290 370 53 31 880
Average Sales Price
Median Sales Price
Average Price Per Square Foot
Number of Sales
$0
$250
$500
$750
$1,000
$1,250
$1,500
20152014201320122011201020092008200720060
320
640
960
1,280
1,600
Price/sq. ft Number of salesMatrix Current Year % Chg Prior Year % Chg Prior Decade
Average Sales Price $1,492,061 5.4% $1,416,145 18.3% $1,261,555
Average Price Per Sq. Ft $1,235 8.1% $1,142 27.8% $966
Median Sales Price $880,000 5.1% $837,667 17.3% $750,000
Number of Sales 1,146 -26.4% 1,558 35.2% 880
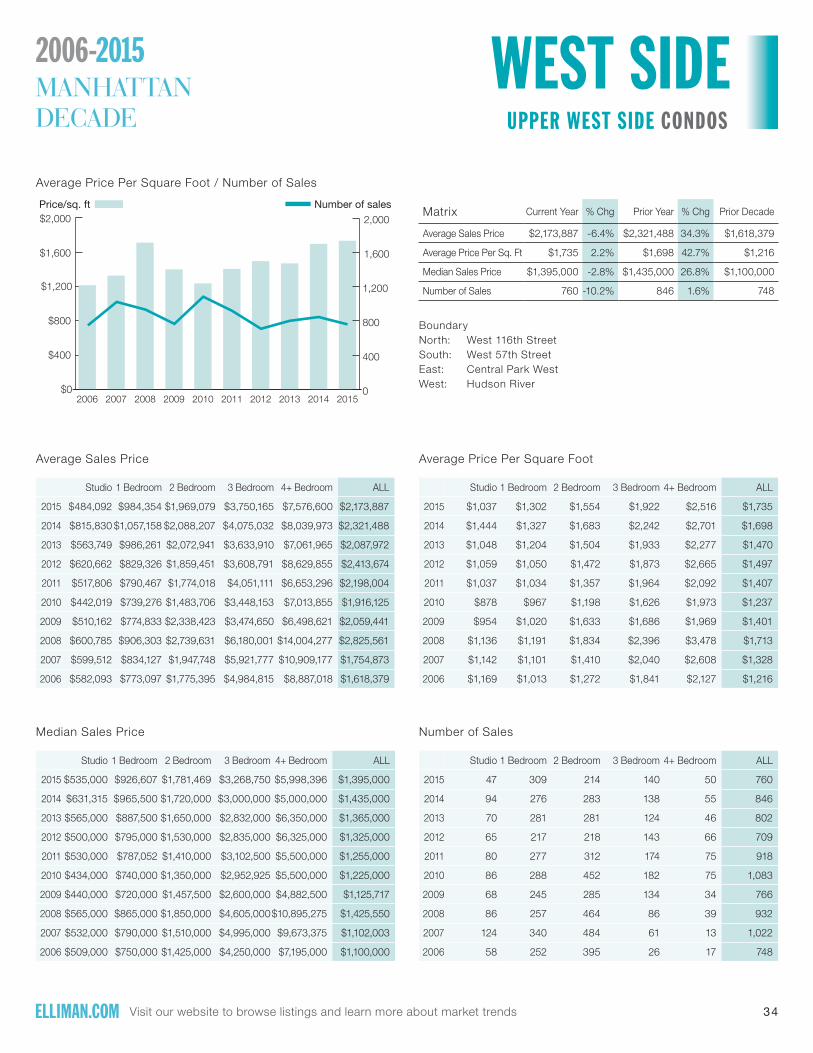
34
WEST SIDEMANHATTAN DECADE
2006-2015
Visit our website to browse listings and learn more about market trends
UPPER WEST SIDE CONDOS
Average Price Per Square Foot / Number of Sales
BoundaryNorth: West 116th StreetSouth: West 57th StreetEast: Central Park WestWest: Hudson River
Studio 1 Bedroom 2 Bedroom 3 Bedroom 4+ Bedroom ALL
2015 $484,092 $984,354 $1,969,079 $3,750,165 $7,576,600 $2,173,887
2014 $815,830 $1,057,158 $2,088,207 $4,075,032 $8,039,973 $2,321,488
2013 $563,749 $986,261 $2,072,941 $3,633,910 $7,061,965 $2,087,972
2012 $620,662 $829,326 $1,859,451 $3,608,791 $8,629,855 $2,413,674
2011 $517,806 $790,467 $1,774,018 $4,051,111 $6,653,296 $2,198,004
2010 $442,019 $739,276 $1,483,706 $3,448,153 $7,013,855 $1,916,125
2009 $510,162 $774,833 $2,338,423 $3,474,650 $6,498,621 $2,059,441
2008 $600,785 $906,303 $2,739,631 $6,180,001 $14,004,277 $2,825,561
2007 $599,512 $834,127 $1,947,748 $5,921,777 $10,909,177 $1,754,873
2006 $582,093 $773,097 $1,775,395 $4,984,815 $8,887,018 $1,618,379
Studio 1 Bedroom 2 Bedroom 3 Bedroom 4+ Bedroom ALL
2015 $535,000 $926,607 $1,781,469 $3,268,750 $5,998,396 $1,395,000
2014 $631,315 $965,500 $1,720,000 $3,000,000 $5,000,000 $1,435,000
2013 $565,000 $887,500 $1,650,000 $2,832,000 $6,350,000 $1,365,000
2012 $500,000 $795,000 $1,530,000 $2,835,000 $6,325,000 $1,325,000
2011 $530,000 $787,052 $1,410,000 $3,102,500 $5,500,000 $1,255,000
2010 $434,000 $740,000 $1,350,000 $2,952,925 $5,500,000 $1,225,000
2009 $440,000 $720,000 $1,457,500 $2,600,000 $4,882,500 $1,125,717
2008 $565,000 $865,000 $1,850,000 $4,605,000$10,895,275 $1,425,550
2007 $532,000 $790,000 $1,510,000 $4,995,000 $9,673,375 $1,102,003
2006 $509,000 $750,000 $1,425,000 $4,250,000 $7,195,000 $1,100,000
Studio 1 Bedroom 2 Bedroom 3 Bedroom 4+ Bedroom ALL
2015 $1,037 $1,302 $1,554 $1,922 $2,516 $1,735
2014 $1,444 $1,327 $1,683 $2,242 $2,701 $1,698
2013 $1,048 $1,204 $1,504 $1,933 $2,277 $1,470
2012 $1,059 $1,050 $1,472 $1,873 $2,665 $1,497
2011 $1,037 $1,034 $1,357 $1,964 $2,092 $1,407
2010 $878 $967 $1,198 $1,626 $1,973 $1,237
2009 $954 $1,020 $1,633 $1,686 $1,969 $1,401
2008 $1,136 $1,191 $1,834 $2,396 $3,478 $1,713
2007 $1,142 $1,101 $1,410 $2,040 $2,608 $1,328
2006 $1,169 $1,013 $1,272 $1,841 $2,127 $1,216
Studio 1 Bedroom 2 Bedroom 3 Bedroom 4+ Bedroom ALL
2015 47 309 214 140 50 760
2014 94 276 283 138 55 846
2013 70 281 281 124 46 802
2012 65 217 218 143 66 709
2011 80 277 312 174 75 918
2010 86 288 452 182 75 1,083
2009 68 245 285 134 34 766
2008 86 257 464 86 39 932
2007 124 340 484 61 13 1,022
2006 58 252 395 26 17 748
Average Sales Price
Median Sales Price
Average Price Per Square Foot
Number of Sales
$0
$400
$800
$1,200
$1,600
$2,000
20152014201320122011201020092008200720060
400
800
1,200
1,600
2,000
Price/sq. ft Number of salesMatrix Current Year % Chg Prior Year % Chg Prior Decade
Average Sales Price $2,173,887 -6.4% $2,321,488 34.3% $1,618,379
Average Price Per Sq. Ft $1,735 2.2% $1,698 42.7% $1,216
Median Sales Price $1,395,000 -2.8% $1,435,000 26.8% $1,100,000
Number of Sales 760 -10.2% 846 1.6% 748

35
WEST SIDEMANHATTAN DECADE
2006-2015
Visit our website to browse listings and learn more about market trends
RIVERSIDE DRIVE/WEST END AVENUE CORRIDOR CO-OPS
Average Price Per Square Foot / Number of Sales
BoundaryNorth: West 116th StreetSouth: West 57th StreetEast: West End AvenueWest: Riverside Drive
Studio 1 Bedroom 2 Bedroom 3 Bedroom 4+ Bedroom ALL
2015 $413,038 $731,820 $1,471,498 $2,539,916 $4,359,284 $1,255,835
2014 $398,968 $693,465 $1,382,941 $2,527,663 $4,146,631 $1,217,552
2013 $392,402 $625,377 $1,221,900 $2,221,834 $3,821,600 $1,105,351
2012 $361,886 $617,568 $1,204,114 $2,075,903 $4,372,307 $1,149,175
2011 $352,133 $550,080 $1,268,873 $2,095,622 $3,048,300 $1,080,459
2010 $366,246 $641,805 $1,250,017 $1,952,271 $3,130,186 $1,054,764
2009 $362,568 $587,005 $1,086,845 $1,729,159 $2,371,880 $862,907
2008 $377,078 $687,100 $1,524,573 $2,750,000$10,000,000 $947,774
2007 $399,862 $673,410 $1,328,325 $3,132,400 $4,500,000 $1,040,044
2006 $400,638 $597,974 $1,232,008 $2,812,567 $5,302,333 $1,220,076
Studio 1 Bedroom 2 Bedroom 3 Bedroom 4+ Bedroom ALL
2015 $425,000 $709,000 $1,381,800 $2,447,500 $4,125,000 $875,000
2014 $373,315 $653,000 $1,275,000 $2,450,000 $3,250,000 $851,000
2013 $382,000 $585,000 $1,150,000 $2,100,000 $3,000,000 $840,000
2012 $355,000 $578,746 $1,045,000 $2,056,865 $3,811,500 $815,000
2011 $355,000 $545,000 $1,135,000 $2,100,000 $3,150,000 $755,000
2010 $345,000 $605,000 $1,150,000 $1,925,000 $2,900,000 $818,500
2009 $350,000 $565,000 $1,070,000 $1,825,000 $2,175,000 $699,999
2008 $355,000 $650,000 $1,425,000 $3,000,000 $10,000,000 $671,000
2007 $385,000 $665,000 $1,200,000 $2,800,000 $4,500,000 $799,326
2006 $399,000 $579,000 $1,200,000 $2,700,000 $5,500,000 $799,000
Studio 1 Bedroom 2 Bedroom 3 Bedroom 4+ Bedroom ALL
2015 $798 $956 $1,183 $1,367 $1,650 $1,175
2014 $832 $899 $1,132 $1,312 $1,465 $1,033
2013 $842 $861 $1,009 $1,216 $1,484 $975
2012 $730 $812 $965 $1,142 $1,522 $931
2011 $757 $761 $1,018 $1,182 $1,233 $926
2010 $752 $850 $993 $1,058 $1,338 $928
2009 $766 $824 $906 $1,019 $1,059 $865
2008 $1,048 $983 $1,173 $1,189 $2,500 $1,082
2007 $906 $947 $1,056 $1,390 $1,500 $1,010
2006 $789 $795 $956 $1,149 $1,658 $932
Studio 1 Bedroom 2 Bedroom 3 Bedroom 4+ Bedroom ALL
2015 81 188 167 68 14 518
2014 75 163 137 59 16 450
2013 47 167 177 59 10 460
2012 51 124 131 58 14 378
2011 40 118 119 45 12 334
2010 35 129 115 45 7 331
2009 41 87 80 22 5 235
2008 133 102 137 8 1 381
2007 77 158 193 23 1 452
2006 48 76 125 15 15 279
Average Sales Price
Median Sales Price
Average Price Per Square Foot
Number of Sales
$0
$250
$500
$750
$1,000
$1,250
$1,500
20152014201320122011201020092008200720060
125
250
375
500
625
750
Price/sq. ft Number of salesMatrix Current Year % Chg Prior Year % Chg Prior Decade
Average Sales Price $1,255,835 3.1% $1,217,552 2.9% $1,220,076
Average Price Per Sq. Ft $1,175 13.7% $1,033 26.1% $932
Median Sales Price $875,000 2.8% $851,000 9.5% $799,000
Number of Sales 518 15.1% 450 85.7% 279

36
WEST SIDEMANHATTAN DECADE
2006-2015
Visit our website to browse listings and learn more about market trends
CENTRAL PARK WEST CO-OPS
Average Price Per Square Foot / Number of Sales
BoundaryNorth: West 96th StreetSouth: West 60th StreetEast: Central ParkWest: Central Park West
Studio 1 Bedroom 2 Bedroom 3 Bedroom 4+ Bedroom ALL
2015 $213,333 $1,698,338 $3,192,105 $5,419,200 $12,394,500 $4,606,257
2014 $4,255,614 $1,038,430 $2,598,145 $5,564,973 $12,261,073 $4,434,611
2013 $461,722 $1,135,830 $2,329,025 $5,441,623 $6,451,414 $3,004,644
2012 $431,900 $922,653 $2,702,800 $3,964,692 $6,257,800 $3,041,756
2011 $283,750 $936,000 $2,431,803 $5,510,761 $8,976,493 $3,981,280
2010 $311,500 $732,500 $2,586,226 $4,280,777 $11,967,857 $4,428,457
2009 $418,750 $715,111 $1,765,667 $3,805,667 $7,063,333 $2,735,939
2008 $504,200 $823,429 $2,329,241 $5,410,000$12,408,333 $3,423,521
2007 $295,250 $778,100 $2,475,010 $4,755,500 $9,066,250 $3,236,676
2006 $319,350 $859,227 $2,016,136 $3,906,125 11,430,00 $3,726,093
Studio 1 Bedroom 2 Bedroom 3 Bedroom 4+ Bedroom ALL
2015 $200,000 $853,134 $3,150,000 $4,950,000 $11,750,000 $3,400,000
2014 $587,500 $996,000$2,000,000 $3,925,000 $9,150,000 $2,725,000
2013 $327,000 $930,000 $2,012,235 $4,307,124 $5,000,000 $1,950,000
2012 $395,000 $785,000 $2,755,000 $3,500,000 $5,950,000 $2,750,000
2011 $290,000 $755,000 $1,750,000 $5,700,000 $7,325,000 $2,900,000
2010 $311,500 $640,000 $1,875,000 $3,900,000 $11,500,000 $2,500,000
2009 $420,000 $565,000 $1,525,000 $3,400,000 $6,350,000 $1,928,500
2008 $440,000 $689,000 $1,995,000 $5,025,000 $15,000,000 $1,995,000
2007 $290,000 $726,000 $2,200,000 $3,900,000 $7,080,000 $2,354,000
2006 $382,353 $750,000 $2,100,000 $3,825,000 $7,295,000 $2,150,000
Studio 1 Bedroom 2 Bedroom 3 Bedroom 4+ Bedroom ALL
2015 $538 $1,162 $1,691 $2,006 $3,356 $2,221
2014 $3,568 $1,201 $1,857 $2,234 $3,368 $2,098
2013 $853 $1,214 $1,454 $2,205 $1,789 $1,567
2012 $918 $1,056 $1,648 $1,650 $2,060 $1,519
2011 $709 $1,260 $1,372 $2,043 $2,400 $1,668
2010 $556 $943 $1,608 $1,823 $2,814 $1,771
2009 $859 $997 $1,250 $1,482 $2,101 $1,347
2008 $1,363 $1,053 $1,550 $2,069 $3,237 $1,714
2007 $716 $1,067 $1,538 $1,930 $2,648 $1,616
2006 $704 $1,067 $1,333 $1,467 $2,809 $1,548
Studio 1 Bedroom 2 Bedroom 3 Bedroom 4+ Bedroom ALL
2015 3 20 19 25 10 77
2014 7 30 33 41 15 126
2013 9 23 32 26 7 97
2012 7 15 18 26 10 76
2011 4 14 34 23 15 90
2010 2 10 31 22 14 79
2009 4 9 15 15 6 49
2008 5 7 32 7 6 57
2007 4 16 40 23 8 91
2006 4 11 33 8 13 69
Average Sales Price
Median Sales Price
Average Price Per Square Foot
Number of Sales
$0
$480
$960
$1,440
$1,920
$2,400
20152014201320122011201020092008200720060
40
80
120
160
200
Price/sq. ft Number of salesMatrix Current Year % Chg Prior Year % Chg Prior Decade
Average Sales Price $4,606,257 3.9% $4,434,611 23.6% $3,726,093
Average Price Per Sq. Ft $2,221 5.9% $2,098 43.5% $1,548
Median Sales Price $3,400,000 24.8% $2,725,000 58.1% $2,150,000
Number of Sales 77 -38.9% 126 11.6% 69

37
WEST SIDEMANHATTAN DECADE
2006-2015
Visit our website to browse listings and learn more about market trends
LINCOLN CENTER CO-OPS
Average Price Per Square Foot / Number of Sales
BoundaryNorth: West 72nd StreetSouth: West 57th StreetEast: Central Park WestWest: Hudson River
Studio 1 Bedroom 2 Bedroom 3 Bedroom 4+ Bedroom ALL
2015 $414,813 $765,742 $1,563,401 $3,937,000 $5,100,000 $1,226,691
2014 $383,602 $718,396 $1,529,675 $3,400,054 $9,893,000 $1,281,569
2013 $388,922 $694,170 $1,391,422 $3,171,727 $3,463,100 $1,006,709
2012 $352,618 $603,504 $1,167,449 $2,811,544 $4,118,750 $853,400
2011 $368,480 $576,557 $1,361,632 $3,089,273 $7,355,556 $1,093,680
2010 $385,206 $612,668 $1,300,399 $2,344,064 $12,623,750 $1,299,817
2009 $374,797 $628,133 $1,175,803 $2,940,056 $8,242,500 $884,468
2008 $451,696 $707,567 $1,720,046 $4,940,800 $6,325,000 $1,171,739
2007 $372,241 $631,571 $1,398,798 $4,573,500 $6,118,333 $1,008,278
2006 $372,350 $625,502 $1,417,741 $4,697,857 $14,532,143 $1,386,733
Studio 1 Bedroom 2 Bedroom 3 Bedroom 4+ Bedroom ALL
2015 $414,000 $745,000 $1,483,403 $2,912,500 $5,100,000 $825,000
2014 $391,560 $655,000 $1,450,000 $2,565,000 $5,100,000 $689,000
2013 $380,000 $625,000 $1,300,000 $2,500,000 $3,200,000 $675,000
2012 $342,000 $567,500 $1,100,000 $2,100,000 $4,450,000 $580,000
2011 $350,000 $558,000 $1,125,000 $2,100,000 $5,825,000 $620,000
2010 $350,000 $565,000 $1,089,000 $1,900,000 $15,100,000 $775,000
2009 $358,000 $575,000 $999,900 $1,850,000 $8,242,500 $565,000
2008 $425,000 $649,000 $1,424,000 $4,938,512 $6,325,000 $749,500
2007 $359,000 $599,000 $1,205,000 $5,220,000 $6,875,000 $655,000
2006 $365,000 $579,000 $1,100,000 $4,000,000 $11,000,000 $639,000
Studio 1 Bedroom 2 Bedroom 3 Bedroom 4+ Bedroom ALL
2015 $775 $960 $1,219 $1,527 $1,821 $1,179
2014 $801 $933 $1,269 $1,708 $3,190 $1,096
2013 $808 $916 $1,099 $1,608 $1,226 $986
2012 $692 $810 $999 $1,386 $1,434 $866
2011 $771 $811 $1,107 $1,495 $2,034 $963
2010 $808 $816 $1,089 $1,267 $2,826 $1,006
2009 $715 $865 $975 $1,385 $2,536 $894
2008 $998 $1,013 $1,316 $1,906 $2,108 $1,152
2007 $826 $901 $1,156 $2,001 $1,823 $1,014
2006 $729 $824 $1,077 $1,817 $3,287 $995
Studio 1 Bedroom 2 Bedroom 3 Bedroom 4+ Bedroom ALL
2015 120 232 108 41 12 513
2014 116 221 102 35 15 489
2013 101 202 100 30 9 442
2012 115 167 98 25 6 411
2011 75 140 99 22 9 345
2010 33 126 112 25 8 304
2009 67 114 40 18 2 241
2008 67 86 87 8 2 250
2007 63 143 110 10 3 329
2006 50 88 81 7 7 233
Average Sales Price
Median Sales Price
Average Price Per Square Foot
Number of Sales
$0
$300
$600
$900
$1,200
$1,500
20152014201320122011201020092008200720060
150
300
450
600
750
Price/sq. ft Number of salesMatrix Current Year % Chg Prior Year % Chg Prior Decade
Average Sales Price $1,226,691 -4.3% $1,281,569 -11.5% $1,386,733
Average Price Per Sq. Ft $1,179 7.6% $1,096 18.5% $995
Median Sales Price $825,000 19.7% $689,000 29.1% $639,000
Number of Sales 513 4.9% 489 120.2% 233

38
WEST SIDEMANHATTAN DECADE
2006-2015
Visit our website to browse listings and learn more about market trends
LINCOLN CENTER CONDOS
Average Price Per Square Foot / Number of Sales
BoundaryNorth: West 72nd StreetSouth: West 57th StreetEast: Central Park WestWest: Hudson River
Studio 1 Bedroom 2 Bedroom 3 Bedroom 4+ Bedroom ALL
2015 $223,400$1,253,151 $2,369,227 $5,074,550 $11,928,056 $3,327,731
2014$1,210,507$1,184,459 $2,646,046 $6,064,676 $11,604,425 $3,130,363
2013 $636,956 $1,163,316 $2,513,364 $4,635,229 $7,519,600 $2,482,832
2012 $730,887 $896,052 $2,275,021 $4,036,995 $9,544,319 $2,915,102
2011 $558,455 $857,409 $2,101,265 $4,427,057 $8,231,930 $2,472,978
2010 $475,997 $807,333 $1,615,178 $3,693,388 $8,109,497 $2,029,135
2009 $495,072 $860,265 $3,151,032 $4,128,891 $8,025,979 $2,698,711
2008 $674,920 $998,703 $3,131,055 $7,152,426 $15,712,466 $3,471,868
2007 $610,808 $920,521 $2,280,563 $7,716,858 $13,713,989 $2,281,467
2006 $582,520 $858,558 $2,162,825 $5,651,632 $9,734,930 $2,013,825
Studio 1 Bedroom 2 Bedroom 3 Bedroom 4+ Bedroom ALL
2015 $142,000 $1,104,538 $2,307,714 $3,959,901 $8,477,738 $2,234,940
2014 $700,000 $1,100,000 $2,150,000 $4,000,000 $8,655,125 $1,700,000
2013 $635,000 $995,000 $1,981,250 $3,222,913 $6,389,464 $1,575,000
2012 $500,000 $870,000 $1,760,000 $3,000,000 $5,189,760 $1,760,000
2011 $530,000 $825,000 $1,620,000 $3,050,000 $5,625,000 $1,360,000
2010 $507,000 $810,783 $1,415,000 $2,952,925 $6,000,000 $1,326,600
2009 $515,000 $818,000 $1,750,000 $2,800,000 $6,400,000 $1,600,000
2008 $667,500 $957,155 $2,061,956 $6,109,500 $14,250,000 $1,678,000
2007 $600,000 $860,000 $1,704,316 $5,625,000 $10,700,000 $1,367,550
2006 $595,000 $840,000 $1,800,000 $5,000,000 $7,995,000 $1,275,000
Studio 1 Bedroom 2 Bedroom 3 Bedroom 4+ Bedroom ALL
2015 $610 $1,428 $1,752 $2,377 $3,504 $2,176
2014 $2,013 $1,464 $2,028 $3,116 $3,625 $2,099
2013 $1,164 $1,361 $1,721 $2,452 $2,473 $1,694
2012 $1,136 $1,097 $1,693 $2,040 $2,986 $1,700
2011 $1,118 $1,095 $1,532 $2,227 $2,395 $1,552
2010 $944 $1,027 $1,288 $1,777 $2,320 $1,335
2009 $987 $1,108 $1,907 $1,928 $2,307 $1,626
2008 $1,171 $1,261 $2,042 $2,701 $3,734 $1,942
2007 $1,191 $1,184 $1,619 $2,391 $2,944 $1,513
2006 $1,139 $1,080 $1,468 $2,072 $2,398 $1,376
Studio 1 Bedroom 2 Bedroom 3 Bedroom 4+ Bedroom ALL
2015 30 145 132 55 25 387
2014 29 133 122 58 24 366
2013 25 143 137 51 24 380
2012 23 110 126 96 37 392
2011 31 163 173 89 37 493
2010 37 154 260 99 31 581
2009 25 128 159 82 19 413
2008 45 145 322 65 29 606
2007 48 146 262 36 9 501
2006 25 122 204 19 10 380
Average Sales Price
Median Sales Price
Average Price Per Square Foot
Number of Sales
$0
$500
$1,000
$1,500
$2,000
$2,500
20152014201320122011201020092008200720060
200
400
600
800
1,000
Price/sq. ft Number of salesMatrix Current Year % Chg Prior Year % Chg Prior Decade
Average Sales Price $3,327,731 6.3% $3,130,363 65.2% $2,013,825
Average Price Per Sq. Ft $2,176 3.7% $2,099 58.1% $1,376
Median Sales Price $2,234,940 31.5% $1,700,000 75.3% $1,275,000
Number of Sales 387 5.7% 366 1.8% 380

39
WEST SIDEMANHATTAN DECADE
2006-2015
Visit our website to browse listings and learn more about market trends
MIDTOWN WEST/CLINTON CO-OPS
Average Price Per Square Foot / Number of Sales
BoundaryNorth: West 57th StreetSouth: West 34th StreetEast: Avenue of the AmericasWest: Hudson River
Studio 1 Bedroom 2 Bedroom 3 Bedroom 4+ Bedroom ALL
2015 $373,090 $833,089 $1,263,891 $1,860,000 $4,962,500 $861,631
2014 $366,583 $527,848 $988,259 $1,655,100 $3,545,833 $664,498
2013 $331,279 $589,432 $869,743 $1,524,500 $2,800,000 $656,807
2012 $313,038 $506,026 $956,481 $1,357,333 $1,470,000 $591,014
2011 $300,838 $488,316 $962,643 $2,600,000 $570,000 $529,245
2010 $310,500 $475,632 $871,000 $1,200,000 $2,282,500 $598,642
2009 $333,604 $504,457 $716,643 $917,500 $475,035
2008 $354,296 $572,286 $885,917 $602,937
2007 $379,626 $552,526 $924,121 $2,775,000 $623,701
2006 $370,942 $556,744 $964,278 $1,795,000 $689,595
Studio 1 Bedroom 2 Bedroom 3 Bedroom 4+ Bedroom ALL
2015 $340,380 $590,000 $995,000 $1,345,000 $4,962,500 $580,000
2014 $375,000 $489,896 $870,000 $1,392,924 $3,925,000 $498,841
2013 $320,000 $506,000 $850,000 $1,524,500 $2,800,000 $565,000
2012 $315,000 $464,500 $767,500 $1,250,000 $1,470,000 $480,000
2011 $295,000 $469,000 $955,000 $2,600,000 $570,000 $450,000
2010 $320,000 $469,000 $850,000 $1,200,000 $2,282,500 $475,000
2009 $330,888 $500,000 $748,000 $917,500 $400,000
2008 $320,000 $540,000 $862,500 $540,000
2007 $360,000 $525,000 $851,000 $2,775,000 $544,000
2006 $330,000 $530,000 $850,000 $1,795,000 $575,000
Studio 1 Bedroom 2 Bedroom 3 Bedroom 4+ Bedroom ALL
2015 $730 $874 $1,037 $1,151 $1,654 $957
2014 $735 $746 $849 $1,273 $1,198 $784
2013 $679 $791 $808 $742 $836 $775
2012 $696 $693 $801 $679 $784 $717
2011 $667 $700 $771 $1,643 $760 $713
2010 $657 $699 $767 $598 $761 $708
2009 $722 $725 $646 $667 $712
2008 $821 $803 $750 $793
2007 $803 $822 $813 $776 $814
2006 $726 $741 $788 $520 $754
Studio 1 Bedroom 2 Bedroom 3 Bedroom 4+ Bedroom ALL
2015 46 69 23 7 2 147
2014 29 93 27 4 3 156
2013 29 82 42 2 2 157
2012 26 53 21 3 2 105
2011 29 38 14 1 1 83
2010 21 34 23 1 2 81
2009 23 23 7 2 55
2008 23 35 24 82
2007 39 66 33 2 140
2006 26 39 45 1 111
Average Sales Price
Median Sales Price
Average Price Per Square Foot
Number of Sales
$0
$300
$600
$900
$1,200
$1,500
20152014201320122011201020092008200720060
40
80
120
160
200
Price/sq. ft Number of salesMatrix Current Year % Chg Prior Year % Chg Prior Decade
Average Sales Price $861,631 29.7% $664,498 24.9% $689,595
Average Price Per Sq. Ft $957 22.1% $784 26.9% $754
Median Sales Price $580,000 16.3% $498,841 0.9% $575,000
Number of Sales 147 -5.8% 156 32.4% 111

40
WEST SIDEMANHATTAN DECADE
2006-2015
Visit our website to browse listings and learn more about market trends
MIDTOWN WEST/CLINTON CONDOS
Average Price Per Square Foot / Number of Sales
Boundary West 57th Street West 34th Street Avenue of the Americas Hudson River
Studio 1 Bedroom 2 Bedroom 3 Bedroom 4+ Bedroom ALL
2015 $684,426 $1,119,170 $2,052,906 $4,148,877 $14,805,680 $1,916,099
2014 $681,554 $1,019,123 $1,866,365 $3,873,629 $2,473,500 $1,342,666
2013 $648,357 $935,200 $1,808,539 $2,508,733 $4,420,293 $1,294,934
2012 $605,285 $876,967 $1,738,052 $2,954,118 $3,567,273 $1,375,129
2011 $604,203 $826,982 $1,597,564 $2,796,816 $6,740,967 $1,249,013
2010 $511,972 $749,551 $1,376,984 $2,547,738 $9,099,425 $1,091,842
2009 $550,737 $778,071 $1,465,748 $2,965,364 $7,631,050 $1,124,809
2008 $660,234 $912,803 $1,746,141 $4,126,500 $8,517,500 $1,279,122
2007 $550,117 $827,172 $1,448,819 $10,175,000 $1,063,222
2006 $515,728 $817,550 $1,380,729 $2,825,000 $2,045,000 $924,157
Studio 1 Bedroom 2 Bedroom 3 Bedroom 4+ Bedroom ALL
2015 $685,000 $999,921 $1,750,000 $2,275,788 $8,100,000 $1,311,680
2014 $625,000 $960,000 $1,660,000 $4,250,000 $2,473,500 $1,110,000
2013 $625,000 $855,000 $1,675,000 $2,399,000 $3,825,000 $950,000
2012 $617,500 $800,000 $1,512,500 $2,494,713 $3,725,000 $1,017,300
2011 $560,000 $785,000 $1,475,000 $2,565,990 $7,200,000 $950,000
2010 $495,000 $710,000 $1,200,000 $2,825,643 $400,715 $800,000
2009 $480,000 $772,000 $1,374,637 $2,490,000 $8,175,000 $841,000
2008 $672,045 $875,000 $1,517,192 $4,132,516 $8,517,525 $990,000
2007 $510,000 $825,000 $1,361,250 $10,175,000 $940,000
2006 $479,000 $800,000 $1,325,000 $3,150,000 $2,045,000 $816,000
Studio 1 Bedroom 2 Bedroom 3 Bedroom 4+ Bedroom ALL
2015 $1,359 $1,485 $1,747 $2,656 $4,346 $1,953
2014 $1,331 $1,297 $1,589 $1,895 $1,252 $1,415
2013 $1,180 $1,192 $1,443 $1,383 $1,598 $1,277
2012 $1,076 $1,124 $1,424 $1,580 $1,402 $1,262
2011 $1,111 $1,107 $1,248 $1,467 $1,935 $1,189
2010 $1,060 $978 $1,160 $1,343 $3,757 $1,099
2009 $1,103 $1,038 $1,179 $1,454 $2,261 $1,124
2008 $1,244 $1,224 $1,405 $1,676 $2,289 $1,308
2007 $1,118 $1,126 $1,274 $3,174 $1,188
2006 $1,053 $1,110 $1,178 $1,365 $1,136 $1,118
Studio 1 Bedroom 2 Bedroom 3 Bedroom 4+ Bedroom ALL
2015 31 201 125 35 8 400
2014 59 174 110 14 2 359
2013 72 210 111 15 15 423
2012 74 148 124 39 11 396
2011 67 187 161 32 3 450
2010 64 174 145 16 4 403
2009 46 133 77 11 4 271
2008 88 272 238 10 2 610
2007 84 352 280 2 718
2006 80 197 96 4 2 379
Average Sales Price
Median Sales Price
Average Price Per Square Foot
Number of Sales
$0
$400
$800
$1,200
$1,600
$2,000
20152014201320122011201020092008200720060
200
400
600
800
1,000
Price/sq. ft Number of salesMatrix Current Year % Chg Prior Year % Chg Prior Decade
Average Sales Price $1,916,099 42.7% $1,342,666 107.3% $924,157
Average Price Per Sq. Ft $1,953 38.0% $1,415 74.7% $1,118
Median Sales Price $1,311,680 18.2% $1,110,000 60.7% $816,000
Number of Sales 400 11.4% 359 5.5% 379

41
DOWNTOWNMANHATTAN DECADE
2006-2015
Visit our website to browse listings and learn more about market trends
DOWNTOWN CO-OPS
Average Price Per Square Foot / Number of Sales
Matrix Current Year % Chg Prior Year % Chg Prior Decade
Average Sales Price $1,153,307 3.1% $1,118,961 33.5% $864,152
Average Price Per Sq. Ft $1,202 13.5% $1,059 34.9% $891
Median Sales Price $772,500 7.8% $716,500 23.6% $625,000
Number of Sales 2,049 -18.6% 2,517 40.5% 1,458
BoundaryNorth: West 34th Street and East 42nd StreetSouth: Battery ParkEast: East RiverWest: Hudson River
Studio 1 Bedroom 2 Bedroom 3 Bedroom 4+ Bedroom ALL
2015 $441,002 $840,923 $1,723,222 $3,515,424 $5,033,208 $1,153,307
2014 $467,504 $781,489 $1,531,715 $2,982,221 $6,699,829 $1,118,961
2013 $459,446 $742,106 $1,431,083 $2,669,333 $4,596,888 $1,011,637
2012 $419,031 $729,841 $1,451,713 $2,475,815 $4,662,331 $998,843
2011 $372,250 $618,689 $1,337,019 $2,459,858 $7,080,244 $916,202
2010 $383,104 $628,983 $1,269,141 $2,621,842 $5,007,367 $961,191
2009 $386,148 $634,044 $1,287,501 $2,142,035 $4,733,091 $816,236
2008 $459,509 $747,444 $1,725,501 $3,693,736 $5,848,545 $1,021,983
2007 $421,128 $663,030 $1,463,133 $3,006,757 $4,052,138 $932,685
2006 $417,730 $648,004 $1,337,399 $2,974,650 $4,407,000 $864,152
Studio 1 Bedroom 2 Bedroom 3 Bedroom 4+ Bedroom ALL
2015 $427,140 $740,000 $1,500,000 $3,000,000 $5,025,000 $772,500
2014 $410,000 $680,000 $1,395,000 $2,650,000 $5,100,000 $716,500
2013 $422,500 $650,000 $1,279,000 $2,350,000 $5,125,000 $665,000
2012 $379,000 $630,000 $1,250,000 $2,240,150 $3,650,000 $640,000
2011 $375,000 $571,300 $1,150,000 $2,180,000 $5,650,000 $620,000
2010 $380,000 $600,000 $1,150,000 $2,400,000 $4,825,000 $650,000
2009 $375,000 $595,000 $1,170,000 $1,950,000 $3,500,000 $575,000
2008 $440,000 $700,000 $1,506,279 $3,750,000 $6,100,000 $695,000
2007 $399,999 $615,000 $1,270,000 $2,800,000 $4,154,550 $655,000
2006 $395,000 $610,000 $1,190,000 $2,700,000 $7,000,000 $625,000
Studio 1 Bedroom 2 Bedroom 3 Bedroom 4+ Bedroom ALL
2015 $854 $1,032 $1,312 $1,655 $1,667 $1,202
2014 $913 $972 $1,206 $1,462 $1,915 $1,059
2013 $880 $963 $1,088 $1,313 $1,567 $1,003
2012 $809 $939 $1,105 $1,241 $1,482 $974
2011 $767 $849 $1,051 $1,160 $1,961 $914
2010 $784 $851 $1,002 $1,185 $1,495 $912
2009 $760 $861 $1,005 $1,068 $1,586 $877
2008 $938 $1,020 $1,223 $1,433 $1,476 $1,061
2007 $883 $931 $1,133 $1,135 $1,205 $990
2006 $822 $861 $964 $1,136 $1,444 $891
Studio 1 Bedroom 2 Bedroom 3 Bedroom 4+ Bedroom ALL
2015 427 1,051 420 127 24 2,049
2014 542 1,189 587 161 38 2,517
2013 618 1,106 546 174 34 2,478
2012 471 946 432 128 39 2,016
2011 395 775 516 84 16 1,786
2010 313 658 403 122 18 1,514
2009 322 473 194 68 11 1,068
2008 479 572 394 36 11 1,492
2007 510 835 660 46 13 2,064
2006 377 587 460 30 4 1,458
Average Sales Price
Median Sales Price
Average Price Per Square Foot
Number of Sales
$0
$300
$600
$900
$1,200
$1,500
20152014201320122011201020092008200720060
600
1,200
1,800
2,400
3,000
Price/sq. ft Number of sales

42
DOWNTOWNMANHATTAN DECADE
2006-2015
Visit our website to browse listings and learn more about market trends
DOWNTOWN CONDOS
Average Price Per Square Foot / Number of Sales
Matrix Current Year % Chg Prior Year % Chg Prior Decade
Average Sales Price $2,720,091 21.9% $2,232,167 91.8% $1,418,321
Average Price Per Sq. Ft $1,883 18.6% $1,588 72.6% $1,091
Median Sales Price $1,792,109 14.5% $1,565,000 75.7% $1,020,000
Number of Sales 2,105 -8.8% 2,309 13.2% 1,860
BoundaryNorth: West 34th Street and East 42nd StreetSouth: Battery ParkEast: East RiverWest: Hudson River
Studio 1 Bedroom 2 Bedroom 3 Bedroom 4+ Bedroom ALL
2015 $612,882 $1,233,955 $2,393,722 $4,827,517 $9,071,217 $2,720,091
2014 $737,026 $1,191,401 $2,324,670 $4,218,006 $9,095,140 $2,232,167
2013 $709,918 $1,104,417 $2,221,825 $4,037,961 $7,948,346 $2,095,021
2012 $764,187 $1,034,931 $1,890,900 $3,442,396 $6,543,921 $1,816,961
2011 $613,848 $864,406 $1,754,552 $3,301,159 $5,859,054 $1,726,960
2010 $542,835 $771,731 $1,545,047 $3,158,836 $6,718,246 $1,765,915
2009 $592,277 $866,199 $1,614,173 $2,915,704 $6,613,749 $1,595,726
2008 $664,941 $913,393 $1,928,057 $3,742,018 $8,280,388 $1,617,318
2007 $564,619 $860,900 $1,768,117 $4,042,699 $6,813,535 $1,489,848
2006 $588,335 $809,820 $1,757,645 $3,670,669 $5,492,328 $1,418,321
Studio 1 Bedroom 2 Bedroom 3 Bedroom 4+ Bedroom ALL
2015 $590,000 $1,030,000 $2,100,000 $4,450,000 $7,750,000 $1,792,109
2014 $650,000 $1,053,888 $2,075,000 $3,600,000 $6,700,000 $1,565,000
2013 $620,000 $957,500 $2,000,000 $3,500,000 $6,600,000 $1,470,000
2012 $561,769 $890,000 $1,762,500 $3,000,000 $5,200,000 $1,231,452
2011 $516,252 $789,143 $1,552,831 $2,850,000 $5,093,375 $1,220,000
2010 $492,500 $715,000 $1,425,000 $2,674,181 $6,200,000 $1,210,000
2009 $542,000 $824,782 $1,490,000 $2,575,000 $5,181,110 $1,122,500
2008 $595,000 $860,000 $1,685,203 $3,350,000 $5,620,740 $1,272,812
2007 $515,000 $800,000 $1,555,000 $3,400,000 $5,400,000 $1,140,000
2006 $501,930 $730,000 $1,530,000 $3,150,000 $5,350,000 $1,020,000
Studio 1 Bedroom 2 Bedroom 3 Bedroom 4+ Bedroom ALL
2015 $1,172 $1,447 $1,695 $2,053 $2,696 $1,883
2014 $1,227 $1,404 $1,672 $1,906 $2,551 $1,588
2013 $1,108 $1,248 $1,473 $1,781 $2,022 $1,413
2012 $1,050 $1,206 $1,321 $1,492 $1,684 $1,282
2011 $1,110 $1,131 $1,249 $1,475 $1,521 $1,240
2010 $1,010 $989 $1,148 $1,400 $1,828 $1,167
2009 $999 $1,093 $1,146 $1,366 $1,922 $1,169
2008 $1,084 $1,152 $1,323 $1,468 $2,046 $1,256
2007 $1,052 $1,095 $1,213 $1,378 $1,604 $1,167
2006 $977 $1,029 $1,132 $1,365 $1,371 $1,091
Studio 1 Bedroom 2 Bedroom 3 Bedroom 4+ Bedroom ALL
2015 128 749 741 346 141 2,105
2014 250 851 795 338 75 2,309
2013 255 860 786 340 76 2,317
2012 240 753 613 295 67 1,968
2011 240 729 829 342 81 2,221
2010 178 672 844 432 95 2,221
2009 223 612 621 290 55 1,801
2008 289 823 1,332 129 25 2,598
2007 471 1,014 1,652 205 17 3,359
2006 190 683 890 68 29 1,860
Average Sales Price
Median Sales Price
Average Price Per Square Foot
Number of Sales
$0
$400
$800
$1,200
$1,600
$2,000
20152014201320122011201020092008200720060
800
1,600
2,400
3,200
4,000
Price/sq. ft Number of sales
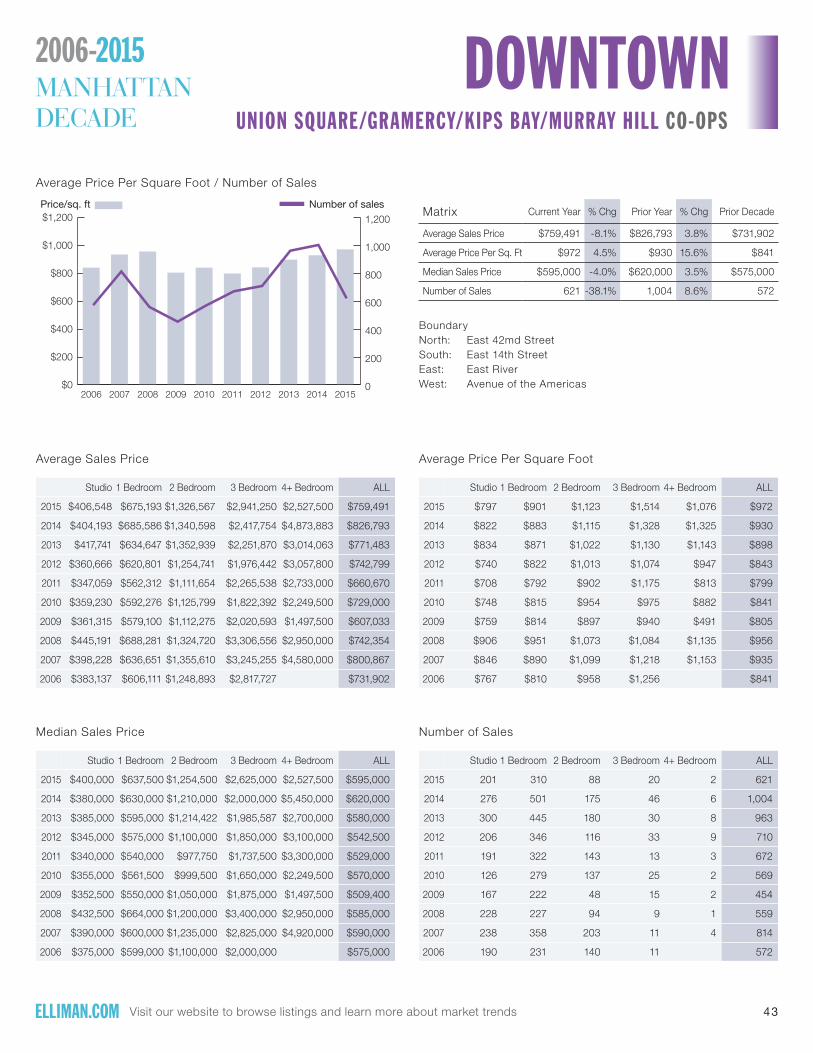
43
DOWNTOWNMANHATTAN DECADE
2006-2015
Visit our website to browse listings and learn more about market trends
UNION SQUARE/GRAMERCY/KIPS BAY/MURRAY HILL CO-OPS
Average Price Per Square Foot / Number of Sales
BoundaryNorth: East 42md StreetSouth: East 14th StreetEast: East RiverWest: Avenue of the Americas
Studio 1 Bedroom 2 Bedroom 3 Bedroom 4+ Bedroom ALL
2015 $406,548 $675,193 $1,326,567 $2,941,250 $2,527,500 $759,491
2014 $404,193 $685,586 $1,340,598 $2,417,754 $4,873,883 $826,793
2013 $417,741 $634,647 $1,352,939 $2,251,870 $3,014,063 $771,483
2012 $360,666 $620,801 $1,254,741 $1,976,442 $3,057,800 $742,799
2011 $347,059 $562,312 $1,111,654 $2,265,538 $2,733,000 $660,670
2010 $359,230 $592,276 $1,125,799 $1,822,392 $2,249,500 $729,000
2009 $361,315 $579,100 $1,112,275 $2,020,593 $1,497,500 $607,033
2008 $445,191 $688,281 $1,324,720 $3,306,556 $2,950,000 $742,354
2007 $398,228 $636,651 $1,355,610 $3,245,255 $4,580,000 $800,867
2006 $383,137 $606,111 $1,248,893 $2,817,727 $731,902
Studio 1 Bedroom 2 Bedroom 3 Bedroom 4+ Bedroom ALL
2015 $400,000 $637,500 $1,254,500 $2,625,000 $2,527,500 $595,000
2014 $380,000 $630,000 $1,210,000 $2,000,000 $5,450,000 $620,000
2013 $385,000 $595,000 $1,214,422 $1,985,587 $2,700,000 $580,000
2012 $345,000 $575,000 $1,100,000 $1,850,000 $3,100,000 $542,500
2011 $340,000 $540,000 $977,750 $1,737,500 $3,300,000 $529,000
2010 $355,000 $561,500 $999,500 $1,650,000 $2,249,500 $570,000
2009 $352,500 $550,000 $1,050,000 $1,875,000 $1,497,500 $509,400
2008 $432,500 $664,000 $1,200,000 $3,400,000 $2,950,000 $585,000
2007 $390,000 $600,000 $1,235,000 $2,825,000 $4,920,000 $590,000
2006 $375,000 $599,000 $1,100,000 $2,000,000 $575,000
Studio 1 Bedroom 2 Bedroom 3 Bedroom 4+ Bedroom ALL
2015 $797 $901 $1,123 $1,514 $1,076 $972
2014 $822 $883 $1,115 $1,328 $1,325 $930
2013 $834 $871 $1,022 $1,130 $1,143 $898
2012 $740 $822 $1,013 $1,074 $947 $843
2011 $708 $792 $902 $1,175 $813 $799
2010 $748 $815 $954 $975 $882 $841
2009 $759 $814 $897 $940 $491 $805
2008 $906 $951 $1,073 $1,084 $1,135 $956
2007 $846 $890 $1,099 $1,218 $1,153 $935
2006 $767 $810 $958 $1,256 $841
Studio 1 Bedroom 2 Bedroom 3 Bedroom 4+ Bedroom ALL
2015 201 310 88 20 2 621
2014 276 501 175 46 6 1,004
2013 300 445 180 30 8 963
2012 206 346 116 33 9 710
2011 191 322 143 13 3 672
2010 126 279 137 25 2 569
2009 167 222 48 15 2 454
2008 228 227 94 9 1 559
2007 238 358 203 11 4 814
2006 190 231 140 11 572
Average Sales Price
Median Sales Price
Average Price Per Square Foot
Number of Sales
$0
$200
$400
$600
$800
$1,000
$1,200
20152014201320122011201020092008200720060
200
400
600
800
1,000
1,200
Price/sq. ft Number of salesMatrix Current Year % Chg Prior Year % Chg Prior Decade
Average Sales Price $759,491 -8.1% $826,793 3.8% $731,902
Average Price Per Sq. Ft $972 4.5% $930 15.6% $841
Median Sales Price $595,000 -4.0% $620,000 3.5% $575,000
Number of Sales 621 -38.1% 1,004 8.6% 572

44
DOWNTOWNMANHATTAN DECADE
2006-2015
Visit our website to browse listings and learn more about market trends
UNION SQUARE/GRAMERCY/KIPS BAY/MURRAY HILL CONDOS
Average Price Per Square Foot / Number of Sales
BoundaryNorth: East 42md StreetSouth: East 14th StreetEast: East RiverWest: Avenue of the Americas
Studio 1 Bedroom 2 Bedroom 3 Bedroom 4+ Bedroom ALL
2015 $596,337 $1,048,122 $1,947,231 $3,055,729 $10,304,699 $1,633,164
2014 $663,054 $1,257,900 $2,241,029 $4,276,631 $8,409,635 $2,102,661
2013 $696,856 $1,085,482 $2,050,259 $3,152,346 $9,778,525 $1,931,380
2012 $599,648 $990,420 $1,768,498 $3,462,634 $6,605,808 $1,575,108
2011 $555,931 $872,196 $1,774,553 $3,702,057 $7,639,511 $1,528,517
2010 $444,271 $776,272 $1,599,983 $2,888,186 $6,178,960 $1,497,348
2009 $553,600 $879,809 $1,519,760 $2,991,957 $4,404,038 $1,432,505
2008 $649,244 $937,612 $1,859,852 $3,215,805 $5,088,975 $1,482,486
2007 $579,481 $883,803 $1,660,304 $3,892,102 $4,036,500 $1,416,958
2006 $590,154 $763,275 $1,451,528 $2,980,400 $4,404,286 $1,150,720
Studio 1 Bedroom 2 Bedroom 3 Bedroom 4+ Bedroom ALL
2015 $587,500 $964,000 $1,727,875 $2,815,000 $7,739,788 $1,286,000
2014 $615,000$1,123,650 $2,095,000 $2,900,000 $6,750,000 $1,475,000
2013 $640,000 $990,000 $1,900,000 $2,825,000 $7,500,000 $1,275,000
2012 $542,025 $869,000 $1,760,000 $3,360,225 $6,000,000 $1,030,000
2011 $478,000 $830,000 $1,530,000 $3,150,000 $6,700,000 $1,060,000
2010 $440,000 $748,413 $1,420,000 $2,516,139 $5,292,983 $1,050,000
2009 $475,000 $810,000 $1,400,093 $2,525,000 $3,150,000 $1,105,000
2008 $565,000 $895,000 $1,650,000 $3,425,000 $4,989,425 $1,252,447
2007 $560,000 $841,000 $1,527,375 $3,818,437 $4,036,500 $1,160,805
2006 $485,000 $745,000 $1,400,000 $2,595,000 $4,300,000 $915,000
Studio 1 Bedroom 2 Bedroom 3 Bedroom 4+ Bedroom ALL
2015 $1,203 $1,420 $1,475 $1,649 $2,565 $1,557
2014 $1,162 $1,521 $1,725 $2,022 $2,598 $1,647
2013 $1,197 $1,253 $1,452 $1,557 $2,277 $1,386
2012 $1,113 $1,251 $1,341 $1,624 $1,780 $1,314
2011 $1,049 $1,147 $1,294 $1,652 $1,973 $1,247
2010 $909 $1,000 $1,167 $1,362 $1,663 $1,123
2009 $1,010 $1,076 $1,097 $1,393 $1,387 $1,127
2008 $1,145 $1,178 $1,349 $1,354 $1,518 $1,272
2007 $1,072 $1,122 $1,206 $1,361 $1,342 $1,174
2006 $960 $1,009 $1,058 $1,248 $1,165 $1,033
Studio 1 Bedroom 2 Bedroom 3 Bedroom 4+ Bedroom ALL
2015 32 186 118 25 8 369
2014 57 221 209 61 17 565
2013 61 222 174 70 20 547
2012 67 239 153 61 12 532
2011 77 225 204 54 9 569
2010 41 192 191 66 15 505
2009 49 151 141 58 8 407
2008 78 243 393 20 4 738
2007 69 362 531 47 2 1,011
2006 54 208 232 10 7 511
Average Sales Price
Median Sales Price
Average Price Per Square Foot
Number of Sales
$0
$400
$800
$1,200
$1,600
$2,000
20152014201320122011201020092008200720060
300
600
900
1,200
1,500
Price/sq. ft Number of salesMatrix Current Year % Chg Prior Year % Chg Prior Decade
Average Sales Price $1,633,164 -22.3% $2,102,661 41.9% $1,150,720
Average Price Per Sq. Ft $1,557 -5.5% $1,647 50.7% $1,033
Median Sales Price $1,286,000 -12.8% $1,475,000 40.5% $915,000
Number of Sales 369 -34.7% 565 -27.8% 511

45
DOWNTOWNMANHATTAN DECADE
2006-2015
Visit our website to browse listings and learn more about market trends
CHELSEA CO-OPS
Average Price Per Square Foot / Number of Sales
BoundaryNorth: West 34th StreetSouth: West 14th StreetEast: Avenue of the AmericasWest: Hudson River
Studio 1 Bedroom 2 Bedroom 3 Bedroom 4+ Bedroom ALL
2015 $485,251 $925,336 $1,719,530 $3,385,286 $4,025,000 $1,232,938
2014 $456,051 $797,426 $1,691,954 $2,813,280 $5,068,333 $1,088,974
2013 $449,792 $794,850 $1,448,697 $2,253,533 $3,965,283 $983,455
2012 $438,878 $705,895 $1,324,780 $1,955,547 $3,633,333 $893,144
2011 $386,100 $626,332 $1,369,499 $1,972,667 $4,335,000 $928,077
2010 $412,772 $640,954 $1,341,358 $4,246,980 $4,603,720 $1,023,521
2009 $411,832 $655,549 $1,499,107 $1,940,100 $4,465,000 $933,986
2008 $483,514 $792,101 $1,909,866 $3,392,650 $7,254,500 $1,094,815
2007 $429,656 $682,350 $1,466,276 $3,225,000 $4,039,233 $970,264
2006 $460,756 $628,721 $1,333,844 $4,350,000 $853,900
Studio 1 Bedroom 2 Bedroom 3 Bedroom 4+ Bedroom ALL
2015 $515,000 $800,000 $1,500,000 $2,862,500 $4,025,000 $854,500
2014 $450,000 $720,000 $1,650,000 $2,480,000 $5,100,000 $750,000
2013 $433,000 $745,000 $1,300,000 $2,270,000 $4,025,000 $740,000
2012 $385,000 $680,000 $1,225,000 $1,849,000 $3,300,000 $665,000
2011 $382,500 $585,000 $1,200,000 $2,200,000 $2,525,000 $685,000
2010 $415,000 $640,000 $1,175,000 $2,175,000 $4,825,000 $665,000
2009 $399,000 $622,500 $1,380,000 $1,900,000 $4,465,000 $630,000
2008 $480,000 $770,000 $1,820,000 $4,276,650 $7,254,500 $784,052
2007 $415,000 $650,000 $1,195,000 $2,800,000 $2,800,000 $689,000
2006 $475,000 $595,000 $1,250,000 $3,750,000 $595,000
Studio 1 Bedroom 2 Bedroom 3 Bedroom 4+ Bedroom ALL
2015 $939 $1,158 $1,326 $1,610 $2,118 $1,284
2014 $909 $1,037 $1,344 $1,439 $1,552 $1,110
2013 $899 $1,017 $1,114 $1,171 $1,443 $1,023
2012 $869 $941 $1,021 $1,177 $1,131 $956
2011 $775 $862 $1,124 $912 $1,431 $934
2010 $816 $874 $1,069 $1,592 $1,351 $952
2009 $800 $889 $1,134 $1,143 $1,626 $950
2008 $1,007 $1,061 $1,313 $1,532 $2,134 $1,129
2007 $889 $972 $1,269 $1,277 $1,188 $1,059
2006 $866 $875 $989 $1,140 $911
Studio 1 Bedroom 2 Bedroom 3 Bedroom 4+ Bedroom ALL
2015 49 119 55 19 2 244
2014 68 175 79 20 3 345
2013 84 154 63 21 6 328
2012 74 134 61 15 6 290
2011 58 105 76 12 5 256
2010 46 95 45 10 5 201
2009 37 53 30 10 2 132
2008 79 100 70 4 2 255
2007 63 101 86 5 3 258
2006 48 80 55 3 186
Average Sales Price
Median Sales Price
Average Price Per Square Foot
Number of Sales
$0
$300
$600
$900
$1,200
$1,500
20152014201320122011201020092008200720060
100
200
300
400
500
Price/sq. ft Number of salesMatrix Current Year % Chg Prior Year % Chg Prior Decade
Average Sales Price $1,232,938 13.2% $1,088,974 44.4% $853,900
Average Price Per Sq. Ft $1,284 15.7% $1,110 40.9% $911
Median Sales Price $854,500 13.9% $750,000 43.6% $595,000
Number of Sales 244 -29.3% 345 31.2% 186

46
DOWNTOWNMANHATTAN DECADE
2006-2015
Visit our website to browse listings and learn more about market trends
CHELSEA CONDOS
Average Price Per Square Foot / Number of Sales
BoundaryNorth: West 34th StreetSouth: West 14th StreetEast: Avenue of the AmericasWest: Hudson River
Studio 1 Bedroom 2 Bedroom 3 Bedroom 4+ Bedroom ALL
2015 $654,400 $1,286,852 $2,725,049 $5,077,114 $8,665,319 $2,761,075
2014 $767,829 $1,299,616 $2,575,563 $4,997,243$13,619,584 $3,024,330
2013 $665,118 $1,286,632 $2,541,490 $4,764,952 $7,424,820 $2,477,205
2012 $1,009,019 $1,092,313 $1,925,147 $3,050,302 $5,785,044 $1,804,167
2011 $647,795 $898,876 $1,586,118 $3,691,213 $4,557,417 $1,934,052
2010 $619,141 $865,297 $1,558,144 $2,572,442 $5,985,163 $1,457,698
2009 $767,167 $959,720 $1,902,756 $3,127,625 $6,600,500 $1,616,022
2008 $527,518 $884,368 $1,774,099 $3,712,360 $5,400,000 $1,379,740
2007 $668,447 $870,499 $1,691,250 $2,710,000 $1,363,272
2006 $664,556 $865,900 $1,672,779 $2,818,750 $5,800,000 $1,468,694
Studio 1 Bedroom 2 Bedroom 3 Bedroom 4+ Bedroom ALL
2015 $595,000 $1,110,000 $2,560,000 $4,350,000 $7,937,500 $1,977,500
2014 $693,334 $1,095,000 $2,375,000 $4,150,000 $9,042,060 $2,000,000
2013 $552,000 $1,326,955 $2,300,000 $4,000,000 $8,950,000 $1,920,000
2012 $743,068 $945,000 $1,800,000 $2,748,900 $5,000,000 $1,430,000
2011 $544,000 $825,000 $1,629,200 $2,800,000 $5,093,375 $1,575,000
2010 $520,000 $775,000 $1,520,000 $3,245,000 $5,500,000 $1,500,000
2009 $620,000 $820,000 $1,500,000 $2,341,975 $4,900,000 $1,190,000
2008 $655,000 $955,000 $1,700,000 $3,500,000 $8,150,000 $1,490,000
2007 $510,000 $800,000 $1,608,835 $2,750,000 $5,400,000 $1,150,000
2006 $585,000 $760,000 $1,599,000 $2,950,000 $1,320,000
Studio 1 Bedroom 2 Bedroom 3 Bedroom 4+ Bedroom ALL
2015 $1,125 $1,589 $1,901 $1,976 $2,550 $1,906
2014 $1,192 $1,521 $1,802 $2,295 $3,273 $1,832
2013 $1,097 $1,381 $1,664 $2,051 $1,845 $1,598
2012 $788 $1,136 $1,309 $1,412 $1,642 $1,224
2011 $1,109 $1,182 $1,330 $1,459 $1,235 $1,303
2010 $1,066 $1,071 $1,139 $1,555 $1,650 $1,230
2009 $1,051 $1,129 $1,114 $1,271 $1,574 $1,146
2008 $1,220 $1,211 $1,346 $1,388 $1,816 $1,303
2007 $977 $1,080 $1,222 $1,276 $1,317 $1,138
2006 $1,089 $1,014 $1,062 $1,119 $1,047
Studio 1 Bedroom 2 Bedroom 3 Bedroom 4+ Bedroom ALL
2015 21 91 107 43 14 276
2014 17 127 130 58 19 351
2013 17 123 137 52 10 339
2012 27 119 118 45 9 318
2011 24 84 152 73 12 345
2010 22 84 138 75 12 331
2009 27 138 146 48 8 367
2008 30 144 303 12 3 492
2007 73 173 217 25 1 489
2006 15 103 166 5 289
Average Sales Price
Median Sales Price
Average Price Per Square Foot
Number of Sales
$0
$400
$800
$1,200
$1,600
$2,000
20152014201320122011201020092008200720060
150
300
450
600
750
Price/sq. ft Number of salesMatrix Current Year % Chg Prior Year % Chg Prior Decade
Average Sales Price $2,761,075 -8.7% $3,024,330 102.5% $1,363,272
Average Price Per Sq. Ft $1,906 4.0% $1,832 82.0% $1,047
Median Sales Price $1,977,500 -1.1% $2,000,000 49.8% $1,320,000
Number of Sales 276 -21.4% 351 -4.5% 289

47
DOWNTOWNMANHATTAN DECADE
2006-2015
Visit our website to browse listings and learn more about market trends
GREENWICH VILLAGE CO-OPS
Average Price Per Square Foot / Number of Sales
BoundaryNorth: 14th StreetSouth: Houston StreetEast: BroadwayWest: Hudson River
Studio 1 Bedroom 2 Bedroom 3 Bedroom 4+ Bedroom ALL
2015 $500,770 $996,044 $2,001,031 $3,658,988 $5,158,333 $1,364,962
2014 $525,546 $970,730 $1,805,353 $3,223,588 $4,637,633 $1,235,998
2013 $511,414 $886,207 $1,636,384 $3,095,767 $5,718,050 $1,199,656
2012 $460,958 $864,984 $1,764,310 $2,973,342 $5,536,347 $1,228,676
2011 $415,386 $727,689 $1,469,222 $2,749,104 $12,104,950 $1,042,495
2010 $415,892 $691,320 $1,398,144 $2,787,611 $4,223,750 $1,047,917
2009 $409,401 $731,244 $1,338,570 $1,931,694 $7,681,000 $961,011
2008 $479,818 $808,794 $1,603,694 $3,952,600 $1,017,246
2007 $470,250 $721,868 $1,479,759 $2,814,200 $2,625,000 $937,963
2006 $465,392 $710,980 $1,454,939 $2,906,900 $3,780,000 $891,690
Studio 1 Bedroom 2 Bedroom 3 Bedroom 4+ Bedroom ALL
2015 $485,000 $878,500 $1,850,000 $3,350,000 $4,725,000 $957,500
2014 $499,000 $830,000 $1,590,000 $2,875,000 $3,365,000 $895,000
2013 $486,500 $799,000 $1,550,000 $3,050,000 $6,700,000 $815,000
2012 $442,000 $751,000 $1,575,000 $2,965,000 $6,100,000 $800,000
2011 $395,000 $667,000 $1,300,000 $2,700,000 $12,104,938 $739,000
2010 $425,000 $675,000 $1,310,000 $2,400,000 $4,995,000 $765,000
2009 $415,000 $679,000 $1,170,000 $1,950,000$11,000,000 $700,000
2008 $465,000 $764,891 $1,400,000 $4,250,000 $774,700
2007 $436,000 $675,000 $1,310,000 $3,110,000 $2,625,000 $699,000
2006 $410,000 $685,000 $1,260,000 $2,700,000 $3,780,000 $699,000
Studio 1 Bedroom 2 Bedroom 3 Bedroom 4+ Bedroom ALL
2015 $946 $1,127 $1,440 $1,691 $1,833 $1,302
2014 $1,003 $1,156 $1,336 $1,507 $1,862 $1,191
2013 $944 $1,105 $1,256 $1,576 $1,944 $1,146
2012 $900 $1,084 $1,350 $1,516 $1,875 $1,149
2011 $868 $968 $1,190 $1,371 $3,416 $1,046
2010 $847 $923 $1,130 $1,264 $1,645 $1,002
2009 $792 $960 $1,094 $1,078 $2,345 $973
2008 $1,002 $1,122 $1,275 $1,634 $1,144
2007 $981 41,031 $1,212 $1,248 $955 $1,077
2006 $903 $963 $1,091 $1,215 $879 $988
Studio 1 Bedroom 2 Bedroom 3 Bedroom 4+ Bedroom ALL
2015 99 342 142 43 6 632
2014 130 254 133 32 6 555
2013 159 274 118 52 10 613
2012 138 266 134 38 15 591
2011 97 201 143 24 2 467
2010 93 176 122 38 4 433
2009 70 117 56 18 4 265
2008 97 158 95 10 360
2007 128 209 153 10 2 502
2006 89 164 103 5 1 362
Average Sales Price
Median Sales Price
Average Price Per Square Foot
Number of Sales
$0
$300
$600
$900
$1,200
$1,500
20152014201320122011201020092008200720060
150
300
450
600
750
Price/sq. ft Number of salesMatrix Current Year % Chg Prior Year % Chg Prior Decade
Average Sales Price $1,364,962 10.4% $1,235,998 53.1% $891,690
Average Price Per Sq. Ft $1,302 9.3% $1,191 31.8% $988
Median Sales Price $957,500 7.0% $895,000 37.0% $699,000
Number of Sales 632 13.9% 555 74.6% 362

48
DOWNTOWNMANHATTAN DECADE
2006-2015
Visit our website to browse listings and learn more about market trends
GREENWICH VILLAGE CONDOS
Average Price Per Square Foot / Number of Sales
BoundaryNorth: 14th StreetSouth: Houston StreetEast: BroadwayWest: Hudson River
Studio 1 Bedroom 2 Bedroom 3 Bedroom 4+ Bedroom ALL
2015 $621,500 $2,098,218 $3,279,647 $6,508,362 $11,678,971 $4,564,039
2014 $1,012,796 $1,514,869 $3,373,453 $4,173,996 $6,494,000 $2,469,650
2013 $703,179 $1,490,620 $2,868,126 $6,659,267 $10,357,833 $3,229,906
2012 $838,592 $1,333,134 $2,356,809 $4,606,783 $2,298,414
2011 $533,236 $1,068,196 $2,617,316 $3,950,800 $8,530,836 $2,579,138
2010 $518,905 $915,077 $1,770,552 $3,311,033 $9,744,342 $2,812,713
2009 $684,158 $823,969 $1,872,427 $3,567,182 $9,960,840 $2,501,284
2008 $653,861 $1,071,998 $2,572,887 $6,518,180 $5,800,000 $2,046,932
2007 $569,028 $958,487 $2,243,008 $5,068,241 $7,680,000 $1,608,267
2006 $572,108 $1,127,624 $3,056,622 $4,664,918 $5,105,750 $2,150,071
Studio 1 Bedroom 2 Bedroom 3 Bedroom 4+ Bedroom ALL
2015 $707,000$1,480,000 $2,875,000 $6,547,002 $10,487,533 $3,025,000
2014 $750,000 $1,443,702 $3,150,000 $4,065,000 $5,200,000 $1,792,182
2013 $705,000 $1,100,000 $2,595,000 $5,460,000 $12,995,000 $2,100,000
2012 $567,000 $995,000 $2,086,256 $3,925,000 $1,700,000
2011 $535,000 $962,246 $2,200,000 $3,275,000 $7,375,000 $1,775,000
2010 $535,000 $825,000 $1,725,000 $3,151,000 $9,000,000 $1,756,481
2009 $578,000 $825,000 $1,650,000 $3,200,000 $11,500,000 $1,645,000
2008 $610,950 $920,000 $2,359,000 $5,850,000 $5,800,000 $1,250,000
2007 $496,860 $880,786 $1,995,000 $5,310,000 $7,680,000 $1,050,000
2006 $544,764 $950,000 $1,825,000 $3,500,000 $5,105,750 $1,225,000
Studio 1 Bedroom 2 Bedroom 3 Bedroom 4+ Bedroom ALL
2015 $1,349 $1,735 $2,068 $2,540 $3,121 $2,448
2014 $1,675 $1,729 $2,289 $2,164 $1,715 $1,931
2013 $1,236 $1,516 $1,676 $2,534 $2,355 $1,783
2012 $1,531 $1,620 $1,627 $1,946 $1,673
2011 $1,166 $1,382 $1,756 $1,826 $2,449 $1,642
2010 $1,022 $1,151 $1,340 $1,472 $2,206 $1,409
2009 $1,067 $1,012 $1,340 $1,648 $2,668 $1,411
2008 $1,289 $1,341 $1,556 $1,894 $1,211 $1,456
2007 $1,212 $1,277 $1,453 $1,660 $2,560 $1,353
2006 $1,185 $1,314 $1,801 $1,920 $1,663 $1,545
Studio 1 Bedroom 2 Bedroom 3 Bedroom 4+ Bedroom ALL
2015 8 82 74 52 32 248
2014 24 68 43 24 5 164
2013 14 64 54 36 6 174
2012 13 41 54 24 132
2011 12 56 49 29 10 156
2010 20 43 75 51 26 215
2009 19 26 52 34 10 141
2008 28 47 62 10 2 149
2007 76 76 100 17 1 270
2006 25 51 64 11 2 153
Average Sales Price
Median Sales Price
Average Price Per Square Foot
Number of Sales
$0
$560
$1,120
$1,680
$2,240
$2,800
20152014201320122011201020092008200720060
100
200
300
400
500
Price/sq. ft Number of salesMatrix Current Year % Chg Prior Year % Chg Prior Decade
Average Sales Price $4,564,039 84.8% $2,469,650 112.3% $2,150,071
Average Price Per Sq. Ft $2,448 26.8% $1,931 58.4% $1,545
Median Sales Price $3,025,000 68.8% $1,792,182 146.9% $1,225,000
Number of Sales 248 51.2% 164 62.1% 153

49
DOWNTOWNMANHATTAN DECADE
2006-2015
Visit our website to browse listings and learn more about market trends
EAST VILLAGE/LOWER EAST SIDE CO-OPS
Average Price Per Square Foot / Number of Sales
BoundaryNorth: 14th StreetSouth: Brooklyn BridgeEast: East RiverWest: Broadway
Studio 1 Bedroom 2 Bedroom 3 Bedroom 4+ Bedroom ALL
2015 $409,934 $652,327 $1,088,476 $2,036,667 $745,741
2014 $361,547 $686,732 $1,214,279 $3,155,086 $6,505,925 $1,065,364
2013 $472,120 $637,195 $972,614 $1,973,700 $5,175,000 $864,261
2012 $393,826 $672,082 $1,173,995 $1,548,833 $3,372,500 $864,510
2011 $366,358 $552,798 $1,125,799 $2,370,300 $9,681,250 $1,001,821
2010 $362,768 $578,180 $1,033,525 $1,877,115 $3,270,000 $778,110
2009 $372,768 $579,727 $949,967 $1,380,000 $636,249
2008 $453,479 $633,968 $1,398,937 $3,599,725 $6,100,000 $922,738
2007 $360,227 $589,308 $1,267,063 $2,743,125 $2,557,300 $858,622
2006 $383,477 $575,716 $1,110,416 $3,450,000 $8,650,000 $869,326
Studio 1 Bedroom 2 Bedroom 3 Bedroom 4+ Bedroom ALL
2015 $415,000 $600,000 $891,000 $1,875,000 $640,000
2014 $340,000 $580,000 $840,000 $3,693,750 $4,275,537 $650,000
2013 $380,000 $514,216 $695,000 $1,175,000 $6,400,000 $555,000
2012 $340,000 $470,000 $720,000 $792,500 $3,372,500 $540,000
2011 $375,000 $508,000 $870,000 $2,035,000$10,000,000 $570,000
2010 $380,000 $551,000 $850,000 $1,850,000 $3,270,000 $600,000
2009 $365,000 $538,000 $990,000 $1,660,000 $525,000
2008 $440,000 $622,000 $1,200,000 $4,068,900 $6,100,000 $650,000
2007 $339,000 $550,000 $1,075,000 $2,700,000 $2,557,275 $635,000
2006 $349,000 $535,000 $850,000 $3,450,000 $8,650,000 $622,500
Studio 1 Bedroom 2 Bedroom 3 Bedroom 4+ Bedroom ALL
2015 $815 $882 $1,012 $1,307 $938
2014 $730 $843 $1,027 $1,549 $2,233 $955
2013 $881 $863 $872 $1,043 $1,624 $889
2012 $792 $914 $903 $872 $1,226 $895
2011 $796 $770 $919 $1,133 $2,216 $875
2010 $744 $804 $833 $886 $861 $807
2009 $771 $786 $821 $952 $797
2008 $907 $905 $1,056 $1,369 $1,525 $969
2007 $824 $852 $975 $1,059 $1,001 $898
2006 $782 $754 $874 $1,748 $2,048 $831
Studio 1 Bedroom 2 Bedroom 3 Bedroom 4+ Bedroom ALL
2015 41 152 59 6 258
2014 45 207 138 22 8 420
2013 51 178 122 27 4 382
2012 35 146 88 18 2 289
2011 38 111 96 20 4 269
2010 34 81 53 13 1 182
2009 40 59 30 6 135
2008 58 63 62 4 1 188
2007 60 135 117 8 2 322
2006 31 79 105 2 1 218
Average Sales Price
Median Sales Price
Average Price Per Square Foot
Number of Sales
$0
$300
$600
$900
$1,200
$1,500
20152014201320122011201020092008200720060
100
200
300
400
500
Price/sq. ft Number of salesMatrix Current Year % Chg Prior Year % Chg Prior Decade
Average Sales Price $745,741 -30.0% $1,065,364 -14.2% $869,326
Average Price Per Sq. Ft $938 -1.8% $955 12.9% $831
Median Sales Price $640,000 -1.5% $650,000 2.8% $622,500
Number of Sales 258 -38.6% 420 18.3% 218

50
DOWNTOWNMANHATTAN DECADE
2006-2015
Visit our website to browse listings and learn more about market trends
SOHO/TRIBECA CO-OPS
Average Price Per Square Foot / Number of Sales
Note: Price break-out by number of bedrooms skewed by loft market. Suggested emphasis on “All” category
BoundaryNorth: Houston StreetSouth: Vesey StreetEast: BroadwayWest: Hudson River
Studio 1 Bedroom 2 Bedroom 3 Bedroom 4+ Bedroom ALL
2015 $425,333 $1,352,517 $2,826,850 $4,987,186 $6,600,000 $2,890,898
2014 $1,549,292 $1,191,495 $2,234,303 $3,756,176 $8,684,800 $2,941,899
2013 $725,706 $1,209,073 $2,375,809 $3,340,767 $5,641,900 $2,220,760
2012 $989,636 $1,075,593 $2,010,985 $3,623,375 $6,524,267 $2,103,762
2011 $374,250 $790,932 $2,017,902 $2,762,114 $10,237,500 $1,880,766
2010 $295,000 $804,906 $1,650,361 $2,936,924 $7,075,000 $2,200,309
2009 $824,900 $786,471 $1,715,000 $2,817,353 $3,138,333 $1,756,411
2008 $416,460 $1,182,207 $2,641,277 $3,968,889 $5,825,000 $2,544,222
2007 $574,533 $1,032,679 $1,985,965 $3,254,875 $5,937,750 $1,814,479
2006 $561,273 $921,125 $1,939,732 $2,640,000 $4,300,000 $1,632,348
Studio 1 Bedroom 2 Bedroom 3 Bedroom 4+ Bedroom ALL
2015 $386,500 $1,210,000$2,600,000 $3,525,000 $5,600,000 $2,360,000
2014 $472,937 $777,165 $2,100,000 $3,795,000 $6,200,000 $2,100,000
2013 $440,000 $1,100,000 $2,350,000 $3,580,000 $5,225,000 $2,127,000
2012 $475,000 $895,000 $2,010,000 $3,200,000 $5,091,250 $1,740,000
2011 $405,000 $650,000 $1,950,000 $3,025,000 $10,237,500 $1,749,000
2010 $325,000 $812,000 $1,660,000 $2,930,478 $6,500,000 $1,900,000
2009 $900,000 $740,000 $1,475,000 $2,465,000 $3,400,000 $1,475,000
2008 $423,000 $805,000 $2,437,500 $3,325,000 $6,000,000 $2,350,000
2007 $400,000 $757,000 $1,895,000 $2,999,000 $5,937,750 $1,650,000
2006 $315,000 779,00 $1,695,000 $2,755,000 $4,300,000 $1,500,000
Studio 1 Bedroom 2 Bedroom 3 Bedroom 4+ Bedroom ALL
2015 $890 $1,208 $1,565 $2,094 $2,185 $1,711
2014 $1,900 $1,187 $1,385 $1,572 $2,074 $1,500
2013 $945 $1,110 $1,326 $1,397 $1,569 $1,250
2012 $755 $1,010 $1,134 $1,332 $1,821 $1,123
2011 $803 $934 $1,206 $1,093 $2,567 $1,120
2010 $664 $854 $949 $1,223 $1,762 $1,059
2009 $535 $931 $1,087 $1,134 $1,158 $1,021
2008 $996 $1,145 $1,393 $1,641 $1,350 $1,337
2007 $863 $1,042 $1,145 $944 $1,697 $1,081
2006 $1,041 $965 $925 $895 $1,139 $951
Studio 1 Bedroom 2 Bedroom 3 Bedroom 4+ Bedroom ALL
2015 3 30 25 21 3 82
2014 13 37 38 29 15 132
2013 16 37 47 33 5 138
2012 11 41 27 20 6 105
2011 10 19 49 14 2 94
2010 6 16 36 33 6 97
2009 5 17 25 17 3 67
2008 10 15 61 9 7 102
2007 15 14 57 8 2 96
2006 11 24 47 9 2 93
Average Sales Price
Median Sales Price
Average Price Per Square Foot
Number of Sales
$0
$400
$800
$1,200
$1,600
$2,000
20152014201320122011201020092008200720060
50
100
150
200
250
Price/sq. ft Number of salesMatrix Current Year % Chg Prior Year % Chg Prior Decade
Average Sales Price $2,890,898 -1.7% $2,941,899 77.1% $1,632,348
Average Price Per Sq. Ft $1,711 14.1% $1,500 79.9% $951
Median Sales Price $2,360,000 12.4% $2,100,000 57.3% $1,500,000
Number of Sales 82 -37.9% 132 -11.8% 93

51
DOWNTOWNMANHATTAN DECADE
2006-2015
Visit our website to browse listings and learn more about market trends
SOHO/TRIBECA CONDOS
Average Price Per Square Foot / Number of Sales
Note: Price break-out by number of bedrooms skewed by loft market. Suggested emphasis on “All” category
BoundaryNorth: Houston StreetSouth: Vesey StreetEast: BroadwayWest: Hudson River
Studio 1 Bedroom 2 Bedroom 3 Bedroom 4+ Bedroom ALL
2015 $466,188 $1,397,634 $2,649,828 $4,713,854 $8,791,941 $3,898,294
2014 $929,315 $1,537,323 $2,859,200 $4,240,383 $8,142,776 $3,254,919
2013 $1,618,560 $1,485,313 $2,847,148 $4,156,600 $7,368,768 $3,256,087
2012 $1,240,318 $1,424,235 $2,342,466 $3,981,119 $7,291,779 $3,082,332
2011 $883,938 $1,121,368 $2,162,376 $3,555,940 $5,531,453 $2,624,046
2010 $735,868 $955,295 $1,910,488 $3,346,565 $5,693,185 $2,608,415
2009 $1,130,750 $1,052,385 $2,160,772 $3,097,592 $6,024,459 $2,763,633
2008 $840,950 $1,195,291 $2,332,039 $3,730,099 $8,365,244 $2,539,184
2007 $964,193 $887,519 $2,262,926 $4,316,467 $7,352,258 $2,382,713
2006 $1,629,167 $1,084,441 $2,390,888 $3,975,614 $5,750,231 $2,557,358
Studio 1 Bedroom 2 Bedroom 3 Bedroom 4+ Bedroom ALL
2015 $444,000 $977,500 $2,499,803 $4,650,000 $6,000,000 $3,100,000
2014 $763,688 $1,425,000 $2,520,000 $3,632,850 $6,700,000 $2,800,000
2013 $978,000 $1,323,000 $2,675,000 $4,055,000 $6,600,000 $2,835,826
2012 $980,000 $1,110,000 $2,174,885 $3,450,000 $5,702,200 $2,463,000
2011 $869,781 $975,000 $2,062,500 $3,207,487 $4,970,000 $2,150,000
2010 $580,000 $820,000 $1,705,569 $3,000,000 $5,800,000 $2,100,000
2009 $1,367,500 $935,000 $2,150,000 $2,810,370 $4,400,000 $2,450,000
2008 $672,045 $1,035,000 $2,199,420 $3,384,000 $5,620,740 $2,255,000
2007 $615,000 $800,000 $1,985,587 $3,300,000 $5,700,000 $1,925,000
2006 $1,195,000 $990,000 $2,150,000 $3,300,000 $5,200,000 $2,140,000
Studio 1 Bedroom 2 Bedroom 3 Bedroom 4+ Bedroom ALL
2015 $852 $1,336 $1,761 $2,054 $2,577 $2,034
2014 $1,494 $1,509 $1,773 $1,770 $2,194 $1,734
2013 $1,768 $1,413 $1,553 $1,715 $1,846 $1,600
2012 $1,299 $1,372 $1,377 $1,498 $1,717 $1,443
2011 $1,351 $1,357 $1,319 $1,469 $1,376 $1,379
2010 $1,595 $1,135 $1,237 $1,414 $1,584 $1,342
2009 $1,654 $971 $1,228 $1,327 $1,860 $1,307
2008 $921 $1,240 $1,360 $1,467 $2,281 $1,373
2007 $1,166 $1,128 $1,322 $1,416 $1,701 $1,304
2006 $1,136 $1,109 $1,253 $1,358 $1,417 $1,251
Studio 1 Bedroom 2 Bedroom 3 Bedroom 4+ Bedroom ALL
2015 4 60 153 129 51 397
2014 26 60 145 120 21 372
2013 10 63 172 106 25 376
2012 17 79 124 100 39 359
2011 21 71 136 115 34 377
2010 19 44 130 161 26 380
2009 4 26 82 86 22 220
2008 12 45 248 67 9 381
2007 14 103 354 81 12 564
2006 6 39 169 35 13 262
Average Sales Price
Median Sales Price
Average Price Per Square Foot
Number of Sales
$0
$500
$1,000
$1,500
$2,000
$2,500
20152014201320122011201020092008200720060
200
400
600
800
1,000
Price/sq. ft Number of salesMatrix Current Year % Chg Prior Year % Chg Prior Decade
Average Sales Price $3,898,294 19.8% $3,254,919 52.4% $2,557,358
Average Price Per Sq. Ft $2,034 17.3% $1,734 62.6% $1,251
Median Sales Price $3,100,000 10.7% $2,800,000 44.8% $2,140,400
Number of Sales 397 6.7% 372 51.5% 262

52
DOWNTOWNMANHATTAN DECADE
2006-2015
Visit our website to browse listings and learn more about market trends
BATTERY PARK CITY CONDOS
Average Price Per Square Foot / Number of Sales
BoundaryNorth: Chambers StreetSouth: Battery PlaceEast: West StreetWest: Hudson River
Studio 1 Bedroom 2 Bedroom 3 Bedroom 4+ Bedroom ALL
2015 $448,000 $773,202 $2,071,500 $3,078,517 $5,122,836 $1,918,753
2014 $790,500 $743,060 $1,624,730 $3,246,003 $8,816,250 $1,565,820
2013 $588,300 $739,385 $1,259,323 $2,316,807 $2,933,333 $1,046,948
2012 $519,133 $783,740 $1,182,614 $2,386,350 $3,135,640 $1,162,044
2011 $408,665 $561,309 $1,424,221 $2,361,906 $3,960,857 $1,203,659
2010 $377,580 $551,149 $1,509,638 $2,231,697 $5,784,880 $1,508,016
2009 $404,750 $919,611 $1,588,617 $2,697,681 $7,422,800 $1,827,138
2008 $450,707 $730,977 $1,947,890 $3,248,571 $1,270,406
2007 $413,214 $570,017 $1,375,000 $4,147,500 $810,854
2006 $416,000 $551,643 $1,033,463 $2,000,000 $722,188
Studio 1 Bedroom 2 Bedroom 3 Bedroom 4+ Bedroom ALL
2015 $580,000 $730,000 $2,100,000 $2,916,013 $5,422,181 $1,665,000
2014 $634,200 $622,500 $1,515,000 $3,014,020$11,700,000 $990,000
2013 $560,000 $665,000 $1,200,000 $2,367,889 $2,700,000 $748,413
2012 $525,000 $687,000 $1,100,000 $2,310,000 $4,000,000 $870,000
2011 $415,740 $491,790 $1,272,812 $2,200,000 $3,930,000 $834,965
2010 $382,500 $455,500 $1,545,000 $2,341,975 $3,999,000 $1,400,550
2009 $419,000 $850,000 $1,565,000 $2,405,000 $7,731,250 $1,550,000
2008 $425,000 $745,000 $1,645,000 $3,200,000 $880,000
2007 $399,000 $534,500 $1,150,000 $4,147,500 $580,000
2006 395,000 519,000 830,000 200,000 615,000
Studio 1 Bedroom 2 Bedroom 3 Bedroom 4+ Bedroom ALL
2015 $862 $1,047 $1,538 $1,676 $1,975 $1,507
2014 $1,087 $995 $1,287 $1,643 $2,659 $1,222
2013 $936 $977 $1,047 $1,247 $1,195 $1,022
2012 $894 $1,015 $975 $1,149 $1,251 $1,025
2011 $714 $772 $1,029 $1,194 $1,282 $926
2010 $832 $803 $1,098 $1,147 $1,922 $1,040
2009 $771 $1,224 $1,170 $1,450 $2,054 $1,275
2008 $831 $1,006 $1,393 $1,413 $1,153
2007 $705 $826 $1,039 $1,535 $879
2006 $747 $802 $893 $800 $829
Studio 1 Bedroom 2 Bedroom 3 Bedroom 4+ Bedroom ALL
2015 5 32 35 14 7 93
2014 12 89 53 30 4 188
2013 28 124 40 29 3 224
2012 9 84 37 22 5 157
2011 23 81 58 33 7 202
2010 5 43 52 35 5 140
2009 4 37 46 32 4 123
2008 15 82 63 7 167
2007 7 63 20 2 92
2006 6 46 27 1 80
Average Sales Price
Median Sales Price
Average Price Per Square Foot
Number of Sales
Price/sq. ft Number of sales
$0
$400
$800
$1,200
$1,600
$2,000
20152014201320122011201020092008200720060
60
120
180
240
300Matrix Current Year % Chg Prior Year % Chg Prior Decade
Average Sales Price $1,918,753 22.5% $1,565,820 165.7% $722,188
Average Price Per Sq. Ft $1,507 23.3% $1,222 81.8% $829
Median Sales Price $1,665,000 68.2% $990,000 170.7% $615,000
Number of Sales 93 -50.5% 188 16.3% 80

53
DOWNTOWNMANHATTAN DECADE
2006-2015
Visit our website to browse listings and learn more about market trends
FINANCIAL DISTRICT CO-OPS
Average Price Per Square Foot / Number of Sales
BoundaryNorth: Vesey Street - Broadway - Brooklyn BridgeSouth: Battery ParkEast: East RiverWest: West Street
Studio 1 Bedroom 2 Bedroom 3 Bedroom 4+ Bedroom ALL
2015 $454,600 $799,891 $1,925,500 $1,935,000 $1,271,686
2014 $612,467 $928,854 $1,604,213 $2,614,945 $1,486,582
2013 $416,800 $725,115 $1,447,469 $2,278,964 $2,300,000 $1,348,665
2012 $311,250 $682,400 $1,125,500 $2,253,750 $3,575,000 $1,038,315
2011 $400,000 $585,389 $1,088,944 $1,450,000 $845,950
2010 $330,150 $577,722 $1,097,220 $1,528,333 $750,065
2009 $356,333 $748,500 $1,015,800 $2,501,500 $1,010,357
2008 $472,500 $800,800 $1,690,033 $1,102,465
2007 $431,667 $696,571 $1,644,787 $2,590,500 $1,425,928
2006 $385,000 $688,333 $907,222 $681,363
Studio 1 Bedroom 2 Bedroom 3 Bedroom 4+ Bedroom ALL
2015 $420,000 $750,368 $1,680,000 $1,900,000 $916,000
2014 $425,000 $925,000 $1,700,000 $2,750,000 $1,500,000
2013 $435,000 $672,500 $1,525,000 $2,174,600 $2,300,000 $1,210,000
2012 $310,000 $625,000 $1,300,000 $2,565,000 $3,575,000 $763,000
2011 $400,000 $566,000 $1,080,000 $1,450,000 $775,000
2010 $330,000 $525,000 $950,000 $1,075,000 $585,000
2009 $360,000 $837,000 $999,000 $2,501,500 $886,000
2008 $420,000 $805,000 $1,635,000 $889,000
2007 $395,000 $630,000 $1,550,000 $2,795,000 $1,295,000
2006 $365,000 $745,000 $935,000 $745,000
Studio 1 Bedroom 2 Bedroom 3 Bedroom 4+ Bedroom ALL
2015 $909 $1,002 $1,202 $946 $1,067
2014 $886 $983 $1,225 $1,368 $1,142
2013 $719 $813 $971 $1,172 $1,150 $951
2012 $568 $843 $912 $1,014 $1,152 $834
2011 $667 $705 $830 $854 $767
2010 $627 $688 $792 $774 $706
2009 $560 $837 $764 $1,264 $813
2008 $622 $940 $968 $857
2007 $785 $850 $1,142 $1,139 $1,056
2006 $717 $810 $752 $757
Studio 1 Bedroom 2 Bedroom 3 Bedroom 4+ Bedroom ALL
2015 5 15 12 5 37
2014 9 13 23 11 56
2013 5 13 16 11 1 46
2012 6 10 6 4 1 27
2011 1 9 9 1 20
2010 6 9 5 3 23
2009 3 4 5 2 14
2008 6 5 9 20
2007 3 14 39 4 60
2006 7 6 9 22
Average Sales Price
Median Sales Price
Average Price Per Square Foot
Number of Sales
$0
$200
$400
$600
$800
$1,000
$1,200
$1,400
20152014201320122011201020092008200720060
10
20
30
40
50
60
70
Price/sq. ft Number of salesMatrix Current Year % Chg Prior Year % Chg Prior Decade
Average Sales Price $1,271,686 -14.5% $1,486,582 86.6% $681,363
Average Price Per Sq. Ft $1,067 -6.6% $1,142 41.0% $757
Median Sales Price $916,000 -38.9% $1,500,000 23.0% $745,000
Number of Sales 37 -33.9% 56 68.2% 22
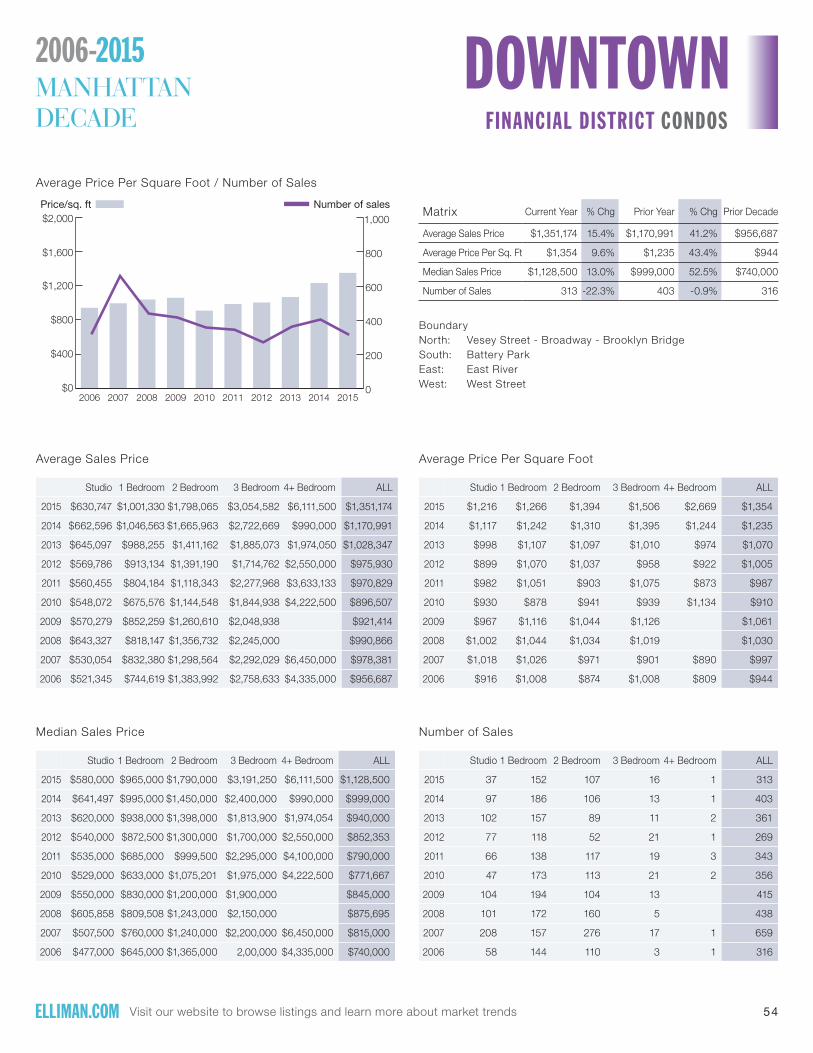
54
DOWNTOWNMANHATTAN DECADE
2006-2015
Visit our website to browse listings and learn more about market trends
FINANCIAL DISTRICT CONDOS
Average Price Per Square Foot / Number of Sales
BoundaryNorth: Vesey Street - Broadway - Brooklyn BridgeSouth: Battery ParkEast: East RiverWest: West Street
Studio 1 Bedroom 2 Bedroom 3 Bedroom 4+ Bedroom ALL
2015 $630,747 $1,001,330 $1,798,065 $3,054,582 $6,111,500 $1,351,174
2014 $662,596 $1,046,563 $1,665,963 $2,722,669 $990,000 $1,170,991
2013 $645,097 $988,255 $1,411,162 $1,885,073 $1,974,050 $1,028,347
2012 $569,786 $913,134 $1,391,190 $1,714,762 $2,550,000 $975,930
2011 $560,455 $804,184 $1,118,343 $2,277,968 $3,633,133 $970,829
2010 $548,072 $675,576 $1,144,548 $1,844,938 $4,222,500 $896,507
2009 $570,279 $852,259 $1,260,610 $2,048,938 $921,414
2008 $643,327 $818,147 $1,356,732 $2,245,000 $990,866
2007 $530,054 $832,380 $1,298,564 $2,292,029 $6,450,000 $978,381
2006 $521,345 $744,619 $1,383,992 $2,758,633 $4,335,000 $956,687
Studio 1 Bedroom 2 Bedroom 3 Bedroom 4+ Bedroom ALL
2015 $580,000 $965,000 $1,790,000 $3,191,250 $6,111,500 $1,128,500
2014 $641,497 $995,000 $1,450,000 $2,400,000 $990,000 $999,000
2013 $620,000 $938,000 $1,398,000 $1,813,900 $1,974,054 $940,000
2012 $540,000 $872,500 $1,300,000 $1,700,000 $2,550,000 $852,353
2011 $535,000 $685,000 $999,500 $2,295,000 $4,100,000 $790,000
2010 $529,000 $633,000 $1,075,201 $1,975,000 $4,222,500 $771,667
2009 $550,000 $830,000 $1,200,000 $1,900,000 $845,000
2008 $605,858 $809,508 $1,243,000 $2,150,000 $875,695
2007 $507,500 $760,000 $1,240,000 $2,200,000 $6,450,000 $815,000
2006 $477,000 $645,000 $1,365,000 2,00,000 $4,335,000 $740,000
Studio 1 Bedroom 2 Bedroom 3 Bedroom 4+ Bedroom ALL
2015 $1,216 $1,266 $1,394 $1,506 $2,669 $1,354
2014 $1,117 $1,242 $1,310 $1,395 $1,244 $1,235
2013 $998 $1,107 $1,097 $1,010 $974 $1,070
2012 $899 $1,070 $1,037 $958 $922 $1,005
2011 $982 $1,051 $903 $1,075 $873 $987
2010 $930 $878 $941 $939 $1,134 $910
2009 $967 $1,116 $1,044 $1,126 $1,061
2008 $1,002 $1,044 $1,034 $1,019 $1,030
2007 $1,018 $1,026 $971 $901 $890 $997
2006 $916 $1,008 $874 $1,008 $809 $944
Studio 1 Bedroom 2 Bedroom 3 Bedroom 4+ Bedroom ALL
2015 37 152 107 16 1 313
2014 97 186 106 13 1 403
2013 102 157 89 11 2 361
2012 77 118 52 21 1 269
2011 66 138 117 19 3 343
2010 47 173 113 21 2 356
2009 104 194 104 13 415
2008 101 172 160 5 438
2007 208 157 276 17 1 659
2006 58 144 110 3 1 316
Average Sales Price
Median Sales Price
Average Price Per Square Foot
Number of Sales
$0
$400
$800
$1,200
$1,600
$2,000
20152014201320122011201020092008200720060
200
400
600
800
1,000
Price/sq. ft Number of salesMatrix Current Year % Chg Prior Year % Chg Prior Decade
Average Sales Price $1,351,174 15.4% $1,170,991 41.2% $956,687
Average Price Per Sq. Ft $1,354 9.6% $1,235 43.4% $944
Median Sales Price $1,128,500 13.0% $999,000 52.5% $740,000
Number of Sales 313 -22.3% 403 -0.9% 316

55
UPTOWNMANHATTAN DECADE
2006-2015
Visit our website to browse listings and learn more about market trends
UPTOWN CO-OPS AND CONDOS
Average Price Per Square Foot / Number of Sales
Matrix Current Year % Chg Prior Year % Chg Prior Decade
Average Sales Price $637,224 15.2% $553,266 10.5% $576,928
Average Price Per Sq. Ft $739 22.6% $603 27.6% $579
Median Sales Price $517,500 14.8% $450,933 4.5% $495,000
Number of Sales 986 -5.8% 1,047 186.6% 344
BoundaryNorth: Harlem RiverSouth: West 116th Street and East 96th StreetEast: East RiverWest: Hudson River
Studio 1 Bedroom 2 Bedroom 3 Bedroom 4+ Bedroom ALL
2015 $327,950 $490,443 $758,588 $1,093,929 $1,096,375 $637,224
2014 $272,874 $401,606 $631,105 $977,425 $1,258,809 $553,266
2013 $264,947 $394,202 $578,978 $829,196 $1,218,095 $505,435
2012 $240,580 $389,894 $569,864 $843,303 $1,059,787 $515,124
2011 $273,206 $408,129 $635,024 $858,061 $1,571,389 $530,657
2010 $294,845 $429,158 $617,166 $902,422 $734,783 $518,631
2009 $318,449 $464,113 $691,308 $936,736 $875,000 $519,169
2008 $339,721 $491,895 $795,142 $2,132,460 $8,073,000 $579,874
2007 $306,741 $480,375 $774,390 $1,166,465 $8,300,000 $585,624
2006 $307,666 $417,011 $646,100 $1,447,039 $576,928
Studio 1 Bedroom 2 Bedroom 3 Bedroom 4+ Bedroom ALL
2015 $320,000 $439,500 $687,000 $999,900 $855,250 $517,500
2014 $212,940 $370,000 $588,548 $805,000 $945,874 $450,933
2013 $215,000 $372,000 $510,000 $760,000 $830,000 $434,500
2012 $225,000 $375,000 $535,000 $750,000 $550,000 $435,000
2011 $265,000 $369,760 $610,000 $840,000 $1,400,000 $450,000
2010 $285,000 $394,962 $615,000 $748,413 $975,000 $430,950
2009 $310,000 $470,000 $615,000 $928,700 $875,000 $450,000
2008 $330,000 $475,000 $682,720 $1,350,000 $8,073,000 $475,000
2007 $299,000 $455,034 $660,000 $1,013,158 $8,300,000 $465,000
2006 $335,000 $380,000 $575,000 $1,385,000 $495,000
Studio 1 Bedroom 2 Bedroom 3 Bedroom 4+ Bedroom ALL
2015 $677 $705 $762 $785 $690 $739
2014 $575 $580 $616 $654 $644 $603
2013 $585 $586 $566 $574 $639 $579
2012 $432 $518 $536 $570 $565 $521
2011 $577 $555 $546 $554 $615 $555
2010 $601 $609 $572 $606 $527 $594
2009 $655 $671 $608 $594 $549 $643
2008 $718 $730 $672 $990 $2,032 $711
2007 $726 $669 $652 $580 $1,937 $676
2006 $621 $567 $574 $644 $579
Studio 1 Bedroom 2 Bedroom 3 Bedroom 4+ Bedroom ALL
2015 125 422 298 125 16 986
2014 139 381 375 141 11 1,047
2013 108 465 374 111 20 1,078
2012 114 288 296 131 15 844
2011 111 248 287 60 9 715
2010 93 270 229 55 6 653
2009 113 147 114 25 2 401
2008 174 271 234 5 1 685
2007 229 258 389 17 1 894
2006 30 105 196 13 344
Average Sales Price
Median Sales Price
Average Price Per Square Foot
Number of Sales
$0
$200
$400
$600
$800
$1,000
20152014201320122011201020092008200720060
300
600
900
1,200
1,500
Price/sq. ft Number of sales

56
UPTOWNMANHATTAN DECADE
2006-2015
Visit our website to browse listings and learn more about market trends
HARLEM/EAST HARLEM CO-OPS AND CONDOS
Average Price Per Square Foot / Number of Sales
Matrix Current Year % Chg Prior Year % Chg Prior Decade
Average Sales Price $746,592 10.9% $673,089 9.9% $679,639
Average Price Per Sq. Ft $839 21.1% $693 31.3% $639
Median Sales Price $630,698 15.5% $546,000 5.1% $600,000
Number of Sales 569 13.3% 502 225.1% 175
BoundaryNorth: West 155th StreetSouth: East 96th Street (excludes corridor between Fifth and Madison Avenues and East 110th Street)East: Harlem RiverWest: St. Nicholas Avenue
Studio 1 Bedroom 2 Bedroom 3 Bedroom 4+ Bedroom ALL
2015 $356,197 $567,906 $864,553 $1,250,773 $1,264,700 $746,592
2014 $321,015 $460,986 $722,702 $1,191,771 $1,587,200 $673,089
2013 $294,094 $467,212 $662,273 $958,838 $928,050 $589,791
2012 $312,905 $453,944 $656,201 $948,929 $1,117,233 $626,034
2011 $299,005 $459,268 $677,821 $919,304 $1,617,938 $604,276
2010 $293,224 $477,379 $696,831 $1,097,240 $967,700 $606,483
2009 $376,163 $517,765 $776,546 $1,074,179 $725,000 $648,551
2008 $341,840 $546,150 $870,134 $3,080,400 $8,073,000 $678,432
2007 $319,848 $530,039 $891,060 $1,256,992 $8,300,000 $768,817
2006 $388,389 $502,479 $727,916 $1,650,071 $679,639
Studio 1 Bedroom 2 Bedroom 3 Bedroom 4+ Bedroom ALL
2015 $370,816 $520,000 $800,000 $1,374,637 $1,137,750 $630,698
2014 $248,430 $439,000 $707,000 $1,055,721 $625,000 $546,000
2013 $270,000 $482,955 $620,000 $879,000 $650,000 $515,000
2012 $298,415 $450,000 $665,000 $920,000 $848,000 $535,000
2011 $278,439 $423,000 $662,500 $900,000 $1,580,000 $534,581
2010 $299,130 $440,000 $678,000 $925,000 $1,125,000 $525,000
2009 $390,000 $500,000 $700,000 $1,037,600 $725,000 $590,000
2008 $329,000 $514,216 $730,000 $3,080,397 $8,073,000 $536,617
2007 $304,973 $455,034 $749,000 $1,272,812 $8,300,000 $635,000
2006 $425,000 $470,000 $650,000 $1,405,508 $600,000
Studio 1 Bedroom 2 Bedroom 3 Bedroom 4+ Bedroom ALL
2015 $728 $816 $848 $882 $897 $839
2014 $680 $661 $690 $755 $849 $693
2013 $657 $684 $628 $656 $537 $654
2012 $528 $599 $594 $621 $586 $594
2011 $592 $607 $566 $586 $617 $585
2010 $588 $666 $614 $670 $518 $637
2009 $637 $713 $649 $667 $494 $672
2008 $746 $765 $708 $1,438 $2,032 $743
2007 $722 $681 $706 $632 $1,937 $702
2006 $754 $627 $623 $663 $639
Studio 1 Bedroom 2 Bedroom 3 Bedroom 4+ Bedroom ALL
2015 74 221 181 83 10 569
2014 70 153 191 83 5 502
2013 52 245 220 67 14 598
2012 45 161 184 94 12 496
2011 58 147 219 47 8 479
2010 42 157 153 37 4 393
2009 32 77 83 19 1 212
2008 77 147 173 2 1 400
2007 38 108 237 13 1 397
2006 18 39 111 7 175
Average Sales Price
Median Sales Price
Average Price Per Square Foot
Number of Sales
$0
$200
$400
$600
$800
$1,000
20152014201320122011201020092008200720060
200
400
600
800
1,000
Price/sq. ft Number of sales

57
UPTOWNMANHATTAN DECADE
2006-2015
Visit our website to browse listings and learn more about market trends
HAMILTON/MORNING SIDE HEIGHTS CO-OPS AND CONDOS
Average Price Per Square Foot / Number of Sales
BoundaryNorth: West 155th StreetSouth: West 116th StreetEast: St, Nicholas AvenueWest: Hudson River
Studio 1 Bedroom 2 Bedroom 3 Bedroom 4+ Bedroom ALL
2015 $348,672 $470,074 $683,903 $882,099 $563,114
2014 $234,333 $382,474 $598,305 $555,078 $415,000 $475,961
2013 $290,971 $312,090 $477,408 $656,059 $319,600 $405,879
2012 $182,510 $359,772 $407,247 $415,455 $360,000 $317,259
2011 $236,180 $352,055 $481,188 $881,200 $1,199,000 $444,107
2010 $351,060 $335,559 $470,165 $490,029 $272,900 $385,474
2009 $263,396 $380,050 $466,673 $1,025,000 $353,472
2008 $310,148 $419,588 $599,932 $2,400,000 $453,645
2007 $331,207 4456,112 $601,949 $991,000 $495,537
2006 $383,809 $586,858 3,390,00 $555,100
Studio 1 Bedroom 2 Bedroom 3 Bedroom 4+ Bedroom ALL
2015 $290,000 $440,000 $604,500 $813,000 $506,000
2014 $225,000 $365,000 $570,000 $560,000 $415,000 $470,000
2013 $220,000 $310,000 $460,000 $699,000 $319,600 $370,000
2012 $197,000 $310,000 $422,940 $385,000 $360,000 $250,000
2011 $207,000 $350,000 $450,000 $352,500 $1,199,000 $395,500
2010 $373,152 $320,000 $470,000 $462,500 $272,930 $354,900
2009 $261,790 $337,500 $489,000 $1,025,000 $329,550
2008 $285,000 $350,000 $615,000 $2,400,000 $397,500
2007 $325,000 $430,950 $599,000 $991,000 $475,000
2006 $380,000 $570,000 $3,390,000 $415,000
Studio 1 Bedroom 2 Bedroom 3 Bedroom 4+ Bedroom ALL
2015 $663 $685 $712 $665 $689
2014 $563 $564 $586 $472 $292 $556
2013 $576 $504 $513 $451 $251 $508
2012 $324 $464 $421 $373 $375 $389
2011 $585 $552 $501 $601 $600 $540
2010 $699 $522 $502 $423 $546 $542
2009 $603 $591 $498 $603 $578
2008 $671 $701 $613 $1,200 $674
2007 $756 $695 $541 $622 $640
2006 $619 $535 $1,579 $596
Studio 1 Bedroom 2 Bedroom 3 Bedroom 4+ Bedroom ALL
2015 20 53 42 13 128
2014 6 50 42 14 2 114
2013 17 49 52 12 2 132
2012 39 21 36 11 1 108
2011 5 18 17 3 1 44
2010 15 36 20 7 1 79
2009 26 16 11 1 54
2008 27 25 19 1 72
2007 45 40 75 2 162
2006 21 24 1 46
Average Sales Price
Median Sales Price
Average Price Per Square Foot
Number of Sales
$0
$200
$400
$600
$800
$1,000
20152014201320122011201020092008200720060
50
100
150
200
250
Price/sq. ft Number of salesMatrix Current Year % Chg Prior Year % Chg Prior Decade
Average Sales Price $563,114 18.3% $475,961 1.4% $555,100
Average Price Per Sq. Ft $689 23.9% $556 15.6% $596
Median Sales Price $506,000 7.7% $470,000 21.9% $415,000
Number of Sales 128 12.3% 114 178.3% 46

58
UPTOWNMANHATTAN DECADE
2006-2015
Visit our website to browse listings and learn more about market trends
WASHINGTON HEIGHTS CO-OPS AND CONDOS
Average Price Per Square Foot / Number of Sales
BoundaryNorth: West 181st StreetSouth: West 155th StreetEast: Harlem RiverWest: Hudson River
Studio 1 Bedroom 2 Bedroom 3 Bedroom 4+ Bedroom ALL
2015 $264,872 $440,560 $641,183 $836,112 $871,250 $530,366
2014 $216,777 $366,977 $516,802 $789,125 $1,351,967 $486,449
2013 $164,550 $287,845 $382,648 $622,477 $2,682,500 $474,853
2012 $243,750 $308,057 $410,595 $716,233 $1,620,000 $427,680
2011 $179,972 $291,627 $539,610 $413,325 $342,166
2010 $225,034 $375,612 $567,461 $500,960 $265,000 $423,638
2009 $306,814 $411,769 $455,834 $501,500 $402,831
2008 $350,363 $406,750 $587,090 $1,050,750 $451,714
2007 $283,407 $438,900 $822,959 $431,892
2006 $430,800 $547,105 $814,750 $544,303
Studio 1 Bedroom 2 Bedroom 3 Bedroom 4+ Bedroom ALL
2015 $257,500 $430,000 $637,500 $805,500 $942,500 $490,500
2014 $199,750 $395,000 $548,000 $750,000 $1,500,000 $423,852
2013 $165,000 $285,000 $372,000 $739,000 $1,750,000 $329,900
2012 $295,000 $285,000 $420,000 $685,000 $1,620,000 $383,000
2011 $130,000 $278,850 $471,003 $512,000 $294,000
2010 $210,912 $325,000 $436,000 $430,000 $265,000 $356,928
2009 $290,000 $357,000 $440,000 $540,000 $400,000
2008 $350,000 $370,000 $560,000 $1,050,734 $405,000
2007 $285,000 $460,000 $628,229 $350,000
2006 $460,000 $520,000 $765,000 $515,000
Studio 1 Bedroom 2 Bedroom 3 Bedroom 4+ Bedroom ALL
2015 $589 $638 $642 $619 $414 $621
2014 $448 $559 $527 $498 $685 $531
2013 $417 $464 $394 $449 $910 $456
2012 $431 $413 $405 $475 $675 $427
2011 $429 $400 $455 $279 $417
2010 $465 $543 $556 $398 $663 $524
2009 $744 $645 $494 $365 $598
2008 $723 $647 $538 $465 $640
2007 $694 $666 $723 $691
2006 $550 $490 $469 $505
Studio 1 Bedroom 2 Bedroom 3 Bedroom 4+ Bedroom ALL
2015 26 99 64 24 4 217
2014 13 55 47 20 3 138
2013 8 38 27 22 4 99
2012 4 37 21 15 1 78
2011 18 26 20 4 68
2010 12 24 23 5 1 65
2009 14 13 12 6 45
2008 27 26 20 2 75
2007 46 26 17 89
2006 10 19 4 33
Average Sales Price
Median Sales Price
Average Price Per Square Foot
Number of Sales
$0
$200
$400
$600
$800
$1000
20152014201320122011201020092008200720060
50
100
150
200
250
Price/sq. ft Number of salesMatrix Current Year % Chg Prior Year % Chg Prior Decade
Average Sales Price $530,366 9.0% $486,449 -2.6% $544,303
Average Price Per Sq. Ft $621 16.9% $531 23.0% $505
Median Sales Price $490,500 15.7% $423,852 -4.8% $515,000
Number of Sales 217 57.2% 138 557.6% 33

59
UPTOWNMANHATTAN DECADE
2006-2015
Visit our website to browse listings and learn more about market trends
FORT GEORGE CO-OPS AND CONDOS
Average Price Per Square Foot / Number of Sales
BoundaryNorth: Dyckman StreetSouth: West 181st StreetEast: Harlem RiverWest: Hudson River
Studio 1 Bedroom 2 Bedroom 3 Bedroom 4+ Bedroom ALL
2015 $266,125 $421,423 $614,995 $887,857 $498,986
2014 $249,517 $373,345 $554,651 $663,333 $1,025,000 $442,202
2013 $225,700 $347,776 $506,217 $624,055 $398,453
2012 $193,528 $303,396 $469,641 $548,112 $510,000 $361,753
2011 $284,406 $363,972 $516,836 $711,900 $405,682
2010 $296,463 $390,478 $369,636 $513,900 $369,306
2009 $331,156 $451,886 $478,333 $403,419
2008 $370,642 $451,906 $610,143 $448,805
2007 $294,768 $486,116 $590,500 $895,000 $440,244
2006 $168,000 $370,275 $553,904 $450,162
Studio 1 Bedroom 2 Bedroom 3 Bedroom 4+ Bedroom ALL
2015 $249,000 $391,231 $597,500 $1,127,500 $450,000
2014 $221,625 $345,000 $534,024 $800,000 $1,025,000 $400,000
2013 $200,000 $299,000 $470,000 $686,000 $334,062
2012 $189,000 $289,043 $418,000 $620,000 $510,000 $330,000
2011 $260,000 $342,380 $475,000 $690,000 $345,652
2010 $300,000 $365,000 $335,000 $513,885 $343,000
2009 $335,000 $515,000 $420,000 $385,000
2008 $352,202 $440,000 $559,000 $435,000
2007 $290,000 $480,000 $595,000 $895,000 $380,000
2006 $155,000 $336,000 $549,000 $399,000
Studio 1 Bedroom 2 Bedroom 3 Bedroom 4+ Bedroom ALL
2015 $561 $594 $601 $613 $598
2014 $520 $542 $561 $542 $476 $544
2013 $468 $522 $524 $422 $511
2012 $409 $424 $482 $417 $271 $440
2011 $680 $512 $530 $491 $549
2010 $606 $562 $409 $639 $527
2009 $667 $705 $448 $663
2008 $743 $707 $553 $696
2007 $704 $704 $574 $497 $672
2006 $334 $511 $542 $511
Studio 1 Bedroom 2 Bedroom 3 Bedroom 4+ Bedroom ALL
2015 8 38 18 7 71
2014 29 88 63 18 1 199
2013 19 88 53 9 169
2012 18 52 41 8 1 120
2011 18 43 22 5 88
2010 16 41 25 2 84
2009 25 28 6 59
2008 31 53 14 98
2007 59 56 37 1 153
2006 5 20 29 54
Average Sales Price
Median Sales Price
Average Price Per Square Foot
Number of Sales
$0
$200
$400
$600
$800
$1,000
20152014201320122011201020092008200720060
50
100
150
200
250
Price/sq. ft Number of salesMatrix Current Year % Chg Prior Year % Chg Prior Decade
Average Sales Price $498,986 12.8% $442,202 10.8% $450,162
Average Price Per Sq. Ft $598 9.9% $544 17% $511
Median Sales Price $450,000 12.5% $400,000 12.8% $399,000
Number of Sales 71 -64.3% 199 3.1.5% 54
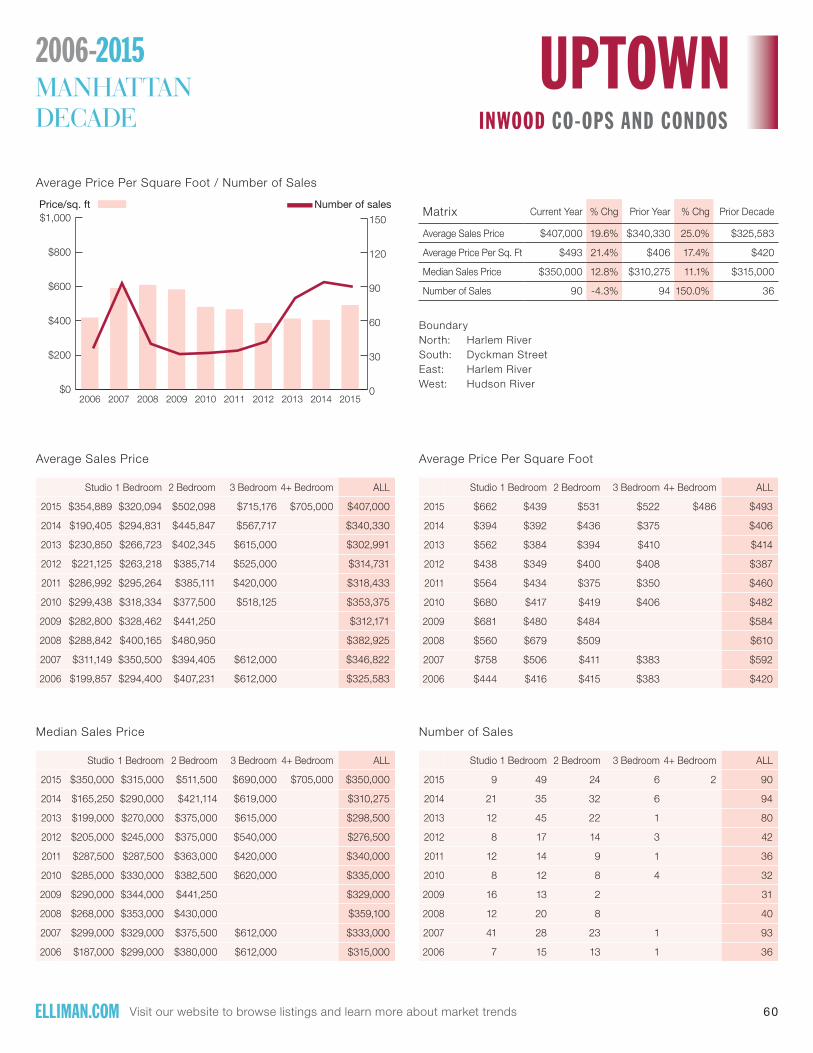
60
UPTOWNMANHATTAN DECADE
2006-2015
Visit our website to browse listings and learn more about market trends
INWOOD CO-OPS AND CONDOS
Average Price Per Square Foot / Number of Sales
BoundaryNorth: Harlem RiverSouth: Dyckman StreetEast: Harlem RiverWest: Hudson River
Studio 1 Bedroom 2 Bedroom 3 Bedroom 4+ Bedroom ALL
2015 $354,889 $320,094 $502,098 $715,176 $705,000 $407,000
2014 $190,405 $294,831 $445,847 $567,717 $340,330
2013 $230,850 $266,723 $402,345 $615,000 $302,991
2012 $221,125 $263,218 $385,714 $525,000 $314,731
2011 $286,992 $295,264 $385,111 $420,000 $318,433
2010 $299,438 $318,334 $377,500 $518,125 $353,375
2009 $282,800 $328,462 $441,250 $312,171
2008 $288,842 $400,165 $480,950 $382,925
2007 $311,149 $350,500 $394,405 $612,000 $346,822
2006 $199,857 $294,400 $407,231 $612,000 $325,583
Studio 1 Bedroom 2 Bedroom 3 Bedroom 4+ Bedroom ALL
2015 $350,000 $315,000 $511,500 $690,000 $705,000 $350,000
2014 $165,250 $290,000 $421,114 $619,000 $310,275
2013 $199,000 $270,000 $375,000 $615,000 $298,500
2012 $205,000 $245,000 $375,000 $540,000 $276,500
2011 $287,500 $287,500 $363,000 $420,000 $340,000
2010 $285,000 $330,000 $382,500 $620,000 $335,000
2009 $290,000 $344,000 $441,250 $329,000
2008 $268,000 $353,000 $430,000 $359,100
2007 $299,000 $329,000 $375,500 $612,000 $333,000
2006 $187,000 $299,000 $380,000 $612,000 $315,000
Studio 1 Bedroom 2 Bedroom 3 Bedroom 4+ Bedroom ALL
2015 $662 $439 $531 $522 $486 $493
2014 $394 $392 $436 $375 $406
2013 $562 $384 $394 $410 $414
2012 $438 $349 $400 $408 $387
2011 $564 $434 $375 $350 $460
2010 $680 $417 $419 $406 $482
2009 $681 $480 $484 $584
2008 $560 $679 $509 $610
2007 $758 $506 $411 $383 $592
2006 $444 $416 $415 $383 $420
Studio 1 Bedroom 2 Bedroom 3 Bedroom 4+ Bedroom ALL
2015 9 49 24 6 2 90
2014 21 35 32 6 94
2013 12 45 22 1 80
2012 8 17 14 3 42
2011 12 14 9 1 36
2010 8 12 8 4 32
2009 16 13 2 31
2008 12 20 8 40
2007 41 28 23 1 93
2006 7 15 13 1 36
Average Sales Price
Median Sales Price
Average Price Per Square Foot
Number of Sales
$0
$200
$400
$600
$800
$1,000
20152014201320122011201020092008200720060
30
60
90
120
150
Price/sq. ft Number of salesMatrix Current Year % Chg Prior Year % Chg Prior Decade
Average Sales Price $407,000 19.6% $340,330 25.0% $325,583
Average Price Per Sq. Ft $493 21.4% $406 17.4% $420
Median Sales Price $350,000 12.8% $310,275 11.1% $315,000
Number of Sales 90 -4.3% 94 150.0% 36