
Managing Spatial Selections With Contextual Snapshots
13
DOI: 10.1111/cgf.12406 COMPUTER GRAPHICS forum Volume 33 (2014), number 8 pp. 132–144 Managing Spatial Selections With Contextual Snapshots P. Mindek 1 , M. E. Gr ¨ oller 1,2 and S. Bruckner 3 1 Vienna University of Technology, Austria {mindek, groeller}@cg.tuwien.ac.at 2 VRV is Research Center, Austria 3 University of Bergen, Norway [email protected] Abstract Spatial selections are a ubiquitous concept in visualization. By localizing particular features, they can be analysed and compared in different views. However, the semantics of such selections often depend on specific parameter settings and it can be difficult to reconstruct them without additional information. In this paper, we present the concept of contextual snapshots as an effective means for managing spatial selections in visualized data. The selections are automatically associated with the context in which they have been created. Contextual snapshots can also be used as the basis for interactive integrated and linked views, which enable in-place investigation and comparison of multiple visual representations of data. Our approach is implemented as a flexible toolkit with well-defined interfaces for integration into existing systems. We demonstrate the power and generality of our techniques by applying them to several distinct scenarios such as the visualization of simulation data, the analysis of historical documents and the display of anatomical data. Keywords: interaction, visual analytics, spatial selections, annotations ACM CCS: I.3.3 [Computer Graphics]: Picture/Image Generation—Viewing algorithms; I.3.6 [Computer Graphics]: Method- ology and Techniques—Interaction techniques 1. Introduction Visual analysis of large data sets often requires displaying of vari- ous subsets of the examined data using different visualization tech- niques. For this purpose, linked views and integrated views are commonly employed. The investigation of multivariate or other- wise complex data may require a specification of spatial regions which are to be examined individually using integrated or linked views. Creating spatial selections, or brushing, is a widely used method for specifying such regions. Brushing techniques are also often employed to specify a degree of interest (DOI) function for fo- cus + context visualization as described by Furnas [Fur86]. Smooth brushing concerns the specification of a non-binary DOI function, which defines a continuous transition between focus and context data. Another aspect of visualizing complex data sets is a frequent need for creating annotations in the rendered images. The annotations as- sign semantics to parts of the image. They are useful for providing additional insight into the data, or for keeping provenance infor- mation. The annotations are related to the spatial selections, since they refer to particular spatially bounded image regions. The an- notations are also bound to the current parameter settings of the visualization. For instance, if a structure is annotated in a volume data set, the annotation loses its meaning when the transfer function, the viewing angle or other parameters change in such a way that the structure in question is no longer visible. In such cases, it is nec- essary to keep track of the visualization settings together with the annotations. We propose a method for managing arbitrary selections in the image space of the visualizations. We define several terms for the purpose of describing the proposed method. A selection is a non- binary DOI function in image space. A visualization snapshot is a set of parameter values describing the state of the visualization system at a particular point in time. Finally, we introduce the concept of contextual snapshots. A contextual snapshot is an entity which holds multiple selections together with a visualization snapshot. The visualization snapshot provides context for the associated selections. By keeping the selections in contextual snapshots, it is possible to recover the states of the visualization system in which the selections have been created. The contextual snapshots allow us to work with c 2014 The Authors Computer Graphics Forum published by John Wiley & Sons Ltd. This is an open access article under the terms of the Creative Commons Attribution License, which permits use, distribution and reproduction in any medium, provided the original work is properly cited. 132 brought to you by CORE View metadata, citation and similar papers at core.ac.uk provided by NORA - Norwegian Open Research Archives
Transcript of Managing Spatial Selections With Contextual Snapshots

DOI: 10.1111/cgf.12406 COMPUTER GRAPHICS forumVolume 33 (2014), number 8 pp. 132–144
Managing Spatial Selections With Contextual Snapshots
P. Mindek1, M. E. Groller1,2 and S. Bruckner3
1Vienna University of Technology, Austria{mindek, groeller}@cg.tuwien.ac.at
2VRV is Research Center, Austria3University of Bergen, Norway
AbstractSpatial selections are a ubiquitous concept in visualization. By localizing particular features, they can be analysed and comparedin different views. However, the semantics of such selections often depend on specific parameter settings and it can be difficultto reconstruct them without additional information. In this paper, we present the concept of contextual snapshots as an effectivemeans for managing spatial selections in visualized data. The selections are automatically associated with the context in whichthey have been created. Contextual snapshots can also be used as the basis for interactive integrated and linked views, whichenable in-place investigation and comparison of multiple visual representations of data. Our approach is implemented as aflexible toolkit with well-defined interfaces for integration into existing systems. We demonstrate the power and generality of ourtechniques by applying them to several distinct scenarios such as the visualization of simulation data, the analysis of historicaldocuments and the display of anatomical data.
Keywords: interaction, visual analytics, spatial selections, annotations
ACM CCS: I.3.3 [Computer Graphics]: Picture/Image Generation—Viewing algorithms; I.3.6 [Computer Graphics]: Method-ology and Techniques—Interaction techniques
1. Introduction
Visual analysis of large data sets often requires displaying of vari-ous subsets of the examined data using different visualization tech-niques. For this purpose, linked views and integrated views arecommonly employed. The investigation of multivariate or other-wise complex data may require a specification of spatial regionswhich are to be examined individually using integrated or linkedviews. Creating spatial selections, or brushing, is a widely usedmethod for specifying such regions. Brushing techniques are alsooften employed to specify a degree of interest (DOI) function for fo-cus + context visualization as described by Furnas [Fur86]. Smoothbrushing concerns the specification of a non-binary DOI function,which defines a continuous transition between focus and contextdata.
Another aspect of visualizing complex data sets is a frequent needfor creating annotations in the rendered images. The annotations as-sign semantics to parts of the image. They are useful for providingadditional insight into the data, or for keeping provenance infor-mation. The annotations are related to the spatial selections, since
they refer to particular spatially bounded image regions. The an-notations are also bound to the current parameter settings of thevisualization. For instance, if a structure is annotated in a volumedata set, the annotation loses its meaning when the transfer function,the viewing angle or other parameters change in such a way that thestructure in question is no longer visible. In such cases, it is nec-essary to keep track of the visualization settings together with theannotations.
We propose a method for managing arbitrary selections in theimage space of the visualizations. We define several terms for thepurpose of describing the proposed method. A selection is a non-binary DOI function in image space. A visualization snapshot isa set of parameter values describing the state of the visualizationsystem at a particular point in time. Finally, we introduce the conceptof contextual snapshots. A contextual snapshot is an entity whichholds multiple selections together with a visualization snapshot. Thevisualization snapshot provides context for the associated selections.By keeping the selections in contextual snapshots, it is possible torecover the states of the visualization system in which the selectionshave been created. The contextual snapshots allow us to work with
c© 2014 The AuthorsComputer Graphics Forum published by John Wiley & Sons Ltd.This is an open access article under the terms of the Creative Commons Attribution License, which permits use, distribution and reproduction in any medium,provided the original work is properly cited.
132
brought to you by COREView metadata, citation and similar papers at core.ac.uk
provided by NORA - Norwegian Open Research Archives

P. Mindek et al. / Managing Spatial Selections With Contextual Snapshots 133
multiple selections created in different states of the visualizationsystem.
To demonstrate the proposed concept, we implemented the con-textual snapshots in three scenarios, one of which is a volume vi-sualization application. The application displays a multivariate 4Dhurricane data set. The user can create selections in image space byusing a lasso metaphor. The selected data can be further analysedusing linked views. We use this example to introduce the parts ofwhich the contextual snapshots consist, and explain how they worktogether.
In applications such as 4D data visualization, it is sometimesnecessary to select and annotate the visualized data multiple timeswhile the visualization parameters are changing. Contextual snap-shots provide a basis for keeping track of these interactions. In cur-rent systems, selections made in image space have to be processedbefore the image changes. Otherwise the selections will become in-valid with the new parameter settings, which we refer to as context.Contextual snapshots record the selection together with the context,so that it can be processed even after the context has changed.
This paper is based on our previous work [MBG13]. It containsan extended description of the concept of contextual snapshots formanaging multiple spatial selections in different steps during thevisualization session. We extended the description of our imple-mentation of the contextual snapshots. We include details on imple-mentation efforts needed to use contextual snapshots in an existingvisualization system. The library can be downloaded from our web-site [csl]. There is also a detailed tutorial which explains on a simpleexample how to integrate contextual snapshots into an existing appli-cation. We extended the implementation with new, customizable an-chors, which serve as abstract previews of the contextual snapshots.We added a possibility to use custom matching functions whichdefine when individual contextual snapshots are active. Finally, weprovide a new use case, which shows contextual snapshots appliedto the visualization of 3D geometry data.
2. Related Work
We propose a method for managing spatial selections in imagespace. There are various scenarios where multiple selections aremade in order to achieve a certain goal. The goal might be to se-lect subsets or features of a data set. Furnas [Fur86] presents DOIfunctions for the specification of focus data. Doleisch and Hauser[DH02] use a DOI function obtained by smooth brushing to modifythe visualization mapping in 3D flow visualization. Doleisch et al.[DGH03] present a framework for the specification of data featuresvisualized in several linked views. Ulinski et al. [UZW*07] proposetwo-handed methods for creating selections in volume rendering.Unger et al. [UMDS08] use smooth brushing in the visualizationof statistical characteristics for subsets of large data sets. Variousmethods for increasing the usefulness of 3D scatterplots incorpo-rating brushing have been developed [KSH04], [PKH04]. Streitet al. [SSL*12] propose a model-driven design process for explor-ing multiple linked data sets. Yu et al. [YEII12] discuss methodsfor selecting data in large 3D point clouds by screen–space interac-tion. In visualization applications which employ brushing or similartechniques, the user interaction is typically limited to the common
context. Contextual snapshots remove this limitation by providingmeans for keeping the context for each individual interaction in-stance.
Gerl et al. [GRIG12] incorporate brushing on renderings of dataattributes for the specification of semantics in volume visualization.Guo et al. [GMY11] introduce a sketch-based interface for directvolume rendering which replaces the traditional way of transferfunction design. Wei et al. [WWYM10] propose a sketch-basedinterface for an interactive 3D vector field exploration. The conceptof contextual snapshots is designed in such a way that the spatialselections could be employed to handle the just mentioned typesof user interaction. Contextual snapshots increase the scalability ofsuch interaction methods. They allow the system to manage multipleinteraction instances simultaneously, while each instance can bemeaningful in a different context.
In addition to the concept of contextual snapshots, we proposea method for combining them with various views of the visualizeddata. The integration and linking of multiple views has been exten-sively explored [Bal10], [Tor04]. Bier et al. [BSP*93] propose asee-through interface as a natural way of displaying additional data.Balabanian et al. [BVMG08] introduce a framework for the spec-ification of visualization parameters for time-varying data. Rungtaet al. [RSD*13] present ManyVis—a framework for easy integrationof existing applications to create custom visualization tools. Santoset al. [SLA*09] propose VisMashup, a framework for simplifyingthe creation of custom visualization applications. The authors ofVisMashup combine various visualization pipelines to create a newvisualization application. In our work, we aim at extending existingvisualization pipelines with interaction possibilities.
Contextual snapshots can also be used for preserving user-createdprovenance information for a visualization. Bavoil et al. [BCC*05]propose VisTrails. It is a system for creating and maintaining vi-sualization pipelines with the possibility to execute them and torecord their provenance information. Our method differs form Vis-Trails in that the user can create spatial selections of the exploreddata in a specific context and annotate them to store the visualiza-tion provenance information. This provides a strong link betweenthe provenance information and the underlying data. Heer et al.[HMSA08] present a design space analysis of history keeping sys-tems. Kreuseler et al. [KNS04] propose an approach to includea history mechanism into a visual data mining framework. Grothand Streefkerk [GS06] present a method for capturing the historyof the knowledge discovery process using a visualization systemwith an ability to create annotations for provenance information.Ellkvist et al. [EKF*09] discuss an architecture for provenanceinter-operability between multiple sources. In contrast to these sys-tems, contextual snapshots provide means to insert annotationsto particular spatial data at a particular stage of the visualizationsession. As the annotations are automatically linked with the cur-rent context, they store provenance information besides their actualcontent.
3. Overview of Contextual Snapshots
Many visualization systems use brushing, selections and linkedviews to provide means for the exploration of complex data sets.
c© 2014 The AuthorsComputer Graphics Forum published by John Wiley & Sons Ltd.

134 P. Mindek et al. / Managing Spatial Selections With Contextual Snapshots
There are various tools for specifying the selections and they usu-ally serve only one specific purpose. The idea of contextual snap-shots is to harness a single mechanism of 2D spatial selections fordifferent tasks, such as data selection and manipulation, data anno-tation or specification of DOI functions. In contextual snapshots,this is achieved by the following concepts: multiple selections canbe stored and each of them can be created in a different context(i.e. parameter settings of the visualization system); an algorithm oftransforming the user input to the DOI functions of the selectionsis interchangeable; each selection can be linked with a number ofadditional views which we refer to as embedded visualizations. Itis possible to display, that is, embed them, directly in the visualiza-tion image. Embedded visualizations are interactive and they candisplay arbitrary graphical user interface elements or visualize dataspecified by a corresponding selection.
In the example application, the selections can specify a spatial re-gion in image space of a volume visualization. An embedded viewwhich displays the histogram of the volume data in the specifiedregion is linked with each selection. Contextual snapshots calculatea histogram of the selected voxels and provide it to the embed-ded visualization. How these data are used depends on the im-plementation of individual embedded visualizations. Another em-bedded visualization is a simple text field. It does not display theselected data region, but it allows users to type in arbitrary text-based annotations. Such an embedded visualization is linked withevery selection, thus providing a possibility to annotate selected datasubsets.
3.1. Concept of contextual snapshots
A visualization system may apply various parameters to modify thevisual mapping. With respect to contextual snapshots, the values of achosen subset of said parameters, the visualization snapshot, definea state of the visualization system. For any state of the system, a usercan create several selections in the rendered images. A contextualsnapshot stores a visualization snapshot together with all selectionscreated when the state of the visualization system corresponded tothis visualization snapshot.
In the hurricane visualization application, we use the position andthe orientation of the virtual 3D camera as the parameters storedwithin the visualization snapshot. Therefore, each image–space se-lection is bound to one 3D camera view. The selection is valid onlyif the volume is rendered using this camera view. Other parame-ters, such as current timestep, are not stored in the visualizationsnapshots. Changing these parameters does not make the selectionsinvalid. This is application-specific and in the given case, it allowsusers to explore how the hurricane data change over time in speci-fied spatial regions. When contextual snapshots are integrated witha visualization system, the system integrator has to choose the set ofparameters which appropriately define the context for the selections.
In this work, a selection is a function f : R2 → [0, 1] which
specifies a DOI for each pixel. The contextual snapshots do notassume any particular definition of this function. Therefore, arbitrarytypes of image–space selections can be used. This is demonstratedin Sections 5 and 6.
A contextual snapshot ci is defined as:
ci = (vi, si , ti), (1)
vi = {(p0, x0), ..., (pn−1, xn−1)} is a visualization snapshot contain-ing n parameters of the visualization system, describing its state atone instant. The visualization snapshot consists of n pairs (pj , xj ),where pj is a parameter name and xj is its value; p0, ..., pn−1
are the same for all contextual snapshots, while the parametervalues x0, ..., xn−1 are specific for each visualization snapshot;si = {f0, ..., fmi
} is the set of all selections created at the state,or context, described by vi . f0, ..., fmi
are the user-defined, real-valued selections as described. Finally, ti is a thumbnail image ofthe visualization in the state described by vi .
The idea of contextual snapshots is based on the fact that thesemantics of the user-made selections depend on what is currentlydisplayed. When the user selects a particular feature in the image,the selection is meaningful only until the way how the feature isdisplayed changes. Therefore, we extract a visualization snapshotevery time a new selection is created. The visualization snapshot islinked to the selection to create a contextual snapshot. The contex-tual snapshot then provides a reproducible spatial selection relatedto what was displayed when the selection was made. It stores theappropriate visualization context in the form of the values of thevisualization-system parameters. All selections with the same visu-alization snapshot are stored together within one contextual snap-shot.
The strength of contextual snapshots is that they can maintainmultiple selections created in different states of the visualizationsystem. The information stored within a contextual snapshot can beused to restore the given state, so that the selections can be displayedand actively used. By restoring the state of the visualization systemaccording to the individual contextual snapshots, it is possible tobrowse all selections created within a visualization session.
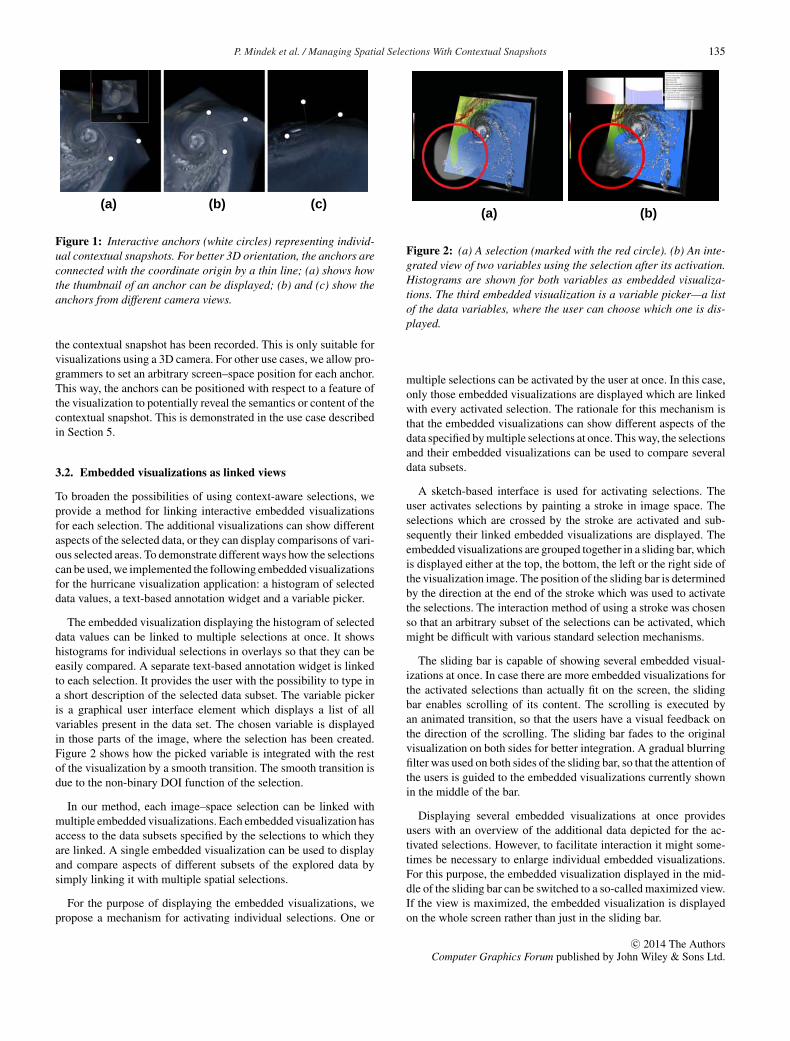
Contextual snapshots are represented by icons which we referto as anchors. The anchors are embedded in the original visualiza-tion as interactive graphical elements. They constitute abstract pre-views of the corresponding contextual snapshots. For instance, in thehurricane visualization application, the anchors are positioned in 3Dspace to represent the camera positions when the respective contex-tual snapshots have been recorded. An anchor can also display athumbnail of how the visualization looked like when the respectivecontextual snapshots have been created. The anchors are interac-tive and they are used to restore the visualization-system state tothe respective contextual snapshot. They serve as a user interfacefor browsing through the contextual snapshots created during thevisualization session. Figure 1 shows the graphical representationof anchors.
The visualization-system parameters used as context for the se-lections vary in different applications. The graphical representationof anchors can be customized to convey the information stored inthe contextual snapshot, as demonstrated in Section 6. The defaultimplementation uses the viewing–transformation matrix of the cam-era to position the anchors in 3D space. In this case, the positionof the anchor conveys the position of the camera at the time when
c© 2014 The AuthorsComputer Graphics Forum published by John Wiley & Sons Ltd.
P. Mindek et al. / Managing Spatial Selections With Contextual Snapshots 135
(a) (b) (c)
Figure 1: Interactive anchors (white circles) representing individ-ual contextual snapshots. For better 3D orientation, the anchors areconnected with the coordinate origin by a thin line; (a) shows howthe thumbnail of an anchor can be displayed; (b) and (c) show theanchors from different camera views.
the contextual snapshot has been recorded. This is only suitable forvisualizations using a 3D camera. For other use cases, we allow pro-grammers to set an arbitrary screen–space position for each anchor.This way, the anchors can be positioned with respect to a feature ofthe visualization to potentially reveal the semantics or content of thecontextual snapshot. This is demonstrated in the use case describedin Section 5.
3.2. Embedded visualizations as linked views
To broaden the possibilities of using context-aware selections, weprovide a method for linking interactive embedded visualizationsfor each selection. The additional visualizations can show differentaspects of the selected data, or they can display comparisons of vari-ous selected areas. To demonstrate different ways how the selectionscan be used, we implemented the following embedded visualizationsfor the hurricane visualization application: a histogram of selecteddata values, a text-based annotation widget and a variable picker.
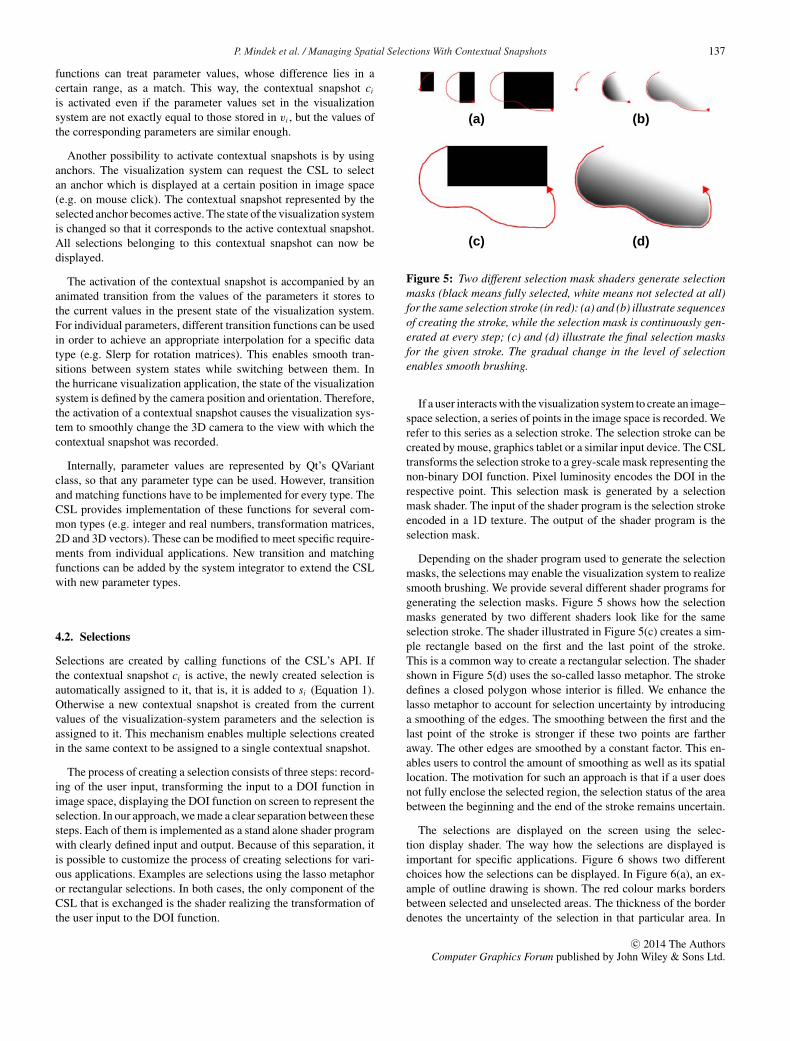
The embedded visualization displaying the histogram of selecteddata values can be linked to multiple selections at once. It showshistograms for individual selections in overlays so that they can beeasily compared. A separate text-based annotation widget is linkedto each selection. It provides the user with the possibility to type ina short description of the selected data subset. The variable pickeris a graphical user interface element which displays a list of allvariables present in the data set. The chosen variable is displayedin those parts of the image, where the selection has been created.Figure 2 shows how the picked variable is integrated with the restof the visualization by a smooth transition. The smooth transition isdue to the non-binary DOI function of the selection.
In our method, each image–space selection can be linked withmultiple embedded visualizations. Each embedded visualization hasaccess to the data subsets specified by the selections to which theyare linked. A single embedded visualization can be used to displayand compare aspects of different subsets of the explored data bysimply linking it with multiple spatial selections.
For the purpose of displaying the embedded visualizations, wepropose a mechanism for activating individual selections. One or
(a) (b)
Figure 2: (a) A selection (marked with the red circle). (b) An inte-grated view of two variables using the selection after its activation.Histograms are shown for both variables as embedded visualiza-tions. The third embedded visualization is a variable picker—a listof the data variables, where the user can choose which one is dis-played.
multiple selections can be activated by the user at once. In this case,only those embedded visualizations are displayed which are linkedwith every activated selection. The rationale for this mechanism isthat the embedded visualizations can show different aspects of thedata specified by multiple selections at once. This way, the selectionsand their embedded visualizations can be used to compare severaldata subsets.
A sketch-based interface is used for activating selections. Theuser activates selections by painting a stroke in image space. Theselections which are crossed by the stroke are activated and sub-sequently their linked embedded visualizations are displayed. Theembedded visualizations are grouped together in a sliding bar, whichis displayed either at the top, the bottom, the left or the right side ofthe visualization image. The position of the sliding bar is determinedby the direction at the end of the stroke which was used to activatethe selections. The interaction method of using a stroke was chosenso that an arbitrary subset of the selections can be activated, whichmight be difficult with various standard selection mechanisms.
The sliding bar is capable of showing several embedded visual-izations at once. In case there are more embedded visualizations forthe activated selections than actually fit on the screen, the slidingbar enables scrolling of its content. The scrolling is executed byan animated transition, so that the users have a visual feedback onthe direction of the scrolling. The sliding bar fades to the originalvisualization on both sides for better integration. A gradual blurringfilter was used on both sides of the sliding bar, so that the attention ofthe users is guided to the embedded visualizations currently shownin the middle of the bar.
Displaying several embedded visualizations at once providesusers with an overview of the additional data depicted for the ac-tivated selections. However, to facilitate interaction it might some-times be necessary to enlarge individual embedded visualizations.For this purpose, the embedded visualization displayed in the mid-dle of the sliding bar can be switched to a so-called maximized view.If the view is maximized, the embedded visualization is displayedon the whole screen rather than just in the sliding bar.
c© 2014 The AuthorsComputer Graphics Forum published by John Wiley & Sons Ltd.

136 P. Mindek et al. / Managing Spatial Selections With Contextual Snapshots
Figure 3: Overview of the system. The black arrows represent thedata flow between the visualization system, the embedded visualiza-tions and the Contextual Snapshot Library (CSL). The grey arrowdenotes the transition from the original rendering to the renderingwith the enhanced visualization.
4. Contextual Snapshot Architecture
Contextual snapshots are meant to be used in existing visualizationsystems. We have implemented contextual snapshots as a librarywhich can be integrated with an underlying visualization systemon the source-code level. We call it Contextual Snapshot Library(CSL). The CSL is responsible for rendering the anchors, the selec-tions and the embedded visualizations into the original visualizationimage. Additionally, it provides an interface for the data transfer be-tween the selections and the embedded visualizations. It also handlesuser input so that the anchors and embedded visualizations are in-teractive. Contextual snapshots integrate the visualization and thegraphical elements for interactive data exploration and annotation.This approach is particularly well suited for the rapidly growingarea of mobile devices such as tablets where the display also servesas the input device.
Figure 3 shows the data flow between the visualization system,the embedded visualizations and the CSL. The visualization systemgathers user input and transmits it to the CSL. The CSL storescontextual snapshots generated from the user input. Additionally, itrenders the selections, the anchors and the embedded visualizationsinto the original visualization image. The result is an enhancedvisualization system.
The CSL renders all of the graphical elements (anchors, selec-tions, embedded visualizations, as illustrated in Figures 1 and 2)into the original visualization and provides the result as a texture.The underlying visualization system can be modified to display thistexture so that the graphical elements of the contextual snapshotsare visible.
Figure 4 shows the overall architecture of an existing visual-ization system using the CSL. The library itself is split into two
Figure 4: Architecture of the visualization system integrating theCSL. The arrows denote the data flow.
parts. The part responsible for managing the contextual snapshots,interaction and rendering of the graphical elements, is called Pre-sentation (PRS). To exploit the capabilities of modern GPUs, thePRS uses several shaders to render all the graphical elements. Theselection mask shader transforms user input into the DOI functionof the selection. The selection display shader renders the selectionon the screen. The embedded visualizations display shader rendersthe sliding bar. Each of these shaders can be exchanged to modifyhow selections are treated.
The functionality of the PRS can be extended by the ShaderEnhancer (SE). The SE is an auxiliary tool for the data transferbetween individual modules of the visualization system. It storesdata specific to individual selections of the contextual snapshots inthe GPU memory so that it can be used in different visualizationpipelines of the system. The SE simplifies the utilization of theselections in the visualization system by providing access to alldata subsets specified through the corresponding DOI functions.The motivation of storing the data in the GPU memory is that GPUimplementations of visualization algorithms can access the datawithout having to transfer them to CPU memory.
The CSL is implemented in C++, using the Qt library. It usesOpenGL for rendering of the graphical elements and for the dataexchange with the visualization system via textures. The specifica-tions of contextual snapshots can be stored on the hard drive in XMLformat. The selection masks and the thumbnails are stored as PNGfiles. The CSL also provides functionality to load this informationand recreate all the contextual snapshots for the currently visualizeddata.
4.1. Contextual snapshots
When the parameters of the visualization system are set so thattheir values match the values stored in visualization snapshotvi (as described in Section 3.1), the contextual snapshot ci isactivated. The default implementation requires that each pair ofcorresponding values are equal in order to activate the respectivecontextual snapshot. However, it is possible to provide custommatching functions for each parameter data-type or even forindividual parameters. The custom implementation of the matching
c© 2014 The AuthorsComputer Graphics Forum published by John Wiley & Sons Ltd.
P. Mindek et al. / Managing Spatial Selections With Contextual Snapshots 137
functions can treat parameter values, whose difference lies in acertain range, as a match. This way, the contextual snapshot ci
is activated even if the parameter values set in the visualizationsystem are not exactly equal to those stored in vi , but the values ofthe corresponding parameters are similar enough.
Another possibility to activate contextual snapshots is by usinganchors. The visualization system can request the CSL to selectan anchor which is displayed at a certain position in image space(e.g. on mouse click). The contextual snapshot represented by theselected anchor becomes active. The state of the visualization systemis changed so that it corresponds to the active contextual snapshot.All selections belonging to this contextual snapshot can now bedisplayed.
The activation of the contextual snapshot is accompanied by ananimated transition from the values of the parameters it stores tothe current values in the present state of the visualization system.For individual parameters, different transition functions can be usedin order to achieve an appropriate interpolation for a specific datatype (e.g. Slerp for rotation matrices). This enables smooth tran-sitions between system states while switching between them. Inthe hurricane visualization application, the state of the visualizationsystem is defined by the camera position and orientation. Therefore,the activation of a contextual snapshot causes the visualization sys-tem to smoothly change the 3D camera to the view with which thecontextual snapshot was recorded.
Internally, parameter values are represented by Qt’s QVariantclass, so that any parameter type can be used. However, transitionand matching functions have to be implemented for every type. TheCSL provides implementation of these functions for several com-mon types (e.g. integer and real numbers, transformation matrices,2D and 3D vectors). These can be modified to meet specific require-ments from individual applications. New transition and matchingfunctions can be added by the system integrator to extend the CSLwith new parameter types.
4.2. Selections
Selections are created by calling functions of the CSL’s API. Ifthe contextual snapshot ci is active, the newly created selection isautomatically assigned to it, that is, it is added to si (Equation 1).Otherwise a new contextual snapshot is created from the currentvalues of the visualization-system parameters and the selection isassigned to it. This mechanism enables multiple selections createdin the same context to be assigned to a single contextual snapshot.
The process of creating a selection consists of three steps: record-ing of the user input, transforming the input to a DOI function inimage space, displaying the DOI function on screen to represent theselection. In our approach, we made a clear separation between thesesteps. Each of them is implemented as a stand alone shader programwith clearly defined input and output. Because of this separation, itis possible to customize the process of creating selections for vari-ous applications. Examples are selections using the lasso metaphoror rectangular selections. In both cases, the only component of theCSL that is exchanged is the shader realizing the transformation ofthe user input to the DOI function.
(a) (b)
(c) (d)
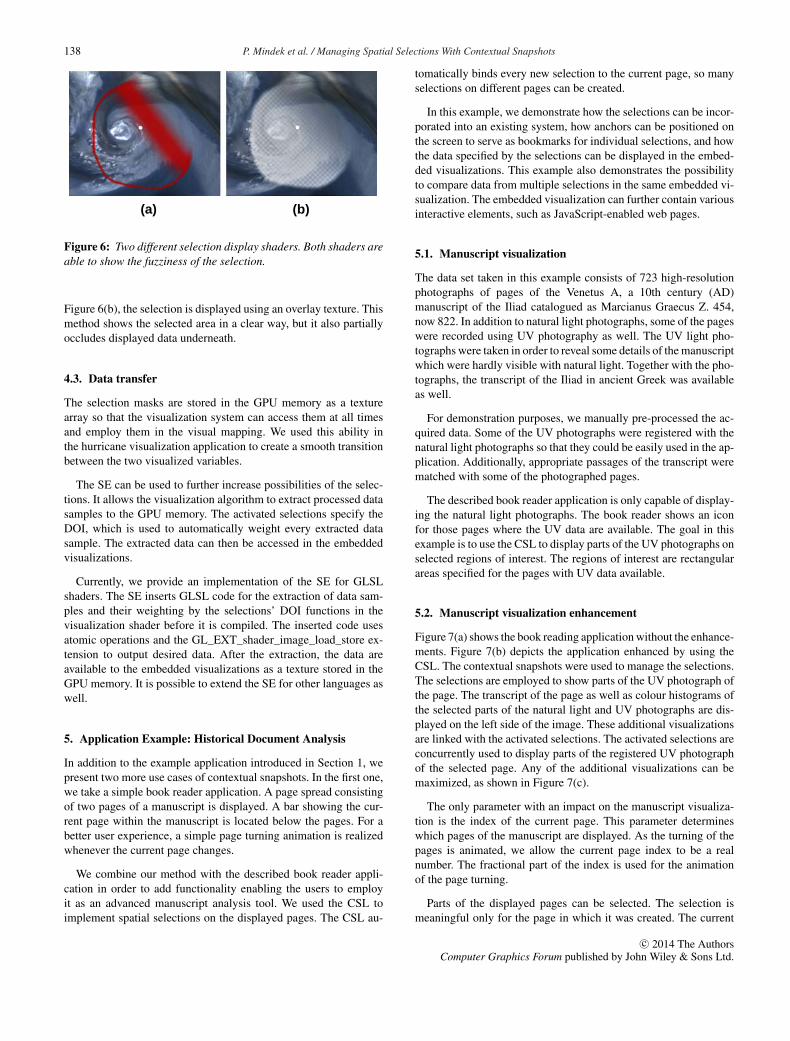
Figure 5: Two different selection mask shaders generate selectionmasks (black means fully selected, white means not selected at all)for the same selection stroke (in red): (a) and (b) illustrate sequencesof creating the stroke, while the selection mask is continuously gen-erated at every step; (c) and (d) illustrate the final selection masksfor the given stroke. The gradual change in the level of selectionenables smooth brushing.
If a user interacts with the visualization system to create an image–space selection, a series of points in the image space is recorded. Werefer to this series as a selection stroke. The selection stroke can becreated by mouse, graphics tablet or a similar input device. The CSLtransforms the selection stroke to a grey-scale mask representing thenon-binary DOI function. Pixel luminosity encodes the DOI in therespective point. This selection mask is generated by a selectionmask shader. The input of the shader program is the selection strokeencoded in a 1D texture. The output of the shader program is theselection mask.
Depending on the shader program used to generate the selectionmasks, the selections may enable the visualization system to realizesmooth brushing. We provide several different shader programs forgenerating the selection masks. Figure 5 shows how the selectionmasks generated by two different shaders look like for the sameselection stroke. The shader illustrated in Figure 5(c) creates a sim-ple rectangle based on the first and the last point of the stroke.This is a common way to create a rectangular selection. The shadershown in Figure 5(d) uses the so-called lasso metaphor. The strokedefines a closed polygon whose interior is filled. We enhance thelasso metaphor to account for selection uncertainty by introducinga smoothing of the edges. The smoothing between the first and thelast point of the stroke is stronger if these two points are fartheraway. The other edges are smoothed by a constant factor. This en-ables users to control the amount of smoothing as well as its spatiallocation. The motivation for such an approach is that if a user doesnot fully enclose the selected region, the selection status of the areabetween the beginning and the end of the stroke remains uncertain.
The selections are displayed on the screen using the selec-tion display shader. The way how the selections are displayed isimportant for specific applications. Figure 6 shows two differentchoices how the selections can be displayed. In Figure 6(a), an ex-ample of outline drawing is shown. The red colour marks bordersbetween selected and unselected areas. The thickness of the borderdenotes the uncertainty of the selection in that particular area. In
c© 2014 The AuthorsComputer Graphics Forum published by John Wiley & Sons Ltd.
138 P. Mindek et al. / Managing Spatial Selections With Contextual Snapshots
(a) (b)
Figure 6: Two different selection display shaders. Both shaders areable to show the fuzziness of the selection.
Figure 6(b), the selection is displayed using an overlay texture. Thismethod shows the selected area in a clear way, but it also partiallyoccludes displayed data underneath.
4.3. Data transfer
The selection masks are stored in the GPU memory as a texturearray so that the visualization system can access them at all timesand employ them in the visual mapping. We used this ability inthe hurricane visualization application to create a smooth transitionbetween the two visualized variables.
The SE can be used to further increase possibilities of the selec-tions. It allows the visualization algorithm to extract processed datasamples to the GPU memory. The activated selections specify theDOI, which is used to automatically weight every extracted datasample. The extracted data can then be accessed in the embeddedvisualizations.
Currently, we provide an implementation of the SE for GLSLshaders. The SE inserts GLSL code for the extraction of data sam-ples and their weighting by the selections’ DOI functions in thevisualization shader before it is compiled. The inserted code usesatomic operations and the GL_EXT_shader_image_load_store ex-tension to output desired data. After the extraction, the data areavailable to the embedded visualizations as a texture stored in theGPU memory. It is possible to extend the SE for other languages aswell.
5. Application Example: Historical Document Analysis
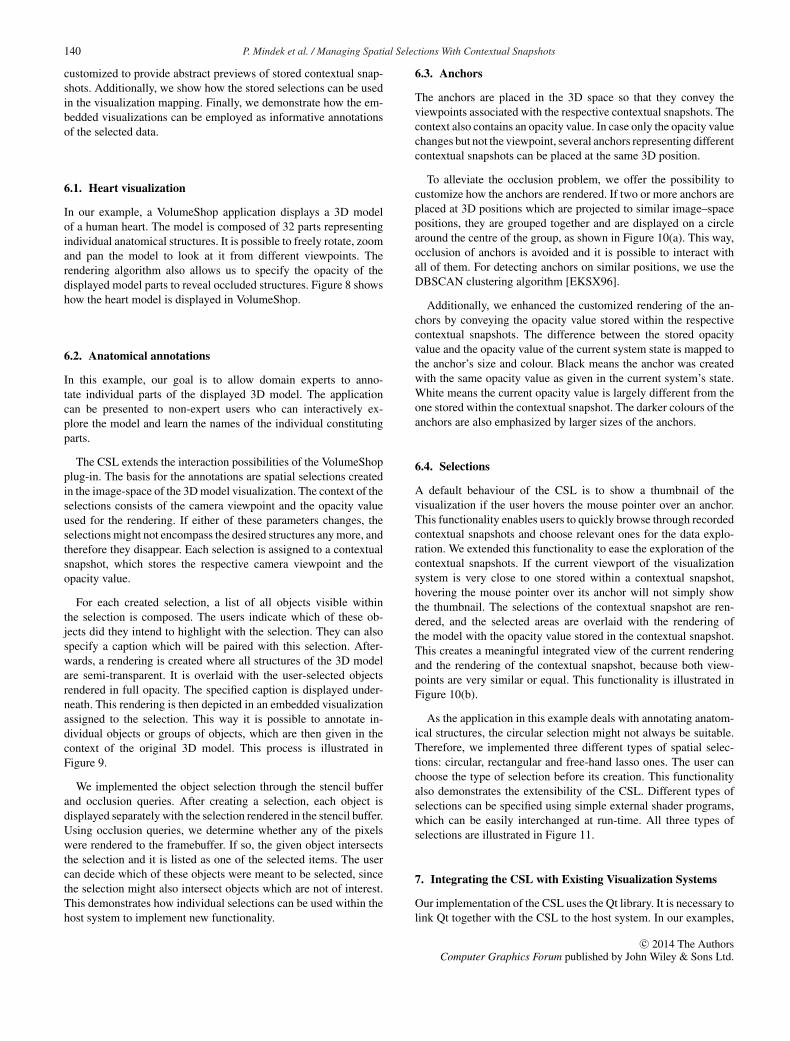
In addition to the example application introduced in Section 1, wepresent two more use cases of contextual snapshots. In the first one,we take a simple book reader application. A page spread consistingof two pages of a manuscript is displayed. A bar showing the cur-rent page within the manuscript is located below the pages. For abetter user experience, a simple page turning animation is realizedwhenever the current page changes.
We combine our method with the described book reader appli-cation in order to add functionality enabling the users to employit as an advanced manuscript analysis tool. We used the CSL toimplement spatial selections on the displayed pages. The CSL au-
tomatically binds every new selection to the current page, so manyselections on different pages can be created.
In this example, we demonstrate how the selections can be incor-porated into an existing system, how anchors can be positioned onthe screen to serve as bookmarks for individual selections, and howthe data specified by the selections can be displayed in the embed-ded visualizations. This example also demonstrates the possibilityto compare data from multiple selections in the same embedded vi-sualization. The embedded visualization can further contain variousinteractive elements, such as JavaScript-enabled web pages.
5.1. Manuscript visualization
The data set taken in this example consists of 723 high-resolutionphotographs of pages of the Venetus A, a 10th century (AD)manuscript of the Iliad catalogued as Marcianus Graecus Z. 454,now 822. In addition to natural light photographs, some of the pageswere recorded using UV photography as well. The UV light pho-tographs were taken in order to reveal some details of the manuscriptwhich were hardly visible with natural light. Together with the pho-tographs, the transcript of the Iliad in ancient Greek was availableas well.
For demonstration purposes, we manually pre-processed the ac-quired data. Some of the UV photographs were registered with thenatural light photographs so that they could be easily used in the ap-plication. Additionally, appropriate passages of the transcript werematched with some of the photographed pages.
The described book reader application is only capable of display-ing the natural light photographs. The book reader shows an iconfor those pages where the UV data are available. The goal in thisexample is to use the CSL to display parts of the UV photographs onselected regions of interest. The regions of interest are rectangularareas specified for the pages with UV data available.
5.2. Manuscript visualization enhancement
Figure 7(a) shows the book reading application without the enhance-ments. Figure 7(b) depicts the application enhanced by using theCSL. The contextual snapshots were used to manage the selections.The selections are employed to show parts of the UV photograph ofthe page. The transcript of the page as well as colour histograms ofthe selected parts of the natural light and UV photographs are dis-played on the left side of the image. These additional visualizationsare linked with the activated selections. The activated selections areconcurrently used to display parts of the registered UV photographof the selected page. Any of the additional visualizations can bemaximized, as shown in Figure 7(c).
The only parameter with an impact on the manuscript visualiza-tion is the index of the current page. This parameter determineswhich pages of the manuscript are displayed. As the turning of thepages is animated, we allow the current page index to be a realnumber. The fractional part of the index is used for the animationof the page turning.
Parts of the displayed pages can be selected. The selection ismeaningful only for the page in which it was created. The current
c© 2014 The AuthorsComputer Graphics Forum published by John Wiley & Sons Ltd.

P. Mindek et al. / Managing Spatial Selections With Contextual Snapshots 139
(a) (b) (c)
Figure 7: (a) The book reader application displaying the Venetus A manuscript. The icon (violet circle) on the top right corner indicates theavailability of UV light data for this particular page. (b) The book reader application enhanced with the CSL to show additional data. Ananchor of a contextual snapshot, selections and embedded visualizations are displayed. (c) The transcript of the displayed pages with the tagcloud in the maximized view. A word selected in the tag cloud is highlighted in yellow.
(a) (b)
Figure 8: (a) A 3D model of a human heart displayed in Vol-umeShop. (b) The model is displayed with a lower opacity to revealthe internal structures.
page index constitutes the visualization snapshot for this application,because it alone fully describes the context for the selections. Thecurrent page index is visualized by the book reader as a sliderdisplayed below the pages. The anchor of each contextual snapshotis placed on the slider according to the current page index. Theanchor therefore visually represents the position of the displayedpage spread and can be used as a bookmark.
The rectangular selections support the visual analysis of interest-ing parts of the photographs. By clicking the UV icon, displayingof the UV light photographs in the selections can be enabled or dis-abled. As the UV and natural light photographs are co-registered,the selections create a comprehensible integrated view.
We have implemented three web views which give web pages asembedded visualizations. With the web pages, we demonstrate thatthe embedded visualizations managed by the CSL are interactive andthat they can contain arbitrary content. The first web view containscolour histograms from the selections. As multiple selections can beactivated, we employed the JavaScript library D3 [BOH11] capableof displaying multiple histograms at once. For each selection, a
colour histogram is displayed. For the pages where the UV data areavailable, the histograms from the UV photographs are displayedas well. As all of the histograms are given in one view, they can beeasily compared.
The second web view shows the Greek transcript of the displayedpages. Contextual information of the selections, that is, the currentpage index, is used to load the appropriate pages from the transcript.A tag cloud of the most frequent words generated by the JavaScriptis displayed below the text.
The third web view contains a web page of the Perseus WordStudy Tool [Mah01]. This web application provides an Englishtranslation of a specified Greek word, as well as further informa-tion. We have connected this view with the Greek transcript of thedisplayed pages. The user can double-click on any word in the tran-script to automatically display its definition with the Perseus WordStudy Tool.
The application of the CSL in the book reader example demon-strates various ways how the contextual snapshots integrate dif-ferent views of the visualized data. This use case contains severaltypes of annotations which can be helpful in analysing the histor-ical manuscript. It shows that the integration of vastly differingvisualization techniques including online content and GPU-basedrendering is easily possible with our approach.
6. Application Example: Heart Visualization
In order to illustrate the possibilities of the CSL and the contextualsnapshots in general, we apply it to extend an existing visualizationsystem. We choose VolumeShop [BG05], a powerful visualizationsystem with a modular architecture. We extend a VolumeShop plug-in for rendering 3D meshes with contextual snapshots to createan application where it is possible to easily add annotations forindividual parts of the geometric model.
In this example, we demonstrate how user input can be trans-formed to different types of selections and how anchors can be
c© 2014 The AuthorsComputer Graphics Forum published by John Wiley & Sons Ltd.
140 P. Mindek et al. / Managing Spatial Selections With Contextual Snapshots
customized to provide abstract previews of stored contextual snap-shots. Additionally, we show how the stored selections can be usedin the visualization mapping. Finally, we demonstrate how the em-bedded visualizations can be employed as informative annotationsof the selected data.
6.1. Heart visualization
In our example, a VolumeShop application displays a 3D modelof a human heart. The model is composed of 32 parts representingindividual anatomical structures. It is possible to freely rotate, zoomand pan the model to look at it from different viewpoints. Therendering algorithm also allows us to specify the opacity of thedisplayed model parts to reveal occluded structures. Figure 8 showshow the heart model is displayed in VolumeShop.
6.2. Anatomical annotations
In this example, our goal is to allow domain experts to anno-tate individual parts of the displayed 3D model. The applicationcan be presented to non-expert users who can interactively ex-plore the model and learn the names of the individual constitutingparts.
The CSL extends the interaction possibilities of the VolumeShopplug-in. The basis for the annotations are spatial selections createdin the image-space of the 3D model visualization. The context of theselections consists of the camera viewpoint and the opacity valueused for the rendering. If either of these parameters changes, theselections might not encompass the desired structures any more, andtherefore they disappear. Each selection is assigned to a contextualsnapshot, which stores the respective camera viewpoint and theopacity value.
For each created selection, a list of all objects visible withinthe selection is composed. The users indicate which of these ob-jects did they intend to highlight with the selection. They can alsospecify a caption which will be paired with this selection. After-wards, a rendering is created where all structures of the 3D modelare semi-transparent. It is overlaid with the user-selected objectsrendered in full opacity. The specified caption is displayed under-neath. This rendering is then depicted in an embedded visualizationassigned to the selection. This way it is possible to annotate in-dividual objects or groups of objects, which are then given in thecontext of the original 3D model. This process is illustrated inFigure 9.
We implemented the object selection through the stencil bufferand occlusion queries. After creating a selection, each object isdisplayed separately with the selection rendered in the stencil buffer.Using occlusion queries, we determine whether any of the pixelswere rendered to the framebuffer. If so, the given object intersectsthe selection and it is listed as one of the selected items. The usercan decide which of these objects were meant to be selected, sincethe selection might also intersect objects which are not of interest.This demonstrates how individual selections can be used within thehost system to implement new functionality.
6.3. Anchors
The anchors are placed in the 3D space so that they convey theviewpoints associated with the respective contextual snapshots. Thecontext also contains an opacity value. In case only the opacity valuechanges but not the viewpoint, several anchors representing differentcontextual snapshots can be placed at the same 3D position.
To alleviate the occlusion problem, we offer the possibility tocustomize how the anchors are rendered. If two or more anchors areplaced at 3D positions which are projected to similar image–spacepositions, they are grouped together and are displayed on a circlearound the centre of the group, as shown in Figure 10(a). This way,occlusion of anchors is avoided and it is possible to interact withall of them. For detecting anchors on similar positions, we use theDBSCAN clustering algorithm [EKSX96].
Additionally, we enhanced the customized rendering of the an-chors by conveying the opacity value stored within the respectivecontextual snapshots. The difference between the stored opacityvalue and the opacity value of the current system state is mapped tothe anchor’s size and colour. Black means the anchor was createdwith the same opacity value as given in the current system’s state.White means the current opacity value is largely different from theone stored within the contextual snapshot. The darker colours of theanchors are also emphasized by larger sizes of the anchors.
6.4. Selections
A default behaviour of the CSL is to show a thumbnail of thevisualization if the user hovers the mouse pointer over an anchor.This functionality enables users to quickly browse through recordedcontextual snapshots and choose relevant ones for the data explo-ration. We extended this functionality to ease the exploration of thecontextual snapshots. If the current viewport of the visualizationsystem is very close to one stored within a contextual snapshot,hovering the mouse pointer over its anchor will not simply showthe thumbnail. The selections of the contextual snapshot are ren-dered, and the selected areas are overlaid with the rendering ofthe model with the opacity value stored in the contextual snapshot.This creates a meaningful integrated view of the current renderingand the rendering of the contextual snapshot, because both view-points are very similar or equal. This functionality is illustrated inFigure 10(b).
As the application in this example deals with annotating anatom-ical structures, the circular selection might not always be suitable.Therefore, we implemented three different types of spatial selec-tions: circular, rectangular and free-hand lasso ones. The user canchoose the type of selection before its creation. This functionalityalso demonstrates the extensibility of the CSL. Different types ofselections can be specified using simple external shader programs,which can be easily interchanged at run-time. All three types ofselections are illustrated in Figure 11.
7. Integrating the CSL with Existing Visualization Systems
Our implementation of the CSL uses the Qt library. It is necessary tolink Qt together with the CSL to the host system. In our examples,
c© 2014 The AuthorsComputer Graphics Forum published by John Wiley & Sons Ltd.

P. Mindek et al. / Managing Spatial Selections With Contextual Snapshots 141
(a) (b)
(c) (d)
Figure 9: (a) The user creates a circular selection and provides a caption for it. (b) When the selection is activated, an embedded visualizationof the selected object in the context of the original model is shown with the specified caption at the bottom. (c) Multiple selections in the samecontext (viewpoint and opacity value) can be created. All of their embedded visualizations are shown at once in the sliding bar. The one in themiddle is highlighted, as well as its associated selection (bold yellow circle). (d) The highlighted embedded visualization is maximized for abetter view. The embedded visualizations can be browsed in the sliding bar or in the maximized view.
c© 2014 The AuthorsComputer Graphics Forum published by John Wiley & Sons Ltd.

142 P. Mindek et al. / Managing Spatial Selections With Contextual Snapshots
(a) (b)
Figure 10: Custom usage of graphical elements of the CSL in theheart example: (a) Two groups of otherwise overlying anchors aredisplayed in a circular layout around the groups’ centres. (b) Hov-ering the mouse pointer over an anchor shows the selections fromthe respective contextual snapshots in an integrated view.
Figure 11: Different types of selections available in the heart appli-cation: circular (1), rectangular (2), free-hand lasso (3) selections.
the Qt library was already part of the host visualization systems,therefore there were no additional dependencies.
The CSL provides functions for creating and accessing theselections, activating them and adding embedded visualizations.However, there are no functionality for handling user input. It isnecessary to implement handling of keyboard and mouse events,and call-relevant functions from the CSL in the respective eventhandlers.
It is necessary to modify the rendering pipeline of the visualiza-tion system in such a way that the output is rendered to a texture,which is provided to the CSL as input. The CSL then renders allvisual elements (anchors, selections and embedded visualizations)with the input texture as background into an output texture. Theoutput texture is sent back to the visualization system. The ren-dering pipeline of the visualization system should be extended bydisplaying the output texture of the CSL on the screen instead ofits original output. This is usually fairly easy to achieve by takinga framebuffer object as a rendering target. Afterwards, a quad isrendered which covers the whole screen and which is textured withthe output texture of the CSL.
In the heart visualization example, the rendering of the anchorsis customized. This is done by subclassing a CSL class responsiblefor the rendering of the visual elements, and overriding the functionfor rendering of the anchors. The subclass also implements handlerswhich react to events from the CSL, such as requests to update incase visual elements of the CSL need to be repainted. If the hostvisualization system uses Qt, an alternative way for this would beto use Qt’s signal/slot mechanism.
8. Discussion
The goal of our work is to introduce a general concept for han-dling spatial selections created in changing contexts during a vi-sualization session. Instead of realizing a new standalone system,we implemented this concept as a flexible toolkit, that is, the CSL.The presented examples demonstrate that the CSL is ready to beintegrated with different existing visualization systems. Section 7describes the implementation efforts needed for the integration ofthe CSL in the provided examples.
In Sections 5 and 6, we give examples how the concept of con-textual snapshots can be employed. State-of-the-art visualizationsystems usually treat selections in such a way that it is necessaryto use several linked views to work with multiple selections si-multaneously. To employ selections as interactive annotations, eachselection would have to be assigned a separate view, possibly in aseparate window. Contextual snapshots allow us to realize multipleselections in the same view while the changes of the visualizationare automatically tracked. Our method does not provide a guidancefor finding appropriate views or means for selecting the data au-tomatically. It extends the common possibilities of data selectionsto act as data annotations, to convey and to communicate users’findings. In this way, the contextual snapshots support users in thedata exploration process.
By employing the CSL to render the selections, the anchorsand the embedded visualizations, the performance of the renderingdropped from 60 FPS to 30 FPS in the historical document anal-ysis example. The performance drop of the whole system mainlydepends on the temporal requirements of the embedded visualiza-tions. This aspect can be improved in the future by parallelizing therendering of individual embedded visualizations. In the heart vi-sualization example, there is no significant performance drop afterintegrating the CSL, since the embedded visualizations only showstatic images.
We encourage the usage of the CSL, since contextual snapshotscan be beneficial for a wide variety of applications. Therefore, wemade the CSL available [csl]. There a detailed tutorial explainswith a simple application case how to ingrate the CSL into existingvisualization systems.
9. Conclusion
In this work, we proposed a method for managing image–space se-lections which can be used for various tasks, such as highlightingof interesting regions in visualizations, displaying additional viewsfor selected data or comparing different spatial regions. We demon-strated the utility of the method by applying it to three distinct use
c© 2014 The AuthorsComputer Graphics Forum published by John Wiley & Sons Ltd.
P. Mindek et al. / Managing Spatial Selections With Contextual Snapshots 143
cases, namely analysis of a historical manuscript, analysis of mul-tivariate weather simulation data and annotation of the geometricalmodel of a human heart.
Our method is meant to be applied to visualization systems wherethe state changes over the duration of a visualization session. Mostof the interactive systems fulfil this characteristic. In our method, theuser-made selections in image space are linked with all necessarycontextual information so that they remain meaningful during thewhole session.
Acknowledgements
The presented work has been partially supported by the ViMaLproject (FWF - Austrian Research Fund, no. P21695) and by theAktion OE/CZ grant number 64p11. The Venetus A data set iscourtesy of The Homer Multitext Project. The hurricane Isabel dataset is produced by the Weather Research and Forecast (WRF) model,courtesy of NCAR and the U.S. National Science Foundation (NSF).
References
[Bal10] BALABANIAN J.-P.: Multi-Aspect Visualization: Going fromLinked Views to Integrated Views. PhD thesis, Department ofInformatics, University of Bergen, Norway, 2010.
[BCC*05] BAVOIL L., CALLAHAN S. P., CROSSNO P. J., FREIRE J., VO H.T.: Vistrails: Enabling interactive multiple-view visualizations. InIEEE Visualization 2005 (2005), pp. 135–142.
[BG05] BRUCKNER S., GROLLER M. E.: Volumeshop: An interactivesystem for direct volume illustration. In Proceedings of IEEEVisualization 2005 (Oct. 2005), C. T. Silva, E. Groller and H.Rushmeier (Eds.), pp. 671–678.
[BOH11] BOSTOCK M., OGIEVETSKY V., HEER J.: D3: Data-drivendocuments. IEEE Transactions on Visualization and ComputerGraphics 17, 12 (2011), 2301–2309.
[BSP*93] BIER E. A., STONE M. C., PIER K., BUXTON W., DEROSE
T. D.: Toolglass and magic lenses: The see-through interface. InProceedings of the 20th Annual Conference on Computer Graph-ics and Interactive Techniques (New York, NY, USA, 1993),SIGGRAPH ’93, ACM, pp. 73–80.
[BVMG08] BALABANIAN J.-P., VIOLA I., MOLLER T., GROLLER E.:Temporal styles for time-varying volume data. In Proceedingsof 3DPVT’08: The Fourth International Symposium on 3D DataProcessing, Visualization and Transmission (Atlanta, GA, USAJune 2008), S. Gumhold, J. Kosecka and O. Staadt (Eds.), GeorgiaInstitute of Technology, pp. 81–89.
[csl] Contextual snapshot library. http://cg.tuwien.ac.at/downloads/csl/. Accessed: April 2014.
[DGH03] DOLEISCH H., GASSER M., HAUSER H.: Interactive featurespecification for focus+context visualization of complex sim-ulation data. In Proceedings of the Symposium on Data Visu-
alisation 2003 (Aire-la-Ville, Switzerland, 2003),VISSYM ’03,Eurographics Association, pp. 239–248.
[DH02] DOLEISCH H., HAUSER H.: Smooth brushing forfocus+context visualization of simulation data in 3D. Journalof WSCG 10 (2002), 147–154.
[EKF*09] ELLKVIST T., KOOP D., FREIRE J., SILVA C., STROMBACK
L.: Using mediation to achieve provenance interoperability. InProceedings of the IEEE International Workshop on ScientificWorkflows, 2009 (Washington, DC, USA, 2009), IEEE ComputerSociety, pp. 291–298.
[EKSX96] ESTER M., KRIEGEL H. P., SANDER J., XU X.: A Density-based algorithm for discovering clusters in large spatial databaseswith noise. In Second International Conference on KnowledgeDiscovery and Data Mining (Portland, OR, USA, 1996), E.Simoudis, J. Han and U. Fayyad (Eds.), AAAI Press, pp. 226–231.
[Fur86] FURNAS G. W.: Generalized fisheye views. In Proceedings ofthe SIGCHI Conference on Human Factors in Computing Systems(New York, NY, USA, 1986), CHI ’86, ACM, pp. 16–23.
[GMY11] GUO H., MAO N., YUAN X.: Wysiwyg (what yousee is what you get) volume visualization. IEEE Transac-tions on Visualization and Computer Graphics 17 (2011),2106–2114.
[GRIG12] GERL M., RAUTEK P., ISENBERG T., GROLLER E.: Semanticsby analogy for illustrative volume visualization. Computers &Graphics 36, 3 (2012), 201–213.
[GS06] GROTH D. P., STREEFKERK K.: Provenance and annota-tion for visual exploration systems. IEEE Transactions onVisualization and Computer Graphics 12, 6 (Nov. 2006),1500–1510.
[HMSA08] HEER J., MACKINLAY J., STOLTE C., AGRAWALA M.: Graph-ical histories for visualization: Supporting analysis, communica-tion, and evaluation. IEEE Transactions on Visualization andComputer Graphics 14, 6 (Nov. 2008), 1189–1196.
[KNS04] KREUSELER M., NOCKE T., SCHUMANN H.: A history mech-anism for visual data mining. In Proceedings of the IEEE Sym-posium on Information Visualization (Washington, DC, USA,2004), InfoVis ’04, IEEE Computer Society, pp. 49–56.
[KSH04] KOSARA R., SAHLING G. N., HAUSER H.: Linking sci-entific and information visualization with interactive 3D scat-terplots. In Proceedings of the 12th International Conferencein Central Europe on Computer Graphics, Visualization andComputer Vision (WSCG) (Pilsen, Czech Republic, 2004), pp.133–140.
[Mah01] MAHONEY A.: Studying the word study tool. New EnglandClassical Journal 28, 3 (2001), 181–183.
[MBG13] MINDEK P., BRUCKNER S., GROLLER M. E.: Contex-tual snapshots: Enriched visualization with interactive spatial
c© 2014 The AuthorsComputer Graphics Forum published by John Wiley & Sons Ltd.

144 P. Mindek et al. / Managing Spatial Selections With Contextual Snapshots
annotations. In Spring Conference on Computer Graphics (NewYork, NY, USA, 2013), SCCG ’13, ACM, pp. 49–56.
[PKH04] PIRINGER H., KOSARA R., HAUSER H.: Interactivefocus+context visualization with linked 2D/3D scatterplots. InProceedings of the Second International Conference on Coordi-nated & Multiple Views in Exploratory Visualization (Washing-ton, DC, USA, 2004), CMV ’04, IEEE Computer Society, pp.49–60.
[RSD*13] RUNGTA A., SUMMA B., DEMIR D., BREMER P.-T., PASCUCCI
V.: Manyvis: Multiple applications in an integrated visualizationenvironment. IEEE Transactions on Visualization and ComputerGraphics 19, 12 (2013), 2878–2885.
[SLA*09] SANTOS E., LINS L., AHRENS J., FREIRE J., SILVA C.: Vis-mashup: Streamlining the creation of custom visualization ap-plications. IEEE Transactions on Visualization and ComputerGraphics 15 (2009), 1539–1546.
[SSL*12] STREIT M., SCHULZ H.-J., LEX A., SCHMALSTIEG D., SCHU-MANN H.: Model-driven design for the visual analysis of hetero-geneous data. IEEE Transactions on Visualization and ComputerGraphics 18 (2012), 998–1010.
[Tor04] TORY M.: Combining Two-Dimensional and Three-Dimensional Views for Visualization of Spatial Data. PhD thesis,Burnaby, BC, Canada, 2004.
[UMDS08] UNGER A., MUIGG P., DOLEISCH H., SCHUMANN H.: Vi-sualizing statistical properties of smoothly brushed data subsets.In Proceedings of the 12th International Conference Informa-tion Visualization (London, UK, 2008), IEEE Computer Society,pp. 233–239.
[UZW*07] ULINSKI A. C., ZANBAKA C. A., WARTELL Z., GOOLKASIAN
P., HODGES L. F.: Two handed selection techniques for volumetricdata. In IEEE Symposium on 3D User Interfaces (Charlotte, NC,USA,2007), p. 26.
[WWYM10] WEI J., WANG C., YU H., MA K.-L.: A sketch-based in-terface for classifying and visualizing vector fields. In PacificVis(2010), IEEE, pp. 129–136.
[YEII12] YU L., EFSTATHIOU K., ISENBERG P., ISENBERG T.: Effi-cient structure-aware selection techniques for 3D point cloudvisualizations with 2DOF input. IEEE Transactions on Vi-sualization and Computer Graphics 18, 12 (2012), 2245–2254.
Supporting Information
Additional Supporting Information may be found in the online ver-sion of this article at the publisher’s web site:
Video S1
c© 2014 The AuthorsComputer Graphics Forum published by John Wiley & Sons Ltd.