Management's report
72
Transcript of Management's report

Management's report
Financial highlights - Danske Bank Group 3 Executive summary 4 Financial review 7 Personal & Business Customers 13 Large Corporates & Institutions 15 Danica Pension 17 Northern Ireland 19 Non-core 21 Group Functions 22
Financial statements
Income statement 25 Statement of comprehensive income 26 Balance sheet 27 Statement of capital 28 Cash flow statement 30 Notes 31
Statements
Statement by the management 70 Independent auditor's review report 71 Supplementary information 72
Danske Bank / Interim report – first half 2021 3/72
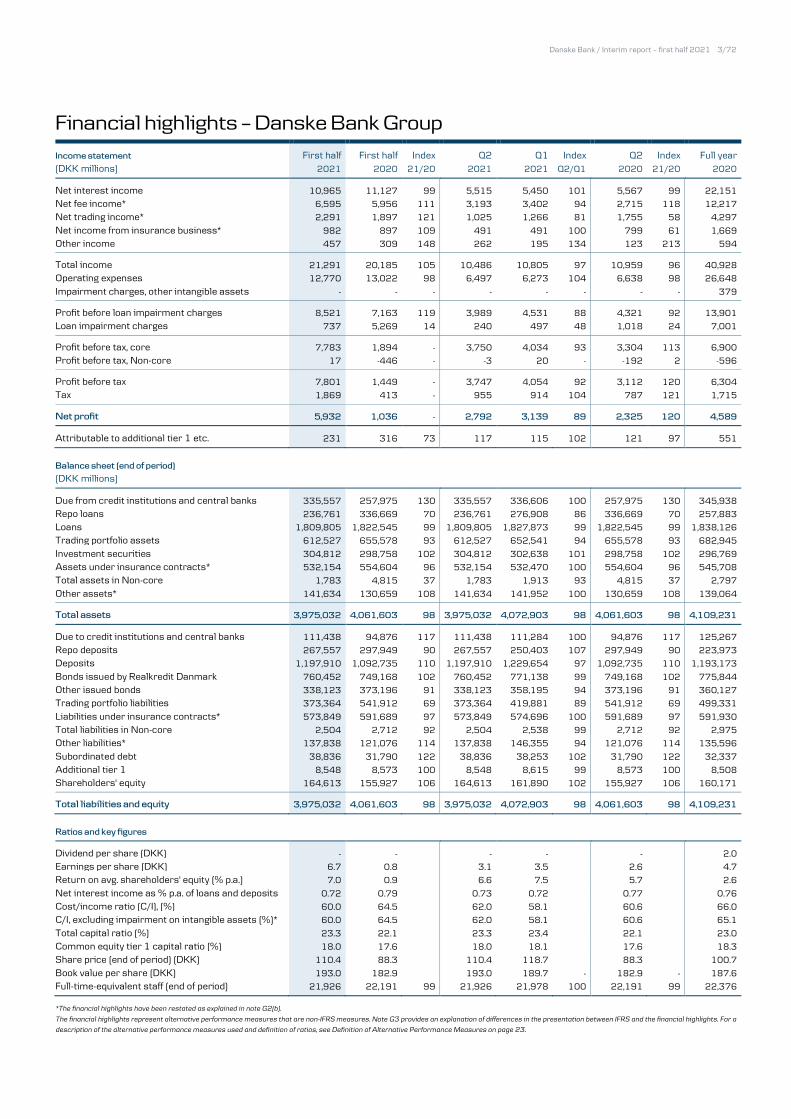
Financial highlights – Danske Bank Group Income statement First half First half Index Q2 Q1 Index Q2 Index Full year (DKK millions) 2021 2020 21/20 2021 2021 Q2/Q1 2020 21/20 2020
Net interest income 10,965 11,127 99 5,515 5,450 101 5,567 99 22,151
Net fee income* 6,595 5,956 111 3,193 3,402 94 2,715 118 12,217
Net trading income* 2,291 1,897 121 1,025 1,266 81 1,755 58 4,297
Net income from insurance business* 982 897 109 491 491 100 799 61 1,669
Other income 457 309 148 262 195 134 123 213 594
Total income 21,291 20,185 105 10,486 10,805 97 10,959 96 40,928
Operating expenses 12,770 13,022 98 6,497 6,273 104 6,638 98 26,648
Impairment charges, other intangible assets - - - - - - - - 379
Profit before loan impairment charges 8,521 7,163 119 3,989 4,531 88 4,321 92 13,901
Loan impairment charges 737 5,269 14 240 497 48 1,018 24 7,001
Profit before tax, core 7,783 1,894 - 3,750 4,034 93 3,304 113 6,900
Profit before tax, Non-core 17 -446 - -3 20 - -192 2 -596
Profit before tax 7,801 1,449 - 3,747 4,054 92 3,112 120 6,304
Tax 1,869 413 - 955 914 104 787 121 1,715
Net profit 5,932 1,036 - 2,792 3,139 89 2,325 120 4,589
Attributable to additional tier 1 etc. 231 316 73 117 115 102 121 97 551 Balance sheet (end of period) (DKK millions)
Due from credit institutions and central banks 335,557 257,975 130 335,557 336,606 100 257,975 130 345,938
Repo loans 236,761 336,669 70 236,761 276,908 86 336,669 70 257,883
Loans 1,809,805 1,822,545 99 1,809,805 1,827,873 99 1,822,545 99 1,838,126
Trading portfolio assets 612,527 655,578 93 612,527 652,541 94 655,578 93 682,945
Investment securities 304,812 298,758 102 304,812 302,638 101 298,758 102 296,769
Assets under insurance contracts* 532,154 554,604 96 532,154 532,470 100 554,604 96 545,708
Total assets in Non-core 1,783 4,815 37 1,783 1,913 93 4,815 37 2,797
Other assets* 141,634 130,659 108 141,634 141,952 100 130,659 108 139,064
Total assets 3,975,032 4,061,603 98 3,975,032 4,072,903 98 4,061,603 98 4,109,231
Due to credit institutions and central banks 111,438 94,876 117 111,438 111,284 100 94,876 117 125,267
Repo deposits 267,557 297,949 90 267,557 250,403 107 297,949 90 223,973
Deposits 1,197,910 1,092,735 110 1,197,910 1,229,654 97 1,092,735 110 1,193,173
Bonds issued by Realkredit Danmark 760,452 749,168 102 760,452 771,138 99 749,168 102 775,844
Other issued bonds 338,123 373,196 91 338,123 358,195 94 373,196 91 360,127
Trading portfolio liabilities 373,364 541,912 69 373,364 419,881 89 541,912 69 499,331
Liabilities under insurance contracts* 573,849 591,689 97 573,849 574,696 100 591,689 97 591,930
Total liabilities in Non-core 2,504 2,712 92 2,504 2,538 99 2,712 92 2,975
Other liabilities* 137,838 121,076 114 137,838 146,355 94 121,076 114 135,596
Subordinated debt 38,836 31,790 122 38,836 38,253 102 31,790 122 32,337
Additional tier 1 8,548 8,573 100 8,548 8,615 99 8,573 100 8,508
Shareholders' equity 164,613 155,927 106 164,613 161,890 102 155,927 106 160,171
Total liabilities and equity 3,975,032 4,061,603 98 3,975,032 4,072,903 98 4,061,603 98 4,109,231 Ratios and key figures
Dividend per share (DKK) - - - - - 2.0
Earnings per share (DKK) 6.7 0.8 3.1 3.5 2.6 4.7
Return on avg. shareholders' equity (% p.a.) 7.0 0.9 6.6 7.5 5.7 2.6
Net interest income as % p.a. of loans and deposits 0.72 0.79 0.73 0.72 0.77 0.76
Cost/income ratio (C/I), (%) 60.0 64.5 62.0 58.1 60.6 66.0
C/I, excluding impairment on intangible assets (%)* 60.0 64.5 62.0 58.1 60.6 65.1
Total capital ratio (%) 23.3 22.1 23.3 23.4 22.1 23.0
Common equity tier 1 capital ratio (%) 18.0 17.6 18.0 18.1 17.6 18.3
Share price (end of period) (DKK) 110.4 88.3 110.4 118.7 88.3 100.7
Book value per share (DKK) 193.0 182.9 193.0 189.7 - 182.9 - 187.6
Full-time-equivalent staff (end of period) 21,926 22,191 99 21,926 21,978 100 22,191 99 22,376 *The financial highlights have been restated as explained in note G2(b).
The financial highlights represent alternative performance measures that are non-IFRS measures. Note G3 provides an explanation of differences in the presentation between IFRS and the financial highlights. For a
description of the alternative performance measures used and definition of ratios, see Definition of Alternative Performance Measures on page 23.
Danske Bank / Interim report – first half 2021 4/72
Executive summary In the first half of 2021, we saw a gradual reopening of the Nordic societies as the vaccines were being rolled out. As a result of this, we saw a recovery in the economies, with labour markets improving faster than in previous crises, and consumer spending also approached or even exceeded normal levels. The continuing rebound of economic activity in Denmark as well as in the other Nordic countries is likely to have a positive effect on customer activity and credit demand for the rest of the year, allowing for a favourable operating environment. While there are grounds for optimism regarding the ongoing economic recovery, it is too early to conclude on the macroeconomic implications of the coronavirus pandemic. In particular, it remains to be seen how both the rolling off of government support packages and tapering from the central banks, and the timing of these, might affect businesses in the most impacted sectors and the overall economies. As a result of economic developments, we saw a more normalised level of impairments than was the case in the first half of 2020. This, combined with higher income and lower expenses, led to Danske Bank posting a net profit of DKK 5.9 billion for the first half of 2021, against DKK 1.0 billion for the same period in 2020. The return on shareholders’ equity was 7.0%, against 0.9% in the first half of 2020. The result is a clear improvement, however, we still need to work determinedly in order to fulfil our financial ambitions. Better Bank We have a strong foundation for becoming a better bank for all of our stakeholders and are seeing good momentum with compliance and costs, for instance, but we are also making good progress on further execution on all planned commercial initiatives across our markets. Part of our work to become a better bank entails a strong focus on simplifying our business and refocusing our efforts on the Nordic markets, where we continue to aim to dedicate more attention and resources to our core segments. As part of these efforts, on 1 July 2021, we announced the sale of our business activities in Luxembourg, which will simplify our footprint and allow us to focus more on serving and developing solutions for the Nordic markets. Moreover, to further strengthen product development and innovation and thereby provide a market-leading customer experience within payment solutions, on 30 June 2021, Dansk Bank announced the merger of MobilePay with mobile payment providers Vipps in Norway and Pivo in Finland. In our efforts to take our compliance function to the next level, we are making good progress with our Financial Crime Prevention plan and have upgraded our compliance-related IT systems and processes significantly. We recently confirmed to the Danish FSA that we have achieved the milestone of updating our Know Your Customer information for a significant part of our personal, business, large corporate and institutional customer base. We remain focused on completing still outstanding due diligence work for
selected subsidiaries. This work is scheduled to be completed between end-2021 and 2023. As part of these compliance IT efforts, Danske Bank successfully developed and deployed a first solution that will allow customers to submit their personal information through a digital channel. Another key achievement was the successful embedding of an automated review capability. Alongside the manual review capabilities that we maintain, this automated solution supports us in assessing customer information and customers’ use of our products and services. On the sustainability journey, we continued to take a leading role within sustainable finance, supported by our customers’ strong positioning in the sustainability transition. Strong customer demand led to a new, ambitious 2023 target of providing DKK 300 billion in sustainable finance. During the first half of the year, we supported issuers and investors in a substantial number of transactions, affirming our position as a leading Nordic bank within sustainable finance. Activity was high across business areas, and we are proud to be ranked number one among the Nordic banks within both issuance of sustainability-linked loans and sustainable bonds. In the first half of 2021, we were dedicated to this focus and will remain so. As a part of this, the Danske Bank structuring and arranging of the successful Swedish International Development Agency guaranteed social bond issue is a good example of how banks can contribute to developing the sustainable bond market, as this is the first example in the world of a guarantee being provided to a business issuing social bonds sold to private investors. For Personal & Business Customers, we launched a number of initiatives to promote the sustainable development for the benefit of our customers, including an attractive car loan offer in Denmark for both electric cars and plug-in hybrid cars. We made good progress with our customer journeys by digitalising processes and ensuring better adoption of already launched digital solutions. For example, in Sweden, 95% of mortgage applications now run through a digital flow, and in Denmark, our recent improvements to our ‘Click-to-remortgage’ process for personal customers allow for more efficient processes and additional calculation options. In addition, we recently launched a new digital car loan process in Norway, for which we have seen solid results in terms of generating more volume, thus underlining the positive effect of digitalising our customer journeys. These results are important elements in supporting our digital transformation, and we will continue to build on them in our planned further digitalisation initiatives to ensure we capture the full potential. Customer satisfaction Our efforts to strengthen customer journeys and offerings at Large Corporates & Institutions continued to support high customer satisfaction in this segment. In Denmark, we are seeing a stable trend, ranking as number one, and we are also ranked number one in the Nordic countries overall. Customer satisfaction in the SME segment also remained strong, as among small businesses, we rank number two in all
Danske Bank / Interim report – first half 2021 5/72
countries, and saw an increase in satisfaction scores in almost all countries, except in Sweden where levels were stable from the end of 2020. Among medium-sized businesses, we rank number two in Norway and Sweden. The overall development in the personal customer segment continues to have our attention, as we see a slightly decreasing trend. Financials In the first half of 2021, total income was up 5% from the same period last year. This was driven mainly by a strong per-formance of our capital markets offerings, as customer activ-ity increased and we continued to support customers with their capital needs, combined with a rebound in trading in-come as a result of solid customer activity. Lending was down in the first half of 2021 from the level at the end of 2020. The decrease was due primarily to a decline in lending at Large Corporates & Institutions as customers are drawing less on credit facilities. At Personal & Business Customers Nordic, we saw an increase in lending, particu-larly at Personal Customers Norway. Deposit volumes maintained an elevated level both at Per-sonal & Business Customers and at Large Corporates & In-stitutions. At Large Corporate & Institutions, deposit vol-umes increased significantly. In the first half of 2021, net interest income benefited from the deposit repricing at the beginning of 2021, however, the positive effect was more than offset by the elevated deposit surplus and margin pressure across the Nordic countries. Net fee income increased in the first half of 2021 from the level in same period last year due to higher customer activity, especially within our capital markets activities, where we continued to support and assist our customers, including with their sustainability transition. This means that our capi-tal markets offerings are delivering, and large corporate cus-tomers in particular have raised funding from capital mar-kets instead of bank lending, which is sustaining the strong level of fee income. We are proud to have been chosen for a large number of landmark transactions – ensuring Danske Bank a number one position as the leading Nordic bank in terms of supported volumes in the first half of 2021 across both debt and equity capital markets. Furthermore, Asset Management realised positive net sales in the retail segment for the third consecutive quarter. Net trading income performed better than in the same period last year due to improving market conditions for Large Corporates & Institutions. In our insurance business, we saw a significant growth in premiums as well as an inflow of new large customers, which shows that we have a strong position in the market. Furthermore, more normalised market conditions have given customers good returns and strengthened the result, despite a tax-related one-off item in the period. We saw lower expenses in the first half of 2021 than in the same period last year, driven by lower transformation costs. Costs continue the downward trend driven by cost initiatives
launched during the past year, and the level of underlying ex-penses is improving, despite primarily tax-related one-off items in the period. Credit quality remained strong, as we saw a low level of actual credit deterioration and have made sufficient impairment charges against key exposures impacted by the coronavirus pandemic. We continue to see more normalised impairment levels than in the first half of 2020, and on a quarterly basis, impairments were further down due to model-driven reversals as a result of better-than-expected macroeconomic developments. Capital, funding and regulation Our capital position remained strong with a total capital ratio of 23.3% and a CET1 capital ratio of 18.0%. On 22 June 2021, the Danish Systemic Risk Council recom-mended an increase in the counter-cyclical buffer in Denmark from the current 0% to 1% effective from 30 September 2022 as per the normal one-year transition period. The Dan-ish Ministry of Industry, Business and Financial Affairs has announced that the recommendation will be followed. In the first half of 2021, the Group issued covered bonds in the amount of DKK 18.1 billion, senior debt of DKK 2 billion, non-preferred (green) senior debt of DKK 3.7 billion, tier 2 capital of DKK 5.6 billion and additional tier 1 capital of DKK 4.5 billion, bringing total long-term wholesale funding to DKK 33.9 billion. Credit ratings On 11 June 2021, Fitch Ratings revised their outlook on Danske Bank A/S’s long-term issuer rating to Stable from Negative. On 13 July 2021, Moody’s upgraded Danske Bank’s non-preferred senior debt rating to Baa2 from Baa3 and revised the outlook on Danske Bank’s A2 deposit rating to Stable from Negative. Outlook for 2021 The outlook has been updated. As stated in company an-nouncement no. 7 of 8 July 2021, we now expect a net profit of more than DKK 12 billion. The upward revision is based on lower-than-expected loan impairment charges due to a faster-than-anticipated macroeconomic recovery as well as higher customer activity. In addition, we expect a gain from the sale of the business activities in Luxembourg that will, however, be offset by a number of provisions for additional tax-related one-off items in the second half of the year. We expect total income in 2021 to be higher, including the gain from the sale of the business activities in Luxembourg and higher customer activity. Underlying operating expenses are expected to be lower than DKK 24.5 billion. Total expenses are expected to be no more than DKK 25 billion, including additional tax-related one-off items in the second half of the year of around DKK 0.2 billion.

Danske Bank / Interim report – first half 2021 6/72
Impairment charges are now expected to be no more than DKK 1.5 billion, due primarily to lower model-driven impairment charges as a result of a better-than-expected macroeconomic recovery and overall improved credit quality. We maintain our ambition for a return on shareholders’ equity of 9-10% in 2023. The outlook is subject to uncertainty and depends on economic conditions, including government support packages.
Danske Bank / Interim report – first half 2021 7/72
Financial review
First half 2021 vs first half 2020 Net profit increased to DKK 5,932 million (H1 2020: DKK 1,036 million) due to significantly lower loan impairment charges and a 5% increase in income driven by higher net fee income and net trading income. Income Net interest income stood at DKK 10,965 million (H1 2020: DKK 11,127 million). Net interest income was positively impacted by the deposit repricing initiatives at Personal & Business Customers Denmark that were implemented at the beginning of 2021. The positive effect was, however, more than offset by an elevated deposit surplus and overall margin pressure across the Nordic countries as well as a lower funding value of deposits across all markets. Net fee income rose 11% to DKK 6,595 million (H1 2020: DKK 5,956 million), driven by high customer activity in the capital markets, as particularly our large corporate customers raised funding from capital markets instead of via bank lending, which is sustaining the strong level of fee income. Assets under management increased from the level in the first half of 2020, which also had a positive impact on net fee income. Net trading income increased to DKK 2,291 million (H1 2020: DKK 1,897 million). The increase was due to improved market conditions for Large Corporates & Institutions and positive value adjustments of the derivatives portfolio. A gain of DKK 227 million on the sale of VISA shares in the Group’s private equity portfolio also contributed to the increase in net trading income. Net income from insurance business amounted to DKK 982 million (H1 2020: DKK 897 million). The increase was due to positive market conditions, which also benefited our customers. The increase in income also reflects significant growth in premiums as well as an inflow of new large customers, which shows that we have a strong position in the market. Additionally, the underlying business within health and accident insurance is improving, however, some of this effect was offset by a provision of DKK 200 million related to pension yield tax. Other income amounted to DKK 457 million (H1 2020: DKK 309 million) due to our real estate agency home seeing high activity on the housing market. Expenses Operating expenses decreased to DKK 12,770 million (H1 2020: DKK 13,022 million) and thus continued the downward trend into the first half of 2021. The decrease mainly reflects lower costs for transformation and consultancy but also our constant focus on lowering the cost base. Provisions totalling DKK 500 million related to the VAT case in Sweden, following a ruling by the European Court of Justice, and a one-off investment of DKK 122 million to ensure good working-from-home conditions had a partly offsetting effect.
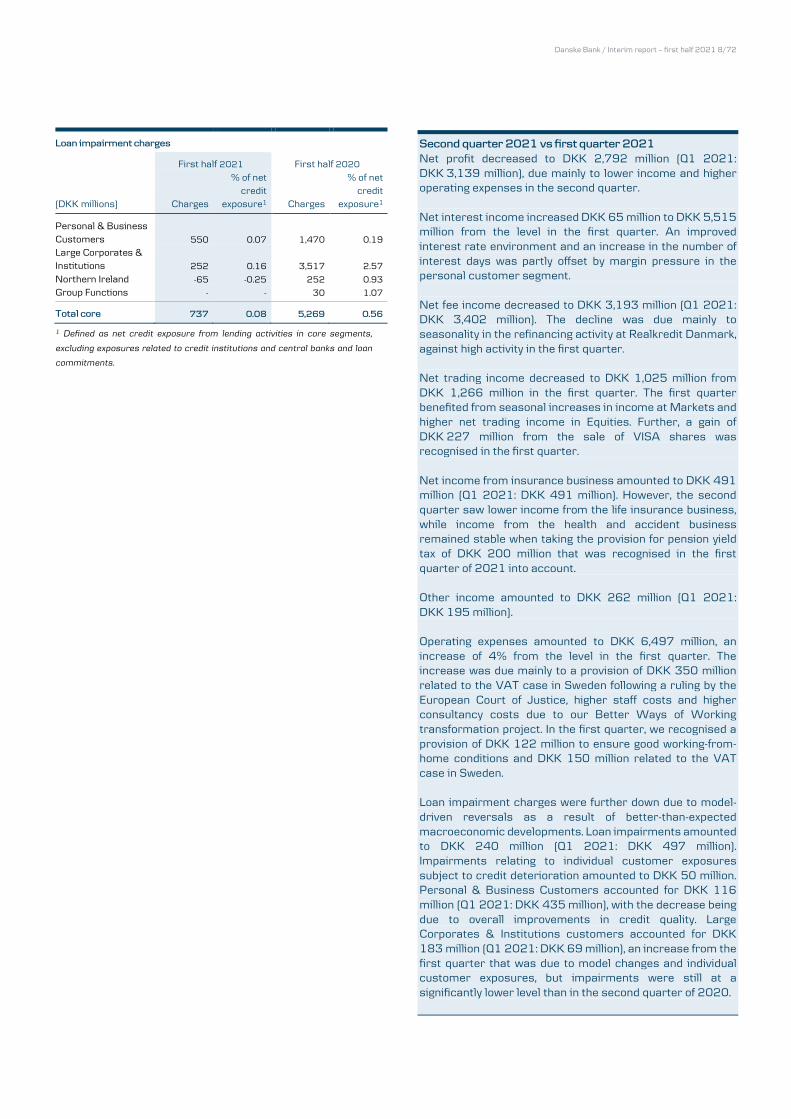
Loan impairments Loan impairment charges in core activities were low in the first half of 2021 and amounted to DKK 737 million (H1 2020: DKK 5,269 million). Impairments mainly reflected a credit deterioration of individual customer exposures of DKK 450 million, relating primarily to segments hit by the lockdown of societies in most of 2021. The full effect of the corona crisis is, however, still uncertain and depends on the phase-out of government support packages, the finalisation of the roll-out of vaccinations and the risk of virus variants causing further lockdowns. Impairments were still at a significantly lower level than in the first half of 2020. At 30 June 2021, Danske Bank had ensured compliance with the Danish FSA orders regarding impairments received on 13 April 2021 in light of the corona crisis. Danske Bank now complies with all Danish FSA orders regarding impairments. In May 2021, the Danish FSA conducted an inspection of the impairment charges made by Danske Bank’s branch in Swe-den against loans to its business customers. The FSA as-sessed that our guidelines for staging of loans were generally satisfactory. Furthermore, the FSA assessed that the impair-ment charges made against the loans with objective evidence of credit impairment that were reviewed by the FSA, including the management overlays, were adequate. Personal & Business Customers accounted for the main part of the loan impairment charges made in the first half of 2021, which were made against individual customer exposures as a result of the corona crisis, for instance in the hotel, restaurants and leisure segments. We continue to see more normalised impairment levels than in the first half of 2020, and on a quarterly basis, impairments were further down due to model-driven reversals as a result of better-than-expected macroeconomic developments. At Large Corporates & Institutions, loan impairment charges fell significantly in the first half of 2021 from the level in the first half of 2020 owing to a decline in charges against exposures to customers in the oil and gas industry. Charges against exposures to customers outside the oil and gas industry were limited.
Danske Bank / Interim report – first half 2021 8/72
Loan impairment charges
First half 2021 First half 2020
(DKK millions) Charges
% of net credit
exposure1 Charges
% of net credit
exposure1
Personal & Business Customers 550 0.07 1,470 0.19
Large Corporates & Institutions 252 0.16 3,517 2.57
Northern Ireland -65 -0.25 252 0.93
Group Functions - - 30 1.07
Total core 737 0.08 5,269 0.56
1 Defined as net credit exposure from lending activities in core segments,
excluding exposures related to credit institutions and central banks and loan
commitments.
Second quarter 2021 vs first quarter 2021 Net profit decreased to DKK 2,792 million (Q1 2021: DKK 3,139 million), due mainly to lower income and higher operating expenses in the second quarter. Net interest income increased DKK 65 million to DKK 5,515 million from the level in the first quarter. An improved interest rate environment and an increase in the number of interest days was partly offset by margin pressure in the personal customer segment. Net fee income decreased to DKK 3,193 million (Q1 2021: DKK 3,402 million). The decline was due mainly to seasonality in the refinancing activity at Realkredit Danmark, against high activity in the first quarter. Net trading income decreased to DKK 1,025 million from DKK 1,266 million in the first quarter. The first quarter benefited from seasonal increases in income at Markets and higher net trading income in Equities. Further, a gain of DKK 227 million from the sale of VISA shares was recognised in the first quarter. Net income from insurance business amounted to DKK 491 million (Q1 2021: DKK 491 million). However, the second quarter saw lower income from the life insurance business, while income from the health and accident business remained stable when taking the provision for pension yield tax of DKK 200 million that was recognised in the first quarter of 2021 into account. Other income amounted to DKK 262 million (Q1 2021: DKK 195 million). Operating expenses amounted to DKK 6,497 million, an increase of 4% from the level in the first quarter. The increase was due mainly to a provision of DKK 350 million related to the VAT case in Sweden following a ruling by the European Court of Justice, higher staff costs and higher consultancy costs due to our Better Ways of Working transformation project. In the first quarter, we recognised a provision of DKK 122 million to ensure good working-from-home conditions and DKK 150 million related to the VAT case in Sweden. Loan impairment charges were further down due to model-driven reversals as a result of better-than-expected macroeconomic developments. Loan impairments amounted to DKK 240 million (Q1 2021: DKK 497 million). Impairments relating to individual customer exposures subject to credit deterioration amounted to DKK 50 million. Personal & Business Customers accounted for DKK 116 million (Q1 2021: DKK 435 million), with the decrease being due to overall improvements in credit quality. Large Corporates & Institutions customers accounted for DKK 183 million (Q1 2021: DKK 69 million), an increase from the first quarter that was due to model changes and individual customer exposures, but impairments were still at a significantly lower level than in the second quarter of 2020.
Danske Bank / Interim report – first half 2021 9/72
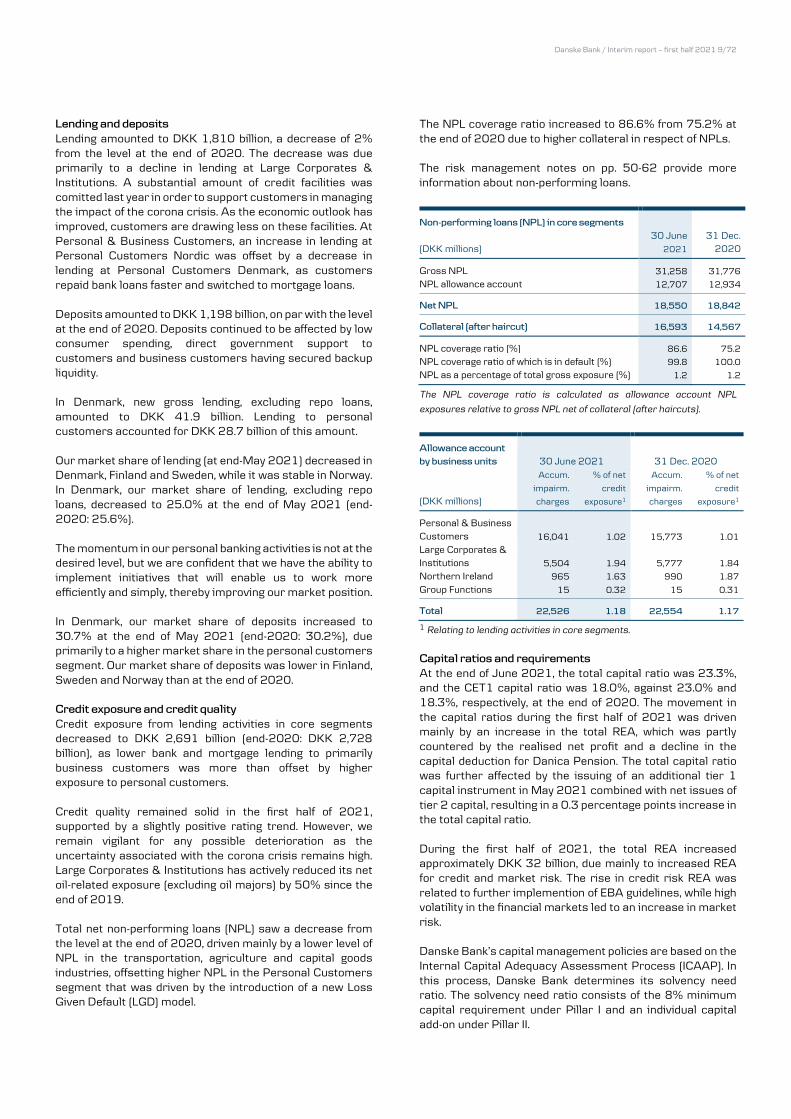
Lending and deposits Lending amounted to DKK 1,810 billion, a decrease of 2% from the level at the end of 2020. The decrease was due primarily to a decline in lending at Large Corporates & Institutions. A substantial amount of credit facilities was comitted last year in order to support customers in managing the impact of the corona crisis. As the economic outlook has improved, customers are drawing less on these facilities. At Personal & Business Customers, an increase in lending at Personal Customers Nordic was offset by a decrease in lending at Personal Customers Denmark, as customers repaid bank loans faster and switched to mortgage loans. Deposits amounted to DKK 1,198 billion, on par with the level at the end of 2020. Deposits continued to be affected by low consumer spending, direct government support to customers and business customers having secured backup liquidity. In Denmark, new gross lending, excluding repo loans, amounted to DKK 41.9 billion. Lending to personal customers accounted for DKK 28.7 billion of this amount. Our market share of lending (at end-May 2021) decreased in Denmark, Finland and Sweden, while it was stable in Norway. In Denmark, our market share of lending, excluding repo loans, decreased to 25.0% at the end of May 2021 (end-2020: 25.6%). The momentum in our personal banking activities is not at the desired level, but we are confident that we have the ability to implement initiatives that will enable us to work more efficiently and simply, thereby improving our market position. In Denmark, our market share of deposits increased to 30.7% at the end of May 2021 (end-2020: 30.2%), due primarily to a higher market share in the personal customers segment. Our market share of deposits was lower in Finland, Sweden and Norway than at the end of 2020. Credit exposure and credit quality Credit exposure from lending activities in core segments decreased to DKK 2,691 billion (end-2020: DKK 2,728 billion), as lower bank and mortgage lending to primarily business customers was more than offset by higher exposure to personal customers. Credit quality remained solid in the first half of 2021, supported by a slightly positive rating trend. However, we remain vigilant for any possible deterioration as the uncertainty associated with the corona crisis remains high. Large Corporates & Institutions has actively reduced its net oil-related exposure (excluding oil majors) by 50% since the end of 2019. Total net non-performing loans (NPL) saw a decrease from the level at the end of 2020, driven mainly by a lower level of NPL in the transportation, agriculture and capital goods industries, offsetting higher NPL in the Personal Customers segment that was driven by the introduction of a new Loss Given Default (LGD) model.
The NPL coverage ratio increased to 86.6% from 75.2% at the end of 2020 due to higher collateral in respect of NPLs. The risk management notes on pp. 50-62 provide more information about non-performing loans. Non-performing loans (NPL) in core segments
(DKK millions) 30 June
2021
31 Dec. 2020
Gross NPL 31,258 31,776
NPL allowance account 12,707 12,934
Net NPL 18,550 18,842
Collateral (after haircut) 16,593 14,567
NPL coverage ratio (%) 86.6 75.2
NPL coverage ratio of which is in default (%) 99.8 100.0
NPL as a percentage of total gross exposure (%) 1.2 1.2
The NPL coverage ratio is calculated as allowance account NPL
exposures relative to gross NPL net of collateral (after haircuts).
Allowance account by business units 30 June 2021 31 Dec. 2020
(DKK millions)
Accum.
impairm.
charges
% of net
credit
exposure1
Accum.
impairm.
charges
% of net
credit
exposure1
Personal & Business Customers 16,041 1.02 15,773 1.01
Large Corporates & Institutions 5,504 1.94 5,777 1.84
Northern Ireland 965 1.63 990 1.87
Group Functions 15 0.32 15 0.31
Total 22,526 1.18 22,554 1.17
1 Relating to lending activities in core segments.
Capital ratios and requirements At the end of June 2021, the total capital ratio was 23.3%, and the CET1 capital ratio was 18.0%, against 23.0% and 18.3%, respectively, at the end of 2020. The movement in the capital ratios during the first half of 2021 was driven mainly by an increase in the total REA, which was partly countered by the realised net profit and a decline in the capital deduction for Danica Pension. The total capital ratio was further affected by the issuing of an additional tier 1 capital instrument in May 2021 combined with net issues of tier 2 capital, resulting in a 0.3 percentage points increase in the total capital ratio. During the first half of 2021, the total REA increased approximately DKK 32 billion, due mainly to increased REA for credit and market risk. The rise in credit risk REA was related to further implemention of EBA guidelines, while high volatility in the financial markets led to an increase in market risk. Danske Bank’s capital management policies are based on the Internal Capital Adequacy Assessment Process (ICAAP). In this process, Danske Bank determines its solvency need ratio. The solvency need ratio consists of the 8% minimum capital requirement under Pillar I and an individual capital add-on under Pillar II.
Danske Bank / Interim report – first half 2021 10/72
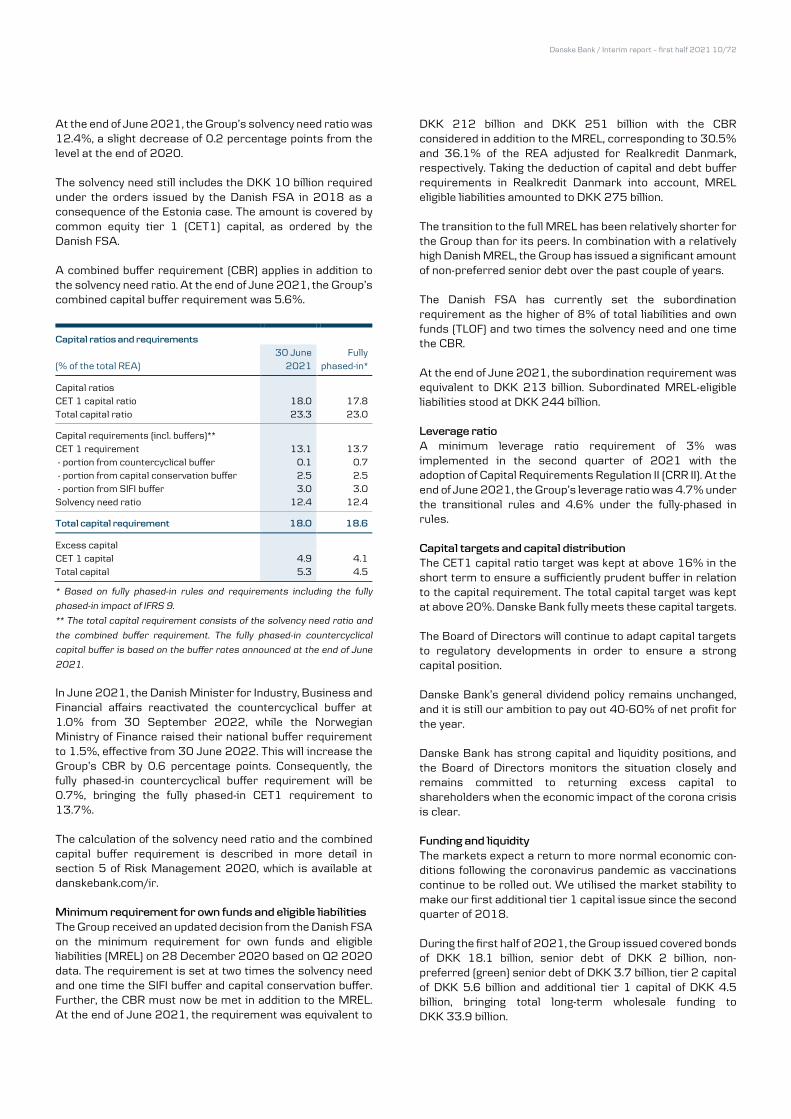
At the end of June 2021, the Group’s solvency need ratio was 12.4%, a slight decrease of 0.2 percentage points from the level at the end of 2020. The solvency need still includes the DKK 10 billion required under the orders issued by the Danish FSA in 2018 as a consequence of the Estonia case. The amount is covered by common equity tier 1 (CET1) capital, as ordered by the Danish FSA. A combined buffer requirement (CBR) applies in addition to the solvency need ratio. At the end of June 2021, the Group’s combined capital buffer requirement was 5.6%. Capital ratios and requirements
(% of the total REA) 30 June
2021 Fully
phased-in*
Capital ratios CET 1 capital ratio 18.0 17.8 Total capital ratio 23.3 23.0
Capital requirements (incl. buffers)** CET 1 requirement 13.1 13.7 - portion from countercyclical buffer 0.1 0.7 - portion from capital conservation buffer 2.5 2.5 - portion from SIFI buffer 3.0 3.0 Solvency need ratio 12.4 12.4
Total capital requirement 18.0 18.6
Excess capital CET 1 capital 4.9 4.1 Total capital 5.3 4.5
* Based on fully phased-in rules and requirements including the fully
phased-in impact of IFRS 9.
** The total capital requirement consists of the solvency need ratio and
the combined buffer requirement. The fully phased-in countercyclical
capital buffer is based on the buffer rates announced at the end of June
2021.
In June 2021, the Danish Minister for Industry, Business and Financial affairs reactivated the countercyclical buffer at 1.0% from 30 September 2022, while the Norwegian Ministry of Finance raised their national buffer requirement to 1.5%, effective from 30 June 2022. This will increase the Group’s CBR by 0.6 percentage points. Consequently, the fully phased-in countercyclical buffer requirement will be 0.7%, bringing the fully phased-in CET1 requirement to 13.7%. The calculation of the solvency need ratio and the combined capital buffer requirement is described in more detail in section 5 of Risk Management 2020, which is available at danskebank.com/ir. Minimum requirement for own funds and eligible liabilities The Group received an updated decision from the Danish FSA on the minimum requirement for own funds and eligible liabilities (MREL) on 28 December 2020 based on Q2 2020 data. The requirement is set at two times the solvency need and one time the SIFI buffer and capital conservation buffer. Further, the CBR must now be met in addition to the MREL. At the end of June 2021, the requirement was equivalent to
DKK 212 billion and DKK 251 billion with the CBR considered in addition to the MREL, corresponding to 30.5% and 36.1% of the REA adjusted for Realkredit Danmark, respectively. Taking the deduction of capital and debt buffer requirements in Realkredit Danmark into account, MREL eligible liabilities amounted to DKK 275 billion. The transition to the full MREL has been relatively shorter for the Group than for its peers. In combination with a relatively high Danish MREL, the Group has issued a significant amount of non-preferred senior debt over the past couple of years. The Danish FSA has currently set the subordination requirement as the higher of 8% of total liabilities and own funds (TLOF) and two times the solvency need and one time the CBR. At the end of June 2021, the subordination requirement was equivalent to DKK 213 billion. Subordinated MREL-eligible liabilities stood at DKK 244 billion. Leverage ratio A minimum leverage ratio requirement of 3% was implemented in the second quarter of 2021 with the adoption of Capital Requirements Regulation II (CRR II). At the end of June 2021, the Group’s leverage ratio was 4.7% under the transitional rules and 4.6% under the fully-phased in rules. Capital targets and capital distribution The CET1 capital ratio target was kept at above 16% in the short term to ensure a sufficiently prudent buffer in relation to the capital requirement. The total capital target was kept at above 20%. Danske Bank fully meets these capital targets. The Board of Directors will continue to adapt capital targets to regulatory developments in order to ensure a strong capital position. Danske Bank’s general dividend policy remains unchanged, and it is still our ambition to pay out 40-60% of net profit for the year. Danske Bank has strong capital and liquidity positions, and the Board of Directors monitors the situation closely and remains committed to returning excess capital to shareholders when the economic impact of the corona crisis is clear. Funding and liquidity The markets expect a return to more normal economic con-ditions following the coronavirus pandemic as vaccinations continue to be rolled out. We utilised the market stability to make our first additional tier 1 capital issue since the second quarter of 2018. During the first half of 2021, the Group issued covered bonds of DKK 18.1 billion, senior debt of DKK 2 billion, non-preferred (green) senior debt of DKK 3.7 billion, tier 2 capital of DKK 5.6 billion and additional tier 1 capital of DKK 4.5 billion, bringing total long-term wholesale funding to DKK 33.9 billion.
Danske Bank / Interim report – first half 2021 11/72
Our strategy of securing more funding directly in our main lending currencies, including NOK and SEK, remains in place, but we will also utilise central bank facilities to obtain funding in the most cost-efficient manner. We plan for regular issues in the EUR benchmark format in covered bonds, senior and non-preferred senior bonds as well as issues in the domestic USD market for senior and non-preferred senior bonds in the Rule 144A format. The benchmark issues are expected to be supplemented by pri-vate placements of bonds. From time to time, we will issue in GBP, JPY, CHF and other currencies when market conditions allow. Issuance plans for subordinated debt in either the additional tier 1 or tier 2 for-mats will depend on balance-sheet growth and redemptions on the one side and our capital targets on the other. Any issu-ance of subordinated debt may cover part of our funding need. Note G6 provides more information about the issuing of bonds in 2021. Danske Bank’s liquidity position remained robust. Stress tests show that we have a sufficient liquidity buffer well be-yond 12 months. At the end of the first half of 2021, our li-quidity coverage ratio stood at 155% (31 December 2020: 154%), with an LCR reserve of DKK 702 billion (31 Decem-ber 2020: DKK 710 billion). The requirement for the net stable funding ratio (NSFR) forms an integral part of our funding planning. As at end-June 2021, the Group’s NSFR was 129.9%. At 30 June 2021, the total nominal value of outstanding long-term funding, excluding equity-accounted additional tier 1 capital and debt issued by Realkredit Danmark, was DKK 358 billion (31 December 2020: DKK 369 billion). The Supervisory Diamond The Danish FSA has identified a number of specific risk indicators for banks and mortgage institutions and has set threshold values with which all Danish banks must comply. The requirements are known as the Supervisory Diamond. At the end of June 2021, Danske Bank was in compliance with all threshold values. A separate report is available at danskebank.com/ir. Realkredit Danmark also complies with all threshold values. New regulation In December 2017, the Basel Committee on Banking Super-vision (BCBS) published the final and revised standards for REA calculations (Basel IV). Due to the corona crisis, the BCBS has delayed the implementation of the Basel IV stand-ards from 2022 to 2023. This will also delay the process for implementation of the standards in the EU, and the EU Com-mission is now expected to publish a legislative proposal in the second half of 2021. As part of the European Banking Authority’s (EBA) roadmap to enhance internal models used to calculate credit risk, Danske Bank has started implementing the revised set of
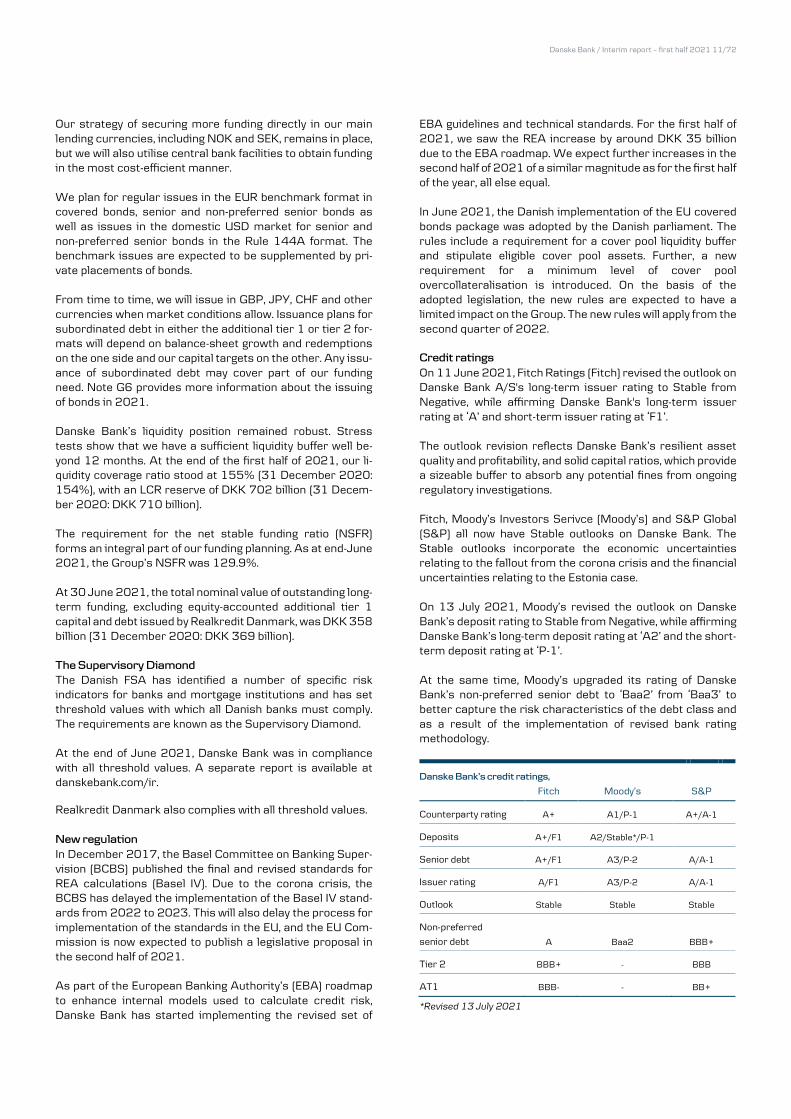
EBA guidelines and technical standards. For the first half of 2021, we saw the REA increase by around DKK 35 billion due to the EBA roadmap. We expect further increases in the second half of 2021 of a similar magnitude as for the first half of the year, all else equal. In June 2021, the Danish implementation of the EU covered bonds package was adopted by the Danish parliament. The rules include a requirement for a cover pool liquidity buffer and stipulate eligible cover pool assets. Further, a new requirement for a minimum level of cover pool overcollateralisation is introduced. On the basis of the adopted legislation, the new rules are expected to have a limited impact on the Group. The new rules will apply from the second quarter of 2022. Credit ratings On 11 June 2021, Fitch Ratings (Fitch) revised the outlook on Danske Bank A/S's long-term issuer rating to Stable from Negative, while affirming Danske Bank's long-term issuer rating at ‘A’ and short-term issuer rating at ‘F1’. The outlook revision reflects Danske Bank’s resilient asset quality and profitability, and solid capital ratios, which provide a sizeable buffer to absorb any potential fines from ongoing regulatory investigations. Fitch, Moody’s Investors Serivce (Moody’s) and S&P Global (S&P) all now have Stable outlooks on Danske Bank. The Stable outlooks incorporate the economic uncertainties relating to the fallout from the corona crisis and the financial uncertainties relating to the Estonia case. On 13 July 2021, Moody’s revised the outlook on Danske Bank’s deposit rating to Stable from Negative, while affirming Danske Bank’s long-term deposit rating at ‘A2’ and the short-term deposit rating at ‘P-1’. At the same time, Moody’s upgraded its rating of Danske Bank’s non-preferred senior debt to ‘Baa2’ from ‘Baa3’ to better capture the risk characteristics of the debt class and as a result of the implementation of revised bank rating methodology.
Danske Bank’s credit ratings, Fitch Moody’s S&P
Counterparty rating A+ A1/P-1 A+/A-1
Deposits A+/F1 A2/Stable*/P-1
Senior debt A+/F1 A3/P-2 A/A-1
Issuer rating A/F1 A3/P-2 A/A-1
Outlook Stable Stable Stable
Non-preferred
senior debt A Baa2 BBB+
Tier 2 BBB+ - BBB
AT1 BBB- - BB+
*Revised 13 July 2021
Danske Bank / Interim report – first half 2021 12/72
Covered bonds issued by Realkredit Danmark are rated ‘AAA’ (Stable outlook) by Fitch, S&P and Scope Ratings. Covered bonds issued by Danske Bank A/S are rated ‘AAA’ (Stable outlook) by both Fitch and S&P. Covered bonds issued by Danske Mortgage Bank Plc are rated ‘Aaa’ by Moody’s. Covered bonds issued by Danske Hypotek AB are rated ‘AAA’ (Stable outlook) by S&P and Nordic Credit Rating. ESG ratings Danske Bank currently focuses on the following ESG rating agencies reflecting investor priorities.
Score at
30 June 2021
Score at
31 Dec. 2020 ESG rating agency
CDP Worldwide, UK B B
ISS ESG, USA C Prime C+ Prime
MSCI ESG Ratings, USA BB BB
Sustainalytics, USA Medium Risk High Risk
Vigeo Eiris, France 64 64
On 10 June 2021, ISS ESG downgraded Danske Bank to C Prime from C+ Prime, due primarily to announced staff redundancies that impact its assessment of employment security and responsible workforce restructuring. On 24 June 2021, Sustainalytics upgraded Danske Bank’s ESG Risk Rating to Medium Risk from High Risk. The improved rating reflects its assessment of business ethics. Changes to the Executive Leadership Team On 25 May 2021, Magnus Agustsson was appointed new Chief Risk Officer (CRO) and also member of the Executive Leadership Team. Magnus Agustsson will join Danske Bank on 1 December at the latest. The interim head of the Group Risk Management organisation, George Anagnostopoulos, will continue in this role until Magnus Agustsson takes over. Magnus Agustsson holds an MSc in Economics from the Uni-versity of Iceland and comes from a position as CRO of SEB in Sweden, where he has held various positions over the past 12 years, all within risk management. Estonia case The internal investigation at Danske Bank was completed in the fourth quarter of 2020, and Danske Bank has reported the findings to the relevant authorities investigating Danske Bank. We continue to fully cooperate with the authorities, which may require Danske Bank to undertake further internal investigation in 2021. The overall timing of the authorities’ investigations remains unknown and is not within Danske Bank’s control. Update on the debt collection case At 1 July 2021, we had reviewed 97% of the 197,000 customer cases in our debt collection systems for which there is a risk of overcollection as a result of the data errors
originally identified. The review has shown that actual overcollection has taken place for 6,300 of these customers. The customer cases yet to be reviewed, approximately 5,600, require additional quality assurance due to their complexity, and we expect to have resolved these cases well before the end of the year. During our investigation of the data errors originally identified, we have unfortunately become aware of a number of potential additional issues that we are still investigating, which means that the number of customers who are expected to be eligible for compensation is increasing. We expect that this work will extend into 2022. It is not considered necessary to make any additional provisions. Danske Bank merges MobilePay with other mobile payment providers On 30 June 2021, Danske Bank A/S announced that it has entered into an agreement with OP Financial Group in Finland and the consortium of banks behind Vipps in Norway to merge the three mobile payment providers MobilePay, Vipps and Pivo. By bringing a number of well-known brands into the ownership of a joint company, we will be strongly positioned in the market and ensure that we have the necessary scale to continue rapid growth. We are also open for dialogue with other leading banks and platforms. It is especially important for us that MobilePay’s close cooperation with the other Dan-ish banks can continue. The potential participation of other banks will further underpin the ambition to create a strong European player in the payment area. The new company will be one of the largest bank-owned digi-tal wallets in Europe, serving 11 million users and over 330,000 shops and web shops. Danske Bank will own 25% of the new company. The merger is conditional on approval by the relevant authorities, including the European Commission. Final approval is expected in the second half of 2021 or in early 2022, hence the expected one-off gain of approximately DKK 400-500 million is not included in our current outlook for the full year. Private banking activities in Luxembourg On 1 July, we announced that Danske Bank has entered into an agreement with Union Bancaire Privée, UBP SA, on the sale of the business activities of Danske Bank International S.A. in Luxembourg. The decision reflects Danske Bank’s strategy of focusing on the core Nordic markets. The sale is expected to result in a one-off gain for Danske Bank of approximately DKK 250 million and is conditional on approval by the relevant authorities. Final approval is ex-pected in the second half of 2021.
Danske Bank / Interim report – first half 2021 13/72
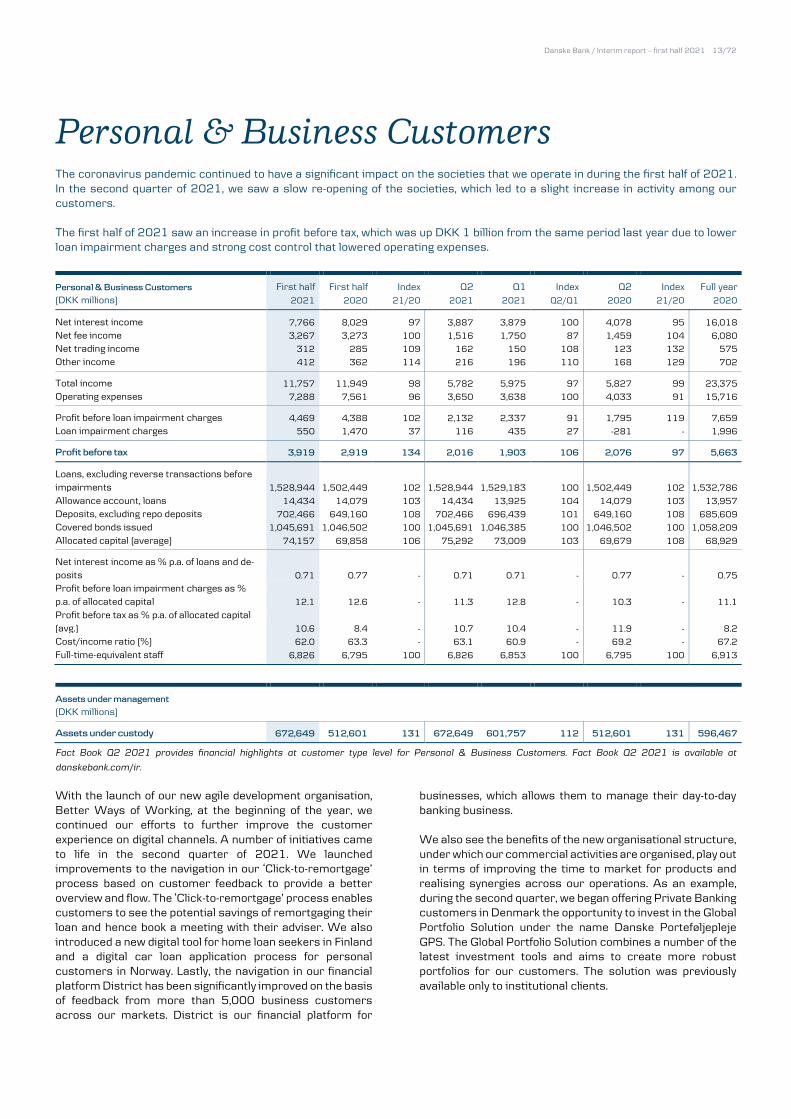
Personal & Business Customers The coronavirus pandemic continued to have a significant impact on the societies that we operate in during the first half of 2021. In the second quarter of 2021, we saw a slow re-opening of the societies, which led to a slight increase in activity among our customers. The first half of 2021 saw an increase in profit before tax, which was up DKK 1 billion from the same period last year due to lower loan impairment charges and strong cost control that lowered operating expenses. Personal & Business Customers First half First half Index Q2 Q1 Index Q2 Index Full year (DKK millions) 2021 2020 21/20 2021 2021 Q2/Q1 2020 21/20 2020
Net interest income 7,766 8,029 97 3,887 3,879 100 4,078 95 16,018
Net fee income 3,267 3,273 100 1,516 1,750 87 1,459 104 6,080
Net trading income 312 285 109 162 150 108 123 132 575
Other income 412 362 114 216 196 110 168 129 702
Total income 11,757 11,949 98 5,782 5,975 97 5,827 99 23,375
Operating expenses 7,288 7,561 96 3,650 3,638 100 4,033 91 15,716
Profit before loan impairment charges 4,469 4,388 102 2,132 2,337 91 1,795 119 7,659
Loan impairment charges 550 1,470 37 116 435 27 -281 - 1,996
Profit before tax 3,919 2,919 134 2,016 1,903 106 2,076 97 5,663
Loans, excluding reverse transactions before impairments 1,528,944 1,502,449 102 1,528,944 1,529,183 100 1,502,449 102 1,532,786
Allowance account, loans 14,434 14,079 103 14,434 13,925 104 14,079 103 13,957
Deposits, excluding repo deposits 702,466 649,160 108 702,466 696,439 101 649,160 108 685,609
Covered bonds issued 1,045,691 1,046,502 100 1,045,691 1,046,385 100 1,046,502 100 1,058,209
Allocated capital (average) 74,157 69,858 106 75,292 73,009 103 69,679 108 68,929
Net interest income as % p.a. of loans and de-posits 0.71 0.77 - 0.71 0.71 - 0.77 - 0.75
Profit before loan impairment charges as % p.a. of allocated capital 12.1 12.6 - 11.3 12.8 - 10.3 - 11.1
Profit before tax as % p.a. of allocated capital (avg.) 10.6 8.4 - 10.7 10.4 - 11.9 - 8.2
Cost/income ratio (%) 62.0 63.3 - 63.1 60.9 - 69.2 - 67.2
Full-time-equivalent staff 6,826 6,795 100 6,826 6,853 100 6,795 100 6,913
Assets under management (DKK millions)
Assets under custody 672,649 512,601 131 672,649 601,757 112 512,601 131 596,467
Fact Book Q2 2021 provides financial highlights at customer type level for Personal & Business Customers. Fact Book Q2 2021 is available at
danskebank.com/ir.
With the launch of our new agile development organisation, Better Ways of Working, at the beginning of the year, we continued our efforts to further improve the customer experience on digital channels. A number of initiatives came to life in the second quarter of 2021. We launched improvements to the navigation in our ‘Click-to-remortgage’ process based on customer feedback to provide a better overview and flow. The ‘Click-to-remortgage’ process enables customers to see the potential savings of remortgaging their loan and hence book a meeting with their adviser. We also introduced a new digital tool for home loan seekers in Finland and a digital car loan application process for personal customers in Norway. Lastly, the navigation in our financial platform District has been significantly improved on the basis of feedback from more than 5,000 business customers across our markets. District is our financial platform for
businesses, which allows them to manage their day-to-day banking business. We also see the benefits of the new organisational structure, under which our commercial activities are organised, play out in terms of improving the time to market for products and realising synergies across our operations. As an example, during the second quarter, we began offering Private Banking customers in Denmark the opportunity to invest in the Global Portfolio Solution under the name Danske Porteføljepleje GPS. The Global Portfolio Solution combines a number of the latest investment tools and aims to create more robust portfolios for our customers. The solution was previously available only to institutional clients.
Danske Bank / Interim report – first half 2021 14/72
Sustainability continues to be one of the top strategic priori-ties across Personal & Business Customers. In the second quarter of 2021, a number of initiatives were introduced to promote a sustainable development. This includes the launch of payment cards made out of recycled plastic for our young-est customers who hold Pocket Money Cards. The cards were introduced across all our markets. Following a six-month campaign, we introduced an attractive and permanent car loan offer in the Danish market for both electric cars and plug-in hybrid cars to support the transition to more sustain-able driving. In Sweden, we launched GreenFleet70 for busi-nesses, a tool to map the environmental footprint of a busi-ness’s car fleet and give advice on how to reduce emissions. Finally in Finland, we launched a new service to help our cus-tomers make more sustainable housing choices in coopera-tion with our partner Akava. The service helps customers get a better overview of how to improve the environmental im-pact of their homes, for example in terms of home renova-tions, energy class and heating.
First half 2021 vs first half 2020 Profit before tax amounted to DKK 3,919 million, an increase of DKK 1,000 million, mainly as a result of a decrease in loan impairment charges. Net interest income decreased 3%. This was due to margin pressure and a challenged interest rate environment across the Nordic countries as well as a lower funding value of deposits across all markets. These effects were only partly mitigated by growing volumes and repricing initiatives for deposits. Net fee income amounted to DKK 3,267 million, on par with the same period last year. Underlying, we saw an increase due to high investment activity and growth in assets under custody. However, this was countered by lower income from a distribution agreement at Banking Finland. Net trading income increased to DKK 312 million due to higher foreign exchange activity in step with the reopening of the societies in which we operate. Other income amounted to DKK 412 million, posting an increase due to our real estate agency home seeing good activity on the housing market in the first half of 2021. Operating expenses decreased 4% due to lower costs in relation to the Better Bank transformation. Loan impairment charges amounted to DKK 550 million, a decrease of 63% from the level in the same period last year (H1 2020: DKK 1,470 million). Loan impairments were still affected by the corona crisis, but were not impacted to the extent seen in the first half of 2020. The impairment charges for the first half of 2021 were driven mainly by charges against individual customer exposures made as a result of the corona crisis as well as model adjustments. Lending volumes increased, driven by Personal Customers Nordic, due mainly to partnership agreements in Norway and currency effects. Deposit volumes increased due to business customers’ liquidity management as a result of the corona
crisis, lower spending for personal customers and government support packages. In the first half of 2021, our focus was on expanding our business with existing customers to help them get the best possible products and solutions. This has been especially successful in our Swedish market.
Second quarter 2021 vs first quarter 2021 Profit before tax in the second quarter amounted to DKK 2,016 million, an increase of DKK 113 million, due primarily to lower impairment charges. Net interest income was on par with the level in the first quarter of 2021. An improved interest rate environment was offset by margin pressure in the personal customer markets. Net fee income decreased, mainly because of seasonality in the refinancing activity at Realkredit Danmark, against the high activity in the first quarter of 2021. Furthermore, we saw lower income from a distribution agreement at Banking Finland in the second quarter of 2021. Operating expenses were on par with expenses in the first quarter of 2021. Loan impairment charges decreased to DKK 116 million (Q1 2021: DKK 435 million). The decrease in impairment charges was attributable to fewer charges against individual customer exposures made as a result of the corona crisis and model adjustments. Lending volumes were on par with volumes in the first quarter of 2021 as the need for credit facilities continued to be at a low level among business customers, which were generally helped by government support packages. For personal customers, we saw a flat development across all markets.
Danske Bank / Interim report – first half 2021 15/72
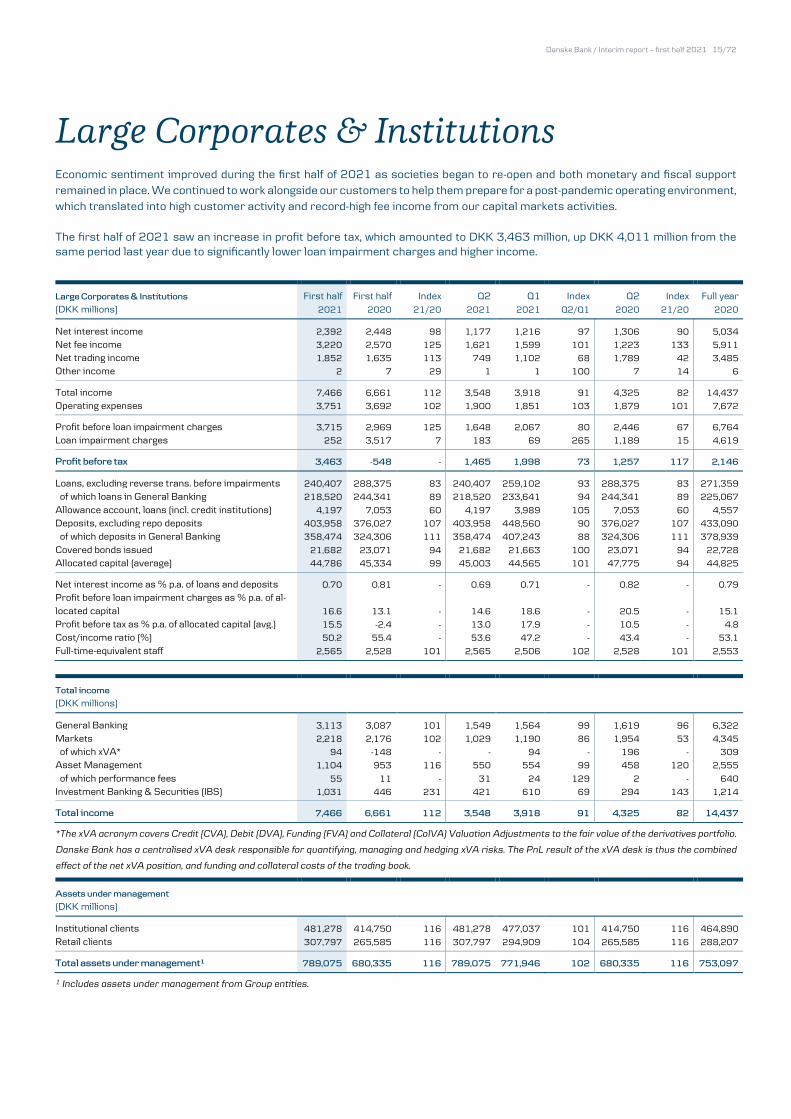
Large Corporates & Institutions Economic sentiment improved during the first half of 2021 as societies began to re-open and both monetary and fiscal support remained in place. We continued to work alongside our customers to help them prepare for a post-pandemic operating environment, which translated into high customer activity and record-high fee income from our capital markets activities. The first half of 2021 saw an increase in profit before tax, which amounted to DKK 3,463 million, up DKK 4,011 million from the same period last year due to significantly lower loan impairment charges and higher income. Large Corporates & Institutions First half First half Index Q2 Q1 Index Q2 Index Full year (DKK millions) 2021 2020 21/20 2021 2021 Q2/Q1 2020 21/20 2020
Net interest income 2,392 2,448 98 1,177 1,216 97 1,306 90 5,034
Net fee income 3,220 2,570 125 1,621 1,599 101 1,223 133 5,911
Net trading income 1,852 1,635 113 749 1,102 68 1,789 42 3,485
Other income 2 7 29 1 1 100 7 14 6
Total income 7,466 6,661 112 3,548 3,918 91 4,325 82 14,437
Operating expenses 3,751 3,692 102 1,900 1,851 103 1,879 101 7,672
Profit before loan impairment charges 3,715 2,969 125 1,648 2,067 80 2,446 67 6,764
Loan impairment charges 252 3,517 7 183 69 265 1,189 15 4,619
Profit before tax 3,463 -548 - 1,465 1,998 73 1,257 117 2,146
Loans, excluding reverse trans. before impairments 240,407 288,375 83 240,407 259,102 93 288,375 83 271,359
of which loans in General Banking 218,520 244,341 89 218,520 233,641 94 244,341 89 225,067
Allowance account, loans (incl. credit institutions) 4,197 7,053 60 4,197 3,989 105 7,053 60 4,557
Deposits, excluding repo deposits 403,958 376,027 107 403,958 448,560 90 376,027 107 433,090
of which deposits in General Banking 358,474 324,306 111 358,474 407,243 88 324,306 111 378,939
Covered bonds issued 21,682 23,071 94 21,682 21,663 100 23,071 94 22,728
Allocated capital (average) 44,786 45,334 99 45,003 44,565 101 47,775 94 44,825
Net interest income as % p.a. of loans and deposits 0.70 0.81 - 0.69 0.71 - 0.82 - 0.79
Profit before loan impairment charges as % p.a. of al-located capital 16.6 13.1 - 14.6 18.6 - 20.5 - 15.1
Profit before tax as % p.a. of allocated capital (avg.) 15.5 -2.4 - 13.0 17.9 - 10.5 - 4.8
Cost/income ratio (%) 50.2 55.4 - 53.6 47.2 - 43.4 - 53.1
Full-time-equivalent staff 2,565 2,528 101 2,565 2,506 102 2,528 101 2,553 Total income (DKK millions)
General Banking 3,113 3,087 101 1,549 1,564 99 1,619 96 6,322
Markets 2,218 2,176 102 1,029 1,190 86 1,954 53 4,345
of which xVA* 94 -148 - - 94 - 196 - 309
Asset Management 1,104 953 116 550 554 99 458 120 2,555
of which performance fees 55 11 - 31 24 129 2 - 640
Investment Banking & Securities (IBS) 1,031 446 231 421 610 69 294 143 1,214
Total income 7,466 6,661 112 3,548 3,918 91 4,325 82 14,437
*The xVA acronym covers Credit (CVA), Debit (DVA), Funding (FVA) and Collateral (ColVA) Valuation Adjustments to the fair value of the derivatives portfolio.
Danske Bank has a centralised xVA desk responsible for quantifying, managing and hedging xVA risks. The PnL result of the xVA desk is thus the combined
effect of the net xVA position, and funding and collateral costs of the trading book. Assets under management (DKK millions)
Institutional clients 481,278 414,750 116 481,278 477,037 101 414,750 116 464,890
Retail clients 307,797 265,585 116 307,797 294,909 104 265,585 116 288,207
Total assets under management¹ 789,075 680,335 116 789,075 771,946 102 680,335 116 753,097
1 Includes assets under management from Group entities.
Danske Bank / Interim report – first half 2021 16/72
Customers utilised the positive market sentiment to raise capital in the financial markets, and we are proud to have been chosen for a large number of landmark transactions –ensuring Danske Bank a number one position as the leading Nordic bank in terms of supported volumes in the first half of 2021 across both debt and equity capital markets. The improved operating environment also led to customers drawing less on their credit facilities, and we are starting to see the significant committed credit facilities that we extended during 2020 to help customers manage the impact of the crisis roll off. Nevertheless, this illustrates the value of having a diversified business across the Nordic markets, as higher net fee income more than compensated for lower net interest income. Sustainable finance continued to be in high demand, and we supported issuers and investors in a substantial number of transactions, affirming our position as the leading Nordic bank within sustainable finance. Activity was high across business areas, and we are proud to be ranked number one among the Nordic banks within both issuance of sustainability-linked loans and sustainable bonds. In the first half of 2021, we have already arranged sustainable bonds in the amount of USD 8 billion for our customers, which is more than we have ever arranged in a full year. Danske Bank’s structuring and arranging of the successful Swedish International Development Agency (SIDA) guaranteed social bond issue is a good example of how banks can contribute to developing the sustainable bond market, as this is the first example in the world of a guarantee being provided to a business issuing social bonds sold to private investors. The SIDA guaranteed social bond issuance will focus on Africa, Latin America and Central, South and Southeast Asia, with the intention of contributing to improved living conditions, health and quality of life for people living in poverty.
First half 2021vs first half 2020 Profit before tax increased to DKK 3,463 million in the first half of 2021 (H1 2020: a loss of DKK 548 million). Customer activity continued to be at high levels during the second quarter of 2021, contributing to total income of DKK 7,466 million (H1 2020: DKK 6,661 million). Net interest income decreased slightly from the level in the same period last year, due mainly to lower net interest income from deposits, as the significant increase in deposit volumes lowered the value of surplus deposits, leading to lower deposit margins. We are repricing deposits to address the decline in deposit margins, and while there is uncertainty about whether deposit volumes will normalise, there were tentative signs of declining volumes towards the end of the second quarter. Lending volumes declined from the level in the first half of 2020. To support customers in managing the impact of the corona crisis, we committed substantial credit facilities towards the end of the first quarter and during the second quarter of last year. As the economic outlook has improved, customers are drawing less on their credit facilities, and the
committed facilities provided last year are beginning to roll off. The impact on net interest income has been modest so far, as lower volumes have partly been mitigated by higher lending margins, as the facilities provided last year on average had lower margins. Net fee income increased 25% from the level in the first half of 2020, reflecting record-high fee income from capital markets activities and increased assets under management. Assets under management increased 16% from the level in the first half of 2020, driven by rising asset prices. During the first half of 2021, Asset Management realised positive net sales in the retail segment for the third consecutive quarter, whereas there was a marginal net outflow in the institutional segment. Net trading income increased 13% from the first half of 2020, driven mainly by higher trading income in Equities and positive value adjustments on the derivatives portfolio (xVA). In the first half of 2020, value adjustments were negative. Operating expenses increased 2% from the level in the same period last year, driven mainly by higher provisions for performance-based compensation. Overall credit quality remained strong. During the first half of 2021, the general rating trend was slightly positive, and loan impairment charges amounted to a net charge of DKK 252 million, a notable decrease from the level in the first half of 2020 (H1 2020: DKK 3,517 million). Since the fourth quarter of 2019, we have actively reduced net oil-related exposure (excluding oil majors) by 50%.
Second quarter 2021 vs first quarter 2021 Profit before tax decreased 27% from the level in the first quarter of 2021, primarily as a result of a seasonal decline in net trading income. Net interest income declined slightly as a result of lower net interest income from undrawn committed credit facilities and lower income from deposits. Net fee income remained at a high level in the second quarter, as activity across the capital markets remained strong. Net trading income decreased, as the first quarter of 2021 benefited from seasonal increases in income at Markets and higher net trading income in Equities. Operating expenses increased 3%, driven largely by higher provisions for performance-based compensation.
Danske Bank / Interim report – first half 2021 17/72
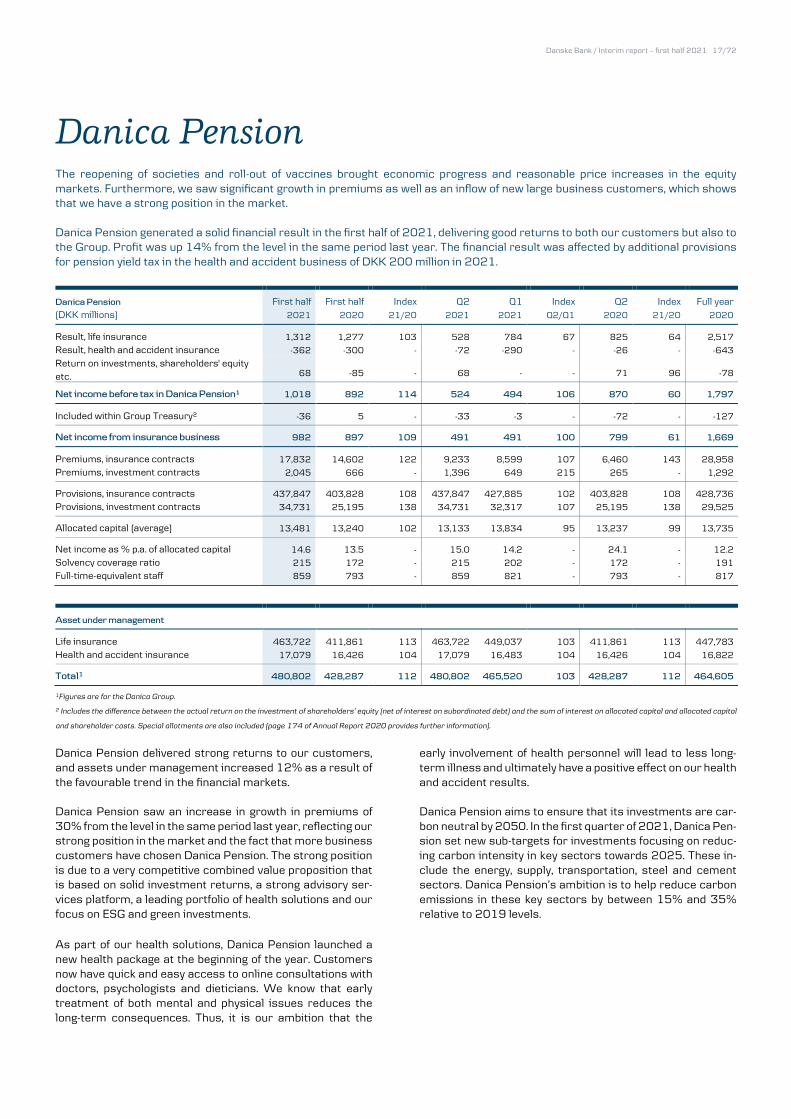
Danica Pension The reopening of societies and roll-out of vaccines brought economic progress and reasonable price increases in the equity markets. Furthermore, we saw significant growth in premiums as well as an inflow of new large business customers, which shows that we have a strong position in the market. Danica Pension generated a solid financial result in the first half of 2021, delivering good returns to both our customers but also to the Group. Profit was up 14% from the level in the same period last year. The financial result was affected by additional provisions for pension yield tax in the health and accident business of DKK 200 million in 2021. Danica Pension First half First half Index Q2 Q1 Index Q2 Index Full year (DKK millions) 2021 2020 21/20 2021 2021 Q2/Q1 2020 21/20 2020
Result, life insurance 1,312 1,277 103 528 784 67 825 64 2,517
Result, health and accident insurance -362 -300 - -72 -290 - -26 - -643
Return on investments, shareholders' equity etc. 68 -85 - 68 - - 71 96 -78
Net income before tax in Danica Pension¹ 1,018 892 114 524 494 106 870 60 1,797
Included within Group Treasury² -36 5 - -33 -3 - -72 - -127
Net income from insurance business 982 897 109 491 491 100 799 61 1,669
Premiums, insurance contracts 17,832 14,602 122 9,233 8,599 107 6,460 143 28,958
Premiums, investment contracts 2,045 666 - 1,396 649 215 265 - 1,292
Provisions, insurance contracts 437,847 403,828 108 437,847 427,885 102 403,828 108 428,736
Provisions, investment contracts 34,731 25,195 138 34,731 32,317 107 25,195 138 29,525
Allocated capital (average) 13,481 13,240 102 13,133 13,834 95 13,237 99 13,735
Net income as % p.a. of allocated capital 14.6 13.5 - 15.0 14.2 - 24.1 - 12.2
Solvency coverage ratio 215 172 - 215 202 - 172 - 191
Full-time-equivalent staff 859 793 - 859 821 - 793 - 817
Asset under management
Life insurance 463,722 411,861 113 463,722 449,037 103 411,861 113 447,783
Health and accident insurance 17,079 16,426 104 17,079 16,483 104 16,426 104 16,822
Total1 480,802 428,287 112 480,802 465,520 103 428,287 112 464,605
1Figures are for the Danica Group.
2 Includes the difference between the actual return on the investment of shareholders’ equity (net of interest on subordinated debt) and the sum of interest on allocated capital and allocated capital
and shareholder costs. Special allotments are also included (page 174 of Annual Report 2020 provides further information).
Danica Pension delivered strong returns to our customers, and assets under management increased 12% as a result of the favourable trend in the financial markets. Danica Pension saw an increase in growth in premiums of 30% from the level in the same period last year, reflecting our strong position in the market and the fact that more business customers have chosen Danica Pension. The strong position is due to a very competitive combined value proposition that is based on solid investment returns, a strong advisory ser-vices platform, a leading portfolio of health solutions and our focus on ESG and green investments.
As part of our health solutions, Danica Pension launched a new health package at the beginning of the year. Customers now have quick and easy access to online consultations with doctors, psychologists and dieticians. We know that early treatment of both mental and physical issues reduces the long-term consequences. Thus, it is our ambition that the
early involvement of health personnel will lead to less long-term illness and ultimately have a positive effect on our health and accident results. Danica Pension aims to ensure that its investments are car-bon neutral by 2050. In the first quarter of 2021, Danica Pen-sion set new sub-targets for investments focusing on reduc-ing carbon intensity in key sectors towards 2025. These in-clude the energy, supply, transportation, steel and cement sectors. Danica Pension’s ambition is to help reduce carbon emissions in these key sectors by between 15% and 35% relative to 2019 levels.
Danske Bank / Interim report – first half 2021 18/72
First half 2021 vs first half 2020 Net income from insurance business increased to DKK 982 million (H1 2020: DKK 897 million), due primarily to a slightly higher result from the life insurance business and a better return on investments allocated to shareholders’ equity, which in the first half of 2020 were impacted by negative value adjustments on the property portfolio. The result of the life insurance business increased 3% due to positive investment results on life insurance products where Danica Pension has the investment risk and an increase in fees resulting from higher assets under management. In the first half of 2021, life insurance products where Danica Pension has the investment risk benefited from an increase in the interest yield curve (including the volatility adjustment) and high returns on risky assets. The result of the health and accident business decreased to a loss of DKK 362 million (H1 2020: a loss of DKK 300 million), despite a stable underlying business. The investment result increased considerably from the level in the first half of 2020, but was offset by an increase in provisions for pension yield tax of DKK 200 million. The return on investments allocated to shareholders’ equity etc. increased DKK 153 million from the level in the first half of 2020, driven mainly by better investment results on investment assets and liabilities allocated to shareholders’ equity. Total premiums increased 30%, driven mainly by an increase in single premiums due to an inflow of new business customers. Assets under management increased DKK 53 billion, due mainly to the positive developments in the financial markets.
Second quarter 2021 vs first quarter 2021 Net income from insurance business was at the same level in the second quarter of 2021 as in the first quarter. However, the loss in the health and accident business decreased, and the return on investments allocated to shareholders’ equity was positive, while we saw a decline in income from the life insurance business. The result of the life insurance business decreased 33%, due mainly to lower investment results on life insurance products where Danica Pension has the investment risk. Especially in the first quarter, life insurance products where Danica Pension has the investment risk benefited from an increase in the interest yield curve (including the volatility adjustment) and high returns on risky assets. The result of the health and accident business improved considerably in the second quarter, despite the underlying business being stable. The development was due mainly to a higher investment result in the second quarter, as the first quarter was affected by one-off provisions for pension yield tax of DKK 200 million. The return on investments allocated to shareholders’ equity etc. increased DKK 68 million on the back of positive returns on investments. Total premiums increased 15%, driven mainly by an increase in single premiums due to an inflow of new business customers. Assets under management increased DKK 15 billion, due mainly to the positive developments in the financial markets.
Danske Bank / Interim report – first half 2021 19/72
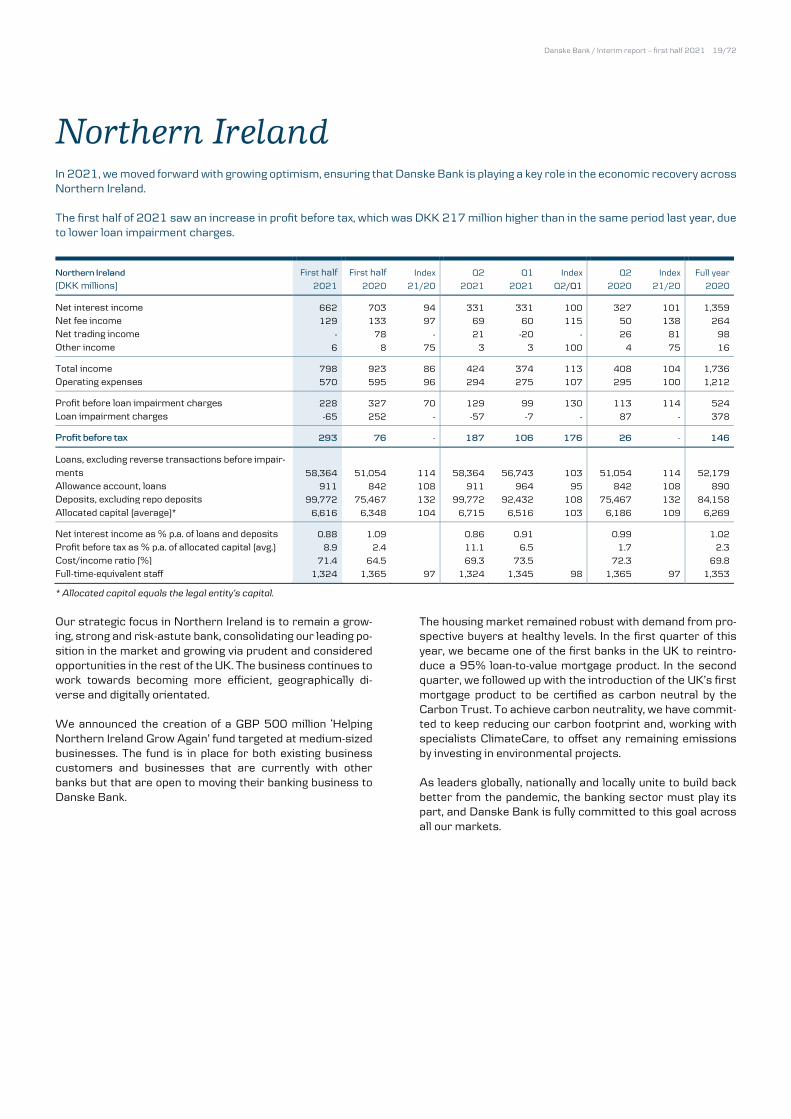
Northern Ireland In 2021, we moved forward with growing optimism, ensuring that Danske Bank is playing a key role in the economic recovery across Northern Ireland. The first half of 2021 saw an increase in profit before tax, which was DKK 217 million higher than in the same period last year, due to lower loan impairment charges. Northern Ireland First half First half Index Q2 Q1 Index Q2 Index Full year
(DKK millions) 2021 2020 21/20 2021 2021 Q2/Q1 2020 21/20 2020
Net interest income 662 703 94 331 331 100 327 101 1,359
Net fee income 129 133 97 69 60 115 50 138 264
Net trading income - 78 - 21 -20 - 26 81 98
Other income 6 8 75 3 3 100 4 75 16
Total income 798 923 86 424 374 113 408 104 1,736
Operating expenses 570 595 96 294 275 107 295 100 1,212
Profit before loan impairment charges 228 327 70 129 99 130 113 114 524
Loan impairment charges -65 252 - -57 -7 - 87 - 378
Profit before tax 293 76 - 187 106 176 26 - 146
Loans, excluding reverse transactions before impair-ments 58,364 51,054 114 58,364 56,743 103 51,054 114 52,179
Allowance account, loans 911 842 108 911 964 95 842 108 890
Deposits, excluding repo deposits 99,772 75,467 132 99,772 92,432 108 75,467 132 84,158
Allocated capital (average)* 6,616 6,348 104 6,715 6,516 103 6,186 109 6,269
Net interest income as % p.a. of loans and deposits 0.88 1.09 0.86 0.91 0.99 1.02
Profit before tax as % p.a. of allocated capital (avg.) 8.9 2.4 11.1 6.5 1.7 2.3
Cost/income ratio (%) 71.4 64.5 69.3 73.5 72.3 69.8
Full-time-equivalent staff 1,324 1,365 97 1,324 1,345 98 1,365 97 1,353
* Allocated capital equals the legal entity’s capital.
Our strategic focus in Northern Ireland is to remain a grow-ing, strong and risk-astute bank, consolidating our leading po-sition in the market and growing via prudent and considered opportunities in the rest of the UK. The business continues to work towards becoming more efficient, geographically di-verse and digitally orientated. We announced the creation of a GBP 500 million ‘Helping Northern Ireland Grow Again’ fund targeted at medium-sized businesses. The fund is in place for both existing business customers and businesses that are currently with other banks but that are open to moving their banking business to Danske Bank.
The housing market remained robust with demand from pro-spective buyers at healthy levels. In the first quarter of this year, we became one of the first banks in the UK to reintro-duce a 95% loan-to-value mortgage product. In the second quarter, we followed up with the introduction of the UK’s first mortgage product to be certified as carbon neutral by the Carbon Trust. To achieve carbon neutrality, we have commit-ted to keep reducing our carbon footprint and, working with specialists ClimateCare, to offset any remaining emissions by investing in environmental projects. As leaders globally, nationally and locally unite to build back better from the pandemic, the banking sector must play its part, and Danske Bank is fully committed to this goal across all our markets.
Danske Bank / Interim report – first half 2021 20/72
First half 2021 vs first half 2020 Profit before tax increased to DKK 293 million, driven by lower loan impairment charges, with the pre-impairments performance dominated by the impact of corona crisis-related restrictions on movement and activity. While both lending and deposits increased, net interest income decreased to DKK 662 million (H1 2020: DKK 703 million), reflecting a sharp decline in UK interest rates. Net fee income decreased to DKK 129 million (H1 2020: DKK 133 million) given very low activity levels as a result of corona crisis-related restrictions. Net trading income and other income were similarly impacted, although net trading income also reflected adverse mark-to-market movements on our bond portfolio. Operating expenses were 4% lower, reflecting the positive impact of ongoing cost reduction initiatives alongside lower activity. Net loan impairment reversals for the half year were driven by an improved economic outlook, leading to a decrease in impairment charges for future losses. Higher lending balances were due largely to the volume of UK government-guaranteed corona-related business support loans alongside a relatively buoyant housing market. Deposit growth rates continued in the first half of 2021, with many personal and business customers continuing to pay off debt and hold additional liquidity.
Second quarter 2021 vs first quarter 2021 Profit before tax increased to DKK 187 million, driven by net loan impairment reversals and growth of 30% in profit before impairments. Income increased 13% to DKK 424 million in the second quarter (Q1 2021: DKK 374 million), reflecting improved activity as lockdown measures were eased across the UK. Operating expenses also increased to DKK 294 million (Q1 2021: DKK 275 million), including the impact of higher activity levels. In respect of the balance sheet, we saw the same pattern as described for the year-on-year movements in lending and deposits.
Danske Bank / Interim report – first half 2021 21/72
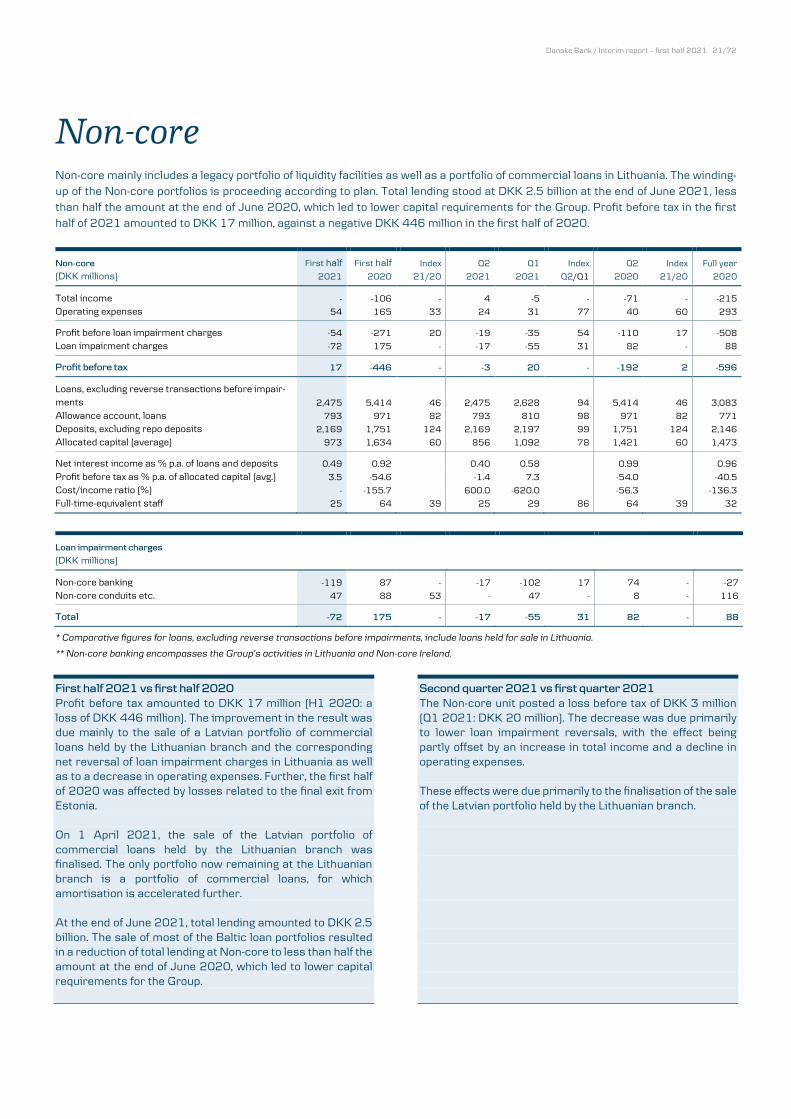
Non-core Non-core mainly includes a legacy portfolio of liquidity facilities as well as a portfolio of commercial loans in Lithuania. The winding-up of the Non-core portfolios is proceeding according to plan. Total lending stood at DKK 2.5 billion at the end of June 2021, less than half the amount at the end of June 2020, which led to lower capital requirements for the Group. Profit before tax in the first half of 2021 amounted to DKK 17 million, against a negative DKK 446 million in the first half of 2020. Non-core First half First half Index Q2 Q1 Index Q2 Index Full year
(DKK millions) 2021 2020 21/20 2021 2021 Q2/Q1 2020 21/20 2020
Total income - -106 - 4 -5 - -71 - -215
Operating expenses 54 165 33 24 31 77 40 60 293
Profit before loan impairment charges -54 -271 20 -19 -35 54 -110 17 -508
Loan impairment charges -72 175 - -17 -55 31 82 - 88
Profit before tax 17 -446 - -3 20 - -192 2 -596
Loans, excluding reverse transactions before impair-ments 2,475 5,414 46 2,475 2,628 94 5,414 46 3,083
Allowance account, loans 793 971 82 793 810 98 971 82 771
Deposits, excluding repo deposits 2,169 1,751 124 2,169 2,197 99 1,751 124 2,146
Allocated capital (average) 973 1,634 60 856 1,092 78 1,421 60 1,473
Net interest income as % p.a. of loans and deposits 0.49 0.92 0.40 0.58 0.99 0.96
Profit before tax as % p.a. of allocated capital (avg.) 3.5 -54.6 -1.4 7.3 -54.0 -40.5
Cost/income ratio (%) - -155.7 600.0 -620.0 -56.3 -136.3
Full-time-equivalent staff 25 64 39 25 29 86 64 39 32
Loan impairment charges (DKK millions)
Non-core banking -119 87 - -17 -102 17 74 - -27
Non-core conduits etc. 47 88 53 - 47 - 8 - 116
Total -72 175 - -17 -55 31 82 - 88
* Comparative figures for loans, excluding reverse transactions before impairments, include loans held for sale in Lithuania.
** Non-core banking encompasses the Group’s activities in Lithuania and Non-core Ireland.
First half 2021 vs first half 2020 Profit before tax amounted to DKK 17 million (H1 2020: a loss of DKK 446 million). The improvement in the result was due mainly to the sale of a Latvian portfolio of commercial loans held by the Lithuanian branch and the corresponding net reversal of loan impairment charges in Lithuania as well as to a decrease in operating expenses. Further, the first half of 2020 was affected by losses related to the final exit from Estonia. On 1 April 2021, the sale of the Latvian portfolio of commercial loans held by the Lithuanian branch was finalised. The only portfolio now remaining at the Lithuanian branch is a portfolio of commercial loans, for which amortisation is accelerated further. At the end of June 2021, total lending amounted to DKK 2.5 billion. The sale of most of the Baltic loan portfolios resulted in a reduction of total lending at Non-core to less than half the amount at the end of June 2020, which led to lower capital requirements for the Group.
Second quarter 2021 vs first quarter 2021 The Non-core unit posted a loss before tax of DKK 3 million (Q1 2021: DKK 20 million). The decrease was due primarily to lower loan impairment reversals, with the effect being partly offset by an increase in total income and a decline in operating expenses. These effects were due primarily to the finalisation of the sale of the Latvian portfolio held by the Lithuanian branch.
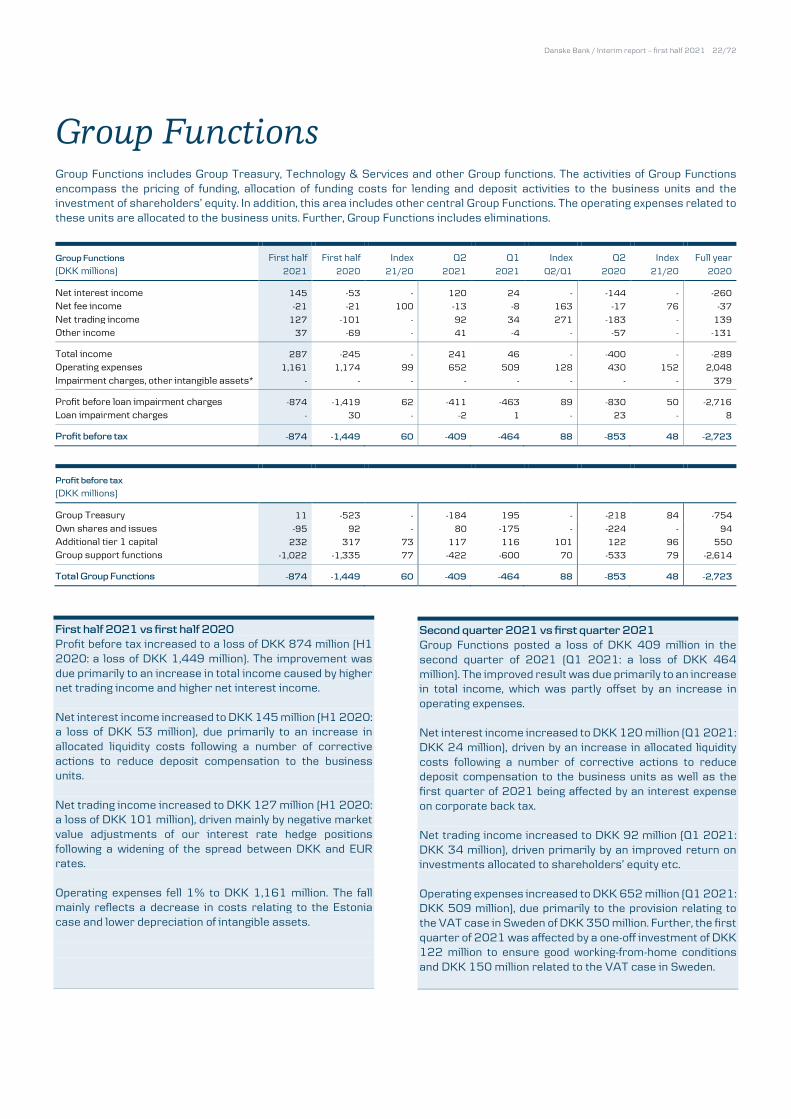
Danske Bank / Interim report – first half 2021 22/72
Group Functions Group Functions includes Group Treasury, Technology & Services and other Group functions. The activities of Group Functions encompass the pricing of funding, allocation of funding costs for lending and deposit activities to the business units and the investment of shareholders’ equity. In addition, this area includes other central Group Functions. The operating expenses related to these units are allocated to the business units. Further, Group Functions includes eliminations. Group Functions First half First half Index Q2 Q1 Index Q2 Index Full year (DKK millions) 2021 2020 21/20 2021 2021 Q2/Q1 2020 21/20 2020
Net interest income 145 -53 - 120 24 - -144 - -260
Net fee income -21 -21 100 -13 -8 163 -17 76 -37
Net trading income 127 -101 - 92 34 271 -183 - 139
Other income 37 -69 - 41 -4 - -57 - -131
Total income 287 -245 - 241 46 - -400 - -289
Operating expenses 1,161 1,174 99 652 509 128 430 152 2,048
Impairment charges, other intangible assets* - - - - - - - - 379
Profit before loan impairment charges -874 -1,419 62 -411 -463 89 -830 50 -2,716
Loan impairment charges - 30 - -2 1 - 23 - 8
Profit before tax -874 -1,449 60 -409 -464 88 -853 48 -2,723
Profit before tax (DKK millions)
Group Treasury 11 -523 - -184 195 - -218 84 -754
Own shares and issues -95 92 - 80 -175 - -224 - 94
Additional tier 1 capital 232 317 73 117 116 101 122 96 550
Group support functions -1,022 -1,335 77 -422 -600 70 -533 79 -2,614
Total Group Functions -874 -1,449 60 -409 -464 88 -853 48 -2,723
First half 2021 vs first half 2020 Profit before tax increased to a loss of DKK 874 million (H1 2020: a loss of DKK 1,449 million). The improvement was due primarily to an increase in total income caused by higher net trading income and higher net interest income. Net interest income increased to DKK 145 million (H1 2020: a loss of DKK 53 million), due primarily to an increase in allocated liquidity costs following a number of corrective actions to reduce deposit compensation to the business units. Net trading income increased to DKK 127 million (H1 2020: a loss of DKK 101 million), driven mainly by negative market value adjustments of our interest rate hedge positions following a widening of the spread between DKK and EUR rates. Operating expenses fell 1% to DKK 1,161 million. The fall mainly reflects a decrease in costs relating to the Estonia case and lower depreciation of intangible assets.
Second quarter 2021 vs first quarter 2021 Group Functions posted a loss of DKK 409 million in the second quarter of 2021 (Q1 2021: a loss of DKK 464 million). The improved result was due primarily to an increase in total income, which was partly offset by an increase in operating expenses. Net interest income increased to DKK 120 million (Q1 2021: DKK 24 million), driven by an increase in allocated liquidity costs following a number of corrective actions to reduce deposit compensation to the business units as well as the first quarter of 2021 being affected by an interest expense on corporate back tax. Net trading income increased to DKK 92 million (Q1 2021: DKK 34 million), driven primarily by an improved return on investments allocated to shareholders’ equity etc. Operating expenses increased to DKK 652 million (Q1 2021: DKK 509 million), due primarily to the provision relating to the VAT case in Sweden of DKK 350 million. Further, the first quarter of 2021 was affected by a one-off investment of DKK 122 million to ensure good working-from-home conditions and DKK 150 million related to the VAT case in Sweden.
Danske Bank / Interim report – first half 2021 23/72
Definition of alternative performance measures
Danske Bank’s management believes that the alternative performance measures (APMs) used in the Management’s report provide valuable information to readers of
the financial statements. The APMs provide a more consistent basis for comparing the results of financial periods and for assessing the performance of the Group and
each individual business unit. They are also an important aspect of the way in which Danske Bank’s management defines operating targets and monitors performance.
Throughout the Management’s report, performance is assessed on the basis of the financial highlights and segment reporting, which represent the financial information
regularly provided to management. The differences between the financial highlights and the IFRS financial statements relate to certain changes in the presentation. Net
profit is the same in the financial highlights and in the IFRS income statement. Note G3 to the financial statements describes the differences between the financial
highlights and the IFRS financial statements, and each line item in the financial highlights is reconciled with the consolidated financial statements prepared under IFRS.
Definitions of additional ratios presented on page 3 and in other sections of the Management’s report:
Ratios and key figures Definition
Dividend per share (DKK)
The dividend per share proposed in the Annual report and paid to shareholders in the subsequent year.
Accordingly, for 2020, it is the dividend to be paid in 2021.
Return on average shareholders’ equity (% p.a.) Net profit as disclosed in the financial highlights divided by the average of the quarterly average
shareholders’ equity (beginning and end of each quarter) within the year. Net profit and shareholders’
equity are stated as if the equity-accounted additional tier 1 capital was classified as a liability. In the
numerator, net profit is reduced by interest expenses of DKK 231 million (full-year 2020: DKK 551
million). The denominator represents equity, excluding additional tier 1 capital and other non-controlling
interests equal to a reduction in the average of the quarterly average of equity of DKK 8,779 million (2020:
13,526 million) compared to a simple average of total equity (beginning and the end of the period).
Net interest income as % p.a. of loans and deposits Net interest income in the financial highlights divided by the daily average of the sum of loans and deposits.
If the ratio was calculated applying the sum of loans and deposits end of period, the ratio for Q2 2021
would be 0.73% (full-year 2020: 0.73%) due to the daily average of the sum of loans and deposits being
DKK 24.0 billion higher (2020: DKK 124.8 billion lower) than calculating the ratio by applying the end of
period sum of loans and deposits. The purpose of the ratio is to show if the growth in net interest income
follows the growth in loans and deposits. The daily average is a more faithful representation of the growth
in loans and deposits.
Cost/income ratio (C/I), (%) Operating expenses, impairment charges on goodwill and impairment charges other intangible assets
divided by total income. All amounts are from the financial highlights.
C/I, excluding impairment on intangible assets (%) Operating expenses divided by total income. All amounts are from the financial highlights.
Book value per share Shareholders’ equity (that is, excluding equity-accounted additional tier 1 capital) divided by the number of
shares outstanding at the end of the period.
Loan impairment charges as % of net credit exposure This ratio is calculated on the basis of loan impairment charges and loans and guarantees in core
segments. The numerator is the loan impairment charges of DKK 737 million (full-year 2020: DKK 7,001
million) from the financial highlights and annualised. The denominator is the sum of Loans at amortised
cost of DKK 1,022.7 billion (2020: DKK 1,022.3 billion), Loans at fair value of DKK 816.3 billion (2020:
DKK 802.6 billion) and guarantees of DKK 71.7 billion (2020: DKK 68.7 billion) at the beginning of the
year, as disclosed in the column “Lending activities – core” in the “Breakdown of credit exposure” table in
the notes to the financial statements. The ratio is calculated for each business unit.
Allowance account as % of net credit exposure This ratio is calculated on the basis of the allowance account and loans and guarantees in core segments.
The numerator is the allowance account of DKK 22.5 billion (2020: DKK 22.6 billion) at the end of the
period, as disclosed in the “Allowance account in core activities broken down by segment” table in the notes
to the financial statements. The denominator is the sum of Loans at amortised cost of DKK 1,008.2 billion
(2020: DKK1,022.7 billion), Loans at fair value of DKK 803.0 billion (DKK 816.3 billion), and guarantees
of DKK 79.8 billion (2020: DKK 71.7 billion), at the end of the period, as disclosed in the column “Lending
activities –core” in the “Breakdown of credit exposure” table in the notes to the financial statements. The
ratio is calculated for each business unit.
Market shares of lending and deposits Market shares are based on data from central banks at the time of reporting. Comparative information is
updated on the basis of the latest available data, for example Annual Report 2020 included November
2020 data for Finland and Norway as December 2020 data was not available at the time of publication of
Annual Report 2020. This was subsequently updated to December 2020 data in Interim report – first
quarter 2021.
Danske Bank / Interim report – first half 2021 24/72
Income statement 25
Statement of comprehensive income 26
Balance sheet 27
Statement of capital 28
Cash flow statement 30 Notes
Note G1: Significant accounting policies and estimates 31 Note G2: Changes in accounting policies, financial highlights and segment reporting 34 Note G3: Business segments 36 Note G4: Income 39 Note G5: Loan impairment charges and reconciliation of total allowance account 40 Note G6: Issued bonds, subordinated debt and additional tier 1 capital 41 Note G7: Other assets and other liabilities 42 Note G8: Foreign currency translation reserve 42 Note G9: Guarantees, commitments and contingent liabilities 43 Note G10: Assets provided or received as collateral 45 Note G11: Fair value information for financial instruments 46 Note G12: Group holdings and undertakings 49 Note G13: Events after the reporting date 49
Risk Management 50
Breakdown of credit exposure 50 Credit exposure from core lending activities 51 Credit exposure from Non-core lending activities 59 Counterparty credit risk and credit risk from trading and investment securities 60 Bond portfolio 60
Financial statements – Danske Bank A/S 63
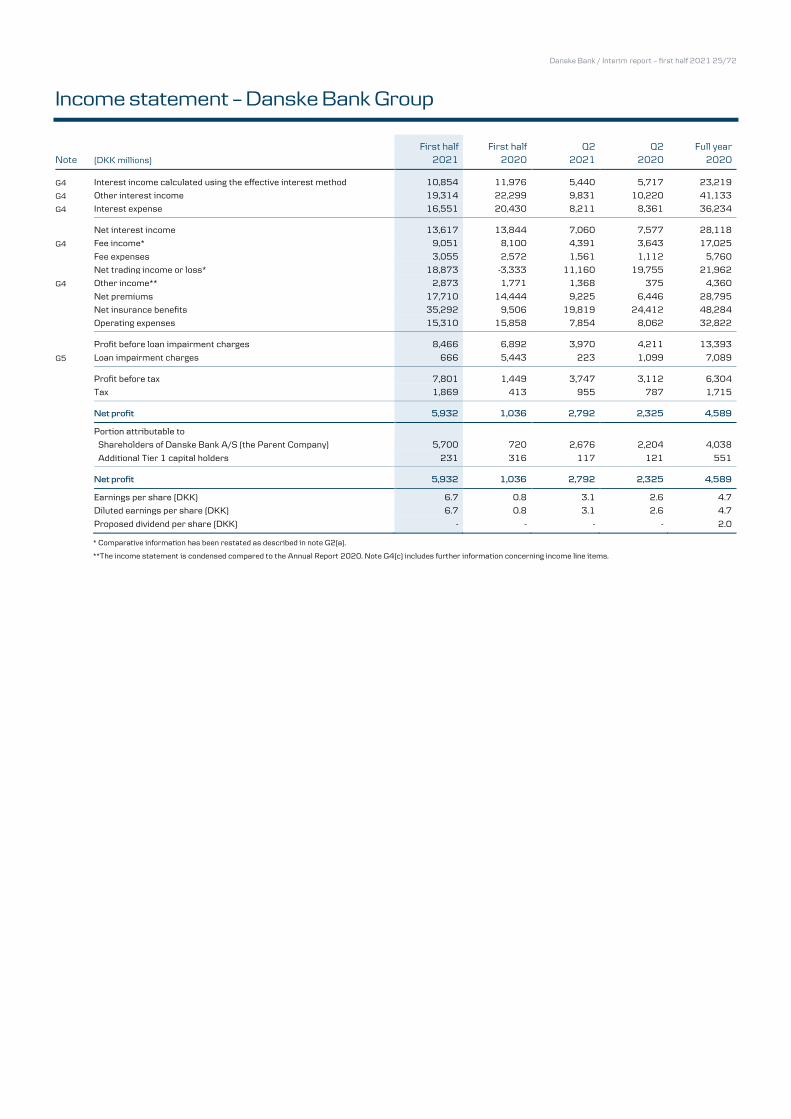
Danske Bank / Interim report – first half 2021 25/72
Income statement – Danske Bank Group
First half First half Q2 Q2 Full year Note (DKK millions) 2021 2020 2021 2020 2020
G4 Interest income calculated using the effective interest method 10,854 11,976 5,440 5,717 23,219
G4 Other interest income 19,314 22,299 9,831 10,220 41,133
G4 Interest expense 16,551 20,430 8,211 8,361 36,234
Net interest income 13,617 13,844 7,060 7,577 28,118
G4 Fee income* 9,051 8,100 4,391 3,643 17,025
Fee expenses 3,055 2,572 1,561 1,112 5,760
Net trading income or loss* 18,873 -3,333 11,160 19,755 21,962
G4 Other income** 2,873 1,771 1,368 375 4,360
Net premiums 17,710 14,444 9,225 6,446 28,795
Net insurance benefits 35,292 9,506 19,819 24,412 48,284
Operating expenses 15,310 15,858 7,854 8,062 32,822
Profit before loan impairment charges 8,466 6,892 3,970 4,211 13,393
G5 Loan impairment charges 666 5,443 223 1,099 7,089
Profit before tax 7,801 1,449 3,747 3,112 6,304
Tax 1,869 413 955 787 1,715
Net profit 5,932 1,036 2,792 2,325 4,589
Portion attributable to
Shareholders of Danske Bank A/S (the Parent Company) 5,700 720 2,676 2,204 4,038
Additional Tier 1 capital holders 231 316 117 121 551
Net profit 5,932 1,036 2,792 2,325 4,589
Earnings per share (DKK) 6.7 0.8 3.1 2.6 4.7
Diluted earnings per share (DKK) 6.7 0.8 3.1 2.6 4.7
Proposed dividend per share (DKK) - - - - 2.0
* Comparative information has been restated as described in note G2(a).
**The income statement is condensed compared to the Annual Report 2020. Note G4(c) includes further information concerning income line items.
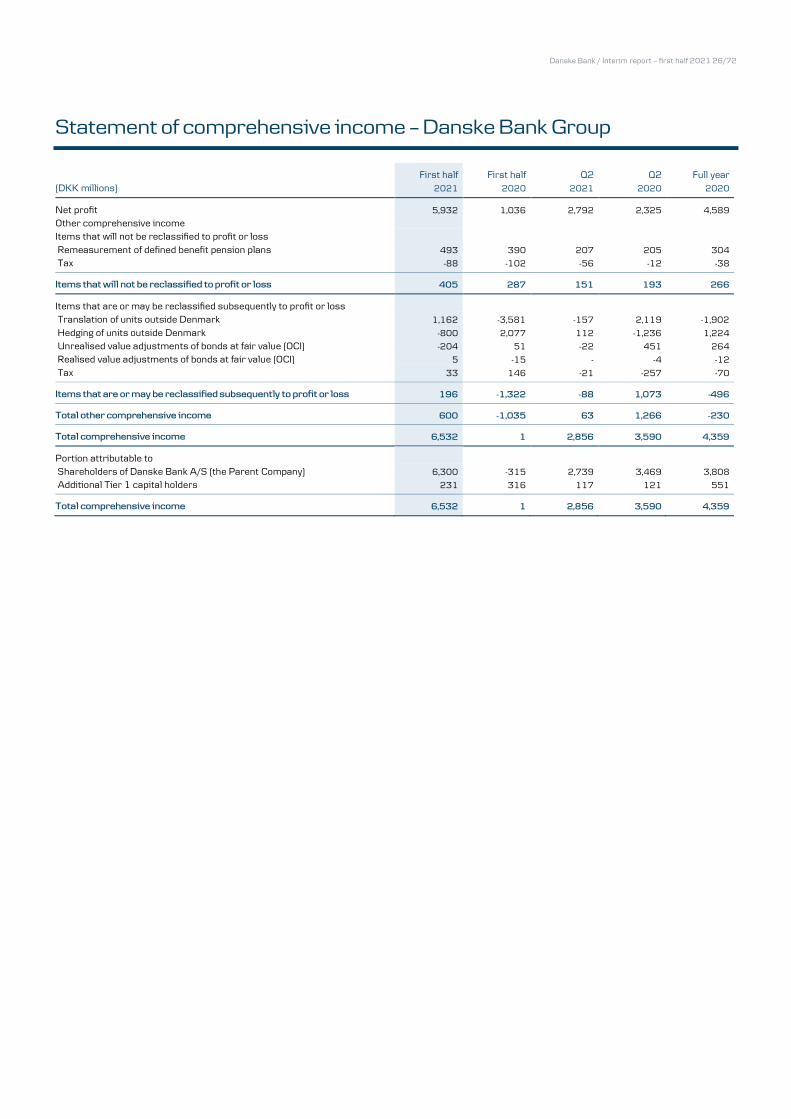
Danske Bank / Interim report – first half 2021 26/72
Statement of comprehensive income – Danske Bank Group
First half First half Q2 Q2 Full year (DKK millions) 2021 2020 2021 2020 2020
Net profit 5,932 1,036 2,792 2,325 4,589
Other comprehensive income Items that will not be reclassified to profit or loss Remeasurement of defined benefit pension plans 493 390 207 205 304
Tax -88 -102 -56 -12 -38
Items that will not be reclassified to profit or loss 405 287 151 193 266
Items that are or may be reclassified subsequently to profit or loss Translation of units outside Denmark 1,162 -3,581 -157 2,119 -1,902
Hedging of units outside Denmark -800 2,077 112 -1,236 1,224
Unrealised value adjustments of bonds at fair value (OCI) -204 51 -22 451 264
Realised value adjustments of bonds at fair value (OCI) 5 -15 - -4 -12
Tax 33 146 -21 -257 -70
Items that are or may be reclassified subsequently to profit or loss 196 -1,322 -88 1,073 -496
Total other comprehensive income 600 -1,035 63 1,266 -230
Total comprehensive income 6,532 1 2,856 3,590 4,359
Portion attributable to Shareholders of Danske Bank A/S (the Parent Company) 6,300 -315 2,739 3,469 3,808
Additional Tier 1 capital holders 231 316 117 121 551
Total comprehensive income 6,532 1 2,856 3,590 4,359
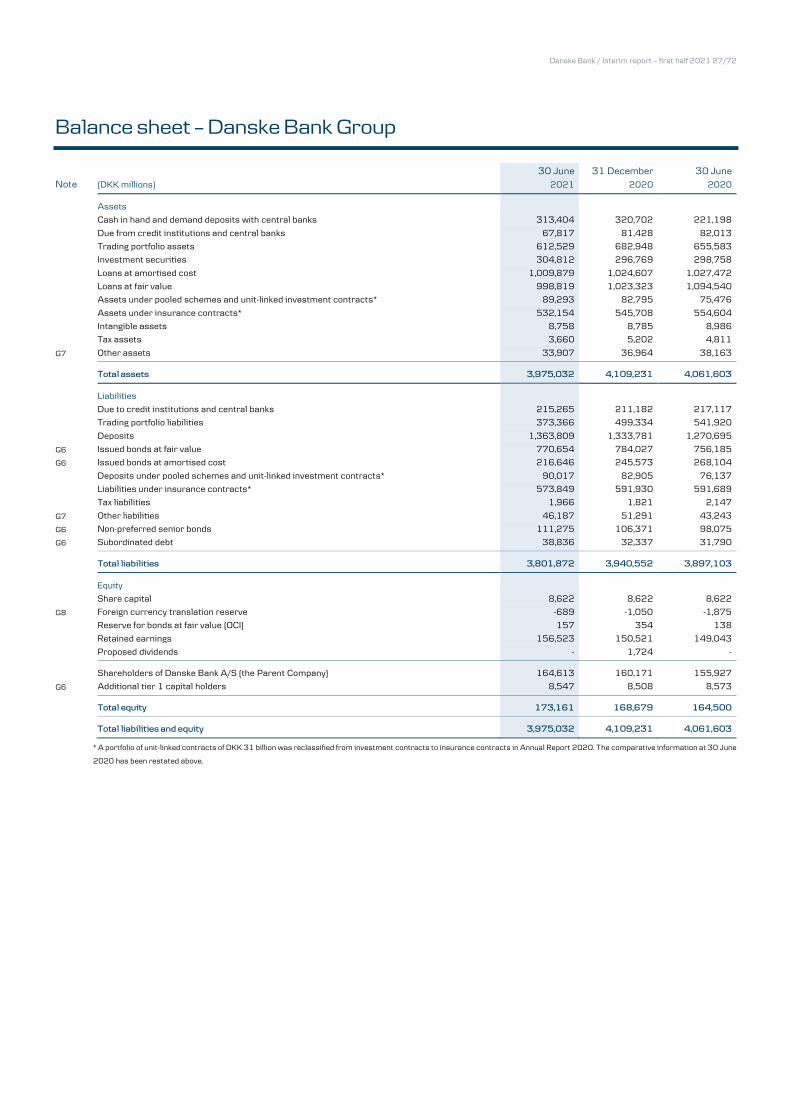
Danske Bank / Interim report – first half 2021 27/72
Balance sheet – Danske Bank Group 30 June 31 December 30 June Note (DKK millions) 2021 2020 2020
Assets
Cash in hand and demand deposits with central banks 313,404 320,702 221,198
Due from credit institutions and central banks 67,817 81,428 82,013
Trading portfolio assets 612,529 682,948 655,583
Investment securities 304,812 296,769 298,758
Loans at amortised cost 1,009,879 1,024,607 1,027,472
Loans at fair value 998,819 1,023,323 1,094,540
Assets under pooled schemes and unit-linked investment contracts* 89,293 82,795 75,476
Assets under insurance contracts* 532,154 545,708 554,604
Intangible assets 8,758 8,785 8,986
Tax assets 3,660 5,202 4,811
G7 Other assets 33,907 36,964 38,163
Total assets 3,975,032 4,109,231 4,061,603
Liabilities
Due to credit institutions and central banks 215,265 211,182 217,117
Trading portfolio liabilities 373,366 499,334 541,920
Deposits 1,363,809 1,333,781 1,270,695
G6 Issued bonds at fair value 770,654 784,027 756,185
G6 Issued bonds at amortised cost 216,646 245,573 268,104
Deposits under pooled schemes and unit-linked investment contracts* 90,017 82,905 76,137
Liabilities under insurance contracts* 573,849 591,930 591,689
Tax liabilities 1,966 1,821 2,147
G7 Other liabilities 46,187 51,291 43,243
G6 Non-preferred senior bonds 111,275 106,371 98,075
G6 Subordinated debt 38,836 32,337 31,790
Total liabilities 3,801,872 3,940,552 3,897,103
Equity
Share capital 8,622 8,622 8,622
G8 Foreign currency translation reserve -689 -1,050 -1,875
Reserve for bonds at fair value (OCI) 157 354 138
Retained earnings 156,523 150,521 149,043
Proposed dividends - 1,724 -
Shareholders of Danske Bank A/S (the Parent Company) 164,613 160,171 155,927
G6 Additional tier 1 capital holders 8,547 8,508 8,573
Total equity 173,161 168,679 164,500
Total liabilities and equity 3,975,032 4,109,231 4,061,603
* A portfolio of unit-linked contracts of DKK 31 billion was reclassified from investment contracts to insurance contracts in Annual Report 2020. The comparative information at 30 June
2020 has been restated above.
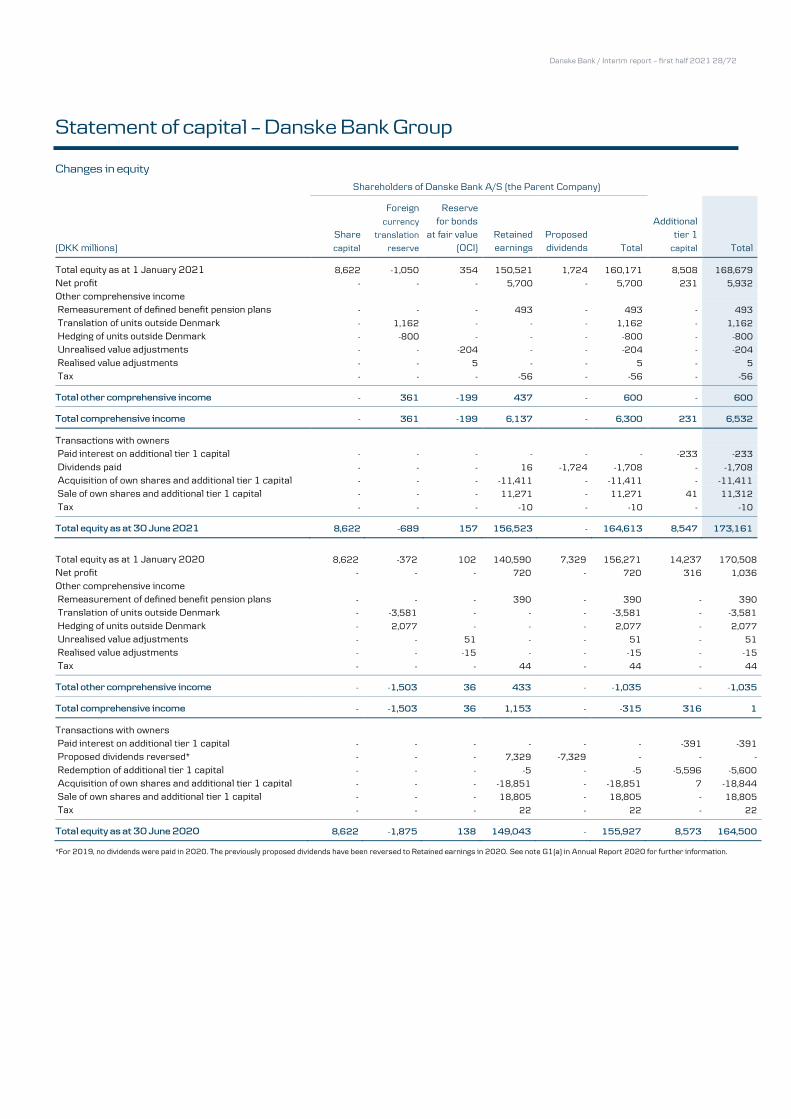
Danske Bank / Interim report – first half 2021 28/72
Statement of capital – Danske Bank Group Changes in equity
Shareholders of Danske Bank A/S (the Parent Company)
(DKK millions)
Share
capital
Foreign
currency
translation
reserve
Reserve for bonds
at fair value (OCI)
Retained earnings
Proposed dividends Total
Additional tier 1
capital Total
Total equity as at 1 January 2021 8,622 -1,050 354 150,521 1,724 160,171 8,508 168,679
Net profit - - - 5,700 - 5,700 231 5,932
Other comprehensive income
Remeasurement of defined benefit pension plans - - - 493 - 493 - 493
Translation of units outside Denmark - 1,162 - - - 1,162 - 1,162
Hedging of units outside Denmark - -800 - - - -800 - -800
Unrealised value adjustments - - -204 - - -204 - -204
Realised value adjustments - - 5 - - 5 - 5
Tax - - - -56 - -56 - -56
Total other comprehensive income - 361 -199 437 - 600 - 600
Total comprehensive income - 361 -199 6,137 - 6,300 231 6,532
Transactions with owners
Paid interest on additional tier 1 capital - - - - - - -233 -233
Dividends paid - - - 16 -1,724 -1,708 - -1,708
Acquisition of own shares and additional tier 1 capital - - - -11,411 - -11,411 - -11,411
Sale of own shares and additional tier 1 capital - - - 11,271 - 11,271 41 11,312
Tax - - - -10 - -10 - -10
Total equity as at 30 June 2021 8,622 -689 157 156,523 - 164,613 8,547 173,161
Total equity as at 1 January 2020 8,622 -372 102 140,590 7,329 156,271 14,237 170,508
Net profit - - - 720 - 720 316 1,036
Other comprehensive income Remeasurement of defined benefit pension plans - - - 390 - 390 - 390
Translation of units outside Denmark - -3,581 - - - -3,581 - -3,581
Hedging of units outside Denmark - 2,077 - - - 2,077 - 2,077
Unrealised value adjustments - - 51 - - 51 - 51
Realised value adjustments - - -15 - - -15 - -15
Tax - - - 44 - 44 - 44
Total other comprehensive income - -1,503 36 433 - -1,035 - -1,035
Total comprehensive income - -1,503 36 1,153 - -315 316 1
Transactions with owners Paid interest on additional tier 1 capital - - - - - - -391 -391
Proposed dividends reversed* - - - 7,329 -7,329 - - -
Redemption of additional tier 1 capital - - - -5 - -5 -5,596 -5,600
Acquisition of own shares and additional tier 1 capital - - - -18,851 - -18,851 7 -18,844
Sale of own shares and additional tier 1 capital - - - 18,805 - 18,805 - 18,805
Tax - - - 22 - 22 - 22
Total equity as at 30 June 2020 8,622 -1,875 138 149,043 - 155,927 8,573 164,500
*For 2019, no dividends were paid in 2020. The previously proposed dividends have been reversed to Retained earnings in 2020. See note G1(a) in Annual Report 2020 for further information.
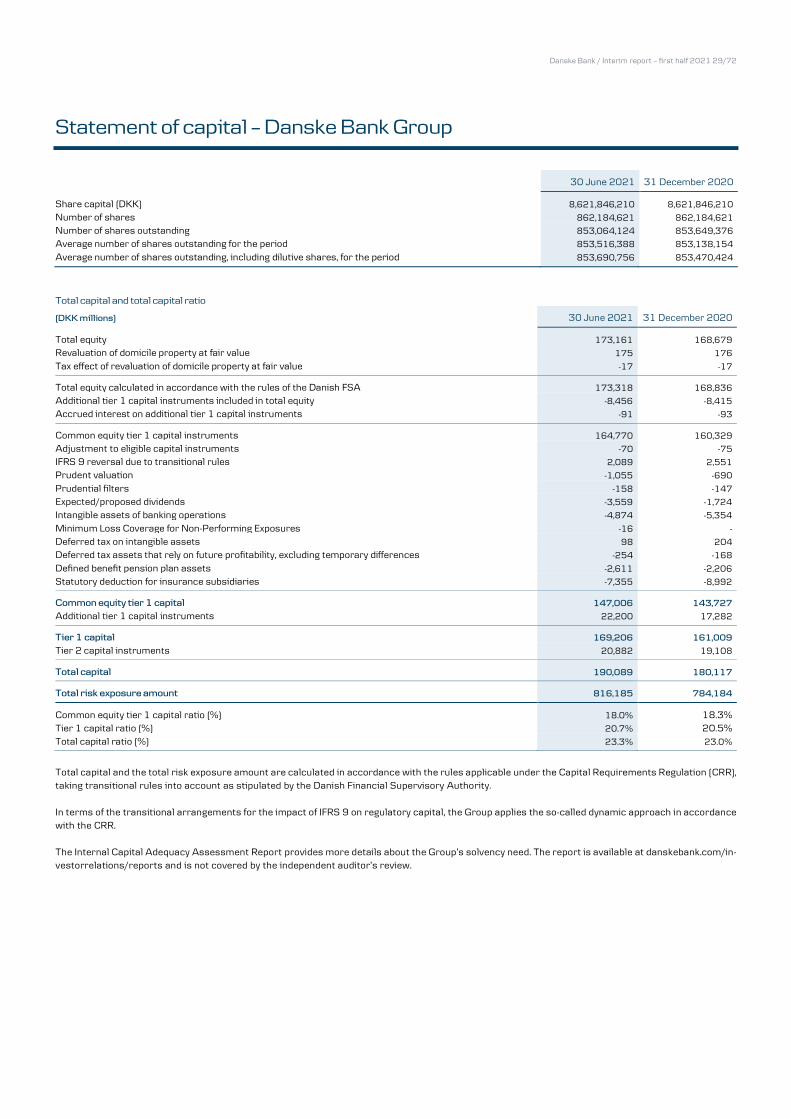
Danske Bank / Interim report – first half 2021 29/72
Statement of capital – Danske Bank Group
30 June 2021 31 December 2020
Share capital (DKK) 8,621,846,210 8,621,846,210
Number of shares 862,184,621 862,184,621
Number of shares outstanding 853,064,124 853,649,376
Average number of shares outstanding for the period 853,516,388 853,138,154
Average number of shares outstanding, including dilutive shares, for the period 853,690,756 853,470,424
Total capital and total capital ratio
(DKK millions) 30 June 2021 31 December 2020
Total equity 173,161 168,679
Revaluation of domicile property at fair value 175 176
Tax effect of revaluation of domicile property at fair value -17 -17
Total equity calculated in accordance with the rules of the Danish FSA 173,318 168,836
Additional tier 1 capital instruments included in total equity -8,456 -8,415
Accrued interest on additional tier 1 capital instruments -91 -93
Common equity tier 1 capital instruments 164,770 160,329
Adjustment to eligible capital instruments -70 -75
IFRS 9 reversal due to transitional rules 2,089 2,551
Prudent valuation -1,055 -690
Prudential filters -158 -147
Expected/proposed dividends -3,559 -1,724
Intangible assets of banking operations -4,874 -5,354
Minimum Loss Coverage for Non-Performing Exposures -16 -
Deferred tax on intangible assets 98 204
Deferred tax assets that rely on future profitability, excluding temporary differences -254 -168
Defined benefit pension plan assets -2,611 -2,206
Statutory deduction for insurance subsidiaries -7,355 -8,992
Common equity tier 1 capital 147,006 143,727
Additional tier 1 capital instruments 22,200 17,282
Tier 1 capital 169,206 161,009
Tier 2 capital instruments 20,882 19,108
Total capital 190,089 180,117
Total risk exposure amount 816,185 784,184
Common equity tier 1 capital ratio (%) 18.0% 18.3% Tier 1 capital ratio (%) 20.7% 20.5% Total capital ratio (%) 23.3% 23.0%
Total capital and the total risk exposure amount are calculated in accordance with the rules applicable under the Capital Requirements Regulation (CRR), taking transitional rules into account as stipulated by the Danish Financial Supervisory Authority.
In terms of the transitional arrangements for the impact of IFRS 9 on regulatory capital, the Group applies the so-called dynamic approach in accordance with the CRR.
The Internal Capital Adequacy Assessment Report provides more details about the Group’s solvency need. The report is available at danskebank.com/in-vestorrelations/reports and is not covered by the independent auditor’s review.
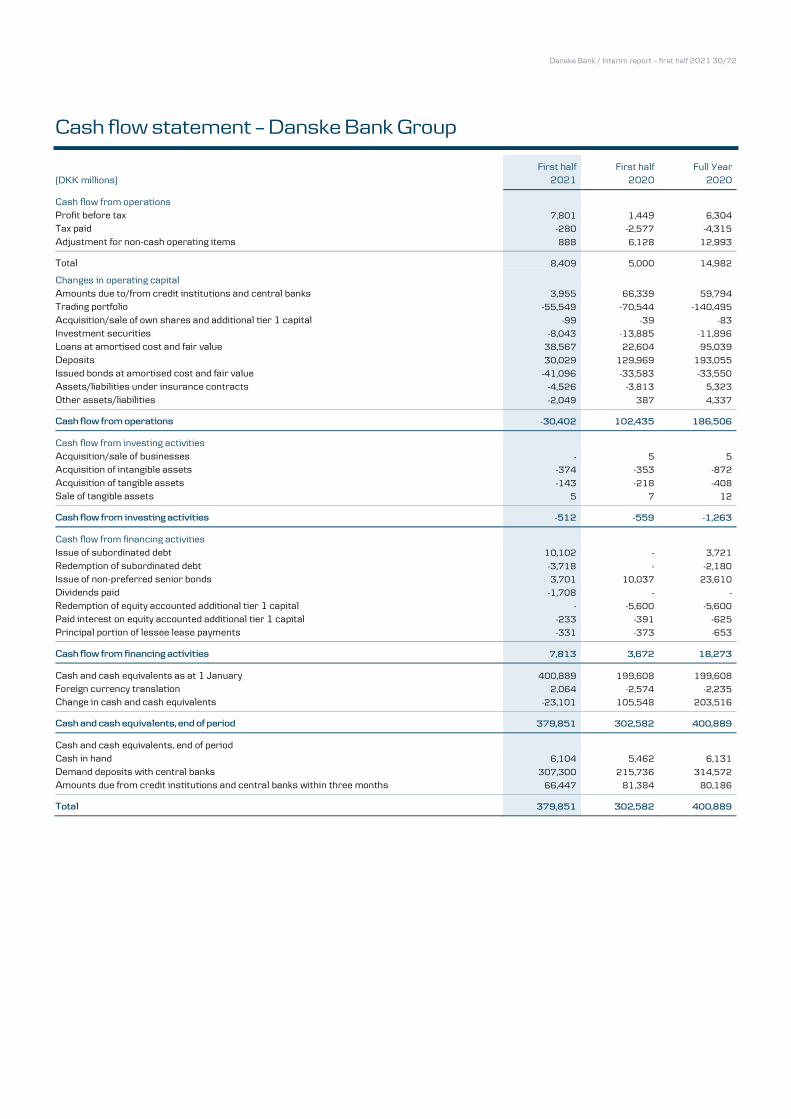
Danske Bank / Interim report – first half 2021 30/72
Cash flow statement – Danske Bank Group
First half First half Full Year (DKK millions) 2021 2020 2020
Cash flow from operations Profit before tax 7,801 1,449 6,304
Tax paid -280 -2,577 -4,315
Adjustment for non-cash operating items 888 6,128 12,993
Total 8,409 5,000 14,982
Changes in operating capital Amounts due to/from credit institutions and central banks 3,955 66,339 59,794
Trading portfolio -55,549 -70,544 -140,495
Acquisition/sale of own shares and additional tier 1 capital -99 -39 -83
Investment securities -8,043 -13,885 -11,896
Loans at amortised cost and fair value 38,567 22,604 95,039
Deposits 30,029 129,969 193,055
Issued bonds at amortised cost and fair value -41,096 -33,583 -33,550
Assets/liabilities under insurance contracts -4,526 -3,813 5,323
Other assets/liabilities -2,049 387 4,337
Cash flow from operations -30,402 102,435 186,506
Cash flow from investing activities
Acquisition/sale of businesses - 5 5
Acquisition of intangible assets -374 -353 -872
Acquisition of tangible assets -143 -218 -408
Sale of tangible assets 5 7 12
Cash flow from investing activities -512 -559 -1,263
Cash flow from financing activities Issue of subordinated debt 10,102 - 3,721
Redemption of subordinated debt -3,718 - -2,180
Issue of non-preferred senior bonds 3,701 10,037 23,610
Dividends paid -1,708 - -
Redemption of equity accounted additional tier 1 capital - -5,600 -5,600
Paid interest on equity accounted additional tier 1 capital -233 -391 -625
Principal portion of lessee lease payments -331 -373 -653
Cash flow from financing activities 7,813 3,672 18,273
Cash and cash equivalents as at 1 January 400,889 199,608 199,608
Foreign currency translation 2,064 -2,574 -2,235
Change in cash and cash equivalents -23,101 105,548 203,516
Cash and cash equivalents, end of period 379,851 302,582 400,889
Cash and cash equivalents, end of period Cash in hand 6,104 5,462 6,131
Demand deposits with central banks 307,300 215,736 314,572
Amounts due from credit institutions and central banks within three months 66,447 81,384 80,186
Total 379,851 302,582 400,889
Danske Bank / Interim report – first half 2021 31/72
Notes – Danske Bank Group
G1. Significant accounting policies and estimates
(a) General
The report has been prepared in accordance with IAS 34, Interim Financial Reporting, as adopted by the EU, and additional Danish disclosure require-ments for listed financial companies. The report is condensed and should be read in conjunction with the Group’s Annual Report 2020.
On 1 January 2021, the Group implemented the amendments to IFRS 9, IAS 39, IFRS 7, IFRS 4 and IFRS 16 (Interest Rate Benchmark Reform, phase 2) and IFRS 16 (Covid-19 Related Rent Concessions). The Group has changed the presentation in the income statement of indirect fees earned when cus-
tomers are granted, refinance or prepay Danish mortgage loans. Further information on the changes to accounting policies and presentation in 2021 can be found in note G2(a). Except for these changes, the Group has not changed its significant accounting policies from those applied in Annual Report 2020. Annual Report 2020 provides a full description of the significant accounting policies.
For changes in the Group’s financial highlights and segment reporting, see note G2(b). Financial statement figures are stated in Danish kroner and whole millions, unless otherwise stated. As a result, rounding discrepancies may occur because totals have been rounded off and the underlying decimals are not presented to financial statement users.
(b) Significant accounting estimates and judgements
The preparation of financial information requires, in some cases, the use of judgements and estimates by management. This includes judgements made when applying accounting policies. The most significant judgements made when applying accounting policies relate to the classification of financial assets
and financial liabilities under IFRS 9, especially related to the business model assessment, and the SPPI test (further explained in note G15 of the Annual Report 2020) and the designation of financial liabilities at fair value through profit or loss to eliminate or significantly reduce an accounting mismatch (further explained in note G16 of the Annual Report 2020). An overview of the classification and measurement basis for financial instruments can be
found in in note G1(c) of the Annual Report 2020. The determination of the carrying amounts of some assets and liabilities requires the estimation of the effects of uncertain future events on those assets
and liabilities. The estimates are based on premises that management finds reasonable but which are inherently uncertain and unpredictable. The prem-ises may be incomplete, unexpected future events or situations may occur, and other parties may arrive at other estimated values. In view of the inherent uncertainties and the high level of subjectivity and judgement involved in the recognition and measurement of the items listed below, it is possible that
the outcomes in the next reporting period could differ from those on which management’s estimates are based. Measurement of expected credit losses on loans, financial guarantees and loan commitments, and bonds measured at amortised cost or fair value
through other comprehensive income The three-stage expected credit loss impairment model in IFRS 9 depends on whether the credit risk has increased significantly since initial recognition. If the credit risk has not increased significantly, the impairment charge equals the expected credit losses resulting from default events that are possible
within the next 12 months (stage 1). If the credit risk has increased significantly, the loan is more than 30 days past due, or the loan is in default or otherwise impaired, the impairment charge equals the lifetime expected credit losses (stages 2 and 3). In determining the impairment for expected credit losses, management exercises judgement and uses estimates and assumptions as explained below.
The expected credit losses are calculated for all individual facilities as a function of probability of default (PD), exposure at default (EAD) and loss given default (LGD) and incorporate forward-looking information. The estimation of expected credit losses involves forecasting future economic conditions over
a number of years. Such forecasts are subject to management judgement and those judgements may be sources of measurement uncertainty that have significant risk of resulting in a material adjustment to a carrying amount in future periods. The incorporation of forward-looking elements reflects the expectations of the Group’s senior management and involves the creation of scenarios (base case, upside and downside), including an assessment of the
probability for each scenario. The purpose of using multiple scenarios is to model the non-linear impact of assumptions about macroeconomic factors on the expected credit losses.
The forward-looking information is based on a three-year forecast period converging to steady state in year seven. The base case is an extension of the Group’s official view of the Nordic economies (the Nordic Outlook report). At 30 June 2021, the base case scenario reflects a recovery later in 2021. To fully capture the downside risk, the downside scenario used at 30 June 2021 is the severe recession scenario applied in the Group’s ICAAP processes
and is similar in nature to regulatory stress tests. The severe recession scenario reflects negative growth and falling property prices for a longer period. At 31 December 2020, the down-side scenario reflected a W-shaped trend in the light of the corona crisis with the economies being back on track in the second or third quarter of 2021. The change of the downside scenario has been made in order to capture the risk of prolonged lockdowns due to new
coronavirus variants and in order for the ECL calculation to include potential downside risks due to the elevated asset prices across the Nordics. Infor-mation on the macroeconomic parameters in the base case and downside scenarios can be found in the risk management notes.
Danske Bank / Interim report – first half 2021 32/72
Notes – Danske Bank Group
(b) Significant accounting estimates continued
With the new suite of scenarios, the base case scenario enters with a probability of 75% (31 December 2020: 60%), the upside scenario with a proba-
bility of 10% (31 December 2020: 15%) and the downside scenario with a probability of 15% (31 December 2020: 25%). On the basis of these assess-ments, the allowance account as at 30 June 2021 amounted to DKK 23.3 billion (31 December 2020: DKK 23.3 billion). If the base case scenario was assigned a probability of 100%, the allowance account would decrease DKK 1.2 billion (31 December 2020: 0.4 billion). Compared to the base case
scenario, the allowance account would increase DKK 8.5 billion (31 December 2020: DKK 1.7 billion), if the downside scenario was assigned a probability of 100%. The increase reflects primarily the transfer of exposures from stage 1 to stage 2 and increased expected credit losses within stage 2. If instead the upside scenario was assigned a probability of 100 %, the allowance account would decrease DKK 0.4 billion (31 December 2020: DKK 0.4 billion)
compared to the base case scenario. However, note that the applied scenarios differ from the scenarios used at 31 December 2020, and the changes in weighting and sensitivities from end of 2020 to end of the first half 2021 are therefore not directly comparable, especially due to the downside scenario being a severe downside scenario at 30 June 2021 to fully capture the downside risks. Further, it shall be noted that the expected credit losses in the
individual scenarios does not represent expected credit loss (ECL) forecasts. Management applies judgement when determining the need for post-model adjustments. As at 30 June 2021, the post-model adjustments amounted to
DKK 6.0 billion (31 December 2020: DKK 6.4 billion) and continue to include the immediate risks arising from the corona crisis due to the continued significant uncertainty related to the magnitude of the pandemic, the effectiveness of the roll-out of the vaccine programmes and to the extent to which governments will continue to support the economies. On the types of risks covered by post-model adjustments, more information can be found in the risk
management notes. Further information on the Group’s accounting treatment of the impacts on expected credit losses from the corona crisis can be found on pages 82 -83
of Annual Report 2020. Note G15 of the Annual Report 2020 and the section on credit risk in the risk management notes provide more details on expected credit losses. As at
30 June 2021, financial assets covered by the expected credit loss model accounted for about 53% of total assets (31 December 2020: 52%).
Fair value measurement of financial instruments
At the end of June 2021, no unusual challenges in obtaining reliable pricing apart from insignificant parts of the portfolio remained. The majority of valuation techniques continues to employ only observable market data, and there has been no significant increase in financial instruments measured on the basis of valuation techniques that are based on one or more significant unobservable inputs. The latter continues to include only unlisted shares,
certain bonds and some long-dated derivatives for which there is no active market. On the derivatives portfolio, the Group makes fair value adjustments to cover changes in counterparty risk (CVA and DVA) and to cover expected funding costs (FVA and ColVA) on derivatives, bid-offer spreads on the net open position of the portfolio of assets and liabilities with offsetting market risk recognised at mid-market prices, and model risk on level 3 derivatives.
As at 30 June 2021, the adjustments totalled DKK 1.1 billion (31 December 2020: DKK 1.6 billion), including the adjustment for credit risk on derivatives that are credit impaired. Note G11 of this report and note G33(a) of the Annual Report 2020 provides more details on the fair value measurement of financial instruments. The Group uses derivatives to hedge the fixed interest rate on some financial assets and liabilities, thus converting the fixed interest rates on the financial instruments to variable interest rates by the use of swaps. The ongoing Interest Rate Benchmark Reform will replace existing benchmark interbank
offered rates (IBORs) with alternative risk-free rates. There is currently uncertainty as to the timing and the methods of transition of different IBORs and whether some existing benchmarks will continue to be supported. As a result of these developments, accounting judgement is involved in determining whether certain hedge accounting relationships that hedge the interest rate risk due to changes in IBORs continue to qualify for hedge accounting. EUR
and USD denominated swaps cleared on a CCP have been converted to ESTR and SOFR discounting respectively, and the conversion had no significant impact on the Group’s hedge accounting values. Following IASB’s project ‘Interest Rate Benchmark Reform, phase I’ for the assessment of effectiveness of such hedges, it is assumed that the interest rate benchmark is not altered as a result of the reform. For further information, see note G12(d) of the
Annual Report 2020.
Danske Bank / Interim report – first half 2021 33/72
Notes – Danske Bank Group
(b) Significant accounting estimates continued
Measurement of goodwill
Goodwill is tested for impairment once a year or more frequently if indications of impairment exist. Impairment testing requires management to estimate the present value of future cash flows. A number of factors affect the value of such cash flows, including discount rates, changes in the economic outlook, customer behaviour and competition. At 30 June 2021, goodwill amounted to DKK 6.1 billion (31 December 2020: DKK 6.1 billion).
In connection with the quarterly reporting, management performs an impairment review to assess whether there are indications that goodwill might be impaired. This includes a review of declines in income, increase in loan impairment charges, decline in the market value of a ssets under management,
major restructurings, macroeconomic developments etc. Since the outbreak of the coronavirus pandemic, the assessment of whether indications of impairment exists has been considered at a more detailed level than usual. This assessment has been performed as a high level update of the 2020 test. Despite taking into account the expected economic impacts from the second wave of lockdowns to contain the coronavirus pandemic, which were initiated
late 2020 and continued in the first half of 2021, it was concluded that no indications of impairment at the end of June 2021 were noted. The goodwill in Danica Pension of DKK 1.6 billion (31 December 2020: DKK 1.6 billion) is sensitive to changes in solvency capital requirements, growth
in the terminal period and the discount rate. The remaining goodwill mainly consists of DKK 2.1 billion (31 December 2020: DKK 2.1 billion) in Markets, DKK 1.8 billion (31 December 2020: DKK
1.8 billion) in Asset Management and DKK 0.5 billion (31 December 2020: DKK 0.5 billion) in General Banking (all part of the business segment Large Corporates & Institutions) showed significant amounts of excess value in the impairment tests in 2020.
Note G19 of the Annual Report 2020 provides more information about impairment testing and sensitivity to changes in assumptions.
Measurement of liabilities under insurance contracts Liabilities under insurance contracts are measured at the present value of expected benefits for each insurance contract. The measurement is based on
actuarial computations that rely on estimates of a number of variables, including mortality and disability rates, and on the discount rate. The future mortality rates are based on the Danish FSA’s benchmark, while other variables are estimated based on data from the Group’s own portfolio of insurance contracts. Note G18 and the risk management notes of the Annual Report 2020 provide more information on the measurement of insurance liabilities
and sensitivity to changes in assumptions.
Danske Bank / Interim report – first half 2021 34/72
Notes – Danske Bank Group
G2. Changes in accounting policies, financial highlights and segment reporting
(a) Changes in accounting policies On 1 January 2021, the Group implemented the amendments to IFRS 9, IAS 39, IFRS 7, IFRS 4 and IFRS 16 (Interest Rate Benchmark Reform, phase 2) and IFRS 16 (Covid-19 Related Rent Concessions). The implementation of the amendments to IFRSs had no impact on the financial statements. The
Group has changed the presentation in the income statement of indirect fees earned when customers are granted, refinance or prepay Danish mortgage loans. Comparative information in the income statement has been restated to reflect the change in presentation. The sections below explain in further details the changes to accounting policies and presentation implemented.
Interest Rate Benchmark Reform – phase 2 (amendments to IFRS 9, IAS 39, IFRS 7, IFRS 4 and IFRS 16) The amendments cover the effects on the financial statements when old interest rate benchmarks are altered or replaced by alternative benchmark
rates as a result of the benchmark reform. The amendments introduce a practical expedient to account for a change to the basis for determination of the contractual cash flows at the date on which
interest rate benchmarks are altered or replaced. Under the practical expedient, a change to the determination of the contractual cash flows is applied prospectively by altering the effective interest rate, i.e. not leading to a modification gain or loss recognised in the income statement. To be applicable for the practical expedient, a change must meet two conditions: (a) the change is a direct consequence of the reform and (b) the new basis for determining
the contractual cash flows is economically equivalent to the previous basis. The amendments further introduce reliefs from existing hedge accounting requirements. The reliefs include that hedge accounting would not discontinue
solely due to the benchmark reform and that, for the retrospective effectiveness test for fair value hedges under IAS 39, the cumulative fair value changes of the hedged item and the hedging instrument may be reset to zero to minimise the risk that a hedge will fail the retrospect ive effectiveness test when the benchmark transitions to an alternative benchmark. The amendments further require that the hedging relationships and documentations are
amended to reflect changes in the hedged item, the hedging instrument and the hedged risk (which do not represent a discontin uation of the exiting hedge).
IFRS 7 introduces further disclosure requirements. The disclosures relate to how the transition to alternative rates is managed, the progress on the transition and the risks arising from financial assets and financial liabilities due to the reform. At the beginning of 2019, the Group formally established an IBOR Transition Programme, the main objectives being to identify how the IBOR transition will affect the Group financially and operationally and to
recommend the best implementation of the transition, mitigate risks, implement changes in contractual relationships etc. On 5 March 2021, ICE Bench-mark Administration (IBA), the administrator of LIBOR, announced its intention to cease publication of GBP, EUR, CHF, JPY, 1 week USD LIBOR and 2 month USD LIBOR immediately after 31 December 2021. The remaining USD LIBOR tenors will be published until 30 June 2023. EURIBOR, CIBOR,
STIBOR and NIBOR are expected to continue for the foreseeable future. Centrally cleared derivatives in the LIBORs which are discontinued will be transi-tioned in large scale before year end by the CCP. Many accounts and other non-contractual facilities have already been moved from affected LIBORs into alternative Risk Free Rates (RFR). The transition of our Loan and Derivatives exposure from LIBOR to alternative Risk Free Rates has started and will
scale up in Q3 into Q4 of this year. It is a top priority for the Group to conduct the transition in a timely and orderly manner that is transparent and fair to our customers.
The implementation is applied retrospectively without restatement of prior periods. The implementation of the amendments had no impact on sharehold-ers’ equity at 1 January 2021. Following the reliefs from the existing hedge accounting requirements, the Group expects that existing hedging relation-ships will continue to qualify for hedge accounting. The added disclosures on the transition to alternative rates will be included in Annual Report 2021.
Covid-19 Related Rent Concessions (amendments to IFRS 16)
The amendment introduces a practical expedient under which a lessee may elect not to assess whether a COVID-19-related rent concession meets the definition of a modification. Danske Bank Group has not been granted any concessions, and the amendment has no impact on the financial statements.
Change in the presentation of indirect fees earned on Danish mortgage loans
The Group’s Danish mortgage loans are granted through Realkredit Danmark and funded by issued listed mortgage bonds with matching terms, both
measured at fair value through profit or loss. When customers are granted, refinance or prepay such loans, the Group earns direct fees as well as indirect fees with the latter being charged as a discount or premium to the quoted price on the bonds funding the specific loan. In th e income statement, the indirect fees are now included within Fee income to align with the presentation of the direct fees. Previously, the indirect fees were included within Net
trading income or loss. The change in presentation has increased Fee income and decreased Net trading income or loss by DKK 327 million in the first half of 2021. Comparative information has been restated, leading to a reclassification to Fee income from Net trading income or loss of DKK 364 million in the first half of 2020 and DKK 590 million for full year 2020.
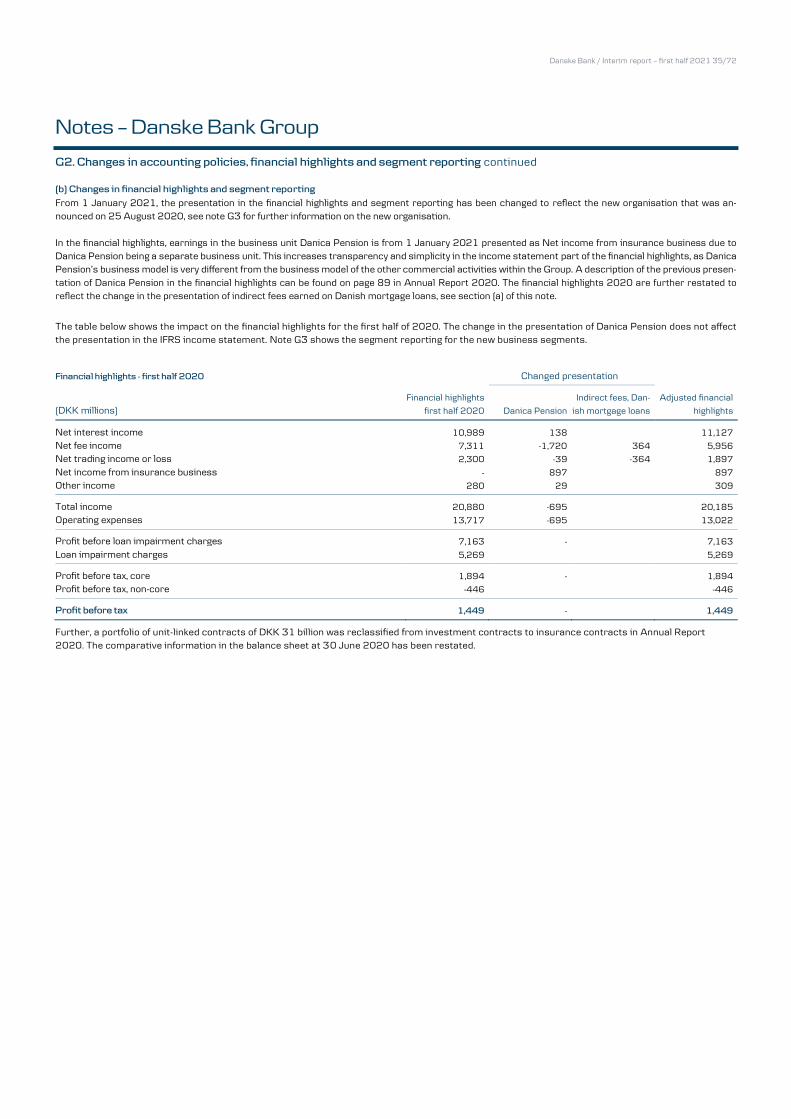
Danske Bank / Interim report – first half 2021 35/72
Notes – Danske Bank Group
G2. Changes in accounting policies, financial highlights and segment reporting continued
(b) Changes in financial highlights and segment reporting
From 1 January 2021, the presentation in the financial highlights and segment reporting has been changed to reflect the new organisation that was an-nounced on 25 August 2020, see note G3 for further information on the new organisation.
In the financial highlights, earnings in the business unit Danica Pension is from 1 January 2021 presented as Net income from insurance business due to Danica Pension being a separate business unit. This increases transparency and simplicity in the income statement part of the financial highlights, as Danica Pension’s business model is very different from the business model of the other commercial activities within the Group. A description of the previous presen-
tation of Danica Pension in the financial highlights can be found on page 89 in Annual Report 2020. The financial highlights 2020 are further restated to reflect the change in the presentation of indirect fees earned on Danish mortgage loans, see section (a) of this note.
The table below shows the impact on the financial highlights for the first half of 2020. The change in the presentation of Danica Pension does not affect the presentation in the IFRS income statement. Note G3 shows the segment reporting for the new business segments.
Financial highlights - first half 2020
Changed presentation
(DKK millions) Financial highlights
first half 2020 Danica Pension
Indirect fees, Dan-
ish mortgage loans
Adjusted financial
highlights
Net interest income 10,989 138 11,127
Net fee income 7,311 -1,720 364 5,956
Net trading income or loss 2,300 -39 -364 1,897
Net income from insurance business - 897 897
Other income 280 29 309
Total income 20,880 -695 20,185
Operating expenses 13,717 -695
13,022
Profit before loan impairment charges 7,163 - 7,163
Loan impairment charges 5,269 5,269
Profit before tax, core 1,894 - 1,894
Profit before tax, non-core -446 -446
Profit before tax 1,449 - 1,449
Further, a portfolio of unit-linked contracts of DKK 31 billion was reclassified from investment contracts to insurance contracts in Annual Report 2020. The comparative information in the balance sheet at 30 June 2020 has been restated.
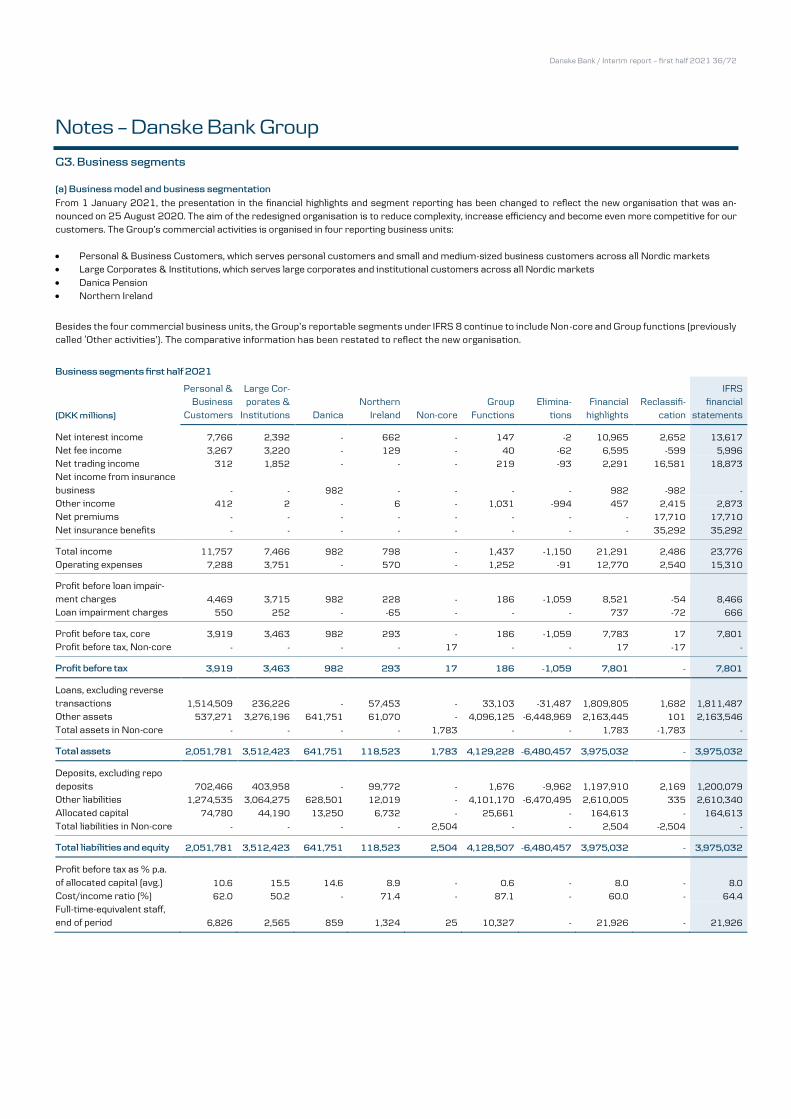
Danske Bank / Interim report – first half 2021 36/72
Notes – Danske Bank Group
G3. Business segments
(a) Business model and business segmentation
From 1 January 2021, the presentation in the financial highlights and segment reporting has been changed to reflect the new organisation that was an-nounced on 25 August 2020. The aim of the redesigned organisation is to reduce complexity, increase efficiency and become even more competitive for our customers. The Group’s commercial activities is organised in four reporting business units:
Personal & Business Customers, which serves personal customers and small and medium-sized business customers across all Nordic markets Large Corporates & Institutions, which serves large corporates and institutional customers across all Nordic markets
Danica Pension Northern Ireland
Besides the four commercial business units, the Group’s reportable segments under IFRS 8 continue to include Non-core and Group functions (previously called ‘Other activities’). The comparative information has been restated to reflect the new organisation.
Business segments first half 2021
(DKK millions)
Personal & Business
Customers
Large Cor-porates &
Institutions Danica Northern
Ireland Non-core Group
Functions Elimina-
tions Financial
highlights Reclassifi-
cation
IFRS financial
statements
Net interest income 7,766 2,392 - 662 - 147 -2 10,965 2,652 13,617
Net fee income 3,267 3,220 - 129 - 40 -62 6,595 -599 5,996
Net trading income 312 1,852 - - - 219 -93 2,291 16,581 18,873
Net income from insurance
business - - 982 - - - - 982 -982 -
Other income 412 2 - 6 - 1,031 -994 457 2,415 2,873
Net premiums - - - - - - - - 17,710 17,710
Net insurance benefits - - - - - - - - 35,292 35,292
Total income 11,757 7,466 982 798 - 1,437 -1,150 21,291 2,486 23,776
Operating expenses 7,288 3,751 - 570 - 1,252 -91 12,770 2,540 15,310
Profit before loan impair-ment charges 4,469 3,715 982 228 - 186 -1,059 8,521 -54 8,466
Loan impairment charges 550 252 - -65 - - - 737 -72 666
Profit before tax, core 3,919 3,463 982 293 - 186 -1,059 7,783 17 7,801
Profit before tax, Non-core - - - - 17 - - 17 -17 -
Profit before tax 3,919 3,463 982 293 17 186 -1,059 7,801 - 7,801
Loans, excluding reverse transactions 1,514,509 236,226 - 57,453 - 33,103 -31,487 1,809,805 1,682 1,811,487
Other assets 537,271 3,276,196 641,751 61,070 - 4,096,125 -6,448,969 2,163,445 101 2,163,546
Total assets in Non-core - - - - 1,783 - - 1,783 -1,783 -
Total assets 2,051,781 3,512,423 641,751 118,523 1,783 4,129,228 -6,480,457 3,975,032 - 3,975,032
Deposits, excluding repo deposits 702,466 403,958 - 99,772 - 1,676 -9,962 1,197,910 2,169 1,200,079
Other liabilities 1,274,535 3,064,275 628,501 12,019 - 4,101,170 -6,470,495 2,610,005 335 2,610,340
Allocated capital 74,780 44,190 13,250 6,732 - 25,661 - 164,613 - 164,613
Total liabilities in Non-core - - - - 2,504 - - 2,504 -2,504 -
Total liabilities and equity 2,051,781 3,512,423 641,751 118,523 2,504 4,128,507 -6,480,457 3,975,032 - 3,975,032
Profit before tax as % p.a. of allocated capital (avg.) 10.6 15.5 14.6 8.9 - 0.6 - 8.0 - 8.0
Cost/income ratio (%) 62.0 50.2 - 71.4 - 87.1 - 60.0 - 64.4
Full-time-equivalent staff, end of period 6,826 2,565 859 1,324 25 10,327 - 21,926 - 21,926
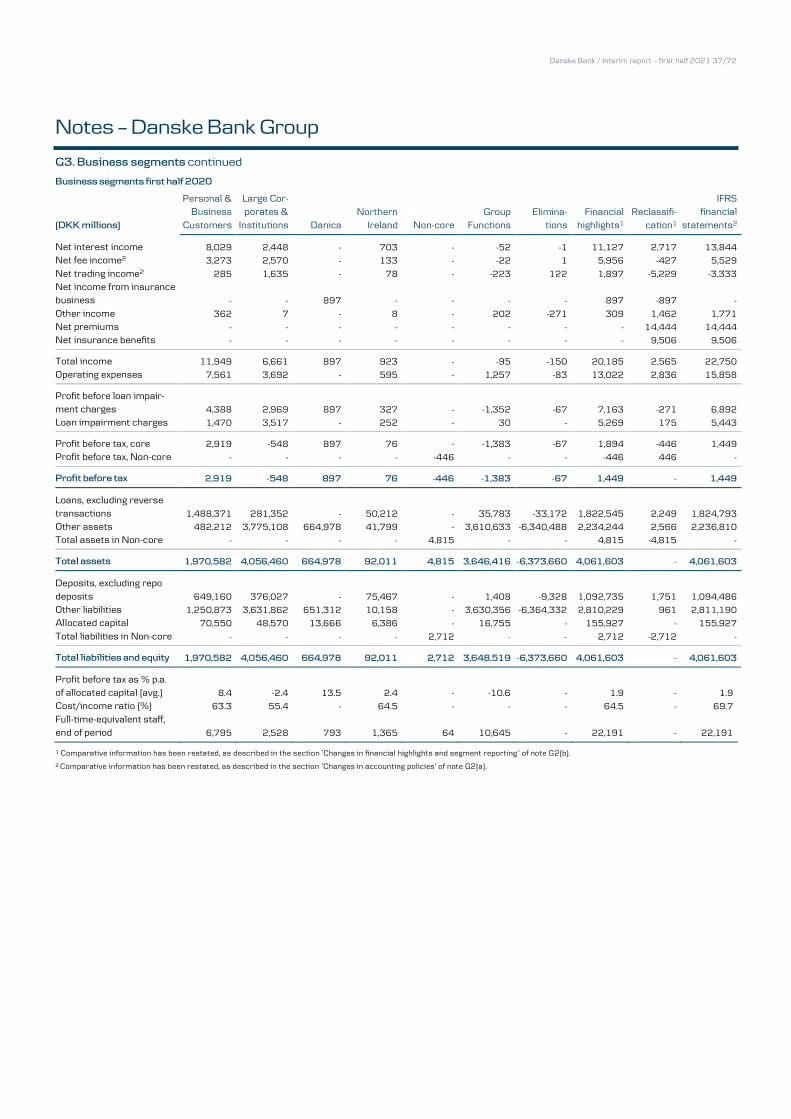
Danske Bank / Interim report – first half 2021 37/72
Notes – Danske Bank Group
G3. Business segments continued
Business segments first half 2020
(DKK millions)
Personal & Business
Customers
Large Cor-porates &
Institutions Danica Northern
Ireland Non-core Group
Functions Elimina-
tions Financial
highlights1 Reclassifi-
cation1
IFRS financial
statements2
Net interest income 8,029 2,448 - 703 - -52 -1 11,127 2,717 13,844
Net fee income2 3,273 2,570 - 133 - -22 1 5,956 -427 5,529
Net trading income2 285 1,635 - 78 - -223 122 1,897 -5,229 -3,333
Net income from insurance business - - 897 - - - - 897 -897 -
Other income 362 7 - 8 - 202 -271 309 1,462 1,771
Net premiums - - - - - - - - 14,444 14,444
Net insurance benefits - - - - - - - - 9,506 9,506
Total income 11,949 6,661 897 923 - -95 -150 20,185 2,565 22,750
Operating expenses 7,561 3,692 - 595 - 1,257 -83 13,022 2,836 15,858
Profit before loan impair-ment charges 4,388 2,969 897 327 - -1,352 -67 7,163 -271 6,892
Loan impairment charges 1,470 3,517 - 252 - 30 - 5,269 175 5,443
Profit before tax, core 2,919 -548 897 76 - -1,383 -67 1,894 -446 1,449
Profit before tax, Non-core - - - - -446 - - -446 446 -
Profit before tax 2,919 -548 897 76 -446 -1,383 -67 1,449 - 1,449
Loans, excluding reverse transactions 1,488,371 281,352 - 50,212 - 35,783 -33,172 1,822,545 2,249 1,824,793
Other assets 482,212 3,775,108 664,978 41,799 - 3,610,633 -6,340,488 2,234,244 2,566 2,236,810
Total assets in Non-core - - - - 4,815 - - 4,815 -4,815 -
Total assets 1,970,582 4,056,460 664,978 92,011 4,815 3,646,416 -6,373,660 4,061,603 - 4,061,603
Deposits, excluding repo deposits 649,160 376,027 - 75,467 - 1,408 -9,328 1,092,735 1,751 1,094,486
Other liabilities 1,250,873 3,631,862 651,312 10,158 - 3,630,356 -6,364,332 2,810,229 961 2,811,190
Allocated capital 70,550 48,570 13,666 6,386 - 16,755 - 155,927 - 155,927
Total liabilities in Non-core - - - - 2,712 - - 2,712 -2,712 -
Total liabilities and equity 1,970,582 4,056,460 664,978 92,011 2,712 3,648,519 -6,373,660 4,061,603 - 4,061,603
Profit before tax as % p.a. of allocated capital (avg.) 8.4 -2.4 13.5 2.4 - -10.6 - 1.9 - 1.9
Cost/income ratio (%) 63.3 55.4 - 64.5 - - - 64.5 - 69.7
Full-time-equivalent staff, end of period 6,795 2,528 793 1,365 64 10,645 - 22,191 - 22,191
1 Comparative information has been restated, as described in the section ‘Changes in financial highlights and segment reporting ’ of note G2(b).
2 Comparative information has been restated, as described in the section ‘Changes in accounting policies’ of note G2(a).
Danske Bank / Interim report – first half 2021 38/72
Notes – Danske Bank Group
G3. Business model and business segmentation continued (b) Reconciliation of the financial highlights and segment reporting to the IFRS financial statements
The ‘Reclassification’ column in the tables above shows the reconciliation between the presentation in the financial highlights and segment reporting and the presentation in the IFRS financial statements. The policies for the reclassifications between the financial highlights and the IFRS financial statements are disclosed on page 89 in Annual Report 2020, however, with the presentation of earnings from Danica Pension being changed from 1 January 2021,
see note G2(b) of this report for an explanation. The decomposition of the reclassification between the IFRS income statement and Financial highlights is shown in the tables below.
Reclassification first half 2021
(DKK millions)
IFRS financial statements
Operating leases and impairment
charges
Markets, Invest-ment Banking &
Securities and Group Treasury
Danica Pension Non-core
Total reclassification
Financial highlights
Net interest income 13,617 - -1,005 -1,637 -10 -2,652 10,965
Net fee income 5,996 - 45 555 -1 599 6,595
Net trading income 18,873 - 960 -17,541 - -16,581 2,291
Net income from insurance business - - - 982 - 982 982
Other income 2,873 -1,852 - -574 11 -2,415 457
Net premiums 17,710 - - -17,710 - -17,710 -
Net insurance benefits 35,292 - - -35,292 - -35,292 -
Total income 23,776 -1,852 - -634 - -2,486 21,291
Operating expenses 15,310 -1,852 - -634 -54 -2,540 12,770
Profit before loan impairment charges 8,466 - - - 54 54 8,521
Loan impairment charges 666 - - - 72 72 737
Profit before tax, core 7,801 - - - -17 -17 7,783
Profit before tax, Non-core - - - - 17 17 17
Profit before tax 7,801 - - - - - 7,801
Reclassification first half 2020
(DKK millions)
IFRS financial statements1
Operating leases and impairment
charges
Markets, Invest-ment Banking &
Securities and Group Treasury
Danica Pension2 Non-core
Total reclassification2
Financial highlights2
Net interest income 13,844 - -1,126 -1,562 -30 -2,717 11,127
Net fee income 5,529 - -18 448 -3 427 5,956
Net trading income -3,333 - 1,092 4,081 56 5,229 1,897
Net income from insurance business - - - 897 - 897 897
Other income 1,771 -2,042 51 447 83 -1,462 309
Net premiums 14,444 - - -14,444 - -14,444 -
Net insurance benefits 9,506 - - -9,506 - -9,506 -
Total income 22,750 -2,042 - -628 106 -2,565 20,185
Operating expenses 15,858 -2,042 - -628 -165 -2,836 13,022
Profit before loan impairment charges 6,892 - - - 271 271 7,163
Loan impairment charges 5,443 - - - -175 -175 5,269
Profit before tax, core 1,449 - - - 446 446 1,894
Profit before tax, Non-core - - - - -446 -446 -446
Profit before tax 1,449 - - - - - 1,449
1 Comparative information has been restated, as described in the section ‘Changes in accounting policies’ of note G2(a).
2 Comparative information has been restated, as described in the section ‘Changes in financial highlights and segment reporting ’ of note G2(b).
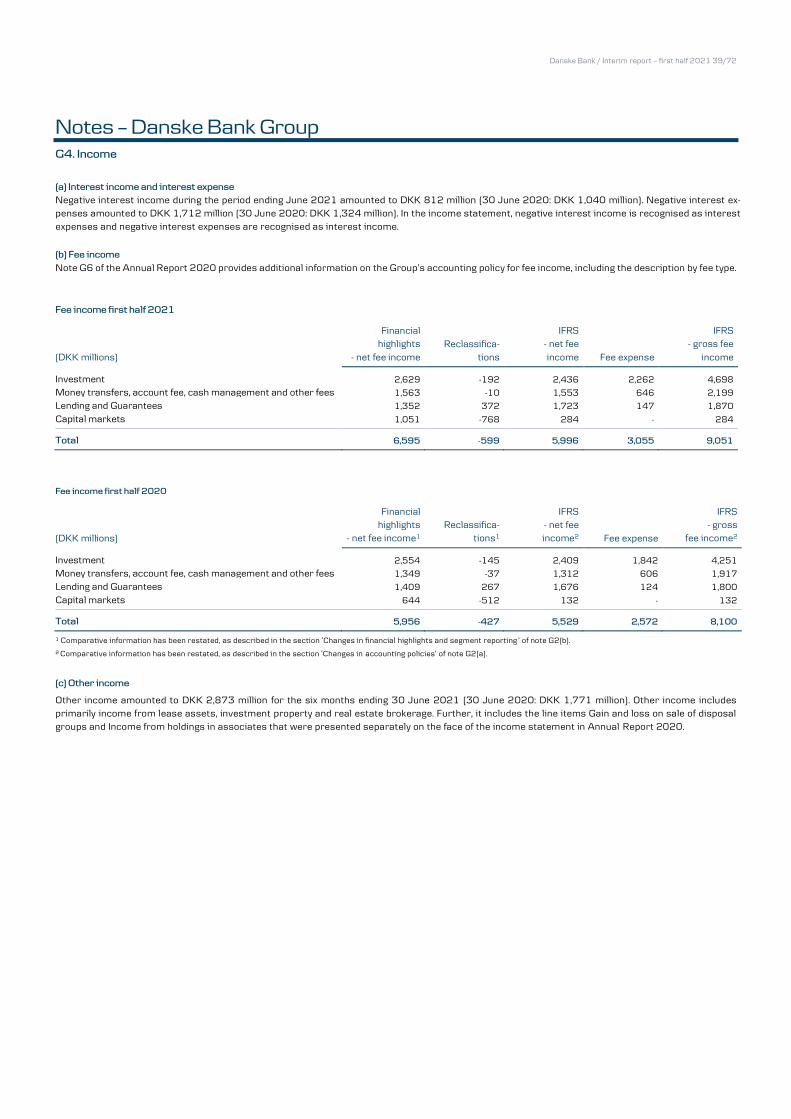
Danske Bank / Interim report – first half 2021 39/72
Notes – Danske Bank Group G4. Income
(a) Interest income and interest expense
Negative interest income during the period ending June 2021 amounted to DKK 812 million (30 June 2020: DKK 1,040 million). Negative interest ex-penses amounted to DKK 1,712 million (30 June 2020: DKK 1,324 million). In the income statement, negative interest income is recognised as interest expenses and negative interest expenses are recognised as interest income.
(b) Fee income
Note G6 of the Annual Report 2020 provides additional information on the Group’s accounting policy for fee income, including the description by fee type.
Fee income first half 2021
(DKK millions)
Financial highlights
- net fee income Reclassifica-
tions
IFRS - net fee
income Fee expense
IFRS - gross fee
income
Investment 2,629 -192 2,436 2,262 4,698
Money transfers, account fee, cash management and other fees 1,563 -10 1,553 646 2,199
Lending and Guarantees 1,352 372 1,723 147 1,870
Capital markets 1,051 -768 284 - 284
Total 6,595 -599 5,996 3,055 9,051
Fee income first half 2020
(DKK millions)
Financial highlights
- net fee income1 Reclassifica-
tions1
IFRS - net fee income2 Fee expense
IFRS - gross
fee income2
Investment 2,554 -145 2,409 1,842 4,251
Money transfers, account fee, cash management and other fees 1,349 -37 1,312 606 1,917
Lending and Guarantees 1,409 267 1,676 124 1,800
Capital markets 644 -512 132 - 132
Total 5,956 -427 5,529 2,572 8,100
1 Comparative information has been restated, as described in the section ‘Changes in financial highlights and segment reporting ’ of note G2(b).
2 Comparative information has been restated, as described in the section ‘Changes in accounting policies’ of note G2(a).
(c) Other income
Other income amounted to DKK 2,873 million for the six months ending 30 June 2021 (30 June 2020: DKK 1,771 million). Other income includes primarily income from lease assets, investment property and real estate brokerage. Further, it includes the line items Gain and loss on sale of disposal groups and Income from holdings in associates that were presented separately on the face of the income statement in Annual Report 2020.
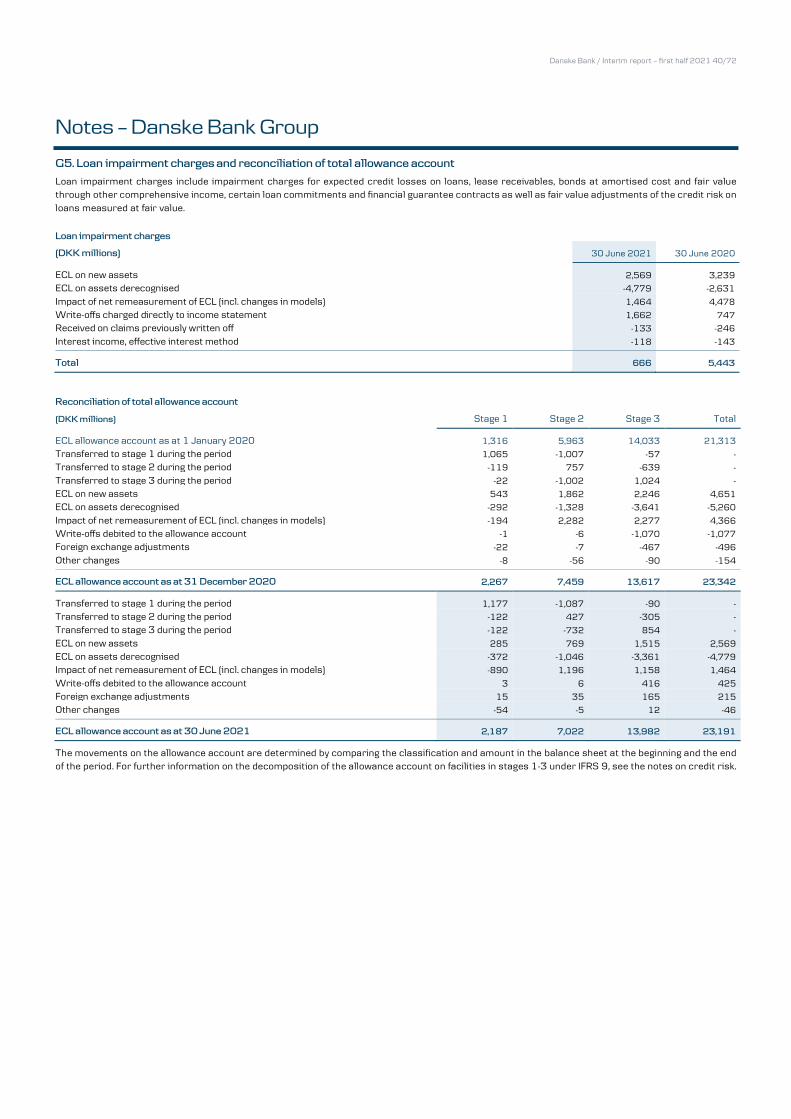
Danske Bank / Interim report – first half 2021 40/72
Notes – Danske Bank Group
G5. Loan impairment charges and reconciliation of total allowance account
Loan impairment charges include impairment charges for expected credit losses on loans, lease receivables, bonds at amortised cost and fair value through other comprehensive income, certain loan commitments and financial guarantee contracts as well as fair value adjustments of the credit risk on
loans measured at fair value.
Loan impairment charges
(DKK millions) 30 June 2021 30 June 2020
ECL on new assets 2,569 3,239
ECL on assets derecognised -4,779 -2,631
Impact of net remeasurement of ECL (incl. changes in models) 1,464 4,478
Write-offs charged directly to income statement 1,662 747
Received on claims previously written off -133 -246
Interest income, effective interest method -118 -143
Total 666 5,443
Reconciliation of total allowance account
(DKK millions) Stage 1 Stage 2 Stage 3 Total
ECL allowance account as at 1 January 2020 1,316 5,963 14,033 21,313
Transferred to stage 1 during the period 1,065 -1,007 -57 -
Transferred to stage 2 during the period -119 757 -639 -
Transferred to stage 3 during the period -22 -1,002 1,024 -
ECL on new assets 543 1,862 2,246 4,651
ECL on assets derecognised -292 -1,328 -3,641 -5,260
Impact of net remeasurement of ECL (incl. changes in models) -194 2,282 2,277 4,366
Write-offs debited to the allowance account -1 -6 -1,070 -1,077
Foreign exchange adjustments -22 -7 -467 -496
Other changes -8 -56 -90 -154
ECL allowance account as at 31 December 2020 2,267 7,459 13,617 23,342
Transferred to stage 1 during the period 1,177 -1,087 -90 -
Transferred to stage 2 during the period -122 427 -305 -
Transferred to stage 3 during the period -122 -732 854 -
ECL on new assets 285 769 1,515 2,569
ECL on assets derecognised -372 -1,046 -3,361 -4,779
Impact of net remeasurement of ECL (incl. changes in models) -890 1,196 1,158 1,464
Write-offs debited to the allowance account 3 6 416 425
Foreign exchange adjustments 15 35 165 215
Other changes -54 -5 12 -46
ECL allowance account as at 30 June 2021 2,187 7,022 13,982 23,191
The movements on the allowance account are determined by comparing the classification and amount in the balance sheet at the beginning and the end of the period. For further information on the decomposition of the allowance account on facilities in stages 1-3 under IFRS 9, see the notes on credit risk.
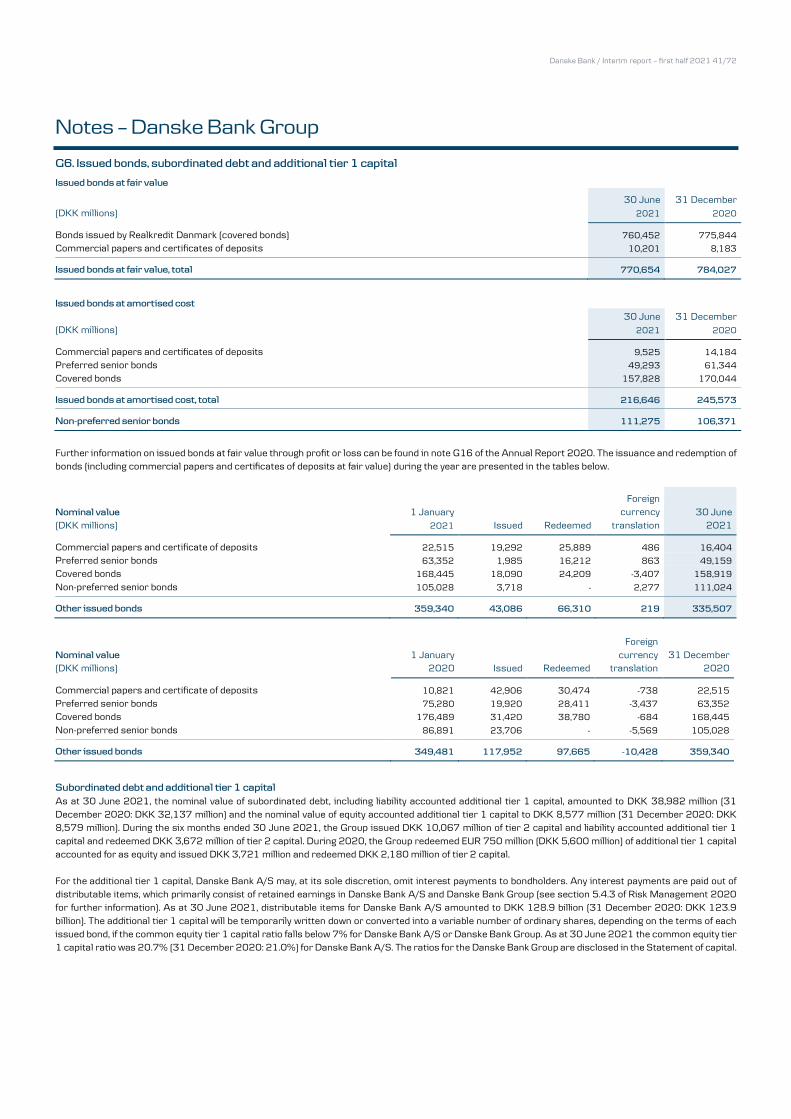
Danske Bank / Interim report – first half 2021 41/72
Notes – Danske Bank Group
G6. Issued bonds, subordinated debt and additional tier 1 capital
Issued bonds at fair value 30 June 31 December
(DKK millions) 2021 2020
Bonds issued by Realkredit Danmark (covered bonds) 760,452 775,844
Commercial papers and certificates of deposits 10,201 8,183
Issued bonds at fair value, total 770,654 784,027
Issued bonds at amortised cost 30 June 31 December
(DKK millions) 2021 2020
Commercial papers and certificates of deposits 9,525 14,184
Preferred senior bonds 49,293 61,344
Covered bonds 157,828 170,044
Issued bonds at amortised cost, total 216,646 245,573
Non-preferred senior bonds 111,275 106,371
Further information on issued bonds at fair value through profit or loss can be found in note G16 of the Annual Report 2020. The issuance and redemption of bonds (including commercial papers and certificates of deposits at fair value) during the year are presented in the tables below.
Nominal value 1 January
Foreign currency 30 June
(DKK millions) 2021 Issued Redeemed translation 2021
Commercial papers and certificate of deposits 22,515 19,292 25,889 486 16,404
Preferred senior bonds 63,352 1,985 16,212 863 49,159
Covered bonds 168,445 18,090 24,209 -3,407 158,919
Non-preferred senior bonds 105,028 3,718 - 2,277 111,024
Other issued bonds 359,340 43,086 66,310 219 335,507
Nominal value 1 January
Foreign currency 31 December
(DKK millions) 2020 Issued Redeemed translation 2020
Commercial papers and certificate of deposits 10,821 42,906 30,474 -738 22,515
Preferred senior bonds 75,280 19,920 28,411 -3,437 63,352
Covered bonds 176,489 31,420 38,780 -684 168,445
Non-preferred senior bonds 86,891 23,706 - -5,569 105,028
Other issued bonds 349,481 117,952 97,665 -10,428 359,340
Subordinated debt and additional tier 1 capital
As at 30 June 2021, the nominal value of subordinated debt, including liability accounted additional tier 1 capital, amounted to DKK 38,982 million (31 December 2020: DKK 32,137 million) and the nominal value of equity accounted additional tier 1 capital to DKK 8,577 million (31 December 2020: DKK 8,579 million). During the six months ended 30 June 2021, the Group issued DKK 10,067 million of tier 2 capital and liability accounted additional tier 1
capital and redeemed DKK 3,672 million of tier 2 capital. During 2020, the Group redeemed EUR 750 million (DKK 5,600 million) of additional tier 1 capital accounted for as equity and issued DKK 3,721 million and redeemed DKK 2,180 million of tier 2 capital.
For the additional tier 1 capital, Danske Bank A/S may, at its sole discretion, omit interest payments to bondholders. Any interest payments are paid out of distributable items, which primarily consist of retained earnings in Danske Bank A/S and Danske Bank Group (see section 5.4.3 of Risk Management 2020 for further information). As at 30 June 2021, distributable items for Danske Bank A/S amounted to DKK 128.9 billion (31 December 2020: DKK 123.9
billion). The additional tier 1 capital will be temporarily written down or converted into a variable number of ordinary shares, depending on the terms of each issued bond, if the common equity tier 1 capital ratio falls below 7% for Danske Bank A/S or Danske Bank Group. As at 30 June 2021 the common equity tier 1 capital ratio was 20.7% (31 December 2020: 21.0%) for Danske Bank A/S. The ratios for the Danske Bank Group are disclosed in the Statement of capital.
Danske Bank / Interim report – first half 2021 42/72
Notes – Danske Bank Group
G7. Other assets and Other liabilities
Other assets amounted to DKK 33,907 million (31 December 2020: DKK 36,964 million), including accrued interest and commission due of DKK 3,531 million (31 December 2020: DKK 3,607 million), holdings in associates of DKK 199 million (31 December 2020: DKK 209 million), investment property of
DKK 2,397 million (31 December 2020: DKK 2,256 million), tangible assets of DKK 8,666 million (31 December 2020: DKK 8,547 million) and right-of-use lease assets of DKK 4,326 million (31 December 2020: DKK 4,819 million), consisting of domicile property of DKK 3,498 million (31 December 2020: DKK 3,938 million) and other tangible assets of DKK 828 million (31 December 2020: DKK 881 million). Further, it includes assets held for sale as defined in IFRS
5 consisting of loans held for sale of DKK 0 million (31 December 2020: DKK 416 million) and other assets held for sale of DKK 252 million (31 December 2020: DKK 293 million).
Other liabilities amounted to DKK 46,187 million (31 December 2020: DKK 51,291 million), including accrued interest and commissions due of DKK 4,425 million (31 December 2020: DKK 6,676 million), lease liabilities of DKK 4,292 million (31 December 2020: 4,761 million), other staff commitments of DKK 1,878 million (31 December 2020: DKK 3,022 million). Further, other liabilities include provisions for customer remediation of DKK 727 million (31 Decem-
ber 2020: DKK 804 million), provisions for restructuring costs of DKK 516 million (31 December 2020: DKK 830 million) and the provision of DKK 1.5 billion (31 December 2020: DKK 1.5 billion) for the donation of the estimated gross income from the non-resident portfolio at the Estonian branch. Any confiscated or disgorged gross income will be deducted from the donation.
G8. Foreign currency translation reserve
The Group has granted loans to its branches in Sweden, Norway and Finland in the currency of the foreign unit for a total of DKK 35,591 million (31 December 2020: DKK 34,612 million). The loans are part of the net investment in those units and the foreign currency gains/losses on these loans are recognised in Other comprehensive income. The funding of the loans is partly done in DKK in order to create a so-called structural FX hedge position in accordance with
banking regulations, i.e. to reduce the impact on capital ratios resulting from changes in the risk exposure amount due to changes in currency rates. With effect from 1 January 2021, the Group’s net investment in its subsidiaries Danske Hypotek AB (Sweden) and Danske Mortgage Bank Plc (Finland) has been included in the structural FX hedge position to extend the hedge to the risk exposure amount measured by currency for EUR, NOK and SEK across the entire
Group balance sheet, although with constraints to the size of the loans to the foreign branches and the net investments in the foreign subsidiaries. This strategy of partly hedging the sensitivity to capital ratios from volatility in foreign currency rates, increases the volatility in Other comprehensive income and the Foreign currency translation reserve in equity under IFRS since it decreases the hedge of the currency risk on the net investments in those units. As at
30 June 2021, the structural FX hedge position totalled DKK 39,748 million (31 December 2020: DKK 31,625 million) and a gain of DKK 324 million has been recognised in Other comprehensive income during the first half of 2021, primarily due to appreciation of NOK against DKK throughout the first half of 2021. During the first half of 2020, a loss of DKK 1,198 million related to the structural FX hedge position was recognised in Other comprehensive income
due to a significant weakening of NOK against DKK throughout the first half of 2020.
Danske Bank / Interim report – first half 2021 43/72
Notes – Danske Bank Group
G9. Guarantees, commitments and contingent liabilities
Contingent liabilities consist of possible liabilities arising from past events. The existence of such liabilities will be confirmed only by the occurrence or non-occurrence of one or more uncertain future events not wholly within the Group’s control. Contingent liabilities that can, but are not likely to, result in an outflow of economic resources are disclosed.
The Group uses a variety of loan related financial instruments to meet customers’ financial requirements. Instruments include loan offers and other credit facilities, guarantees and instruments not recognised in the balance sheet. If an instrument is likely to result in a payment obligation, a liability is
recognised under Other liabilities corresponding to the present value of expected payments.
(a) Guarantees 30 June 31 December (DKK millions) 2021 2020
Financial guarantees 5,963 6,708
Other guarantees 73,789 65,108
Total 79,753 71,816
(b) Commitments 30 June 31 December (DKK millions) 2021 2020
Loan commitments shorter than 1 year 269,985 276,413
Loan commitments longer than 1 year 195,961 198,830
Other unutilised commitments 17,765 18,995
Total 483,711 494,239
In addition to credit exposure from lending activities, loan offers made and uncommitted lines of credit granted by the Group amounted to DKK 253 billion
(31 December 2020: DKK 242 billion). These items are included in the calculation of the total risk exposure amount in accordance with the CRR.
(c) Regulatory and legal proceedings
Estonia matter
Danske Bank remains in dialogue with various authorities regarding the terminated non-resident portfolio at the Bank’s Estonian branch. This includes crimi-nal and regulatory investigations by authorities in Estonia, Denmark, France and the United States. The Bank continues to cooperate with all authorities.
In 2018, the Estonian Office of the Prosecutor General opened a criminal investigation into former employees of the Estonian branch. In November 2018, Danske Bank was preliminary charged by the Danish State Prosecutor for Serious Economic and International Crime (“SØIK”) with vio-
lating the Danish AML Act on four counts all relating to the Estonian branch in the period from 1 February 2007 to the end of January 2016. In October 2020, SØIK added violation of the Danish Financial Business Act for governance and control failures in the period from 1 February 2007 to the end of 2017 to the preliminary charges.
In February 2019, Danske Bank was placed under formal investigation by an investigating judge of the Tribunal de Grande Instance de Paris in the context of an on-going French criminal investigation and on the grounds of money laundering suspicions relating to certain transactions in the terminated portfolio of
non-resident customers of the Bank’s Estonian branch, amounting to around DKK 160 million and performed between 2007 and 2014. The Bank has posted bail in the amount of DKK 80 million.
In December 2020, Danske Bank was informed by the U.S. Department of Treasury’s Office of Foreign Assets Control (“OFAC”) that it had decided to close its investigation of Danske Bank in relation to the Estonia case with no action. OFAC is the U.S. authority responsible for civil enforcement of U.S. sanctions. The decision does not preclude OFAC from taking future enforcement action should new or additional information warrant renewed attention.
The Bank is reporting to, responding to and cooperating with various authorities, including SØIK, the U.S. Department of Justice (DOJ) and the U.S. Securities and Exchange Commission (SEC), relating to the Bank’s Estonian branch. The internal investigation work planned by the Bank was completed and the findings
were reported to relevant authorities in 2020. The Bank continues to fully cooperate and will provide the authorities with further information if and when requested. The overall timing of the authorities’ investigations remains unknown and is not within the Bank’s control. It is not yet possible to reliably estimate the timing, form of resolution, or amount of potential settlement or fines, which could be material.
Based on orders from the Danish FSA, Danske Bank’s solvency need has been increased in 2018 by a Pillar II add-on of in total DKK 10 billion to ensure adequate capital coverage of the increased compliance and reputational risks in relation to the Estonian AML matter.
On 9 January 2019, an action was filed in the United States District Court for the Southern District of New York by an alleged holder of Danske Bank’s American Depositary Receipts, representing its ordinary shares, against the Bank and certain of its officers and former officers and/or directors. The
complaint alleges that the defendants violated Section 10(b) and Section 20(a) of the Securities Exchange Act of 1934 by, among other things, making false and misleading statements and/or failing to disclose adverse information regarding the Bank’s business and operations in relation to AML matters relating to the Bank’s Estonian branch and related matters.
Danske Bank / Interim report – first half 2021 44/72
Notes – Danske Bank Group
G9. Guarantees, commitments and contingent liabilities continued
The complaint seeks unspecified damages on behalf of a putative class of purchasers of the Bank’s American Depositary Receipts between 9 January
2014 and 29 April 2019. On 24 August 2020, the Court granted the motion and dismissed all claims against the Bank on three independent grounds. On 23 September 2020, the plaintiffs filed an appeal of this ruling to the Second Circuit. The Bank has opposed that appeal, and a decision is expected in the second half of 2021.The Bank intends to defend itself against these claims. The timing of the completion of the lawsuit and the outcome are uncertain.
On 3 March 2019, a court case was initiated against Danske Bank and Thomas F. Borgen for approval of a class action led by a newly formed association with the aim to represent former and current shareholders in a liability action relating to the Estonian AML matter. On 21 January 2021, the court
dismissed the case because it did not fulfil the criteria for being approved as a class action. The association has appealed this decision. The appeal will not be decided until Q3 2021 at the earliest. In March 2019, October 2019, January 2020, March 2020, September 2020, and February 2021 a total of 320 separate cases were initiated and are still ongoing against the Bank with a total claim amount of approximately DKK 7.9 billion. On 27 December
2019 and 4 September 2020, two separate claims were filed by 93 investors against the Bank with a total claim amount of approximately DKK 1.7 billion. On 2 September 2020, 20 separate claims were filed by 20 investors against the Bank with a total claim amount of approximately DKK 1.1 billion. On 18 September 2020, a separate claim was filed by 201 investors against the Bank with a total claim amount of approximately DKK 2.1 billion. On 18
September 2020, one case was filed against the Bank and Thomas F. Borgen by two investors with a total claim amount of DKK 10 million. These court actions relate to alleged violations in the Bank’s branch in Estonia of the rules on prevention of money laundering and /or alleged failure to timely inform the market of such violations (and in one claim, also market manipulation). Of the 320 cases filed in the period from March 2019 to February 2021, 200
have been referred to the Eastern High Court. On 29 June 2021, the Supreme Court denied the Bank’s request for referral of the remaining cases, which are now stayed before the Copenhagen City Court. The Bank is defending itself against these claims. The timing of completion of any such lawsuits (pend-ing or threatening) and their outcome are uncertain.
On 20 February 2020 and 12 March 2021, two cases were initiated against Thomas F. Borgen by 76 institutional investors, and funded by the litigation funder Deminor Recovery Services. The total claim amount is approximately DKK 3.2 billion. Danske Bank has received procedural notifications in respect
of both cases. Under Danish law, the purpose of a procedural notification is to make a formal reservation of rights to bring a potential claim against the notified party in the future. The main hearing is scheduled to be held in September 2021.
Other
Owing to its business volume, Danske Bank is continually a party to various other lawsuits and disputes and has an ongoing dialogue with public authori-ties, such as the Danish FSA and the Danish Tax Agency on other matters. In general, Danske Bank does not expect the outcomes of any of these other
pending lawsuits and disputes or its dialogue with public authorities to have any material effect on its financial position. Provisions for litigations are included in Other liabilities, see note G7.
(d) Further explanation
A limited number of employees are employed under terms which, if they are dismissed before reaching their normal retirement a ge, grant them a sever-
ance and/or pension payment in excess of their entitlement under ordinary terms of employment. As the sponsoring employer, the Group is also liable for the pension obligations of a number of company pension funds.
The Group participates in the Danish Guarantee Fund and the Danish Resolution Fund. The funds’ capital must amount to at least 0.8% and 1%, respec-
tively, of the covered deposits of all Danish credit institutions by 31 December 2024. The Danish Guarantee Fund is currently fully funded, but if the fund subsequently does not have sufficient means to make the required payments, extraordinary contributions of up to 0.5% of the individual institution’s covered deposits may be required. Extraordinary contributions above this percentage require the consent of the Danish FSA. The first contribution to the
Danish Resolution Fund was made in December 2015. Danske Bank A/S and Realkredit Danmark A/S make contributions to the Resolution Fund on the basis of their size and risk relative to other credit institutions in Denmark. The contribution to the Danish Resolution Fund is recognised as operating expenses.
If the Resolution Fund does not have sufficient means to make the required payments, extraordinary contributions of up to three times the latest annual contributions may be required. In addition, Danish banks participate in the Danish Restructuring Fund, which reimburses creditors if the final dividend is
lower than the interim dividend in respect of banks that were in distress before 1 June 2015. Similarly, Danish banks have made payment commitments (totalling DKK 1 billion) to cover losses incurred by the Danish Restructuring Fund for the withdrawal of distressed banks from data centres etc. Payments to the Danish Restructuring Fund are calculated on the basis of the individual credit institution’s share of covered deposits relative to other credit insti-
tutions in Denmark. However, each institution’s contribution to the Danish Restructuring Fund may not exceed 0.2% of its covered deposits.
The Group is a member of deposit guarantee schemes and other compensation schemes in Norway, the UK and Luxembourg. As in Denmark, the contri-butions to the schemes in these countries are annual contributions combined with extraordinary contributions if the means of the schemes are not
sufficient to cover the required payments. Danske Bank A/S is taxed jointly with all Danish entities of Danske Bank Group and is jointly and severally liable with these for payment of Danish corpo-
ration tax and withholding tax, etc. Danske Bank A/S is registered jointly with all significant Danish entities of Danske Bank Group for financial services employer tax and VAT, for which
Danske Bank A/S and the entities are jointly and severally liable.
Danske Bank / Interim report – first half 2021 45/72
Notes – Danske Bank Group
G10. Assets provided or received as collateral
As at 30 June 2021, the Group had deposited securities (including bonds issued by the Group) worth DKK 32.8 billion as collateral with Danish and
international clearing centres and other institutions (31 December 2020: DKK 36.7 billion). As at 30 June 2021, the Group had provided cash and securities (including bonds issued by the Group) worth DKK 68.9 billion as collateral for derivatives
transactions (31 December 2020: DKK 104.0 billion). As at 30 June 2021, the Group had registered assets (including bonds and shares issued by the Group) under insurance contracts and unit-linked
investment contracts worth DKK 487.9 billion (31 December 2020: DKK 473.5 billion) as collateral for policyholders’ savings of DKK 472.4 billion (31 December 2020: DKK 458.1 billion).
As at 30 June 2021, the Group had registered loans at fair value and securities (including bonds issued by the Group) worth a total of DKK 813.1 billion (31 December 2020: DKK 827.1 billion) as collateral for bonds issued by Realkredit Danmark. Similarly, the Group had registered loans and other assets worth DKK 324.6 billion (31 December 2020: DKK 326.5 billion) as collateral for covered bonds issued under Danish, Finnish and Swedish law.
The table below shows assets provided as collateral for liabilities or contingent liabilities. Assets provided as collateral under repo transactions are shown separately whereas the types explained above are included in the column ‘Other’.
30 June 2021 31 December 2020
(DKK millions) Repo Other Total Repo Other Total
Due from credit institutions - 26,112 26,112 - 28,886 28,886
Trading and investment securities 273,675 70,899 344,574 237,453 80,062 317,515
Loans at fair value - 802,966 802,966 - 816,284 816,284
Loans at amortised cost - 333,750 333,750 - 360,511 360,511
Assets under insurance contracts and unit-
linked investment contracts - 408,868 408,868 - 370,176 370,176
Other assets - 43 43 - 52 52
Total 273,675 1,642,637 1,916,312 237,453 1,655,971 1,893,424
Own issued bonds 26,509 83,533 110,042 19,556 93,992 113,548
Total, including own issued bonds 300,184 1,726,170 2,026,354 257,009 1,749,963 2,006,972
Securities provided as collateral under agreements that entitle the counterparty to sell the securities or provide them as collateral for other loans amounted to DKK 273.7 billion as at 30 June 2021 (31 December 2020: DKK 237.5 billion).
As at 30 June 2021, the Group had received securities worth DKK 274.2 billion (31 December 2020: DKK 309.8 billion) as collateral for reverse repo transactions, securities lending, derivatives transactions and other transactions entered into on the standard terms for such transactions. As the party
receiving the collateral, the Group is entitled in most cases to sell the securities or provide the securities as collateral for other loans in exchange for returning similar securities to the counterparty at the expiry of the transactions. As at 30 June 2021, the Group had sold securities or provided securities as collateral worth DKK 131.3 billion (31 December 2020: DKK 132.3 billion).
The Group also receives many other types of assets as collateral in connection with its ordinary lending activities. The Group has not received the own-ership of these assets. The risk management notes of the Annual Report 2020 provide more details on assets received as collateral in connection with ordinary lending activities.
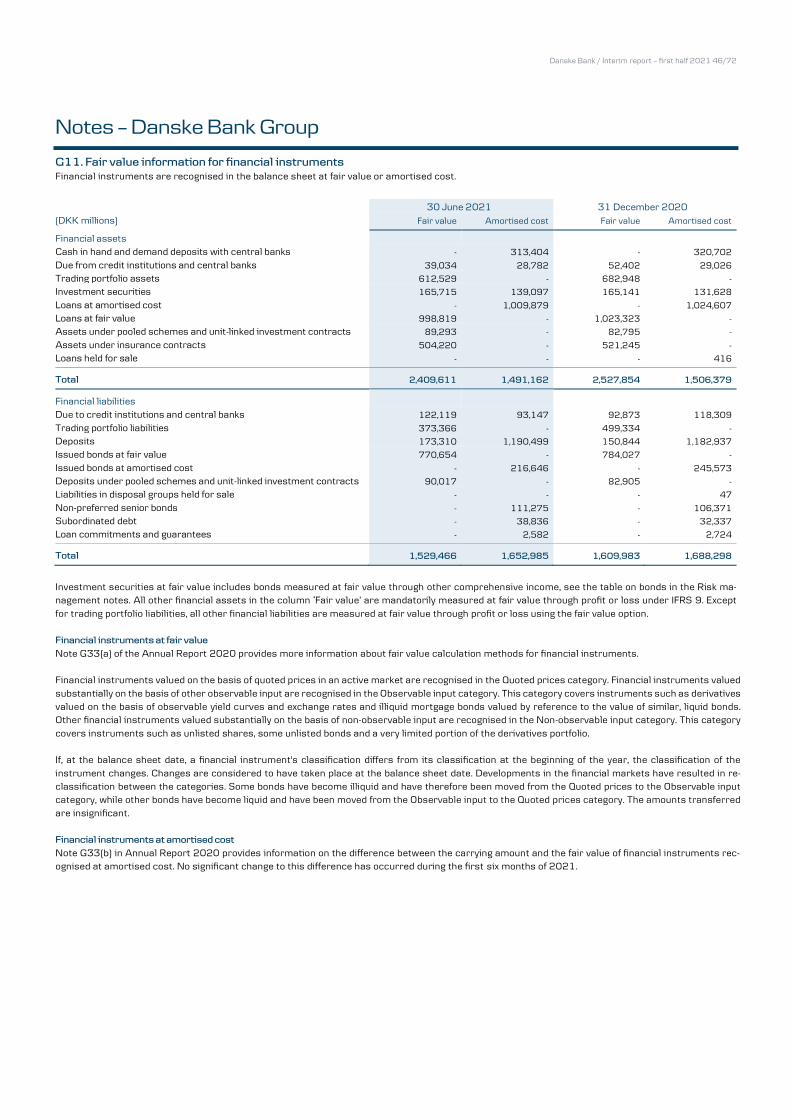
Danske Bank / Interim report – first half 2021 46/72
Notes – Danske Bank Group
G11. Fair value information for financial instruments
Financial instruments are recognised in the balance sheet at fair value or amortised cost.
30 June 2021 31 December 2020
(DKK millions) Fair value Amortised cost Fair value Amortised cost
Financial assets Cash in hand and demand deposits with central banks - 313,404 - 320,702
Due from credit institutions and central banks 39,034 28,782 52,402 29,026
Trading portfolio assets 612,529 - 682,948 -
Investment securities 165,715 139,097 165,141 131,628
Loans at amortised cost - 1,009,879 - 1,024,607
Loans at fair value 998,819 - 1,023,323 -
Assets under pooled schemes and unit-linked investment contracts 89,293 - 82,795 -
Assets under insurance contracts 504,220 - 521,245 -
Loans held for sale - - - 416
Total 2,409,611 1,491,162 2,527,854 1,506,379
Financial liabilities Due to credit institutions and central banks 122,119 93,147 92,873 118,309
Trading portfolio liabilities 373,366 - 499,334 -
Deposits 173,310 1,190,499 150,844 1,182,937
Issued bonds at fair value 770,654 - 784,027 -
Issued bonds at amortised cost - 216,646 - 245,573
Deposits under pooled schemes and unit-linked investment contracts 90,017 - 82,905 -
Liabilities in disposal groups held for sale - - - 47
Non-preferred senior bonds - 111,275 - 106,371
Subordinated debt - 38,836 - 32,337
Loan commitments and guarantees - 2,582 - 2,724
Total 1,529,466 1,652,985 1,609,983 1,688,298
Investment securities at fair value includes bonds measured at fair value through other comprehensive income, see the table on bonds in the Risk ma-nagement notes. All other financial assets in the column ‘Fair value’ are mandatorily measured at fair value through profit or loss under IFRS 9. Except
for trading portfolio liabilities, all other financial liabilities are measured at fair value through profit or loss using the fair value option. Financial instruments at fair value
Note G33(a) of the Annual Report 2020 provides more information about fair value calculation methods for financial instruments. Financial instruments valued on the basis of quoted prices in an active market are recognised in the Quoted prices category. Financial instruments valued
substantially on the basis of other observable input are recognised in the Observable input category. This category covers instruments such as derivatives valued on the basis of observable yield curves and exchange rates and illiquid mortgage bonds valued by reference to the value of similar, liquid bonds. Other financial instruments valued substantially on the basis of non-observable input are recognised in the Non-observable input category. This category
covers instruments such as unlisted shares, some unlisted bonds and a very limited portion of the derivatives portfolio. If, at the balance sheet date, a financial instrument's classification differs from its classification at the beginning of the year, the classification of the
instrument changes. Changes are considered to have taken place at the balance sheet date. Developments in the financial markets have resulted in re-classification between the categories. Some bonds have become illiquid and have therefore been moved from the Quoted prices to the Observable input category, while other bonds have become liquid and have been moved from the Observable input to the Quoted prices category. The amounts transferred
are insignificant. Financial instruments at amortised cost
Note G33(b) in Annual Report 2020 provides information on the difference between the carrying amount and the fair value of financial instruments rec-ognised at amortised cost. No significant change to this difference has occurred during the first six months of 2021.
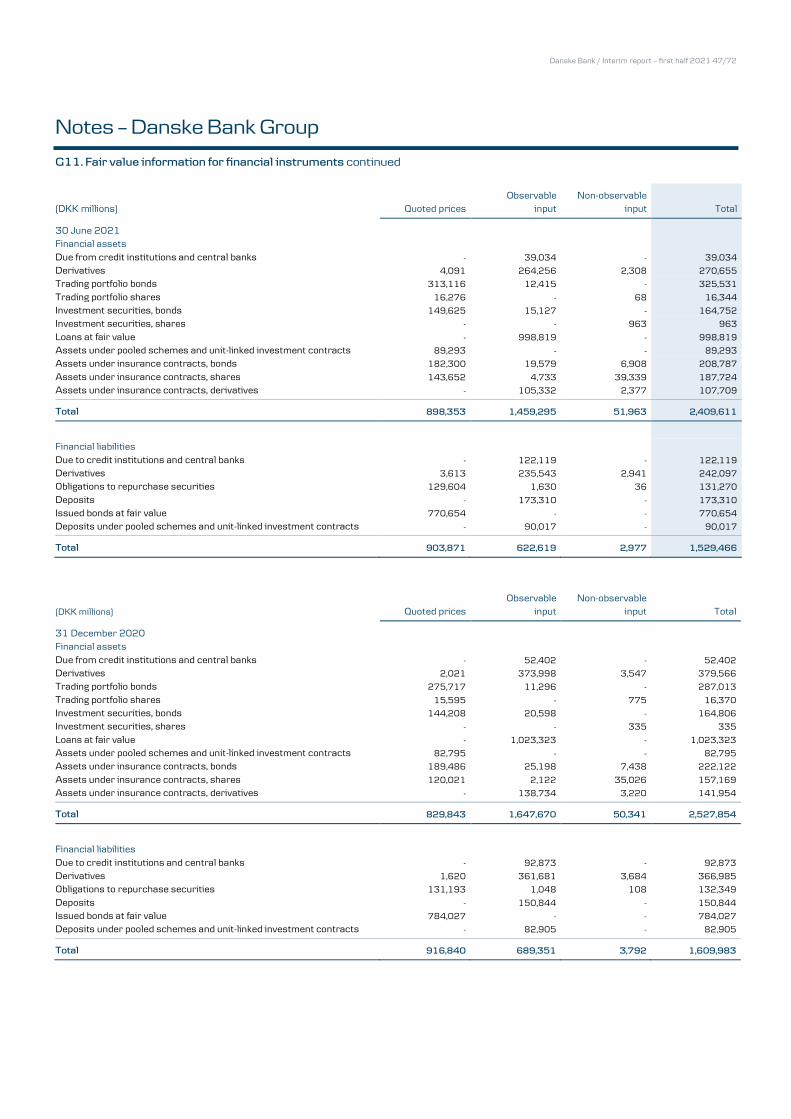
Danske Bank / Interim report – first half 2021 47/72
Notes – Danske Bank Group
G11. Fair value information for financial instruments continued
(DKK millions) Quoted prices Observable
input Non-observable
input Total
30 June 2021
Financial assets Due from credit institutions and central banks - 39,034 - 39,034
Derivatives 4,091 264,256 2,308 270,655
Trading portfolio bonds 313,116 12,415 - 325,531
Trading portfolio shares 16,276 - 68 16,344
Investment securities, bonds 149,625 15,127 - 164,752
Investment securities, shares - - 963 963
Loans at fair value - 998,819 - 998,819
Assets under pooled schemes and unit-linked investment contracts 89,293 - - 89,293
Assets under insurance contracts, bonds 182,300 19,579 6,908 208,787
Assets under insurance contracts, shares 143,652 4,733 39,339 187,724
Assets under insurance contracts, derivatives - 105,332 2,377 107,709
Total 898,353 1,459,295 51,963 2,409,611
Financial liabilities Due to credit institutions and central banks - 122,119 - 122,119
Derivatives 3,613 235,543 2,941 242,097
Obligations to repurchase securities 129,604 1,630 36 131,270
Deposits - 173,310 - 173,310
Issued bonds at fair value 770,654 - - 770,654
Deposits under pooled schemes and unit-linked investment contracts - 90,017 - 90,017
Total 903,871 622,619 2,977 1,529,466
(DKK millions) Quoted prices Observable
input Non-observable
input Total
31 December 2020
Financial assets Due from credit institutions and central banks - 52,402 - 52,402
Derivatives 2,021 373,998 3,547 379,566
Trading portfolio bonds 275,717 11,296 - 287,013
Trading portfolio shares 15,595 - 775 16,370
Investment securities, bonds 144,208 20,598 - 164,806
Investment securities, shares - - 335 335
Loans at fair value - 1,023,323 - 1,023,323
Assets under pooled schemes and unit-linked investment contracts 82,795 - - 82,795
Assets under insurance contracts, bonds 189,486 25,198 7,438 222,122
Assets under insurance contracts, shares 120,021 2,122 35,026 157,169
Assets under insurance contracts, derivatives - 138,734 3,220 141,954
Total 829,843 1,647,670 50,341 2,527,854
Financial liabilities
Due to credit institutions and central banks - 92,873 - 92,873
Derivatives 1,620 361,681 3,684 366,985
Obligations to repurchase securities 131,193 1,048 108 132,349 Deposits - 150,844 - 150,844 Issued bonds at fair value 784,027 - - 784,027 Deposits under pooled schemes and unit-linked investment contracts - 82,905 - 82,905
Total 916,840 689,351 3,792 1,609,983
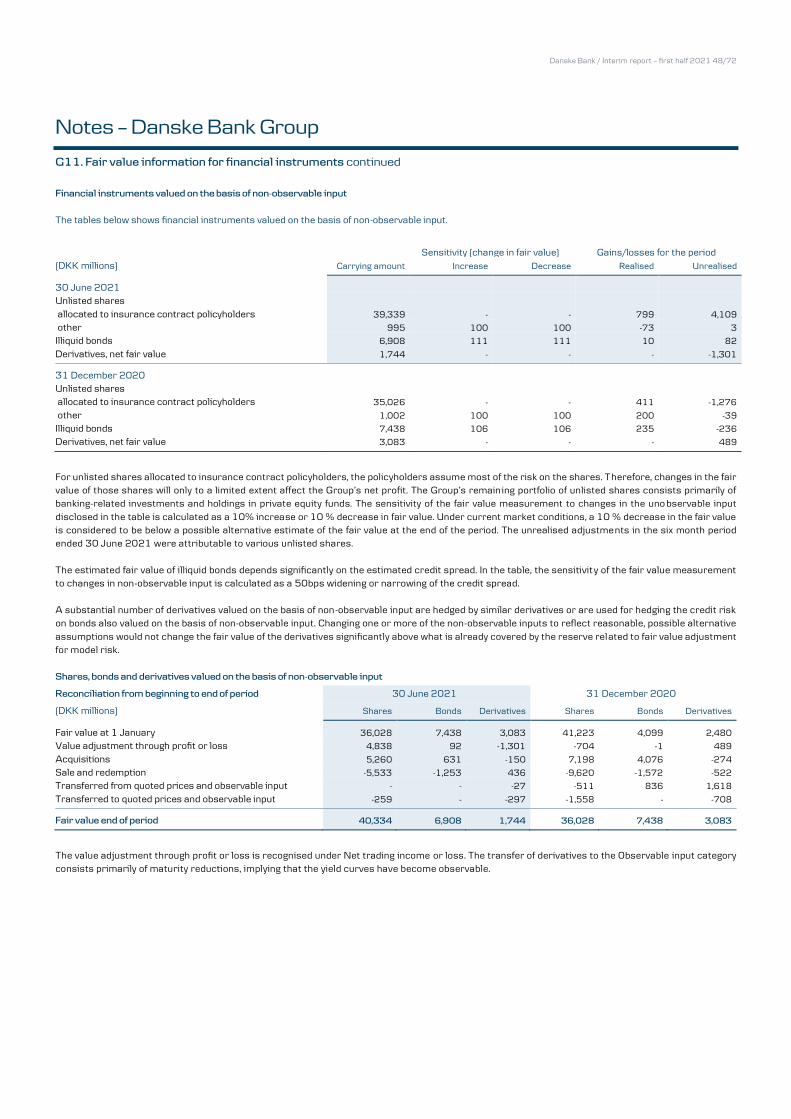
Danske Bank / Interim report – first half 2021 48/72
Notes – Danske Bank Group
G11. Fair value information for financial instruments continued
Financial instruments valued on the basis of non-observable input
The tables below shows financial instruments valued on the basis of non-observable input.
Sensitivity (change in fair value) Gains/losses for the period (DKK millions) Carrying amount Increase Decrease Realised Unrealised
30 June 2021
Unlisted shares
allocated to insurance contract policyholders 39,339 - - 799 4,109
other 995 100 100 -73 3
Illiquid bonds 6,908 111 111 10 82
Derivatives, net fair value 1,744 - - - -1,301
31 December 2020 Unlisted shares allocated to insurance contract policyholders 35,026 - - 411 -1,276
other 1,002 100 100 200 -39
Illiquid bonds 7,438 106 106 235 -236
Derivatives, net fair value 3,083 - - - 489
For unlisted shares allocated to insurance contract policyholders, the policyholders assume most of the risk on the shares. Therefore, changes in the fair value of those shares will only to a limited extent affect the Group’s net profit. The Group’s remain ing portfolio of unlisted shares consists primarily of banking-related investments and holdings in private equity funds. The sensitivity of the fair value measurement to changes in the uno bservable input
disclosed in the table is calculated as a 10% increase or 10 % decrease in fair value. Under current market conditions, a 10 % decrease in the fair value is considered to be below a possible alternative estimate of the fair value at the end of the period. The unrealised adjustments in the six month period ended 30 June 2021 were attributable to various unlisted shares.
The estimated fair value of illiquid bonds depends significantly on the estimated credit spread. In the table, the sensitivity of the fair value measurement to changes in non-observable input is calculated as a 50bps widening or narrowing of the credit spread.
A substantial number of derivatives valued on the basis of non-observable input are hedged by similar derivatives or are used for hedging the credit risk on bonds also valued on the basis of non-observable input. Changing one or more of the non-observable inputs to reflect reasonable, possible alternative
assumptions would not change the fair value of the derivatives significantly above what is already covered by the reserve related to fair value adjustment for model risk.
Shares, bonds and derivatives valued on the basis of non-observable input
Reconciliation from beginning to end of period 30 June 2021 31 December 2020
(DKK millions) Shares Bonds Derivatives Shares Bonds Derivatives
Fair value at 1 January 36,028 7,438 3,083 41,223 4,099 2,480
Value adjustment through profit or loss 4,838 92 -1,301 -704 -1 489
Acquisitions 5,260 631 -150 7,198 4,076 -274
Sale and redemption -5,533 -1,253 436 -9,620 -1,572 -522
Transferred from quoted prices and observable input - - -27 -511 836 1,618
Transferred to quoted prices and observable input -259 - -297 -1,558 - -708
Fair value end of period 40,334 6,908 1,744 36,028 7,438 3,083
The value adjustment through profit or loss is recognised under Net trading income or loss. The transfer of derivatives to the Observable input category consists primarily of maturity reductions, implying that the yield curves have become observable.
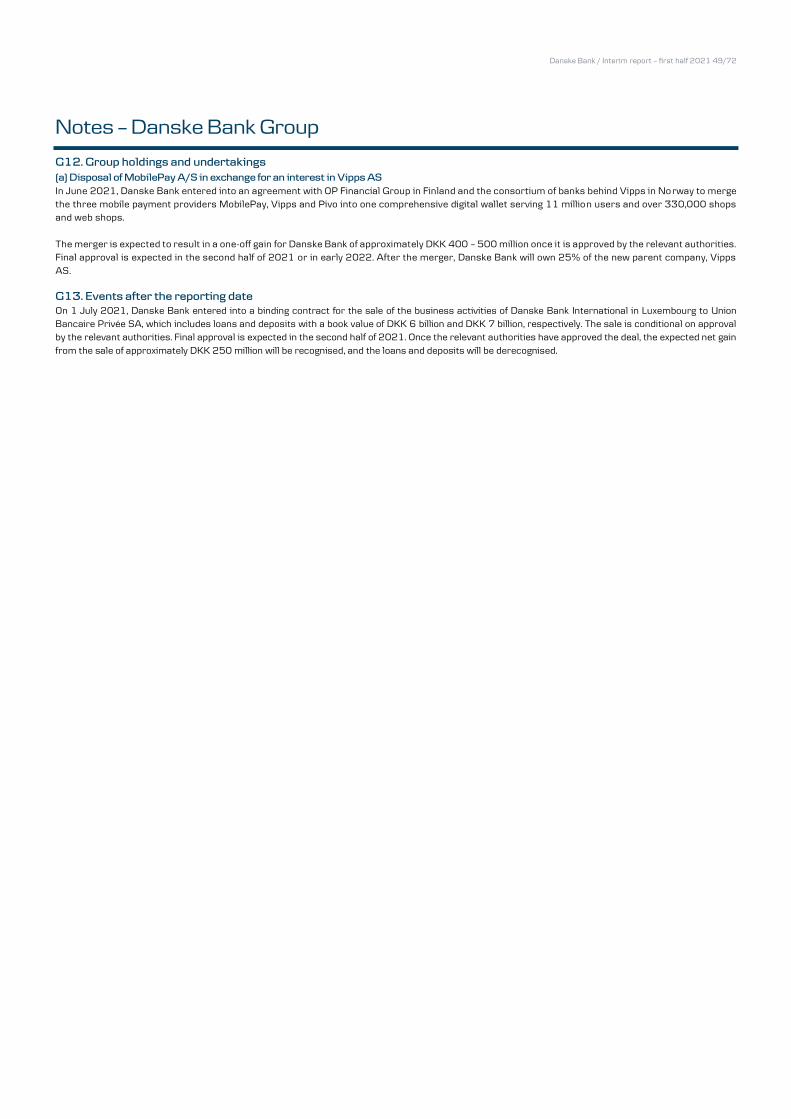
Danske Bank / Interim report – first half 2021 49/72
Notes – Danske Bank Group
G12. Group holdings and undertakings
(a) Disposal of MobilePay A/S in exchange for an interest in Vipps AS
In June 2021, Danske Bank entered into an agreement with OP Financial Group in Finland and the consortium of banks behind Vipps in Norway to merge the three mobile payment providers MobilePay, Vipps and Pivo into one comprehensive digital wallet serving 11 million users and over 330,000 shops and web shops.
The merger is expected to result in a one-off gain for Danske Bank of approximately DKK 400 – 500 million once it is approved by the relevant authorities. Final approval is expected in the second half of 2021 or in early 2022. After the merger, Danske Bank will own 25% of the new parent company, Vipps
AS.
G13. Events after the reporting date
On 1 July 2021, Danske Bank entered into a binding contract for the sale of the business activities of Danske Bank International in Luxembourg to Union Bancaire Privée SA, which includes loans and deposits with a book value of DKK 6 billion and DKK 7 billion, respectively. The sale is conditional on approval by the relevant authorities. Final approval is expected in the second half of 2021. Once the relevant authorities have approved the deal, the expected net gain
from the sale of approximately DKK 250 million will be recognised, and the loans and deposits will be derecognised.
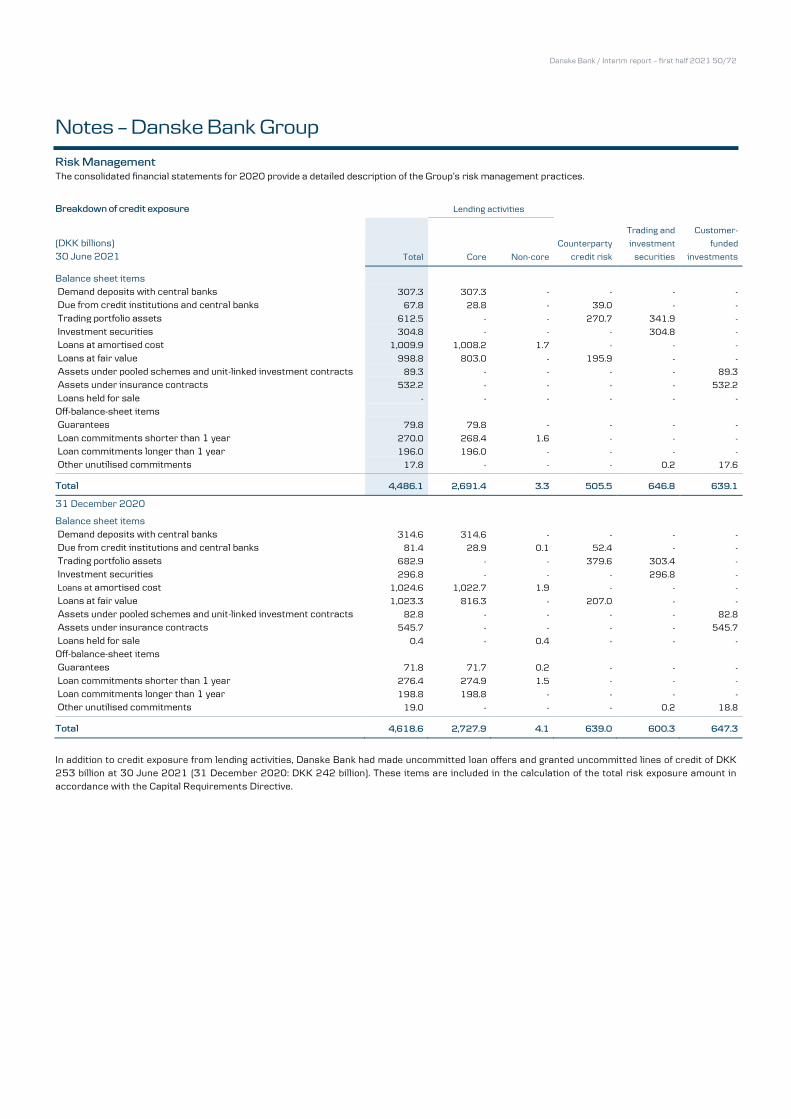
Danske Bank / Interim report – first half 2021 50/72
Notes – Danske Bank Group
Risk Management
The consolidated financial statements for 2020 provide a detailed description of the Group’s risk management practices.
Breakdown of credit exposure
Lending activities
(DKK billions) 30 June 2021 Total Core Non-core
Counterparty
credit risk
Trading and
investment
securities
Customer-
funded
investments
Balance sheet items Demand deposits with central banks 307.3 307.3 - - - -
Due from credit institutions and central banks 67.8 28.8 - 39.0 - -
Trading portfolio assets 612.5 - - 270.7 341.9 -
Investment securities 304.8 - - - 304.8 -
Loans at amortised cost 1,009.9 1,008.2 1.7 - - -
Loans at fair value 998.8 803.0 - 195.9 - -
Assets under pooled schemes and unit-linked investment contracts 89.3 - - - - 89.3
Assets under insurance contracts 532.2 - - - - 532.2
Loans held for sale - - - - - -
Off-balance-sheet items Guarantees 79.8 79.8 - - - -
Loan commitments shorter than 1 year 270.0 268.4 1.6 - - -
Loan commitments longer than 1 year 196.0 196.0 - - - -
Other unutilised commitments 17.8 - - - 0.2 17.6
Total 4,486.1 2,691.4 3.3 505.5 646.8 639.1
31 December 2020
Balance sheet items Demand deposits with central banks 314.6 314.6 - - - -
Due from credit institutions and central banks 81.4 28.9 0.1 52.4 - -
Trading portfolio assets 682.9 - - 379.6 303.4 -
Investment securities 296.8 - - - 296.8 -
Loans at amortised cost 1,024.6 1,022.7 1.9 - - -
Loans at fair value 1,023.3 816.3 - 207.0 - -
Assets under pooled schemes and unit-linked investment contracts 82.8 - - - - 82.8
Assets under insurance contracts 545.7 - - - - 545.7
Loans held for sale 0.4 - 0.4 - - -
Off-balance-sheet items Guarantees 71.8 71.7 0.2 - - -
Loan commitments shorter than 1 year 276.4 274.9 1.5 - - -
Loan commitments longer than 1 year 198.8 198.8 - - - -
Other unutilised commitments 19.0 - - - 0.2 18.8
Total 4,618.6 2,727.9 4.1 639.0 600.3 647.3
In addition to credit exposure from lending activities, Danske Bank had made uncommitted loan offers and granted uncommitted lines of credit of DKK 253 billion at 30 June 2021 (31 December 2020: DKK 242 billion). These items are included in the calculation of the total risk exposure amount in accordance with the Capital Requirements Directive.
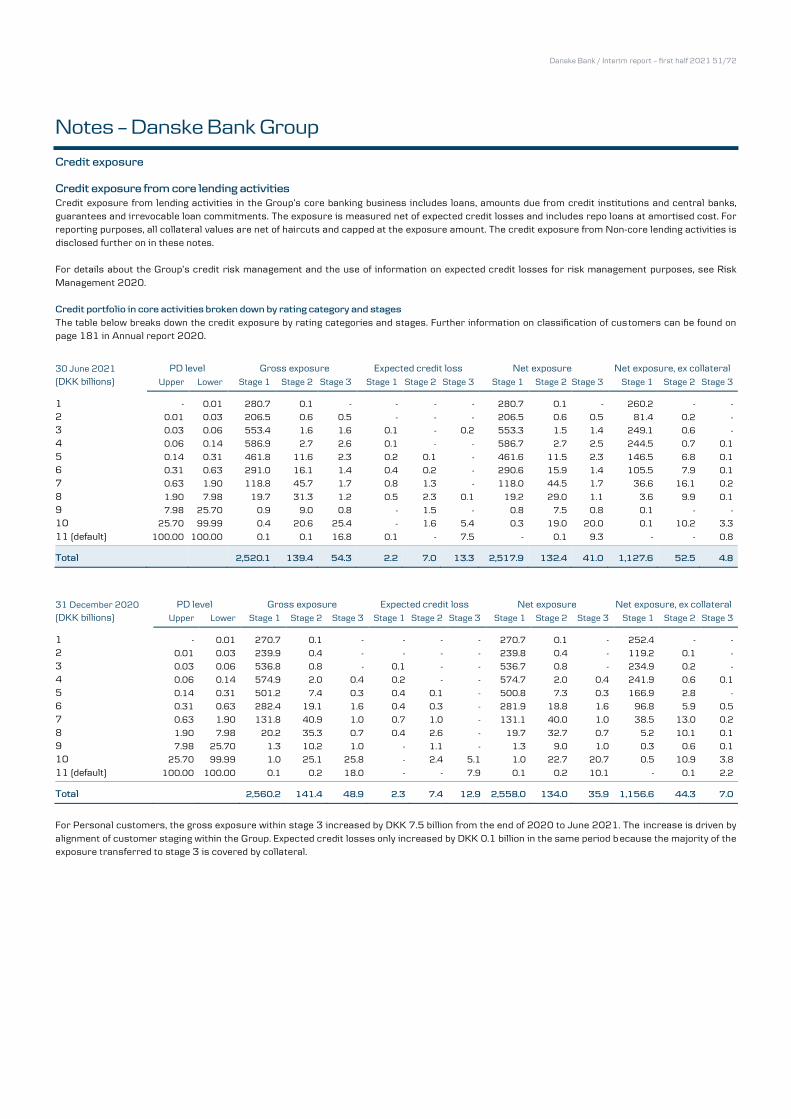
Danske Bank / Interim report – first half 2021 51/72
Notes – Danske Bank Group
Credit exposure
Credit exposure from core lending activities
Credit exposure from lending activities in the Group’s core banking business includes loans, amounts due from credit institutions and central banks, guarantees and irrevocable loan commitments. The exposure is measured net of expected credit losses and includes repo loans at amortised cost. For reporting purposes, all collateral values are net of haircuts and capped at the exposure amount. The credit exposure from Non-core lending activities is
disclosed further on in these notes. For details about the Group’s credit risk management and the use of information on expected credit losses for risk management purposes, see Risk
Management 2020. Credit portfolio in core activities broken down by rating category and stages
The table below breaks down the credit exposure by rating categories and stages. Further information on classification of customers can be found on page 181 in Annual report 2020.
30 June 2021 PD level Gross exposure Expected credit loss Net exposure Net exposure, ex collateral (DKK billions) Upper Lower Stage 1 Stage 2 Stage 3 Stage 1 Stage 2 Stage 3 Stage 1 Stage 2 Stage 3 Stage 1 Stage 2 Stage 3
1 - 0.01 280.7 0.1 - - - - 280.7 0.1 - 260.2 - -
2 0.01 0.03 206.5 0.6 0.5 - - - 206.5 0.6 0.5 81.4 0.2 -
3 0.03 0.06 553.4 1.6 1.6 0.1 - 0.2 553.3 1.5 1.4 249.1 0.6 -
4 0.06 0.14 586.9 2.7 2.6 0.1 - - 586.7 2.7 2.5 244.5 0.7 0.1
5 0.14 0.31 461.8 11.6 2.3 0.2 0.1 - 461.6 11.5 2.3 146.5 6.8 0.1
6 0.31 0.63 291.0 16.1 1.4 0.4 0.2 - 290.6 15.9 1.4 105.5 7.9 0.1
7 0.63 1.90 118.8 45.7 1.7 0.8 1.3 - 118.0 44.5 1.7 36.6 16.1 0.2
8 1.90 7.98 19.7 31.3 1.2 0.5 2.3 0.1 19.2 29.0 1.1 3.6 9.9 0.1
9 7.98 25.70 0.9 9.0 0.8 - 1.5 - 0.8 7.5 0.8 0.1 - -
10 25.70 99.99 0.4 20.6 25.4 - 1.6 5.4 0.3 19.0 20.0 0.1 10.2 3.3
11 (default) 100.00 100.00 0.1 0.1 16.8 0.1 - 7.5 - 0.1 9.3 - - 0.8
Total 2,520.1 139.4 54.3 2.2 7.0 13.3 2,517.9 132.4 41.0 1,127.6 52.5 4.8
31 December 2020 PD level Gross exposure Expected credit loss Net exposure Net exposure, ex collateral (DKK billions) Upper Lower Stage 1 Stage 2 Stage 3 Stage 1 Stage 2 Stage 3 Stage 1 Stage 2 Stage 3 Stage 1 Stage 2 Stage 3
1 - 0.01 270.7 0.1 - - - - 270.7 0.1 - 252.4 - -
2 0.01 0.03 239.9 0.4 - - - - 239.8 0.4 - 119.2 0.1 -
3 0.03 0.06 536.8 0.8 - 0.1 - - 536.7 0.8 - 234.9 0.2 -
4 0.06 0.14 574.9 2.0 0.4 0.2 - - 574.7 2.0 0.4 241.9 0.6 0.1
5 0.14 0.31 501.2 7.4 0.3 0.4 0.1 - 500.8 7.3 0.3 166.9 2.8 -
6 0.31 0.63 282.4 19.1 1.6 0.4 0.3 - 281.9 18.8 1.6 96.8 5.9 0.5
7 0.63 1.90 131.8 40.9 1.0 0.7 1.0 - 131.1 40.0 1.0 38.5 13.0 0.2
8 1.90 7.98 20.2 35.3 0.7 0.4 2.6 - 19.7 32.7 0.7 5.2 10.1 0.1
9 7.98 25.70 1.3 10.2 1.0 - 1.1 - 1.3 9.0 1.0 0.3 0.6 0.1
10 25.70 99.99 1.0 25.1 25.8 - 2.4 5.1 1.0 22.7 20.7 0.5 10.9 3.8
11 (default) 100.00 100.00 0.1 0.2 18.0 - - 7.9 0.1 0.2 10.1 - 0.1 2.2
Total 2,560.2 141.4 48.9 2.3 7.4 12.9 2,558.0 134.0 35.9 1,156.6 44.3 7.0
For Personal customers, the gross exposure within stage 3 increased by DKK 7.5 billion from the end of 2020 to June 2021. The increase is driven by
alignment of customer staging within the Group. Expected credit losses only increased by DKK 0.1 billion in the same period b ecause the majority of the exposure transferred to stage 3 is covered by collateral.
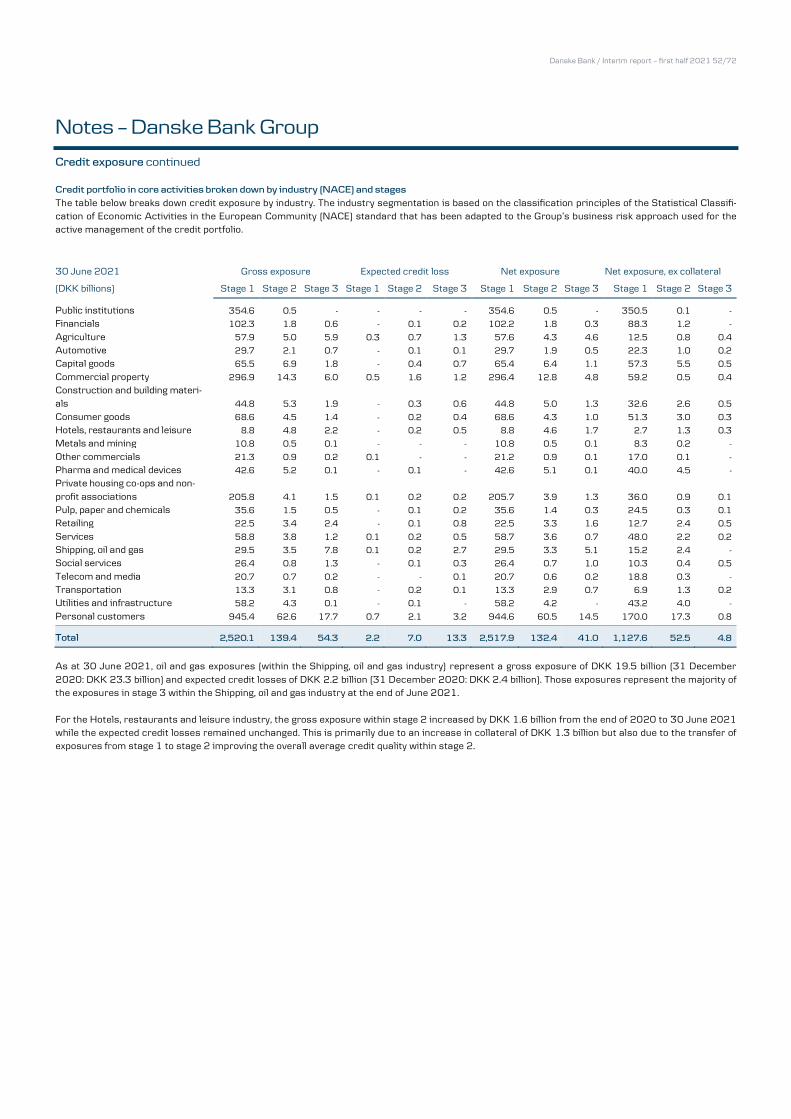
Danske Bank / Interim report – first half 2021 52/72
Notes – Danske Bank Group
Credit exposure continued
Credit portfolio in core activities broken down by industry (NACE) and stages
The table below breaks down credit exposure by industry. The industry segmentation is based on the classification principles of the Statistical Classifi-cation of Economic Activities in the European Community (NACE) standard that has been adapted to the Group’s business risk approach used for the active management of the credit portfolio.
30 June 2021 Gross exposure Expected credit loss Net exposure Net exposure, ex collateral
(DKK billions) Stage 1 Stage 2 Stage 3 Stage 1 Stage 2 Stage 3 Stage 1 Stage 2 Stage 3 Stage 1 Stage 2 Stage 3
Public institutions 354.6 0.5 - - - - 354.6 0.5 - 350.5 0.1 -
Financials 102.3 1.8 0.6 - 0.1 0.2 102.2 1.8 0.3 88.3 1.2 -
Agriculture 57.9 5.0 5.9 0.3 0.7 1.3 57.6 4.3 4.6 12.5 0.8 0.4
Automotive 29.7 2.1 0.7 - 0.1 0.1 29.7 1.9 0.5 22.3 1.0 0.2
Capital goods 65.5 6.9 1.8 - 0.4 0.7 65.4 6.4 1.1 57.3 5.5 0.5
Commercial property 296.9 14.3 6.0 0.5 1.6 1.2 296.4 12.8 4.8 59.2 0.5 0.4
Construction and building materi-als 44.8 5.3 1.9 - 0.3 0.6 44.8 5.0 1.3 32.6 2.6 0.5
Consumer goods 68.6 4.5 1.4 - 0.2 0.4 68.6 4.3 1.0 51.3 3.0 0.3
Hotels, restaurants and leisure 8.8 4.8 2.2 - 0.2 0.5 8.8 4.6 1.7 2.7 1.3 0.3
Metals and mining 10.8 0.5 0.1 - - - 10.8 0.5 0.1 8.3 0.2 -
Other commercials 21.3 0.9 0.2 0.1 - - 21.2 0.9 0.1 17.0 0.1 -
Pharma and medical devices 42.6 5.2 0.1 - 0.1 - 42.6 5.1 0.1 40.0 4.5 -
Private housing co-ops and non-
profit associations 205.8 4.1 1.5 0.1 0.2 0.2 205.7 3.9 1.3 36.0 0.9 0.1
Pulp, paper and chemicals 35.6 1.5 0.5 - 0.1 0.2 35.6 1.4 0.3 24.5 0.3 0.1
Retailing 22.5 3.4 2.4 - 0.1 0.8 22.5 3.3 1.6 12.7 2.4 0.5
Services 58.8 3.8 1.2 0.1 0.2 0.5 58.7 3.6 0.7 48.0 2.2 0.2
Shipping, oil and gas 29.5 3.5 7.8 0.1 0.2 2.7 29.5 3.3 5.1 15.2 2.4 -
Social services 26.4 0.8 1.3 - 0.1 0.3 26.4 0.7 1.0 10.3 0.4 0.5
Telecom and media 20.7 0.7 0.2 - - 0.1 20.7 0.6 0.2 18.8 0.3 -
Transportation 13.3 3.1 0.8 - 0.2 0.1 13.3 2.9 0.7 6.9 1.3 0.2
Utilities and infrastructure 58.2 4.3 0.1 - 0.1 - 58.2 4.2 - 43.2 4.0 -
Personal customers 945.4 62.6 17.7 0.7 2.1 3.2 944.6 60.5 14.5 170.0 17.3 0.8
Total 2,520.1 139.4 54.3 2.2 7.0 13.3 2,517.9 132.4 41.0 1,127.6 52.5 4.8
As at 30 June 2021, oil and gas exposures (within the Shipping, oil and gas industry) represent a gross exposure of DKK 19.5 billion (31 December
2020: DKK 23.3 billion) and expected credit losses of DKK 2.2 billion (31 December 2020: DKK 2.4 billion). Those exposures represent the majority of the exposures in stage 3 within the Shipping, oil and gas industry at the end of June 2021.
For the Hotels, restaurants and leisure industry, the gross exposure within stage 2 increased by DKK 1.6 billion from the end of 2020 to 30 June 2021 while the expected credit losses remained unchanged. This is primarily due to an increase in collateral of DKK 1.3 billion but also due to the transfer of exposures from stage 1 to stage 2 improving the overall average credit quality within stage 2.
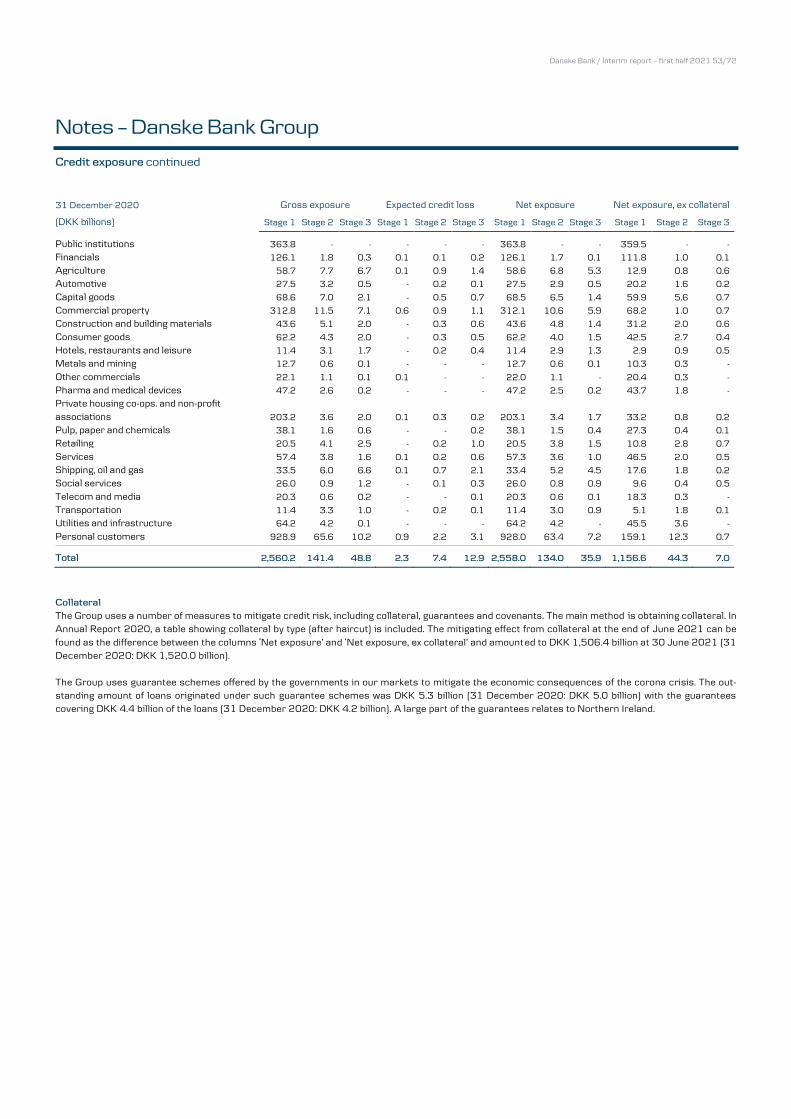
Danske Bank / Interim report – first half 2021 53/72
Notes – Danske Bank Group
Credit exposure continued 31 December 2020 Gross exposure Expected credit loss Net exposure Net exposure, ex collateral
(DKK billions) Stage 1 Stage 2 Stage 3 Stage 1 Stage 2 Stage 3 Stage 1 Stage 2 Stage 3 Stage 1 Stage 2 Stage 3
Public institutions 363.8 - - - - - 363.8 - - 359.5 - -
Financials 126.1 1.8 0.3 0.1 0.1 0.2 126.1 1.7 0.1 111.8 1.0 0.1
Agriculture 58.7 7.7 6.7 0.1 0.9 1.4 58.6 6.8 5.3 12.9 0.8 0.6
Automotive 27.5 3.2 0.5 - 0.2 0.1 27.5 2.9 0.5 20.2 1.6 0.2
Capital goods 68.6 7.0 2.1 - 0.5 0.7 68.5 6.5 1.4 59.9 5.6 0.7
Commercial property 312.8 11.5 7.1 0.6 0.9 1.1 312.1 10.6 5.9 68.2 1.0 0.7
Construction and building materials 43.6 5.1 2.0 - 0.3 0.6 43.6 4.8 1.4 31.2 2.0 0.6
Consumer goods 62.2 4.3 2.0 - 0.3 0.5 62.2 4.0 1.5 42.5 2.7 0.4
Hotels, restaurants and leisure 11.4 3.1 1.7 - 0.2 0.4 11.4 2.9 1.3 2.9 0.9 0.5
Metals and mining 12.7 0.6 0.1 - - - 12.7 0.6 0.1 10.3 0.3 -
Other commercials 22.1 1.1 0.1 0.1 - - 22.0 1.1 - 20.4 0.3 -
Pharma and medical devices 47.2 2.6 0.2 - - - 47.2 2.5 0.2 43.7 1.8 -
Private housing co-ops. and non-profit
associations 203.2 3.6 2.0 0.1 0.3 0.2 203.1 3.4 1.7 33.2 0.8 0.2
Pulp, paper and chemicals 38.1 1.6 0.6 - - 0.2 38.1 1.5 0.4 27.3 0.4 0.1
Retailing 20.5 4.1 2.5 - 0.2 1.0 20.5 3.8 1.5 10.8 2.8 0.7
Services 57.4 3.8 1.6 0.1 0.2 0.6 57.3 3.6 1.0 46.5 2.0 0.5
Shipping, oil and gas 33.5 6.0 6.6 0.1 0.7 2.1 33.4 5.2 4.5 17.6 1.8 0.2
Social services 26.0 0.9 1.2 - 0.1 0.3 26.0 0.8 0.9 9.6 0.4 0.5
Telecom and media 20.3 0.6 0.2 - - 0.1 20.3 0.6 0.1 18.3 0.3 -
Transportation 11.4 3.3 1.0 - 0.2 0.1 11.4 3.0 0.9 5.1 1.8 0.1
Utilities and infrastructure 64.2 4.2 0.1 - - - 64.2 4.2 - 45.5 3.6 -
Personal customers 928.9 65.6 10.2 0.9 2.2 3.1 928.0 63.4 7.2 159.1 12.3 0.7
Total 2,560.2 141.4 48.8 2.3 7.4 12.9 2,558.0 134.0 35.9 1,156.6 44.3 7.0
Collateral
The Group uses a number of measures to mitigate credit risk, including collateral, guarantees and covenants. The main method is obtaining collateral. In Annual Report 2020, a table showing collateral by type (after haircut) is included. The mitigating effect from collateral at the end of June 2021 can be
found as the difference between the columns ‘Net exposure’ and ‘Net exposure, ex collateral’ and amounted to DKK 1,506.4 billion at 30 June 2021 (31 December 2020: DKK 1,520.0 billion).
The Group uses guarantee schemes offered by the governments in our markets to mitigate the economic consequences of the corona crisis. The out-standing amount of loans originated under such guarantee schemes was DKK 5.3 billion (31 December 2020: DKK 5.0 billion) with the guarantees covering DKK 4.4 billion of the loans (31 December 2020: DKK 4.2 billion). A large part of the guarantees relates to Northern Ireland.
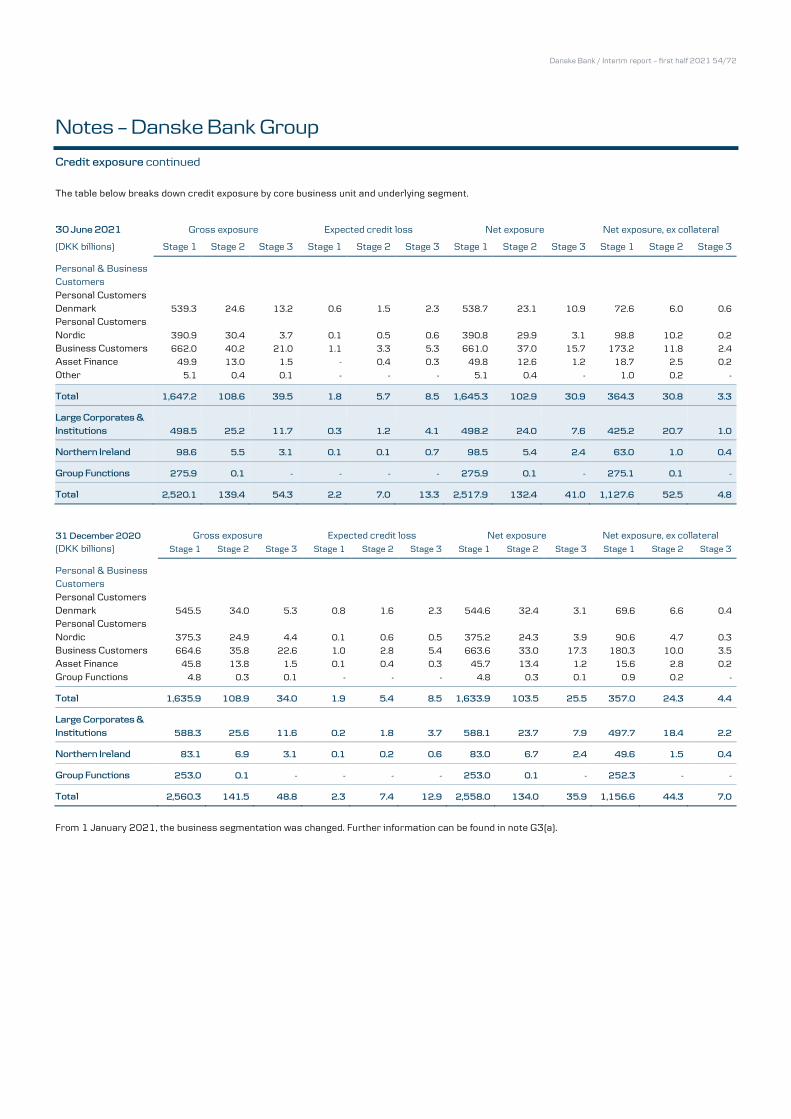
Danske Bank / Interim report – first half 2021 54/72
Notes – Danske Bank Group
Credit exposure continued
The table below breaks down credit exposure by core business unit and underlying segment.
30 June 2021 Gross exposure Expected credit loss Net exposure Net exposure, ex collateral
(DKK billions) Stage 1 Stage 2 Stage 3 Stage 1 Stage 2 Stage 3 Stage 1 Stage 2 Stage 3 Stage 1 Stage 2 Stage 3
Personal & Business Customers
Personal Customers Denmark 539.3 24.6 13.2 0.6 1.5 2.3 538.7 23.1 10.9 72.6 6.0 0.6
Personal Customers
Nordic 390.9 30.4 3.7 0.1 0.5 0.6 390.8 29.9 3.1 98.8 10.2 0.2
Business Customers 662.0 40.2 21.0 1.1 3.3 5.3 661.0 37.0 15.7 173.2 11.8 2.4
Asset Finance 49.9 13.0 1.5 - 0.4 0.3 49.8 12.6 1.2 18.7 2.5 0.2
Other 5.1 0.4 0.1 - - - 5.1 0.4 - 1.0 0.2 -
Total 1,647.2 108.6 39.5 1.8 5.7 8.5 1,645.3 102.9 30.9 364.3 30.8 3.3
Large Corporates &
Institutions 498.5 25.2 11.7 0.3 1.2 4.1 498.2 24.0 7.6 425.2 20.7 1.0
Northern Ireland 98.6 5.5 3.1 0.1 0.1 0.7 98.5 5.4 2.4 63.0 1.0 0.4
Group Functions 275.9 0.1 - - - - 275.9 0.1 - 275.1 0.1 -
Total 2,520.1 139.4 54.3 2.2 7.0 13.3 2,517.9 132.4 41.0 1,127.6 52.5 4.8
31 December 2020 Gross exposure Expected credit loss Net exposure Net exposure, ex collateral (DKK billions) Stage 1 Stage 2 Stage 3 Stage 1 Stage 2 Stage 3 Stage 1 Stage 2 Stage 3 Stage 1 Stage 2 Stage 3
Personal & Business Customers
Personal Customers Denmark 545.5 34.0 5.3 0.8 1.6 2.3 544.6 32.4 3.1 69.6 6.6 0.4
Personal Customers
Nordic 375.3 24.9 4.4 0.1 0.6 0.5 375.2 24.3 3.9 90.6 4.7 0.3
Business Customers 664.6 35.8 22.6 1.0 2.8 5.4 663.6 33.0 17.3 180.3 10.0 3.5
Asset Finance 45.8 13.8 1.5 0.1 0.4 0.3 45.7 13.4 1.2 15.6 2.8 0.2
Group Functions 4.8 0.3 0.1 - - - 4.8 0.3 0.1 0.9 0.2 -
Total 1,635.9 108.9 34.0 1.9 5.4 8.5 1,633.9 103.5 25.5 357.0 24.3 4.4
Large Corporates &
Institutions 588.3 25.6 11.6 0.2 1.8 3.7 588.1 23.7 7.9 497.7 18.4 2.2
Northern Ireland 83.1 6.9 3.1 0.1 0.2 0.6 83.0 6.7 2.4 49.6 1.5 0.4
Group Functions 253.0 0.1 - - - - 253.0 0.1 - 252.3 - -
Total 2,560.3 141.5 48.8 2.3 7.4 12.9 2,558.0 134.0 35.9 1,156.6 44.3 7.0
From 1 January 2021, the business segmentation was changed. Further information can be found in note G3(a).
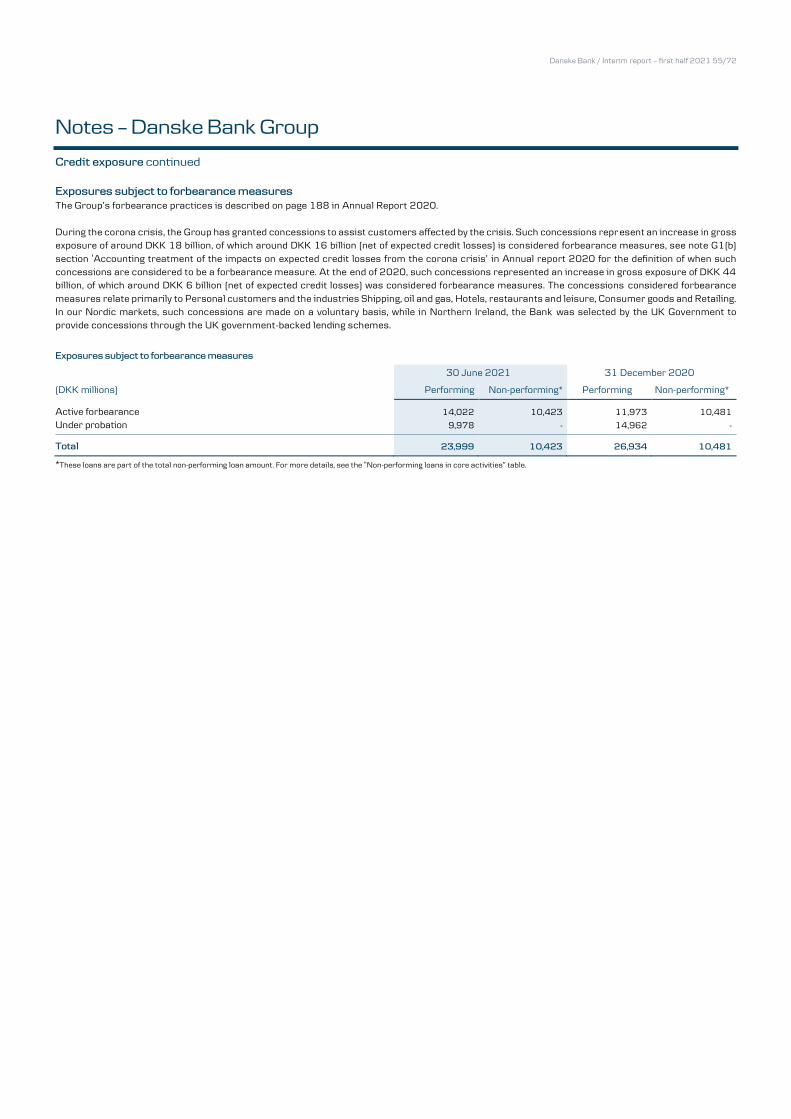
Danske Bank / Interim report – first half 2021 55/72
Notes – Danske Bank Group
Credit exposure continued
Exposures subject to forbearance measures
The Group’s forbearance practices is described on page 188 in Annual Report 2020.
During the corona crisis, the Group has granted concessions to assist customers affected by the crisis. Such concessions represent an increase in gross exposure of around DKK 18 billion, of which around DKK 16 billion (net of expected credit losses) is considered forbearance measures, see note G1(b)
section ‘Accounting treatment of the impacts on expected credit losses from the corona crisis’ in Annual report 2020 for the definition of when such concessions are considered to be a forbearance measure. At the end of 2020, such concessions represented an increase in gross exposure of DKK 44 billion, of which around DKK 6 billion (net of expected credit losses) was considered forbearance measures. The concessions considered forbearance
measures relate primarily to Personal customers and the industries Shipping, oil and gas, Hotels, restaurants and leisure, Consumer goods and Retailing. In our Nordic markets, such concessions are made on a voluntary basis, while in Northern Ireland, the Bank was selected by the UK Government to provide concessions through the UK government-backed lending schemes.
Exposures subject to forbearance measures
30 June 2021 31 December 2020
(DKK millions) Performing Non-performing* Performing Non-performing*
Active forbearance 14,022 10,423 11,973 10,481
Under probation 9,978 - 14,962 -
Total 23,999 10,423 26,934 10,481
*These loans are part of the total non-performing loan amount. For more details, see the “Non-performing loans in core activities” table.
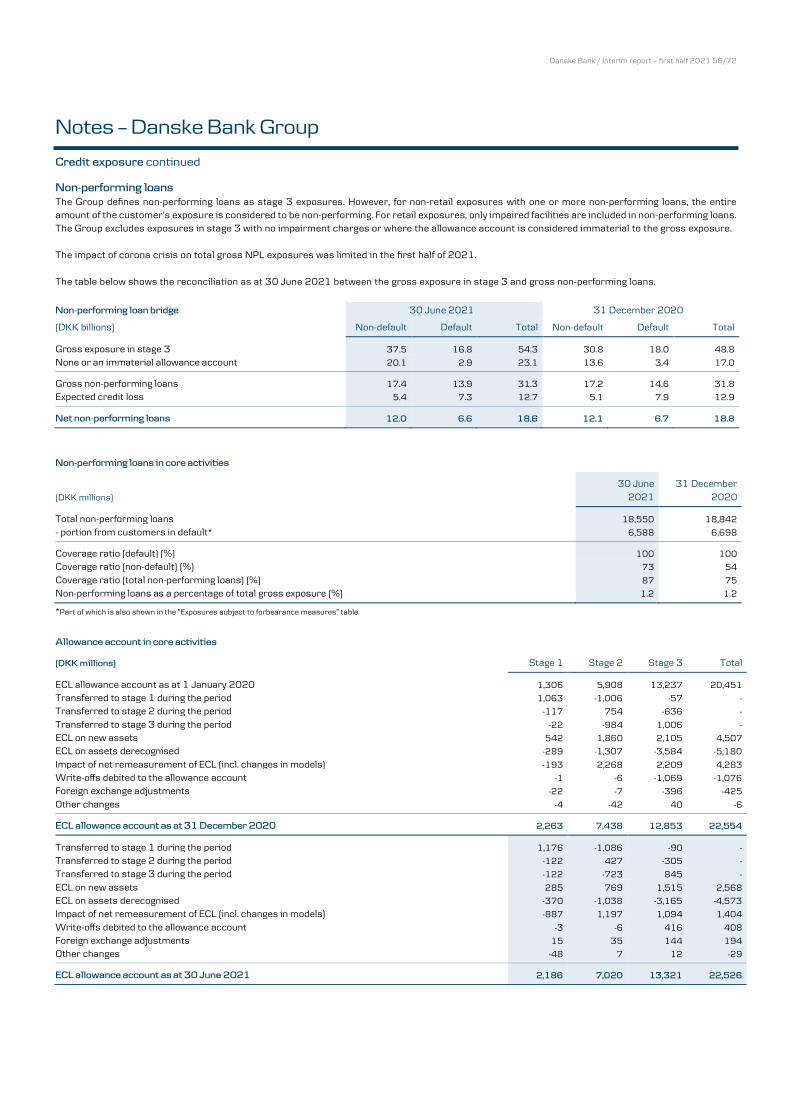
Danske Bank / Interim report – first half 2021 56/72
Notes – Danske Bank Group
Credit exposure continued Non-performing loans
The Group defines non-performing loans as stage 3 exposures. However, for non-retail exposures with one or more non-performing loans, the entire amount of the customer’s exposure is considered to be non-performing. For retail exposures, only impaired facilities are included in non-performing loans. The Group excludes exposures in stage 3 with no impairment charges or where the allowance account is considered immaterial to the gross exposure.
The impact of corona crisis on total gross NPL exposures was limited in the first half of 2021.
The table below shows the reconciliation as at 30 June 2021 between the gross exposure in stage 3 and gross non-performing loans.
Non-performing loan bridge 30 June 2021 31 December 2020
(DKK billions) Non-default Default Total Non-default Default Total
Gross exposure in stage 3 37.5 16.8 54.3 30.8 18.0 48.8
None or an immaterial allowance account 20.1 2.9 23.1 13.6 3.4 17.0
Gross non-performing loans 17.4 13.9 31.3 17.2 14.6 31.8
Expected credit loss 5.4 7.3 12.7 5.1 7.9 12.9
Net non-performing loans 12.0 6.6 18.6 12.1 6.7 18.8
Non-performing loans in core activities
(DKK millions)
30 June
2021
31 December
2020
Total non-performing loans 18,550 18,842
- portion from customers in default* 6,588 6,698
Coverage ratio (default) (%) 100 100
Coverage ratio (non-default) (%) 73 54
Coverage ratio (total non-performing loans) (%) 87 75
Non-performing loans as a percentage of total gross exposure (%) 1.2 1.2
*Part of which is also shown in the ”Exposures subject to forbearance measures” table.
Allowance account in core activities
(DKK millions) Stage 1 Stage 2 Stage 3 Total
ECL allowance account as at 1 January 2020 1,306 5,908 13,237 20,451
Transferred to stage 1 during the period 1,063 -1,006 -57 -
Transferred to stage 2 during the period -117 754 -636 -
Transferred to stage 3 during the period -22 -984 1,006 -
ECL on new assets 542 1,860 2,105 4,507
ECL on assets derecognised -289 -1,307 -3,584 -5,180
Impact of net remeasurement of ECL (incl. changes in models) -193 2,268 2,209 4,283
Write-offs debited to the allowance account -1 -6 -1,069 -1,076
Foreign exchange adjustments -22 -7 -396 -425
Other changes -4 -42 40 -6
ECL allowance account as at 31 December 2020 2,263 7,438 12,853 22,554
Transferred to stage 1 during the period 1,176 -1,086 -90 -
Transferred to stage 2 during the period -122 427 -305 -
Transferred to stage 3 during the period -122 -723 845 -
ECL on new assets 285 769 1,515 2,568
ECL on assets derecognised -370 -1,038 -3,165 -4,573
Impact of net remeasurement of ECL (incl. changes in models) -887 1,197 1,094 1,404
Write-offs debited to the allowance account -3 -6 416 408
Foreign exchange adjustments 15 35 144 194
Other changes -48 7 12 -29
ECL allowance account as at 30 June 2021 2,186 7,020 13,321 22,526
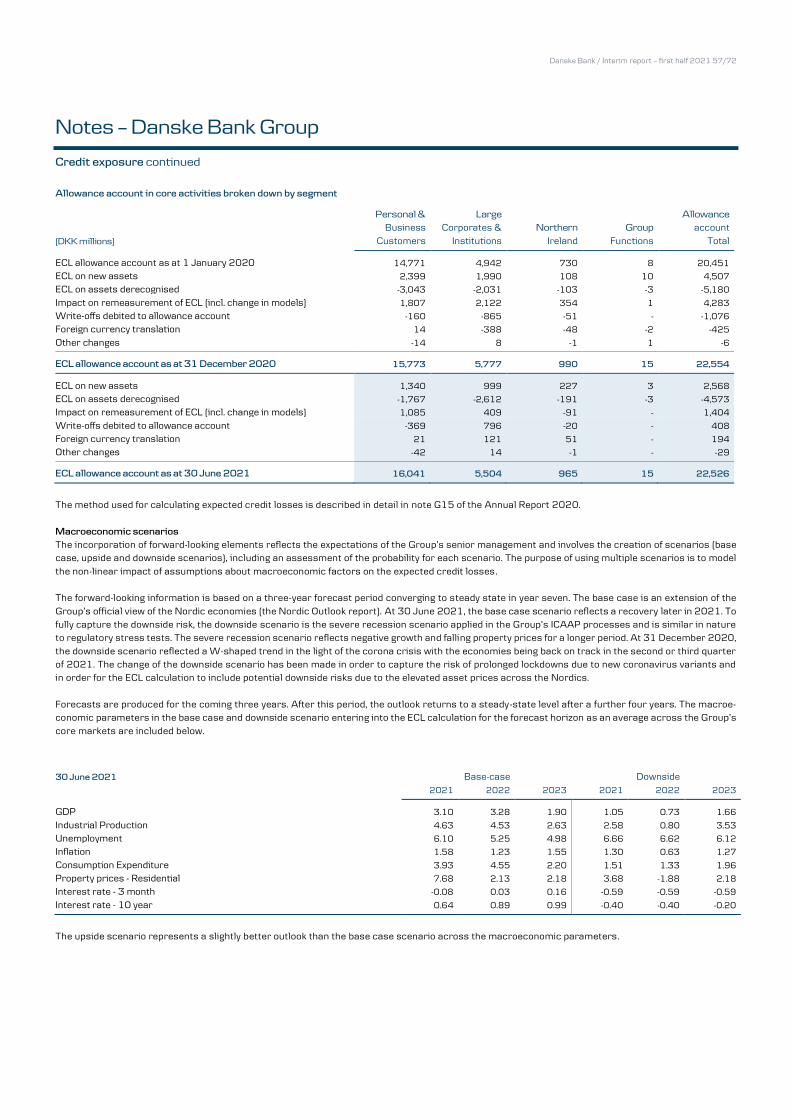
Danske Bank / Interim report – first half 2021 57/72
Notes – Danske Bank Group
Credit exposure continued
Allowance account in core activities broken down by segment
(DKK millions)
Personal & Business
Customers
Large Corporates &
Institutions
Northern
Ireland
Group
Functions
Allowance account
Total
ECL allowance account as at 1 January 2020 14,771 4,942 730 8 20,451
ECL on new assets 2,399 1,990 108 10 4,507
ECL on assets derecognised -3,043 -2,031 -103 -3 -5,180
Impact on remeasurement of ECL (incl. change in models) 1,807 2,122 354 1 4,283
Write-offs debited to allowance account -160 -865 -51 - -1,076
Foreign currency translation 14 -388 -48 -2 -425
Other changes -14 8 -1 1 -6
ECL allowance account as at 31 December 2020 15,773 5,777 990 15 22,554
ECL on new assets 1,340 999 227 3 2,568
ECL on assets derecognised -1,767 -2,612 -191 -3 -4,573
Impact on remeasurement of ECL (incl. change in models) 1,085 409 -91 - 1,404
Write-offs debited to allowance account -369 796 -20 - 408
Foreign currency translation 21 121 51 - 194
Other changes -42 14 -1 - -29
ECL allowance account as at 30 June 2021 16,041 5,504 965 15 22,526
The method used for calculating expected credit losses is described in detail in note G15 of the Annual Report 2020.
Macroeconomic scenarios The incorporation of forward-looking elements reflects the expectations of the Group’s senior management and involves the creation of scenarios (base case, upside and downside scenarios), including an assessment of the probability for each scenario. The purpose of using multiple scenarios is to model
the non-linear impact of assumptions about macroeconomic factors on the expected credit losses. The forward-looking information is based on a three-year forecast period converging to steady state in year seven. The base case is an extension of the
Group’s official view of the Nordic economies (the Nordic Outlook report). At 30 June 2021, the base case scenario reflects a recovery later in 2021. To fully capture the downside risk, the downside scenario is the severe recession scenario applied in the Group’s ICAAP processes and is similar in nature to regulatory stress tests. The severe recession scenario reflects negative growth and falling property prices for a longer period. At 31 December 2020,
the downside scenario reflected a W-shaped trend in the light of the corona crisis with the economies being back on track in the second or third quarter of 2021. The change of the downside scenario has been made in order to capture the risk of prolonged lockdowns due to new coronavirus variants and in order for the ECL calculation to include potential downside risks due to the elevated asset prices across the Nordics.
Forecasts are produced for the coming three years. After this period, the outlook returns to a steady-state level after a further four years. The macroe-conomic parameters in the base case and downside scenario entering into the ECL calculation for the forecast horizon as an average across the Group’s
core markets are included below.
30 June 2021 Base-case Downside
2021 2022 2023 2021 2022 2023
GDP 3.10 3.28 1.90 1.05 0.73 1.66
Industrial Production 4.63 4.53 2.63 2.58 0.80 3.53
Unemployment 6.10 5.25 4.98 6.66 6.62 6.12
Inflation 1.58 1.23 1.55 1.30 0.63 1.27
Consumption Expenditure 3.93 4.55 2.20 1.51 1.33 1.96
Property prices - Residential 7.68 2.13 2.18 3.68 -1.88 2.18
Interest rate - 3 month -0.08 0.03 0.16 -0.59 -0.59 -0.59
Interest rate - 10 year 0.64 0.89 0.99 -0.40 -0.40 -0.20
The upside scenario represents a slightly better outlook than the base case scenario across the macroeconomic parameters.
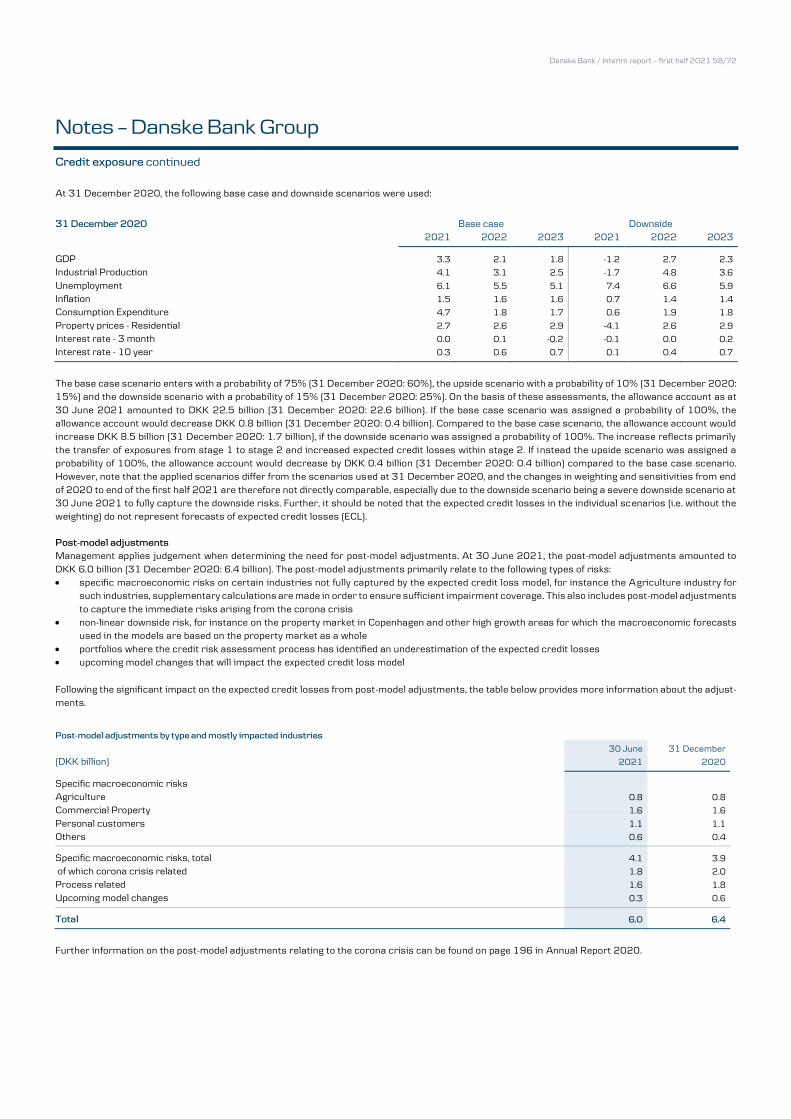
Danske Bank / Interim report – first half 2021 58/72
Notes – Danske Bank Group
Credit exposure continued
At 31 December 2020, the following base case and downside scenarios were used:
31 December 2020 Base case Downside
2021 2022 2023 2021 2022 2023
GDP 3.3 2.1 1.8 -1.2 2.7 2.3
Industrial Production 4.1 3.1 2.5 -1.7 4.8 3.6
Unemployment 6.1 5.5 5.1 7.4 6.6 5.9
Inflation 1.5 1.6 1.6 0.7 1.4 1.4
Consumption Expenditure 4.7 1.8 1.7 0.6 1.9 1.8
Property prices - Residential 2.7 2.6 2.9 -4.1 2.6 2.9
Interest rate - 3 month 0.0 0.1 -0.2 -0.1 0.0 0.2
Interest rate - 10 year 0.3 0.6 0.7 0.1 0.4 0.7
The base case scenario enters with a probability of 75% (31 December 2020: 60%), the upside scenario with a probability of 10% (31 December 2020: 15%) and the downside scenario with a probability of 15% (31 December 2020: 25%). On the basis of these assessments, the allowance account as at
30 June 2021 amounted to DKK 22.5 billion (31 December 2020: 22.6 billion). If the base case scenario was assigned a probability of 100%, the allowance account would decrease DKK 0.8 billion (31 December 2020: 0.4 billion). Compared to the base case scenario, the allowance account would increase DKK 8.5 billion (31 December 2020: 1.7 billion), if the downside scenario was assigned a probability of 100%. The increase reflects primarily
the transfer of exposures from stage 1 to stage 2 and increased expected credit losses within stage 2. If instead the upside scenario was assigned a probability of 100%, the allowance account would decrease by DKK 0.4 billion (31 December 2020: 0.4 billion) compared to the base case scenario. However, note that the applied scenarios differ from the scenarios used at 31 December 2020, and the changes in weighting and sensitivities from end
of 2020 to end of the first half 2021 are therefore not directly comparable, especially due to the downside scenario being a severe downside scenario at 30 June 2021 to fully capture the downside risks. Further, it should be noted that the expected credit losses in the individual scenarios (i.e. without the weighting) do not represent forecasts of expected credit losses (ECL).
Post-model adjustments
Management applies judgement when determining the need for post-model adjustments. At 30 June 2021, the post-model adjustments amounted to
DKK 6.0 billion (31 December 2020: 6.4 billion). The post-model adjustments primarily relate to the following types of risks: specific macroeconomic risks on certain industries not fully captured by the expected credit loss model, for instance the Agriculture industry for
such industries, supplementary calculations are made in order to ensure sufficient impairment coverage. This also includes post-model adjustments
to capture the immediate risks arising from the corona crisis non-linear downside risk, for instance on the property market in Copenhagen and other high growth areas for which the macroeconomic forecasts
used in the models are based on the property market as a whole
portfolios where the credit risk assessment process has identified an underestimation of the expected credit losses upcoming model changes that will impact the expected credit loss model
Following the significant impact on the expected credit losses from post-model adjustments, the table below provides more information about the adjust-ments.
Post-model adjustments by type and mostly impacted industries
(DKK billion) 30 June
2021
31 December
2020
Specific macroeconomic risks
Agriculture 0.8 0.8
Commercial Property 1.6 1.6
Personal customers 1.1 1.1
Others 0.6 0.4
Specific macroeconomic risks, total 4.1 3.9
of which corona crisis related 1.8 2.0
Process related 1.6 1.8
Upcoming model changes 0.3 0.6
Total 6.0 6.4
Further information on the post-model adjustments relating to the corona crisis can be found on page 196 in Annual Report 2020.
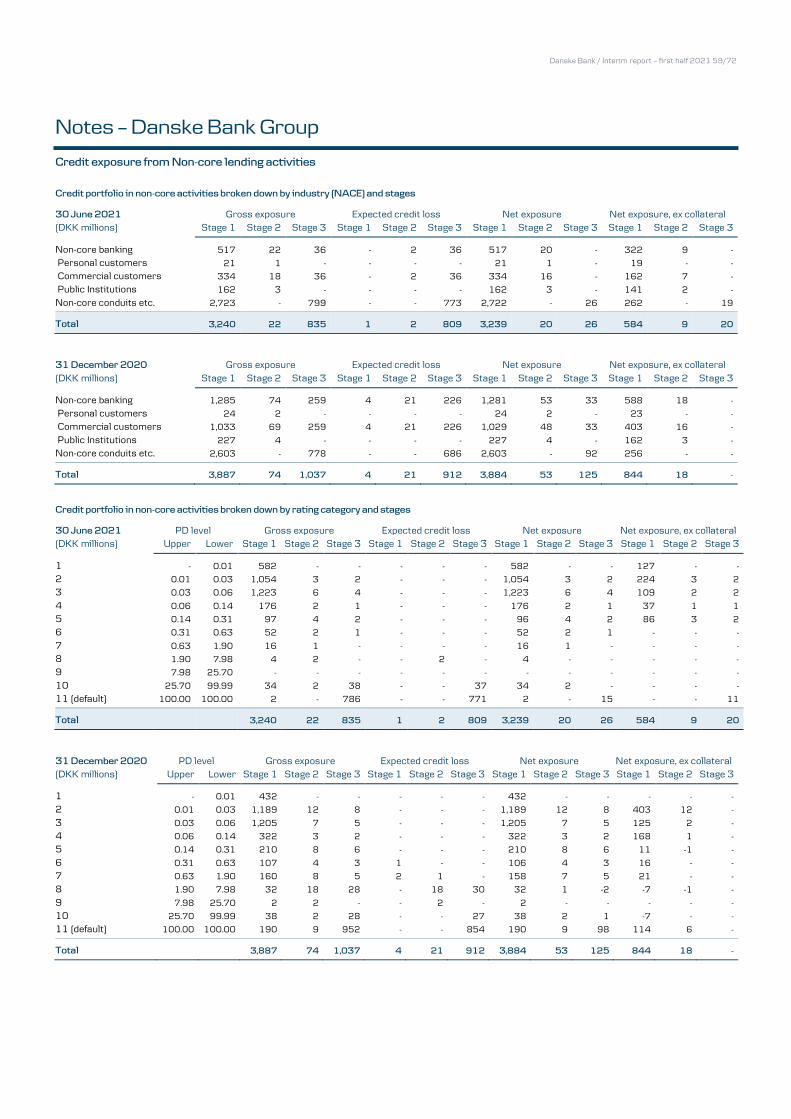
Danske Bank / Interim report – first half 2021 59/72
Notes – Danske Bank Group
Credit exposure from Non-core lending activities
Credit portfolio in non-core activities broken down by industry (NACE) and stages
30 June 2021 Gross exposure Expected credit loss Net exposure Net exposure, ex collateral (DKK millions) Stage 1 Stage 2 Stage 3 Stage 1 Stage 2 Stage 3 Stage 1 Stage 2 Stage 3 Stage 1 Stage 2 Stage 3
Non-core banking 517 22 36 - 2 36 517 20 - 322 9 -
Personal customers 21 1 - - - - 21 1 - 19 - -
Commercial customers 334 18 36 - 2 36 334 16 - 162 7 -
Public Institutions 162 3 - - - - 162 3 - 141 2 -
Non-core conduits etc. 2,723 - 799 - - 773 2,722 - 26 262 - 19
Total 3,240 22 835 1 2 809 3,239 20 26 584 9 20
31 December 2020 Gross exposure Expected credit loss Net exposure Net exposure, ex collateral
(DKK millions) Stage 1 Stage 2 Stage 3 Stage 1 Stage 2 Stage 3 Stage 1 Stage 2 Stage 3 Stage 1 Stage 2 Stage 3
Non-core banking 1,285 74 259 4 21 226 1,281 53 33 588 18 -
Personal customers 24 2 - - - - 24 2 - 23 - -
Commercial customers 1,033 69 259 4 21 226 1,029 48 33 403 16 -
Public Institutions 227 4 - - - - 227 4 - 162 3 -
Non-core conduits etc. 2,603 - 778 - - 686 2,603 - 92 256 - -
Total 3,887 74 1,037 4 21 912 3,884 53 125 844 18 -
Credit portfolio in non-core activities broken down by rating category and stages
30 June 2021 PD level Gross exposure Expected credit loss Net exposure Net exposure, ex collateral (DKK millions) Upper Lower Stage 1 Stage 2 Stage 3 Stage 1 Stage 2 Stage 3 Stage 1 Stage 2 Stage 3 Stage 1 Stage 2 Stage 3
1 - 0.01 582 - - - - - 582 - - 127 - -
2 0.01 0.03 1,054 3 2 - - - 1,054 3 2 224 3 2
3 0.03 0.06 1,223 6 4 - - - 1,223 6 4 109 2 2
4 0.06 0.14 176 2 1 - - - 176 2 1 37 1 1
5 0.14 0.31 97 4 2 - - - 96 4 2 86 3 2
6 0.31 0.63 52 2 1 - - - 52 2 1 - - -
7 0.63 1.90 16 1 - - - - 16 1 - - - -
8 1.90 7.98 4 2 - - 2 - 4 - - - - -
9 7.98 25.70 - - - - - - - - - - - -
10 25.70 99.99 34 2 38 - - 37 34 2 - - - -
11 (default) 100.00 100.00 2 - 786 - - 771 2 - 15 - - 11
Total 3,240 22 835 1 2 809 3,239 20 26 584 9 20
31 December 2020 PD level Gross exposure Expected credit loss Net exposure Net exposure, ex collateral (DKK millions) Upper Lower Stage 1 Stage 2 Stage 3 Stage 1 Stage 2 Stage 3 Stage 1 Stage 2 Stage 3 Stage 1 Stage 2 Stage 3
1 - 0.01 432 - - - - - 432 - - - - -
2 0.01 0.03 1,189 12 8 - - - 1,189 12 8 403 12 -
3 0.03 0.06 1,205 7 5 - - - 1,205 7 5 125 2 -
4 0.06 0.14 322 3 2 - - - 322 3 2 168 1 -
5 0.14 0.31 210 8 6 - - - 210 8 6 11 -1 -
6 0.31 0.63 107 4 3 1 - - 106 4 3 16 - -
7 0.63 1.90 160 8 5 2 1 - 158 7 5 21 - -
8 1.90 7.98 32 18 28 - 18 30 32 1 -2 -7 -1 -
9 7.98 25.70 2 2 - - 2 - 2 - - - - -
10 25.70 99.99 38 2 28 - - 27 38 2 1 -7 - -
11 (default) 100.00 100.00 190 9 952 - - 854 190 9 98 114 6 -
Total 3,887 74 1,037 4 21 912 3,884 53 125 844 18 -
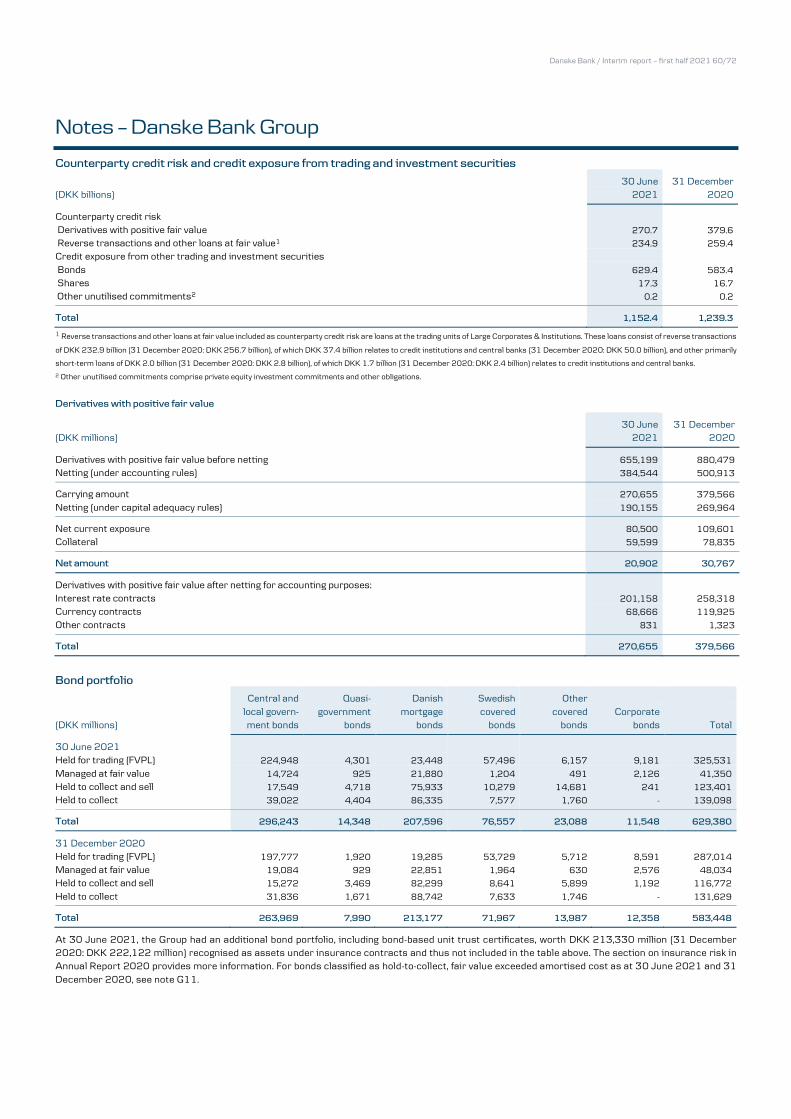
Danske Bank / Interim report – first half 2021 60/72
Notes – Danske Bank Group
Counterparty credit risk and credit exposure from trading and investment securities
30 June 31 December (DKK billions) 2021 2020
Counterparty credit risk Derivatives with positive fair value 270.7 379.6
Reverse transactions and other loans at fair value1 234.9 259.4
Credit exposure from other trading and investment securities Bonds 629.4 583.4
Shares 17.3 16.7
Other unutilised commitments2 0.2 0.2
Total 1,152.4 1,239.3
1 Reverse transactions and other loans at fair value included as counterparty credit risk are loans at the trading units of Large Corporates & Institutions. These loans consist of reverse transactions
of DKK 232.9 billion (31 December 2020: DKK 256.7 billion), of which DKK 37.4 billion relates to credit institutions and central banks (31 December 2020: DKK 50.0 billion), and other primarily
short-term loans of DKK 2.0 billion (31 December 2020: DKK 2.8 billion), of which DKK 1.7 billion (31 December 2020: DKK 2.4 billion) relates to credit institutions and central banks.
2 Other unutilised commitments comprise private equity investment commitments and other obligations.
Derivatives with positive fair value
(DKK millions) 30 June
2021 31 December
2020
Derivatives with positive fair value before netting 655,199 880,479
Netting (under accounting rules) 384,544 500,913
Carrying amount 270,655 379,566
Netting (under capital adequacy rules) 190,155 269,964
Net current exposure 80,500 109,601
Collateral 59,599 78,835
Net amount 20,902 30,767
Derivatives with positive fair value after netting for accounting purposes:
Interest rate contracts 201,158 258,318
Currency contracts 68,666 119,925
Other contracts 831 1,323
Total 270,655 379,566
Bond portfolio
Central and Quasi- Danish Swedish Other
local govern- government mortgage covered covered Corporate (DKK millions) ment bonds bonds bonds bonds bonds bonds Total
30 June 2021
Held for trading (FVPL) 224,948 4,301 23,448 57,496 6,157 9,181 325,531
Managed at fair value 14,724 925 21,880 1,204 491 2,126 41,350
Held to collect and sell 17,549 4,718 75,933 10,279 14,681 241 123,401
Held to collect 39,022 4,404 86,335 7,577 1,760 - 139,098
Total 296,243 14,348 207,596 76,557 23,088 11,548 629,380
31 December 2020
Held for trading (FVPL) 197,777 1,920 19,285 53,729 5,712 8,591 287,014
Managed at fair value 19,084 929 22,851 1,964 630 2,576 48,034
Held to collect and sell 15,272 3,469 82,299 8,641 5,899 1,192 116,772
Held to collect 31,836 1,671 88,742 7,633 1,746 - 131,629
Total 263,969 7,990 213,177 71,967 13,987 12,358 583,448
At 30 June 2021, the Group had an additional bond portfolio, including bond-based unit trust certificates, worth DKK 213,330 million (31 December 2020: DKK 222,122 million) recognised as assets under insurance contracts and thus not included in the table above. The section on insurance risk in Annual Report 2020 provides more information. For bonds classified as hold-to-collect, fair value exceeded amortised cost as at 30 June 2021 and 31
December 2020, see note G11.
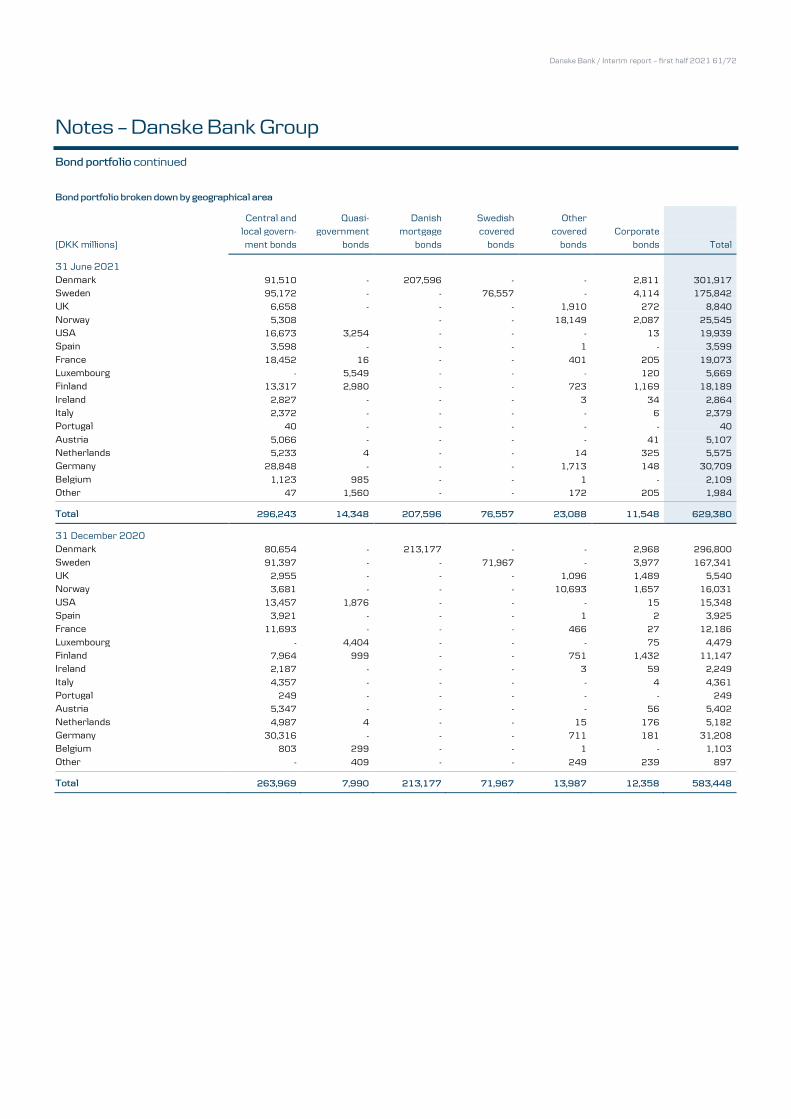
Danske Bank / Interim report – first half 2021 61/72
Notes – Danske Bank Group
Bond portfolio continued
Bond portfolio broken down by geographical area
Central and Quasi- Danish Swedish Other local govern- government mortgage covered covered Corporate (DKK millions) ment bonds bonds bonds bonds bonds bonds Total
31 June 2021
Denmark 91,510 - 207,596 - - 2,811 301,917
Sweden 95,172 - - 76,557 - 4,114 175,842
UK 6,658 - - - 1,910 272 8,840
Norway 5,308 - - 18,149 2,087 25,545
USA 16,673 3,254 - - - 13 19,939
Spain 3,598 - - - 1 - 3,599
France 18,452 16 - - 401 205 19,073
Luxembourg - 5,549 - - - 120 5,669
Finland 13,317 2,980 - - 723 1,169 18,189
Ireland 2,827 - - - 3 34 2,864
Italy 2,372 - - - - 6 2,379
Portugal 40 - - - - - 40
Austria 5,066 - - - - 41 5,107
Netherlands 5,233 4 - - 14 325 5,575
Germany 28,848 - - - 1,713 148 30,709
Belgium 1,123 985 - - 1 - 2,109
Other 47 1,560 - - 172 205 1,984
Total 296,243 14,348 207,596 76,557 23,088 11,548 629,380
31 December 2020 Denmark 80,654 - 213,177 - - 2,968 296,800
Sweden 91,397 - - 71,967 - 3,977 167,341
UK 2,955 - - - 1,096 1,489 5,540
Norway 3,681 - - - 10,693 1,657 16,031
USA 13,457 1,876 - - - 15 15,348
Spain 3,921 - - - 1 2 3,925
France 11,693 - - - 466 27 12,186
Luxembourg - 4,404 - - - 75 4,479
Finland 7,964 999 - - 751 1,432 11,147
Ireland 2,187 - - - 3 59 2,249
Italy 4,357 - - - - 4 4,361
Portugal 249 - - - - - 249
Austria 5,347 - - - - 56 5,402
Netherlands 4,987 4 - - 15 176 5,182
Germany 30,316 - - - 711 181 31,208
Belgium 803 299 - - 1 - 1,103
Other - 409 - - 249 239 897
Total 263,969 7,990 213,177 71,967 13,987 12,358 583,448
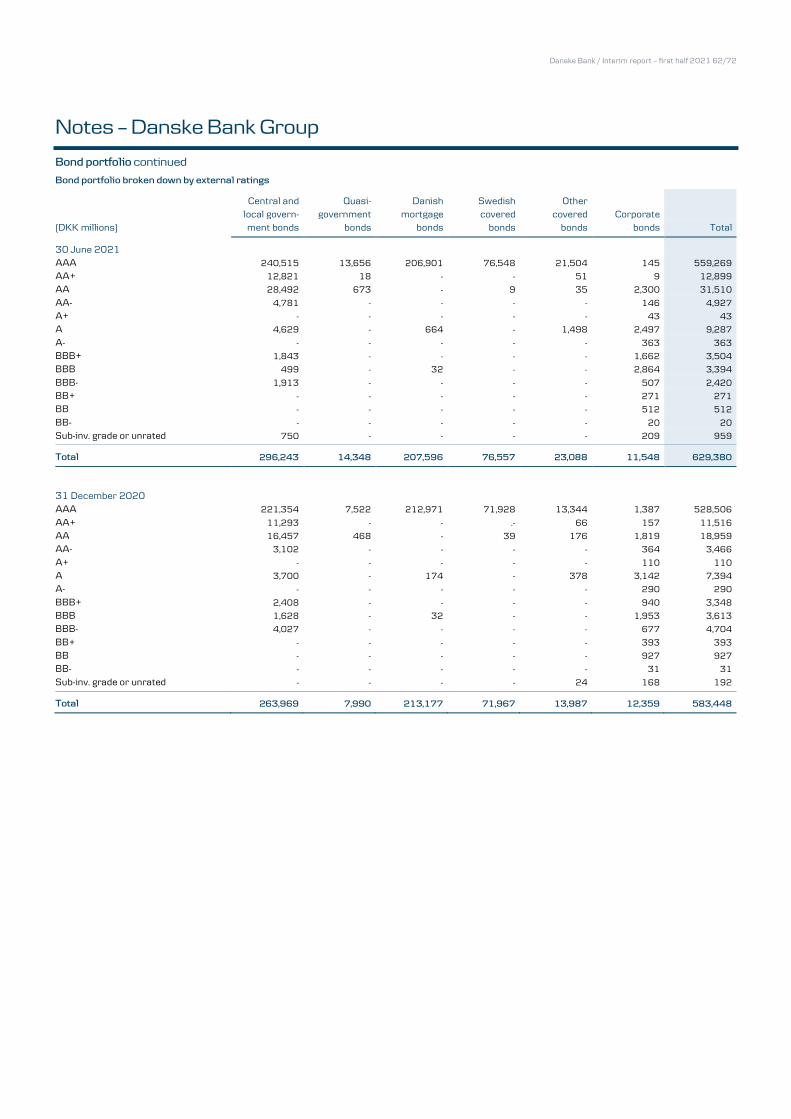
Danske Bank / Interim report – first half 2021 62/72
Notes – Danske Bank Group
Bond portfolio continued
Bond portfolio broken down by external ratings
Central and Quasi- Danish Swedish Other
local govern- government mortgage covered covered Corporate (DKK millions) ment bonds bonds bonds bonds bonds bonds Total
30 June 2021
AAA 240,515 13,656 206,901 76,548 21,504 145 559,269
AA+ 12,821 18 - - 51 9 12,899
AA 28,492 673 - 9 35 2,300 31,510
AA- 4,781 - - - - 146 4,927
A+ - - - - - 43 43
A 4,629 - 664 - 1,498 2,497 9,287
A- - - - - - 363 363
BBB+ 1,843 - - - - 1,662 3,504
BBB 499 - 32 - - 2,864 3,394
BBB- 1,913 - - - - 507 2,420
BB+ - - - - - 271 271
BB - - - - - 512 512
BB- - - - - - 20 20
Sub-inv. grade or unrated 750 - - - - 209 959
Total 296,243 14,348 207,596 76,557 23,088 11,548 629,380
31 December 2020
AAA 221,354 7,522 212,971 71,928 13,344 1,387 528,506
AA+ 11,293 - - .- 66 157 11,516
AA 16,457 468 - 39 176 1,819 18,959
AA- 3,102 - - - - 364 3,466
A+ - - - - - 110 110
A 3,700 - 174 - 378 3,142 7,394
A- - - - - - 290 290
BBB+ 2,408 - - - - 940 3,348
BBB 1,628 - 32 - - 1,953 3,613
BBB- 4,027 - - - - 677 4,704
BB+ - - - - - 393 393
BB - - - - - 927 927
BB- - - - - - 31 31
Sub-inv. grade or unrated - - - - 24 168 192
Total 263,969 7,990 213,177 71,967 13,987 12,359 583,448
Danske Bank / Interim report – first half 2021 63/72
Financial statements – Danske Bank A/S
The financial statements of the Parent Company, Danske Bank A/S, are prepared in accordance with the Danish Financial Business Act and the Danish FSA’s Executive Order No. 281 of 26 March 2014 on Financial Reports for Credit Institutions and Investment Companies, etc. as amended by Executive Order No. 707 of 1 June 2016, Executive Order No. 1043 of 5 September 2017, Executive Order No. 1441 of 3 December 2018 and Executive Order
No. 1593 of 9 November 2020. The amendments of 9 November 2020 incorporate a requirement to provide a description of policies for data ethics applicable for annual reporting periods beginning on or after 1 January 2021.
Note G2(a) provides further information on changes in accounting policies implemented as at 1 January 2021. Except for these changes, Danske Bank A/S has not changed its significant accounting policies from those applied in the Annual Report 2020.
The accounting policies applied are identical to the Group’s IFRS accounting principles, see note G1, with the following exception: Domicile property (except right-of-use assets) is measured (revalued) at its estimated fair value through Other comprehensive income.
The estimated fair value of domicile property is determined in accordance with the Danish FSA’s Executive Order on Financial Reports for Credit Institu-tions and Investment Companies, etc.
Holdings in subsidiaries are measured on the basis of the equity method. Net profit from these undertakings is recognised under Income from associates and group undertakings.
The format of the Parent Company’s financial statements is not identical to the format of the consolidated financial statements in accordance with IFRS. The table below shows the differences in net profit and shareholders’ equity between the IFRS consolidated financial statemen ts and the Parent Com-
pany’s financial statements presented in accordance with Danish FSA rules.
Danske Bank Group
Net profit Net profit Equity Equity
2021 2020 30 June 2021 31 December 2020
Consolidated financial statement (IFRS) 5,932 1,036 173,161 168,679
Domicile properties -6 -3 175 176
Tax effect 1 - -17 -17
Financial statements (Danish FSA rules) 5,926 1,032 173,318 168,836
In 2020, ‘Domicile properties’ includes an adjustment in net profit related to investment properties previously held by Danic a Pension and included as Assets under insurance contracts in the financial statements for Danske Bank Group. As Danske Bank occupied more than 10% of the properties, they
were accounted for as domicile property in Danske Bank Group and Danske Bank A/S. In the consolidated financial statements fo r Danske Bank Group, domicile property is measured using the cost method, and a gain on the sale of those properties of DKK 76 million, net of tax, was recognised in the income statement. Under the revaluation method used in the financial statements for Danske Bank A/S, there was no gain on the sale.
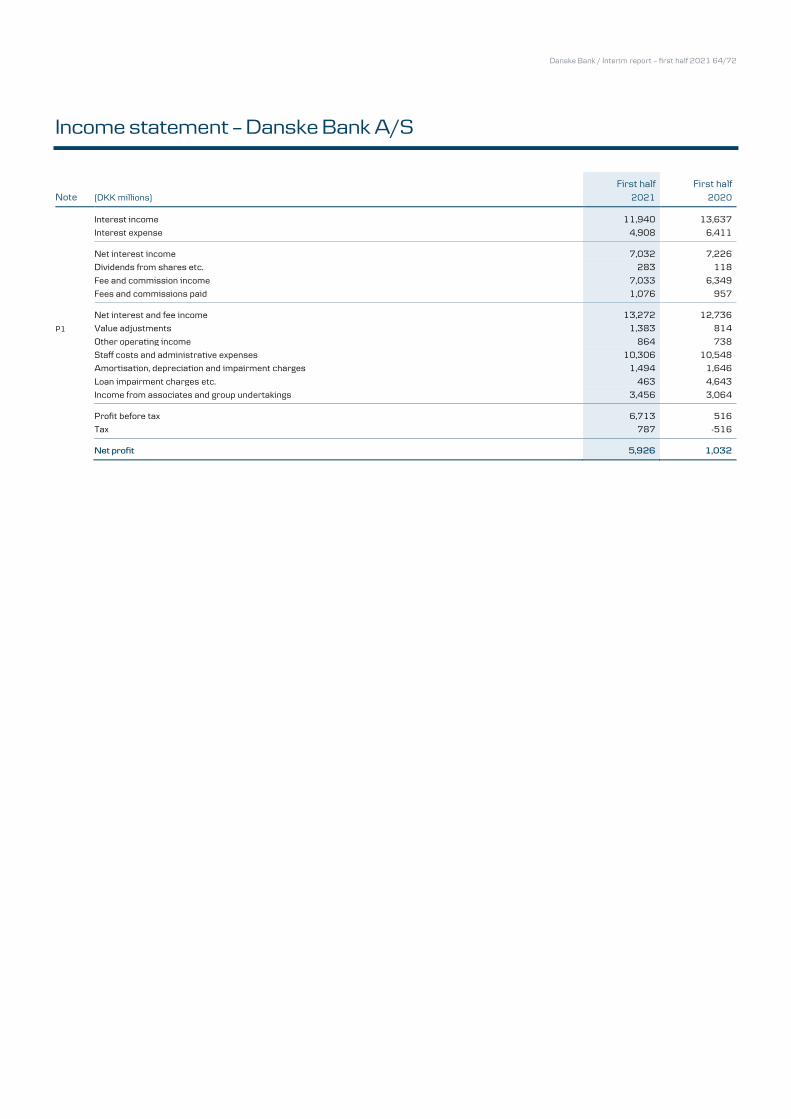
Danske Bank / Interim report – first half 2021 64/72
Income statement – Danske Bank A/S
First half First half Note (DKK millions) 2021 2020
Interest income 11,940 13,637
Interest expense 4,908 6,411
Net interest income 7,032 7,226
Dividends from shares etc. 283 118
Fee and commission income 7,033 6,349
Fees and commissions paid 1,076 957
Net interest and fee income 13,272 12,736
P1 Value adjustments 1,383 814
Other operating income 864 738
Staff costs and administrative expenses 10,306 10,548
Amortisation, depreciation and impairment charges 1,494 1,646
Loan impairment charges etc. 463 4,643
Income from associates and group undertakings 3,456 3,064
Profit before tax 6,713 516
Tax 787 -516
Net profit 5,926 1,032
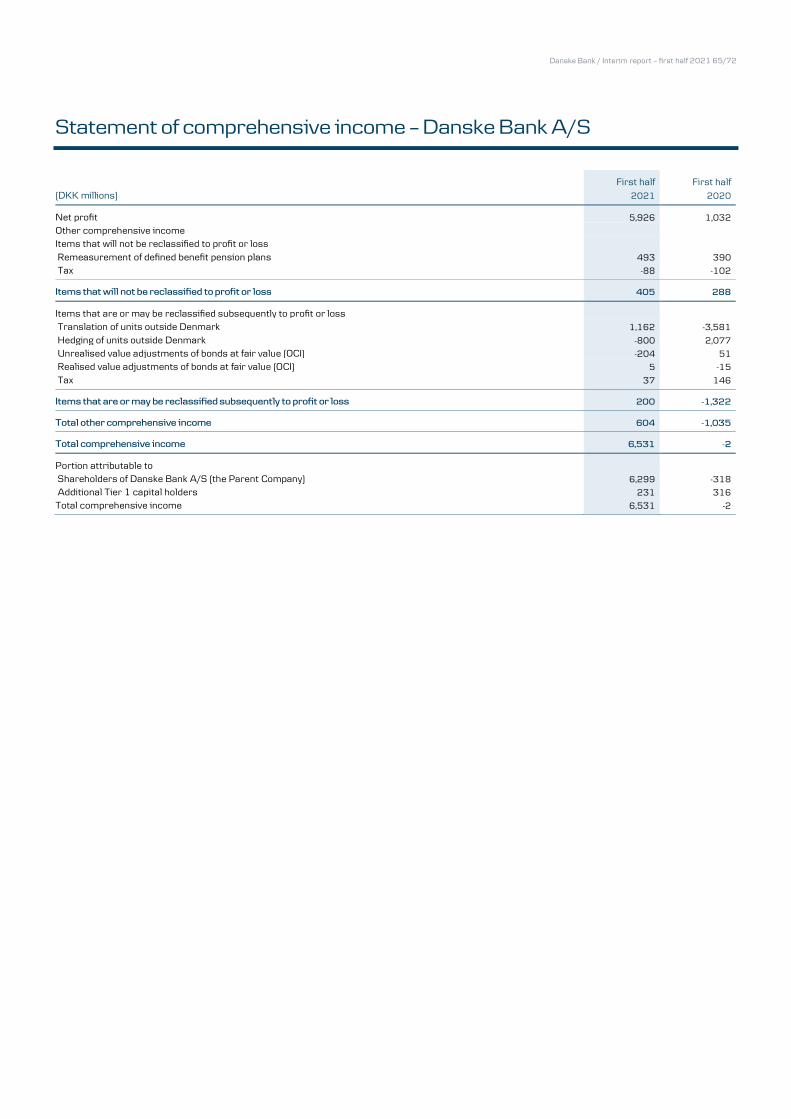
Danske Bank / Interim report – first half 2021 65/72
Statement of comprehensive income – Danske Bank A/S
First half First half
(DKK millions) 2021 2020
Net profit 5,926 1,032
Other comprehensive income Items that will not be reclassified to profit or loss Remeasurement of defined benefit pension plans 493 390
Tax -88 -102
Items that will not be reclassified to profit or loss 405 288
Items that are or may be reclassified subsequently to profit or loss Translation of units outside Denmark 1,162 -3,581
Hedging of units outside Denmark -800 2,077
Unrealised value adjustments of bonds at fair value (OCI) -204 51
Realised value adjustments of bonds at fair value (OCI) 5 -15
Tax 37 146
Items that are or may be reclassified subsequently to profit or loss 200 -1,322
Total other comprehensive income 604 -1,035
Total comprehensive income 6,531 -2
Portion attributable to Shareholders of Danske Bank A/S (the Parent Company) 6,299 -318
Additional Tier 1 capital holders 231 316
Total comprehensive income 6,531 -2
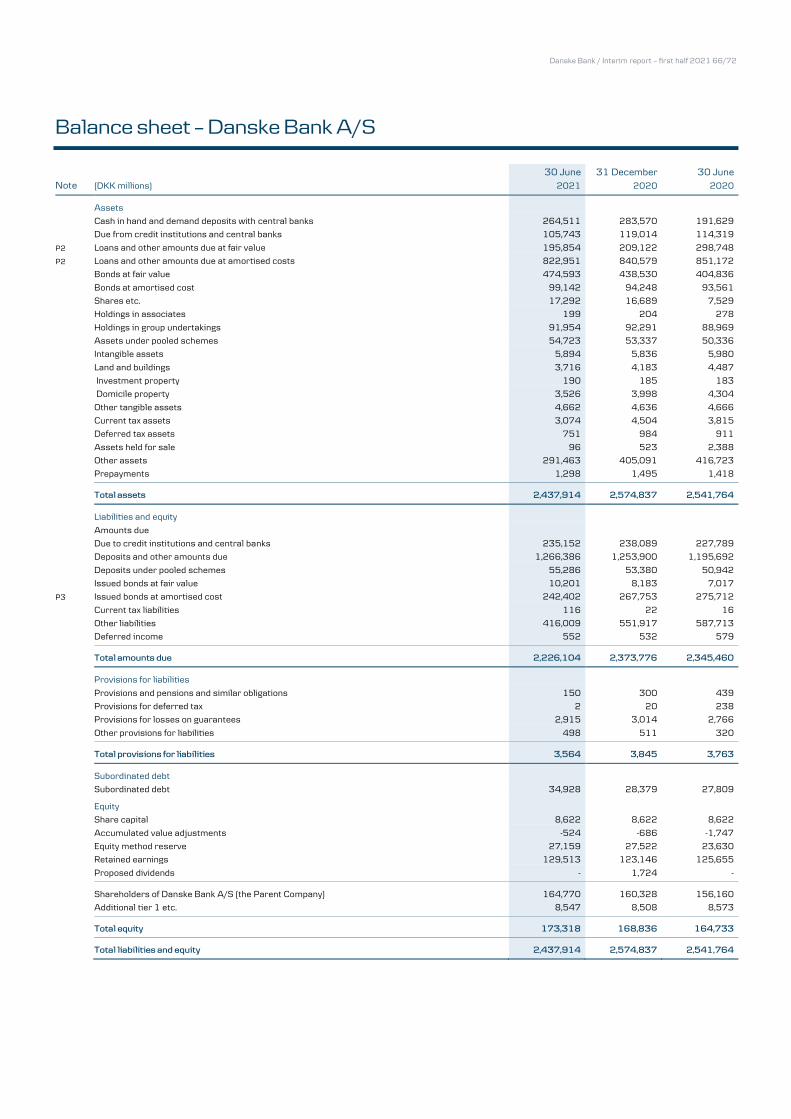
Danske Bank / Interim report – first half 2021 66/72
Balance sheet – Danske Bank A/S
30 June 31 December 30 June Note (DKK millions) 2021 2020 2020
Assets Cash in hand and demand deposits with central banks 264,511 283,570 191,629
Due from credit institutions and central banks 105,743 119,014 114,319
P2 Loans and other amounts due at fair value 195,854 209,122 298,748
P2 Loans and other amounts due at amortised costs 822,951 840,579 851,172
Bonds at fair value 474,593 438,530 404,836
Bonds at amortised cost 99,142 94,248 93,561
Shares etc. 17,292 16,689 7,529
Holdings in associates 199 204 278
Holdings in group undertakings 91,954 92,291 88,969
Assets under pooled schemes 54,723 53,337 50,336
Intangible assets 5,894 5,836 5,980
Land and buildings 3,716 4,183 4,487
Investment property 190 185 183
Domicile property 3,526 3,998 4,304
Other tangible assets 4,662 4,636 4,666
Current tax assets 3,074 4,504 3,815
Deferred tax assets 751 984 911
Assets held for sale 96 523 2,388
Other assets 291,463 405,091 416,723
Prepayments 1,298 1,495 1,418
Total assets 2,437,914 2,574,837 2,541,764
Liabilities and equity Amounts due Due to credit institutions and central banks 235,152 238,089 227,789
Deposits and other amounts due 1,266,386 1,253,900 1,195,692
Deposits under pooled schemes 55,286 53,380 50,942
Issued bonds at fair value 10,201 8,183 7,017
P3 Issued bonds at amortised cost 242,402 267,753 275,712
Current tax liabilities 116 22 16
Other liabilities 416,009 551,917 587,713
Deferred income 552 532 579
Total amounts due 2,226,104 2,373,776 2,345,460
Provisions for liabilities Provisions and pensions and similar obligations 150 300 439
Provisions for deferred tax 2 20 238
Provisions for losses on guarantees 2,915 3,014 2,766
Other provisions for liabilities 498 511 320
Total provisions for liabilities 3,564 3,845 3,763
Subordinated debt Subordinated debt 34,928 28,379 27,809
Equity Share capital 8,622 8,622 8,622
Accumulated value adjustments -524 -686 -1,747
Equity method reserve 27,159 27,522 23,630
Retained earnings 129,513 123,146 125,655
Proposed dividends - 1,724 -
Shareholders of Danske Bank A/S (the Parent Company) 164,770 160,328 156,160
Additional tier 1 etc. 8,547 8,508 8,573
Total equity 173,318 168,836 164,733
Total liabilities and equity 2,437,914 2,574,837 2,541,764
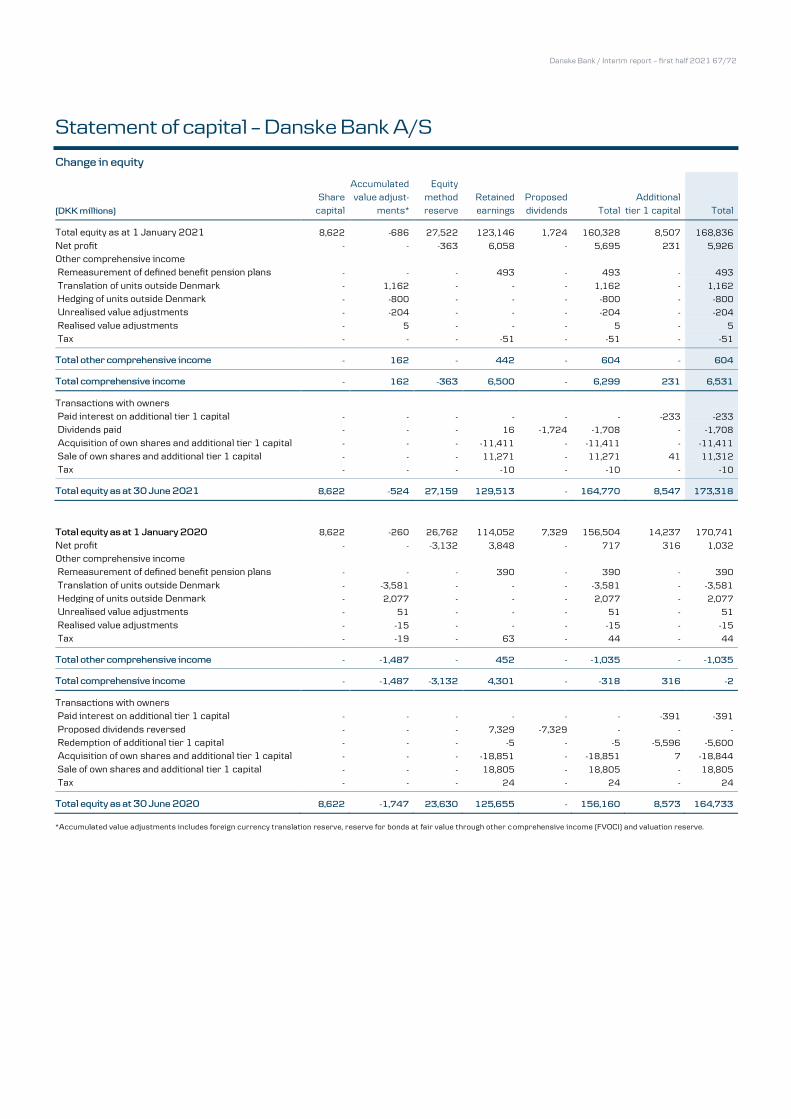
Danske Bank / Interim report – first half 2021 67/72
Statement of capital – Danske Bank A/S
Change in equity
(DKK millions)
Share capital
Accumulated value adjust-
ments*
Equity method reserve
Retained earnings
Proposed dividends Total
Additional tier 1 capital Total
Total equity as at 1 January 2021 8,622 -686 27,522 123,146 1,724 160,328 8,507 168,836
Net profit - - -363 6,058 - 5,695 231 5,926
Other comprehensive income Remeasurement of defined benefit pension plans - - - 493 - 493 - 493
Translation of units outside Denmark - 1,162 - - - 1,162 - 1,162
Hedging of units outside Denmark - -800 - - - -800 - -800
Unrealised value adjustments - -204 - - - -204 - -204
Realised value adjustments - 5 - - - 5 - 5
Tax - - - -51 - -51 - -51
Total other comprehensive income - 162 - 442 - 604 - 604
Total comprehensive income - 162 -363 6,500 - 6,299 231 6,531
Transactions with owners Paid interest on additional tier 1 capital - - - - - - -233 -233
Dividends paid - - - 16 -1,724 -1,708 - -1,708
Acquisition of own shares and additional tier 1 capital - - - -11,411 - -11,411 - -11,411
Sale of own shares and additional tier 1 capital - - - 11,271 - 11,271 41 11,312
Tax - - - -10 - -10 - -10
Total equity as at 30 June 2021 8,622 -524 27,159 129,513 - 164,770 8,547 173,318
Total equity as at 1 January 2020 8,622 -260 26,762 114,052 7,329 156,504 14,237 170,741
Net profit - - -3,132 3,848 - 717 316 1,032
Other comprehensive income Remeasurement of defined benefit pension plans - - - 390 - 390 - 390
Translation of units outside Denmark - -3,581 - - - -3,581 - -3,581
Hedging of units outside Denmark - 2,077 - - - 2,077 - 2,077
Unrealised value adjustments - 51 - - - 51 - 51
Realised value adjustments - -15 - - - -15 - -15
Tax - -19 - 63 - 44 - 44
Total other comprehensive income - -1,487 - 452 - -1,035 - -1,035
Total comprehensive income - -1,487 -3,132 4,301 - -318 316 -2
Transactions with owners Paid interest on additional tier 1 capital - - - - - - -391 -391
Proposed dividends reversed - - - 7,329 -7,329 - - -
Redemption of additional tier 1 capital - - - -5 - -5 -5,596 -5,600
Acquisition of own shares and additional tier 1 capital - - - -18,851 - -18,851 7 -18,844
Sale of own shares and additional tier 1 capital - - - 18,805 - 18,805 - 18,805
Tax - - - 24 - 24 - 24
Total equity as at 30 June 2020 8,622 -1,747 23,630 125,655 - 156,160 8,573 164,733
*Accumulated value adjustments includes foreign currency translation reserve, reserve for bonds at fair value through other c omprehensive income (FVOCI) and valuation reserve.
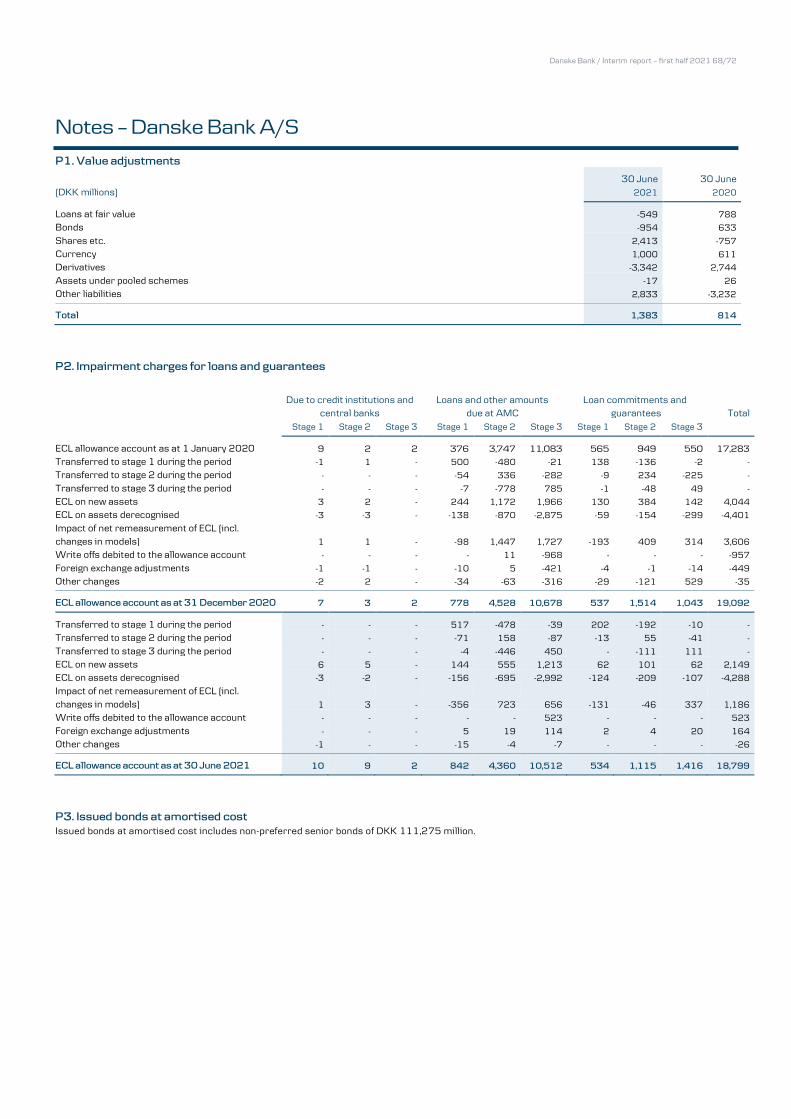
Danske Bank / Interim report – first half 2021 68/72
Notes – Danske Bank A/S
P1. Value adjustments
30 June 30 June (DKK millions) 2021 2020
Loans at fair value -549 788
Bonds -954 633
Shares etc. 2,413 -757
Currency 1,000 611
Derivatives -3,342 2,744
Assets under pooled schemes -17 26
Other liabilities 2,833 -3,232
Total 1,383 814
P2. Impairment charges for loans and guarantees
Due to credit institutions and central banks
Loans and other amounts due at AMC
Loan commitments and guarantees Total
Stage 1 Stage 2 Stage 3 Stage 1 Stage 2 Stage 3 Stage 1 Stage 2 Stage 3
ECL allowance account as at 1 January 2020 9 2 2 376 3,747 11,083 565 949 550 17,283
Transferred to stage 1 during the period -1 1 - 500 -480 -21 138 -136 -2 -
Transferred to stage 2 during the period - - - -54 336 -282 -9 234 -225 -
Transferred to stage 3 during the period - - - -7 -778 785 -1 -48 49 -
ECL on new assets 3 2 - 244 1,172 1,966 130 384 142 4,044
ECL on assets derecognised -3 -3 - -138 -870 -2,875 -59 -154 -299 -4,401
Impact of net remeasurement of ECL (incl. changes in models) 1 1 - -98 1,447 1,727 -193 409 314 3,606
Write offs debited to the allowance account - - - - 11 -968 - - - -957
Foreign exchange adjustments -1 -1 - -10 5 -421 -4 -1 -14 -449
Other changes -2 2 - -34 -63 -316 -29 -121 529 -35
ECL allowance account as at 31 December 2020 7 3 2 778 4,528 10,678 537 1,514 1,043 19,092
Transferred to stage 1 during the period - - - 517 -478 -39 202 -192 -10 -
Transferred to stage 2 during the period - - - -71 158 -87 -13 55 -41 -
Transferred to stage 3 during the period - - - -4 -446 450 - -111 111 -
ECL on new assets 6 5 - 144 555 1,213 62 101 62 2,149
ECL on assets derecognised -3 -2 - -156 -695 -2,992 -124 -209 -107 -4,288
Impact of net remeasurement of ECL (incl. changes in models) 1 3 - -356 723 656 -131 -46 337 1,186
Write offs debited to the allowance account - - - - - 523 - - - 523
Foreign exchange adjustments - - - 5 19 114 2 4 20 164
Other changes -1 - - -15 -4 -7 - - - -26
ECL allowance account as at 30 June 2021 10 9 2 842 4,360 10,512 534 1,115 1,416 18,799
P3. Issued bonds at amortised cost
Issued bonds at amortised cost includes non-preferred senior bonds of DKK 111,275 million.
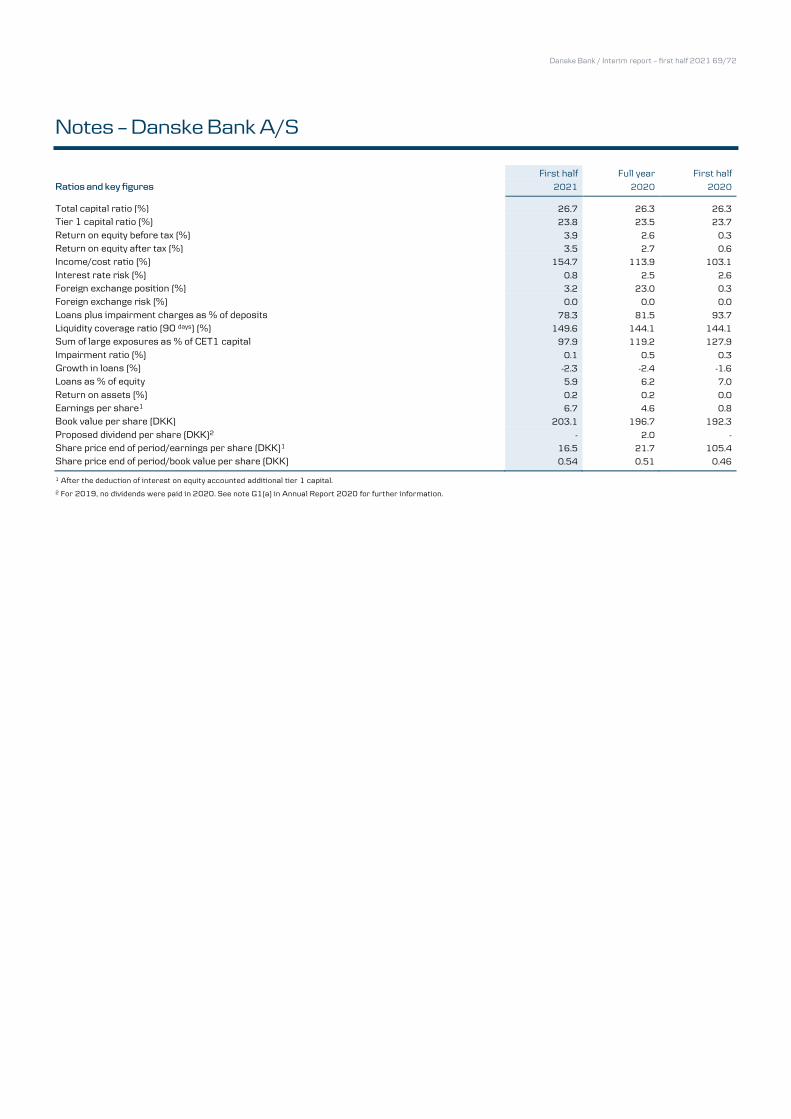
Danske Bank / Interim report – first half 2021 69/72
Notes – Danske Bank A/S
First half Full year First half Ratios and key figures 2021 2020 2020
Total capital ratio (%) 26.7 26.3 26.3
Tier 1 capital ratio (%) 23.8 23.5 23.7
Return on equity before tax (%) 3.9 2.6 0.3
Return on equity after tax (%) 3.5 2.7 0.6
Income/cost ratio (%) 154.7 113.9 103.1
Interest rate risk (%) 0.8 2.5 2.6
Foreign exchange position (%) 3.2 23.0 0.3
Foreign exchange risk (%) 0.0 0.0 0.0
Loans plus impairment charges as % of deposits 78.3 81.5 93.7
Liquidity coverage ratio (90 days) (%) 149.6 144.1 144.1
Sum of large exposures as % of CET1 capital 97.9 119.2 127.9
Impairment ratio (%) 0.1 0.5 0.3
Growth in loans (%) -2.3 -2.4 -1.6
Loans as % of equity 5.9 6.2 7.0
Return on assets (%) 0.2 0.2 0.0
Earnings per share1 6.7 4.6 0.8
Book value per share (DKK) 203.1 196.7 192.3
Proposed dividend per share (DKK)2 - 2.0 -
Share price end of period/earnings per share (DKK)1 16.5 21.7 105.4
Share price end of period/book value per share (DKK) 0.54 0.51 0.46
1 After the deduction of interest on equity accounted additional tier 1 capital.
2 For 2019, no dividends were paid in 2020. See note G1(a) in Annual Report 2020 for further information.
Danske Bank / Interim report – first half 2021 70/72
Statement by the management The Board of Directors and the Executive Leadership Team (the management) have considered and approved Interim report – first half 2021 of the Danske Bank Group. The consolidated interim financial statements have been prepared in accordance with IAS 34, Interim Financial Reporting, as adopted by the EU, and the Parent Company’s interim financial statements have been prepared in accordance with the Danish Financial Business Act. Furthermore, the interim report has been prepared in accordance with Danish disclosure requirements for interim reports of listed financial institutions. In our opinion, the interim financial statements give a true and fair view of the Group’s and the Parent Company’s assets, liabilities, total equity and financial position at 30 June 2021 and of the results of the Group’s and the Parent Company’s operations and the consolidated cash flows for the period starting on 1 January 2021 and ending on 30 June 2021. Moreover, in our opinion, the management’s report includes a fair review of developments in the Group’s and the Parent Company’s operations and financial position and describes the significant risks and uncertainty factors that may affect the Group and the Parent Company.
Copenhagen, 23 July 2021
Executive Leadership Team Carsten Rasch Egeriis CEO
Berit Behring Karsten Breum Stephan Engels
Glenn Söderholm Philippe Vollot Frans Woelders
Board of Directors
Karsten Dybvad Jan Thorsgaard Nielsen Carol Sergeant Chairman Vice Chairman Vice Chairman
Martin Blessing Lars-Erik Brenøe Raija-Leena Hankonen
Bente Avnung Landsnes Bente Bang Kirsten Ebbe Brich Elected by the employees Elected by the employees
Thorbjørn Lundholm Dahl Charlotte Hoffmann Elected by the employees Elected by the employees
Danske Bank / Interim report – first half 2021 71/72
Independent auditors’ review report To the shareholders of Danske Bank A/S Independent auditors’ review report on the consolidated and parent interim financial statements We have reviewed the consolidated and parent interim financial statements of Danske Bank A/S for the financial period 1 January to 30 June 2021, pp. 25-69 which comprise the income statement, statement of comprehensive income, balance sheet, statement of capital and notes, for the Group and Parent Company, respectively, as well as the consolidated cash flow statement. Management’s responsibility for the consolidated and parent interim financial statements Management is responsible for the preparation of the consolidated interim financial statements in accordance with IAS 34 Interim Financial Reporting as adopted by the EU and Danish disclosure requirements for listed financial companies and for the preparation of the Parent Company’s interim financial statements in accordance with the Danish Financial Business Act and Danish disclosure requirements for listed financial companies, and for such internal control as Management determines is necessary to enable the preparation of the consolidated and parent interim financial statements that are free from material misstatement, whether due to fraud or error. Auditors’ responsibility Our responsibility is to express a conclusion on the consolidated and parent interim financial statements. We conducted our review in accordance with the International Standard on Engagements to Review Interim Financial Information Performed by the Independent Auditor of the Entity and additional requirements under Danish audit regulation. This requires that we express a conclusion about whether anything has come to our attention that causes us to believe that the consolidated and parent interim financial statements, taken as a whole, have not been prepared, in all material respects, in accordance with the applicable financial reporting framework. This also requires us to comply with relevant ethical requirements. A review of financial statements in accordance with the International Standard on Engagements to Review Interim Financial Information Performed by the Independent Auditor of the Entity is a limited assurance engagement. The auditor performs procedures primarily consisting of inquiries of management and others within the entity, as appropriate, and applying analytical procedures, and evaluates the evidence obtained. A review is substantially less in scope than an audit performed in accordance with International Standards on Auditing. Accordingly, we do not express an audit opinion on the consolidated and parent interim financial statements. Conclusion Based on our review, nothing has come to our attention that causes us to believe that the consolidated interim financial statements for the financial period 1 January to 30 June 2021 have not been prepared, in all material respects, in accordance with IAS 34 Interim Financial Reporting as adopted by the EU and Danish disclosure requirements for listed financial companies, and that the Parent Company’s Interim Financial Statements have not been prepared, in all material respects, in accordance with the Danish Financial Business Act and Danish disclosure requirements for listed financial entities. Emphasis of matter We draw attention to note G9 to the consolidated interim financial statements that includes a description of the contingent liability regarding the uncertainty as to the outcome of the investigations by the authorities in Estonia, Denmark, France and the USA into the terminated non-resident portfolio at Danske Bank’s Estonian Branch. We agree to the accounting treatment of this matter in the consolidated interim financial statements, and accordingly our conclusion is not modified.
Copenhagen, 23 July 2021
Deloitte Statsautoriseret Revisionspartnerselskab
Business Registration No. 33 96 35 56
Kasper Bruhn Udam Jens Ringbæk State-Authorised
Public Accountant Identification No
(MNE) mne29421
State-Authorised Public Accountant
Identification No (MNE) mne27735
Danske Bank / Interim report – first half 2021 72/72
Supplementary information Financial calendar
29 October 2021 3 February 2022 17 March 2022 29 April 2022 22 July 2022 28 October 2022
Interim report – first nine months 2021 Annual Report 2021 Annual general meeting Interim report – first quarter 2022 Interim report – first half 2022 Interim report – first nine months 2022
Contacts
Stephan Engels
Chief Financial Officer
+45 45 14 60 02
Claus Ingar Jensen Head of Investor Relations
+45 45 12 84 83
Links
Danske Bank’s financial statements are available online at danskebank.com/Reports.
Danske Bank
danskebank.com
Denmark danskebank.dk
Finland danskebank.fi
Sweden danskebank.se
Norway danskebank.no
Northern Ireland danskebank.co.uk
Ireland danskebank.ie
Realkredit Danmark rd.dk
Danske Capital danskecapital.com Danica Pension danicapension.dk