Management skill, entrepreneurial mindset, and enterprise ... · PDF fileManagement skill,...
36
1 Management skill, entrepreneurial mindset, and enterprise survival: Evidence from randomized experiments and repeated surveys in Vietnam Yuki Higuchi a , Vu Hoang Nam b , and Tetsushi Sonobe c a. Nagoya City University, Nagoya, Japan b. Foreign Trade University, Hanoi, Vietnam c. National Graduate Institute for Policy Studies, Tokyo, Japan (This version: October 2017, Very preliminary) Abstract We conducted randomized experiments to provide management training for 312 Vietnamese small manufacturers in 2010 and repeatedly collected follow-up data in 2011, 2013, and 2016. Analyzing panel data constructed from our surveys with negligible incidence of attrition (less than 2 percent of the baseline sample), we find that the treated enterprises were 17 percentage points more likely to continue business five years after the training, when a five-year survival rate among the control group was 52 percent. In addition, the treated enterprises, particularly a sub-group that received both classroom and on-site training programs, had significantly higher business performance than the control group. Mediation analysis suggests that the higher business performance was due to sustainably improved management skill and change in entrepreneurial mindset. Keywords: Management training, Kaizen, Small and medium enterprises, Vietnam, Asia JEL classification: L2, M1, O1 Acknowledgement: We would like to thank Yutaka Arimoto, Jun Goto, Ryo Kambayashi, Yoko Kijima, Hisaki Kono, Yukichi Mano, Kazuya Masuda, Peter Martinsson, Tomoya Matsumoto, Keijiro Otsuka, Saumik Paul, Long Q. Trinh, Marcella Veronesi, and Naoyuki Yoshino for helpful comments and suggestions. This research was supported by the World Bank Japan PHRD Trust Fund No. TF096317, JSPS KAKENHI Grant Numbers 25101002 and 15H06540, and Grant-in-Aid for Research in Nagoya City University. The usual disclaimers apply.
Transcript of Management skill, entrepreneurial mindset, and enterprise ... · PDF fileManagement skill,...
1
Management skill, entrepreneurial mindset, and enterprise survival:
Evidence from randomized experiments and repeated surveys in Vietnam
Yuki Higuchia, Vu Hoang Namb, and Tetsushi Sonobec
a. Nagoya City University, Nagoya, Japan
b. Foreign Trade University, Hanoi, Vietnam
c. National Graduate Institute for Policy Studies, Tokyo, Japan
(This version: October 2017, Very preliminary)
Abstract
We conducted randomized experiments to provide management training for 312
Vietnamese small manufacturers in 2010 and repeatedly collected follow-up data in 2011,
2013, and 2016. Analyzing panel data constructed from our surveys with negligible
incidence of attrition (less than 2 percent of the baseline sample), we find that the treated
enterprises were 17 percentage points more likely to continue business five years after
the training, when a five-year survival rate among the control group was 52 percent. In
addition, the treated enterprises, particularly a sub-group that received both classroom
and on-site training programs, had significantly higher business performance than the
control group. Mediation analysis suggests that the higher business performance was due
to sustainably improved management skill and change in entrepreneurial mindset.
Keywords: Management training, Kaizen, Small and medium enterprises, Vietnam, Asia
JEL classification: L2, M1, O1
Acknowledgement: We would like to thank Yutaka Arimoto, Jun Goto, Ryo Kambayashi,
Yoko Kijima, Hisaki Kono, Yukichi Mano, Kazuya Masuda, Peter Martinsson, Tomoya
Matsumoto, Keijiro Otsuka, Saumik Paul, Long Q. Trinh, Marcella Veronesi, and
Naoyuki Yoshino for helpful comments and suggestions. This research was supported by
the World Bank Japan PHRD Trust Fund No. TF096317, JSPS KAKENHI Grant
Numbers 25101002 and 15H06540, and Grant-in-Aid for Research in Nagoya City
University. The usual disclaimers apply.
2
I. Introduction
The management score developed by Bloom and van Reenen (2007) and subsequent
studies and several randomized controlled trials (RCTs) of management training have
confirmed a long-standing suspicion that management tends to be poor in developing
countries. Hence, a question arises as to whether improvement in management practices
increases business performance. In a survey of RCTs of management training, McKenzie
and Woodruff (2014) pointed out that evidence on this issue has so far been weak. Few
studies found statistically significant impacts of experimental training programs on
business performance of treated firms, and researchers are yet to arrive at a consensus on
why training impacts on business are limited. Are they due to inadequately designed
training programs, too early assessment of training impacts, or knowledge spillovers form
training participants to non-participants?
This study attempts at providing a partial answer, particularly to a question of
whether training impact on business performance dissipates or enhances over time, based
on RCTs of management training that we conducted in Vietnam. Our previous studies
(Higuchi, Nam et al. 2015; Higuchi, Mhede et al. 2016) found that training impact on
value added emerged over time, suggesting that training impact in the existing studies is
evaluated too soon. In this paper, we further extend the follow-up observation period to
evaluate training impact over five years.
We conducted a baseline survey of 312 small manufacturers in two industrial
clusters in the suburbs of Hanoi, Vietnam, in early 2010, and then assigned them randomly
to treatment and control groups. Our training program had classroom and on-site
components. Classroom training participants learned from trainers about good
3
management practices for about 40 hours in total. On-site training participants had the
trainers visited their workshops several times and received concrete advice on how to
improve efficiency and safety at work. Follow-up surveys were conducted in 2011, 2013,
and 2016 to collect data of management practices at that point in time as well as annual
values of production and costs in the previous calendar year.
Based on panel data constructed by our surveys, we found that three treatment
groups (i.e. those invited to either component or to both training components) were on
average 17 percentage points more likely to continue business five years after the
intervention, when a five-year survival rate among the control group was 52 percent. This
was not influenced by systematic attrition from the survey because we tracked almost all
the sample enterprises including the exit ones and the incidence of attrition at the latest
survey was less than 2% of the baseline sample. In addition, we found that the treated
enterprises, particularly a sub-group that received both classroom and on-site training
programs, had significantly higher business performance, measured in terms of value
added, sales revenue or profit, than the control group in the five-year interval.
In order to analyze the mechanism linking the training and business performance,
we conduct mediation analysis, which has increasingly been applied in empirical studies
(e.g., Dippel et al. 2017; Hicks and Tingley 2011; Imai et al. 2011). As a result, we found
that the higher business performance was due to sustainably improved management skill
and change in entrepreneurial mindset. The treated enterprises applied a significantly
greater number of good management practices soon after the training, which is consistent
with the existing studies, and more importantly, they continued to adopt these practices
five years after the intervention. In addition, they had significantly higher entrepreneurial
mindset score, which was constructed based on a number of questions, such as, whether
4
they wish to learn new business knowledge or whether they are confident in introducing
new product. Our data suggests that the entrepreneurial score was indeed correlated with
the real-world behaviour, such as, participation in management training (after our
training) and introduction of upgraded product.
This paper contributes to four strands of literature. Firstly, we provided evidence
on longer-term impact of management training, which was pointed out as one of the
important remaining questions in the literature of management training (McKenzie and
Woodruff, 2014). Consistent with a non-experimental evidence by Giorcelli (2016)
finding the positive training impacts fifteen years after the training, which targeted for
medium to large enterprises in Italy as part of the Marshall Plan, our experiment revealed
that management training can have longer-term impacts on small enterprises in today’s
emerging economy. Second, this paper sheds light on the mechanism through which
training intervention increases business performance, with particular focus on
entrepreneurial mindset. Our findings support a small but emerging literature on the
importance of motivational aspect in business success (e.g., Bruhn et al. 2017; Campos
et al. 2017; Lafortune et al. 2016).
Thirdly, our study contributes to an established literature on enterprise survival (e.g.,
Dunne et al. 1989; Evans 1987). In the empirical studies following these early theoretical
papers, the main explanatory variables of enterprise survival included enterprise size, age,
and human capital of entrepreneurs. We argue that management also matters in enterprise
survival because we found that managerial intervention helped the treated enterprises to
survive. Fourthly, this paper contributes to an emerging literature of identification of
gazelles, that is, enterprises with high growth potential (Diao et al. 2016; Fafchamps and
Woodruff 2016; Grimm et al. 2012; McKenzie 2017). The identification of gazelles is an
5
important policy agenda for allocating scarce business resource to promising enterprises.
Based on our finding that enterprises selectively decided to participate in the training (the
compliance rate for our classroom training was 47%) and that the training participants
indeed performed better in the five-year interval, we argue that provision of management
training can be used as a screening device for identifying high-performing enterprises.
The remainder of the paper is organized as follows. Section 2 describes the
experimental design and checks balance. Section 3 describes the empirical strategy and
presents the impact evaluation results while Section 4 summarizes the findings and
discusses implications for future studies.
II. Experimental Design
Study Sites and Sample Enterprises
Since our ultimate goal is to prescribe an effective policy toward income generation in
developing countries, we are interested in evaluating training impacts in industrial
clusters, which enjoy various benefits of agglomeration economies (Fujita et al. 1999).
Indeed, the vast majority of firms are located near other firms producing similar or related
products (e.g., Atkin et al. 2016; Sonobe and Otsuka 2011). Conducting an RCT of
management training in an industrial cluster has both advantages and disadvantages. A
major advantage is that sample enterprises face same prices of product, factors, and
intermediate inputs, and have same access to infrastructure because they produce same
products in geographical proximity. This reduces heterogeneity among sample firms,
thereby facilitating statistical inference.
A major disadvantage is that imitation is rampant in industrial clusters.
6
Management practices and business performance might improve for even those firms that
did not receive training, which would lead to an underestimation of training impacts
unless a special method of impact evaluation, such as one adopted by McKenzie and
Puerto (2017) for a large number of microenterprises is applied. Having said that
knowledge spillovers make impact evaluation difficult, we note that spillovers make
social benefit of the training greater than private benefit. Although there is suggestive
evidence for existence of the spillovers in our context, we have not applied any special
method, and hence, our results are likely to understate the training impacts.
The two industrial clusters in our study are selected from over two thousand village
industrial clusters throughout Vietnam which have spontaneously developed and
produced traditional craft items (JICA 2004)1. These clusters have contributed to rapid
economic growth since 1986 when Vietnamese economy was liberalized by Doi Moi
(Renovation) policy (Oostendorp et al. 2009). In 2007, Nam et al. (2009; 2010) conducted
enterprise surveys in two of these clusters that have successfully started producing
modernized items. We chose the two clusters as our experiment sites partly because of
existing rapport, and partly because they were representative clusters of modern products
in semi-urbanized areas in Vietnam in terms of the number of firms, the employment size
per firm, and some other aspects.
The two clusters are located in the suburbs of Hanoi about 15km from the city
center but in different directions: one cluster in Bac Ninh province has produced steel
products and the other in Ha Tay province has produced knitwear and garment products.
In the steel cluster, Nam et al. (2009) surveyed 204 enterprises randomly selected from
372 enterprises that were in a list provided by the commune government office in 2007,
1 See Higuchi et al. (2015) for more detail description of the two industrial clusters in our study.
7
and we found that, among the 204 enterprises, 155 were still in operation before the
training intervention in 2010. This 155 enterprises consist our baseline sample steel
manufacturers in this study. In the knitwear cluster, Nam et al. (2010) surveyed a total of
138 enterprises in operation in 2007, even though the collected data were lost due to an
accident in late 2008. According to a new list complied in 2010 by the commune
government office, the total number of knitwear enterprises was 161, all of which consist
our baseline sample knitwear manufacturers. Just before our management training
programs started in 2010, baseline surveys were conducted in the two clusters.
Experimental Intervention and Timeline
A typical sample enterprise under our study employs about 20 workers. When a firm has
no employees, what business owner/managers must know about management would be
their self-management, financial management, and marketing. When a firm has many
employees, they need to know how to coordinate the division of labor as well. Thus, our
experimental training programs covered not only basic accounting, marketing, and
business strategy as often adopted in the existing studies (McKenzie and Woodruff, 2014),
but also elementary training in Kaizen management. Kaizen is an approach to production
management and quality control, aimed at improving the coordination among workers
(Imai 2012). We made a contract with a business consulting firm in Japan to dispatch a
Kaizen expert to our study sites. We also hired a local consultant, who was qualified as a
master trainer of the International Labor Organization’s (ILO) Start/Improve Your
Business (SIYB) training, and her co-trainer. The Kaizen expert taught the local
consultants in English, and the latter taught in the local language the training participants.
Bloom et al. (2013) found that an extensive training program featuring lean
8
manufacturing, an American version of Kaizen, was effective in improving management
practices and productivity at medium-sized textile plants in India. It remains an open
question whether less expensive, shorter-term training programs can have favorable and
sustained impacts on small-sized enterprises.
In the two clusters, the training programs had two components: one offered
classroom lectures for 2.5 hours a day, five days a week over a three-week span (total
about 40 hours), and the other sent trainers to participants several times to provide
coaching tailored to respective firms. In each of the two study sites, the sample was
randomly divided in half, and one-half was invited to participate in the classroom training
component. From among the classroom training participants, the team of instructors
selected two enterprises in each cluster to make them model enterprises, which served as
showcases of Kaizen practices. At the selected four enterprises, the instructor team
convinced the owner/managers to change the layout of their workshops.
Subsequently, stratified by the invitation status to the classroom training, the
sample was further randomly divided in half, and only half was invited to the on-site
training component. On-site training began with a one-day seminar, in which the model
enterprise owner/managers gave presentations about their enterprises’ physical changes
and the responses from their workers as well as their own opinions. After the seminar, the
instructor team visited each participants’ enterprises at least two times depending on the
availability and willingness of the participants to demonstrate how to encourage workers
to improve their work environment, productivity, and product quality. The four model
enterprises were not randomly selected as they were required to be willing to showcase
their changed workshop and to have enough space to welcome on-site training
participants to observe the changes, we exclude these enterprises from the empirical
9
analyses below.
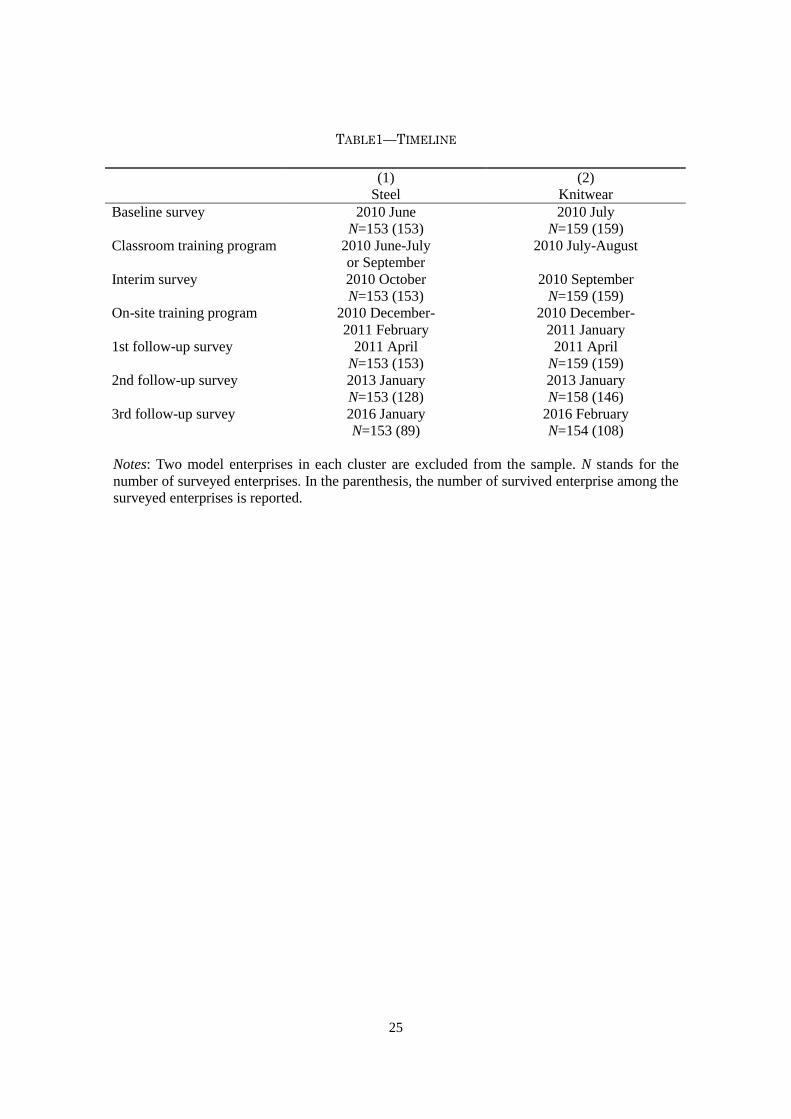
The two training programs were implemented in 2010, and an interim survey was
conducted after the classroom training but before the on-site training. After the
completion of the on-site training program, three follow-up surveys were conducted from
early 2011 through early 2016. Timeline of the training programs and surveys is presented
in Table 1, and the latest follow-up survey allows us to evaluate training impacts five
years after the intervention.
Randomization and Balance
We group the total of 312 baseline samples (153 in the steel cluster and 159 in the knitwear
cluster after excluding the four model enterprises) into three treatment groups and a
control group. The first treatment group was invited to both classroom and on-site training
programs and labeled as “Class + Onsite” Group, while the second and third were invited
only to either the classroom or the on-site program and labeled “Class-only” group and
“Onsite-only” Group, respectively. “Control” Group was invited to neither of the
programs. The sample size of each group is shown in the bottom of Table 2. Note that the
number of samples in each group is unbalanced. Since we had found that their ex ante
willingness to participate in the training was not high, we decided to invite more than half
of the baseline sample to the classroom training. After the classroom training, we
stratified the sample by the classroom invitation status and invited randomly selected
enterprises from both strata to the on-site training. Given the budget constraint and limited
number of enterprises to be selected as on-site training recipients, we assigned a larger
share to the stratum that were invited to the classroom training so that we can have a
certain number of enterprises who would receive both components of the training. Hence,
10
the number of enterprises in “Onsite-only” Group is particularly small.
While 108 enterprises in the steel cluster were invited to the classroom training
program, 41 enterprises actually participated. In the knitwear cluster, 89 enterprises were
invited, and 52 enterprises actually participated. We issued a certificate to the enterprises
that participated for at least ten days of the classroom training out of the total 15 days. We
define only the certificate holders as classroom training participants. The take-up rate was
38 percent and 58 percent in the steel and knitwear clusters, respectively2. By contrast,
the take-up rate of the on-site training was 100 percent in both clusters because no
enterprise refused to accept the consultants’ visits. There were no uninvited participants
in any training program.
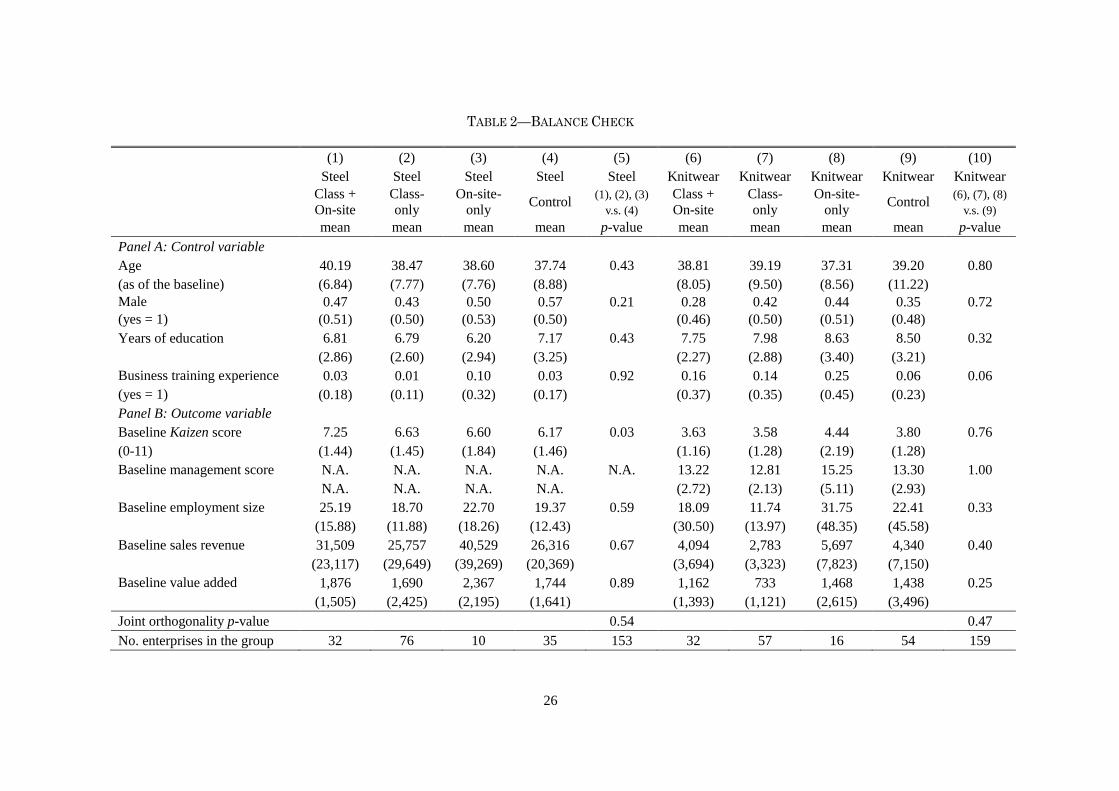
Table 2 presents the means and standard deviations of control variables (i.e., sample
owner/managers’ characteristics) and baseline outcome variables by treatment status and
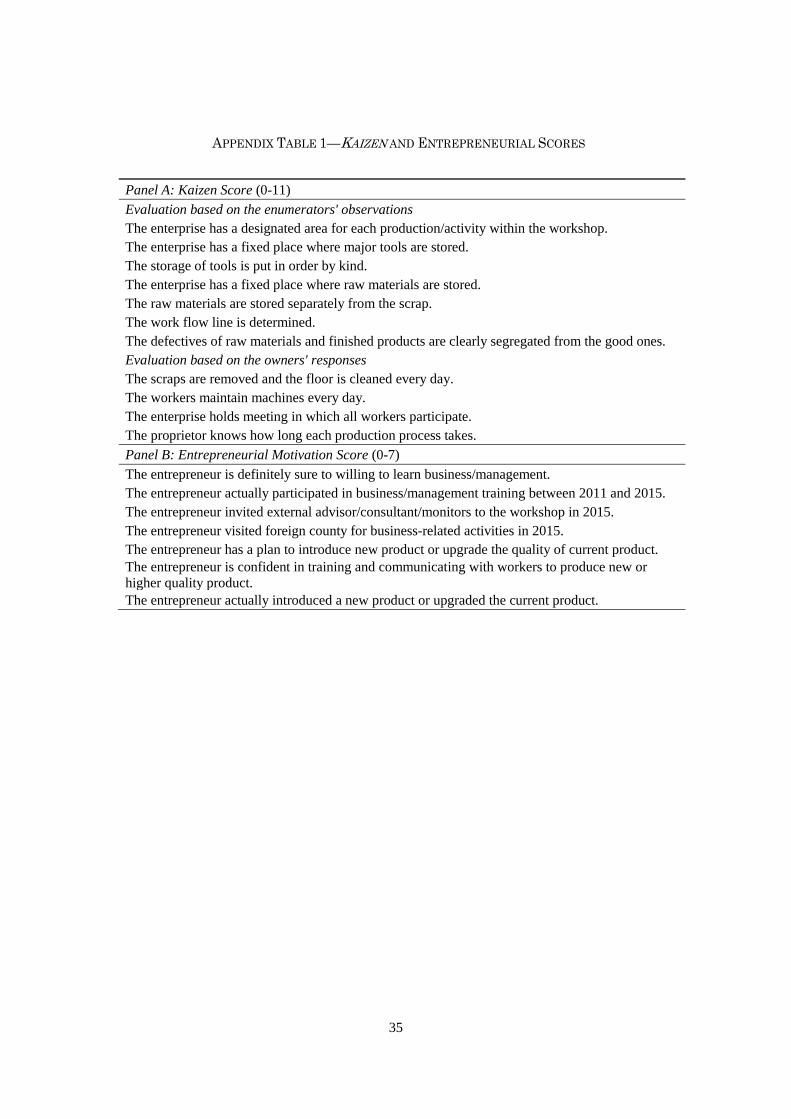
by cluster. Our outcome variables include Kaizen score, which is the number of
production management practices adopted and represents the basic skills in production
management (see Panel A in Appendix Table 1 for all 11 diagnostic criteria on which the
score is based)3, overall management score similar to the one developed by McKenzie
and Woodruff (2016)4, employment size in terms of the number of workers, and real
2 Four steel enterprises and 16 knitwear enterprises participated for less than ten days. Thus, the take up
rate for at least one classroom training was 42 percent in the steel cluster and 74 percent in the knitwear
cluster. 3 During our survey, enumerators visited each sample enterprise and judged whether the enterprise met
each criterion based on either the enumerators’ visual inspection or the owner’s way of responding to their
questions. The Kaizen score of an enterprise is the number of the diagnostic criteria that the enterprise was
found to meet, and, hence, the lowest possible value is zero and the highest is 11. The score should be high
if Kaizen is well established. Because Kaizen is a common-sense approach, some enterprises may have
adopted some Kaizen practices and get somewhat relatively high scores without knowing that those
practices are part of Kaizen. In the steel cluster, the baseline Kaizen score was collected at the time of
interim survey due to time constraint which enabled us to conduct only a short baseline survey. In the
interim survey, we collected information of their production management practices at the time of the interim
survey as well as retrospective information on the practices adopted before the classroom training. 4 Note that the diagnostic criteria was changed in the 3rd follow-up survey. In the 3rd follow-up survey,
we strictly followed McKenzie and Woodruff (2016) and asked 26 questions to elicit the number of adopted
questions. In the baseline, 1st, and 2nd follow-up surveys, the score ranges from 0 to 30 while it ranges
11
annual values of sales revenue and value added, which is defined as sales revenue minus
various costs except for labor cost.5
Columns 5 and 10 report p-values from the t-test for the null hypothesis that the
mean values are the same between the control group and the treatment groups (i.e.,
Class+Onsite, Class-only, and Onsite-only Groups pooled). To the extent that p-value is
insignificant (except for prior training experience in the knitwear cluster and baseline
Kaizen score in the steel cluster)6, control variables and baseline outcome variables are
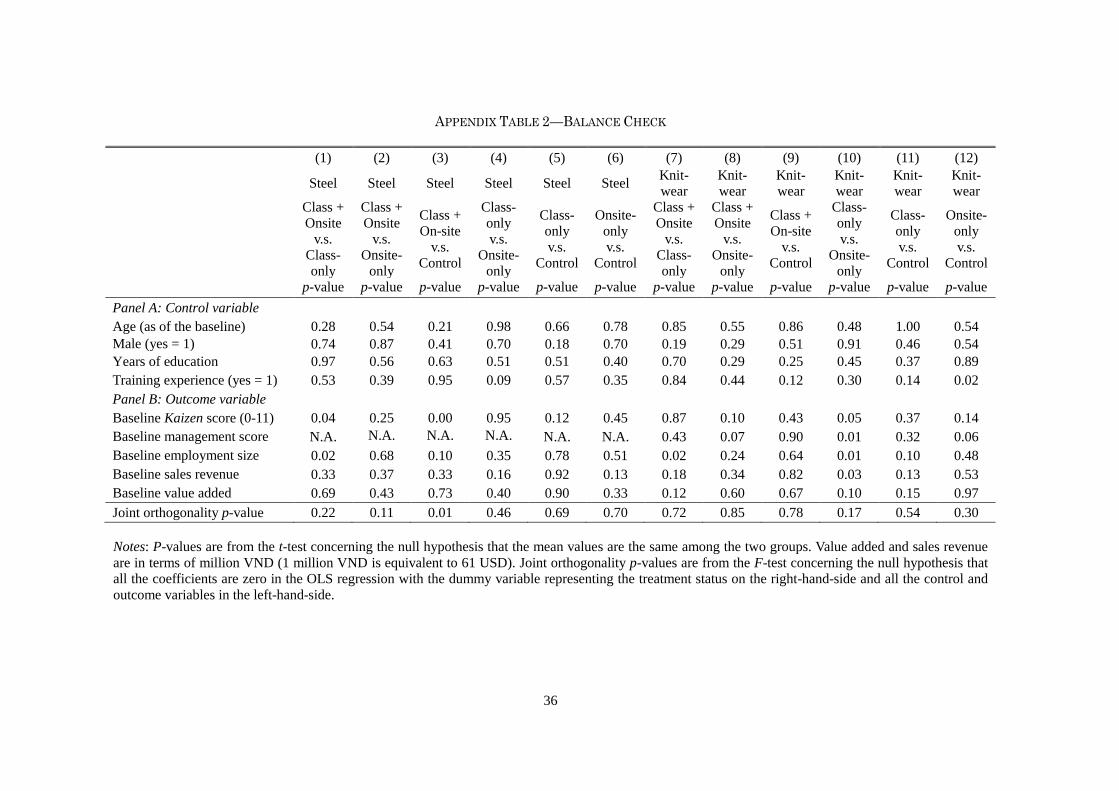
balanced (see Appendix Table 2 for the p-values from pairwise comparison of all the
possible pairs among the four groups). In addition, p-values from the joint orthogonality
test, which is from F-test concerning the null hypothesis that all the coefficients are zero
in an OLS regression with the dummy variable representing the treatment status on the
right-hand-side and all the control and baseline outcome variables in the left-hand-side,
are reported toward the bottom of Table 2 (see Appendix Table 2 for corresponding p-
values for the pairwise comparison). The insignificant p-values suggest that the
assignment of intervention was random.
III. Results
from 0 to 26 in the 3rd follow-up survey. The correlation coefficient of the original management score in
the 2nd follow-up survey and the score based on McKenzie and Woodruff (2016) in the 3rd follow-up
survey was 0.74. In the steel cluster, due to the reasons described in the footnote 4, we did not collect overall
management score in the baseline survey (see Table 2). 5 The data on these baseline values are recall data collected in the baseline survey. For the knitwear
enterprises, the baseline values are the averages of real annual values in 2008 and 2009. The average is
taken to reduce noise in the data, following the lead of McKenzie (2012). For the steel enterprises, the
baseline values are real value of 2009. 6 As described in the footnote 4, the baseline Kaizen score in the steel cluster was retrospectively collected
at the time of the interim survey. The score of the treatment group may have been over-reported, referencing
the improved production management practices after the classroom training. Such bias of “shoestring”
retrospective data collection was reported by Ravallion (2014).
12
Outcome Variables
In addition to the outcome variables presented in Panel B of Table 2, our variables of
interest include a survival dummy and an entrepreneurial mindset score. Table 1 shows
the number of surviving enterprises in the parenthesis. As we define enterprises as
surviving if they had any production in the previous calendar year, all of our sample
enterprises were considered as surviving at the time of 1st follow-up survey. In the 2nd
follow-up survey, 25 enterprises in the steel cluster and 13 enterprises in the knitwear
cluster had no production in 2012 and thus were considered exit enterprises. Therefore,
the number of surviving enterprises was 128 in the steel cluster and 146 in the knitwear
cluster, and the corresponding survival rate was 84 percent and 92 percent. Similarly, 64
steel enterprises and 46 knitwear enterprises had no production in 2015 and thus are
defined as exit ones. The number of surviving enterprises five years after the training
intervention was 89 in the steel cluster and 108 in the knitwear cluster, with the
corresponding survival rate of 58 percent and 68 percent. Note that a few enterprises that
had no production in 2012 re-started the production by 2015, and thus, were defined as
exit in the 2nd follow-up survey while as surviving at the 3rd follow-up survey.
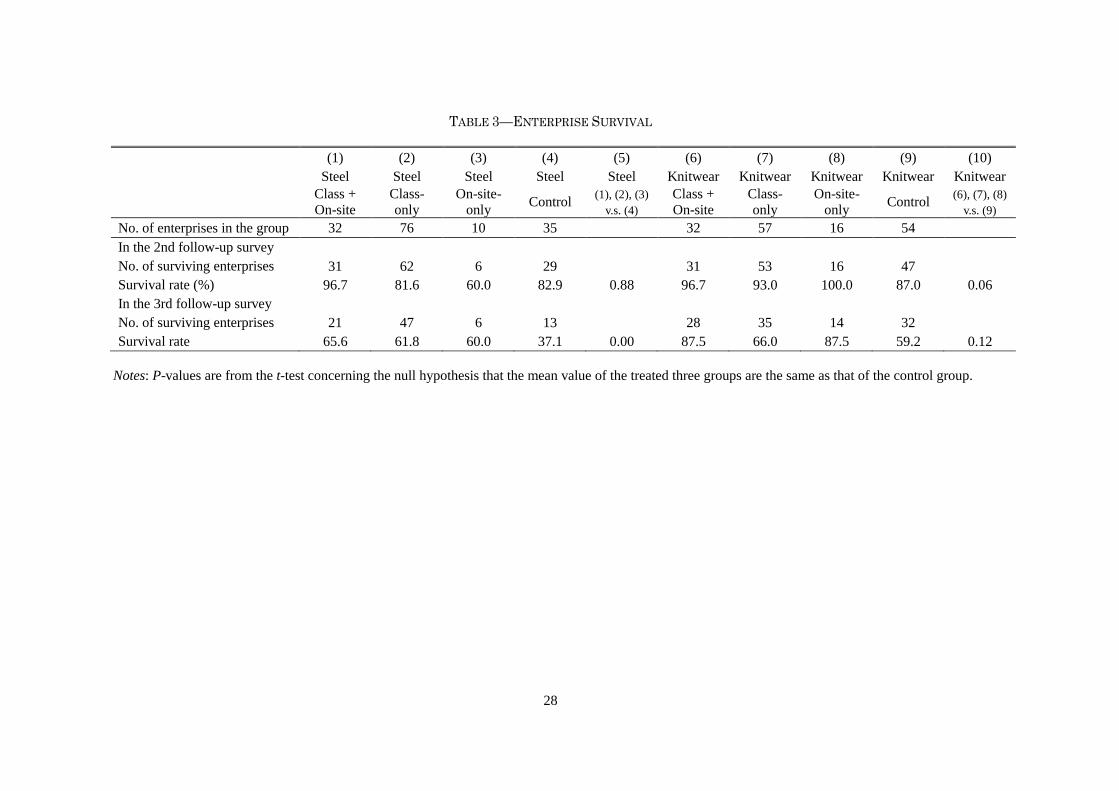
Table 3 shows the number of survival enterprises and survival rate by the treatment
status and by cluster in the same manner as Table 2. The survival rate of enterprises in
Class+Onsite Group at the 3rd follow-up survey was 66 percent and 88 percent in the
steel and knitwear cluster, respectively, whereas the corresponding survival rate among
the control Group was 37 percent and 59 percent. These differences suggest that the
training intervention had positive impacts on enterprise survival. Due to the differential
survival rates, we analyze the training impacts on business performance which is
conditional on survival as well as that on unconditional business performance by
13
assuming that exit enterprises had zero value added.
In order to examine mechanism linking the training intervention and business
performance, we analyze managerial skills and entrepreneurial mindset. Managerial skills
were measured using Kaizen and overall management scores as described in Section II.
In addition to the improvement in management capacity by training intervention, a
number of recent studies have found that entrepreneurial motivation is important
determinant of business success. For instance, Campos et al. (2017) and Lafortune et al.
(2016) found that a motivational intervention had positive impact on business
performance, which is of similar or even greater magnitude. Whereas these two studies
targeted microentrepreneurs in Togo and Chile, respectively, we examine entrepreneurial
motivation as a possible channel for business improvement among small and medium-
sized manufacturers. In order to quantify entrepreneurial mindset, we constructed an
entrepreneurial score, which is based on seven criteria listed in Panel B of Appendix Table
1.7 Admitting that some questions are sorely hypothetical about their attitude, other
questions were based on their real world behavior in business.
Empirical Specification
We first estimate the reduced-form impacts of the training on the outcome variables by
considering the following regression equation:
yit = α + βBOTHt Z
BOTHi + βCLASS
t ZCLASS
i + βONSITEt Z
ONSITEi + yi0 + ηt + εit. (1)
7 We have to note that most of these questions were newly added in the 3rd follow-up survey. The score at
the time of the 1st follow-up survey was sorely based on whether “The entrepreneur is definitely sure to
willing to learn business/management.” This information collected using certainty approach, however, was
proved to provide credible information on the attitude of respondents. We followed Blumenschein et al.
(2008) to ask a hypothetical question, followed by a question to ask whether the answer was “definitely or
probably sure.” The definitely sure answers were found to reasonably predict real-world behavior.
14
where yit is an outcome variable of enterprise i at the t-th round of the follow-up survey
or year t. ZBOTHi is a dummy variable indicating whether enterprise i was invited to both
components of the training program (i.e., whether the enterprise belongs to Class+Onsite
Group) or not, and similarly, ZCLASSi and ZONSITE
i is a dummy variable indicating whether
the enterprise belongs to Classroom-only Group or Onsite-only Group, respectively.
Since we expect the training effects to change over time, the coefficients on these
variables, βBOTHt, β
CLASSt, and βONSITE
t have subscript t. Taking advantage of the perfect
compliance of the on-site training and reasonably high compliance rate of the classroom
training, we report the estimated coefficients by the intention-to-treat (ITT) specification.
In the estimation of training impacts on business performance (i.e., conditional and
unconditional value added), we employ the ANCOVA estimator, which is more efficient
than the fixed-effect model estimator, according to McKenzie (2012) and subsequent
studies. Specifically, the right-hand side of equation (1) includes the baseline value of the
dependent variable, yi0. The baseline value in the knitwear cluster is the mean of the values
in 2008 and 2009 since the use of average baseline value improves efficiency (see the
footnote 5). The time effects common to all enterprises, ηt, are captured by time dummy
variables and the error term, εit, is clustered to control for autocorrelation within the
respective enterprises.
Next, in addition to the reduced-form estimation of the training impacts, we adopt
mediation analysis to shed light on possible mechanism through which the training
intervention improved business performance. Following Imai et al. (2011), we consider
yi as yi{Zi, Mi(Zi)}, where Zi is a binary treatment variable and Mi(Zi) is a mediator for
enterprise i under the treatment status Zi = z. In our context, Mi is management skills or
15
entrepreneurial mindset. The total treatment effect of Zi on yi can be expresses as {yi(Zi=1)
- yi(Zi=0)}, which can be further decomposed into
yi(1) - yi(0) = [yi{1, Mi(z)} - yi{0, Mi(z)}] + [yi{z, Mi(1)} - Yi{z, Mi(0)}], (2)
where the former term represents the direct effect of the treatment and the latter term
represents the mediation effect. The former includes all causal mechanism linking the
treatment to the outcome except for that through a mediating variable. Applying logic to
estimate average treatment effect in the potential outcome framework, our interest lies in
estimating the average direct effect (ADE), that is, E[yi{1, Mi(z)} - yi{0, Mi(z)}], and the
average causal mediation effect (ACME), E[yi{z, Mi(1)} - Yi{z, Mi(0)}.
According to Imai et al. (2011), sequential ignorability assumption is needed to
compute ADE and ACME, which can be formally expressed as;
{yi(z’, m), Mi(z)} ⊥ Zi|Xi=x
yi(z’, m) ⊥ Mi(z)|Zi=z, Xi=x . (3)
In our study, we used STATA “mediation” command developed by Hicks and Tingley
(2011). The command fits the following two equations and computes point estimates and
confidence intervals of ADE and ACME based on simulation;
Mi = α2 + β2 Zi + ξ2 Xi + εi2
yi = α3 + β3 Zi + γ Mi + ξ3 Xi + εi3. (4)
16
If the sequential ignorability assumption holds, the error terms εi2 and εi3 in equation (4)
are uncorrelated. This assumption, however, can never directly tested. Hence, the
command also conducts sensitivity analysis by shifting the correlation coefficient of error
terms εi2 and εi3 to identify a threshold value of the correlation coefficient at which ACME
becomes zero. The threshold value informs the extent to which the sequential ignorability
assumption can be relaxed.
Training Impacts
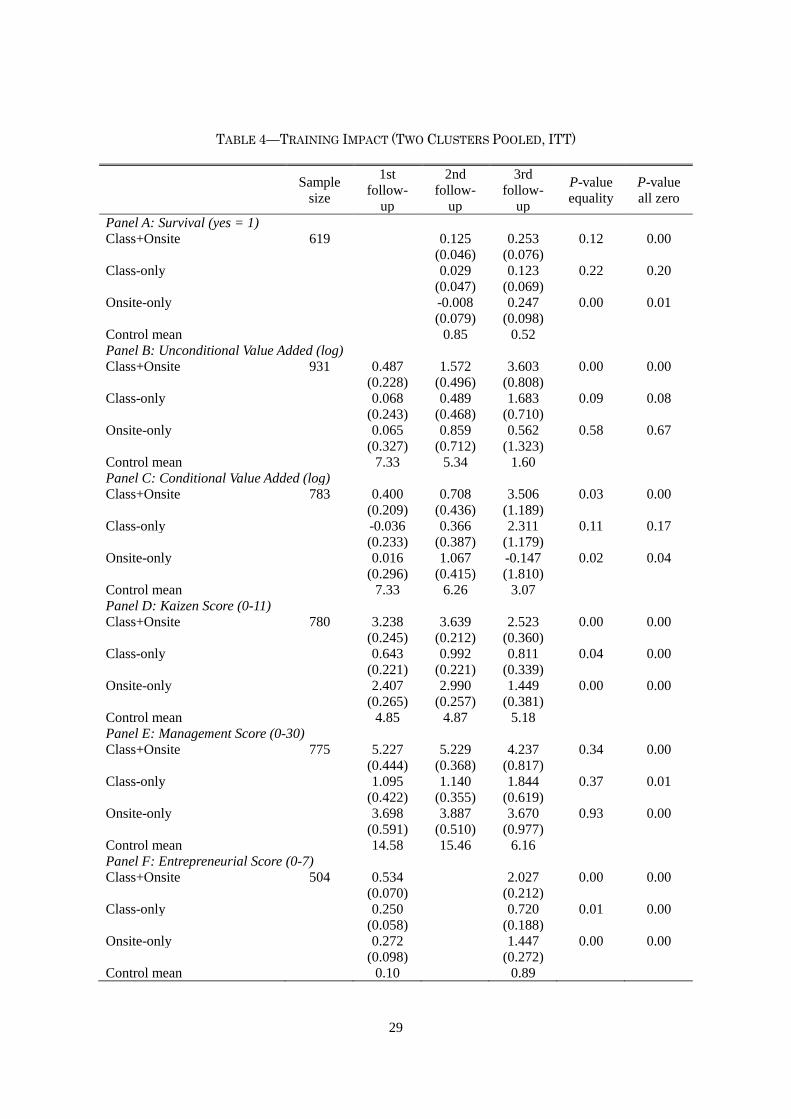
Table 4 presents the estimated training impacts by pooling the samples in the two clusters.
Consistent with Table 3, Panel A shows that the training had positive impacts on
enterprise survival. The enterprises invited to both component of the training were 12.5
percentage point more likely to continue business two years after the training intervention
and 25.3 percentage point more likely to do so five years after. P-values reported to the
right of the Table suggest that we can reject the null hypothesis that both of the
coefficients were jointly zero.
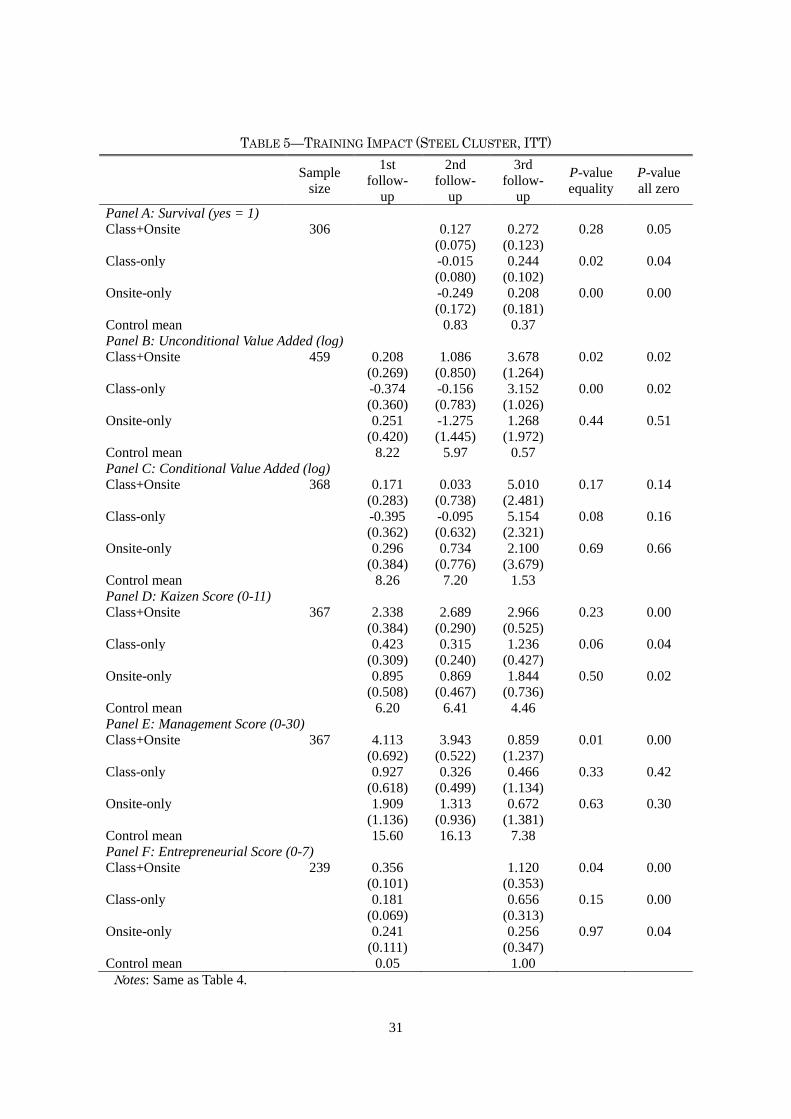
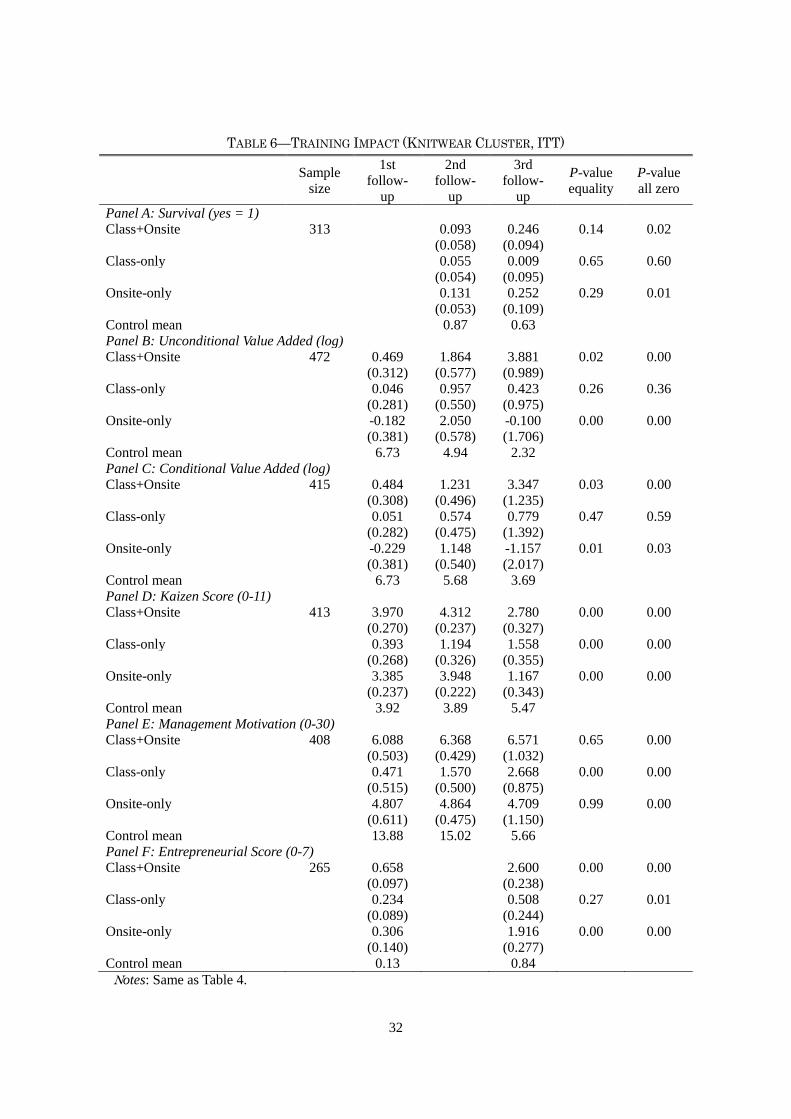
Tables 5 and 6 present separately estimated impacts in the steel cluster and in the
knitwear cluster, respectively. These Tables illustrate that the combination of two
component had largest impacts in both clusters, whereas the classroom component had
larger impacts than the on-site component in the steel cluster and the on-site training had
larger impacts than the classroom component in the knitwear cluster. We interpret that in
the steel cluster, where the bulky and heavy machines were used for production, it was
not easy for the instructor team to improve the production process of the treated
enterprises in the short span because it was difficult to change their workshop layout on
trial and error basis. Instead, abstract and systematic and knowledge on management and
17
business taught in the classroom training helped the treated enterprises to apply learned
knowledge in the long span. On the other hand, the on-site coaching was more effective
in the labor-intensive knitwear cluster, where changes in workshop layouts was relatively
easy. The team of instructors provided concrete and tailored advice on how to improve
productivity as well as on how to motivate and mobilize workers.
Next, we analyze the training impacts on business performance. Kaizen production
approach emphasizes reduction of cost for productivity improvement, and thus, the value
added is more likely to be improved by our training intervention than the sales revenue.8
As we have some enterprises with below zero value added or extremely large value added,
we transform the value added, following the lead of Burbidge et al. (1988), and define
log of value added as log{y + (y2 + 1)0.5}. In Tables 4 to 6, Panel B presents training
impacts on the unconditional value added whereas Panel C presents that on the
conditional value added. Our training, particularly the combination of classroom and on-
site training programs, had positive and significant impacts. As the training dramatically
increased the survival rate, the impacts were stronger on the unconditional value added
in which exit enterprises are assumed to have zero value added.
When we take a closer look, it took time for training impacts to emerge in the steel
cluster, where the classroom training vis-à-vis on-site training was useful, because the
training participants needed time to apply their abstract knowledge into their actual
business. The coefficients were not significant in the 1st or 2nd follow-up surveys but
became significant in the 3rd follow-up survey. This suggests that some of the existing
studies of training intervention evaluated impacts so early that they were yet to be realized
in business. In the knitwear cluster, we only find the sustained impacts among
8 Although we only report the results of value added, similar results were obtained for sales revenue and
profit.
18
Class+Onsite Group. We interpret that the tailored coaching helped the knitwear
enterprises to improve their business in the short span but only the hand-in technical
support did not sustainably improved their business performance. Instead, such hand-in
support had sustainable effects when combined with systematic knowledge on business
taught in the classroom training.
Mechanism
We find that the training significantly improved business of the treated enterprises, we
are now interested in mechanism. First, we consider management skills. In Tables 4 to 6,
Panel D presents results on Kaizen score whereas Panel E presents results on overall
management score. As it was not possible to collect information of adopted management
practices from exit enterprises, these Panels present the training impacts on management
skills only among the surviving enterprises. The most important finding is that the training
impacts on management were sustained in the 3rd follow-up survey. In particular, the
combination of the two component had largest impacts in both clusters. The enterprises
invited to both training components adopted 2.5 more Kaizen practices than the control
group five years after the training intervention.
In addition to the significantly improved management skills, Panel F shows that
entrepreneurial mindset significantly improved among the treated enterprises, particularly
among Class+Onsite Group. The enterprises in this group had 2.0 points higher
entrepreneurial score at the time of 3rd follow-up survey, when the control group average
was only 0.89. When we take a closer look, the combination had strongest impacts in both
clusters. In addition, the classroom training had effect in the steel cluster whereas the on-
site training had effect in the knitwear cluster, exhibiting the similar pattern as the training
19
impacts on business performance. This suggests that change in entrepreneurial motivation
was most likely to be the channel linking the training intervention and improved business
performance.
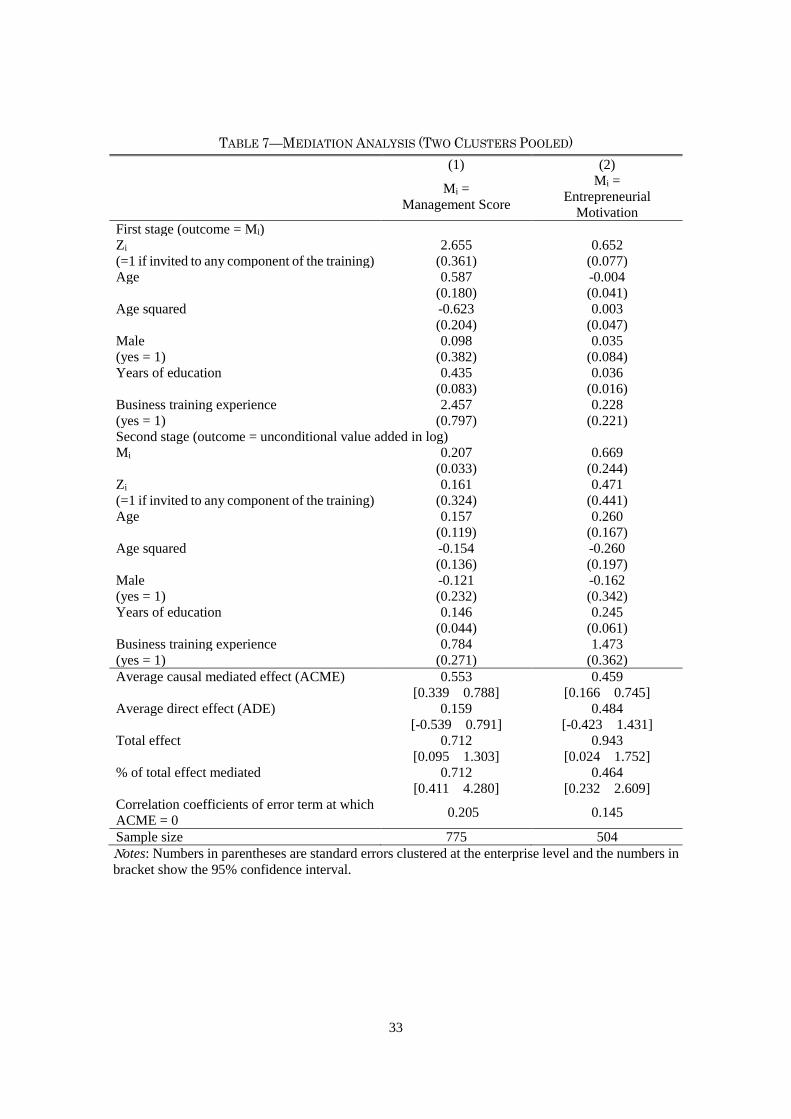
In order to formally examine the channel, Table 7 reports the results of mediation
analysis. Based on equation (4), we define the overall management score as a mediating
variable in column 1 whereas we define the entrepreneurial score as a mediating variable
in column 2. As our sample was too small for conducting simulation of hundreds times if
we split the sample into four groups, we simply split into the treatment group and the
control group as in columns 5 and 10 in Table 2. Hence, the reported results are the impact
of either or both component of our training programs. Toward the bottom of Table 7,
ACME of the management skills was estimated to be 0.55, accounting for 71.2% of the
total effect of training intervention on unconditional value added, whereas ACME of the
entrepreneurial mindset was estimated to be 0.46, accounting for 46.6% of the total effect.
Therefore, the results confirm that management skills and entrepreneurial mindset are the
mechanism through which the training improved business performance. Our sensitivity
analysis shows that the ACME are positive as long as the correlation coefficient between
error terms in equation (4) is less than 0.21 for the management skills and less than 0.14
for the entrepreneurial mindset score.
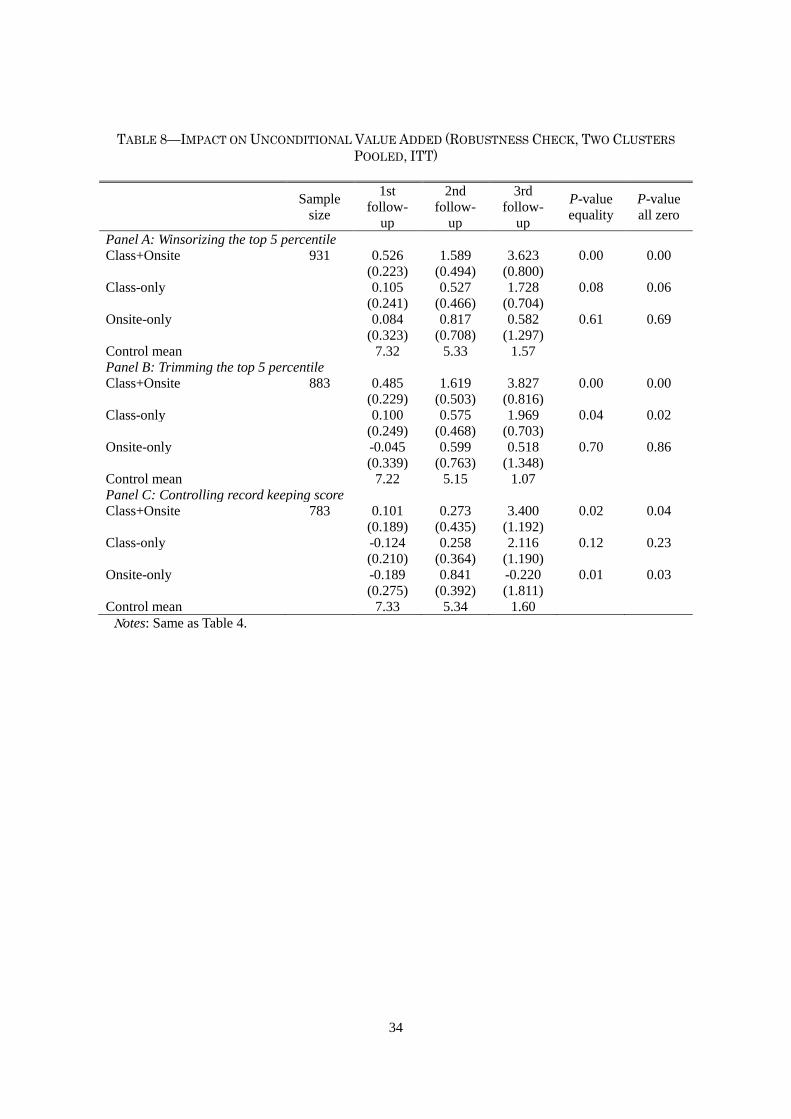
Robustness Check
Data on business performance is known as noisy and has large variance (de Mel et al.
2009). In order to control for the influence of outliers, Panel A and B in Table 8 report the
results by winsorizing and trimming the top 5 percentile of the distribution as a robustness
check for the impacts on the unconditional value added. As an alternative robustness
20
check for value added, Panel C reports the results with the record keeping score controlled
in the regression. The training participants may have come to pay more meticulous
attention to record keeping than the non-participants and became able to provide more
accurate information on their business. In order to control for such possibility of
systematic measurement errors, we followed the lead of de Mel et al. (2014) and added
the record keeping score as a control to the right-hand side of the otherwise same
regression equation. The estimated coefficients are similar in magnitude and statistical
significant as those reported in Table 4, hence, reinforcing our conclusion that the training
had sustained impacts on business performance.
IV. Conclusion
This study has taken advantage of the randomized design of training intervention and the
panel data covering five years to analyze longer-term impact of management training.
This paper has found that the Kaizen training had favorable effects on management
practices, and that these effects lasted at least for five years. In addition, training improved
the attitude and mindset of enterprises owner/managers, making it possible for them to
improve their business. Due to these long-term changes, the treated enterprises are more
likely to survive and have higher business performance than the control enterprises. Our
results suggest that managerial training intervention has impacts on enterprise dynamics
in a few years or possibly in a longer time span.
21
References
Atkin, D., Chaudhry, A., Chaudry, S., Khandelwal, A.K., Raza, T., Verhoogen, E., 2016.
On the origins and development of Pakistan’s soccer-ball cluster. World Bank
Economic Review, 30, s34-s41.
Bloom, N., Eifert, B., Mahajan, A., McKenzie, D., Roberts, J., 2013. Does management
matter? Evidence from India. Quarterly Journal of Economics, 128, 1-51.
Bloom, N., van Reenen, J., 2007. Measuring and explaining management practices across
firms and countries. Quarterly Journal of Economics, 122, 1341-1408.
Blumenschein, K., Blomquist, G.C., Johannesson, M., Horn, N., Freeman, P. 2008.
Eliciting willingness to pay without bias: Evidence from a field experiment.
Economic Journal, 118, 114-137.
Bruhn, M., Karlan, D., Schoar, A. 2017. The impact of consulting services on small and
medium enterprises. Journal of Political Economy, forthcoming.
Burbidge, J., Magee, L., Robb, A.L., 1988. Alternative transformations to handle extreme
values of the dependent variable. Journal of the American Statistical Association,
83, 123-127.
Campos, F., Frese, M.m Goldstein, M., Iacovone, L., Johnson, H.C., McKenzie, D.,
Mensmann, M., 2017. Teaching personal initiative beats traditional training in
boosting small business in West Africa. Science, 357, 1287-1290.
De Mel, S., McKenzie, D., Woodruff, C. 2009. Measuring microenterprise profits: Must
we ask how the sausage is made? Journal of Development Economics, 88, 19-32.
De Mel, S., McKenzie, D., Woodruff, C. 2014. Business training and female enterprise
start-up, growth, and dynamics: Experimental evidence from Sri Lanka. Journal of
22
Development Economics, 106, 199-210.
Diao, X., Kweka, J., McMillan, M. 2016. Economic transformation in Africa from the
bottom up: Evidence from Tanzania. NBER Working Paper 22889.
Dippel, C., Gold, R., Heblich, D., Pinto, R. 2017. Instrumental variable and causal
mechanisms: Unpacking the effect of trade on workers and voters. NBER Working
Paper 23209.
Dunne, T., Roberts, M.J., Samuelson, L. 1989. The growth and failure of U.S.
manufacturing plants. Quarterly Journal of Economics, 104, 671-698.
Evans, D.S. 1987. Tests of alternative theories of firm growth. Journal of Political
Economy, 95, 657-674.
Fafchamps, M., Woodruff, C. 2016. Identifying gazelles: Expert panels vs. surveys as a
means to identify firms with rapid growth potential. World Bank Economic Review,
forthcoming.
Fujita, M., Krugman, P.R., Venables, A.J., 1999. The Spatial Economy, Cities, Region and
International Trade. Cambridge MA: MIT Press.
Giorcelli, M. 2016. The long-term effects of management and technology transfers.
Mimeo.
Grimm, M., Knorringa, P., Lay, J., 2012. Constrained gazelles: High potentials in West
Africa’s informal economy. World Development, 40, 1352-1368.
Hicks, R., Tingley, D. 2011. Causal mediation analysis. Stata Journal, 11, 605-619.
Higuchi, Y., Mhede, E.P., Sonobe, T., 2016. Short- and medium-run impacts of
management training: An experiment in Tanzania. Mimeo.
Higuchi, Y., Nam, V.H., Sonobe, T., 2015. Sustained impacts of Kaizen training. Journal
of Economic Behavior and Organization, 120, 189-206.
23
Imai, M., 2012. Gemba Kaizen: A commonsense Approach to Continuous Improvement
Strategy, Second Edition. New York: McGraw-hill.
Imbens, G., Angrist, J., 1994. Identification and estimation of local average treatment
effects. Econometrica, 62, 467-476.
Imai, K., Keele, L., Tingley, D., Yamamoto, T. 2010. Unpacking the black box of
causality: Learning about causal mechanisms from experimental and observational
studies. American Political Science Review, 105, 765-789.
Lafortune, J., Riutort, J., Tessada, J. 2016. Are microentrepreneurs constrained by their
lack of knowledge or motivation? Lessons from a randomized experiment in Chile.
Mimeo.
McKenzie, D., 2012. Beyond baseline and follow-up: The case for more T in experiments.
Journal of Development Economics, 99, 210-221.
McKenzie, D. 2017. Identifying and spurring high-growth entrepreneurship:
Experimental evidence from a business plan competition. American Economic
Review, 107, 2278-2307.
McKenzie, D., Puerto, S. 2017. Growing markets through business training for female
entrepreneurs: A market-level randomized experiment in Kenya. World Bank
Policy Research Working Paper 7993.
McKenzie, D., Woodruff, C., 2014. What are we learning from business training and
entrepreneurship evaluations around the developing world? World Bank Research
Observer, 29, 48-82.
McKenzie, D., Woodruff, C., 2016. Business practices in small firms in developing
countries. Management Science, forthcoming.
Japan International Cooperation Agency (JICA), 2004. The Study on Artisan Craft
24
Development Plan for Rural Industrialization in the Socialist Republic of Vietnam.
Hanoi: JICA.
Nam, V.H., Sonobe, T., Otsuka, K., 2009. An inquiry into the transformation process of
village-based industrial clusters: the case of an iron and steel cluster in northern
Vietnam. Journal of Comparative Economics, 37, 568-581.
Nam, V.H., Sonobe, T., Otsuka, K., 2010. An inquiry into the development process of
village industries: the case of a knitwear cluster in northern Vietnam. Journal of
Development Studies, 46, 312-330.
Oostendorp, R.H., Trung, T.Q., Tung, N.T., 2009. The changing role of non-farm
household enterprises in Vietnam. World Development, 37, 632-644.
Ravallion, M. 2014. Can we trust shoestring evaluations? World Bank Economic Review,
28, 413-431.
Sonobe, T., Otsuka, K., 2011. Cluster-Based Industrial Development: A Comparative
Study of Asia and Africa. New York: Palgrave Macmillan.
25
TABLE1—TIMELINE
Notes: Two model enterprises in each cluster are excluded from the sample. N stands for the
number of surveyed enterprises. In the parenthesis, the number of survived enterprise among the
surveyed enterprises is reported.
(1) (2)
Steel Knitwear
Baseline survey 2010 June
N=153 (153)
2010 July
N=159 (159)
Classroom training program 2010 June-July
or September
2010 July-August
Interim survey 2010 October
N=153 (153)
2010 September
N=159 (159)
On-site training program 2010 December-
2011 February
2010 December-
2011 January
1st follow-up survey 2011 April
N=153 (153)
2011 April
N=159 (159)
2nd follow-up survey 2013 January
N=153 (128)
2013 January
N=158 (146)
3rd follow-up survey 2016 January
N=153 (89)
2016 February
N=154 (108)
26
TABLE 2—BALANCE CHECK
(1) (2) (3) (4) (5) (6) (7) (8) (9) (10)
Steel Steel Steel Steel Steel Knitwear Knitwear Knitwear Knitwear Knitwear
Class +
On-site
Class-
only
On-site-
only Control
(1), (2), (3)
v.s. (4)
Class +
On-site
Class-
only
On-site-
only Control
(6), (7), (8)
v.s. (9)
mean mean mean mean p-value mean mean mean mean p-value
Panel A: Control variable
Age 40.19 38.47 38.60 37.74 0.43 38.81 39.19 37.31 39.20 0.80
(as of the baseline) (6.84) (7.77) (7.76) (8.88) (8.05) (9.50) (8.56) (11.22)
Male 0.47 0.43 0.50 0.57 0.21 0.28 0.42 0.44 0.35 0.72
(yes = 1) (0.51) (0.50) (0.53) (0.50) (0.46) (0.50) (0.51) (0.48)
Years of education 6.81 6.79 6.20 7.17 0.43 7.75 7.98 8.63 8.50 0.32
(2.86) (2.60) (2.94) (3.25) (2.27) (2.88) (3.40) (3.21)
Business training experience 0.03 0.01 0.10 0.03 0.92 0.16 0.14 0.25 0.06 0.06
(yes = 1) (0.18) (0.11) (0.32) (0.17) (0.37) (0.35) (0.45) (0.23)
Panel B: Outcome variable
Baseline Kaizen score 7.25 6.63 6.60 6.17 0.03 3.63 3.58 4.44 3.80 0.76
(0-11) (1.44) (1.45) (1.84) (1.46) (1.16) (1.28) (2.19) (1.28)
Baseline management score N.A. N.A. N.A. N.A. N.A. 13.22 12.81 15.25 13.30 1.00
N.A. N.A. N.A. N.A. (2.72) (2.13) (5.11) (2.93)
Baseline employment size 25.19 18.70 22.70 19.37 0.59 18.09 11.74 31.75 22.41 0.33
(15.88) (11.88) (18.26) (12.43) (30.50) (13.97) (48.35) (45.58)
Baseline sales revenue 31,509 25,757 40,529 26,316 0.67 4,094 2,783 5,697 4,340 0.40
(23,117) (29,649) (39,269) (20,369) (3,694) (3,323) (7,823) (7,150)
Baseline value added 1,876 1,690 2,367 1,744 0.89 1,162 733 1,468 1,438 0.25
(1,505) (2,425) (2,195) (1,641) (1,393) (1,121) (2,615) (3,496)
Joint orthogonality p-value 0.54 0.47
No. enterprises in the group 32 76 10 35 153 32 57 16 54 159
27
Notes: Numbers in parentheses are standard deviations. P-values are from the t-test concerning the null hypothesis that the mean value of the treated three
groups are the same as that of the control group. Value added and sales revenue are in terms of million VND (1 million VND is equivalent to 61 USD). Joint
orthogonality p-values are from the F-test concerning the null hypothesis that all the coefficients are zero in the OLS regression with the dummy variable
representing the treatment status on the right-hand-side and all the control and outcome variables in the left-hand-side.
28
TABLE 3—ENTERPRISE SURVIVAL
(1) (2) (3) (4) (5) (6) (7) (8) (9) (10)
Steel Steel Steel Steel Steel Knitwear Knitwear Knitwear Knitwear Knitwear
Class +
On-site
Class-
only
On-site-
only Control
(1), (2), (3)
v.s. (4)
Class +
On-site
Class-
only
On-site-
only Control
(6), (7), (8)
v.s. (9)
No. of enterprises in the group 32 76 10 35 32 57 16 54
In the 2nd follow-up survey
No. of surviving enterprises 31 62 6 29 31 53 16 47
Survival rate (%) 96.7 81.6 60.0 82.9 0.88 96.7 93.0 100.0 87.0 0.06
In the 3rd follow-up survey
No. of surviving enterprises 21 47 6 13 28 35 14 32
Survival rate 65.6 61.8 60.0 37.1 0.00 87.5 66.0 87.5 59.2 0.12
Notes: P-values are from the t-test concerning the null hypothesis that the mean value of the treated three groups are the same as that of the control group.
29
TABLE 4—TRAINING IMPACT (TWO CLUSTERS POOLED, ITT)
Sample
size
1st
follow-
up
2nd
follow-
up
3rd
follow-
up
P-value
equality
P-value
all zero
Panel A: Survival (yes = 1)
Class+Onsite 619 0.125 0.253 0.12 0.00
(0.046) (0.076)
Class-only 0.029 0.123 0.22 0.20
(0.047) (0.069)
Onsite-only -0.008 0.247 0.00 0.01
(0.079) (0.098)
Control mean 0.85 0.52
Panel B: Unconditional Value Added (log)
Class+Onsite 931 0.487 1.572 3.603 0.00 0.00
(0.228) (0.496) (0.808)
Class-only 0.068 0.489 1.683 0.09 0.08
(0.243) (0.468) (0.710)
Onsite-only 0.065 0.859 0.562 0.58 0.67
(0.327) (0.712) (1.323)
Control mean 7.33 5.34 1.60
Panel C: Conditional Value Added (log)
Class+Onsite 783 0.400 0.708 3.506 0.03 0.00
(0.209) (0.436) (1.189)
Class-only -0.036 0.366 2.311 0.11 0.17
(0.233) (0.387) (1.179)
Onsite-only 0.016 1.067 -0.147 0.02 0.04
(0.296) (0.415) (1.810)
Control mean 7.33 6.26 3.07
Panel D: Kaizen Score (0-11)
Class+Onsite 780 3.238 3.639 2.523 0.00 0.00
(0.245) (0.212) (0.360)
Class-only 0.643 0.992 0.811 0.04 0.00
(0.221) (0.221) (0.339)
Onsite-only 2.407 2.990 1.449 0.00 0.00
(0.265) (0.257) (0.381)
Control mean 4.85 4.87 5.18
Panel E: Management Score (0-30)
Class+Onsite 775 5.227 5.229 4.237 0.34 0.00
(0.444) (0.368) (0.817)
Class-only 1.095 1.140 1.844 0.37 0.01
(0.422) (0.355) (0.619)
Onsite-only 3.698 3.887 3.670 0.93 0.00
(0.591) (0.510) (0.977)
Control mean 14.58 15.46 6.16
Panel F: Entrepreneurial Score (0-7)
Class+Onsite 504 0.534 2.027 0.00 0.00
(0.070) (0.212)
Class-only 0.250 0.720 0.01 0.00
(0.058) (0.188)
Onsite-only 0.272 1.447 0.00 0.00
(0.098) (0.272)
Control mean 0.10 0.89

30
Notes: Numbers in parentheses are standard errors clustered at the enterprise level. All regressions
control for the control variables listed in Panel A in Table 2, the knitwear cluster dummy, and the
survey round dummies as explanatory variables even though their estimated coefficients are not
reported. In Panels B and C, the baseline values of each dependent variable are also controlled. P-
values are for test that the treatment effect is equal in all the follow-up surveys; and that the treatment
effect is zero in all the follow-up surveys.
31
TABLE 5—TRAINING IMPACT (STEEL CLUSTER, ITT)
Sample
size
1st
follow-
up
2nd
follow-
up
3rd
follow-
up
P-value
equality
P-value
all zero
Panel A: Survival (yes = 1)
Class+Onsite 306 0.127 0.272 0.28 0.05
(0.075) (0.123)
Class-only -0.015 0.244 0.02 0.04
(0.080) (0.102)
Onsite-only -0.249 0.208 0.00 0.00
(0.172) (0.181)
Control mean 0.83 0.37
Panel B: Unconditional Value Added (log)
Class+Onsite 459 0.208 1.086 3.678 0.02 0.02
(0.269) (0.850) (1.264)
Class-only -0.374 -0.156 3.152 0.00 0.02
(0.360) (0.783) (1.026)
Onsite-only 0.251 -1.275 1.268 0.44 0.51
(0.420) (1.445) (1.972)
Control mean 8.22 5.97 0.57
Panel C: Conditional Value Added (log)
Class+Onsite 368 0.171 0.033 5.010 0.17 0.14
(0.283) (0.738) (2.481)
Class-only -0.395 -0.095 5.154 0.08 0.16
(0.362) (0.632) (2.321)
Onsite-only 0.296 0.734 2.100 0.69 0.66
(0.384) (0.776) (3.679)
Control mean 8.26 7.20 1.53
Panel D: Kaizen Score (0-11)
Class+Onsite 367 2.338 2.689 2.966 0.23 0.00
(0.384) (0.290) (0.525)
Class-only 0.423 0.315 1.236 0.06 0.04
(0.309) (0.240) (0.427)
Onsite-only 0.895 0.869 1.844 0.50 0.02
(0.508) (0.467) (0.736)
Control mean 6.20 6.41 4.46
Panel E: Management Score (0-30)
Class+Onsite 367 4.113 3.943 0.859 0.01 0.00
(0.692) (0.522) (1.237)
Class-only 0.927 0.326 0.466 0.33 0.42
(0.618) (0.499) (1.134)
Onsite-only 1.909 1.313 0.672 0.63 0.30
(1.136) (0.936) (1.381)
Control mean 15.60 16.13 7.38
Panel F: Entrepreneurial Score (0-7)
Class+Onsite 239 0.356 1.120 0.04 0.00
(0.101) (0.353)
Class-only 0.181 0.656 0.15 0.00
(0.069) (0.313)
Onsite-only 0.241 0.256 0.97 0.04
(0.111) (0.347)
Control mean 0.05 1.00
Notes: Same as Table 4.
32
TABLE 6—TRAINING IMPACT (KNITWEAR CLUSTER, ITT)
Sample
size
1st
follow-
up
2nd
follow-
up
3rd
follow-
up
P-value
equality
P-value
all zero
Panel A: Survival (yes = 1)
Class+Onsite 313 0.093 0.246 0.14 0.02
(0.058) (0.094)
Class-only 0.055 0.009 0.65 0.60
(0.054) (0.095)
Onsite-only 0.131 0.252 0.29 0.01
(0.053) (0.109)
Control mean 0.87 0.63
Panel B: Unconditional Value Added (log)
Class+Onsite 472 0.469 1.864 3.881 0.02 0.00
(0.312) (0.577) (0.989)
Class-only 0.046 0.957 0.423 0.26 0.36
(0.281) (0.550) (0.975)
Onsite-only -0.182 2.050 -0.100 0.00 0.00
(0.381) (0.578) (1.706)
Control mean 6.73 4.94 2.32
Panel C: Conditional Value Added (log)
Class+Onsite 415 0.484 1.231 3.347 0.03 0.00
(0.308) (0.496) (1.235)
Class-only 0.051 0.574 0.779 0.47 0.59
(0.282) (0.475) (1.392)
Onsite-only -0.229 1.148 -1.157 0.01 0.03
(0.381) (0.540) (2.017)
Control mean 6.73 5.68 3.69
Panel D: Kaizen Score (0-11)
Class+Onsite 413 3.970 4.312 2.780 0.00 0.00
(0.270) (0.237) (0.327)
Class-only 0.393 1.194 1.558 0.00 0.00
(0.268) (0.326) (0.355)
Onsite-only 3.385 3.948 1.167 0.00 0.00
(0.237) (0.222) (0.343)
Control mean 3.92 3.89 5.47
Panel E: Management Motivation (0-30)
Class+Onsite 408 6.088 6.368 6.571 0.65 0.00
(0.503) (0.429) (1.032)
Class-only 0.471 1.570 2.668 0.00 0.00
(0.515) (0.500) (0.875)
Onsite-only 4.807 4.864 4.709 0.99 0.00
(0.611) (0.475) (1.150)
Control mean 13.88 15.02 5.66
Panel F: Entrepreneurial Score (0-7)
Class+Onsite 265 0.658 2.600 0.00 0.00
(0.097) (0.238)
Class-only 0.234 0.508 0.27 0.01
(0.089) (0.244)
Onsite-only 0.306 1.916 0.00 0.00
(0.140) (0.277)
Control mean 0.13 0.84
Notes: Same as Table 4.
33
TABLE 7—MEDIATION ANALYSIS (TWO CLUSTERS POOLED)
(1) (2)
Mi =
Management Score
Mi =
Entrepreneurial
Motivation
First stage (outcome = Mi)
Zi 2.655 0.652
(=1 if invited to any component of the training) (0.361) (0.077)
Age 0.587 -0.004
(0.180) (0.041)
Age squared -0.623 0.003
(0.204) (0.047)
Male 0.098 0.035
(yes = 1) (0.382) (0.084)
Years of education 0.435 0.036
(0.083) (0.016)
Business training experience 2.457 0.228
(yes = 1) (0.797) (0.221)
Second stage (outcome = unconditional value added in log)
Mi 0.207 0.669
(0.033) (0.244)
Zi 0.161 0.471
(=1 if invited to any component of the training) (0.324) (0.441)
Age 0.157 0.260
(0.119) (0.167)
Age squared -0.154 -0.260
(0.136) (0.197)
Male -0.121 -0.162
(yes = 1) (0.232) (0.342)
Years of education 0.146 0.245
(0.044) (0.061)
Business training experience 0.784 1.473
(yes = 1) (0.271) (0.362)
Average causal mediated effect (ACME) 0.553 0.459
[0.339 0.788] [0.166 0.745]
Average direct effect (ADE) 0.159 0.484
[-0.539 0.791] [-0.423 1.431]
Total effect 0.712 0.943
[0.095 1.303] [0.024 1.752]
% of total effect mediated 0.712 0.464
[0.411 4.280] [0.232 2.609]
Correlation coefficients of error term at which 0.205 0.145
ACME = 0
Sample size 775 504
Notes: Numbers in parentheses are standard errors clustered at the enterprise level and the numbers in
bracket show the 95% confidence interval.
34
TABLE 8—IMPACT ON UNCONDITIONAL VALUE ADDED (ROBUSTNESS CHECK, TWO CLUSTERS
POOLED, ITT)
Sample
size
1st
follow-
up
2nd
follow-
up
3rd
follow-
up
P-value
equality
P-value
all zero
Panel A: Winsorizing the top 5 percentile
Class+Onsite 931 0.526 1.589 3.623 0.00 0.00
(0.223) (0.494) (0.800)
Class-only 0.105 0.527 1.728 0.08 0.06
(0.241) (0.466) (0.704)
Onsite-only 0.084 0.817 0.582 0.61 0.69
(0.323) (0.708) (1.297)
Control mean 7.32 5.33 1.57
Panel B: Trimming the top 5 percentile
Class+Onsite 883 0.485 1.619 3.827 0.00 0.00
(0.229) (0.503) (0.816)
Class-only 0.100 0.575 1.969 0.04 0.02
(0.249) (0.468) (0.703)
Onsite-only -0.045 0.599 0.518 0.70 0.86
(0.339) (0.763) (1.348)
Control mean 7.22 5.15 1.07
Panel C: Controlling record keeping score
Class+Onsite 783 0.101 0.273 3.400 0.02 0.04
(0.189) (0.435) (1.192)
Class-only -0.124 0.258 2.116 0.12 0.23
(0.210) (0.364) (1.190)
Onsite-only -0.189 0.841 -0.220 0.01 0.03
(0.275) (0.392) (1.811)
Control mean 7.33 5.34 1.60
Notes: Same as Table 4.
35
APPENDIX TABLE 1—KAIZEN AND ENTREPRENEURIAL SCORES
Panel A: Kaizen Score (0-11)
Evaluation based on the enumerators' observations
The enterprise has a designated area for each production/activity within the workshop.
The enterprise has a fixed place where major tools are stored.
The storage of tools is put in order by kind.
The enterprise has a fixed place where raw materials are stored.
The raw materials are stored separately from the scrap.
The work flow line is determined.
The defectives of raw materials and finished products are clearly segregated from the good ones.
Evaluation based on the owners' responses
The scraps are removed and the floor is cleaned every day.
The workers maintain machines every day.
The enterprise holds meeting in which all workers participate.
The proprietor knows how long each production process takes.
Panel B: Entrepreneurial Motivation Score (0-7)
The entrepreneur is definitely sure to willing to learn business/management.
The entrepreneur actually participated in business/management training between 2011 and 2015.
The entrepreneur invited external advisor/consultant/monitors to the workshop in 2015.
The entrepreneur visited foreign county for business-related activities in 2015.
The entrepreneur has a plan to introduce new product or upgrade the quality of current product.
The entrepreneur is confident in training and communicating with workers to produce new or
higher quality product.
The entrepreneur actually introduced a new product or upgraded the current product.
36
APPENDIX TABLE 2—BALANCE CHECK
(1) (2) (3) (4) (5) (6) (7) (8) (9) (10) (11) (12)
Steel Steel Steel Steel Steel Steel Knit-
wear
Knit-
wear
Knit-
wear
Knit-
wear
Knit-
wear
Knit-
wear
Class +
Onsite
v.s.
Class-
only
Class +
Onsite
v.s.
Onsite-
only
Class +
On-site
v.s.
Control
Class-
only
v.s.
Onsite-
only
Class-
only
v.s.
Control
Onsite-
only
v.s.
Control
Class +
Onsite
v.s.
Class-
only
Class +
Onsite
v.s.
Onsite-
only
Class +
On-site
v.s.
Control
Class-
only
v.s.
Onsite-
only
Class-
only
v.s.
Control
Onsite-
only
v.s.
Control
p-value p-value p-value p-value p-value p-value p-value p-value p-value p-value p-value p-value
Panel A: Control variable
Age (as of the baseline) 0.28 0.54 0.21 0.98 0.66 0.78 0.85 0.55 0.86 0.48 1.00 0.54
Male (yes = 1) 0.74 0.87 0.41 0.70 0.18 0.70 0.19 0.29 0.51 0.91 0.46 0.54
Years of education 0.97 0.56 0.63 0.51 0.51 0.40 0.70 0.29 0.25 0.45 0.37 0.89
Training experience (yes = 1) 0.53 0.39 0.95 0.09 0.57 0.35 0.84 0.44 0.12 0.30 0.14 0.02
Panel B: Outcome variable
Baseline Kaizen score (0-11) 0.04 0.25 0.00 0.95 0.12 0.45 0.87 0.10 0.43 0.05 0.37 0.14
Baseline management score N.A. N.A. N.A. N.A. N.A. N.A. 0.43 0.07 0.90 0.01 0.32 0.06
Baseline employment size 0.02 0.68 0.10 0.35 0.78 0.51 0.02 0.24 0.64 0.01 0.10 0.48
Baseline sales revenue 0.33 0.37 0.33 0.16 0.92 0.13 0.18 0.34 0.82 0.03 0.13 0.53
Baseline value added 0.69 0.43 0.73 0.40 0.90 0.33 0.12 0.60 0.67 0.10 0.15 0.97
Joint orthogonality p-value 0.22 0.11 0.01 0.46 0.69 0.70 0.72 0.85 0.78 0.17 0.54 0.30
Notes: P-values are from the t-test concerning the null hypothesis that the mean values are the same among the two groups. Value added and sales revenue
are in terms of million VND (1 million VND is equivalent to 61 USD). Joint orthogonality p-values are from the F-test concerning the null hypothesis that
all the coefficients are zero in the OLS regression with the dummy variable representing the treatment status on the right-hand-side and all the control and
outcome variables in the left-hand-side.