Management Dashboard System Release Date: May 22, 2014
30
Management Dashboard System Release Date: May 22, 2014 Thomas Bronack © Page: 1 Product Overview Document Introducing a new approach to Dashboards that can provide you with the information you need to achieve business goals on-time and within budget, in a much more efficient manner than is accomplished today. In today’s world of Global Projects, in which companies are trying to provide a controlled Information Technology Environment, while achieving a 100% Green LEED’s (Leadership in Energy and Environmental Design) certification, it is becoming increasingly more important to insure that your staff is utilizing the most current and accurate information possible and that project goals, timeframes, and budgets are understood and optimized. Too often you’ll find people using out-of-date information, which leads to confusion, chaos, and project slippage. This is particularly true for projects that cross continents, countries, cultures, languages, and time zones. The Management Dashboard system that I am introducing will help you overcome those obstacles and make it easier for personnel to instantly access the most current and accurate documents they need to accomplish their assigned tasks. Have you ever found it difficult to locate the right document? Does it take you forever to find the document amongst the many libraries that you have, and when you do locate the document are you sure it is the right document and not out-of-date? The approach I have employed uses your existing data and simply provides a Dashboard front-end that can control document releases, only allowing the latest release to be displayed or worked on. This approach works for both Forms contained in databases, and flat files used for: Manuals; Standards and Procedures; PowerPoint Presentations; Excel Files; and all MS Office types of documents; along with adobe documents; and, even Project Plans.
Transcript of Management Dashboard System Release Date: May 22, 2014

Management Dashboard System Release Date: May 22, 2014
Thomas Bronack © Page: 1 Product Overview Document
Introducing a new approach to Dashboards that can provide you with the information you need to achieve business
goals on-time and within budget, in a much more efficient manner than is accomplished today.
In today’s world of Global Projects, in which companies are trying to provide a controlled Information Technology
Environment, while achieving a 100% Green LEED’s (Leadership in Energy and Environmental Design) certification, it is
becoming increasingly more important to insure that your staff is utilizing the most current and accurate information
possible and that project goals, timeframes, and budgets are understood and optimized.
Too often you’ll find people using out-of-date information, which leads to confusion, chaos, and project slippage. This is
particularly true for projects that cross continents, countries, cultures, languages, and time zones. The Management
Dashboard system that I am introducing will help you overcome those obstacles and make it easier for personnel to
instantly access the most current and accurate documents they need to accomplish their assigned tasks.
Have you ever found it difficult to locate the right document? Does it take you forever to find the document amongst
the many libraries that you have, and when you do locate the document are you sure it is the right document and not
out-of-date? The approach I have employed uses your existing data and simply provides a Dashboard front-end that can
control document releases, only allowing the latest release to be displayed or worked on. This approach works for both
Forms contained in databases, and flat files used for: Manuals; Standards and Procedures; PowerPoint Presentations;
Excel Files; and all MS Office types of documents; along with adobe documents; and, even Project Plans.

Management Dashboard System Release Date: May 22, 2014
Thomas Bronack © Page: 2 Product Overview Document
The Dashboard can be accessed from anywhere and at any time, so you do not have to rely on Conference Calls and
Remote Meetings to view data or obtain status updates. If you find yourself worried in the middle of the night about
the status of a project, and it’s affecting your sleep, you can simply log-on and view the current status. You can even
Drill-Down to the person performing the task and be connected directly to that person so you can have a discussion,
provide additional information, or provide guidance or expert assistance that would allow the person to complete their
work and get the project back on schedule.
This tool provides training materials, project descriptions, Statements of Work (SOW), Forms, and Flow Charts. Project
Plans can be provided to allow people to see what they are currently responsible for and to determine the other tasks
they must complete. Resource charges can be accumulated as Purchase Orders (PO’s) associated with the time and the
resources used to complete work. The PO’s can be accumulated against a Work Order (WO) so that a charge-back
system can be created to bill for work performed. This Charge-Back System can be used to judge the expenses and time
associated with future work of a similar nature, so that more accurate cost and time projections can be made.
A Work-Flow Management System, combined with a Personnel Training System can be used to log, track, analyze, and
report on activity so that you can make improvements based on past experience, thereby allowing you to optimize the
skill-set of your staff and the duration of projects and real-time activities. These savings and improved morale will result
in reduced costs, a happier staff that will be reflected to clients and co-workers, better retention, and a client base that
receives excellent attention. Those clients will become better references and would be more likely to recommend your
services to other people in their field. This tool is a valuable aid to your Project Management Office (PMO).
Through this process, the company will be better equipped to implement, maintain, test, assure quality, and perform
production activities. The ability to recover from unexpected problems and disaster events will be enhanced, and your
company’s ability to adhere to Service Contracts and Compliance Requirements will be greatly improved.
Through the use of the Dashboard System, your company’s reputation will be improved and your bottom line increased.
The Dashboard System can be obtained through a License Agreement, which will include all product materials and,
training, and my time as a consultant to assist your company implement the product and achieve its rewards.
If you believe that a product like this would help your company achieve its goals better, while using existing data, then
please contact me at:
Thomas Bronack
Email: [email protected]
Phone: (917) 673-6992
A video presentation, or on-line demonstration, of the Dashboard System can be obtained upon request, so that you will
better understand its flexibility and how you can benefit from its usage.
Thank You,
Thomas Bronack

Management Dashboard System Release Date: May 22, 2014
Thomas Bronack © Page: 3 Product Overview Document
This project was similar to other projects I worked on and had similar project management and communications
problems that affected productivity that needed to be addressed.
My last project was similar to many projects that may have been performed in the past, are currently active, or are being
planned for future implementation. These projects may cross Continents, Countries, Cultures, Languages, and Time
Zones, all of which result in work instructions and status meetings being conducted through Conference Calls and
Remote Meetings where screen displays and presentations could be utilized. Unfortunately, the control of current and
accurate documentation may be lacking and can lead to misinformation, confusion, and sometimes chaos – all of which
may result in project slippage and increased expenses.
The many Project Phases within these projects may include:
1. Respond to Request for Proposal (RFP) with a Bid and then a Project Plan detailing time frames, deliverables,
resources, and costs associated with achieving the goals stated in the RFP.
2. Conduct an Inventory of existing locations, the applications and clients serviced, the communications required
to support client contracts and personnel needs, and the costs associated with vendor contracts for facilities and
services provided. From this Inventory a Configuration Management can be created for all locations presently
outside of the client’s direct control. Since our overall goal was to develop a Global Resource Inventory and
Configuration Management System, it was important to establish a format for the collection of resource
information that could be combined into an Enterprise-Wide Repository.

Management Dashboard System Release Date: May 22, 2014
Thomas Bronack © Page: 4 Product Overview Document
3. From the Inventory and Growth Projections, we next calculated the size of the Production Sites needed to
support current and future operations, but under the direct control of the client. In this project we constructed
Production Sites to support Europe, Asia / Pacific, and the Americas.
4. Our next step was to Transition the original equipment from the current locations to the designated Production
Site for the client office or Business Unit. This was simply picking up the old equipment, moving it to the new
Production Site and connecting it.
5. Once the equipment was transitions and connected it had to be tested to verify that the services originally
provided to the client were indeed being provided in the same or better manner than before.
6. When Testing was completed, we could eliminate unnecessary vendor contracts and reap a savings.
7. At this point we could begin construction of an internal Recovery Site to support production sites and the
applications residing at the specific Production Site. The Inventory we created from the Production Site
inventories was used to calculate the size of the recovery facility and to order the “Available Pool of Resources”
we believed necessary to support the production sites should a Disaster Event occur. The Recovery Site
Available Pool of Resources would be drawn from to create a “Dedicated Pool of Recovery Resources” to
support Application Recovery Certification and Information Technology Recovery Operations. Resources would
be drawn from the Pool of Resources and assigned to the application, or IT Facility, going through recovery
verification. These resources would be Allocated and Dedicated to the Application or IT Facility to support
Recovery Management demands going forward.
8. The equipment and facilities at the Production and Recovery Sites were then converted to a VMware, Cisco,
EMC (VCE), environment that supported Virtual Operations, so that the latest technologies could be utilized to
reduce footprints and infrastructure costs, while allowing for a more rapid and less burdensome recovery
operation. This Transformed environment had to be tested to certify recovery operations and laid the
foundation for the company to move towards VBLOCK and VPLEX virtual computing going forward. This new
technology would allow the company to place smaller VBOCK machines at office locations and connect them to
very large VBLOCK machines at the Production or Recovery Site. VPLEX would be used to support data
synchronization through Recovery Point Application (RPA) from EMC in a Metro LAN (up to approximately 200
km) and GEO LAN world-wide configuration as needed. The use of the VBOCK /VPLEX combination would be
able to support High Availability (HA) and Continuous Available (CA) applications (sometimes referred to as
“Active - Active”) as business and regulatory requirements dictated. The VBLOCK configuration consists of
Network (Cisco), Memory (EMC), and Processing (VMware) and is considered a complete computing
configuration, which is designed by Pre-Sales Engineers, constructed at the VCE Factory, delivered within 30
days of order, and installed at the client site in 1 to 2 days with testing and training provided on-site to the client
team.
9. A “Proof of Concept” was performed to validate that recovery operations could support each of the Production
Data Centers should a disaster event occur, so sample applications were selected from each production site for
recovery testing. This recovery testing included: Connectivity; Security; and Functionality for applications. DR
Exercise Booklets had to be created and personnel trained in order to succeed in this project goal. All
information needed to prepare the Recovery Site Infrastructure was defined and provided to Recovery Site
personnel long before the Recovery Test was scheduled so that they could allocate resources and synchronize
data between the Production and Recovery Site in support of Application Recovery Certification being
performed during the Proof of Concept test. A six step process was defined and followed in support of Recovery
Management, which included:

Management Dashboard System Release Date: May 22, 2014
Thomas Bronack © Page: 5 Product Overview Document
a. DR Planning Session in which management and technical personnel selected applications, IT Facilities,
or Business Locations for Recovery Testing, and then set scope, objectives, and goals, defined success /
failure conditions, and finally planned the recovery test (A Meeting Agenda was created to supplement
this meeting).
b. A Recovery Site Infrastructure Form was create to provide Recovery Site personnel with the information
they needed to draw resources from the Available Pool and assign them to the Dedicated Pool of
Recovery Resources and to Synchronize Data between the Production and Recovery Sites. A final Back-
up Tape was delivered to the Recovery Site and restored to the Virtual Tape Library and used to
synchronize the Recovery Point Applications in the Production and Recovery Sites going forward. From
that point on, backup data from the Production Site was reduced through Data Deduplication utilized by
the Virtual Tape Library and through automated the RPA’s data synchronization process.
c. A Pre-Stage form was created to supply the Recovery Site team with the specific information related to
the Application Recovery Certification test, so that they could set-up the recovery site to support the
planned recovery test for the selected application(s).
d. The Actual DR Test was performed when the application was connected to the recovery facility and the
Production IP Addresses switched to the Recovery IP Addresses. The Application Recovery Team used
their “Production Job Run Book” to test the application because it looked exactly the same in Recovery
as it did in Production. The transition from Production to Recovery was transparent to the end users.
e. Post-Test activities were conducted after the Recovery Testing was completed and consisted of:
gathering Actual Times and Estimated Times for Recovery Steps; listing any Encountered Problems; and,
assembling any Comments provided by personnel associated with the recovery test. This information
was then assembled into a Report and Presentation to be delivered at the Post Mortem Meeting where
management and technical personnel would review recovery operations and make recommendations
for improvement. Selected recommendations were added to the Recovery Process and recovery
operations monitored to record any improvements. Through this process of Test, Review, Improve we
were able to produce the Best Recovery Plan possible for our environment.
10. Our next project phase was responsible for implementing Recovery Management throughout the Enterprise
(which is sometimes referred to as Enterprise Resiliency). During this phase we developed a Global Application
Catalog from a Configuration Management Data Base (CMDB) tool and appended personnel and criticality
information to the records (which an automated tool could not extract). We also sub-divided the Global
Application Catalog into Configuration Management Catalogs associated with each physical location (this
information was used to support Business Impact Analysis (BIA) functions). We then developed supportive
documentation and guidelines to help personnel select applications for certification and to perform Enterprise
Resiliency operations.
11. The last major phase of the project was Compliance Management (sometimes referred to as Corporate
Certification), in which we had to define all of the laws we had to adhere to, both domestically and
internationally, and create an “Audit Universe” describing our compliance responsibilities. This process
developed a Technology Risk Management and Audit Compliance process, where: Gaps; Exceptions; and
Obstacles were identified and repaired so that a “Letter of Attestation” could be supplied to the Regulator’s by
Executive Management stating that the company is in compliance.

Management Dashboard System Release Date: May 22, 2014
Thomas Bronack © Page: 6 Product Overview Document
12. As an ending to this project, we integrated an Automated Personnel Productivity System that allowed new
activities to be entered (Strategic, Tactical, and Operational) so that personnel skill and work load levels could be
examined. As new skills were required, or workloads became too high for assigned resources, then
requirements went into the Automated Recruitment System for broadcast to recruiting organizations, or
internal personnel were scheduled for training through the Automated Training System to prepare them for
future work assignments. Once the work task was required, the Automated Work Flow Management System
was activated (see Personnel Productivity System). Work tasks were prioritized and due dates established so
that work could be sorted by due date and priority and placed on the individual assigned to the work task in
most important order from top to bottom. The individual would come to work, go to their “Work To-Do List”
screen and select the top item, then complete the task and submit it to the Work Router for assignment to the
next individual needed to respond to the work request until completed. This information was logged, tracked,
analyzed, and reported on so that Work Flow Improvements could be made based on factual data.
13. A Support Organization was created to respond to encountered problems and incidents. When changes had to
be made in order to repair a problem, then a Change Request was created and submitted to the Change
Management System for processing. As part of this effort, we created “Command Centers” for Network,
Operations, Incident, Help Desk, Contingency Command, and connected them to the Emergency Operations
Center.
14. Finally, we had to develop a Schedule of Activities that would maintain our enterprise in a ready state that was
capable of supporting production and recovery operations going forward. This included periodic Audits and
Recovery Testing.
15. When completed, the entire process was integrated within the Everyday Functions performed by personnel to
insure that documentation, safeguards, and compliance was always maintained in a current and accurate
fashion through Version and Release Management.
As you can see, this was a complicated and long-term project that required many people, many documents, procedures,
status reporting, and management control. We eventually found that creating a Repository of Information that was
Front-Ended by a Dashboard was the only way to achieve this task. That is why I finalized the Executive Dashboard
System and added sub-dashboards for Infrastructure, Systems Development Life Cycle, Recovery Management, and
Compliance.
A different perspective of the project and its goals is shown below.
Management Dashboard System Release Date: May 22, 2014
Thomas Bronack © Page: 7 Product Overview Document
How the Dashboard System initially started was through a simple interface between a Repository of Information and the
general User Community. Its purpose was to provide quick access to current and accurate information so that personnel
would know what was expected of them to achieve our combined goals, as described in the Statement of Work and
Project Plans.
A picture of how the initial Dashboard was used to interface between personnel and documentation is shown below.
Project information was contained in a Library
(Repository) with a Dashboard front-end that
selected the most current document via a Link
and presented the information to the
requestor who could read or update the
document (if authorized). Upon return, the old
document was stored in an archive and the
new document saved with the same name as
the original document to protect links and
eliminate interruptions.

Management Dashboard System Release Date: May 22, 2014
Thomas Bronack © Page: 8 Product Overview Document
Executive Dashboard
Completed In Process Pending
Phase I - Management Guidelines and Goals1 2 3 4 5 6 7 8 9 10 11 12 13
Executive
Committee
Formulation
Formulate Steering
Committee
Perform a Needs
Analysis to Define
Goals &
Objectives, then
Prioritize
Create a Business
Plan and Gain
Executive
Management
Approval
Receive Approval &
Funding for
Development and
Maintenance
Obtain Strong
Current and Future
Management
Support
Have
Management
create a Project
Inition Letter
stating their
Strong Support
Define
Stakeholders
and Participants,
then review
Scope,
Objectives, and
Goals
Create Recovery
Teams, Define
Responsibilities,
and Assign
Personnel
Develop a
Project Plan in
MS Project
Define
Reporting
Audience,
Criteria, Report
Format, and
Schedule
Create and
Deliver Desired
Reports as
Scheduled
Receive
Management
Feed-Back
Comments and
Instructions
Phase II - Risk Management Goals and Objectives
Define all
Compliance Laws
and Regulatory
Needs for
Countries you do
Business In
Define Audit
Controls and
Monitoring
Methods, then
build into plan
Define Suply
Chain
Management
Needs
Define SLA / SLR /
RTO and KPI Service
Contract
Requirements
Perform Risk
Assessment and
report on
uncovered Gaps &
Exceptions
Report on
Obstacles that
Impede Recovery
Operations
Calculate
Impacts and
Repair Costs
Define Insurance
Costs to Repair
Reported Flaws
Provide
Management
with Report and
Presentation on
Findings
Obtain
Management
approval for
repairs,
controls, and
insurance
Mitigate /
Mediate, or
Obtain
Insurance to
cover flaws
Create a Letter
of Attestation
Creation
Process for
Management
Repeat Process
on a Periodic
Basis
Phase III - Business Impact Analysis
Define Locations
and / or Business
Units that need a
BIA
Define
Applications, by
Priority (CA, HA,
Non-Crital)
Create Business
Recovery Plan for
Locations and
Business Units
Create Disaster
Recovery Plan for
Information
Technology
Perform Workplace
Safety and Violence
Prevention Review
Perform Physical
Security and Site
Access Controls
RTO / RPO / RTC
and PKI and Vital
Records
Management
Rate Ability to
Achieve Goals,
using
Quantitative or
Qualitative
Methods
Define Gaps &
Exceptions
against
Compliance
Laws and
Regulations
Define
Obstacles that
Impede
Processing
Operations
Define Impact
of Gaps,
Exceptions,
and Obstacles
and their
Repair Costs
Define
Insurance Costs
and Select
Insurance Plan
that best meets
needs
Gain
Management
Approval to
Mitigate /
Mediate / Insure
Phase IV - Automated Tool Selection (Locate, Review, Select, Implement, and Train)
Decide upon using
an Automated
Risk Assessment
Tool
Define Automated
Tool Selection
Criteria
Audit and
Controls Tool
Business Impact
Analysis (BIA) Tool
Business Continuity
Planning Tool
Disaster Recovery
Planning Tool
Define
Application
Recovery
Certification Tool
Select Vendors
to Demonstrate
Their Tools
Select Best Tool
that meets
needs
Obtain &
Implement
Tools
Train Staff on
Tools
Incorporate
Tools into
Recovery
Planning
Process
Adhere to
Version & Release
Management
Phase V - Create Recovery Plans
Business and
Location Recovery
Plan
Protection, Salvage
& Restoration Plan
DR Exercise
Booklet
DR Planning
Management
Dashboard
Crisis Management
Plan
Establish a
Recovery Plan
Repository
Connect
Recovery Plans
to Command
Centers
Define
Contingency
Manager
Define Recovery
Team Members
Define Initiation
and Recovery
Team Tasks
Create
Recovery Plan
and Monitor
Status
Report on
Recovery Plan
Status to CCC
and EOC
Create
Management
"Letter of
Attestation"
Phase VI - Initiate Recovery Plan when Disaster Event Occurs
Help Desk
Identifies Disaster
Event or a Disaster
Event is reported
to Help Desk
Help Desk Notifies
Contingency
Recovery Plan
Coordinator
Contingency
Coordinator
Declares Disaster
and Initiates Plan
Team is Called and
Recovery Tasks
Performed
Failing Site
Protection, Salvage,
and Restoration is
Initiated
Disaster Site is
Evacuated, as
needed
Recovery
Personnel are
Transferred to
Recovery Site
Recovery
Operations are
Initiated and
Conducted for
Life of Disaster
Failing Site is
Salvaged and
Restored
Personnel
Return to
Original Site
and Resume
Production
Post Mortem is
Conducted and
Improvements
Identified
Improvements
are
Incorporated in
Future
Recovery Plans
Recovery Steps
are added to
Testing Process
and Periodicically
Repeated
Phase VII - Community Relations, Communications, and Administration
Notify First
Responders,
Community, and
Government
Agencies of
Disaster Event as
needed
Coordinate with
Clients, other
Building Park
Residents,
Personnel, and
Families
Coordinate with
Government
(OSHA, OEM,
City, etc.)
Notify Supply Chain
Management to
make Deliveries to
Recovery Site
Establish Financial
and Personnel
Considerations
during Recovery
Manage
Contingency
Command Center
(CCC) and
Emergency
Operations Center
(EOC)
Respond to
Encountered
Problems and
Update Status
Communicate
Disaster Event
Status to
Community and
Media
Manage
Recovery
Process from
Start to Finish
Declare Disaster
Event is Over
and Production
is Resumed
Manage Post
Mortem and
Plan
Enhancements
Ensure
Recovery
Planning is
Integrated
Ensure
Documentation,
Training, and
Awareness is
current
Training Materials
Training Materials
Training Materials
Training Materials
Management Dashboard for achieving Enterprise Resiliency and Corporate Certification,
with Recovery Management Planning and Activation included.
DashboardsDashboard Description
Documents to be produced in Phase VII
Documents to be produced in Phase I
Documents to be produced in Phase II
Documents to be produced in Phase III
Documents to be produced in Phase IV
Documents to be produced in Phase V
Documents to be produced in Phase VI

Management Dashboard System Release Date: May 22, 2014
Thomas Bronack © Page: 9 Product Overview Document
The Executive Dashboard is used to support implementing Enterprise Resiliency and Corporate Certification and contains
seven phase each with 13 steps (for a total of 91 steps).
Enterprise Resiliency combines all of the DR functions under one umbrella department using a common set of tools and
a common language. It is designed to optimize communications and performance amongst the various recovery groups
to better respond to disaster events and to foster a wider knowledge base amongst DR practitioners.
Corporate Certification is responsible for insuring that your company complies with all of the rules and regulations of the
countries where you conduct business.
Combining the two disciplines will insure that your company has developed a safeguarded and compliant environment
that is best suited to protect your business and company reputation, while complying with all of the regulatory
requirements where your company conducts business.

Management Dashboard System Release Date: May 22, 2014
Thomas Bronack © Page: 10 Product Overview Document
We first performed an Equipment Inventory of all of the client locations, then built the production data centers and
transitioned their equipment to the new production sites and tested the environment to verify it still operated
successfully. We were then able to eliminate outside contracts with vendors and service providers.
Our next phase required us to virtualize the equipment and eliminate old equipment that the virtualized environment
replaced (another savings to the client). In this process we were able to achieve Green LEED’s 100% certification.
Next we built an internal recovery site and connected it to the production sites and validated that we could recovery
Production applications at the internal recovery site. We implemented an “Application Recovery Certification” process,
an IT Recovery process, and finally a Business Recovery process.
Finally, we accomplished Enterprise Resiliency (Recovery Management) and Corporate Certification (Compliance
Management).
During this process we built a Global Application Catalog by applying the Configuration Management Data Base
(CMDB) product (part of ITIL v3 family of products) and then appended ownership, criticality, support, and other
information not attainable through an extraction tool like CMDB. Finally, we sub-divided the Global Catalog into
Configuration Catalogs associated with locations, which supported some of our Business Impact Analysis (BIA)
requirements.
At the end of this project, the company was totally prepared to meet recovery requirements associated with regulatory
practices and client service contracts throughout the world.
An overview of the Equipment Life Cycle associated with this project is shown below.

Management Dashboard System Release Date: May 22, 2014
Thomas Bronack © Page: 11 Product Overview Document
As the project progressed we were able to identify metrics that could be used for management reporting in a normal
Dashboard manner. These metrics were based on:
1. Number of active projects, per category of responsibility:
a. Asset Acquisition;
b. Asset Redeployment;
c. Asset Termination; and,
d. The use of Infrastructure personnel to assist in these tasks.
2. Project Descriptions were created and broken into units that were Completed, Active, or Pending to determine:
a. How much was already spent;
b. How much was currently being spent; and,
c. How much was yet to be spent.
3. We then defined personnel costs and the average duration associated with their work functions, which allowed
us to calculate:
a. Average Costs;
b. Average Hours per task;
c. Total Hours for tasks (Completed, Active, and Pending);
d. Total Costs;
e. Active Costs;
f. Pending Costs; and,
g. Percentage Complete.
4. This information was then charted into the presentation shown below.

Management Dashboard System Release Date: May 22, 2014
Thomas Bronack © Page: 12 Product Overview Document
Having these metrics available to management proved to be an excellent manner to communicate project status and
costs to management and they appreciated having it available to them.
As the project went on, we discovered that we could create similar reports for the Systems Development Life Cycle
(SDLC), Recovery Management, and Risk Management, and Compliance Management – which just made the use of the
Management Dashboard System that much more powerful and helpful in achieving our goals while providing
management with the information they needed.
An additional benefit was received by the Project Management Office (PMO) who were better able to record, track, and
complete projects, while defining costs and areas for improvement in efficiency that reduced costs and reduced project
durations.

Management Dashboard System Release Date: May 22, 2014
Thomas Bronack © Page: 13 Product Overview Document
A Systems Development Life Cycle (SDLC) dashboard was create and connected to the Executive Dashboard for rapid
access. It is used to illustrate the steps required to develop and maintain applications within the Enterprise
Environment.
The steps used to create applications, and the information required by the Requester, was submitted in a “Work Order
(WO)” to the Applications Department. The Work Order was then broken down into “Purchase Orders (POs)” for
processing throughout the SDLC to show what actions were performed, their duration and resources used, and the cost
per activity. From this information, it was possible to generate a Charge-Back System comprised of Work Orders and
their associated Purchase Orders. Charges were then submitted to Accounting and the Requester.
Throughout the SDLC, it was necessary to provide forms to drive work activities and documents to describe
accomplishments. These documents were associated with specific SDLC steps and placed within a table of documents
for every step completed. In order to better monitor SDLC activity and gain an understanding of activities performed, it
was necessary to create Sub-Menus for SDLC phases and a Master Menu for the entire project. Through this
mechanism, it was possible to track SDLC activity through the Dashboard System as shown below.

Management Dashboard System Release Date: May 22, 2014
Thomas Bronack © Page: 14 Product Overview Document
The SDLC Documentation Menus are shown above and another, more complete description of the SDLC shown below.

Management Dashboard System Release Date: May 22, 2014
Thomas Bronack © Page: 15 Product Overview Document
New developments in Information Technology have occurred in rapid succession since the days of Tape Backup and
Restoration, as is shown in the below chart. We are presently in the “Server Centric Backup” phase, but moving forward
to the “Infrastructure Centric Data Protection” phase and finally the “Cloud-Service Centric Data Management” phase.
These phases are better described in the below illustration.
It is obvious that a shift in thinking has been introduced into the data protection and management discipline that has
been brought upon us through the rapid growth of data and the need for quicker recovery times to the point where we
may someday be required to support 100% uptime. The techniques discussed above will aid us achieve that goal.
As our society grows more dependent on computing for our business and personal lives, it will become more evident
that protecting data to support our needs is essential to a continued society. Recovery Operations will have to follow
the demand curve and the approach discussed above is the path chosen by EMC and other major storage providers.
The use of VM for the testing phase within the SDLC and the RPA to maintain data synchronization between the
Production and Recovery environments are examples of Infrastructure Centric Data Protection. Using a Cloud based
data repository would move this SDLC towards a Cloud-Services Centric Data Management environment. We’re almost
there and moving closer every day. Fear and logistics are our enemy.

Management Dashboard System Release Date: May 22, 2014
Thomas Bronack © Page: 16 Product Overview Document
The Charge-Back System related Purchase Orders (PO’s) to Work Orders (WO’s) submitted by a Requestor asking for
specific types of work to be accomplished. As the work progressed through its Life Cycle PO’s were completed and
associated with the Requestor WO Number. Once the Work Order was completed and accepted by the Requester the
Total Cost was calculated and submitted to Accounting for Posting to the General Ledger System as an Account
Receivable to Information Technology and an Account Payable to the Requester’s Department.
This system allowed the Information Technology Department to better become a “Profit Center” and not a “Cost
Center”.

Management Dashboard System Release Date: May 22, 2014
Thomas Bronack © Page: 17 Product Overview Document
This system will guide you in selecting the right form to use when requesting work to be performed, then provide you
with help and data entry validation to insure you have completed the form correctly. Once completed, the Forms
Router will log the work request, authorize it, and assign it to the individuals designated to accomplish the work (from
first person to last). Work will be assigned on a “To-Do List” in due date and priority order, so the individual simply
takes the top item from the list and completes their work, returning it to the Forms Router for assignment to the next
step in its processing schedule. At the end of the work, the Requestor is notified and they approve the work. Should
personnel require training in order to complete the work, the Automated Training System will schedule them for
training in time to adhere to project / work schedules. Vendor Certifications and University Accreditations are added to
the personnel profile and efforts are made to help personnel achieve their desired career paths during this process.

Management Dashboard System Release Date: May 22, 2014
Thomas Bronack © Page: 18 Product Overview Document
The Workflow Management System is designed to process work through the enterprise from, inception to completion,
so that work-flow can be optimized. Access to the system is via a front end that can be accessed from anywhere and at
any time, with interfaces to the Automated Personnel and Automated Training Systems. User Profiles and a Work
Tracking Library are included along with a Data Base of Forms and a Library of Flat Files. User Work Requests (WO’s) are
Logged and the work item is Assigned and Tracked for the individuals who are responsible for performing the actions
associated with the request from first to last action (Purchase Orders or PO’s are used to monitor time and resource
usage for charge-back). Measurements are stored and analyzed to determine the Life-Cycle and Time Frames associated
with work items. Finally, a reporting mechanism is used to report on Work-Flow so that improvements can be made to
optimize how work flows through your organization.

Management Dashboard System Release Date: May 22, 2014
Thomas Bronack © Page: 19 Product Overview Document
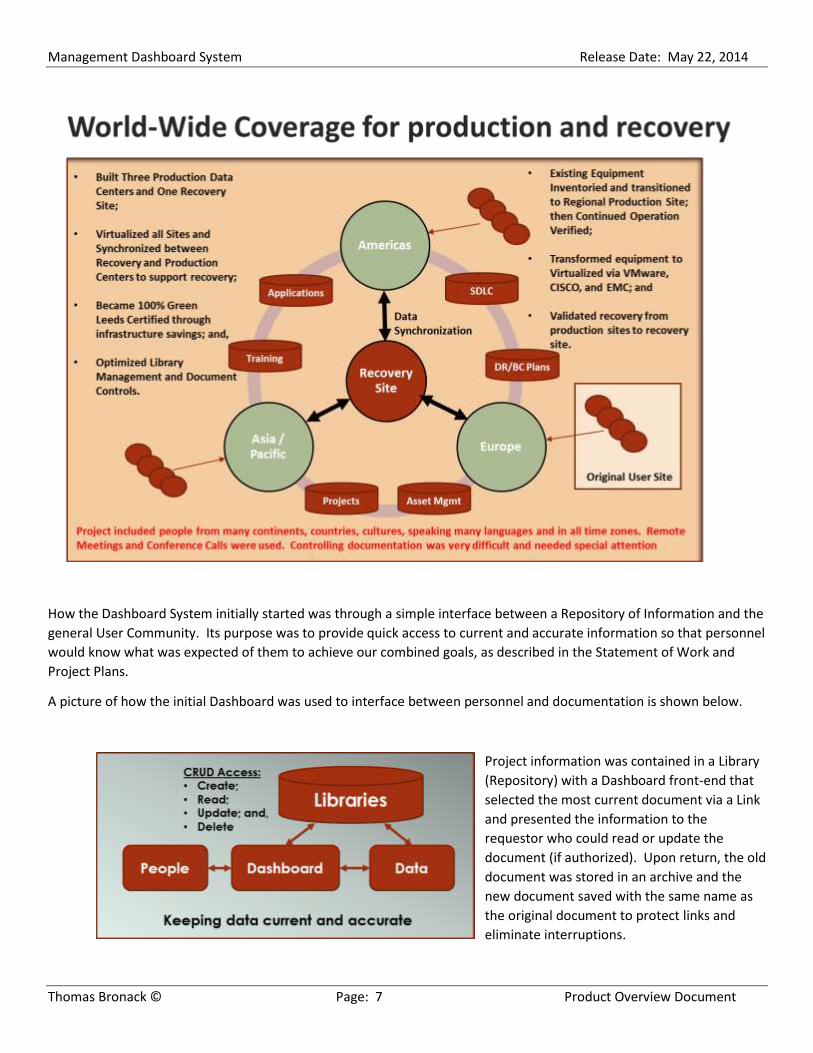
The Recovery Management Dashboard is sub-divided into three areas, which are:
1. Disaster Recovery Planning and Activation – where planning sessions are conducted to select applications, IT
Environments, and Business Locations for Recovery Testing.
2. Application Recovery Certification – which includes Recovery Certification for Applications and IT Locations.
3. Business Location Recovery – for Business Sites and Business Units, and includes Evacuation Plans, Business
Recovery Site occupation and return instructions, Security, Salvage, and Restoration Activities, Vendor
Management, and many other activities used to relocate a business operation to a recovery facility and maintain
production throughout an Emergency or Disaster Event.
This Dashboard will link you to sub-dashboards for each of the categories listed above. Once there, the sub-dashboard
will provide you with training materials, recovery manuals, and instructions to follow in order to recover the failing
function.
Disaster Recovery and Business Recovery Sites are accessible through the Dashboard, so that you will know where they
are and the procedures associated with Disaster Declaration and personnel transportation to the recovery facilities.
An example of the Recovery Management Dashboard is provided below.
Management Dashboard System Release Date: May 22, 2014
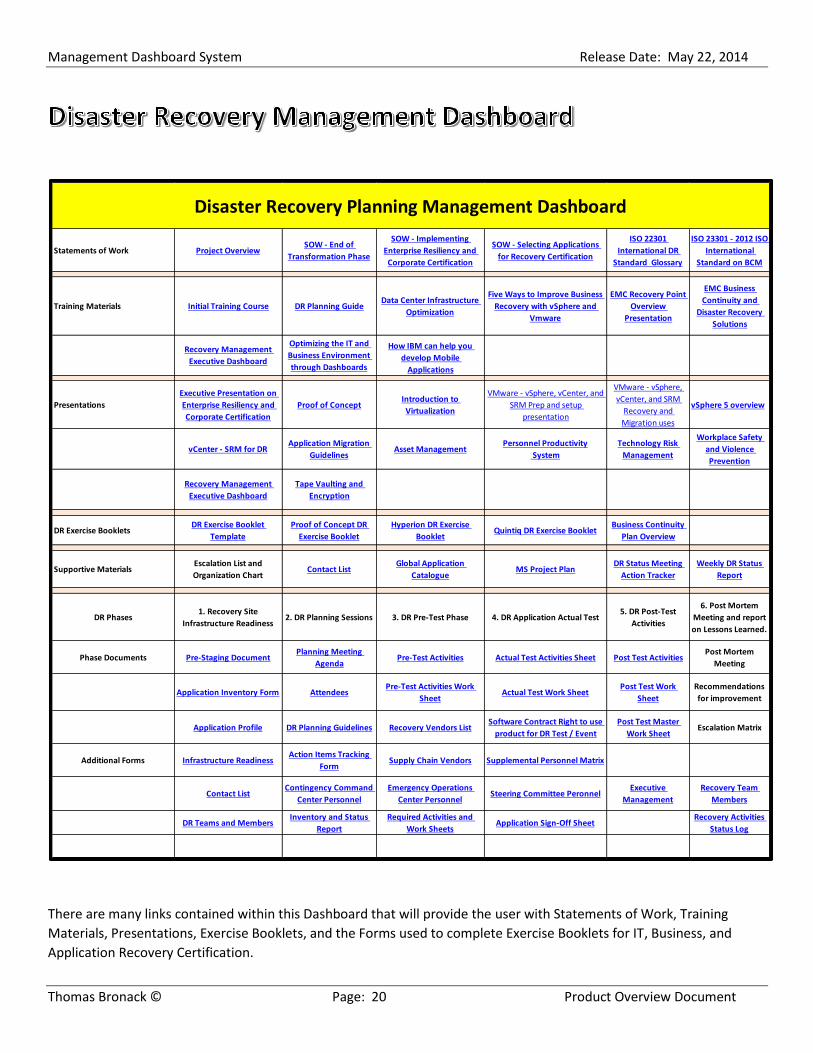
Thomas Bronack © Page: 20 Product Overview Document
There are many links contained within this Dashboard that will provide the user with Statements of Work, Training
Materials, Presentations, Exercise Booklets, and the Forms used to complete Exercise Booklets for IT, Business, and
Application Recovery Certification.
Statements of Work Project OverviewSOW - End of
Transformation Phase
SOW - Implementing
Enterprise Resiliency and
Corporate Certification
SOW - Selecting Applications
for Recovery Certification
ISO 22301
International DR
Standard Glossary
ISO 23301 - 2012 ISO
International
Standard on BCM
Training Materials Initial Training Course DR Planning GuideData Center Infrastructure
Optimization
Five Ways to Improve Business
Recovery with vSphere and
Vmware
EMC Recovery Point
Overview
Presentation
EMC Business
Continuity and
Disaster Recovery
Solutions
Recovery Management
Executive Dashboard
Optimizing the IT and
Business Environment
through Dashboards
How IBM can help you
develop Mobile
Applications
Presentations
Executive Presentation on
Enterprise Resiliency and
Corporate Certification
Proof of ConceptIntroduction to
Virtualization
VMware - vSphere, vCenter, and
SRM Prep and setup
presentation
VMware - vSphere,
vCenter, and SRM
Recovery and
Migration uses
vSphere 5 overview
vCenter - SRM for DRApplication Migration
GuidelinesAsset Management
Personnel Productivity
System
Technology Risk
Management
Workplace Safety
and Violence
Prevention
Recovery Management
Executive Dashboard
Tape Vaulting and
Encryption
DR Exercise BookletsDR Exercise Booklet
Template
Proof of Concept DR
Exercise Booklet
Hyperion DR Exercise
BookletQuintiq DR Exercise Booklet
Business Continuity
Plan Overview
Supportive MaterialsEscalation List and
Organization ChartContact List
Global Application
CatalogueMS Project Plan
DR Status Meeting
Action Tracker
Weekly DR Status
Report
DR Phases1. Recovery Site
Infrastructure Readiness 2. DR Planning Sessions 3. DR Pre-Test Phase 4. DR Application Actual Test
5. DR Post-Test
Activities
6. Post Mortem
Meeting and report
on Lessons Learned.
Phase Documents Pre-Staging DocumentPlanning Meeting
AgendaPre-Test Activities Actual Test Activities Sheet Post Test Activities
Post Mortem
Meeting
Application Inventory Form AttendeesPre-Test Activities Work
SheetActual Test Work Sheet
Post Test Work
Sheet
Recommendations
for improvement
Application Profile DR Planning Guidelines Recovery Vendors ListSoftware Contract Right to use
product for DR Test / Event
Post Test Master
Work SheetEscalation Matrix
Additional Forms Infrastructure ReadinessAction Items Tracking
FormSupply Chain Vendors Supplemental Personnel Matrix
Contact ListContingency Command
Center Personnel
Emergency Operations
Center PersonnelSteering Committee Peronnel
Executive
Management
Recovery Team
Members
DR Teams and MembersInventory and Status
Report
Required Activities and
Work SheetsApplication Sign-Off Sheet
Recovery Activities
Status Log
Disaster Recovery Planning Management Dashboard
Management Dashboard System Release Date: May 22, 2014
Thomas Bronack © Page: 21 Product Overview Document
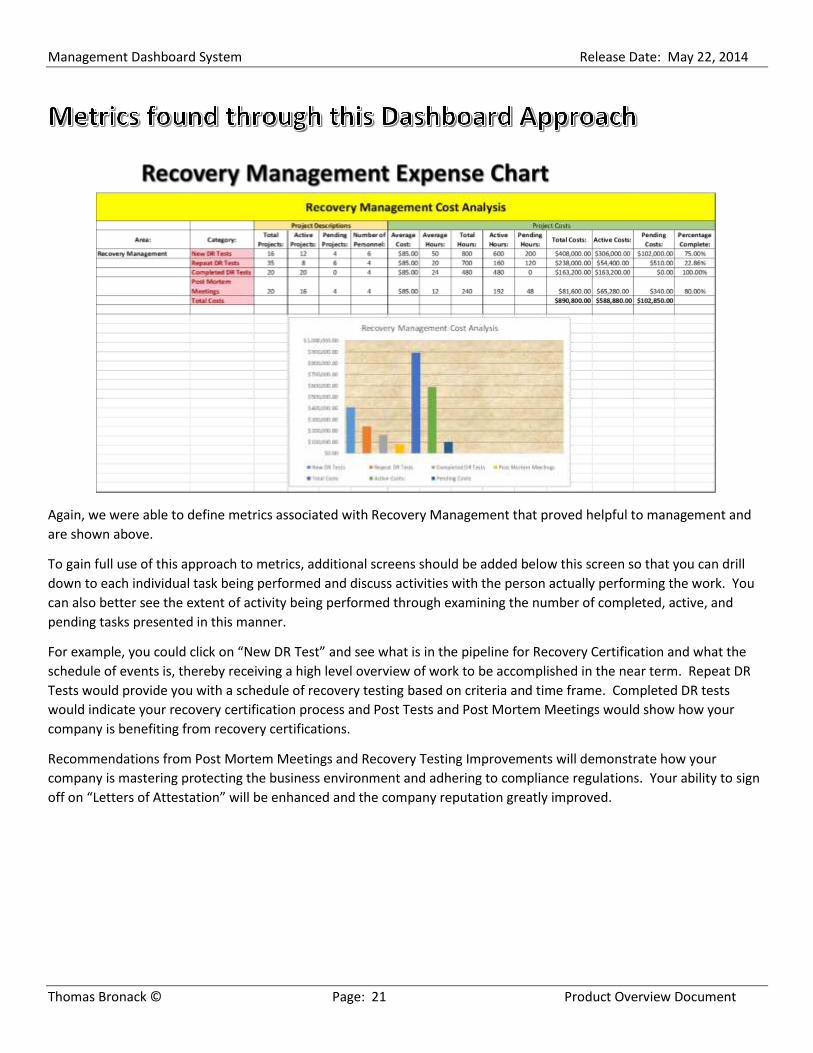
Again, we were able to define metrics associated with Recovery Management that proved helpful to management and
are shown above.
To gain full use of this approach to metrics, additional screens should be added below this screen so that you can drill
down to each individual task being performed and discuss activities with the person actually performing the work. You
can also better see the extent of activity being performed through examining the number of completed, active, and
pending tasks presented in this manner.
For example, you could click on “New DR Test” and see what is in the pipeline for Recovery Certification and what the
schedule of events is, thereby receiving a high level overview of work to be accomplished in the near term. Repeat DR
Tests would provide you with a schedule of recovery testing based on criteria and time frame. Completed DR tests
would indicate your recovery certification process and Post Tests and Post Mortem Meetings would show how your
company is benefiting from recovery certifications.
Recommendations from Post Mortem Meetings and Recovery Testing Improvements will demonstrate how your
company is mastering protecting the business environment and adhering to compliance regulations. Your ability to sign
off on “Letters of Attestation” will be enhanced and the company reputation greatly improved.

Management Dashboard System Release Date: May 22, 2014
Thomas Bronack © Page: 22 Product Overview Document
The Charter and general recovery management disciplines are illustrated above. Executive Management is responsible
for maintaining the Charter Goals and Objectives, while: Information Technology is concerned about Disaster Recovery;
Business Units are responsible for the Business Impact Analysis (BIA), and Business Recovery; and the Audit, Risk
Management, and Legal Departments are responsible for Risk, Compliance, Insurance, and general business guidelines
to insure adherence to compliance regulations both domestically and world-wide as necessary.
The many disciplines involved with planning and enacting recovery plans are shown in the “Contingency Recovery
Planning” circle of influence, so that you can better understand the extent of this endeavor.
Business Continuity Management Disciplines and Integration
Contingency
Planning
Disaster
Recovery
Risk
Management
Business
Recovery
Charter:
· Eliminate Business Interruptions;
· Ensure Continuity of Business;
· Minimize Financial Impact; and
· Adhere to Legal / Regulatory
Requirements
Information Technology
Protection
· Critical Jobs;
· Data Sensitivity and Access
Controls;
· Vital Records Management;
· Vaulting and Data Recovery;
· Recovery Time Objectives;
· Recovery Point Objectives; and
· Mainframe, Mid-Range, and
Servers.
Risk Management
· Exposures (Gaps and
Exceptions);
· Insurance;
· Legal / Regulatory
Requirements;
· Cost Justification; and
· Vendor Agreements.
Corporate Asset
Protection
· Inventory Control
· Asset Management
· Configuration
Management
· Business Continuity; and
· Office Recovery.
Contingency Recovery
Disciplines
Contingency
Recovery
Planning
Facilities
Executive
Management
Personnel
General
Services
Public
RelationsFinance
Auditing
Company
Operations
Information
Technology
“Contingency Planning affects every part of the
organization and is separated into logical work
areas along lines of responsibility”.
“These four Contingency Planning
Disciplines allow for logical work
separation and better controls”
“Establishing interfaces with key
departments will allow for the inclusion
of corporate-wide recovery procedures
(Security, Salvage, and Restoration, etc.)
in department specific Recovery Plans”
Suppliers
Supply Chain safeguards
must be enforced to
maintain supply delivery
and continued operations

Management Dashboard System Release Date: May 22, 2014
Thomas Bronack © Page: 23 Product Overview Document
The process associated with creating a Business Recovery Plan is described over the next two pages and the testing /
certification process right afterward. Stakeholders, participants, and recovery teams will be formed within this project
and reporting schedules defined.
As with any large project, management approval and commitment is required before project initiation. Once started,
the first step of Recovery Planning is to perform a Risk Assessment to define any Gaps, Exceptions, or Obstacles that may
impede the development of recovery plans. After the Risk Assessment is conducted a Business Impact Analysis (BIA) is
performed for locations and Business Units to define their specific Recovery Requirements

Management Dashboard System Release Date: May 22, 2014
Thomas Bronack © Page: 24 Product Overview Document
Identifying applications for Recovery Certification is usually based on criticality and recovery time requirements, but
compliance is an important consideration as well. The above diagram illustrates how you can:
· select critical applications for Recovery Certification;
· substantiate their criticality through supporting artifacts;
· perform an architectural and engineering review of the recovery location to insure its ability to support
production requirements associated with the selected application(s);
· Perform Recovery Pre-Test, Test, and Post-Test activities for the selected applications;
· Mediate / Mitigate any encountered problems and re-test until Recovery Certification is Achieved;
· Conduct a Post Mortem Meeting to review the results from the Recovery Certification; and,
· Implement any suggestions for improvement in the recovery process or associated procedures.

Management Dashboard System Release Date: May 22, 2014
Thomas Bronack © Page: 25 Product Overview Document
Goals and procedures for application Recovery Certification are shown above. When an Application is “Ready for
Recovery Certification” it is submitted to a Recovery Test as defined in the DR Exercise Booklet.
Continuous Availability (CA) applications must pass a Flip / Flop recovery test in order to be both Recovery Certified and
to reach the “Gold Standard” in recovery testing in support of the management directive of “Zero Downtime” for CA
applications.
High Availability (HA) applications must adhere to “Failover / Failback” recovery testing to become Recovery Certified
and capable of recovering within 2 – 72 hours as defined in the DR Exercise Booklet for the application.
If problems arise during Recovery Certification, the DR Test will be placed on hold, the problem repaired, and the DR
Test continued until Recovery Certification is achieved.

Management Dashboard System Release Date: May 22, 2014
Thomas Bronack © Page: 26 Product Overview Document
A “Plan – Act – Implement – Review” process has proven successful in the past and a similar approach has
been integrated within this Dashboard Management System as well. It is applied to each of the four sections
of the Management Dashboard System, including: Infrastructure (to acquire, redeploy, or terminate
resources); Systems Development Life Cycle (to develop or maintain applications and IT environments);
Recovery Management (to safeguard resources and continue the business in adherence to Recovery Time
Objectives); and Risk and Compliance (to adhere to all laws and regulations in the countries where business is
conducted).
We have improved on this efficiency by adding some additional steps that make our efficiency diagram look
like this: Develop – Plan – Build – Test – Review – Utilize – Analyze – Review – Improve – Maintain. This
continuous loop will insure that you develop and maintain the best product possible. Through this process
your company will achieve the best possible plan through an evolutionary approach that is specifically tailored
to your company culture and requirements.
The continuous improvement loop technique is
also applied to the areas contained within the
Management Dashboard System including
Infrastructure, SDLC, Recovery Management, and
Risk and Compliance Management areas. Through
this continuous improvement practice, it will be
possible to achieve the best operations possible
that both safeguards your environment but also
adhered to the laws and regulations your company
is obligated to obey world-wide.
The Enterprise Resilience discipline will combine
recovery operations under the control of one
department having overall responsibility for
developing the best practices possible for
detecting, preventing, and responding to disaster
events, wheatear they are an act of nature or man-made.
The Corporate Certification discipline will be satisfied through the Risk and Compliance actions performed to
guaranty adherence to Laws and Regulations world-wide that apply to the company and its ability to continue
to supply operations in the countries where they presently conduct business.
Develop
Plan
Build
Test
UtilizeAnalyze
Review
Improve
Maintain

Management Dashboard System Release Date: May 22, 2014
Thomas Bronack © Page: 27 Product Overview Document
The End Goal of recovery planning is the implementation of an Emergency Operations Center (EOC) where all recovery
and business units report on the occurrence and status of disaster events, incidents, or problems, that disrupt normal
business operations. The EOC is chartered to continue business operations under all circumstances to the best of their
abilities. The EOC will communicate internally with all business units and support organizations to gather status and
provide instructions. The EOC will then report to executive management, who will provide a single image to the outside
world when reporting on status and events resulting from the business interruption.
Management Dashboard System Release Date: May 22, 2014
Thomas Bronack © Page: 28 Product Overview Document
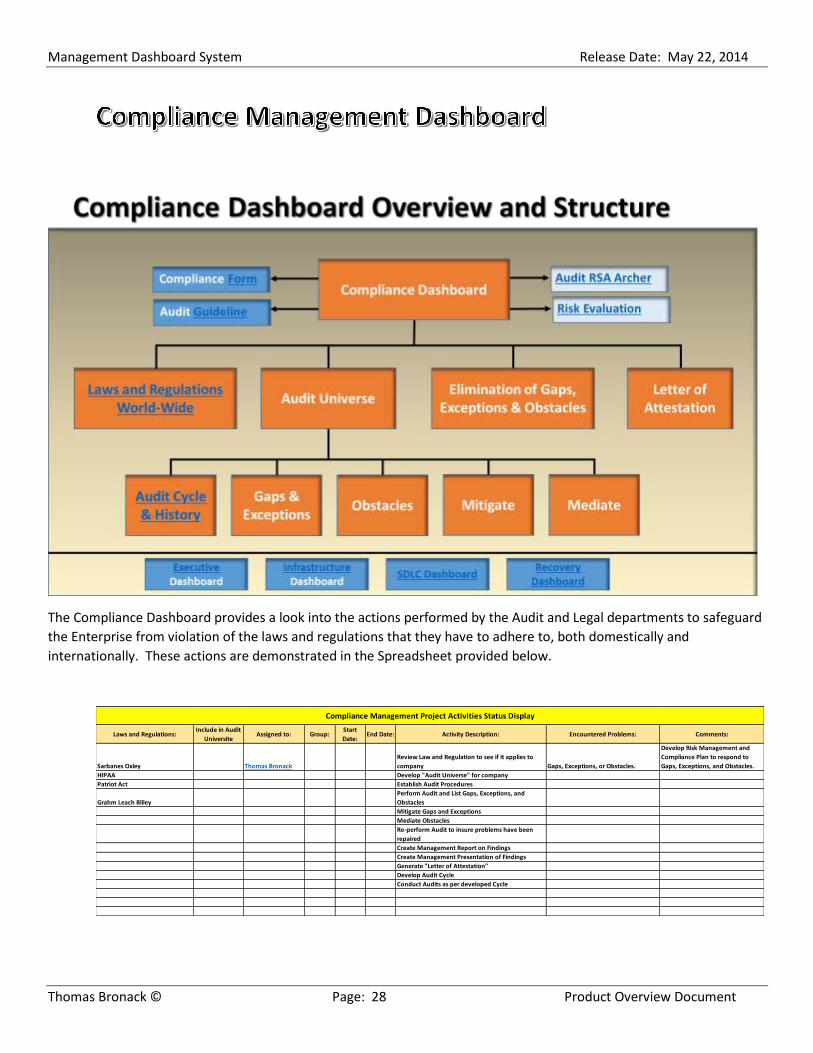
The Compliance Dashboard provides a look into the actions performed by the Audit and Legal departments to safeguard
the Enterprise from violation of the laws and regulations that they have to adhere to, both domestically and
internationally. These actions are demonstrated in the Spreadsheet provided below.
Laws and Regulations:Include in Audit
UniversiteAssigned to: Group:
Start
Date:End Date: Activity Description: Encountered Problems: Comments:
Sarbanes Oxley Thomas Bronack
Review Law and Regulation to see if it applies to
company Gaps, Exceptions, or Obstacles.
Develop Risk Management and
Compliance Plan to respond to
Gaps, Exceptions, and Obstacles.
HIPAA Develop "Audit Universe" for company
Patriot Act Establish Audit Procedures
Grahm Leach Bliley
Perform Audit and List Gaps, Exceptions, and
Obstacles
Mitigate Gaps and Exceptions
Mediate Obstacles
Re-perform Audit to insure problems have been
repaired
Create Management Report on Findings
Create Management Presentation of Findings
Generate "Letter of Attestation"
Develop Audit Cycle
Conduct Audits as per developed Cycle
Compliance Management Project Activities Status Display
Management Dashboard System Release Date: May 22, 2014
Thomas Bronack © Page: 29 Product Overview Document
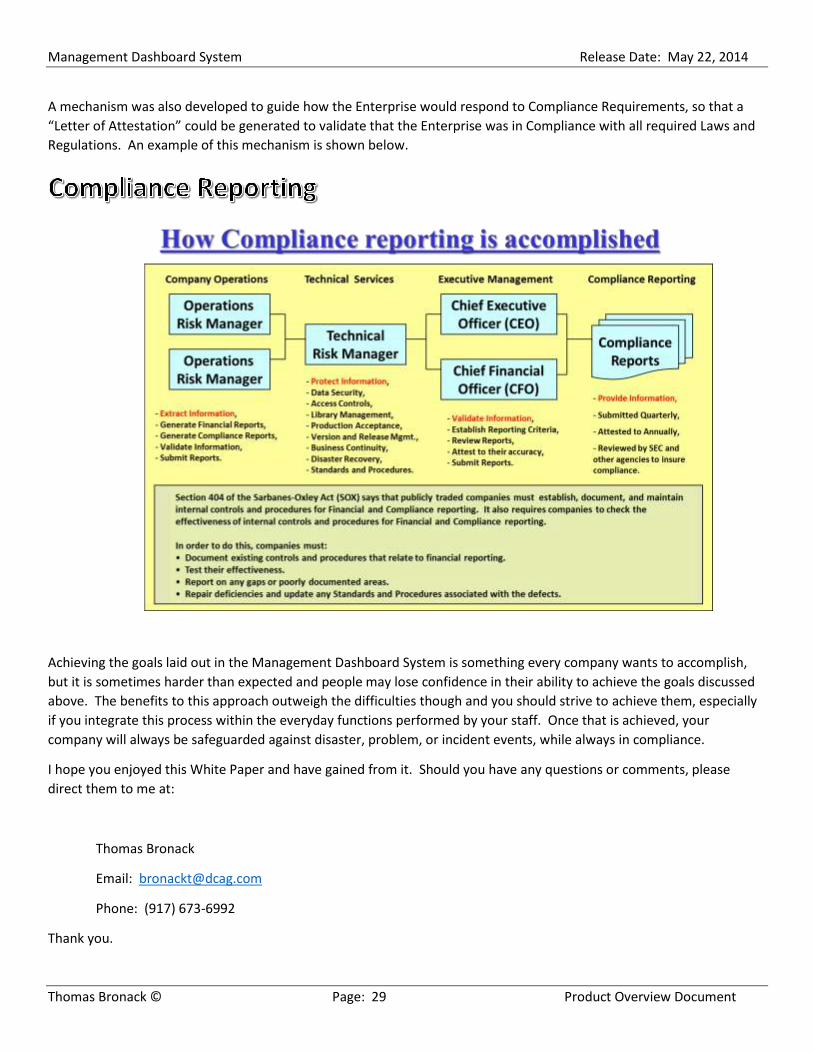
A mechanism was also developed to guide how the Enterprise would respond to Compliance Requirements, so that a
“Letter of Attestation” could be generated to validate that the Enterprise was in Compliance with all required Laws and
Regulations. An example of this mechanism is shown below.
Achieving the goals laid out in the Management Dashboard System is something every company wants to accomplish,
but it is sometimes harder than expected and people may lose confidence in their ability to achieve the goals discussed
above. The benefits to this approach outweigh the difficulties though and you should strive to achieve them, especially
if you integrate this process within the everyday functions performed by your staff. Once that is achieved, your
company will always be safeguarded against disaster, problem, or incident events, while always in compliance.
I hope you enjoyed this White Paper and have gained from it. Should you have any questions or comments, please
direct them to me at:
Thomas Bronack
Email: [email protected]
Phone: (917) 673-6992
Thank you.

Management Dashboard System Release Date: May 22, 2014
Thomas Bronack © Page: 30 Product Overview Document
Thomas Bronack
Certified Business Continuity Professional from the Disaster Recovery Institute International (DRII)
“Enterprise Resiliency and Corporate Certification”
Email: [email protected] Phone: (917) 673-6992 Web Site: www.dcag.com
Tom Bronack is a senior Information Technology contributor specializing in Enterprise Resiliency
and Corporate Certification which includes the combining of all recovery management disciplines
under one department (with a common glossary of terms and set of tools) and establishing Risk
and Compliance adherence to all of the required laws and regulations of countries where the
client company conducts business. Mr. Bronack has also assisted in the implementation of Multi-
Data Center environments that have crossed continents, countries, cultures, languages, and time
zones. Tom started his career at IBM in the NYC Banking Office where he was trained on
Mainframe Computer hardware and software systems and provided support to all of the major
banks and financial organizations in lower Manhattan. Tom has designed, implemented,
supported, consolidated, and terminated data centers for clients since leaving IBM.
One of his projects required the insourcing of a distributed Information Technology enterprise, that had been supported
through vendor contracts and outsourced environments, so that the client could better control their IT Resources and
implement a leading edge, Green 100% Certified environment. This typical project included: conducting an Inventory of
existing resources at all outsourced environments (created a Global Inventory Data Base); building three regional
production data centers (Asia, Europe, Americas); Transitioning the original equipment to the production sites and
verifying that operations were maintained in the same, or better, manner as before; Virtualizing the three production
sites and building a Recovery Data Center; verifying that the production sites could be recovered at the recovery site
within the Recovery Time Objectives contained in client contracts; implementing a new and improved Systems
Development Life Cycle (SDLC); and integrating all updated functions and responsibilities within the everyday duties
performed by the staff so that all production, compliance, and recovery operations were constantly maintained in a
current and accurate state.
Tom is a Certified Business Continuity Professional (CBCP) from Disaster Recovery Institute International and has been a
member of the Board of Directors for the Association of Contingency Planners (NYC Metro Chapter) for over three years.
Mr. Bronack also developed a Management Dashboard System that covers: Infrastructure, SDLC, Recovery
Management, and Risk and Compliance Management. This system provides current and accurate information to project
members so that systems and applications can be introduced to the production environment safely and in compliance
with all regulations and standards. The Management Dashboard System allows access from any place at any time to
check on status and can be used to drill down to the person performing the current work for discussion or assistance.
Mr. Bronack is currently under contract with the Disaster Recovery Institute International (DRII) to develop an
Information Technology Disaster Recovery course covering Physical, Virtual, Cloud, and Co-Location facilities with a
section on Virtual Desktop Infrastructure (VDI) to support desktop security, mobile devices, and BYOD uses. The course
will be delivered in a two-day classroom or Computer Based Training (CBT) method.
Contact Tom should you be interested in his services or would like to arrange for a demonstration of the Management
Dashboard System.