MAN GAN ESE€¦ · MAN GAN ESE The Glob a lPic ture – A Soc ioEc onom ic Asse ssm e nt
58
MAN GAN ESE The Glob a lPi ctur e – A SocioE c onom i cAss essment
Transcript of MAN GAN ESE€¦ · MAN GAN ESE The Glob a lPic ture – A Soc ioEc onom ic Asse ssm e nt

MAN GAN ESEThe Glob a lPic ture – A Soc ioEc onom ic Asse ssm e nt

Copyrig ht© 2015Risk & Polic yAna lystsLtd .AllRig htsRe se rve d .
Cove rim a g e c ourte syofthe Inte rna tiona lM a ng a ne se Institute
Thisd oc um e ntwa spre pa re d b yRisk & Polic yAna lystsLtd (RPA) forthe spe c ific use ofthe Inte rna tiona lM a ng a ne se Institute (IM nI)
a nd isnotto b e use d ,d istrib ute d orre lie d upon b ya nythird pa rtywithoutpriorc onse nt. The a na lysisa nd opinionsc onta ine d in
thisre porta re b a se d onpub lic lya va ila b le sourc e sa nd ,a lthoug h re a sona b le e ffortsha ve b e e nm a d e toe nsure tha tthe c onte ntsof
thisre porta re fa c tua llyc orre c t,RPA m a ke snore pre se nta tionorwa rra nty,e xpre ssorim plie d ,tha tsuc h inform a tionisa c c ura te or
c om ple te .Allre c ipie ntsofthism a te ria lm ustm a ke the irown ind e pe nd e nta sse ssm e ntofthe m a te ria l,a nd ne ithe rRPA northe
IM nIsha llb e lia b le fora nyd ire c t,ind ire c torc onse que ntia llossord a m a g e suffe re d b ya nype rson a sa re sultofre lying on a ny
sta te m e ntin,ora lle g e d om issionfrom ,thism a te ria l.
Re c om m e nd e d c ita tion:
RPA (2015): M a ng a ne se ,The Glob a lPic ture – A Soc io Ec onom ic Asse ssm e nt,re portforthe Inte rna tiona lM a ng a ne se Institute ,
Lod d on,N orfolk,U K.
Re portpre pa re d b y:
Postle M ,N wa og uT,U psonS,Cla rk C,He ine ve tte rA
Risk & Polic yAna lystsLtdFa rthing Gre e nHouse1Be c c le sRoa dLod d on,N orfolkN R14 6LTU nite d King d omTe l:+44 (0)1508 528465W e b :www.rpa ltd .c o.uk
Inte rna tiona lM a ng a ne se Institute17rue Duphot75001Pa risFra nc eTe l:+33 (0)14563 06 34W e b :http://www.m a ng a ne se .org

Table of Contents
Executive Summary 1
1. Introduction 3
2. Manganese Ore 4
3. Manganese Alloy 9
4. Manganese in Steel 14
4.1 Manganese in Carbon Steel 16
4.2 Manganese in Construction & Engineering Steel 17
4.3 Advanced High Strength Steels 18
4.4 Manganese in Austenitic Mn Steel 20
4.5 Manganese in Stainless Steel 22
4.6 Manganese in HSLA Steels 24
5. Manganese – Impacts on Industry & Society 26
5.1 Agriculture 27
5.2 Batteries 28
5.3 Healthcare 30
5.4 Aluminium 32
5.5 Slags and Cement 34
5.6 Electronics 35
5.7 Water 36
6. Manganese – Regional Impacts 38
7. Conclusion 46
References 47

| 1
Executive SummarySocio-economic assessment (SEA) is the term used to describe a set of analytical tools and approaches for analysing the net
social and economic impacts associated with a specific product, process or activity. It is an important tool for assessing the
total contribution of an activity or sector to the economy, its overall impacts on society as a whole and the trade-offs involved
in any policy decision that affects the productive activities of a sector. There is a growing recognition that industry benefits
from being more proactive in the development and use of SEA. Indeed, many industry sectors have prepared their own SEAs
with the aim of providing additional evidence on the contribution and role of their activities to economies around the world.
This report presents the findings of the first global SEA on Manganese (Mn). The study is based on a top-down analysis of
the key supply chains for Mn, starting from Mn ore production, through Mn alloy production and focussing on the major
downstream sector (the steel industry), as well as selected uses of Mn and Mn-containing products. It outlines the economic
importance of Mn ore and alloys in terms of their direct and indirect economic value, as well as their effects on employment
(jobs and wages). In compiling this report, we have utilised production and economic data relating to Mn and its use sectors,
as well as a range of modelling tools and methodologies to assess, in economic terms, the criticality of Mn to the steel
industry, based on the unique physico-chemical properties of Mn and the specific qualities that it imparts to particular steel
products. As well as financial and economic benefits, there are also social, environmental and human health benefits
associated with the use of Mn in its downstream applications. These benefits have been identified and monetised where
possible (taking into account data
availability) and the socio-
economic contribution of Mn at
regional and national levels have
been highlighted.
Key Findings
The mining of Mn ore and
production of Mn ferroalloys make
significant economic and social
contributions to national and
regional economies where these
activities take place. In 2013,
global production of Mn ore
totalled ~58 million Mt and was
worth an estimated US $10.2 -
$11.1 billion to the global economy
(this value is based on market prices
and quantities of Mn ore produced).
Key figures are as follows:
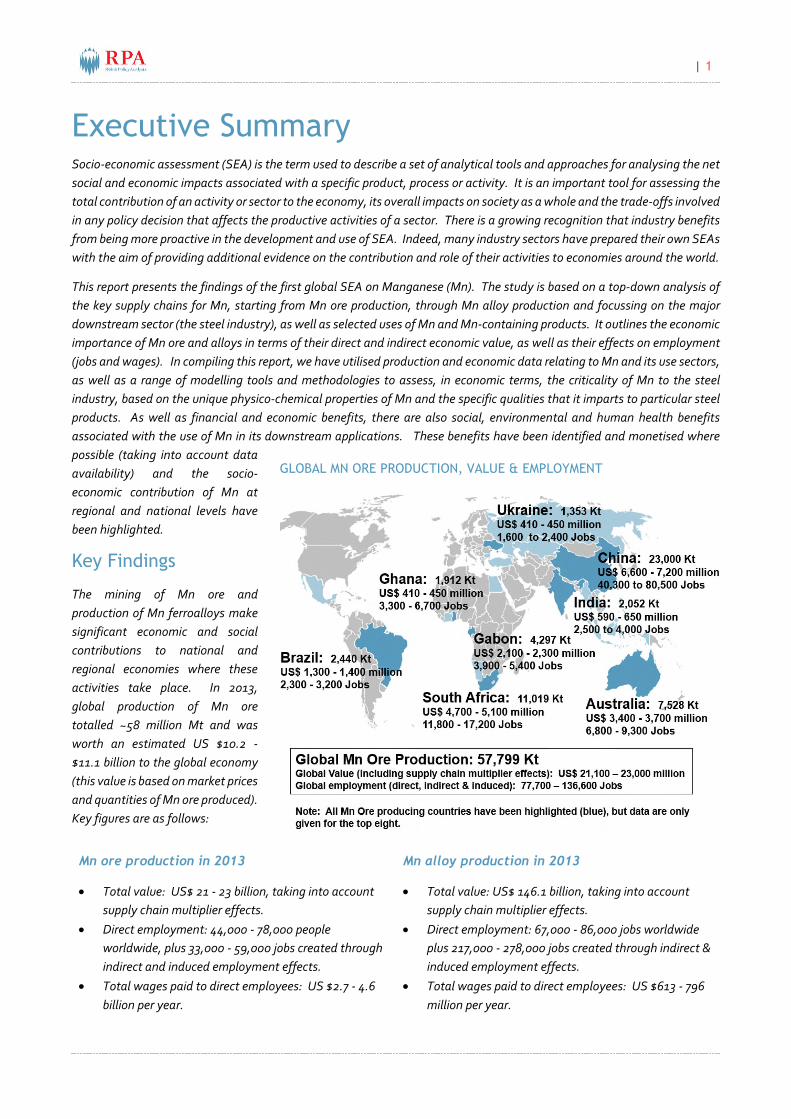
Mn ore production in 2013
Total value: US$ 21 - 23 billion, taking into account
supply chain multiplier effects.
Direct employment: 44,000 - 78,000 people
worldwide, plus 33,000 - 59,000 jobs created through
indirect and induced employment effects.
Total wages paid to direct employees: US $2.7 - 4.6
billion per year.
Mn alloy production in 2013
Total value: US$ 146.1 billion, taking into account
supply chain multiplier effects.
Direct employment: 67,000 - 86,000 jobs worldwide
plus 217,000 - 278,000 jobs created through indirect &
induced employment effects.
Total wages paid to direct employees: US $613 - 796
million per year.
GLOBAL MN ORE PRODUCTION, VALUE & EMPLOYMENT

2 |
Applications & Importance
Manganese is a critical raw material input and additive for the steel industry. Overall, it could be argued that, without Mn, the
entire steel industry (based on the current physico-chemical properties of steel) would not exist and, as a result, the entire value
of the steel industry – an estimated US$ 964 billion to US$ 1,446 billion in 2013 – is reliant on the continued supply of Mn. There
is, however, some potential for product substitution for certain steel types. Examples of key downstream uses in steel and other
applications are given below.
Advanced High Strength Steels (AHSS) AHSS
provide excellent ductility and strength when compared
to conventional steels. This is important in automotive
applications as it can lead to weight reduction, lower fuel
consumption and associated emissions, and improved
crashworthiness. The use of AHSS in motor vehicles
could lead to global savings of between 8 and 28 million
Mt of CO2 per year and fuel savings in the region of 0.35-
1.13 l/km per car (equating to an annual global fuel cost
saving of US$ 435 - 1,400 billion).
Engineering Steels Engineering steels require critical
and often stringent levels of elasticity, strength, ductility,
toughness and fatigue resistance and, in some cases,
may also require resistance to high or low temperatures,
corrosive and other aggressive environments. Mn is an
essential component in these steels and can also be used
to adjust their mechanical properties.
Stainless Steels Mn is a
key component of low-cost
stainless steel formulations,
notably S200-series stainless.
The market for S200 steel is
valued at around US $13
billion per year and could
reach US$ 18.7 billion - 35.7
billion by 2020. This niche
market would not exist
without Mn.
MAIN USES OF MN ORE
Sources: CPM Group (2010) and Ideas First Research (2010)IMnI (2015, pers. comm.)
Agriculture Mn is a trace mineral that is essential for
the metabolism of all living organisms (plants and
animals). Mn deficiency is common in the soils of many
locations globally. For example, in northern Indiana,
USA, it is estimated that it could lead to annual losses for
soybean producers of between US $196 - 392 million, if
Mn-containing fertiliser is not applied.
Batteries Development of the lithium manganese oxide
(LMO) battery could offer the opportunity for the wide-
scale introduction of battery electric vehicles (BEVs).
Assuming that BEVs make up 15% of all new car sales by
2020 and that 50% of future electric vehicles contain the
LMO battery, the total value of CO2 emissions reductions
could be between US$ 723 -5,214 million for the European
Union (EU). If 80% of future electric vehicles contain the
LMO battery, reductions of between US$ 1,157 - 8,343
million could be expected in the EU. In addition, this
would lead to reductions in PM10 emissions and hence
pollution related health effects.
SiMn Slag Approximately 65% of the fuel used in
cement production is used in the calcination phase.
Because SiMn slag is precalcined, its use as an alternative
to limestone can reduce CO2 emissions. Furthermore, if
SiMn slag is used, less fuel needs to be burned, which
results in further emissions reductions. Recent research
also points to Mn slag conveying enhanced physical and
mechanical properties to cement

| 3
1. IntroductionManganese (Mn) plays a very important role in the global economy, even if the dependence of various industry sectors,
products and/or applications on Mn is not always recognised.
In 2013, approximately 53 million metric tonnes (mt) of Mn ore
(wet) was produced globally, making Mn the fourth most
consumed metal after iron, copper and aluminium. The
production and processing of Mn ore and Mn alloys, as well as the
associated capital and operating expenditures, make significant
economic and social contributions to local, national and regional
economies where these activities take place, as measured by
indicators such as gross domestic product (GDP), employment,
tax revenues, etc.
Mn is also a critical raw material input and process additive for the
steel industry and the continued growth of this industry relies on
Mn. Indeed, demand for Mn ore and alloys depends directly on
the needs of the steel industry and it can be observed that
international consumption of Mn ore is closely associated with
the emerging economies, with China accounting for over half of
total global consumption.
Besides steel, Mn has a number of other important downstream uses which make significant contributions to national
and global economies each year. For example, Mn is a critical element in the manufacture of Mn batteries (notably,
those used in electric vehicles), the production of aluminium alloys (e.g. for beverage cans) and in consumer electronics
(e.g. television circuit boards). Mn is also an essential micronutrient needed for plant growth and plays a vital role in
agricultural production. It is also critical for maintaining the health and well-being of the human body and is used in food
supplements and medicines.
This report provides the results of the first global study on the socio-economic importance of Mn. It is based on a top-
down analysis of the key supply chains for Mn, starting from Mn ore production, through Mn alloy production and
covering the major downstream user sector, the steel industry. It outlines the economic importance of Mn ore and alloys
in terms of their direct and indirect economic value, as well as their effects on employment (jobs and wages). In
compiling this report, we have utilised production and economic data relating to Mn and its use sectors, as well as a
range of modelling tools and methodologies to assess, in economic terms, the criticality of Mn to the steel industry,
based on the unique physico-chemical properties of Mn and the specific qualities that it imparts to particular steel
products. As well as financial and economic benefits, there are also social, environmental and human health benefits
associated with the use of Mn in its downstream applications. These benefits have been identified and monetised where
possible (taking into account data availability) and the socio-economic contribution of Mn at regional and national levels
have been highlighted.
Socio-economic analysis provides the tools and methods for estimating the social and economic benefits of an industry
to a community, ranging from a single neighbourhood to the global community as a whole. It provides a well-established
framework for calculating the social and economic importance of the products in which an element, such as Mn, is used.
Ultimately, this report sets out how the production and use of Mn is helping to meet society’s needs in a sustainable
way, with the aim of ensuring that some of the economic benefits that have so-far not been well understood are better
recognised by governments and other key stakeholders.
Socio-economic assessment (SEA) is the
term used to describe a set of analytical tools
and approaches for analysing the net social
and economic impacts associated with a
specific product, process or activity. It is an
important tool for assessing the total
contribution of an activity or sector to the
economy, its overall impacts on society as a
whole and the trade-offs involved in any
policy decision. This report presents the
findings of the first global SEA on Mn.

4 |
2. Manganese OreReserves
Manganese (Mn) is found as a free element in nature (often in
combination with iron) and is the 12th most abundant element in
the earth’s crust. It is one of the most widely used and versatile
chemical elements in the world and is the fourth most consumed
metal (after iron, copper and aluminium).1 Currently, only 12 of
the 300 minerals containing Mn are of mining significance.
Current estimates of world Mn ore reserves reach several billion
tonnes.2 In terms of metal content, global Mn reserves are
estimated to lie in the region of 570 million mt, with South Africa
containing between 85% and 92% of the world’s high grade Mn
ore. Although significant Mn ore deposits are widely distributed
across China, there are no reserves of high grade Mn ore in the
country.
Mn reserves, in the form of polymetallic nodules, have also been
discovered on deep ocean floors and are seen as a potentially
valuable source of Mn in the long-term future.
ESTIMATED GLOBAL MN RESERVES(METAL CONTENT, KILOTONNES)
Country Estimated Reserves
South Africa 150,000
Ukraine 140,000
Australia 97,000
Brazil 54,000
India 49,000
China 44,000
Gabon 24,000
Kazakhstan 5,000
Mexico 5,000
Other countries Small
World total (rounded) 570,000
Source: USGS (2014)
GLOBAL MN RESERVES BY COUNTRY

| 5
Production & Consumption
Production
In 2013, approximately 58 million mt of Mn ore (wet) was
produced globally, with the five major producers being
China, South Africa, Australia, Gabon and Brazil. All are
major seaborne exporters, except for China, which
imports approximately 50% of its requirements.
In 2013, production of high grade ores stood at 16 million
mt (wet), with Australia, Gabon, South Africa and Brazil,
supplying over 95% of the international market. Medium
grade ores accounted for around 16 million mt (wet);
Australia, South Africa and India were the three major
producers. Low grade ores accounted for around 26
million mt (wet), with the market dominated by China.
China accounts for around 40% of global Mn ore
production and produces nearly 90% of the world’s low
grade Mn ore.
Consumption
Demand for Mn depends directly on the needs of the steel
industry and so international consumption of Mn ore is
closely associated with the emerging economies.
In 2013, total global consumption of Mn ore stood at 17.4
million mt (metal content), up 4.2% on 2012 (16.7 million
mt). China accounted for the majority of all Mn ore
consumed (62%). India, Ukraine and South Korea
accounted for a further 16% of global Mn ore
consumption.
MN ORE PRODUCTION BY GRADE AND COUNTRY(2013) (KILOTONNES, WET)
0
5,000
10,000
15,000
20,000
25,000 High Grade Ore
Medium Grade Ore
Low Grade Ore
GLOBAL MN ORE PRODUCTION (2010-2013)
(KILOTONNES)
GLOBAL MN ORE CONSUMPTION (KILOTONNES,CONTENT)
6 |
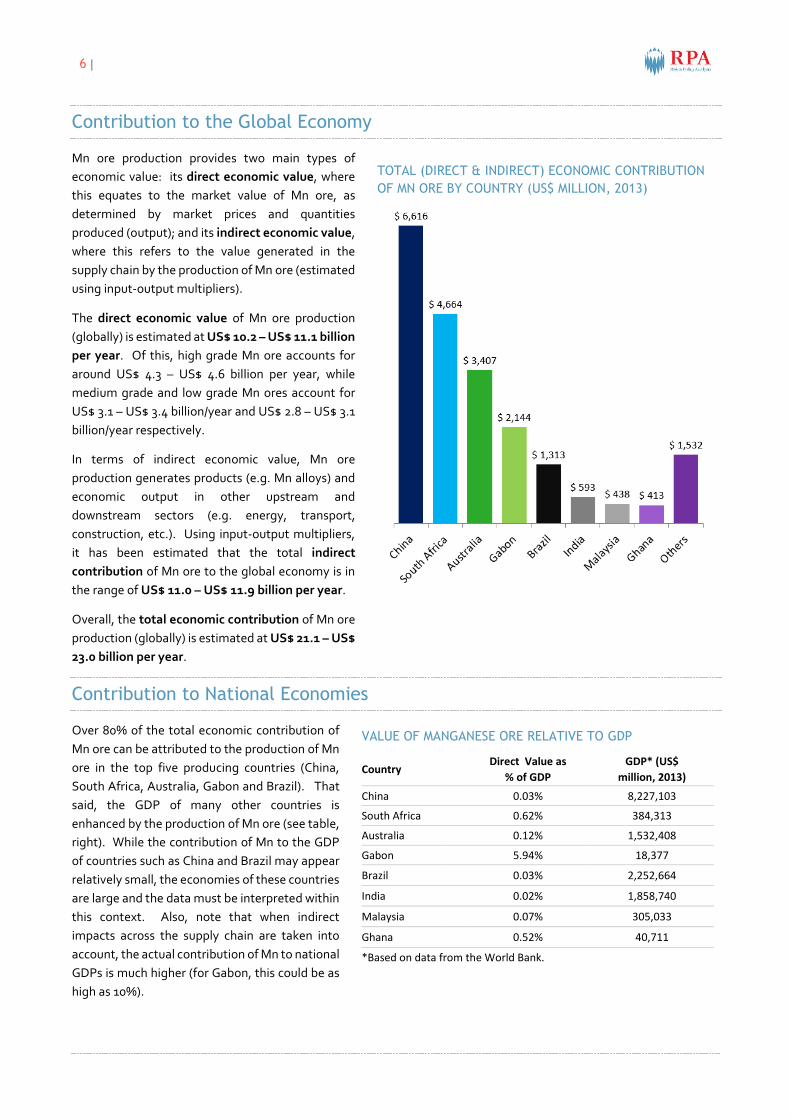
Contribution to the Global Economy
Mn ore production provides two main types of
economic value: its direct economic value, where
this equates to the market value of Mn ore, as
determined by market prices and quantities
produced (output); and its indirect economic value,
where this refers to the value generated in the
supply chain by the production of Mn ore (estimated
using input-output multipliers).
The direct economic value of Mn ore production
(globally) is estimated at US$ 10.2 – US$ 11.1 billion
per year. Of this, high grade Mn ore accounts for
around US$ 4.3 – US$ 4.6 billion per year, while
medium grade and low grade Mn ores account for
US$ 3.1 – US$ 3.4 billion/year and US$ 2.8 – US$ 3.1
billion/year respectively.
In terms of indirect economic value, Mn ore
production generates products (e.g. Mn alloys) and
economic output in other upstream and
downstream sectors (e.g. energy, transport,
construction, etc.). Using input-output multipliers,
it has been estimated that the total indirect
contribution of Mn ore to the global economy is in
the range of US$ 11.0 – US$ 11.9 billion per year.
Overall, the total economic contribution of Mn ore
production (globally) is estimated at US$ 21.1 – US$
23.0 billion per year.
Contribution to National Economies
Over 80% of the total economic contribution of
Mn ore can be attributed to the production of Mn
ore in the top five producing countries (China,
South Africa, Australia, Gabon and Brazil). That
said, the GDP of many other countries is
enhanced by the production of Mn ore (see table,
right). While the contribution of Mn to the GDP
of countries such as China and Brazil may appear
relatively small, the economies of these countries
are large and the data must be interpreted within
this context. Also, note that when indirect
impacts across the supply chain are taken into
account, the actual contribution of Mn to national
GDPs is much higher (for Gabon, this could be as
high as 10%).
TOTAL (DIRECT & INDIRECT) ECONOMIC CONTRIBUTION
OF MN ORE BY COUNTRY (US$ MILLION, 2013)
VALUE OF MANGANESE ORE RELATIVE TO GDP
CountryDirect Value as
% of GDP
GDP* (US$
million, 2013)
China 0.03% 8,227,103
South Africa 0.62% 384,313
Australia 0.12% 1,532,408
Gabon 5.94% 18,377
Brazil 0.03% 2,252,664
India 0.02% 1,858,740
Malaysia 0.07% 305,033
Ghana 0.52% 40,711
*Based on data from the World Bank.

| 7
THE CONTRIBUTION OF MN ORE TO THE GLOBAL ECONOMY (2013)
Ch
ina
Direct Contribution
2,530 - 2,760 (US$, million)
Indirect Contribution
4,086 - 4,457 (US$, million)
Total Contribution
6,616 - 7,217 (US$, million)
Sou
thA
fric
a
Direct Contribution
2,375 - 2,590 (US$, million)
Indirect Contribution
2,289 - 2,497 (US$, million)
Total Contribution
4,664 - 5,088 (US$, million)
Au
stra
lia
Direct Contribution
1,817 - 1,982 (US$, million)
Indirect Contribution
1,590 - 1,734 (US$, million)
Total Contribution
3,407 - 3,717 (US$, million)
Gab
on
Direct Contribution
1,092 - 1,191 (US$, million)
Indirect Contribution
1,052 - 1,148 (US$, million)
Total Contribution
2,114 - 2,339 (US$, million)
Bra
zil
Direct Contribution
621 - 677 (US$, million)
Indirect Contribution
692 - 755 (US$, million)
Total Contribution
1,313 - 1,433 (US$, million)
Ind
ia
Direct Contribution
390 - 425(US$, million)
Indirect Contribution
203 - 222 (US$, million)
Total Contribution
593 - 647 (US$, million)
Mal
aysi
a
Direct Contribution
211 - 230 (US$, million)
Indirect Contribution
227 - 248 (US$, million)
Total Contribution
438 - 478 (US$, million)
Gh
ana
Direct Contribution
210 - 229 (US$, million)
Indirect Contribution
203 - 221 (US$, million)
Total Contribution
413 - 451 (US$, million)
Ukr
ain
e
Direct Contribution
260 - 284 (US$, million)
Indirect Contribution
148 - 161 (US$, million)
Total Contribution
408 - 445 (US$, million)
Kaz
akh
stan
Direct Contribution
231 - 252 (US$, million)
Indirect Contribution
131 - 143 (US$, million)
Total Contribution
363 - 396 (US$, million)
Oth
ers
Direct Contribution
430 - 469 (US$, million)
Indirect Contribution
332 - 362 (US$, million)
Total Contribution
762 - 831 (US$, million)
Wo
rld
Direct Contribution
10,167 - 11,091 (US$, million)
Indirect Contribution
10,954 - 11,949 (US$, million)
Total Contribution
21,121 - 23,041 (US$, million)

8 |
Industry Employment
Direct Employment
Between 44,000 and 78,000 people are directly employed in Mn ore production globally. Uncertainties in the exact
figure are due to a lack of reliable data from China, which accounts for over 50% of all direct employment in Mn ore
mining. South Africa is the second largest employer in Mn ore mining, followed by Australia (although this could change
based on planned mine closures/openings). In total (globally), between US$ 2,700 million and US$ 4,600 million per
annum is paid in wages to those employed directly in the production of Mn ore, with workers in China, Australia and
South Africa accounting for the majority (~80%) of wages paid.
Indirect / Induced Employment
The production of Mn ore creates indirect employment
(estimated at 22,000 to 39,000 people) in businesses that
supply goods and services to the Mn ore mining sector (e.g.
transport and logistics, machinery and repairs, etc.). It also
creates induced employment estimated at a further 11,000
to 20,000 jobs as a result of income (wages) from direct and
indirect employment being re-spent on final goods and
services. In total, it is estimated that between 77,000 and
136,600 people are employed as a result of Mn ore
production worldwide.
TOTAL EMPLOYMENT IN MN ORE PRODUCTION
ESTIMATE OF WAGES FOR MN ORE (US$ MILLION)
Country Low Estimate High Estimate
China 1,182 2,364
Australia 529 727
South Africa 462 673
Gabon 147 200
Brazil 99 139
Ghana 75 150
India 66 106
Ukraine 49 73
Malaysia 32 48
Mexico 22 33
Others 69 107
Total 2,731 4,620

| 9
3. Manganese AlloyProduction & Consumption
Production
Globally, most of the Mn ore used by the steel
industry is processed into suitable metallic alloy
forms before being used in steel production. There
are three main Mn-containing ferroalloys used for
steelmaking:
Silicomanganese (SiMn), which accounts for
around 70% of all Mn alloys produced;
High Carbon Ferromanganese (HC FeMn),
which accounts for around 20% of all Mn alloys
produced; and
Refined Ferromanganese (Ref FeMn),
(medium-carbon (MC) and low-carbon (LC))
which account for around 10% of all Mn alloys
produced.
In 2013, production of Mn alloys totalled 19 million
mt, up 8% on 2012. Production of SiMn totalled
13.2 million mt, while production of HC FeMn and
Ref FeMn accounted for 4.2 million mt and 1.7
million mt respectively.
Consumption
China is the world’s largest consumer of Mn alloy
(all types), consuming 11.5 million mt in 2013.
Globally, the most consumed alloy type is SiMn,
which is primarily used for the production of steel
long products and critical elements in the
construction industry. China (8.52 million mt),
India (0.76 million mt), the United States (0.45
million mt) and Russia (0.37 million mt) are all
important consumers of SiMn. Both HC FeMn and
Ref FeMn are used to make flat and quality steel
products and require the use of high grade ore.
Important consumers of Ref FeMn include China
(0.85 million mt), the Japan (0.14 million mt) and
the United States (0.13 million mt). China (which
consumed 2.09 million mt of HC FeMn in 2013),
Japan (0.44 million mt) and India (0.41 million mt)
are important consumers of HC FeMn.
GLOBAL MN ALLOY PRODUCTION (MILLION MT)
GLOBAL (APPARENT) MN ALLOY CONSUMPTION
(2013, MILLION MT)

10 |
GLOBAL MN ALLOY PRODUCTION
(2013, KILOTONNES)
MN ALLOY APPARENT CONSUMPTION
(2013, KILOTONNES)

| 11
Contribution to the Global Economy
In terms of direct economic value, the global
production of Mn alloy is valued at around US$ 23
billion per year, based on global production of
around 19 million mt and 2013 market prices. As
indicated in the table below, China contributed
approximately US$ 14.4 billion worth of Mn alloy to
the global economy in 2013, which is approximately
half of the total value of all Mn alloy produced. Large
contributions to the global economy were also made
by Mn alloy producers in India (US$ 2.5 billion),
South Africa (US$ 0.9 billion) and Ukraine (US$ 0.8
billion).
Global production of SiMn is valued at US$ 15.8
billion per year, while HC FeMn and Ref FeMn
account for US$ 5.1 billion and US$ 2.1 billion
respectively. In total, the value of Mn alloy
production worldwide, taking into account
downstream multiplier effects in the supply chain, is
estimated at around US$ 146 billion per year, of
which China accounts for 74%. SiMn accounts for
around 70% of the total economic contribution of Mn
alloys and HC FeMn and Ref FeMn account for 20%
and 10% respectively.
TOTAL CONTRIBUTION OF MN ALLOY TO THE GLOBALECONOMY (US$, BILLION)
CountryDirectValue
IndirectValue
TotalValue
China 14.38 94.40 108.79
India 2.51 8.49 11.00
South Korea 0.63 4.28 4.91
Ukraine 0.83 2.51 3.34
South Africa 0.86 2.43 3.29
Japan 0.60 2.22 2.82
Norway 0.76 1.90 2.66
Russia 0.35 1.07 1.42
Spain 0.30 0.91 1.21
Kazakhstan 0.23 0.71 0.95
Others 1.66 4.04 5.70
World 23.11 122.96 146.07
ESTIMATED PRODUCTION VALUE(US$ BILLION, 2013)
TOTAL (DIRECT & INDIRECT) CONTRIBUTION OF MN ALLOYBY COUNTRY (2013)

12 |
Industry Employment
Direct Employment
Between 67,000 and 86,000 people are directly
employed in the production of Mn alloys globally. As
indicated in the figure (next page), approximately 87%
of direct employment in Mn alloy production can be
found in China. This is to be expected, given that
China accounts for nearly two thirds of all Mn alloy
production. India is the next most important
employer, followed by Brazil.
When broken down by type of Mn Alloy, as would be
expected, SiMn is the main source of direct
employment in Mn alloy production, accounting for
between 50,000 and 64,000 direct jobs. HC FeMn
accounts for between 12,000 and 16,000 direct jobs,
while 5,000 to 7,000 people are directly employed in
the production of Ref FeMn.
Indirect/Induced Employment
It is estimated that there are between 202,000 and
258,000 people indirectly employed in the production
of Mn alloys globally and a further 15,000 to 22,000
jobs are created through induced employment
effects. Overall, total employment (i.e. direct, indirect
and induced) relating to the production of Mn alloy (all
types) is estimated at between 284,000 and 366,000
people globally. The vast majority of jobs created in
the production of Mn alloy are located in China
(around 87% of all jobs - direct, indirect and induced).
India, Brazil and Kazakhstan account for a further 6%
of all employment in Mn alloy production.
In total, between US$ 621 million and $809 million per
annum is paid in wages to those employed directly in
the production of Mn alloys (worldwide), with workers
in China, Norway and Japan accounting for the
majority of wages paid.
TOTAL (GLOBAL) EMPLOYMENT IN MN ALLOY PRODUCTION
Direct Jobs
67,000 - 86,000
Indirect Jobs
202,000 - 258,000
Induced Jobs
15,000 - 22,000
Total Jobs
284,000 - 366,000
ESTIMATE OF WAGES FOR MN ALLOYS (US$ MILLION)
Country Low Estimate High Estimate
China 474.8 593.4
Norway 40.6 60.8
Japan 19.5 29.3
Spain 16.6 24.9
Brazil 13.8 17.2
South Korea 11.2 16.8
France 8.0 12.1
United States 7.8 11.7
Australia 7.6 11.4
Kazakhstan 4.3 5.4
Others 17.2 25.9
World 621.4 808.8
EMPLOYMENT BY ALLOY TYPE

| 13
ESTIMATE OF TOTAL EMPLOYMENT IN MN ALLOY PRODUCTION (ALL ALLOY TYPES, LOW ESTIMATE)

14 |
4. Manganese in SteelOverview
By far, the most important use of
Mn worldwide is as a process
additive and alloying material in
steelmaking. Mn is intentionally
present and used as an alloying
element in almost all types of steel
and is a residual constituent of all
others, making it the most
prevalent alloying agent, after
carbon.
As can be seen from the table
below, large additions of Mn
(about 12% to 13%) are used to
make certain types of steel (e.g.
Hadfield steel), however, the vast
majority of steel production results
in multi-purpose carbon steels
containing around 0.5% Mn.
Production & Consumption
Global production of crude steel has increased
significantly since the early part of the 20th century,
from a few tens of million mt in 1900 to approximately
1,600 million mt in 2013. Today, there are over 3,500
different grades of steel, encompassing unique
physical, chemical and environmental properties. In
2013, China produced around 48% of the world’s steel.
It is anticipated that production of crude steel will
continue to increase over the next 20 years, reaching
approximately 2,500 million mt by 2030.3
STEEL TYPES RELEVANT TO MN
% of SteelProduced
% of MnConsumption
Mn
Content
Growth
per Year
High Mn ContentSteels
High Mn Non-Magnetic Steel
1% 8% 11% 6.5%
Hadfield Steel 1% 9% 13% 8.0%
Stainless (200-Series)
0.4% 3% 12% 12.0%
Low Mn ContentSteels
Carbon Steel 87% 59% 0.5% 6.0%
HSLA Steel 7% 13% 1.5% 12.0%
Engineering/Construction Steel
3% 3% 1% 7.6%
Stainless (excl. 200-Series)
2% 3% 1% 8.0%
Total 100% 100% - -
MAIN USES OF MN ORE
Sources: CPM Group (2010), Ideas First Research (2010), IMnI (2015, pers. comm.)
WORLD CRUDE STEEL PRODUCTION
2000 TO 2030 (MILLION TONNES)
Source: BHP Billiton (2013)

| 15
In line with crude steel production, apparent global steel
consumption has increased from just below 800 million mt in 2000 to
just under 1,500 million mt in 2013. One of the key reasons for this
growth has been a significant increase in steel demand from China (in
2000, China accounted for just 16% of total world apparent steel use;
by 2013 this had risen to 47%). However, other developing regions
have also seen an increase in their contribution to global steel use
over this period.
As indicated in the pie-charts (right), over half of global steel
production is used in the construction industry, with this proportion
increasing to 57% when considering emerging economies alone (data
for 2011). Other important sectors in which significant quantities of
steel are used include mechanical machinery, metal products and the
automotive industry, which account for 14%, 13% and 12% of global
steel use respectively.
The Economic Value of Mn in Steel
The economic value of Mn in the context of steel making derives from
two key aspects:
Firstly, in its use as an alloying material, there are no known
alternatives to Mn in the steel making process; and
Secondly, Mn is basically the most cost-effective
hardenability intensifier available and this is the reason it is
used in all standard treatable steels. While Mn is not as
powerful as nickel in its ability to stabilize austenite and more
Mn is required to achieve the same effect, Mn has the
advantage of being much less expensive and its effects can be
reinforced by combining it with nitrogen, which is also an
austenite-forming element.
Overall, it could be argued that, without Mn, the entire steel industry
(based on the current physico-chemical properties of steel) would not
exist and, as a result, the entire value of the steel industry – an
estimated US$ 964 billion to US$ 1,446 billion in 2013 – is reliant on
the continued production and use of Mn.
It is important to note that, at a more specific product level, there
may be the potential for substitution of Mn in some uses. For
example, in theory, there are technical substitutes to Mn in its use as
a mild deoxidizer and desulphuriser; however, there are significant
trade-offs (some of which are intended and acceptable) associated
with adopting some of these substitutes. Likewise, it may also be
possible to substitute Mn in some of the high Mn content steels (e.g.
high Mn non-magnetic steels, Hadfield steel, stainless (200 series)
steel) with other metals (e.g. Nickel, Boron, etc.) to produce
alternative steels which confer alternative properties.
WORLD STEEL USE BY SECTOR (2011)
Source: Han (2012)

16 |
4.1 Manganese in Carbon SteelBackground
Steel is classified as carbon steel when no minimum content is specified or required for elements such as chromium,
cobalt, nickel or titanium (among others); when the specified minimum for copper does not exceed 0.40%; or when the
maximum content specified for manganese is less than 1.65%, silicon (<0.60%), copper (<0.60%).4 It is the most basic
and versatile type of steel available and is produced in greater quantities than any other steel (accounts for over 80% of
total steel produced).
Criticality of Mn in Carbon Steel
Mn is used as a process additive (deoxidizer and
desulphuriser) in the production of most carbon
steels. It reduces the tendency towards hot-shortness
(i.e. cracking), resulting from the presence of sulphur,
which enables the metal to be hot-worked.5
Although the use of Mn as a deoxidizer and
desulphuriser has declined in recent years (e.g. with
the advent of hot-metal desulphurization and ladle
deoxidation), its use in steelmaking still relies on
these properties to a large extent.6
As an alloying element, Mn improves the physical
qualities of steel by improving its strength,
toughness, hardness and workability, making it less
brittle, easier to form and more resistant to shock,
abrasion and corrosion.7 The Mn content in carbon
steels is often increased for the purpose of increasing
depth of hardening and improving strength and
toughness.8 By countering the brittleness caused by
sulphur, Mn also has a beneficial effect on the surface
finish of carbon steel.9 Carbon steels with Mn content
(from 1% - 1.8%) are also known as carbon-
manganese steels.
Economic Importance of Mn
It has been estimated that 1.40 billion mt of
carbon steel was produced in 2013, worth an
estimated US$ 839 billion to US$ 1,259 billion.
Since Mn is present in all carbon steels (either as a
residual element, e.g. from its use as a process
additive, or as an alloying element used to impart
specific properties to the final steel), the entire
value of the carbon steel market can be said to be
dependent on the production and use of Mn.
KEY USES OF CARBON STEEL
Steel Type Applications
Low Carbon Used to make flat-rolled sheets or steelstrips for ships, wire products, car bodies,domestic appliances and tin plates. Alsoused for making bolts, bridges, buildings,forgings, gears, nails, pipes, rivets,screws and shafts.
MediumCarbon
Used to make auger bits, axles (includingfor cars), boilers, connecting rods, crankpins, crankshafts, drop forgings, forgings,gears, hammers, pipelines, rails andrailway wheel assemblies, screwdrivers,shafting, sledges.
High Carbon Used to make cutting tools, blades,springs and high-strength wires. Alsoused to make hammers, screwdrivers,saws, drills and other general tools.
Ultra-HighCarbon
Used for specialist applications, e.g. (non-industrial-purpose) knives, axles orpunches; blades and cutting, milling andprecision tools; surgical cutlery; twistdrills; pipe cutters; circular cutters; razors;engravers; saws for cutting steel; whitedrawing dies.
Source: The University of Toledo (no date)
Image courtesy of: Grand Steel Products Inc.
| 17
4.2 Manganese in Construction & EngineeringSteelCriticality & Economic Importance of Mn
Although the exact mechanical properties of
construction/engineering steel can be altered by
adjusting its carbon and Mn content and through the
addition of various alloying elements (e.g. chromium,
nickel, molybdenum, vanadium, titanium and
bismuth), no direct substitute has been found for Mn in
this application.10 It has been estimated that 48 million
mt of construction/engineering steel was produced in
2013 (based on construction/engineering steel
accounting for 3% of total global steel production).
Since Mn is an essential component of these steels, the
entire value of the construction/engineering steel
market - an estimated US$ 29 billion to US$ 43 billion
– is reliant on Mn.
Construction Steel
In construction, the most important property for steel
to have is high strength and stress-bearing capacity.
Not only does Mn improve the strength, hardness and
toughness of construction steel, it is also the most
economical hardenability intensifier (the most cost-
effective way to increase the hardenability of carbon
steel is to increase the Mn content from 0.6% to 1.4%).
Mn is therefore critical to steel’s production and use in
construction applications.
Steel frame construction offers significant advantages
over more traditional materials, such as reinforced
concrete. It has the highest strength-to-weight ratio of
any building material (which increases safety), is cheap
(around 5% to 8% less expensive than reinforced
concrete), is flexible (can be produced into many shapes
and forms), and can be prefabricated offsite, increasing
the speed of construction onsite.
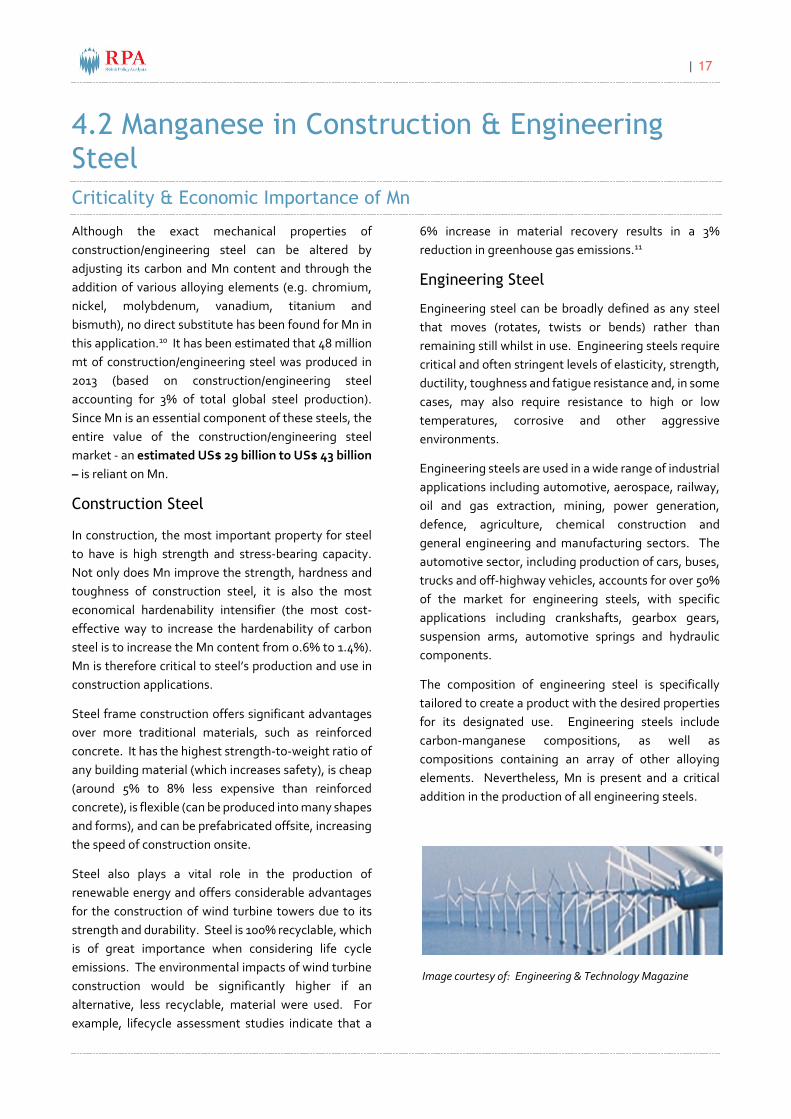
Steel also plays a vital role in the production of
renewable energy and offers considerable advantages
for the construction of wind turbine towers due to its
strength and durability. Steel is 100% recyclable, which
is of great importance when considering life cycle
emissions. The environmental impacts of wind turbine
construction would be significantly higher if an
alternative, less recyclable, material were used. For
example, lifecycle assessment studies indicate that a
6% increase in material recovery results in a 3%
reduction in greenhouse gas emissions.11
Engineering Steel
Engineering steel can be broadly defined as any steel
that moves (rotates, twists or bends) rather than
remaining still whilst in use. Engineering steels require
critical and often stringent levels of elasticity, strength,
ductility, toughness and fatigue resistance and, in some
cases, may also require resistance to high or low
temperatures, corrosive and other aggressive
environments.
Engineering steels are used in a wide range of industrial
applications including automotive, aerospace, railway,
oil and gas extraction, mining, power generation,
defence, agriculture, chemical construction and
general engineering and manufacturing sectors. The
automotive sector, including production of cars, buses,
trucks and off-highway vehicles, accounts for over 50%
of the market for engineering steels, with specific
applications including crankshafts, gearbox gears,
suspension arms, automotive springs and hydraulic
components.
The composition of engineering steel is specifically
tailored to create a product with the desired properties
for its designated use. Engineering steels include
carbon-manganese compositions, as well as
compositions containing an array of other alloying
elements. Nevertheless, Mn is present and a critical
addition in the production of all engineering steels.
Image courtesy of: Engineering & Technology Magazine

18 |
4.3 Advanced High Strength SteelsBackground
Advanced High Strength Steels (AHSS) (i.e. steels which typically have an ultimate tensile strength between 300 MPa
and 1,500 MPa) offer a superior combination of ductility and strength compared to conventional high strength steels.
They demonstrate a high fatigue endurance limit and generally have excellent formability. The high energy absorption
capacity of AHSS allows them to be used in vehicles to help protect occupants during a collision and can also reduce
vehicle weight. Hence, AHSS have undergone significant research and development in recent years, particularly in
automotive applications.
Twinning Induced Plasticity (TWIP) steels (a type of AHSS) are a newly developed material characterised by a high rate
of work hardening. High performance TWIP steels are fully austenitic and non-magnetic and demonstrate properties of
both high ductility and strength. They can be stretched by up to 90% of their original length without breaking and resist
tensile pressures up to 1,100 MPa.
Criticality & Economic Importance of Mn
Mn is the main alloying element in TWIP steels,
comprising 18-30 wt. %. Mn is also the main alloying
element in austenitic Mn steels more generally. In
TWIP steels, Mn is crucial for preserving the
austenitic structure of the steel and for controlling
the material’s stacking fault energy (SFE).12 The key
deformation process that gives TWIP steels their
unique properties is the conversion of the material’s
structure from austenite to martensite under stress.
The high concentration of Mn within TWIP steels
allows the material to be fully austenitic at room
temperature, which is vitally important for enabling
the material to be sufficiently ductile whilst resisting
high stress levels without breaking (a key asset in
materials used in automotive applications).13 14
TWIP steels have the potential for use in various vehicle bodywork and structural components and offer considerable
advantages compared to conventional steels, namely increased strength (twice as strong), increased energy absorption
capability and reduced weight (5-6% less dense)15. The higher strength TWIP steels can also be used in thinner sheets,
leading to further weight reductions (~10-20% with savings of up to 30% for certain components).16 17 Inclusion of
TWIP steels within the FutureSteelVehicle design optimisation process (which demonstrates lightweight steel solutions
to automakers) and the considerable research interest in TWIP steels suggests the use of this material will increase in
future.18
The principle advantage of AHSS (particularly TWIP steel) over conventional steel is the material’s combination of
excellent ductility and strength, which allows for considerable weight savings. Although a relatively recent innovation,
these steels have significant potential for use in future automotive applications, mainly because of their potential to
increase the crashworthiness of vehicles (enhancing passenger safety) and reduce vehicle weight, leading to
improvements in fuel consumption and emissions reductions. This is particularly important considering the recent
rise in oil prices, increasing regulatory pressure to reduce the environmental impacts of vehicle emissions and the
continuous increase in vehicle weight (by almost 90% in the EU between 1970 and 2010 - see graph overleaf).19 20
FORECAST FOR AUTOMOTIVE USE OF AHSS
(AVERAGE POUNDS PER VEHICLE)
Source: Ducker Worldwide (no date) in Surma (2012)

| 19
It is estimated that for every 10% of weight eliminated from a vehicle’s total weight, fuel economy improves by
7%.21 Reducing a vehicle’s weight by 100kg, reduces fuel consumption by 0.25l/km and carbon emissions by
approximately 7 gCO2/km.22 Although difficult to evaluate, it is estimated that the use of AHSS steels can result in a
vehicle weight saving of around 10%-25%.20 Assuming an average car weighs 1,400 kg, CO2 emissions per car could
be reduced by 9.8 to 31.5 g/km - equivalent to an estimated global saving of 8 million to 28 million tonnes of CO2 per
year. The use of AHSS could reduce each car’s fuel consumption by an estimated 0.35-1.13 l/km. Applied to all cars
globally, this equates to an estimated reduction in expenditure on fuel of US$ 435-1,400 billion per year. It is also
worth noting the fact that average greenhouse gas emissions from primary production of steel are at least four to five
times lower than alternative materials used in automotive applications.23
The use of AHSS in vehicle design also has
the potential to increase the
crashworthiness of vehicles, thus enhancing
passenger safety in the event of a collision.
On average, there are 1.24 million fatal
vehicle accidents and between 20 million
and 50 million non-fatal injuries globally
each year. These result in human costs (loss
of life) and economic costs (e.g. loss of
outputs, medical costs etc.). Assuming the
use of AHSS in vehicles could reduce the
number of incidents by 1% to 5%, savings in
Europe are estimated at between US$ 81
million and US$ 407 million per year,
taking into account both human and
economic costs. It is estimated that 3% of
India's GDP (US$ 55.8 billion) is lost due to
road traffic crashes each year and that
around 15.5% of all road deaths in India
involve the driver/passenger of a 4-
wheeled vehicle24. Again assuming the use
of AHSS could reduce such road deaths by
1% to 5%, total GDP savings are estimated
at US$ 86 million to US$ 432 million per
year.
What’s more, AHSS can be produced at a
similar or even reduced cost compared to
conventional steels (and significantly lower
costs compared to alternative materials –
see chart), which signifies the potential
importance of these materials in the
future. 25
It is estimated that, in 2009, 9.73 million tonnes of high Mn non-magnetic steel was produced resulting in the
consumption of 1.07 million tonnes of Mn. This equates to approximately 1% of annual steel production and 8% of total
Mn consumed in the production of steel. Forecasts suggest that, by 2015, production of high Mn non-magnetic steel
(including TWIP steel) will reach 14.19 million tonnes, consuming 1.56 million tonnes of Mn.26
PRODUCTION COST & VEHICLE MASS OF DIFFERENT MATERIALS
COMPARED TO CONVENTIONAL STEEL
MID-SIZE PASSENGER CAR WEIGHT IN THE EU
Source (both graphs): De Cooman, Chin & Kim (2011)

20 |
4.4 Manganese in Austenitic Mn SteelBackground
Austenitic Mn steel, also known as mangalloy or Hadfield steel (after its 19th Century inventor, Sir Robert Hadfield), is a
high Mn content steel that typically contains between 11% and 14% Mn. Austenitic Mn steel has unique properties which
make it indispensable for applications in which great toughness and wear resistance are required.10 It is generally used
in situations where assurance is required by the user against unexpected failure (e.g. in demanding applications where
downtime cannot be accepted). Common uses for austenitic Mn steel include gears; spline shafts; axles; rifle barrels;
earthmoving, mineral and mining equipment; grinding and crushing machinery; oil well drilling; power shovel buckets;
railway points and crossover components; track work and rail road wheels; dredging; lumbering; steel-plants; cement
plants; kiln and mill liners; stone crushers, jaw and gyratory crushers and ore processing equipment.
Criticality & Economic Importance of Mn
Austenitic Mn steel is a remarkable engineering alloy that, by definition, would not exist without Mn. Hence, it could be
argued that the entire value of the austenitic Mn steel market is attributable to the availability and use of Mn.
Importantly, the service life of austenitic Mn steel components is three to five times longer compared to carbon
steel when exposed to slow abrasive wear.27 This can lead to a substantial reduction in costs associated with
maintenance and replacement. Austenitic Mn steels perform most efficiently when external conditions cause extensive
work hardening of the wear component’s surface. Under shock and impact, austenitic Mn steel almost triples its initial
surface hardness, retains its interior toughness and acquires a high polish. The ability of Austenitic Mn steel to work
harden up to its ultimate tensile strength is a key feature and, in this regard, this material has no equal.27 These
features make this steel an ideal material for heavy impact and abrasive service applications.28 Austenitic Mn steel also
exhibits high levels of ductility, toughness and slow crack propagation rates in comparison to other potentially
competitive materials.29
Railways
Railway switches and crossings are subjected to high and
concentrated dynamic forces and must perform their duty with
the highest levels of reliability and safety. On a plain track, a
broken rail can still be passed by a train wheel due to built-in
redundancy; however, failure of a switch/crossing component
can lead to direct derailment of the first train that runs over it.
Choice of engineering material is, therefore, critical.
Due to its unique properties (namely excellent work hardening
ability, suitable strength and high toughness), austenitic Mn
steel has been widely used to manufacture railway switches and
crossings (frogs) for more than a century. Voestalpine (a global
market leader in turnout technology for railways, metros and
tramways) and Balfour Beatty Rail (the UK market leader for
switches and crossings) both use austenitic Mn steel in the
production of railway components (e.g. crossings and switches,
as well as specialist embedded track-work for urban rail
systems, ports and docks).
TRAIN WHEEL PASSAGE THROUGH A RAILWAY
FROG
Image courtesy of: Havlicek & Busova (2012)

| 21
Austenitic Mn steel is used because it develops an
exceptionally wear-resistant surface during operation
and is, therefore, suitable for tracks experiencing very
high axle loads30. Its work hardening ability, together
with its high wear-resistance and fracture toughness,
increases the longevity of the component/track. For
example, curved rails made of austenitic Mn steel have
demonstrated life expectancies in excess of six times
that of normal carbon steel rail.31 Replacing austenitic
Mn steel with an alternative metal may reduce the
anticipated lifespan of the component, thus leading to
the need for more frequent maintenance and
replacement and, hence, increased costs associated
with materials, labour and lost profits due to downtime.
Hence, the total direct benefits of austenitic Mn steel
could be enormous given the thousands (if not millions)
of turnouts that are used throughout the global rail
system every year.
Indirect cost associated with delays (caused by
increased maintenance) could also be significant if less
durable materials are used and there could be a
potentially greater risk of rail failures. In the UK alone
it is estimated that train delays cost the economy over
£1 billion (US$ 1.7 billion) per year, with turnout
systems considered to be the main component of
railway infrastructure that affects the ability of the
system to operate to capacity.
Within the EU, the number of passengers and volume
of cargo transported by rail is expected to double and
triple respectively by 2020. This increase in demand
cannot only be satisfied by building new railways; the
efficiency of existing railways will also need to increase.
In part, this can be achieved by increasing the capacity
of the rail system, which directly relates to the
frequency of repair and maintenance. Use of an
alternative material, with lower strength and/or lower
wear resistance, might lead to a reduction in train
speeds as a means of reducing track wear (to prolong
component life) and to increase safety. This could have
a knock-on impact for journey times and, hence,
passenger travel and freight deliveries. The use of
durable materials (such as austenitic Mn steel) is
therefore considered critical to the future development
of the EU’s rail network and regional economic growth.
Over time, railway axle loads appear to be increasing,
which is leading to an increase in the levels of stress and
wear on railway components.32 This suggests that
excellent toughness and wear resistance (properties
associated with austenitic Mn steel) are likely to
become increasingly important considerations in the
manufacture of railway components in the future.
In terms of alternatives to austenitic Mn steel, bainitic
steel, which has proven uses in switch and crossing
applications as well as shallow radius track, could
potentially be used in some applications.33 However, as
with all steels, Mn is still a crucial alloying element in
this type of steel (low-carbon bainite, for example,
contains ~3.95% Mn).34 ArcelorMittal has developed a
fully pearlitic micro-alloyed steel rail with mechanical
properties considerably better than traditional C-Mn
steel rails. The levels of C, Mn and Cr in this steel
guarantee a very fine pearlitic microstructure, without
the presence of brittle structures in the rail or its
welds.35
Image courtesy of: IRO Learn (no date)

22 |
4.5 Manganese in Stainless SteelBackground
The term “stainless steel” is used to describe an extremely
versatile family of engineering materials, which are selected
primarily for their corrosion and heat resistant properties. They
find use across a broad spectrum of applications and industries,
as indicated in the diagram to the right. Mn is intentionally
present and used, in various concentrations, in all types of
stainless steel. Overall, it could therefore be argued that the
entire stainless steel industry - valued at an estimated €80
billion (~US$ 106 billion) in 201036 - is reliant on the continued
production and use of Mn.
Economic Importance of Mn (200 series)
The addition of Mn to stainless steel promotes the stability of
an austenitic crystalline structure. While nickel (Ni) is also an
austenite forming element, Mn is able to achieve the same
effect at a much lower cost. As such, Mn has become a key
component of low-cost stainless steel formulations, notably
200-series stainless steel.
200-series stainless steel currently accounts for 3% of primary
Mn consumption, and around 21% of all stainless steels; this
creates a global market for 200-series stainless steel of around
US$ 12.7 billion to US$ 25.4 billion per year (based on 2012
production). Assuming market growth of 5% per annum
(currently 6.6%), 200-series stainless steel could reach around
US$ 18.7 billion to US$ 35.7 billion in value by 2020 - a market
which would not exist without Mn.
END-USES OF STAINLESS STEEL
Source: SMR (2013) in Outokumpu (2013)
GLOBAL STAINLESS STEEL DEMAND (INDEX: 2005 = 100)
Source: ISSF (2013)

| 23
Criticality in Selected Applications
Bridges
Galling is a severe form of adhesive wear which occurs
when two sliding surfaces fuse together as a result of cold
welding. When Mn is added to stainless steel it forms Mn-
rich sulphides, which act as solid lubricants in sliding
contact and so stainless steels containing such sulphides
exhibit strong resistance to galling.37 Indeed, grades such
as Nitronic® 60 (which combine high Mn with high silicon
contents) offer excellent galling resistance.
In bridge components (such as pins and bolting), galling
can result in the need for expensive retrofitting, repair
work and/or safety concerns. Lubricants are not the
solution due to the long life-cycle of a bridge and lack of
accessibility.38 Many lubricants are also hazardous to the
environment. Thus, alloy selection is critical.
Perhaps the most significant development in the
stainless steel market in recent years has been the
emergence of the lean duplex grades. In some of the
recently developed grades, Mn and N are used in
combination to reduce the amount of expensive and
volatile alloying elements to very low levels. This has a
beneficial effect on cost and price stability, which is
critical for construction projects with a long lead time
(such as bridges).
One of the key advantages of duplex stainless steel is its
excellent strength-to-weight ratio. With optimised
design, the weight saving potential of using duplex
stainless steel compared to austenitic grades or
conventional mild steel is around 30% for bridge
construction.39 This is important because it minimizes
substructure costs and facilitates very shallow
construction depths, which overcome problems with
headroom and flood clearances, and minimizes the
length of approach ramps.40 Minimum self-weight can
also reduce the cost of transporting and handling
components and is particularly beneficial in poor ground
conditions.
LDX 2101®, for example, is alloyed with 5% Mn and has
been used for bridges in Sienna (Italy) and Gaularfjell
(Norway).42 Lean duplex rebar will also be used in
Brisbane’s Gateway Upgrade Project, the first time LDX
2101 will be used as rebar.41
Desalinisation Equipment
Besides structural applications, such as bridges, the high
strength of duplex stainless steel is also useful for
reducing the section thickness (and weight) of sheet and
plate used in the walls of pressure vessels and storage
tanks (as shown in the diagram below). For this reason,
duplex stainless steels have quite a significant (and
growing) market share in the water treatment sector.
According to SMR (2009)42, duplex stainless steels make
up a 13% share of all stainless steels used in the water
treatment sector. Furthermore, the market for duplex
desalination equipment is anticipated to grow by >10%
per year in the forthcoming years.
POTENTIAL WALL THICKNESS REDUCTION IN STORAGETANKS USING DUPLEX STAINLESS STEEL COMPAREDWITH AUSTENITIC
Source: Outokumpu (no date)

24 |
4.6 Manganese in HSLA SteelsBackground
High Strength Low Alloy (HSLA) steels, which account for around 7% of world steel production, are an important
category of steels used primarily for their high strength. Although HSLA steels contain a range of alloying elements
(including <2% Mn), they are not considered to be alloy steels in the normal sense, primarily because they are designed
to meet specific mechanical properties, rather than a chemical composition. Indeed, HSLA steels are generally defined
as steels having a yield strength >450 MPa.
In recent years, the production and use of HSLA steels has grown rapidly in a number of regions, especially China.43
Worldwide, production of HSLA steels has outpaced crude steel production by around 20% year-on-year since 2006.44
Criticality of Mn in HSLA Steel
Mn is an important alloying constituent in HSLA steels, where it is used principally as a strengthening element. In these
steels, relatively high Mn levels (1.0% to 1.8%) have a beneficial effect on the austenitic transformation temperature and
its role in obtaining a very fine ferrite structure.45 Mn also improves low-temperature impact properties.
It is important to note that the key properties of HSLA steels are not provided solely (or arguably, mainly) by Mn. Other
alloying elements can be added alone, or in combination, depending on the particular mechanical properties
required. For example, niobium, vanadium and/or titanium may be added to increase strength, while zirconium and
calcium improve formability. These micro-alloying additions help to refine the structure and strengthen the steel
through the formation of carbide or nitride precipitates which are evenly distributed in the ferrite matrix. This is somewhat
different from the role of Mn, which is critical to obtaining a very fine ferrite structure.46 In any case, Mn does have an
effect on improving the precipitation strengthening of these micro alloying additions (e.g. in vanadium steel and also to
a lesser extent niobium steels)47 and, as such, plays an important role in microstructural refinement.6
There are no alternatives to Mn in HSLA steels. There are, however, alternative steels which can be used in the
applications where HSLA steels are deployed but these steels do not offer the same benefits as HSLA steels. The
principal advantages of HSLA steels compared with traditional carbon steels are: higher strength with good ductility;
good formability at room temperature (which allows for greater part complexity and more manufacturing flexibility);
good weldability with most conventional welding methods; and good corrosion resistance. As a result of these
properties, HSLA steels have found application in automobiles, cranes, roller coasters and other structures that are
designed to handle large amounts of stress and where a good strength-to-weight ratio is important. They can also be
found in bridges, oil/gas pipelines, shipbuilding, suspension components, building structures, vehicles/transportation,
tubular components, heavy equipment and off-shore/platforms.
MANGANESE IN THE CONSTRUCTION OF THE TRANS-ALASKA
PIPELINE
HSLA steels were originally developed as flat-rolled products for the Trans-
Alaska pipeline in the late 1960s. The good weldability of HSLA steel allowed
reliable joining of pipe sections under difficult field conditions and the strength
and fracture toughness of the steel permit the use of higher pumping pressures.
To prevent hot oil from melting the permafrost underground, much of the pipe is
suspended above the ground. Hence, the strength of HSLA steel was an
important design parameter.
Sources: Russell & Lee (2005)

| 25
Criticality in Selected Applications
Overview
HSLA steels with the same strength are usually 20% to
30% lighter than carbon steel. This is important
because increasing the yield strength of steel using Mn
results in significant cost savings. Although the extent
of potential savings varies across sectors and end-uses,
the principle is the same. Some examples of specific
applications are given below.
Offshore Installations
Over the last 10 to 15 years, there has been growing
interest in the use of higher strength steels for offshore
installations. The main application for these steels has
been in the fabrication of production jack-ups – an end
use with technically demanding requirements. HSLA
steels have also been used in tethering attachments for
floating structures in tension leg platforms (TLP’s) and
for mooring lines with semi-submersible module
offshore drilling units (MODUs).
HSLA steels offer a number of advantages over
conventional steels, particularly where weight is
important - in particular, they result in savings in the
cost of materials while maintaining strength. The table
below provides an illustration of the potential cost
savings which could apply by using HSLA steel to build
an offshore platform, compared with using a typical
structural steel.48
The example (based on 1,000 tonnes of steel) indicates
that the use of HSLA steel produces an overall cost
reduction of around US$ 300,000 (~14%). The largest
cost savings are realised at the fabrication stage, with
cost savings of around US$ 225,000 (20%). It also
shows that the use of HSLA steel creates a 30%
reduction in the amount of material used (700 tonnes
rather than 1,000 tonnes), as well as a reduction in
transport and shipping costs.
Automotive Applications
Although HSLA steel is more expensive than carbon
steel, it has proven popular within the automotive
industry and accounts for up to 40% of the body mass
of some modern passenger cars.49
Because HSLA alloys are stronger than carbon steels,
they can be used in thinner sections, making them
particularly attractive for transportation-equipment
components where weight reduction is important.
Using lighter weight steel reduces the overall weight of
the vehicle which, in turn, lowers fuel consumption and
CO2 emissions, offsetting the higher cost of the steel.
This delivers benefits to steelmakers, helps ensure
motor vehicle manufacturers can meet emissions
targets and reduces vehicle owners’ costs. According to
one source50, steelmakers can expect to earn $100 per
ton of HSLA steel compared to $50 for carbon steel,
while users can expect to save $39 (per ton of steel)
when carbon steel is replaced with HSLA steel.
Furthermore, a recent study51 discovered that the use
of HSLA steel with vanadium (HSLA-V steel) in trailer
chassis results in a weight reduction of 680 kg which,
assuming an annual transportation distance of 100,000
km, results in a saving of 312 litres of diesel.
Depending on design, the higher strength of HSLA
steels can also translate into better fatigue and crash
performance, while maintaining or even reducing
section thickness.
ALTERNATIVE COSTS OF A WELDED CONSTRUCTION USING STEEL WITH HIGHER YIELD STRENGTH (US$)
Steel tonnage S355 Carbon Steel S460 HSLA
Material Costs 660,000 610,000
Fabrication 1,100,000 875,000
Corrosion Protection 260,000 260,000
Engineering 175,000 175,000
Total Cost 2,200,000 1,900,000
Source: Hulka (no date)

26 |
5. Manganese – Impacts on Industry &Society
Introduction
While most Mn ore is used as direct feedstock for
ferroalloys or steel production, around 2% to 6% of Mn
ore is used in the production of specialist metallurgical
and chemical products. These find application in a
wide range of uses, including agricultural feed and
fertilizer, food supplements and medicines, water
treatment, batteries (importantly, those used in
electric vehicles) and electronics. Mn is also the main
alloying element in the 3XXX series aluminium alloys,
which are widely used to make aluminium beverage
cans. Although some Mn ore (around 13% to 15%) is
lost to slag in the process of Mn alloy production,
recent research suggests that this “waste” could be a
valuable addition in the production of low carbon
concrete.
The value of Mn in some of its key applications is
explored further in the following sections.
SOME UNIQUE USES OF MANGANESE
MANGANESE IN SHIPS
In 2006, German company MMG produced the world's
largest ship propeller for the Emma Maersk. The ship’s six-
blade, single-piece propeller is 9.6 meters in diameter and is
cast from an alloy consisting of copper, aluminium, nickel,
iron and manganese.
Source: Bell (2012). Image courtesy of: Mecklenburger
Metallguss GmbH (no date)
MANGANESE IN “BIG BANG” SIMULATION
A Mn-containing non-magnetizable austenitic stainless steel
was used to make the quadrupole magnets in the world’s
largest “big bang” simulator (the Large Hadron Collider,
based in Switzerland). The quadrupole magnets, consisting
of four magnetic poles, act as magnetic lenses, focusing the
particle beam alternately in horizontal and vertical direction
and keeping it on a predetermined “flight path”.
Source: Thyssenkrupp (2008). Image courtesy of:
Wired.com (2010)
KEY USES OF MANGANESE

| 27
5.1 Agriculture
Background
Mn is one of nine essential micronutrients for plant growth. It satisfies a number of biological processes, including
ensuring optimal plant enzyme synthesis, nitrogen metabolism and lignin manufacture. Mn deficiency in plants reduces
the chlorophyll content and ability of the plant to photosynthesize and also lowers resistance to root pathogens.
Criticality Mn in Agriculture
In certain regions of the world, soils are significantly deficient in Mn and this is likely to impair the production of arable
crops (particularly crops with a high Mn requirement such as soybeans, peas, wheat, barley and oats). Crop losses as a
result of Mn deficiency can have a significant social and economic impact on farmers as well as actors in the wider
agricultural sector, the retail sector (food prices) and society (e.g. availability of bread and breakfast cereals). Impacts
may also extend to animals grazing on these soils that may experience symptoms of Mn deficiency (e.g. impaired
growth). In Mn-deficient areas, Mn is usually added to the soil as a fertiliser (e.g. as Mn sulphate) and animals may be
fed Mn in the form of supplements.
Economic Importance
European Cereal Production
The economic importance of Mn in agriculture will vary by
region, by soil conditions (e.g. temperature, moisture,
pH), by the presence (or absence) of other nutrients (e.g.
Mn deficiency can co-exist with iron deficiency) and the
specific crop being planted (i.e. whether the crop has a
high or low Mn requirement).
Using Europe as an example, Mn deficiency in agricultural
soils occurs across large areas of Poland, North Western
Spain, Scandinavia and the UK. In the UK specifically, it is
the most common micronutrient deficiency seen in crops;
sugar beet, cereals and peas are considered to be
particularly susceptible.52 In the UK and Ireland, it is
estimated that up to 20% of the area under arable crops
is treated for Mn deficiency each year and that severe Mn
deficiency can result in yield losses of up to 65% in winter
cereals.53 Assuming that 15% to 20% of the total area
under winter wheat and barley production in the UK and
Ireland is treated for Mn deficiency each year and that
yield losses for non-treatment lie in the region of 40% to
60%, the total benefit of treatment for Mn deficiency
would be around US$ 370 million to US$ 667 million
each year.
United States Soybean Production
Similarly, in Northern Indiana (United Stated) where soils
are high in organic matter, soybean yields can increase by
around 15 bushels per acre when Mn is added to deficient
crops.54 Assuming 70 million bushels of soybeans are
produced on Mn deficient soils and that yield losses from Mn
deficiency lie in the region of 20% to 40%, the total value of
additional yield (with the addition of Mn fertiliser) is
estimated to be worth US$ 196 million to US$ 392 million
in Northern Indiana alone. These figures do not take into
account further impacts up the supply chain.
MANGANESE DEFICIENT SOYBEAN CROP
Image courtesy of: Sturgul (2009)

28 |
5.2 Batteries
Background
The global market for electric vehicles (EV) is forecast to reach over 6 million units by the year 202055, with the US
currently accounting for ~38% of the world’s electric vehicle stock.56 Although future growth in the EV market is
expected to emanate mainly from the Asia-Pacific region, with countries such as China and Japan setting aggressive
production and sales goals57, the US is forecast to remain an important market for EV adoption through to 2020.58
In the US, EVs currently emit about 84g CO2/km, which is significantly less than the amount of CO2 emitted on average
by conventional vehicles with an internal combustion engine.59 Due to differences in the electricity mix, EVs in Europe
perform slightly better, only emitting 70g CO2/km.60 In addition to reducing CO2 emissions, replacing conventional
vehicles with EVs could also help reduce human exposure to other urban pollutants (e.g. PM10) which are associated
with direct impacts on health, significantly reduce traffic noise in cities and significantly reduce oil dependency.
Criticality of Mn in Batteries
Many types of batteries have been investigated for use in EVs
with extensive research having been conducted on lead acid,
nickel-cadmium, nickel-metal hybrid, sodium-nickel chloride
and lithium polymer batteries. A number of other batteries,
such as the sodium-sulphur battery, are also in development
but have not yet found significant practical application.
Although lithium-Mn oxide spinel (LMO) is a relatively new
material, the ongoing expansion of the EV market may rely on
its continued use in rechargeable batteries. LMO batteries are
associated with good structural stability, low-cost and good
electronic and lithium-ion conductivity. With growing concern
over the safety and viability of other cathode designs (e.g.
LCO), spinels based on LiMn2O4 are growing in popularity as
cathode materials. The use of LMO battery technology is also
particularly attractive as it offers a real opportunity for
reducing reliance on lead, nickel and cadmium power sources
in this important area, thereby offering potential
environmental and health gains.
LMO batteries have already found application in commercially
available EVs, including the Chevy Volt and the Nissan Leaf.
However, research and development of this technology is still
in the early stages and further technological advances are
expected. Indeed, development of the LMO battery may
potentially offer the opportunity for the wide-scale
introduction of battery EVs.
ENERGY DENSITY OF COMMON BATTERYTECHNOLOGIES
Source: RPA (2011)
AFTER STEEL, THE BATTERY SECTOR IS CURRENTLY
THE SECOND LARGEST CONSUMER OF MANGANESE

| 29
Economic Importance
According to one recent report, the rapidly growing
global market for EVs will create an overall market for
lithium-ion batteries worth over US$ 24 billion by 2023,
up from US$ 3.2 billion in 2013.61
Europe
Using a case study approach, the benefits associated
with CO2 savings and reduced emissions of PM10s have
been estimated across the EU for the period 2011 to
2020. Assuming that EVs make up 15% of all new car
sales by 2020 and that 50% of future EVs contain the
LMO battery, the total economic value of social
benefits associated with CO2 emissions reductions has
been estimated at between US$ 723 million and US$
5,214 million. Assuming that 80% of future EVs
contain the LMO battery, the economic value of the
reductions is between US$ 1,157 million and US$
8,343 million.
Assuming that a reduction of 15 µg/m3 PM10s leads to
a gain of 140 life days, it is estimated that between
413,000 and 662,000 life years, or around half a life day
per person by 2020, will be gained across the EU
population by the year 2020 with a move to EVs. This is
associated with total present value benefits of US$ 22
billion (50% uptake) and US$ 36 billion (80% uptake).
USA
Assuming that 2.6 to 6.0 million EVs are sold in the US
over the period 2011 to 2020 and that 50% of these
contain the LMO battery, the total value of social
benefits associated with CO2 emissions reductions has
been estimated at US$ 38 million to US$ 857 million.
Assuming that 80% of future EVs in the US contain the
LMO battery, the economic value of reductions is
estimated at US$ 61 million to US$ 1,371 million.
Note that, unlike the European example above, these
values do not take into account any future
improvements in the carbon intensity of the US
electricity mix. The values given here therefore
represent the minimum benefits that are likely to
accrue (i.e. they are an underestimate).
GLOBAL LITHIUM-ION BATTERY MARKET 2016 (US$)
Source: Frost & Sullivan (2012), Reported by New Energy News (2013)

30 |
5.3 Healthcare
Background
Although estimations of human requirements for Mn vary
considerably, there is general agreement amongst health
professionals that some Mn is essential for maintaining the
health and wellbeing of the human body. Mn is associated with
bone development and with amino acid, lipid and
carbohydrate metabolism. Trace amounts of Mn are also
needed for normal sexual functioning and may help lower the
risk of osteoporosis in post-menopausal women.62 Mn
deficiency has been demonstrated in animals and has been
noted in humans in association with vitamin K deficiency. The
main manifestations in all species studied are impaired growth,
skeletal abnormalities, disturbed or depressed reproductive
functions, lack of muscular coordination among newborns and
defects in lipid and carbohydrate metabolisms.63
In order to prevent the detrimental effects of Mn deficiency, various Mn chemicals (including MnSO4, MnO and MnCl2)
have been used as food additives and dietary supplements for humans (and other animals). Manganese sulphate is also
used in medicine to treat Mn deficiency (typically in animals)64 and manganese carbonate is used as a hematinic (this
increases haemoglobin content of the blood and is used to treat anaemia).65 Mn may also help treat the symptoms of
premenstrual syndrome (PMS) in women.66
Some Mn chemicals have also been developed for use in
specialised healthcare applications to assist in the
diagnosis and treatment of numerous health issues. For
instance, various Mn chemicals are known to be effective
contrast agents for enhancement of Magnetic Resonance
Imaging (MRI) at tissue, cellular and even molecular
levels. MRI is a medical imaging technique that is widely
used in hospitals for medical diagnosis. Research
suggests that Mn doped superparamagnetic iron oxide
nanoparticles can be used to form ultrasensitive contrast
agents for liver imaging. This sensitive contrast agent
may find application in the identification of small liver
lesions and assist in the identification and evaluation of
severity of liver diseases.67 Mn-based agents continue to
be developed and new nanotechnologies have great
promise for achieving high MR contrast.68 To date,
gadolinium (Gd) has been the predominant
paramagnetic used for MR paramagnetic contrast.
However, the recent discovery and association of the use
of this substance and nephrogenic systematic fibrosis
(NSF) in some patients with severe renal disease or
following a liver transplant has caused concern.
Therefore, the pursuit of alternative methods to achieve
personalised molecular imaging has renewed attention in
Image courtesy of: Wisegeek (no date)
MN AS AN MRI CONTRAST AGENT
Image courtesy of: Massaad & Pautler (2012)
Image A shows an MRI image of the left cochlea of a guinea
pig before MnCl2 administration. Image B shows the same
cochlea after 12 h of MnCl2 administration.

| 31
Mn and may increase the potential use of Mn based agents in the future. It is important to note that there are potential
alternatives to gadolinium and Mn for use in MRI, including iron and copper.69
The use of Mn-containing stainless steel implants began in the 1920’s and, due to the detrimental effects of metal
corrosion on the human body, research and development in this field has focused on finding increasingly corrosion-
resistant materials. Today, the most widely used metallic biomaterials include stainless steels, titanium and its alloys,
cobalt-chromium based alloys, as well as tantalum, niobium and gold. Stainless steels are conventionally used in
orthopaedics, with the main advantages being low cost, good mechanical properties and ease of processing.70 However,
stainless steels have traditionally contained nickel, which is known to cause contact allergies. Nickel is the most
common metal to cause contact dermatitis in orthodontics, with more cases of allergic reactions than for all other metals
combined.75 It is estimated that 8.6% of the global population suffers from an allergy to nickel; 65 million people in
Europe alone. 71 Most cardiovascular and peripheral vascular stents are made from 316L stainless steel which contains
strongly sensitising metals such as nickel and chromium.75 As a result, Mn-containing high-nitrogen nickel-free
austenitic stainless steels are increasingly being used as replacements for nickel-containing steels in medical
applications72.
Economic Importance
The global market for biomedical metals reached US$ 13.3 billion in 2012 with this expected to increase by 7.5% annually
over the coming years. By 2016, the market is expected to approach US$ 17.8 billion in value and by 2020 is expected to
reach US$ 23.7 billion.73 It should be noted that there are other metals used in biomedical applications, including
titanium alloys and cobalt-based alloys with the use of titanium alloys considered to have the most promising growth
prospects for the future. However, stainless steels are considered to be the largest product group of biomedical metals,
accounting for more than half of the total biomedical metal market80 (an estimated US$ 6.7 billion in 2012). Mn is a
critical component of these steels, which would not exist without its inclusion. The development of new nickel-free
stainless steels and the relatively low cost of these materials (compared to alternatives) is likely to ensure the continued
use of Mn-containing biomedical metal products in the future.
GLOBAL MARKET FOR BIOMEDICAL METALS, 2012 – 2020, US$ BILLION
Source: Acmite Market Intelligence (2013)

32 |
5.4 Aluminium
Background
Aluminium is the second most popular metal after steel. It finds widespread use in applications where weight is a
decisive factor. While the construction and automotive industries are the largest consumers of aluminium globally
(accounting for >50% of total global consumption), it is the packaging industry which is expected to display the highest
growth rate over the next few years.74 The aluminium beverage can is the lightest form of beverage packaging on the
market and provides a bright, decorative substrate. Aluminium cans are very robust and provide excellent protection
during transport and distribution with minimum need for secondary packaging. They are also easily recycled. Other
beneficial properties of aluminium for packaging include good formability, high corrosion resistance and UV-light
resistance, all of which are vital when it comes to food packaging and storage.75 Use of aluminium packaging is not
restricted to the food sector though; it also plays an important role in the packaging of consumer goods and
pharmaceutical products, such as toothpaste.
Criticality of Mn in Aluminium Beverage Cans
The specific choice of material used for aluminium beverage
cans has for years now been consolidated.76 Al-Mn alloy (3XXX
series) is used for the body of the can (due to its specific
mechanical properties and excellent workability), while Al-Mg
alloy (5XXX series) is used for the lid (end) and tab.77 To some
degree, Mn is present in almost all aluminium alloys, albeit as
an impurity.78 Mn is, however, the main alloying element in the
3XXX series aluminium alloys, where it is used in concentrations
of 1% to 2% wt. In general, the addition of Mn to aluminium
alloy makes treatment and forming easier and increases
ductility and strength. Mn helps aluminium to resist corrosion
and, in combination with iron, improves the alloy’s castability
and reduces shrinkage during metal solidification.
In 2011, ~254 billion beverage cans were manufactured globally,
around 90% of which were made from aluminium (an estimated
229 billion units).79 80 Assuming a market value of US$ 0.01 to
US$ 0.05 per unit, the total value of the aluminium beverage
can market is estimated at US$ 2.5 billion to US$ 12.7 billion.
The global market for metal cans is expected to reach US$ 51.6
billion in 2019, growing at a CAGR of 2.4% from 2013 to 2019.81
Given a market growth rate of 2.4%, the global market for
aluminium beverage cans could be worth US$ 11 billion to US$
22 billion by 2020.
The benefits of using Mn in aluminium can manufacture are experienced more strongly in some regions than in others.
As outlined in the case study overleaf, the USA is the largest market for aluminium cans. However, Europe, Japan, China
and Brazil are also major consumers. While beverage can consumption has experienced significant growth in the Middle
East in recent years, the market for beverage cans in sub-Saharan Africa and India has been slow to develop.88
Nevertheless, can demand in these regions is expected to increase in the coming years in line with rising incomes, better
retail infrastructure and changing consumer tastes. Hence the benefits of Mn are likely to increase in these regions in
the future.
Image courtesy of: Salvatore Vuono (no date)

| 33
USA
The USA is the largest single market for beverage cans, accounting
for around 43% of the global market (~109 billion cans in 2011).
Companies in the USA that manufacture metal cans employ as
many as 28,400 people and generate an additional 155,800 jobs in
supplier and ancillary industries.82 Assuming that 75% of people
employed in the production of metal cans work in the production
of aluminium beverage cans, around 138,150 people were
employed as a result of US aluminium beverage can
manufacture in 2011.
Workers employed directly in the manufacture of metal cans took
home (in total) more than US$ 2 billion in wages and benefits in
2011, bringing total wages from direct, indirect and induced
employment in the US industry to over US$ 10.5 billion.91 Again,
assuming 75% of wages paid to employees in the manufacture of
metal cans relate to jobs in the manufacture of aluminium
beverage cans, total wages (direct, indirect and induced)
resulting from aluminium beverage can production in the US
equate to an estimated US$ 7.9 billion in 2011.
Not only does the manufacture of cans create jobs in the USA, the
metal can industry also contributes to the economy as a whole. In
2011, the metal can industry was responsible for as much as $46.97
billion in total economic activity throughout the USA.91 In 2010,
metal cans generated US$ 9.0 billion in sales in the USA, with
aluminium cans accounting for approximately 35% (US$ 3.3
billion).83 Assuming that 35% of all economic activity in the metal
can production sector in the USA is attributable to the production
of aluminium beverage cans, it is estimated that the aluminium
beverage can industry was responsible for as much as US$ 16.4
billion in total economic activity throughout the US economy in
2011. Total tax revenues in the USA related to aluminium
beverage can production are estimated at US$ 1.5 billion.
CONTRIBUTION OF THE USA ALUMINIUM
BEVERAGE CAN INDUSTRY
ESTIMATED TAXES GENERATED IN THE USA FROM
ALUMINIUM BEVERAGE CAN PRODUCTION (US$ BILLION)

34 |
5.5 Slags and Cement
Background
Like steel, cement plays a vital role in meeting society's needs for housing and infrastructure. The production of cement,
however, is very energy-intensive and accounts for around 5% of global anthropogenic CO2 emissions.84 As a means of
improving the environmental performance of cement, research has been carried out to assess the feasibility of using Mn
ferroalloy slag in its production.85 The results of this research point to a new and sustainable use for this by-product of
the Mn production process - in cement production.
Criticality of Mn in Slag
There are several options for producing low carbon concrete,
however, many of these options pose challenges today due to
restrictions on use (e.g. fuel ash), declines in supply (e.g. blast
furnace slag), cost/technical issues, etc. The use of Mn slag has
been shown to have potential for use in its own right in blended
cement production. It can also be combined with other
approaches (e.g. use of lean mix concrete, carbon capture) to
deliver even greater benefits. Recent research shows that Mn
slag can be used to partly substitute cement concrete as a
means of lowering the economic costs, as well as achieving
enhanced physical and mechanical properties.86 In this
supplementary role, concrete made with Mn slag exhibits very
low strength and weight loss in synthetic seawater corrosion
and freezing-thawing cycle tests.87
Economic Importance
Around 65% of the fuel used in cement
production is used in the calcination phase.88
Because SiMn slag is precalcined, its use in
cement production means that less fuel needs to
be burned which results in CO2 emissions
reductions. The table (right) gives an indication
of potential CO2 savings calculated from
laboratory work. Over the period 2011 to 2020,
the value of these savings is estimated at US$
1.55 million to US$ 7.83 million.
Assuming just 1% of clinker produced worldwide
in 2012 was made using SiMn slag, the total
(global) value of CO2 reductions would be in
the region of US$ 5.94 million to US$ 29.16
million. Although fuel savings are more difficult
to quantify (as they will vary depending on the
fuel type used), it is likely that the savings would
be substantial.
POTENTIAL CO2 SAVINGS FOR A KILN PRODUCING 850,000TONNES OF CLINKER PER YEAR
Baseline 5% SiMn Slag
CO2 Production from 1st calcination
(‘000 tpa)454 442
Process CO2 savings against control (‘000
tpa)- 11.6
Theoretical heat of reaction (Zur
Strassen) Kcal/kg420 414
Combustion CO2 due to the Qth
assuming 93kg CO2/GK emission139 137.1
Combustion CO2 saving against control
(‘000 tonnes)- 1.9
Total CO2 saving against the baseline
(‘000 tpa)- 13.5
Total value of CO2 savings (US$, million) 1.55 – 7.83
Source: Carbon Enterprises (no date); Value of CO2 savings (own estimate)
Image courtesy of: Carbon Enterprises (no date)

| 35
5.6 Electronics
Background
Manganese ferrite (MnFe2O4) is a non-conductive ceramic compound and magnetic material with a cubic spinel
structure which is used extensively in the manufacture of electronics and in various technological applications. It belongs
to the wider family of so-called ‘soft ferrites’ with the chemical formula - XXFe2O4 – where XX could represent any of the
divalent transition metals (e.g. Zn, Ni, Co, Cu, Mg, etc.). Of these, the most widely used soft ferrites are Manganese-
Zinc (MnZn) and Nickel-Zinc (NiZn) ferrites, with MnZn accounting for around 70% of the global market for soft
ferrites.89
Criticality of Mn in Electronics
The specific properties of Mn ferrite depend heavily on the composition, morphology and size of the Mn ore, as well as
the preparation conditions. Through careful manipulation of their chemical composition and processing procedures,
soft ferrites are tailor made to meet specific characteristics in electronic components. Indeed, many different material
grades of MnZn ferrite can be manufactured depending on their desired end-use application. For example, MnZn ferrite
cores are used for compact transformers and digital communication pulse transformers (signal transformers) where they
provide a number of specific advantages including: high resistivity, wide range of operating frequencies, high
permeability, time and temperature stability, large material selection, versatility of core shapes, low cost and light
weight.90 They can also be found in radio aerials and antenna rods (where high sensitivity and high magnetic
permeability at radio frequencies are important pre-requisites), telecommunications equipment, computer memory
cores and tape recorders (where ferrite particles are embedded in terylene tapes).91 Large quantities of MnZn ferrite are
also consumed in the manufacture of television circuit boards. Overall, MnZn ferrites are technologically important
materials because of their high magnetic permeability and low core losses.92 Indeed, the principle advantage of MnZn
ferrite over its most important counterpart, NiZn ferrite, is its higher permeability and saturation induction levels, which
makes MnZn ferrite highly suited to low frequency (<2 MHz) applications.93
Economic Importance
Magnetic materials can be divided into soft magnetic materials (comprising soft ferrites and electrical steel) and
permanent magnet materials (comprising hard ferrites and NdFeB magnets). The global market for magnetic materials
is forecast to reach US$ 33 billion by the year 2018, buoyed by strong demand from Asia, particularly China.94 Soft
magnetic materials (including MnZn ferrite) represents the largest product segment in this market. It is important to
note that China currently accounts for over 50% of the world’s output of soft ferrite and that, between 2000 and 2007,
China’s soft ferrite output effectively tripled. It is projected that soft ferrites will experience significant growth in the
near future mainly driven by the resurgence of the global economy, rapid technological advancements and continued
strong demand from existing applications in the electronics and IT sectors.105
At the turn of the century, the value of the global market for MnZn was estimated at US$ 0.7 billion to US$ 1.4 billion
per year (based on soft ferrite accounting for 80% of the global market for powder magnetic products and MnZn
accounting for 70% of the market for soft ferrite). Assuming this market has continued to grow at rate of 15% year-on-
year, the global market for MnZn ferrites would be worth around US$ 4 billion to US$ 9 billion today. This may be an
underestimate given that global output of soft magnetic materials reportedly grew at a CAGR of more than 16%
between 2004 (230,000 tonnes) and 2010 (580,000 tonnes).95

36 |
5.7 Water
Background
Mn plays an important role in the provision and treatment/purification of water supply. Mn containing steels are used
in a wide variety of water-related applications ranging from collection and storage to distribution and purification. These
include pumps, pipes, well-drilling equipment and tanks for waste water treatment and desalination plants. Various
forms of Mn (including Electrolytic Mn Metal (EMM) and potassium permanganate) are also used in water treatment
and aquaculture applications and offer key advantages to other alternative substances.
Criticality of Mn in Water Related Activities
Although electrolytic manganese metal (EMM) is mainly used as an
alloying element in the steel sector, EMM also finds use in a wide
variety of other applications including anti-bacterial and anti-
fungicidal agents, which are used to purify drinking water, treat waste
water and in odour control.96 Electrolytic Mn dioxide crystals can be
used to remove iron in solution from water.97 Both iron and
manganese are unaesthetic parameters that are often present in
groundwater. Mn dioxide is one of the most commonly used
substances for the removal of iron, manganese hydrogen sulphide,
arsenic and radium from water, particularly in the western U.S.98 99
Although there are numerous alternative iron and manganese
removal technologies (e.g. sequestering, cation exchange, aeration
and filtration etc.), the use of Mn dioxide oxidation/filtration media
offers certain key advantages, including higher filtration rates,
smaller treatment vessels (that occupy a smaller footprint), excellent
co-contaminant removal of iron and Mn as well as sulphides and
arsenic and the ability to reliably remove target substances at
efficiencies of 90-99%.111
Potassium permanganate is a powerful oxidising agent with
bactericidal and algicidal properties. It is extensively used in drinking
water purification and waste water treatment. It is also used for odour
control, including deodorisation of discharges (e.g. from paint
factories and fish processing plants) and to treat common fish
pathogens such as gill parasites and external bacterial and fungal
infections.100 There are alternative substances with bactericidal and
algicidal properties (e.g. formalin, chelated copper or copper
sulphate), however, copper toxicity increases in soft water areas and
formalin should not be used in temperatures below 40oF. 101 102 103
Therefore, the key advantages of potassium permanganate include
its ability to be used in soft water areas and in cold environments
(indeed, it is considered to be the only effective parasite treatment in
cold water conditions).104 It is also used by fishery biologists and
aquaculturists to inactivate piscicides actinomycin-A and rotenone
(both of which are toxic to fish) in ponds and flowing waters.114
POTASSIUM PERMANGANATE WATERTREATMENT
Image courtesy of: Ardarsh Chemicals (2014)

| 37
Economic Importance
As indicated above, the use of potassium
permanganate is considered to be particularly critical as
a means for treating common fish pathogens and
fungal infections in soft- and/or cold- water areas. One
such region, where low average water temperatures
and soft water conditions are combined, is Scotland.
Scotland is the third largest producer of farmed salmon
in the world, with the industry worth an estimated
£584.7 million (US$ 980 million) in 2011.105 Assuming
the cessation of potassium permanganate use results in
a yield losses equivalent to 1% of the value of the
Scottish salmon farming industry, total losses from the
cessation of potassium permanganate use in this
application would equate to losses in the region of £5.8
million (US$ 9.1 million) per year. The total annual
wage bill for the Scottish salmon farming industry is
estimated at £36 million (US$ 56 million) per year,
which translates to an annual input of almost £166
million (US$ 260 million) to the Scottish economy
(mostly in the Highlands and Islands).106 This serves to
highlight the importance of the salmon farming
industry to the Scottish economy (and, in particular,
remote regional economies) and the need to maintain
healthy stocks.
It is also important to note the potential reliance and,
hence, socio-economic importance of using potassium
permanganate as a treatment for fish diseases in
developing countries. Evidence suggests that
potassium permanganate may be widely used to treat
diseases in fisheries in the developing world, with a
survey of 257 farmers undertaken in Bangladesh
indicating that potassium permanganate was the most
popular treatment.107 Fish is the second most valuable
agricultural crop in Bangladesh and its production
contributes to the livelihoods and employment of
millions of people. It is estimated that approximately
1.3 million tonnes of fish (excluding shrimp and prawn)
are produced each year from numerous inland
aquaculture systems (including small homestead ponds
and larger intensive enterprises).108 Again, assuming
that the cessation of potassium permanganate use
results in a 1% reduction in fish yield, direct losses to the
Bangladeshi economy are estimated to lie in the region
of US$ 8.8 million to US$ 12.5 million per year.
Potential socio-economic impacts associated with
reduced fish production yields could be significant
given that fish provides more than 60% of animal
source food in the Bangladeshi diet.122
SCOTTISH SALMON FARMING
Image courtesy of: Sainsbury’s (no date)
PROJECTED TOTAL FOOD FISH CONSUMPTION(000 TONNES, GLOBAL)
Source: World Bank (2013)

38 |
6. Manganese – Regional Impacts
Africa
In 2013, the African region accounted for ~30% of
global Mn ore production, with the two largest
producing countries being South Africa (11 million mt)
and Gabon (4.3 million mt). Ghana, Ivory Coast,
Namibia and Egypt also produced small amounts of Mn
ore. In total, US$ 3.8 billion to US$ 4.1 billion worth of
Mn ore was produced in the African region in 2013, with
the total economic value (direct and indirect) of
production valued at US$ 7.5 billion to US$ 8.1 billion
in this year.
South Africa is considered to hold around 80% of
world Mn reserves109, with around 92% of the world’s
high grade Mn ore located in the Kalahari Basin.110
This is significant given that high quality steel products
(such as flats and longs) use HC FeMn and Ref FeMn,
which can only be made using high grade Mn ore111.
Hence, South Africa is likely to be a very important
player in the future production of high quality steel;
indeed, future production of Mn ore in South Africa is
forecast to grow by an average of 11.7% between 2012
and 2020, depending on the future development of the
country’s rail and port capacity.112
In 2013, Africa accounted for just 2% of total global Mn
ore consumption (i.e. 356,400 mt). Only Egypt and
South Africa consumed significant quantities of Mn ore
(accounting for 8% and 92% of total regional
consumption respectively).
It is estimated that 11,200 to 17,100 people are
currently employed in the production of Mn ore in
Africa - a quarter of global employment related to Mn
ore production. A further 8,400 to 12,800 people are
thought to be employed as a result of indirect and
induced employment effects. It is worth noting that the
social multiplier effect of mining is believed to be very
high in Africa - in South Africa, there is a dependency
ratio of about 10 to 1 which suggests that Mn mining
generates significant positive impacts in the
communities where it takes place.113
Also of note is that the fatality and injury rates
associated with Mn ore production in 2012 were
generally lower than most other mined commodities
in South Africa (see graphs on the next page).
In 2013, Africa produced 17% of the world’s HC FeMn,
9% of its Ref FeMn and 1% of its SiMn. South Africa
was by far the greatest contributor, with Egypt
producing a small quantity of HC FeMn (accounting for
6% of African production).
In total, production of Mn alloy in Africa is valued at US$
892 million per year, bringing the total economic value
(direct and indirect) of Mn alloy production in Africa to
an estimated US$ 3.4 billion per year.
It is estimated that approximately 5,000 to 7,700
people are currently employed in the production of
Mn alloy in Africa (taking into account direct, indirect
and induced employment effects); 50% in Zaire and
48% in Namibia.
TOTAL ECONOMIC VALUE OF MN ORE PRODUCTION(LOW ESTIMATE, US$ MILLION)

| 39
FATALITY RATES PER MILLION HOURS WORKED PER COMMODITY MINED – SOUTH AFRICA (2012)
INJURY RATES PER MILLION HOURS WORKED PER COMMODITY MINED – SOUTH AFRICA (2012)
Source: Ramontja (2013)

40 |
CASE STUDY: SOUTH AFRICA (ASSMANG LTD)
Assmang Ltd is an important producer of Mn ore and alloy in South Africa and provides a significant socio-economic
contribution to local (and regional) communities. A key priority of the Organisation is to ensure the health and safety of
its employees. During 2011/12, the Mn ore production facilities at the Black Rock complex achieved 1.7 million fatality-
free shifts and received an award for the safest and most improved underground mine. Mn alloy production at Cato Ridge
Works also achieved 1.2 million fatality-free shifts during 2011/12.
Assmang also contributes to community outreach programmes that include extending HIV/Aids testing and disease
management into local communities, the development of a community health care facility and a sight restoration project.
Assmang Ltd contributes to social development with measures designed to educate and train local populations. The
management demographic of the Black Rock Mn complex currently consists of 57% Historically Disadvantaged South
African’s (HDSA), thus exceeding the 2014 target of 40%. In 2011/12, Assmang Ltd spent 9.3% of payroll on staff
training, which is almost double the Mining Charter 2014 target of 5% and the number of learnerships and bursaries
awarded has also increased over recent years, with these focussing on artisanal skills (such as electricians, boilermakers
etc.). In addition to the above CSR initiatives, the company invests in ‘TEACH South Africa’, which aims to improve
educational opportunities for children attending the most disadvantaged schools.
Assmang promotes employee home ownership by providing housing subsidies, discounted interest rates for housing loans
as well as developing affordable housing (using, where possible, local suppliers and thus significantly contributing to the
local economy). Assmang Ltd’s CSR spend in 2011/12 was approx. US$ 8.3 million (an increase of 60% compared to the
previous year) and included infrastructure (road) upgrades and supply of a water reticulation system to the Madibeng
Community.
Source: (Assmang, 2012)
CASE STUDY: GABON (ERAMET - COMILOG)
Manganese production is now the second-largest economic activity in Gabon. Eramet’s subsidiary Comilog (which
operates an ore and sinter production business in Gabon) employs around 3,000 workers in this field. In Moanda, Comilog
contributes to both economic and social development - the Company has policies to educate and train local populations
and also contributes to the provision and operation of health (hospitals, maternity services, etc.), education and housing
facilities. In 2011, 25% of Comilog’s payroll/wage bill was used for social purposes.
Comilog provides 33 hospital beds and 19 rooms dedicated to maternity care within the Marcel-Abéké hospital in Moanda.
The hospital has treated more than 40,000 workers and performs more than 680 operations per year (61% of which are
not on employees of Comilog). Furthermore, the hospital has one of the best equipped surgical wards in Gabon. In 2011,
a new pharmacy was opened as well as 20 new fully functioning rooms. In partnership with public authorities and the
health authority of Gabon, Comilog leads the ‘Gamma’ program; an AIDS prevention campaign.
Comilog also contributes to the provision of housing and infrastructure in Moanda and has approximately 1,000 houses
within the town. In 2012, Comilog began to build 100 new homes for its staff. In 2011, the company renovated 3 km of
national road to serve the industrial zone and also installed two 5,000 litre water tanks to provide drinking water to the
area around the railway station. The company also supports education and training by providing materials to the
professional training centre, by welcoming 200 trainees (on average) per year and by providing finance to the Henri Sylvoz
School in Moanda. Comilog is developing a new metallurgical complex in Moanda, including a mining and metallurgical
school, creating 400 jobs. Since 2005, Eramet (Setrag) has managed the Transgabon railway used to transport Mn ore,
wood and other goods as well as passengers across Gabon.
Sources: Comilog (2011a); Comilog (2011b); Eramet (2006); Eramet (2012)

| 41
Asia
In the Asian region, India and China are important
countries, accounting for around 16% of global Mn ore
reserves (in 4th and 5th position globally). In terms of Mn
ore production, China accounts for over a third of wet
Mn ore produced (all grades) and ~90% of global
production of low grade ores. Despite these abundant
resources, production in the Asian region has not been
able to keep pace with present demand. Today, China
and India are the two largest importers of Mn ore in the
world, with China importing approximately 50% of its
Mn ore requirements. South Korea is also a major
importer, importing more than one million tonnes of
Mn ore each year, mainly from South Africa, Australia
and Gabon. Japan is also an important trading country
in the Asian region.
The Asian region is also an important player in the
production of value added products. In 2011, India was
the largest exporter of SiMn in the world. SiMn is
preferred in many mini steel mills because it contains
the right proportion of Mn (50-74%) and silicon (14-
28%) as well as low carbon content (1-2.5%). India is
also the fourth largest producer of crude steel in the
world and is forecast to become the second largest
producer of crude steel in the world by 2015. In the
coming years, India's steel usage is projected to grow
by between 7% and 10% per year on the back of
urbanisation and surging infrastructure investment.
The 200 series stainless steels have also made an
important contribution to society in Asia. In India, 200
series stainless steels, which have a high Mn content,
have been used extensively since the 1980s; these
stainless steels are not only cheaper than 300 series
stainless steels (due to their lower nickel content) but
they are also available domestically. The market for
200 series stainless steel has experienced dramatic
growth in China (and South East Asia more generally)
over the last few years. In 2012, China produced
approximately 5 million tonnes of 200 series stainless
steel, making it the world’s leading producer of the
metal.114 India is the world’s second largest producer of
200 series stainless steel. Although the majority of 200
series stainless steel produced in India is consumed
domestically, a significant proportion is also exported
to China.115
200 series stainless steel is particularly well suited to the
rapidly growing consumer and manufacturing sectors
in Asia. The development of 200 series stainless steel in
Asia permitted the production of cost effective
stainless steel products which has helped to meet
increasing demand created by the expanding Chinese
and Indian economies and the desire to improve living
standards. 200 series stainless steel is most often used
in the production of tableware and cookware, as well as
in electrical products. 200 series stainless steel has also
helped to fuel growth in the use of stainless steel in
India (now the tenth largest producer of stainless steel
in the world) although per capita consumption of
stainless steel in India is still lower than the global
average (1.2 kg compared to 9.4 kg).116 This highlights
the continued potential for growth in the stainless steel
industry in India. With the development of rural
markets, consumption and application of 200 series
stainless steel is expected to increase in the future.1
Mn is also a major source of employment in the Asian
region. Over 50% of all workers employed in the
production of Mn ore and alloys are based in China.
Most of these workers are employed in small mines
producing Mn ore. It has been reported that there are
over 500 producers of 200-series stainless steel in
China, the majority of which are small, private
enterprises. In India, MOIL is a major employer in
certain regions, accounting for over 6,500 workers
overall.
STAINLESS STEEL COOKWARE
Image courtesy of: Amazon.com (no date)
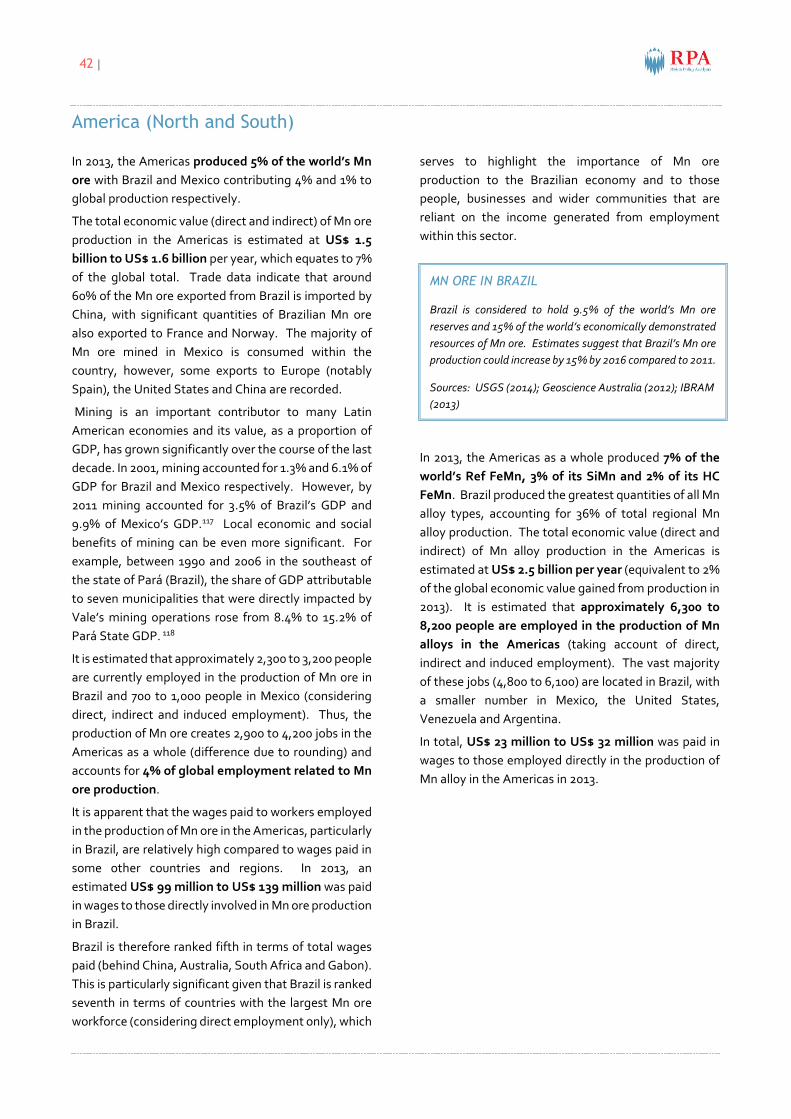
42 |
America (North and South)
In 2013, the Americas produced 5% of the world’s Mn
ore with Brazil and Mexico contributing 4% and 1% to
global production respectively.
The total economic value (direct and indirect) of Mn ore
production in the Americas is estimated at US$ 1.5
billion to US$ 1.6 billion per year, which equates to 7%
of the global total. Trade data indicate that around
60% of the Mn ore exported from Brazil is imported by
China, with significant quantities of Brazilian Mn ore
also exported to France and Norway. The majority of
Mn ore mined in Mexico is consumed within the
country, however, some exports to Europe (notably
Spain), the United States and China are recorded.
Mining is an important contributor to many Latin
American economies and its value, as a proportion of
GDP, has grown significantly over the course of the last
decade. In 2001, mining accounted for 1.3% and 6.1% of
GDP for Brazil and Mexico respectively. However, by
2011 mining accounted for 3.5% of Brazil’s GDP and
9.9% of Mexico’s GDP.117 Local economic and social
benefits of mining can be even more significant. For
example, between 1990 and 2006 in the southeast of
the state of Pará (Brazil), the share of GDP attributable
to seven municipalities that were directly impacted by
Vale’s mining operations rose from 8.4% to 15.2% of
Pará State GDP. 118
It is estimated that approximately 2,300 to 3,200 people
are currently employed in the production of Mn ore in
Brazil and 700 to 1,000 people in Mexico (considering
direct, indirect and induced employment). Thus, the
production of Mn ore creates 2,900 to 4,200 jobs in the
Americas as a whole (difference due to rounding) and
accounts for 4% of global employment related to Mn
ore production.
It is apparent that the wages paid to workers employed
in the production of Mn ore in the Americas, particularly
in Brazil, are relatively high compared to wages paid in
some other countries and regions. In 2013, an
estimated US$ 99 million to US$ 139 million was paid
in wages to those directly involved in Mn ore production
in Brazil.
Brazil is therefore ranked fifth in terms of total wages
paid (behind China, Australia, South Africa and Gabon).
This is particularly significant given that Brazil is ranked
seventh in terms of countries with the largest Mn ore
workforce (considering direct employment only), which
serves to highlight the importance of Mn ore
production to the Brazilian economy and to those
people, businesses and wider communities that are
reliant on the income generated from employment
within this sector.
In 2013, the Americas as a whole produced 7% of the
world’s Ref FeMn, 3% of its SiMn and 2% of its HC
FeMn. Brazil produced the greatest quantities of all Mn
alloy types, accounting for 36% of total regional Mn
alloy production. The total economic value (direct and
indirect) of Mn alloy production in the Americas is
estimated at US$ 2.5 billion per year (equivalent to 2%
of the global economic value gained from production in
2013). It is estimated that approximately 6,300 to
8,200 people are employed in the production of Mn
alloys in the Americas (taking account of direct,
indirect and induced employment). The vast majority
of these jobs (4,800 to 6,100) are located in Brazil, with
a smaller number in Mexico, the United States,
Venezuela and Argentina.
In total, US$ 23 million to US$ 32 million was paid in
wages to those employed directly in the production of
Mn alloy in the Americas in 2013.
MN ORE IN BRAZIL
Brazil is considered to hold 9.5% of the world’s Mn ore
reserves and 15% of the world’s economically demonstrated
resources of Mn ore. Estimates suggest that Brazil’s Mn ore
production could increase by 15% by 2016 compared to 2011.
Sources: USGS (2014); Geoscience Australia (2012); IBRAM
(2013)
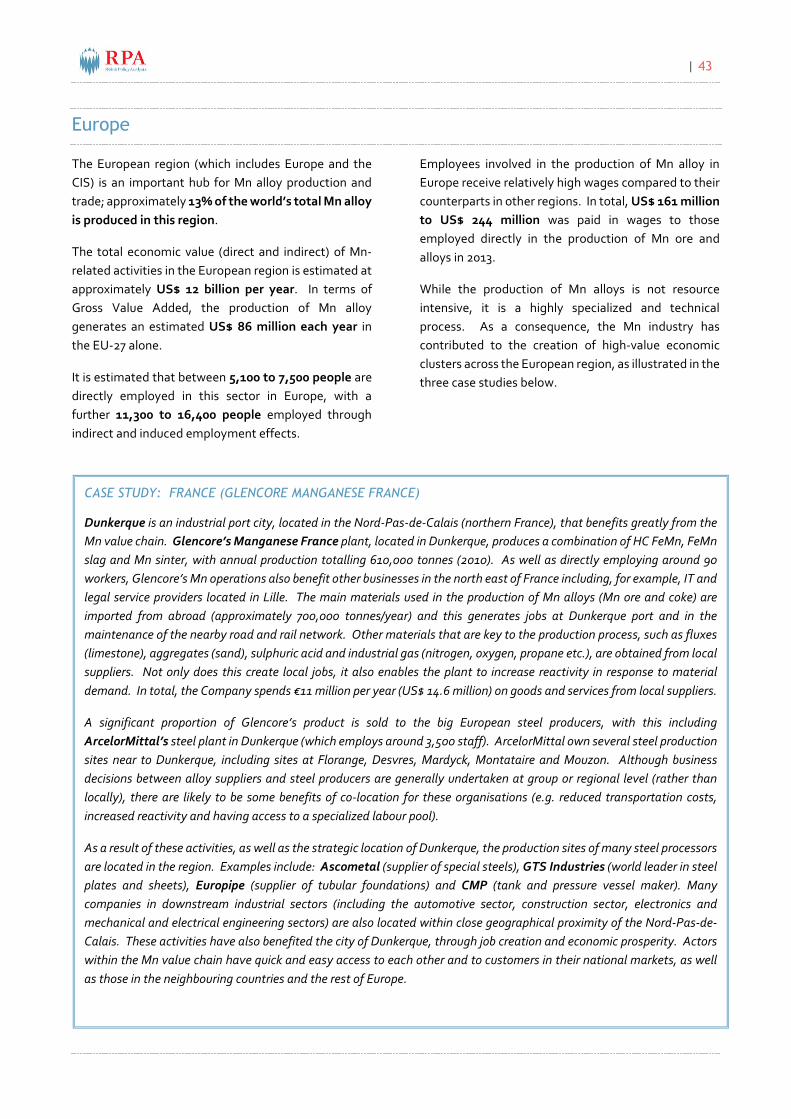
| 43
Europe
The European region (which includes Europe and the
CIS) is an important hub for Mn alloy production and
trade; approximately 13% of the world’s total Mn alloy
is produced in this region.
The total economic value (direct and indirect) of Mn-
related activities in the European region is estimated at
approximately US$ 12 billion per year. In terms of
Gross Value Added, the production of Mn alloy
generates an estimated US$ 86 million each year in
the EU-27 alone.
It is estimated that between 5,100 to 7,500 people are
directly employed in this sector in Europe, with a
further 11,300 to 16,400 people employed through
indirect and induced employment effects.
Employees involved in the production of Mn alloy in
Europe receive relatively high wages compared to their
counterparts in other regions. In total, US$ 161 million
to US$ 244 million was paid in wages to those
employed directly in the production of Mn ore and
alloys in 2013.
While the production of Mn alloys is not resource
intensive, it is a highly specialized and technical
process. As a consequence, the Mn industry has
contributed to the creation of high-value economic
clusters across the European region, as illustrated in the
three case studies below.
CASE STUDY: FRANCE (GLENCORE MANGANESE FRANCE)
Dunkerque is an industrial port city, located in the Nord-Pas-de-Calais (northern France), that benefits greatly from the
Mn value chain. Glencore’s Manganese France plant, located in Dunkerque, produces a combination of HC FeMn, FeMn
slag and Mn sinter, with annual production totalling 610,000 tonnes (2010). As well as directly employing around 90
workers, Glencore’s Mn operations also benefit other businesses in the north east of France including, for example, IT and
legal service providers located in Lille. The main materials used in the production of Mn alloys (Mn ore and coke) are
imported from abroad (approximately 700,000 tonnes/year) and this generates jobs at Dunkerque port and in the
maintenance of the nearby road and rail network. Other materials that are key to the production process, such as fluxes
(limestone), aggregates (sand), sulphuric acid and industrial gas (nitrogen, oxygen, propane etc.), are obtained from local
suppliers. Not only does this create local jobs, it also enables the plant to increase reactivity in response to material
demand. In total, the Company spends €11 million per year (US$ 14.6 million) on goods and services from local suppliers.
A significant proportion of Glencore’s product is sold to the big European steel producers, with this including
ArcelorMittal’s steel plant in Dunkerque (which employs around 3,500 staff). ArcelorMittal own several steel production
sites near to Dunkerque, including sites at Florange, Desvres, Mardyck, Montataire and Mouzon. Although business
decisions between alloy suppliers and steel producers are generally undertaken at group or regional level (rather than
locally), there are likely to be some benefits of co-location for these organisations (e.g. reduced transportation costs,
increased reactivity and having access to a specialized labour pool).
As a result of these activities, as well as the strategic location of Dunkerque, the production sites of many steel processors
are located in the region. Examples include: Ascometal (supplier of special steels), GTS Industries (world leader in steel
plates and sheets), Europipe (supplier of tubular foundations) and CMP (tank and pressure vessel maker). Many
companies in downstream industrial sectors (including the automotive sector, construction sector, electronics and
mechanical and electrical engineering sectors) are also located within close geographical proximity of the Nord-Pas-de-
Calais. These activities have also benefited the city of Dunkerque, through job creation and economic prosperity. Actors
within the Mn value chain have quick and easy access to each other and to customers in their national markets, as well
as those in the neighbouring countries and the rest of Europe.

44 |
CASE STUDY: SLOVAKIA (OFZ)
OFZ a. s., located in Slovakia, is the largest central European manufacturer of ferroalloys, offering its customers a range
of Mn-based products (including HC FeMn and FeSiMn). The Company is one of the most important suppliers of
ferroalloy in the Central European region and is located centrally in relation to the traditional metallurgical centres of
Slovakia, Poland, Czech Republic, Hungary and Austria, where the vast majority of its production is sold. The company
supplies Mn alloys to two local steelworks (U.S. Steel Kosice s.r.o in Slovakia and Trinec Iron and Steelworks (Třinecké
Železárny) in the Czech Republic) located approximately 200km east and 100km northwest of the OFZ a.s. facilities
respectively. Třinecké Železárny produces approximately 2.5 million tonnes of steel annually and employs
approximately 6,000 people. Around half the steel products produced by Třinecké Železárny are sold domestically with
the remaining 50% shipped to more than 50 countries around the world (although the largest volumes of products are
exported to neighbouring countries). The steelworks operated by U.S. Steel Kosice s.r.o, is the largest private employer
in eastern Slovakia with a workforce of more than 13,000 people. The supply of Mn alloys from OFZ a.s. is critical to the
operations undertaken at these plants.
OFZ’s plant in Istebné (Slovakia) is an important employer in the region; in 2013, the Company employed 200 people to
manufacture its Mn-based products and made employee contributions (for Mn) totalling approximately €830,000 (US$
1.1 million). A key priority of the organization is to ensure the health and safety of its employees. To this end the
company has introduced a number of measures to effectively monitor employee health, including the presence of
healthcare workers at hazardous workplaces. OFZ a. s. also provides employer health reinsurance, as required under
the Slovakian healthcare system and works in cooperation with the local hospital to undertake health projects/training
for staff.
Sources: OFZ a. s. (no date); OFZ a. s. (2011); OFZ a. s. (2014)
CASE STUDY: SPAIN (FERROATLÁNTICA)
In 2012, Grupo FerroAtlántica employed 414 people in the production of Mn products in Spain. The Company’s Monzón
factory (operated by Hidro Nitro and located in Huesca) produces SiMn and FeMn; it employs 162 people directly in this
area of business. Several of the company’s suppliers are located in the vicinity of Monzón, providing services such as
machinery supplies, materials transportation, supply and installation of furnace consumables and provision of crushing
and screening services. Industrial maintenance and assemblies are provided by local companies employing around 100
staff, and transportation of raw materials and finished products is provided by four local companies with over 180 staff.
HNE exports more than 85% of its production either by road transport or through Mediterranean or Cantabria ports.
FerroAtlántica’s Boo plant, situated in the municipalities of Astillero and Camargo, produces SiMn, HC FeMn and Ref
FeMn; it has 168 employees. A number of companies within the area provide FerroAtlántica’s Mn operations with
materials and services, including stevedoring services at the nearby port of Santander, internal transport services and
cleaning services. Some of the company’s downstream users are also located within the vicinity of the factory, including
Global Steel Wire (one of the largest European producers of rolled wire and derived products, with an annual turnover
of €470 million) and Arcelor Mittal Asturias (with a total annual production of 5 million tonnes of steel).
Two of FerroAtlántica’s factories are located in A Coruña Province, in the Municipalities of Cée and Dumbría. In 2011, a
significant investment was made by the local government of Galicia to expand the capacity of the nearby Brens-Cee
Port. FerroAtlántica contributed €2 million to this project, which has enhanced the competitiveness of the plants and
benefitted commercial and economic activity in the area.
Sources: Grupo FerroAtlántica (2012) – Annual Report

| 45
Oceania
Australia is the only country within the Oceania region to produce Mn ore. It is considered to hold 17% of the world’s Mn
ore reserves, ranked third behind South Africa (26%) and Ukraine (25%).119 In 2013, Australia produced 13% of the
world’s Mn ore (7.3 million mt) and was the world’s largest producer of high grade Mn ore (accounting for 36% of global
production). This is important given that high quality steels can only be made using high grade ore.126
Mining is one of the most important sectors of the Australian economy and typically accounts for around 5% of the
country’s GDP.120 The mining sector’s share of GDP is forecast to increase to 7.6% by 2017.121 However, this figure would
increase significantly if downstream mining related activities in industries such as manufacturing, construction,
transport and storage, property and business services and electricity and gas were included.
Taking into account direct and indirect effects, it is estimated that the production of Mn ore contributes around US$ 3.4
billion to US$ 3.7 billion to the region’s economy each year, which is equivalent to around 16% of the global economic
value gained from Mn ore production.
It is estimated that 6,800 to 9,300 people are currently
employed in the production of Mn ore in Australia
(considered direct, indirect and induced employment) –
approximately 7% to 9% of global Mn ore employment.
It is widely reported that the wages paid to mine workers in
Australia are high compared to those in other nations and
sectors (as indicated in the table). This is important given
that these workers are likely to have a higher level of
disposable income, which can support jobs and economic
growth in other sectors of the Australian economy. In 2013,
an estimated US$ 529 million to US$ 727 million was paid in
wages to those employed directly in the production of Mn
ore in Australia.
As is the case with Mn ore production, Australia is the only
country within Oceania to produce significant quantities of
Mn alloy. In 2013, Australia produced ~3% of the world’s HC
FeMn. SiMn and Ref FeMn are not produced in the region.
It is estimated that the production of Mn alloy contributes
some US$ 572 million to the region’s economy each year
(direct and indirect economic value), equivalent to 0.4% of
the global economic value gained from Mn alloy
production.
It is estimated that 100 to 200 people are directly employed
in the production of Mn alloy in Australia, with a further 400
to 600 jobs generated in the supply chain. Total employment
relating to the production of Mn alloys in Australia is
estimated at 500 to 800 people in 2013, with around US$ 7.6
million to US$ 11.4 million paid in wages to employees
(direct employment only).
In a global context, Oceania is a relatively small consumer of
Mn alloys accounting for less than 1% of global apparent
consumption in 2013.
EMPLOYMENT IN MN ORE & MN ALLOYPRODUCTION IN AUSTRALIA
ESTIMATED WAGES RELATED TO DIFFERENT SECTORSIN AUSTRALIA IN 2013 (US$ MILLION)
Employment type Low High
Mn ore miners 530 730
Government 290 400
Healthcare 250 350
Retail 150 210
Construction 580 790
Transport 390 540
Technical professionals 370 510
Manufacturing 430 600

46 |
7. ConclusionManganese plays a very important role in the global economy and various industry sectors, products and/or applications
are heavily dependent on its production and use.
In countries such as Australia, China, Gabon, South Africa and
Brazil, the production of Mn ore (and associated capital and
operating expenditures) makes a significant contribution to the
national economy (e.g. in terms of GDP). Overall, the total
economic contribution of Mn ore production (globally) is
estimated at US$ 21 billion to US$ 23 billion per year. There are
also important social benefits from such operations reflected in
employment figures. Between US$ 2,700 million and $ 4,600
million per annum is paid in wages to those employed directly in
the production of Mn ore, with workers in China, Australia and
South Africa accounting for the majority (~80%) of wages paid.
The global economy also benefits from Mn alloy production and processing, with global production of Mn alloy valued
at around US$ 23 billion per year (of which, China contributes approximately US$ 14.4 billion). Large contributions to
the global economy are also made by Mn alloy producers in India (US$ 2.5 billion), South Africa (US$ 0.9 billion) and
Ukraine (US$ 0.8 billion). Taking into account downstream effects along the supply chain, the value of Mn alloy
production worldwide is estimated at around US$ 146 billion per year.
Mn is a critical raw material input and process additive for the steel industry and the continued growth of this industry
relies on Mn. Of particular importance are carbon steels (worth an estimated US$ 839 billion to US$ 1,259 billion in 2013)
and construction/engineering steels (worth an estimated US$ 29 billion to US$ 43 billion). Recent innovations in the
steel sector, such as in TWIP steels, have significant potential for use in future automotive applications, mainly due to
their potential to increase the crashworthiness of vehicles (enhancing passenger safety) and reduce vehicle weight
(reducing fuel consumption and emissions). Mn is also critical in the production of low-cost 200-series stainless steels;
a market which could grow to reach around US$ 18 billion to US$ 35 billion in value by 2020.
Besides steel, Mn has a number of other downstream uses of social and economic significance. For example, Mn is a
critical element in the manufacture of batteries (e.g. the lithium manganese spinel battery) that could offer the
opportunity for the wide-scale introduction of battery electric vehicles. In the EU alone, this could lead to total CO2
emissions reductions worth an estimated US$ 723 million to US$ 8,343 million by 2020. An estimated 413,000 to 662,000
life years could be gained across the EU population by 2020 due to the associated reduction in PM10 emissions. Mn is
also the main alloying element in the production of 3XXX series aluminium alloys used in beverage cans; a market
estimated to grow to over US$ 11 billion by 2020.
Socio-economic analysis provides the tools and methods for estimating the social and economic benefits of an industry
to a community, ranging from a single neighbourhood to the global community as a whole. While some of these benefits
have been quantified in this first report, there are other benefits which are equally important but which have not been
fully quantified at this stage. For instance, in Europe, the Mn industry has contributed to the creation of high-value
economic clusters across the region. Mn is also an essential micronutrient needed for plant growth and plays a vital role
in agricultural production. It is also critical for maintaining the health and well-being of the human body and is used in
food supplements and medicines. It is hoped that this report will assist in ensuring that some of the economic benefits
that have so-far not been well understood are better recognised by governments and other key stakeholders. It will also
increase the appreciation of how the production and use of Mn is helping to meet society’s needs in a sustainable way.

| 47
References1 AME Mineral Economics (Hong Kong) Ltd and Chinese Iron and Steel Research Institute Group (2010): Manganese Industry
Review, available from Hong Kong Exchanges and Clearing Limited:http://www.hkexnews.hk/listedco/listconews/sehk/2010/1108/01091_932152/E114.pdf
2 International Manganese Institute (no date): Reserves, Article available from the IMnI:http://www.manganese.org/about_Mn /reserves
3 BHP Billiton (2013): BHP Billiton Coal Overview, Presentation available from BHP Billiton:http://www.bhpbilliton.com/home/investors/reports/Documents/2013/130529_CoalBriefing.pdf
4 KeytoMetals (no date): Classification of Carbon and Low-Alloy Steels, Article available from KeytoMetals:http://www.keytometals.com/Articles/Art62.htm
5 Acme Alloys (no date): Austenitic Manganese Steels, Information available from Acme Alloys:http://www.acmealloys.com/Austenitic%20Manganese%20Steels.PDF
6 AMG Vanadium (no date): Manganese, Article available from AMG Vanadium:http://www.metallurgvanadium.com/manganesepage.html
7 Webb TC (2008): Manganese, Mineral Commodity Profile No. 1., Article available from Government of New Brunswick,Department of Natural Resources, Minerals, Policy and Planning Division: http://www.gnb.ca/0078/minerals/PDF/MCP_1-e.pdf
8 AZoM (no date): Steels – Carbon Steels, Mild Steel, Carbon-Manganese Steels, Alloys Steels, Low-Alloy Steels and Micro-Alloy Steels, Article available from AZoM: http://www.azom.com/article.aspx?ArticleID=2537
9 Leong Huat Hardware Pte Ltd (no date): Effects of Mn, P, S, Si & V on the Mechanical Properties of Steel, Informationavailable from Leong Huat Hardware Pte Ltd: http://www.leonghuat.com/articles/elements.htm
10 MMTA (2006): Manganese, Information available from the Minor Metals Trade Association (MMTA):http://www.mmta.co.uk/uploads/2013/01/10/153950_manganese_mbm.pdf
11 World Steel Association (2008): Wind Energy – The Fastest Growing Power Source, Paper available from the World SteelAssociation: http://www.steel.org/Sustainability/~/media/Files/SRI/Media%20Center/WindEnergyCaseStudy.ashx
12 Hamada AS, Karjalainen LP (2010): Corrosion Behaviour of High-Mn TWIP Steels with Electroless Ni-P Coating, The OpenCorrosion Journal, 3, 1-6, Paper available at: http://www.benthamscience.com/open/tocorrj/articles/V003/1TOCORRJ.pdf
13 KeytoMetals (2007): Multiphase Twinning-Induced Plasticity (TWIP) Steel, Article available from KeytoMetals:http://www.keytometals.com/page.aspx?ID=CheckArticle&site=kts&NM=207
14 WorldAutoSteel (no date): Twinning-Induced Plasticity (TWIP) Steel, Article available from WorldAutoSteel:http://www.worldautosteel.org/steel-basics/steel-types/twinning-induced-plasticity-twip-steel/
15 WorldAutoSteel (2011): FutureSteelVehicle, Article available a from WorldAutoSteel:http://www.autosteel.org/~/media/Files/Autosteel/Programs/FutureSteelVehicle/FSV%20-%20Overview%20Report%20-%20rev1.pdf
16 Schroder T (2010): Cooking Steel for the Cars of Tomorrow, Report available from Max-Planck-Gesellschaft:http://www.mpg.de/799772/W003_Materials-Technology_022-029.pdf
17 ThyssenKrupp (2009): InCar – The Innovative Solution Kit for the Automotive Industry, Article available fromThyssenKrupp: http://incar.thyssenkrupp.com/0_10_Homepage.html?lang=en
18 WorldAutoSteel (no date): FutureSteelVehicle Provides Lightweight, Low Carbon Footprint Vehicle, Article available fromWorldAutoSteel: http://www.worldautosteel.org/projects/future-steel-vehicle/phase-2-results/
19 ICCT (2012): European CO2 Emission Performance Standards for Passenger Cars and Light Commercial Vehicles, Articleavailable from The International Council on Clean Transport: http://www.theicct.org/eu-2020-co2-emission-standards-cars-and-vans
20 De Cooman B, Chin K & Kim J (2011): High Mn TWIP Steels for Automotive Applications – New Trends and Developmentsin Automotive System Engineering, Paper available at InTechOpen: http://cdn.intechopen.com/pdfs/13349/InTech-High_mn_twip_steels_for_automotive_applications.pdf
21 Ghassemieh E (2011): Chapter 20: Materials in Automotive Applications, State of the Art and Prospects – In: New Trendsand Developments in Automotive Industry, Article available at IntechOpen: http://www.intechopen.com/books/new-trends-and-developments-in-automotive-industry/materials-in-automotive-application-state-of-the-art-and-prospects

48 |
22 PA Consulting Group (no date): Developing Vehicles to Meet Carbon Emissions Reduction Targets, Article available fromPA Consulting Group: http://www.paconsulting.co.uk/our-thinking/developing-vehicles-to-meet-carbon-emissions-reduction-targets/
23 The Automotive Applications Council (2011): Sustainability and Steel in Automotive Applications, Article available from theSteel Market Development Institute:http://www.autosteel.org/Sustainability/Life%20Cycle%20Information/Automobiles.aspx
24 World Health Organization (2013): Global status report on road safety 2013, Report available from the WHO:http://www.who.int/violence_injury_prevention/road_safety_status/2013/en/
25 Industry Today (2013): Pound-for-Pound, Article available from Industry Today:http://www.industrytoday.com/FlippingBook/16.5/#22/z
26 Ideas 1st Research (2010): Manganese – May 2010, Report available from Ideas 1st Research:http://ideasfirst.in/Admin/Downloads/Reports/1580573763_Manganese%20Report%20-%20Final%20-%2031May20101.pdf
27 Peters NW (no date): The Performance of Hadfield's Manganese Steel as it Relates to Manufacture, Report available fromAREMA: http://www.arema.org/files/library/2005_Conference_Proceedings/00040.pdf
28 Ford Steel Company (2009): Mangalloy Plate, Article available from Ford Steel Company:http://www.fordsteel.com/mangalloy_plate.htm
29 Olawale JO, Ibitoye SA & Shittu MD (2013): Workhardening behaviour and microstructural analysis of failed austeniticmanganese steel crusher jaws, Materials Research (submitted), Paper available at:http://www.scielo.br/scielo.php?pid=S1516-14392013005000144&script=sci_arttext
30 Voestalpine. (no date): Cast Manganese Crossings, Information available from Voestalpine:http://www.voestalpine.com/weichensysteme/static/sites/c007/downloads/en/products/turnouts/HMN_en.pdf
31 Balfour Beatty Rail (2013): Embedded Trackwork, Information available from Balfour Beatty Rail:http://www.bbrail.co.uk/Products-and-Services/Track/Embedded-Track-Work
32 Hlavaty T et al. (2009): The Bainitic Steels for Rails Applications, Materials Engineering, 16, 44-50. Paper available from theFaculty of Mechanical Engineering at the University of Zilina: http://fstroj.uniza.sk/journal-mi/PDF/2009/09-04.pdf
33 Tata Steel (2013): Rail technical Guide, Document available from Tata Steel:http://www.tatasteeleurope.com/file_source/StaticFiles/Business_Units/Rail/Rail%20Technical%20Guide%20Final.pdf
34 Kufa T et al. (2009): Materialova uroven kolejnic TZ v porovnani s kolejnicemi nekterych prednich evropskych vyrobcu. In:Hlavaty T et al. (2009): The Bainitic Steels for Rails Applications, Materials Engineering, 16, 44-50.
35 ArcelorMittal (no date): Heavy Haul Rails, Article available from ArcelorMittal:http://www.arcelormittal.com/rails+specialsections/en/heavy-haul-rails.html
36 Outokumpu (no date): Annual Report 2010, Market Position, Article available from Outokumpu:http://ar2010.outokumpu.com/business/operating-environment/market-position
37 BSSA (no date): Factors affecting wear and galling, Article available from the British Stainless Steel Association:http://www.bssa.org.uk/topics.php?article=11
38 Magee JH (1996): Two Galling Resistant Stainless Steels used for Bridge Hinge Pins, Article available from CarpenterTechnology Corporation: http://www.cartech.com/techarticles.aspx?id=1666
39 Outokumpu (2005): Utilization of the Material Strength for Lower Weight and Cost with LDX 2101®, Paper available fromOutokumpu: http://www.outokumpu.com/SiteCollectionDocuments/Utilization-of-the-Material-Strength-for-Lower-Weight-and-Cost-with-LDX-2101-Acom.pdf
40 Tata Steel (no date): Advantages of Steel Bridges, Article available from Tata Steel:http://www.tatasteelconstruction.com/en/design_guidance/steel_bridges/advantages_of_steel_bridges/
41 Outokumpu (no date): Pioneering use of duplex LDX 2101® in concrete reinforcement, Article available from Outokumpu:http://www.outokumpu.com/en/industries-and-cases/cases/pioneering-use-of-duplex-ldx-2101/Pages/default.aspx
42 SMR (2009): Stainless Steel End Use Analysis, Outokumpu Investors Day, Presentation available from Outokumpu:http://www.outokumpu.com/SiteCollectionDocuments/Outokumpu_CMD_2009_by_Markus_Moll.pdf#search=%22stainless%20steel%20end%20use%20analysis%22
43 Vanitec (2011): Vanadium is used to Strengthen High Strength Low Alloy (HSLA) Steels by Grain Refinement andPrecipitation Strengthening, Article available from The Vanadium International Technical Committee (Vanitec):http://vanitec.org/vanadium/vanadium-solutions-and-advantages/hsla-steels-general/

| 49
44 Crosshair (2011): Vanadium 101, available at: http://www.crosshairexploration.com/s/Vanadium101.asp
45 International Manganese Institute (no date): Applications, Article available from the IMnI:http://www.manganese.org/about_mn/applications
46 MHRP (no date): Applications of Manganese – Industrial and Metallurgical, Information available from The ManganeseHealth Research Programme (MHRP): http://www.manganese-health.org/background/applications
47 KeytoMetals (no date): Control of High Strength Low Alloy (HSLA) Steel Properties, Article available from KeytoMetals:http://www.keytometals.com/page.aspx?ID=CheckArticle&site=kts&NM=182
48 Hulka K (no date): High Strength Steel for Construction Engineering, Article available from Companhia Brasileira deMetalurgia e Mineração: http://www.cbmm.com.br/portug/sources/techlib/info/hsconstr/hsconstr.htm
49 KeytoMetals (no date): Application of Microalloyed HSLA Steel: Part Two, Article available from KeytoMetals:http://www.keytometals.com/page.aspx?ID=CheckArticle&LN=EN&site=KTS&NM=349
50 Korchynsky M (2001): A New Role for Microalloyed Steels – Adding Economic Value, Paper available from The VanadiumInternational Technical Committee (Vanitec): http://vanitec.org/wp-content/uploads/2011/09/A-New-Role-for-Microalloyed-Steels-Adding-Economic-Value.pdf
51 Eckerlid J, Åsell M, Ohlsson A (2010): Use of Vanadium High-Strength Low-Alloy Steels in Trailers – A Case Study, Reportavailable from HSLA-V: http://www.hsla-v.org/assets/documents/trailer.pdf
52 White P (2012): Fertiliser 4: Micronutrients for arable crops, Article available from Farmers Weekly Academy:http://academy.fwi.co.uk/Courses/Arable/Fertiliser-Management/Fertiliser-4-Micronutrients-for-arable-crops
53 Barclay Crop Protection (2009): BVR Manganese500 Technical User Guide, Leaflet available from Barclay Crop Protection:http://www.barclay.ie/media/16159/bvr%20manganese500%20lr.pdf
54 Wolfshohl K (2013): The manganese hit, Article available from The Progressive Farmer: http://dtnpf-digital.com/article/The+Manganese+HIT/1567147/185130/article.html
55 Navigant Research (2013): Electric Vehicle Market Forecasts: Global Forecasts for Light Duty Hybrid, Plug-in Hybrid,andBattery Electric Vehicles: 2013-2020, Executive summary available from Navigant Research:http://www.navigantresearch.com/wp-assets/uploads/2013/06/EVMF-13-Executive-Summary.pdf
56 Electric Vehicle Initiative (2013): Global EV Outlook, Understanding the Electric Vehicle Outlook to 2020, Report availablefrom the International Energy Agency: http://www.iea.org/publications/globalevoutlook_2013.pdf
57 Global Industry Analysts (2010): Global Electric Vehicles Market to Reach 2.6 Million Units by 2015, According to a NewReport by Global Industry Analysts, Inc. Article available from the North Sea Region Electric Mobility Network:http://www.prweb.com/releases/electric/vehicles/prweb4545594.htm
58 Ingram A (2013): U.S. Could Be The Biggest Electric Car Market By 2020, Article available from Green Car Reports:http://www.greencarreports.com/news/1081873_u-s-could-be-the-biggest-electric-car-market-by-2020
59 Davis G (2011): Your new electric car emits 75g CO2/km (at the power station), Technical Paper available from Ecometrica:http://ecometrica.com/assets//electric_car_emits_75_gCO2_per_km.pdf
60 Kampman B et al (2010): Development of policy recommendations to harvest the potential of electric vehicles, Paperavailable from the North Sea Region Electric Mobility Network (E-Mobility NSR): http://e-mobility-nsr.eu/fileadmin/user_upload/downloads/info-pool/green_power_for_electric_cars_report_08-02-10.pdf
61 Navigant Research (2014): Electric Vehicle Batteries: Lithium Ion Batteries for Hybrid, Plug-In Hybrid, and Battery ElectricVehicles: Global Market Analysis and Forecasts, Report available from Navigant Research:http://www.navigantresearch.com/research/electric-vehicle-batteries
62 NDRI (no date): Manganese (Mn) is Essential for Male Fertility/Reproduction, Article available from NDRI:http://ndri.com/article/manganese_mn_is_essential_for_male_fertility_reproduction-292.html
63 International Manganese Institute (no date): Health – Manganese and the Human Body, Article available from the IMnI:http://www.manganese.org/health_safety_and_environment/health
64 PubChem (no date): Manganese Sulphate, Information available from The National Center for Biotechnology Information:http://pubchem.ncbi.nlm.nih.gov/summary/summary.cgi?cid=24580&loc=ec_rcs
65 PubChem (no date): Manganese Carbonate, Information available from The National Center for BiotechnologyInformation: http://pubchem.ncbi.nlm.nih.gov/summary/summary.cgi?cid=11726
66 WebMD (no date): Manganese, Information available from WebMD: http://www.webmd.com/vitamins-supplements/ingredientmono-182-MANGANESE.aspx?activeIngredientId=182&activeIngredientName=MANGANESE

50 |
67 Lu J et al. (2009): Manganese ferrite nanoparticle micellar nanocomposites as MRI contrast agent for liver imaging,Biomaterials, 30, pp 2919-2928. Paper available at: http://www.ncbi.nlm.nih.gov/pubmed/19230966
68 Pan D et al. (2010): Revisiting an old friend: manganese-based MRI contrast agents, Wiley Interdisciplinary Reviews:Nanomedicine and Nanobiotechnology, pp 1-19. Paper available at: http://www.ncbi.nlm.nih.gov/pubmed/20860051
69 Bin Na H et al. (2009): Inorganic nanoparticles for MRI contrast agents, Advanced Materials, pp 2133-2148. Paper availableat: http://onlinelibrary.wiley.com/doi/10.1002/adma.200802366/abstract
70 Yang K and Ren Y (2010): Nickel-free austenitic stainless steels for medical applications, Science and Technology ofAdvanced Materials, 11, pp 1-13. Paper available at: http://iopscience.iop.org/1468-6996/11/1/014105/pdf/1468-6996_11_1_014105.pdf
71 Nickelfrei (2013): Verbreitung der Nickelallergie [distribution of nickel allergies], Information available from NickelFrei:http://www.nickelfrei.de/nickelallergie-im-ueberblick/verbreitung.html
72 Ratner BD et al. (2013): Biomaterials Science – An Introduction to Materials in Medicine, Society for Biomaterials, ThirdEdition, Elsevier.
73 Acmite Market Intelligence (2013): Global Biomedical Market, Abstract available at Acmite Market Intelligence:http://www.acmite.com/brochure/Brochure-Global-Biomedical-Metal-Market.pdf
74 Visiongain (2012): The Aluminium Market Analysis, Financials and Forecasting 2012-2017, Abstract available at Visiongain:https://www.visiongain.com/Report/812/The-Aluminium-Market-Analysis-Financials-and-Forecasting-2012-2017
75 Gesamtverband der deutschen Aluminiumindustrie e.V. (no date): Aluminium in der Verpackung, Maximale Leistung beiminimalem Materialeinsatz [aluminium in packaging, maximum performance at minimum material usage], Reportavailable from Aluminium-Verband Schweiz [Aluminium Association Switzerland]:http://www.alu.ch/download/gda/Verpackung.pdf
76 Giovanazzi A (2005): Il processo produttivo della lattina per bevande [the manufacturing process for beverage cans]. Thesissupervised by Colombo D, Trento University. Available at: http://www.ing.unitn.it/~colombo/lattine/sito.htm
77 Terukina AT (2013): Barriers and solutions for closed-loop aluminium beverage can recycling. Thesis submitted to theNorwegian University of Science and Technology, supervised by Müller DB and Løvik AN, IVM. Available at:http://www.diva-portal.org/smash/get/diva2:648683/FULLTEXT01.pdf
78 KeytoMetals (no date): Aluminum Alloys – Effects of Alloying Elements, Information available from KeytoMetals:http://www.keytometals.com/Article55.htm
79 Maudgal S (2012): Aluminum Can Stock, Current Status and Future View, Presentation available from Novelis:http://www.novelis.com/en-us/SiteAssets/Novelis_Canmaker_Shashi_92712.pdf
80 Rexam (no date): Overview: global beverage can market, Information available from Rexam:http://www.rexam.com/index.asp?pageid=790
81 PR Newswire (2013): Global Metal Cans Market is Expected to Reach USD 51.60 billion in 2019: Transparency MarketResearch Article available from PR Newswire: http://www.prnewswire.com/news-releases/global-metal-cans-market-is-expected-to-reach-usd-5160-billion-in-2019-transparency-market-research-226433941.html
82 John Dunham and Associates (2011): The Metal Can Industry Creates Jobs in the United States, Report available from theCan Manufacturers Institute: http://www.cancentral.com/sites/cancentral.com/files/public-documents/National%20Talking%20Point%20-CMI.pdf
83 HighBeam Business (no date): Metal Cans, Article available from HighBeam Business:http://business.highbeam.com/industry-reports/metal/metal-cans
84 World Business Council for Sustainable Development (no date): Cement Sustainability Initiative, About the CementIndustry, Information available from WBCSD: http://www.wbcsdcement.org/index.php/about-cement
85 Vale (2012): Sustainability Report, available from Vale:http://www.vale.com/EN/aboutvale/sustainability/links/LinksDownloadsDocuments/2012-sustainability-report.pdf
86 Duo Qiang L et al. (2011): Performance of Concrete Made with Manganese Slag, Advanced Materials Research, 335 - 336,pp 333-338. Paper available at: http://www.scientific.net/AMR.335-336.333
87 Rong-Jin L et al. (2012): Durability of concrete made with manganese slag as supplementary cementitious materials, Journalof Shanghai Jiaotong University (Science), 17 (3), pp 345-349. Paper available at:http://link.springer.com/article/10.1007%2Fs12204-012-1284-y#page-1
88 Carbon Enterprises (no date): Silico Manganese Slag, Article available from Carbon Enterprises:http://www.carbonenterprises.co.uk/silico-manganese-slag/

| 51
89 Yan C (2008): Soft Ferrite Industry in China, Magnetics Business & Technology, Article available from Magnetics Magazine:http://s3.amazonaws.com/zanran_storage/www.magneticsmagazine.com/ContentPages/23403679.pdf
90 Yuxiang (no date): MnZn Ferrite Core, Article available from Yuxiang: http://www.magnet-tech.com/core/MnZn/characteristics.htm
91 Chatterjee KK (2007): Uses of Metals and Metallic Minerals, New Age International Publishers, New Delhi, India.
92 Iyer R et al. (2009): Low temperature synthesis of nanosized Mn1–xZnxFe2O4 ferrites and their characterizations, Bulletinof Materials Science, 32 (2) pp 141-147. Paper available at: http://www.ias.ac.in/matersci/bmsapr2009/141.pdf
93 Li SM & Lwin KT (2008): Production of Manganese Zinc Ferrite Cores for Electronic Applications, World Academy ofScience, Engineering and Technology, 2, pp 10-22. Paper available at: http://waset.org/publications/15849/production-of-manganese-zinc-ferrite-cores-for-electronic-applications
94 PR Newswire (2012): Global Market for Magnetic Materials to Reach $33 Billion by 2018; Developing Countries to DriveHigh Performance Alloys; Metal Finishing Chemicals to Reach $8.5 bn, Article available from PR Newswire:http://www.prnewswire.com/news-releases/global-market-for-magnetic-materials-to-reach-33-billion-by-2018-developing-countries-to-drive-high-performance-alloys-metal-finishing-chemicals-to-reach-85-bn-177729081.html
95 Research in China (2011): Global and China Magnetic Materials Industry Report, 2010-2011, Abstract available fromResearch in China: http://www.researchinchina.com/Htmls/Report/2011/6197.html
96 CPM Group. (2011): Electrolytic Manganese Market Outlook, Executive summary available at:http://amydata.com/data/reports/Electrolytic_Manganese_Metal_Outlook_2011_ExecutiveSummary.pdf
97 Sustain Aqua (no date): Water Treatment Processes, Information available from Sustain Aqua: http://www.sustain-aqua.co.za/water.html
98 Wirth M (2013): The Magic of Manganese Dioxide – What it is and Why should you care, Water Conditioning and PurificationMagazine, Article available from Water Conditioning & Purification Magazine:http://www.wcponline.com/pdf/V55N3%20Wirth.pdf
99 Giles G (2010): Advances in Iron and Manganese Treatment Technology for North Carolina using AD26 Oxidation/FiltrationTechnology – Design, Case Studies and Implementation, Report available from NC Safewater:http://www.ncsafewater.org/Pics/Training/AnnualConference/AC10TechnicalPapers/AC10_Water/Water_T.AM_10.30_Giles.pdf
100 Lazur AM & Yanong RPE (2009): The Use of Potassium Permanganate in Fish Ponds, Article available from the Universityof Florida: http://edis.ifas.ufl.edu/fa032
101 MacMillan JR (2009): Potassium Permanganate: What is it and how can we ensure it is safely used in US Aquaculture, Paperavailable from the U.S. Fish and Wildlife Service:http://www.fws.gov/fisheries/aadap/PDF/Potassium%20Permanganate%20White%20Paper%20Final.pdf
102 Athanassopoulou F et al. (2009): An overview of the treatments for parasitic disease in Mediterranean aquaculture, inRogers C (ed.) & Basurco B (ed.): The use of veterinary drugs and vaccines in Mediterranean aquaculture, OptionsMéditerranéennes: Série A. Séminaires Méditerranéens, 86, pp 65-83. Paper available at:http://om.ciheam.org/om/pdf/a86/00801063.pdf
103 Francis-Floyd R (2011): Management of Fish, Information available from The Merck Veterinary Manual:http://www.merckmanuals.com/vet/exotic_and_laboratory_animals/fish/management_of_fish.html
104 Chiltern Koi Club (2005): Parasite Treatments, Information available from Chiltern Koi Club:http://www.chilternkoi.baxx.net/Parasites%20part%202.htm
105 SSPO (2014): Production, Information available from the Scottish Salmon Producers Association:http://www.scottishsalmon.co.uk/facts_figures/production.aspx
106 The Atlantic Salmon Trust (no date): Salmon Farming in Scotland: Economic Success or Ecological Failure? Informationavailable from The Atlantic Salmon Trust: http://www.atlanticsalmontrust.org/policies-and-research/salmon-farming-in-scotland-economic-success-or-ecological-failure.html
107 Brown D & Brooks A (2012): A survey of disease impact and awareness in pond aquaculture in Bangladesh, the Fisheriesand Training Extension Project - Phase II, Technical Paper No. 406, pp 85-93. Paper available from the Food & AgricultureOrganization of the United Nations: http://www.fao.org/docrep/005/y3610e/y3610e10.htm
108 Belton B et al. (2011): Review of Aquaculture and Fish Consumption in Bangladesh, Report available from the WorldFishCenter: http://www.worldfishcenter.org/resource_centre/WF_2970.pdf

52 |
109 Gajigo O et al. (2011): Manganese Industry Analysis: Implications for Project Finance, Report available from the AfricanDevelopment Bank:http://www.afdb.org/fileadmin/uploads/afdb/Documents/Publications/WPS%20No%20132%20Manganese%20Industry%20Analysis%20doc.pdf
110 United Manganese of Kalahari (no date): Manganese - Uses, A New Mine, and the Benefits of High Grade Ore, Presentationavailable from the IMnI: http://www.manganese.org/__data/assets/pdf_file/0003/82848/3._UMK_130909.pdf
111 Agoracom (2013): Manganese Macro Background as it Relates to Cancana, Information available from Agoracom:http://agoracom.com/ir/Cancana/forums/discussion/topics/463795-manganese-macro-background-as-it-relates-to-cancana/messages/1500864
112 Laugharne A (2013): Mn Boom in South Africa – The Logistical Challenge, Presentation given at CRU Ryan’s NotesConference, Amsterdam, June 2013.
113 Chamber of Mines South Africa (2012): Facts About South African Mining, Putting South Africa First: Mining’s Contributionto South Africa, Fact sheet available from AngloGold Ashanti: http://www.anglogold.com/NR/rdonlyres/09C55043-3816-4FA8-9371-E83999855261/0/November2012.pdf
114 Research in China (2013): Global and China Stainless Steel & Products Industry Report, 2012-2015, Summary available fromReportLinker: http://www.reportlinker.com/p01187987-summary/Global-and-China-Stainless-Steel-Products-Industry-Report.html
115 Hatch Consulting (2007): Developments in the World Stainless Steel Industry and the Implications for Nickel Consumption,presented at the 3rd New Caledonia Nickel Conference, 20th March 2007. Presentation available from Hatch Consulting:http://www.hatch.ca/mining_metals/Iron_Steel/Articles/documents/developments_world_stainless_steel_nickel_consumption.pdf
116 Pradesh A (2010): India Ranks 10th in Stainless Steel Production in the World, Article available from India PR Wire:http://www.indiaprwire.com/pressrelease/mining-metals/2010010841035.htm
117 Bamrud J (2012): Mining GDP Contribution Triples in Latin America, Article available from Mining Weekly:http://www.miningweekly.com/article/mining-gdp-contribution-triples-in-latin-america-2012-10-11
118 ICMM (2013): The Mining Sector in Brazil: Building Institutions for Sustainable Development, Report available from theInternational Council on Mining & Metals: http://www.icmm.com/document/5423
119 USGS (2014): Mineral Commodity Summaries 2014, Report available from the USGS:http://minerals.usgs.gov/minerals/pubs/mcs/2014/mcs2014.pdf
120 Australian Bureau of Statistics (2012): Year Book of Australia 2012 – Mining Industry, Report available from the AustralianBureau of Statistics:http://www.abs.gov.au/ausstats/[email protected]/Lookup/by%20Subject/1301.0~2012~Main%20Features~Mining%20Industry~150
121 Business Monitor International (2013): Australia Mining Report, Q3 2013, Report available from the Ministry of ForeignAffairs of the Czech Republic: http://www.mzv.cz/file/1033799/Australia_Mining_Report___Q3_2013.pdf


MANGANESE
The Global Picture - A Socio Economic Assessment
Manganese (Mn) plays a very important role in the
global economy, even if the dependence of various
industry sectors, products and/or applications on
Mn is not always recognised. Mn is a critical raw
material input for the steel industry but also has a
number of other important downstream uses which
make a significant economic and social contribution
to national and regional economies where these
activities take place.
This report presents the results of the first global
study on the socio-economic importance of Mn,
undertaken by Risk & Policy Analysts Ltd (UK) for the
IMnI.
International Manganese Institute (IMnI) is a not-for-profit industry association that
represents manganese ore and alloy producers, manufacturers of metallurgical products or
chemical compounds, trading houses, industry service providers, companies involved in Mn
business development, universities and research organizations around the world. Founded in
1975, with headquarters in Paris, France, IMnI's mission is to provide vision and guidance to
the Mn industry by promoting economic, social and environmental responsibility and
sustainability to all stakeholders.
Risk & Policy Analysts Limited (RPA) is an independent consultancy providing expert advice
to both public and private sector clients around the world. Established in 1990, RPA’s team
of multi-disciplinary experts offer a broad range of high quality services including policy and
project appraisal, regulatory and business impact assessment, environmental policy and
management, flood risk assessment and management, cost and risk-benefit analysis,
environmental economics, socio-economic analysis and hazard and risk studies.
Copyright © 2015 Risk & Policy Analysts Ltd. All Rights Reserved.