Malaysia Brunei - IUJ
79
COUNTRY PROFILE 2001 Malaysia Brunei This Country Profile is a reference tool, which provides analysis of historical political, infrastructural and economic trends. It is revised and updated annually. The EIU’s Country Reports analyse current trends and provide a two-year forecast The full publishing schedule for Country Profiles is now available on our website at http://www.eiu.com/schedule The Economist Intelligence Unit 15 Regent St, London SW1Y 4LR United Kingdom
Transcript of Malaysia Brunei - IUJ
COUNTRY PROFILE 2001
Malaysia
BruneiThis Country Profile is a reference tool, which providesanalysis of historical political, infrastructural and economictrends. It is revised and updated annually. The EIU’s CountryReports analyse current trends and provide a two-yearforecast
The full publishing schedule for Country Profiles is nowavailable on our website at http://www.eiu.com/schedule
The Economist Intelligence Unit15 Regent St, London SW1Y 4LRUnited Kingdom

The Economist Intelligence UnitThe Economist Intelligence Unit is a specialist publisher serving companies establishing and managingoperations across national borders. For over 50 years it has been a source of information on businessdevelopments, economic and political trends, government regulations and corporate practice worldwide.
The EIU delivers its information in four ways: through our digital portfolio, where our latest analysis isupdated daily; through printed subscription products ranging from newsletters to annual referenceworks; through research reports; and by organising seminars and presentations. The firm is a member ofThe Economist Group.
LondonThe Economist Intelligence Unit15 Regent StLondonSW1Y 4LRUnited KingdomTel: (44.20) 7830 1007Fax: (44.20) 7830 1023E-mail: [email protected]
New YorkThe Economist Intelligence UnitThe Economist Building111 West 57th StreetNew YorkNY 10019, USTel: (1.212) 554 0600Fax: (1.212) 586 0248E-mail: [email protected]
Hong KongThe Economist Intelligence Unit60/F, Central Plaza18 Harbour RoadWanchaiHong KongTel: (852) 2585 3888Fax: (852) 2802 7638E-mail: [email protected]
Website: www.eiu.com
Electronic deliveryThis publication can be viewed by subscribing online at www.store.eiu.com
Reports are also available in various other electronic formats, such as CD-ROM, Lotus Notes, on-linedatabases and as direct feeds to corporate intranets. For further information, please contact your nearestEconomist Intelligence Unit office
Copyright© 2001 The Economist Intelligence Unit Limited. All rights reserved. Neither this publication norany part of it may be reproduced, stored in a retrieval system, or transmitted in any form or by anymeans, electronic, mechanical, photocopying, recording or otherwise, without the prior permissionof The Economist Intelligence Unit Limited.
All information in this report is verified to the best of the author’s and the publisher’s ability. However,the EIU does not accept responsibility for any loss arising from reliance on it.
ISSN 0269-5588
Symbols for tables“n/a” means not available; “–” means not applicable
Printed and distributed by Patersons Dartford, Questor Trade Park, 151 Avery Way, Dartford, Kent DA1 1JS, UK.


EIU Country Profile 2001 © The Economist Intelligence Unit Limited 2001
Comparative economic indicators, 2000

1
EIU Country Profile 2001 © The Economist Intelligence Unit Limited 2001
Contents
Malaysia
4 Basic data
5 Political background5 Historical background9 Constitution, institutions and administration
10 Political forces11 International relations and defence
14 Resources and infrastructure14 Population15 Education15 Health16 Natural resources and the environment17 Transport, communications and the Internet18 Energy provision
19 The economy19 Economic structure20 Economic policy24 Economic performance26 Regional trends
27 Economic sectors27 Agriculture, forestry and fisheries28 Mining and semi-processing29 Manufacturing30 Construction30 Financial services32 Other services
32 The external sector32 Trade in goods34 Invisibles and the current account35 Capital flows and foreign debt36 Foreign reserves and the exchange rate
38 Appendices38 Regional organisation39 Sources of information41 Reference tables41 Population41 Labour force42 Transport statistics42 Energy production42 Government finances43 Money supply43 Interest rates43 Gross domestic product

2
EIU Country Profile 2001 © The Economist Intelligence Unit Limited 2001
44 Gross domestic product by expenditure44 Gross domestic product by sector45 Consumer price index45 Agricultural and forestry production45 Minerals production46 Manufacturing production46 Construction statistics46 Stockmarket indicators47 Exports47 Imports48 Main traditional exports48 Imports by category48 Main trading partners49 Balance of payments, IMF series50 Balance of payments, national series50 External debt, World Bank series51 Official development assistance51 Foreign reserves51 Exchange rates52 Banking statistics
Brunei
53 Basic data
54 Political background54 Historical background54 Constitution, institutions and administration55 Political forces57 International relations and defence
58 Resources and infrastructure58 Population59 Education and health59 Natural resources and the environment60 Transport, communications and the Internet61 Energy provision
61 The economy61 Economic structure62 Economic policy63 Economic performance
64 Economic sectors64 Agriculture, forestry and fishing64 Mining and semi-processing65 Manufacturing65 Construction65 Financial services66 Other services
66 The external sector66 Trade in goods67 Invisibles and the current account

3
© The Economist Intelligence Unit Limited 2001 EIU Country Profile 2001
67 Capital flows and foreign debt67 Foreign reserves and the exchange rate
69 Appendices69 Sources of information70 Reference tables70 Population70 Labour force, 199170 Transport and telecommunications71 National energy statistics71 Government finances71 Money supply72 Gross domestic product72 Gross domestic product by sector73 Consumer prices73 Agricultural production73 Forestry production73 Oil and natural gas production and prices73 Balance of trade74 Main exports74 Main imports74 Main trading partners75 Balance of payments, national series75 Exchange rates75 International reserves

4 Malaysia
EIU Country Profile 2001 © The Economist Intelligence Unit Limited 2001
Malaysia
Basic data
330,113 sq km
23.8m (mid-2001 estimate)
Population in ‘000 (2000)
Kuala Lumpur (capital) 1,298Kelang 649Ipoh 566Petaling Jaya 438Johor Baharu 385
Tropical
Hottest months, April and May, 23-33°C (average daily minimum andmaximum); coldest month, December, 22-32°C; driest month, July, 99 mmaverage rainfall; wettest month, April, 292 mm average rainfall
Malay, Chinese, English, Tamil, Itan Dusan, Bajau and others
Metric system with gradual conversion from UK (imperial) system. Localmeasures include:
1 pikul=25 gantang=60.48 kg1 koyan=40 pikul=2.419 tonnes
Malaysian dollar or ringgit (M$, or RM)=100 sen (cents). Average exchangerates in 2000: M$3.8:US$1 (pegged at that rate on September 2nd 1998);M$5.76:£1. Exchange rates on September 6th 2001: M$3.8:US$1; M$5.52:£1
Peninsula: 7 hours ahead of GMT; Sabah and Sarawak: 8 hours ahead of GMT
January 24th-26th (Chinese New Year); March 6th (Hari Raya Haji); March26th (Islamic New Year); May 1st (Labour Day), 7th (Vesak Day); June 2nd(King’s birthday), 4th (Prophet Mohammed’s birthday); August 31st (NationalDay); November 14th (Deepavali); December 16th-18th (Hari Raya Puasa, endof Ramadan), 25th (Christmas Day)
Total area
Population
Main towns
Climate
Weather in Kuala Lumpur(altitude 39 metres)
Languages
Measures
Currency
Time
Public holidays (2001)
Malaysia 5
© The Economist Intelligence Unit Limited 2001 EIU Country Profile 2001
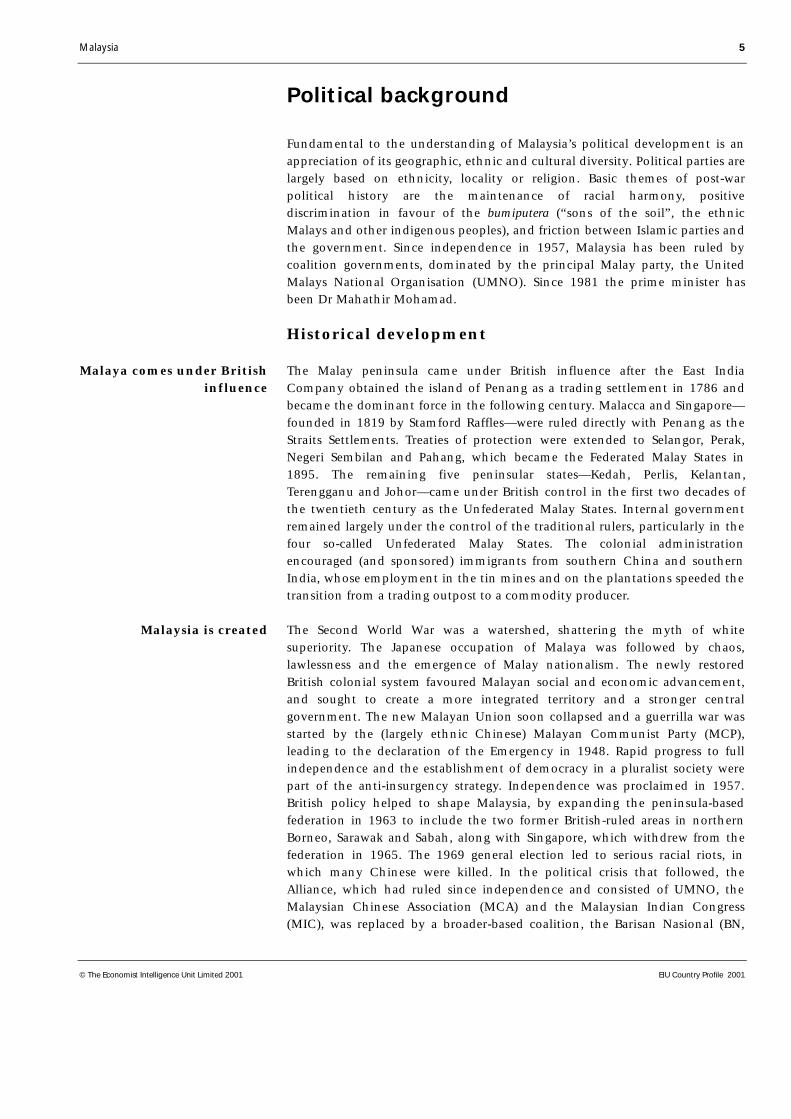
Political background
Fundamental to the understanding of Malaysia’s political development is anappreciation of its geographic, ethnic and cultural diversity. Political parties arelargely based on ethnicity, locality or religion. Basic themes of post-warpolitical history are the maintenance of racial harmony, positivediscrimination in favour of the bumiputera (“sons of the soil”, the ethnicMalays and other indigenous peoples), and friction between Islamic parties andthe government. Since independence in 1957, Malaysia has been ruled bycoalition governments, dominated by the principal Malay party, the UnitedMalays National Organisation (UMNO). Since 1981 the prime minister hasbeen Dr Mahathir Mohamad.
Historical development
The Malay peninsula came under British influence after the East IndiaCompany obtained the island of Penang as a trading settlement in 1786 andbecame the dominant force in the following century. Malacca and Singapore—founded in 1819 by Stamford Raffles—were ruled directly with Penang as theStraits Settlements. Treaties of protection were extended to Selangor, Perak,Negeri Sembilan and Pahang, which became the Federated Malay States in1895. The remaining five peninsular states—Kedah, Perlis, Kelantan,Terengganu and Johor—came under British control in the first two decades ofthe twentieth century as the Unfederated Malay States. Internal governmentremained largely under the control of the traditional rulers, particularly in thefour so-called Unfederated Malay States. The colonial administrationencouraged (and sponsored) immigrants from southern China and southernIndia, whose employment in the tin mines and on the plantations speeded thetransition from a trading outpost to a commodity producer.
The Second World War was a watershed, shattering the myth of whitesuperiority. The Japanese occupation of Malaya was followed by chaos,lawlessness and the emergence of Malay nationalism. The newly restoredBritish colonial system favoured Malayan social and economic advancement,and sought to create a more integrated territory and a stronger centralgovernment. The new Malayan Union soon collapsed and a guerrilla war wasstarted by the (largely ethnic Chinese) Malayan Communist Party (MCP),leading to the declaration of the Emergency in 1948. Rapid progress to fullindependence and the establishment of democracy in a pluralist society werepart of the anti-insurgency strategy. Independence was proclaimed in 1957.British policy helped to shape Malaysia, by expanding the peninsula-basedfederation in 1963 to include the two former British-ruled areas in northernBorneo, Sarawak and Sabah, along with Singapore, which withdrew from thefederation in 1965. The 1969 general election led to serious racial riots, inwhich many Chinese were killed. In the political crisis that followed, theAlliance, which had ruled since independence and consisted of UMNO, theMalaysian Chinese Association (MCA) and the Malaysian Indian Congress(MIC), was replaced by a broader-based coalition, the Barisan Nasional (BN,
Malaya comes under Britishinfluence
Malaysia is created
6 Malaysia
EIU Country Profile 2001 © The Economist Intelligence Unit Limited 2001
National Front). With minor changes in its composition, the BN has ruledMalaysia ever since.
The bumiputera account for 63% of the population, and have dominated thepolitical system since independence. The electoral system makes support in theMalay-dominated rural areas crucial for political success at the national level.In Sabah and Sarawak indigenous minorities retain similar traditional politicallinks. At the 1999 general election, UMNO lost a substantial part of the Malayvote, resulting in an even split between UMNO on the one hand and theopposition parties Parti Islam sa-Malaysia (PAS) and Parti Keadilan Nasional(PKN) on the other.
The ethnic Chinese, who constitute 24% of the population, enjoy greatereconomic power than the Malays, are largely urbanised, and form a higherproportion of the population in Malaysia than in other South-east Asiancountries (apart from the special case of Singapore). Chinese voters havetended to divide along class lines familiar in industrialised countries, somesupporting Chinese right-of-centre parties in the government coalition, such asthe MCA, and others left-of-centre opposition parties, such as the DemocraticAction Party (DAP). At the 1999 general election, the continued allegiance of amajority of the Chinese electorate helped to keep the BN in power with a two-thirds majority.
Indians, who make up 7% of the population, mostly vote along ethnic lines,expressed through the MIC, a member of the BN.
After the 1969 riots, the BN government instituted the 20-year New EconomicPolicy (NEP), a programme of positive discrimination aimed at reducinginterracial tensions by improving the incomes and economic power of thebumiputera. The National Development Policy (NDP), which followed the NEPafter 1990, relaxed some of the positive discrimination measures that favourthe bumiputera. An extended period of strong economic growth—at least until1998—made it possible to raise the status of the bumiputera withouttransferring wealth from the ethnic Chinese, thereby avoiding seriousintercommunal conflict.
The BN has capitalised on the considerable advantages of incumbency tomaintain its dominance of the political landscape. Ostensibly in the interestsof public order, it has tended to keep formal election campaigns short,discouraged rallies and threatened to use sweeping powers of detention againstopponents. It won two-thirds of the votes cast and 162 of the 192 seats in thelower chamber, the Dewan Rakyat, in the 1995 general election. Federal andstate parliamentary elections held on November 29th 1999 saw the BN’s shareof the overall vote fall to 56.4%, from 65.9% in 1995, although it retained atwo-thirds majority in the national assembly.
Ethnicity and politicalparties
The New Economic Policy
Incumbency benefitsthe BN

Malaysia 7
© The Economist Intelligence Unit Limited 2001 EIU Country Profile 2001
Recent election results(no. of seats)
1990 1995 1999
Barisan Nasional (BN) 127 162 148 United Malays National Organisation (UMNO) 71 88 72 Malaysian Chinese Association (MCA) 18 30 28 Parti Pesaka Bumiputera Bersatu (PPBB) 10 13 10 Malaysian Indian Congress (MIC) 6 6 7 Gerakan Rakyat Malaysia 5 7 7 Sarawak United People’s Party (SUPP) 4 6 7 Parti Bangsa Dayak Sarawak (PBDS) 4 4 6 Sarawak National Party (SNAP) 3 4 4 United Sabah National Org (USNO) 6 4 3 Sabah Progressive Party (SPP) 0 0 2 Liberal Democrat Party (LDP) 0 0 1 BN Direct 0 0 1
Barisan Alternatif (BA, Alternative Front)a – – 42 Parti Islam sa-Malaysia (PAS) 7 7 27 Democratic Action Party (DAP) 20 9 10 Parti Keadilan Nasional (PKN) – – 5
Parti Bersatu Sabah (PBS) 14 8 3
Parti Melayu Semangat ‘46 (S46)b 8 6 –
Others 4 0 0
Total 180 192 193
a The 1999 election was the first that the BA contested as a coalition. b Part of UMNO in 1986,broke away in 1987, returned in 1996.
Source: Election Commission.
The major reason for the BN losses in the 1999 elections was a split in theethnic Malay vote. The 1997-98 Asian economic crisis had exposed corruptionwithin UMNO and raised a desire for reform and a change of leadership,especially among younger UMNO politicians. The deputy prime minister,Anwar Ibrahim, who became the focal point of the reformasi movement, wasdismissed from the government in September 1998, expelled from UMNO, andcharged with obstruction of justice and sodomy; on the first count, Mr Anwarwas sentenced to six years in jail. The dubious treatment of Dr Mahathir’s long-standing heir apparent, his severe beating in police custody and his contro-versial trial unleashed a vigorous campaign for political reform that revitalisedthe opposition. UMNO’s share of the vote declined in the 1999 election from39.4% to 31.8%, while its representation in the lower house dropped to 72from what had in effect been 94 seats (including the six seats held by PartyMelayu Semangat ’46, which rejoined UMNO in 1996). The main beneficiarywas the Malay-based opposition party, PAS. It took 27 seats in the lower house,up from seven, wrested control of the Terengganu state parliament whileretaining neighbouring Kelantan, and made strong inroads in other northernMalay-belt states, including Dr Mahathir’s native Kedah.
Divisions within the Malay community are potentially seriously destabilising,with negative implications for race relations and the economic outlook. Thedivisions frequently focus on Dr Mahathir’s personality, his intransigence
The campaign forpolitical reform
Doubtful political stability

8 Malaysia
EIU Country Profile 2001 © The Economist Intelligence Unit Limited 2001
and reluctance to give up the position of prime minister; in theory, at least,the transition is secure—the deputy prime minister, Abdullah Badawi, isDr Mahathir’s anointed successor. A smooth succession could possibly befollowed by a continuation of the status quo, with only minor reforms.However, the real divisions go deeper and relate to conflicts, left unresolvedsince the formation of Malaysia, about the nature and inclusiveness ofMalaysian society. Dr Mahathir has tightly controlled political life, especiallyin recent years; his departure could destabilise UMNO’s system of politicalcontrol and open up fundamental social and political conflicts. Furtherdestabilising influences could come from a deteriorating economy, reducingUMNO’s ability to offer patronage, and from a more assertive judiciary,preventing the government from asserting control. The opposition alliance,the Barisan Alternatif (BA, Alternative Front), is divided, being dominated byPAS, with its two main partners, the DAP and the PKN objecting to thesocially divisive intention of PAS to found an Islamic state, should the BAwin the next general election.
Important recent events
May 1997: Dr Mahathir appoints Mr Anwar as acting prime minister andacting president of the United Malays National Organisation (UMNO) duringhis absence. Mr Anwar’s brief stewardship is distinguished by a campaignagainst official corruption, which is unprecedented in its severity.
September 1997: Dr Mahathir dismisses as “ridiculous” allegations of sexualmisconduct made against Mr Anwar. The deputy prime minister characterisesthe accusations as a “declaration of war” by unnamed UMNO membersworried by his anti-corruption drive.
June 1998: Dr Mahathir uses UMNO’s annual general assembly to quashmounting criticism of his leadership by Anwar loyalists, revealing that some ofthem have benefited from official largesse. Mr Anwar is made all but redundantas finance minister by the recall of Daim Zainuddin as special functionsminister in charge of “economic development”.
September 1998: Mr Anwar is sacked from the government and expelledfrom UMNO. After leading a series of anti-Mahathir rallies he is arrested,beaten in custody and indicted on charges of obstructing justice andof sodomy.
April 1999: Following a five-month trial, Mr Anwar is controversiallyconvicted of obstruction of justice and sentenced to six years in jail, triggeringdemonstrations by his supporters and criticism by foreign governments.
November 1999: The ruling BN coalition wins the general election,controlling more than two-thirds of the seats in the national parliament, butnonetheless has a reduced mandate. The BN loses a second state assembly—Terengganu—to the opposition Parti Islam sa-Malaysia.
November 2000: The ruling coalition suffers a humiliating defeat in a by-election in the Lunas constituency in Dr Mahathir’s native Kedah state, a seatthat the BN had held since independence.

Malaysia 9
© The Economist Intelligence Unit Limited 2001 EIU Country Profile 2001
January 2001: A new chief justice, Dzaiddin Abdullah, is appointed with areputation for independence and incorruptibility. Mr Dzaiddin’s agenda is toclean up the image of the judiciary, tarnished by compliance with thegovernment. After Mr Dzaiddin’s appointment, the judiciary increasinglyrefuses to bow to the authorities.
June 2001: Daim Zainuddin, finance minister and confidant of Dr Mahathir,resigns, as the prime minister embarks on a campaign against corruption inUMNO and cronyism, in order to revive the party’s fortunes. Mr Daim was themastermind behind Malaysia’s recovery after the 1997 Asian financial crisisand was responsible for the bailing out of politically well connected businesses.
July 2001: Mr Anwar launches an appeal against his sentence for sodomy. Theappointment of Mr Dzaiddin as the new chief justice has increased his chancesof a successful appeal.
Constitution, institutions and administration
Malaysia is a federal, constitutional monarchy within the Commonwealth. Theposition of king (yang di-pertuan agong, meaning “supreme ruler”) is rotatedevery five years. The nine-strong Conference of Rulers of the states of thepeninsula, excluding Malacca and Penang (the sultans of Kedah, Perak, Johor,Selangor, Pahang, Terengganu and Kelantan; the yang di-pertuan besar, orsupreme minister, of Negeri Sembilan; and the raja of Perlis) elects one of itsnumber to serve as king.
The powers granted to the traditional rulers on independence have beenmodified. Rulers and their families have in the past been accused by UMNOparty members of abusing their power for private gain and exceeding theirconstitutional authority. In 1992 UMNO drew up a code of conduct forrulers. After some alterations, a compromise was eventually reached inFebruary 1993, and constitutional amendments were passed that limitedrulers’ personal legal immunity.
The federal parliament consists of an upper chamber, the Senate or DewanNegara (Council of the Nation), of 68 members, of whom 42 members areappointed by the king and 13 pairs are elected by the state legislatures, and alower chamber, the House of Representatives or Dewan Rakyat (Council of thePeople), directly elected by universal suffrage. The number of seats in theDewan Rakyat was increased from 180 to 192 before the 1995 general election,and to 193 in 1999. The lower house has long been a rubber stamp for the BN,with little real debate on draft legislation or issues taking place there.
Each of the 13 states has an Executive Council dealing with non-federalmatters under a menteri besar (chief minister) who is answerable to elected stateassemblies. The constitutional head of each state government is either one ofthe traditional rulers or (in Penang, Malacca, Sabah and Sarawak) a stategovernor appointed by the king, on the advice of the federal government.
A federal constitutionalmonarchy
The federal parliament
The states’ ExecutiveCouncils

10 Malaysia
EIU Country Profile 2001 © The Economist Intelligence Unit Limited 2001
The Malaysian judicial system still resembles the UK system inherited from thecolonial period. As with the traditional rulers, the government has establisheda code of conduct for judges, the breaching of which may result in dismissal.Important changes have taken place in recent years, including the abolition ofthe jury system in 1995, tending to increase the power of the executive andreduce the scope for independent action by the judiciary. The appointment inJanuary 2001 of a new chief justice, Dzaiddin Abdullah, has lifted expectationsthat the judiciary will reassert its independence.
Political forces
UMNO, the party of Malay nationalists in the colonial period, remains themost important of the Malay parties, although it has lost support, attractingonly just over half of the total Malay vote in the 1999 election. The presidentof UMNO invariably serves as the prime minister. Elections to leading partyposts and to the UMNO supreme council determine the leadership successionand can also affect the posts occupied by ministers in the cabinet. Anincumbent leader is rarely challenged, but Dr Mahathir was almost defeated inthe internal UMNO elections of April 1987.
PAS thrives as a haven for Malay protest votes. But the party has yet to clarifythe role of Islam in its manifesto if it intends to present itself—and the BA—asa viable alternative for those voters dissatisfied with UMNO but suspicious ofplans to transform Malaysia into a theocracy. It is unlikely that PAS could wrestpower from UMNO with an austere Islamist agenda.
At the time of independence, the MCA was the acknowledged politicalrepresentative of the ethnic Chinese. It quickly became an apologist for thegovernment coalition in which it served, and was identified with the richerChinese and business interests. It is the second largest party in the BN afterUMNO but its leadership succession is proving a divisive issue. The party’s nextleader will be decided in the next triennial party elections, due in mid-2002.Gerakan Rakyat, founded as a left-of-centre multiracial party, and the DAP, alsoa multiracial party but further to the left, both mainly attract ethnic Chinesevoters (although the DAP also has prominent Indian and Malay members).
One of the features of political activity in the past was the open and directparticipation by coalition parties in entrepreneurial activities and companyownership as a means of obtaining party funds. UMNO, the biggest party(open since 1992 to other bumiputera besides Malays, and with a totalmembership of more than 2m), had the biggest portfolio of businesses. Theseactivities were criticised for putting temptation in the way of bothbusinessmen and politicians. They were officially wound down, but the shareswere transferred to “safe hands”—in practice, groups or individuals with closelinks to influential party members. UMNO’s major business interest is theconglomerate, Renong, which was taken back into government ownership inJuly 2001 after it failed to solve its debt problems. The MCA was also engagedin business activities grouped under a holding company, Multi-Purpose
Changes to the judicialsystem
UMNO is the dominantMalay party
UMNO’s corporate links
Chinese and multiracialparties
PAS tackles its Islamistagenda

Malaysia 11
© The Economist Intelligence Unit Limited 2001 EIU Country Profile 2001
Holdings (MPH). It has been less successful than UMNO in retaining influenceover management after disposing of its shares in these companies.
Key political figures
Mahathir Mohamad: Prime minister and president of the United MalaysNational Organisation (UMNO). In July 2001 he became Asia’s longest-servingelected ruler when he celebrated 20 years in office. He is the architect of boththe economic advance of the Malay community and the rapid industrialgrowth of Malaysia. His popularity has been in decline since the 1997 Asianeconomic crisis, a trend that accelerated with the ouster in September 1998 ofAnwar Ibrahim, his deputy in the party and government, and the campaign forchange that it triggered. He was returned unopposed in May 2000 for anotherthree-year term as UMNO president. Dr Mahathir has said that he will notstand for parliament in the next general election, due by 2004, but shows nosign of yielding power before then.
Abdullah Ahmad Badawi: Deputy president of UMNO and deputy primeminister. He is one of Dr Mahathir’s most trusted aides and first in line tosucceed him. He is an affable but unassuming personality, and many stillquestion his ability to unite the BN if he does assume power.
Anwar Ibrahim: Dr Mahathir’s former deputy in UMNO and former deputyprime minister. He is appealing against his controversial 15-year sentence forabuse of power and sodomy. His detention has inspired the reformistmovements prepared openly to question Dr Mahathir’s dominance of theestablished order. It is possible that the Federal Court will overturn hisconviction, thereby paving the way for a comeback to the political arena.
Najib Tun Razak: UMNO’s senior vice-president, defence minister and sonof a former prime minister, Tun Razak. He is popular, has a reputation forputting the party’s interests before his own interests and holds a strong thirdplace in the UMNO hierarchy. He also has ambitions to succeed Dr Mahathir.
Abdul Hadi Awang: The chief minister of the hydrocarbon-rich north-eastern peninsular state of Terengganu which fell to the opposition PartiIslam sa-Malaysia in the November 1999 poll. Mr Awang leads the effortsof PAS to broaden its appeal to non-Muslims and will remain atloggerheads with UMNO.
Dzaiddin Abdullah: Malaysia’s new chief justice. He is at the forefront ofefforts to clean up the image of the judiciary, tarnished by frequentallegations of corruption and political interference. Since Mr Dzaiddin’sappointment in December 2000, the judiciary has increasingly refused tobow to the authorities.
International relations and defence
Malaysia has always been active in a number of international bodies, andunder Dr Mahathir the country has adopted highly vocal positions on anumber of international questions. Dr Mahathir has also been noted for hisrefusal to heed criticism of his government’s human-rights record and for his
Dr Mahathir’s world view

12 Malaysia
EIU Country Profile 2001 © The Economist Intelligence Unit Limited 2001
readiness to disparage press freedom and the more open democratic practicesof the US and Europe. On the economic front, Dr Mahathir has characterisedmany international initiatives on trade union rights and on environmentalprotection as measures devised by the rich, developed countries to obstruct thedevelopment of newly industrialising countries.
Dr Mahathir continues to attack foreigners for allegedly trying to topple hisgovernment and wages war against foreign multinationals for preying on weakMalaysian firms. He blamed the Asian financial crisis, triggered in mid-1997 bythe large-scale sell-off of regional currencies and stocks, on Western“speculators”, and launched an outspoken campaign for the establishment ofsome degree of international supervision of short-term capital flows. Hecriticised the austerity-based remedies advocated by the InternationalMonetary Fund (IMF), an organisation that he dismissed as little more than anexecutor of policies framed by the US government, of which he is alsoincreasingly critical. Malaysia has called for the creation of a regional monetaryfund for Asia. In April 2001 “ASEAN+3”, the ten countries of the Association ofSouth-East Asian Nations (ASEAN) and Japan, China and South Korea, agreedto set up a network of currency swap arrangements that link the disbursementof short-term liquidity to IMF conditions. Malaysia is proposing to develop thiscurrency swap scheme further and strengthen financial co-operation amongAsian countries.
Relations with neighbouring Singapore remain sensitive, and Malaysia isconcerned about the situation in Indonesia, a major source of illegalimmigration and air pollution from forest fires. It has border disagreementswith Indonesia and the Philippines, and it is resisting China’s claims in theSouth China Sea. Malaysia was a founder-member of ASEAN and also amember of the broader but more loose-knit Asia-Pacific EconomicCo-operation (APEC) forum. In 1991 Dr Mahathir proposed setting up anotherregional body, the East Asian Economic Group, later renamed the East AsianEconomic Caucus (EAEC), to strengthen the negotiating power of Asianeconomies vis-à-vis such blocs as the EU and the North American Free-TradeAgreement (NAFTA). The government remains wary of the potentially negativeimpact on local businesses of global and regional trade pacts. In May 2000 thegovernment controversially succeeded in persuading its ASEAN counterparts toallow Malaysia to defer until 2005 the scheduled reduction in duties on motorvehicles produced elsewhere in the ASEAN area. This move could harm theplanned creation of an ASEAN Free-Trade Area (AFTA) by 2003.
The government has allocated M$10.7bn (US$2.8bn) to the Ministry ofDefence under the Eighth Malaysia Plan, which runs to end-2005. Under a15-year strategic plan, Malaysia’s armed forces, which at present mainly servein an anti-insurgency capacity, will develop a full capability to deter externalthreats. Malaysia has bilateral defence and military training agreements withthe UK, Australia and New Zealand, but remains a member of the Non-aligned Movement.
ASEAN, APEC and theproposed EAEC
Defence spending remainshigh
Malaysia 13
© The Economist Intelligence Unit Limited 2001 EIU Country Profile 2001
Security risk in Malaysia
The security risk to foreign companies operating in Malaysia is low but hasincreased over the past twelve months. It finds its origin in the widespreadfrustration with the government, which has blocked most traditional means ofprotest through censorship, libel suits, tight controls on demonstrations and—until recently—an unquestioned control of the judiciary. The governmentcontinues to wield the draconian Internal Security Act (ISA), which allows forindefinite detention without trial. The opposition’s frustration is made worseby the seemingly endless duration of the reign of the 76-year-old Dr Mahathir,who in July 2001 celebrated his twentieth year in office, and shows no sign ofwanting to retire.
Social unrest: The major risk to business comes from the return of economicand political conditions which are conducive to the outbreak of racial violence.Tensions persist below the surface between the majority Malays on the onehand and the minority ethnic Chinese and Indian populations on the other. Inthe most serious post-war racial conflict in 1969, divisions within the Malaymajority led to the scapegoating of the ethnic Chinese, hundreds of whomwere killed in riots. The Malay majority is once again split, but this time theeconomy is also turning down, which could cause many Malays to lose theirjobs. Racial tensions are not just below the surface. In a never explainedincident early in 2001 a number of ethnic Indians were killed during a riot inKuala Lumpur. However, given the tight controls by the government, the near-term risk of large-scale racial violence appears quite low.
There is no immediate risk of a return of the large-scale demonstrationsagainst the government and the ruling United Malays National Organisationthat last took place in 1998, when the deposed deputy prime minister, AnwarIbrahim, led reformasi (“reform”) demonstrations. However, unrest is likely torise should Mr Anwar be successful in one or more of his several appealsagainst his convictions.
There is widespread awareness within Malaysia that it is heavily dependent onforeign direct investment. The opposition is unlikely specifically to targetforeign businesses.
Armed conflict: The risk of armed conflict affecting business is low. Reportsof—apparently large, Islamic-based—violence have increased over the pasttwelve months but it is unclear to what extent the incidents have been stagedby the government, in an attempt to compromise the main opposition party,PAS, by associating it with Islamic extremism. However, there are no “no-go”areas in Malaysia and the government remains clearly very much in control ofthe country.
Organised crime: Malaysia is, in general, a safe country. Violent crime,kidnapping and extortion are rare and organised crime is seldom a threat toforeign business. Foreigners are, however, often the target of pickpocketing,burglaries, car break-ins and purse-snatching.

14 Malaysia
EIU Country Profile 2001 © The Economist Intelligence Unit Limited 2001
Resources and infrastructure
Population
The Malaysian population is estimated to have reached 23.8m by mid-2001.The Eighth Malaysia Plan projects an annual average increase of 2.3% in2001-05; in 1996-2000 the annual average rate of growth was 2.4%. Around80% of the population lives in peninsular Malaysia. The rate of growth hasbeen the fastest in Malaysia’s more developed states, at 2.8% during1996-2000. The dependency ratio (those under the age of 15 and over the ageof 64 divided by the rest of the population) is expected to continue to decline,from 59.1% in 2000 to 55.3% in 2005, as the median age rises from 23.9 yearsto 25.3 years.
The average population density, at 70.6 persons per sq km in 2000, is relativelylow. However, there are wide disparities between the peninsula and the sparselypopulated Borneo states. The proportion of the population living in urbanareas stood at 61.8% in 2000, up from 55.1% in 1995. (Reference table 1provides historical data on population.)
Population, 2001(mid-year estimates)
‘000 %
Total 23,795 100.0Malaysian 22,529 94.7 Bumiputera 14,886 62.6 Malay 12,341 51.9 Other bumiputera 2,545 10.7 Chinese 5,720 24.0 Indian 1,671 7.0 Others 252 1.1Non-Malaysian 1,266 5.3
Age structure0-14 7,881 33.115-64 14,956 62.965+ 958 4.0Median age (years) 23.9 –
Source: Department of Statistics, Monthly Bulletin of Statistics.
Rates of population growth vary considerably between the main ethnic groups,probably owing to differences in geographical location, income levels andtraditions. In 1996-2000 the annual average rates of growth of the bumiputera(“sons of the soil”, ethnic Malays and other indigenous peoples), Chinese andIndian communities were 3.2%, 1.4% and 1.8%, respectively. The Chinese,long urbanised and enjoying higher average incomes, now have smallerfamilies; the Malay urban population is growing, but most families remain inrural areas.
Mean monthly gross household income increased from M$2,020 (US$532 atthe current pegged exchange rate of M$3.8:US$1) in 1995 to M$2,472 in 1999,
Growth rates vary betweenthe main ethnic groups
Fairly rapid populationgrowth

Malaysia 15
© The Economist Intelligence Unit Limited 2001 EIU Country Profile 2001
an average growth rate of 5.2% annually, according to official data. Theproportion of lower-income households, defined as those earnings betweenM$1,500 and M$3,000, increased from 32.3% in 1995 to 37% in 1999. Growthrates varied by ethnic group. The mean monthly income of Malay householdsexpanded by 5.5% annually to M$1,984, that of Chinese households by 4.6% ayear to M$3,456, and that of Indian households by 6.3% a year to M$2,702.The mean monthly income of urban households rose by 4.6% annually toM$3,103 in 1999, and that of rural households by 6.7% to M$1,718.
Slowing death and birth rates presage an increase in the proportion of thepopulation aged over 65 and a decline in the under-14 age group, as well as arise in the median age, accompanied by further urbanisation.
Education
The government places great emphasis on raising the general level ofeducational achievement. It provides universal education up to secondarylevel, and there is, in addition, a large number of private-sector schools andcolleges. The provision of state tertiary educational institutions has steadilyexpanded. Sending pupils abroad for study, a long tradition on the part of bothfamilies and the government, intensified during the boom years. The switch tothe use of Malay as the medium of instruction in all state secondary schoolsencouraged the trend. State assistance mostly takes the form of soft loans,repayable when students graduate and take paid employment. Under the termsof the New Economic Policy (NEP), almost all government assistance wasdirected towards the children of bumiputera. Owing to the recent economiccrisis, many of those studying overseas were brought home, increasing thepressure on local educational institutions. Tamil and Mandarin Chinesecontinue to be the languages of instruction in some primary schools. Thegovernment, disappointed with the failure of bumiputera students to qualify foruniversity places, announced in August 2001 that university entrance would bebased on merit henceforth.
Health
The public health system, with its emphasis on community-based care, haslong been internationally recognised as a model provider of quality services atlittle or no cost to consumers. As a result, Malaysia’s basic indicators comparefavourably with most other Asian countries. But there are geographicalvariations: health indicators for Sabah, Sarawak and some predominantly ruralstates on the Malayan peninsula are well below average.
Already low by regional standards, government spending on the health sectorfell from 3% of GDP in 1990 to 2.4% in 1998, reflecting the authorities’ desiregradually to reduce their role as a provider. But the Eighth Malaysia Plan,which covers 2001-05, has targeted government spending on heath atM$5.5bn (US$1.4bn), or 5% of the social sector development budget,representing a 47.3% increase over the M$3.7bn allocated in the SeventhMalaysia Plan.
A model system, albeit withregional disparities
Education given highpriority

16 Malaysia
EIU Country Profile 2001 © The Economist Intelligence Unit Limited 2001
While the Seventh Malaysia Plan (1996-2000) focused on an expansionarydevelopment programme that saw a strong increase in the numbers of newprivate hospitals and clinics, the Eighth Malaysia Plan aims for an overallimprovement in the quality of public health services with greater emphasis onthe use of information technology, improvements in the quality of healthpersonnel and upgrading rural facilities. A total of M$715m (US$188m) hasbeen allocated for rural and environmental health.
Natural resources and the environment
In the colonial period economic development was dominated by tin miningand the cultivation of natural rubber. Depletion of the richest, lowest-cost tindeposits, rising labour costs and a period of low tin prices combined to reducelocal production and end Malaysia’s dominant position as the world’s largestproducer of tin concentrates. However, it is still one of the world’s maincentres of tin refining, although it must supplement declining domestic mineoutput with imported concentrates.
Petroleum and natural gas are now more important mineral products. Both oiland natural gas are extracted from two main areas in the South China Sea, offTerengganu and off Sabah.
Malaysia is no longer the world’s biggest producer of natural rubber, itsdeclining output having been overtaken in 1993 by rising production inThailand and Indonesia. Plantation companies have for many years beenswitching to the more profitable cultivation of oil palm. Malaysia is the world’slargest producer of palm oil.
Malaysia remains the world’s leading producer of tropical sawlogs. For someyears its pre-eminence resulted partly from the flouting of controls on tree-felling by loggers. These controls are now being imposed more strictly andoutput has fallen. Bans on log exports were originally imposed as much toencourage more downstream processing as to preserve the Malaysianrainforest. Controls are now linked to replanting.
It has been the aim of successive Malaysian governments to raise earnings fromall primary products by increasing the degree of domestic processing. Thecountry now has large commodity-based industries: demand from rubbergoods manufacturers has reached the point where rubber must be imported,because falling domestic output is fully committed to trading contracts.
Minerals
Rubber and palm oil
Timber
Domestic processing
Malaysia 17
© The Economist Intelligence Unit Limited 2001 EIU Country Profile 2001
Transport, communications and the Internet
Malaysia’s physical infrastructure compares favourably with that of most othercountries in the region, having benefited from substantial investment—bothprivate and public—during the boom years. Between 1995 and 2000, the totalroad network increased from 61,380km to 65,880km. A slowdown in privateinvestment owing to the financial crisis was offset to some extent by increasedgovernment spending on roads in 1999 and 2000.
Malaysia has made considerable progress in the creation of a more integrated,efficient and reliable urban transport system, although the 1997-98 economicdownturn caused several rail projects to run into financial difficulties.
Rapid economic growth stimulated air traffic and led to the construction ofKuala Lumpur International Airport (KLIA), which opened in June 1998. TheM$9bn new airport, largely completed before the economic crisis struck, canhandle 25m passengers a year. But its distance from Kuala Lumpur as well as afall off in business and a reduction in the number of international carrierslanding at KLIA, have left it heavily underused.
More than 90% of Malaysia’s international trade is conducted throughseaports, which handled 220.8m tonnes in 2000, up from 152.3m tonnes in1995, largely because of a rise in containerised and liquid bulk cargo. A hugeexpansion is planned on the central west coast at Klang, as well as at TanjungPelepas in Johor, in order to compete with Singapore, which in 2000 stillhandled 24% of Malaysia’s international trade. (Reference table 3 provides avariety of transport indicators.)
The monopoly of Telekom Malaysia, which is largely state-owned, over theprovision of fixed-line and cellular services ended in 1994 with the licensing ofseveral competitors. However, Telekom remains the dominant provider offixed-line services; in 2000 there were 21 fixed-line telephones for every 100people. The newcomers have tended to concentrate on mobile telephony,raising the number of subscribers from 872,000 in 1995 to 5.1m in 2000. Theensuing competition has brought lower tariffs and improved service quality.
The development of information and communications technology (ICT) playsa crucial role in the government’s plans for the economy. ICT usage, measuredin terms of installed personal computers, rose from 29.5 per 1,000 head ofpopulation in 1995 to 95.7 in 2000. The number of Internet subscribersincreased from 13,000 in 1995 to about 1.7m in December 2000. There werefive Internet service providers in Malaysia in 2001. The government activelypromotes electronic services but keeps a wary eye on the Internet, fearinguncensored criticism.
Large investments ininfrastructure
A new internationalairport
Port capacity continuesto expand
Telecommunications
The Internet

18 Malaysia
EIU Country Profile 2001 © The Economist Intelligence Unit Limited 2001
Energy provision
Malaysia is well endowed with energy resources. It is a net exporter of oil andgas, which are extracted from beneath the South China Sea. Receptioninstallations in Terengganu handle the oil and gas extracted from fields east ofthe peninsula; other fields are located north of Sarawak and around the coastof Sabah. Coal is mined in Sarawak, and the high rainfall and ruggedtopography of both peninsular Malaysia and Sabah and Sarawak provideextensive scope for hydroelectric power, still largely to be exploited.
Energy balance, 2000(m tonnes oil equivalent)
Oil Gas Coal Electricitya Other Total
Primary supplyProduction 37.5 40.0 0.1 1.2b 2.4 81.2Imports 16.0 0.0 1.2 0.0 0.0 17.2Exports –28.5 –20.5 0.0 0.0 0.0 –49.0Stock change 0.0 0.0 0.0 0.0 0.0 0.0Total 25.0 19.5 1.3 1.2b 2.4 49.4
0.4c 48.6
Processing & transformationInput to refining –20.0 0.0 0.0 0.0 0.0 –20.0Input to transformation –4.0 –12.0 –0.4 –1.2b 0.0 –17.6Refining/transformation output 20.0 0.0 0.0 6.0c 0.0 26.0Energy industry fuel/loss –2.5 –5.0 0.0 –0.5c –1.0 –9.0Final consumptionTransport fuels 10.7 – 0.0 0.0 0.0 10.7Industrial fuels 5.5 1.5 0.9 2.7c 0.1 10.7Residential fuels 1.5 – – 2.8c 1.3 5.6Non-energy uses 0.8 1.0 0.0 0.0 0.0 1.8Total 18.5 2.5 0.9 5.5c 1.4 28.8
a Primary electricity output and imports and exports of electricity are expressed as input equivalents on an assumed generating efficiency of 33%.b Input basis. c Output basis.
Source: Energy Data Associates.
Rapid industrial development boosted demand for electricity significantly, andthe resulting supply shortfall led the government in the early 1990s to awardcontracts to private consortia, known as independent power providers (IPPs),to build and operate thermal generating plants to supply the national grid.The IPPs produced 37% of Malaysia’s electricity in 2000. Malaysia’s reservemargin—the difference between installed capacity and peak demand—remains large: by end-2000 the reserve margin stood at 32%. However, by 2005Tenaga Nasional, peninsular Malaysia’s main, predominantly state-ownedutility, and the IPPs are expected to raise installed capacity by 61% to meet ananticipated surge in demand. The government has revived the giant 2,400-mwBakun Hydroelectric Project on Borneo. (Reference table 4 provides nationalenergy statistics.)
The power industry readiesfor surge in demand
There are substantialenergy resources

Malaysia 19
© The Economist Intelligence Unit Limited 2001 EIU Country Profile 2001
The economy
Economic structure
Main economic indicators, 2000
GDP growth (%) 8.3
Consumer price inflation (av; %) 1.5
Gross national savings (% of GDP) 39.5
Current-account balance (US$ bn) 7.9
Total external debt (year-end estimate; US$ bn) 44.1
Exchange rate (av; M$:US$) 3.8
Population (m; mid-year estimate)a 23.8
a 2001.
Sources: Bank Negara Malaysia; official and EIU estimates.
In line with its vision of becoming a fully developed nation by 2020 Malaysiahas industrialised rapidly, transforming itself from an economy whoselivelihood relied primarily on the production of mineral and agriculturalexport commodities—palm oil, natural rubber, tropical timber and other minormineral and agricultural products—into an economy dominated bymanufacturing. The manufacturing sector continues to strengthen its positionas the leading contributor to GDP, increasing its share to 34.3% in 2000, from31.5% in 1999.
Malaysia plays a leading role in the world markets for some of its commodities.It is still an important source of rubber and is the dominant world producer ofpalm oil. Palm oil output reached a record 10.8m tonnes in 2000.
Manufactures account for 85% of gross export earnings. Electronic goods arethe single most important category, growing at a double-digit rate for most ofthe past 25 years, declining only in 1985 and probably also in 2001.Production is heavily dependent on imported parts. Government policy isaiming to raise the domestic content of exports. The strong export orientationof the electronics industry has made it highly vulnerable to fluctuations inglobal demand.
Malaysia’s rapid growth over the last 20 years has been financed and sustainedby high domestic savings and by large inflows of foreign direct investment(FDI). These inflows reached a peak of 8.7% of GDP in 1992-93, but have sincestabilised, standing at 4.9% of GDP in 2000. A large but declining part of theFDI inflow is channelled into manufacturing, which in 1998-2000 accountedfor 43% of FDI inflows, with 35% taken by the services sector. Malaysia ishoping to attract investment in higher knowledge content industries in linewith its ambitions to become a knowledge-based economy.
High rate of capitalinvestment
Electronics productiondominates
Manufacturing is thelargest sector

20 Malaysia
EIU Country Profile 2001 © The Economist Intelligence Unit Limited 2001
Comparative economic indicators, 2000
Malaysia Thailand Singapore Indonesia US
GDP (US$ bn) 89.3 121.9 91.4 153 9,873
GDP per head (US$) 3,841 1,954 22,753 721 35,032
Consumer price inflation (av; %) 1.5 1.6 1.4 3.7 3.4
Current-account balance (US$ bn) 7.9 9.2 21.8 7.7 –435.4 % of GDP 8.8 7.5 23.9 5.0 –4.4
Exports of goods fob (US$ bn) 98.1 67.9 138.9 62.5 775.7
Imports of goods fob (US$ bn) 77.6 56.2 127.5 37.4 1,222.8
External debt (US$ bn) 44.1 80.5 9.7 142.6 n/a
Debt-service ratio, paid (%) 5.2 18.4 1.9 28.9 n/a
Source: EIU, CountryData.
Economic policy
Fiscal policy tends to be prudent, with revenue during the boom yearsoutstripping current outlays and, for much of the 1990s, developmentspending as well. (See Reference table 5 for historical data on governmentfinances.) For the past four years, however, the government has followed astimulative fiscal policy, initially to aid economic recovery from the regionalfinancial crisis and, later on, to limit the impact of the global slowdown on thedomestic economy. The budget went into deficit in 1998. The 2001 budgetforecasts a deficit of M$16.1bn (US$4.2bn). Slower revenue growth is likely towiden that deficit. In March 2001 the government unveiled a fiscal package,which included M$3bn of additional public works expenditure; the economywill probably feel the impact in 2002. Further fiscal stimulative measures toboost private investment and attract foreign direct investment are to beexpected in the 2002 budget, to be announced in October.
Government finances, 2000a
% changeM$ bn year on year
Revenue 63.5 8.2 Tax revenue 48.5 7.3 Direct taxes 29.8 10.4 Indirect taxes 18.7 2.7 Non-tax revenue 15.0 11.1
Expenditure 75.2 10.3 Operating 58.2 24.6 Development (net) 23.3 8.4
Balance –18.0b 89.5
a Estimated. b Includes loan recoveries.
Source: Ministry of Finance, Economic Report 2000/2001.
Monetary policy is accommodative, reinforcing the impact of the expansionaryfiscal measures. Further interest-rate cuts can be expected if economic activitydoes not pick up. (See Reference table 6 for data on money supply growth andReference table 7 for interest rates.) The Malaysian ringgit has been pegged to
Fiscal policy isgenerally prudent

Malaysia 21
© The Economist Intelligence Unit Limited 2001 EIU Country Profile 2001
the US dollar at M$3.80:US$1 since 1998; persistent dollar strength in thatperiod has meant that Malaysia has lost competitiveness, especially in relationto neighbouring economies. There is no indication that the government willwant to change the fixed currency regime but its determination might bechallenged if the regional economic slowdown were to drag on.
Official development strategies have been based on a series of five-year plans.In line with the objective of becoming a fully developed nation by 2020, thegovernment in April 2001 unveiled its Eighth Malaysia Plan (EMP), which aimsfor 7.5% growth in 2001-05. The structural shift towards high-end manu-facturing is expected to continue; manufacturing, agriculture and services areexpected to contribute 35.8%, 7% and 55.1%, respectively, to GDP by 2005.The EMP replaces the Seventh Malaysia Plan which ran from 1996-2000, whenannual average growth reached only 4.7%, well below the plan’s original targetof 8%. The new growth target will be difficult to achieve, given the plunge inelectronics exports in 2001, which raises longer-term concerns about the globaldemand for electronics products and Malaysia’s sustainable rate of economicgrowth. The government may find it impossible to make up for slow economicgrowth in the early years of the plan with faster growth later in 2004-05. Aswas the case in the earlier plan, the economic expansion is expected to bedriven by an upturn in private investment. The EMP aims for an average 19%annual rise in private investment, after contracting by 11.6% under theSeventh Malaysia Plan. Public investment is intended to grow by only 1.1%annually, while the public sector declines as a share of GDP and resumes itsrole as the facilitator of private-sector participation in the economy. Whileforeign investment will remain important, its share of total investment isexpected to decline, in part because of the expected global competition forforeign funds.
Malaysia’s five-year plans
Seventh Plan Eighth PlanTarget Outturn Target
Real GDP growth (%) 8.0 4.7 7.5
Inflation (av; %) 2.7 3.4 2.7
GNP per head (M$; end-period) 14,788 13,359 17,779
Unemployment (%) 2.8 3.1 2.7
General government balance (% of GNP) 1.5 1.5 1.5
Current-account balance (% of GNP) 0.5 6.5 3.9
Source: Economic Planning Unit, Eighth Malaysia Five-Year Plan (2001-2005).‘
The EMP, together with the Second Industrial Masterplan (1996-2005),emphasise the importance of strengthening the links between industries andproviding them with appropriate support, in particular through thedevelopment of human resources, physical infrastructure and other services.The EMP aims to achieve its growth targets by boosting productivity: accordingto the plan, 2.8 percentage points of the targeted average 7.5% annual GDPgrowth will come from an increase in total factor productivity. The moreefficient use of labour and capital will hinge on improving the quality and
Five-year plans

22 Malaysia
EIU Country Profile 2001 © The Economist Intelligence Unit Limited 2001
skills of the workforce, which the government may find difficult to achievewithin the plan period.
Federal government development allocation and expenditure by sector(M$ m)
Seventh Plan Eighth PlanAllocation Outturn Allocation
Economic 49,351.6 47,171.9 50,514.6 Agricultural development 8,286.9 8,139.3 7,860.0 Mineral resources development 46.1 40.8 50.0 Commerce & industry 12,208.8 11,257.8 10,295.4 Transport 21,677.7 20,826.2 21,818.9 Communications 51.3 47.0 146.5 Energy 2,544.0 2,543.6 2,601.6 Water resources 3,131.5 2,999.5 5,988.4 Feasibility study 299.3 264.9 131.0 Research & development 1,106.0 1,052.8 1,622.8
Social 32,156.0 31,284.0 37,518.1 Education & training 20,185.8 19,724.1 22,660.0 Health 3,737.1 3,725.5 5,500.0 Information & broadcasting 246.2 192.3 254.1 Housing 3,372.4 3,330.8 4,223.3 Culture, youth & sports 1,571.3 1,365.4 964.8 Local authorities & welfare services 1,624.9 1,565.1 2,972.6 Village & community development 1,350.4 1,318.5 943.3 Purchase of land 67.9 62.3 0.0
Security 12,747.6 11,644.0 10,750.0 Defence 10,293.9 9,539.3 8,750.0 Internal security 2,453.7 2,104.7 2,000.0
General administration 9,309.7 8,937.1 11,217.3
Total 103,564.9 99,037.0 110,000.0
Source: Economic Planning Unit, Eighth Malaysia Five-Year Plan (2001-2005).
The Malaysian way of dealing with the speculative capital flows and the sharpeconomic downturn in 1997-98, without the assistance of the InternationalMonetary Fund (IMF), has attracted a great deal of attention. Criticism of thecapital controls died down after Malaysia’s economic performance proved atleast as good as that of the regional economies that had sought the IMF’s help,and after the IMF grudgingly admitted that capital controls might, after all,have a role to play during a balance-of-payments crisis. Malaysia’s financialcrisis was triggered in mid-1997 by heavy selling of the ringgit and shares byforeign fund managers. It degenerated into a full-blown recession and led tothe imposition of capital and currency controls in September 1998 (see Theexternal sector: Foreign reserves and the exchange rate). Dr Mahathir justifiedthe controls because of what he called the “disastrous” failure of the freemarket. They were essentially designed to halt the speculative flight of capitalthat had battered the ringgit and share prices for more than a year.Accompanied by the fixing of the exchange rate at M$3.8:US$1, they alsoallowed for a further easing of interest rates without undermining the value ofthe ringgit. Official agencies used the breathing space afforded by the controlsto try to restore the overextended financial system to health—inter alia, vianon-performing loan carve-outs, the recapitalisation of banks and debt
Capital controls largelyabolished

Malaysia 23
© The Economist Intelligence Unit Limited 2001 EIU Country Profile 2001
reschedulings—but the government also bailed out many badly run but wellconnected corporations.
Public-sector development allocation(M$ m)
Seventh Plan Eighth PlanAllocation Outturn Allocation
Transport 20,913.1 20,484.2 21,222.1 Roadsa 12,429.9 12,269.5 14,002.6 Urban transport 404.2 404.0 705.6 Rail 5,450.3 5,450.3 4,081.0 Ports 1,157.4 1,089.2 1,500.0 Airports 1,471.3 1,271.2 932.9
Utilities 3,445.3 3,048.0 5,549.9 Water supply 2,776.8 2,382.7 3,966.3 Sewerage 668.5 665.3 1,583.6
Communications 51.0 39.6 228.0 Telecommunications & post 10.2 4.1 146.7 Meteorological services 40.8 35.5 81.3
Total 24,409.4 23,571.8 27,000.0
a Excludes localised roads in regional development areas, some local authorities and agriculturalroads.
Source: Economic Planning Unit, Eighth Malaysia Five-Year Plan (2001-2005).
Although the prime minister stated repeatedly that the capital and currencycontrols would remain in place until the international community tookconcrete steps to regulate such short-term flows—which has not takenplace—the controls have been largely dismantled. In May 2001 the 10% levyon the repatriation of profits from portfolio investments held for less thanone year—the last residual restriction on foreign investors—was abolished.Capital controls now exist for Malaysians only, but could easily and quicklybe restored during a crisis. The currency peg remains and offshore ringgittrade is still banned. Malaysia remains committed to the fixed exchange rate,despite criticism of its inflexibility and a loss of competitiveness owing to USdollar strength.
There are few indications that the government intends to revise its approachto failing, politically favoured businesses in the near future, despiteassurances that it will consult more closely with the public and will probemore closely the abilities of the companies involved in the controversialprivatisation initiative. The high-profile campaign of privatising governmentassets was launched in the 1980s with the explicit intention of promotingMalay interests by increasing the share of the nation’s corporate assets in thehands of bumiputera (ethnic Malays and other indigenous peoples). Criticshave said that many lucrative projects went to political favourites with littleindustry knowledge or expertise. The 1997-98 economic downturn showedup the weaknesses and the lack of managerial skills in many wellconnected companies.
Although many companies have been bailed out, the resolution of the baddebt problem has been difficult and slow, requiring additional government
Approach to privatisationunchanged

24 Malaysia
EIU Country Profile 2001 © The Economist Intelligence Unit Limited 2001
help at a later stage. The failure of the programme was highlighted by the buy-back, in December 2000, of a controlling 29% stake in the debt-ridden nationalcarrier, Malaysian Airline System (MAS), held by a former business associate ofthe finance minister, Daim Zainuddin, for M$1.79bn; at M$8 a share, this wasthree and a half times the MAS share price on the open market. Thegovernment’s decision, in August 2001, to take over the heavily indebtedRenong UEM may be a prelude to a takeover of the whole Renong group, oneof Malaysia’s largest companies, which has close relations with UMNO.
In January the government introduced a controversial self-assessment schemefor Malaysia-based corporate taxpayers. By removing the task from the InternalRevenue Board (IRB), the government aims to lift efficiency and accountingpractices. But business heads say that the legislation was put together tooquickly with little regard for the views of the 280,000 companies whichaccount for nearly half of the M$29bn collected annually by the IRB. Theyhave complained about the difficulty for the taxpayer in interpreting complextax legislation in the first place and the stiff penalties for those failing to do so,which mean that anyone responsible for submitting an incorrect return canface a jail term of up to three years. Dr Mahathir has hinted that thegovernment is likely to reduce the corporate tax rate, currently standing at28%, in the 2002 budget to be presented in October 2001. This rate is higherthan the levels prevailing in many other Asian countries, includingneighbouring Singapore. A reduction would enhance Malaysia’s com-petitiveness, but it is doubtful whether it would raise the rate of domesticinvestment to compensate for the expected drop in FDI flows.
Taxation policy in the coming years is expected to continue to favour low-income earners. The 2001 budget highlighted this with a number ofconcessions, including an increase in the annual rebate payable to individualtaxpayers from M$110 (US$29) to M$350 and raising the eligibility thresholdfrom M$10,000 (US$2,630) to M$35,000.
Economic performance
Malaysia suffered a brief recession in the mid-1980s and then enjoyed a periodof consistently fast growth until 1998, with the economic expansion driven bymanufacturing investment and exports. (Reference tables 8-10 provide data onMalaysia’s gross domestic product.) Malaysia’s dependence on exports,particularly electronics and electrical goods, which make up 62% of exports, hasmade economic growth vulnerable to global fluctuations in the demand forthese products. Malaysia has benefited from the surge in global demand forinformation and communication technology goods, which pulled its economyout of recession in 1999. However, during 2001 there was a savage downturn inthe global demand for investment goods, which resulted in a plunge in Malaysiaexports and a sharp fall in GDP growth for the second time this decade. Withother regional economies also weakening, no quick or strong recovery seemslikely in 2001 or 2002. Domestic demand will provide some support, but will beunable to compensate fully for the fall off in demand for exports.
Outlook depressed byelectronics sector
Changes to taxation policy
Malaysia 25
© The Economist Intelligence Unit Limited 2001 EIU Country Profile 2001
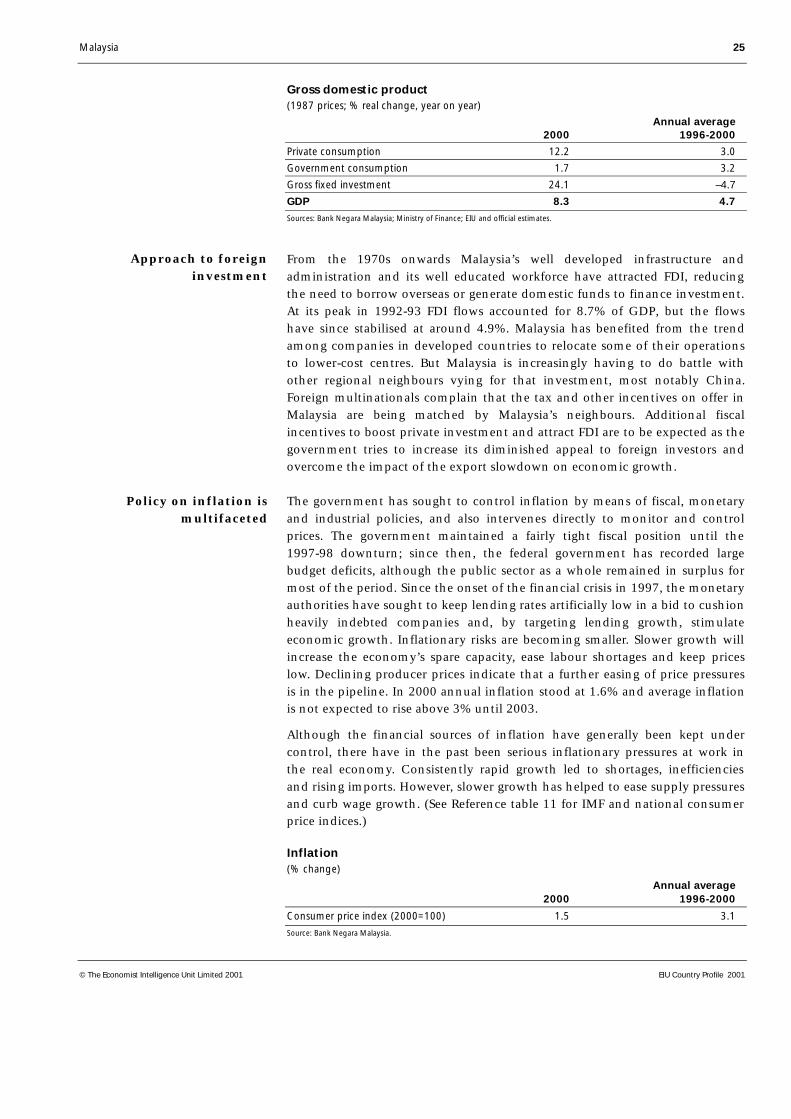
Gross domestic product(1987 prices; % real change, year on year)
Annual average2000 1996-2000
Private consumption 12.2 3.0
Government consumption 1.7 3.2
Gross fixed investment 24.1 –4.7
GDP 8.3 4.7
Sources: Bank Negara Malaysia; Ministry of Finance; EIU and official estimates.
From the 1970s onwards Malaysia’s well developed infrastructure andadministration and its well educated workforce have attracted FDI, reducingthe need to borrow overseas or generate domestic funds to finance investment.At its peak in 1992-93 FDI flows accounted for 8.7% of GDP, but the flowshave since stabilised at around 4.9%. Malaysia has benefited from the trendamong companies in developed countries to relocate some of their operationsto lower-cost centres. But Malaysia is increasingly having to do battle withother regional neighbours vying for that investment, most notably China.Foreign multinationals complain that the tax and other incentives on offer inMalaysia are being matched by Malaysia’s neighbours. Additional fiscalincentives to boost private investment and attract FDI are to be expected as thegovernment tries to increase its diminished appeal to foreign investors andovercome the impact of the export slowdown on economic growth.
The government has sought to control inflation by means of fiscal, monetaryand industrial policies, and also intervenes directly to monitor and controlprices. The government maintained a fairly tight fiscal position until the1997-98 downturn; since then, the federal government has recorded largebudget deficits, although the public sector as a whole remained in surplus formost of the period. Since the onset of the financial crisis in 1997, the monetaryauthorities have sought to keep lending rates artificially low in a bid to cushionheavily indebted companies and, by targeting lending growth, stimulateeconomic growth. Inflationary risks are becoming smaller. Slower growth willincrease the economy’s spare capacity, ease labour shortages and keep priceslow. Declining producer prices indicate that a further easing of price pressuresis in the pipeline. In 2000 annual inflation stood at 1.6% and average inflationis not expected to rise above 3% until 2003.
Although the financial sources of inflation have generally been kept undercontrol, there have in the past been serious inflationary pressures at work inthe real economy. Consistently rapid growth led to shortages, inefficienciesand rising imports. However, slower growth has helped to ease supply pressuresand curb wage growth. (See Reference table 11 for IMF and national consumerprice indices.)
Inflation(% change)
Annual average2000 1996-2000
Consumer price index (2000=100) 1.5 3.1
Source: Bank Negara Malaysia.
Policy on inflation ismultifaceted
Approach to foreigninvestment

26 Malaysia
EIU Country Profile 2001 © The Economist Intelligence Unit Limited 2001
The consumer price index (CPI) is the most widely cited measure of pricemovements. It is derived from a weighted average of the householdexpenditure patterns of five income groups and includes 430 items, of which20 are subject to price control. The 20 controlled items have a high weightingin the index.
By concentrating its attention on these items, the government has managedthe index and given the impression of controlling inflation. This policy ofcontrolling prices reduces the hardships caused to poorer households byinflation (and may, as a result, have a knock-on effect on wage rates among thelowest-paid workers), but both the policy and the CPI conceal rather thancombat underlying inflationary pressures.
Malaysia’s traditionally tight labour market has loosened as a result of theeconomic slowdown. Unemployment was only 2.7% in 1997 according to theDepartment of Statistics. It has since edged up, standing at 3.1% in 2000, after3.4% in 1999. In past downturns the government has responded byrepatriating large numbers of foreign workers.
Manufacturing sector wages(% change)
Annual average2000 1996-2000
Wages 4.6 4.7
Source: Bank Negara Malaysia.
As Malaysia moves to become a knowledge-based economy, one of the greatestchallenges is the need to equip workers with new skills. In 2000 productivityimprovements generally outpaced growth in real wages. (See Reference table 2for historical data on the labour force.)
Regional trends
Economic development is concentrated in the western states of the peninsula.After trading operations had been established in the Straits Settlements, tinmining and plantation developments began in Selangor, Perak and Johor—areas that, together with Penang, still have the largest concentrations ofmanufacturing industry. Penang and the Kelang Valley (in central Selangor,between Kuala Lumpur and the coast) are the main locations of export-oriented manufacturing. Penang’s customs-free industrial zones have been thefocus of investment by international electronics companies, while the KlangValley has the largest and longest-established concentration of generalmanufacturing operations.
Successive five-year plans have fostered the location of industrial projects innew areas, still mainly in states on the west of the peninsula (Kedah, NegeriSembilan and Malacca). In the predominantly rural states on the east coast ofthe peninsula (Kelantan, Terengganu and Pahang) and the two Borneo states(Sabah and Sarawak) industrial activity is mainly related to the processing oflocal raw materials. Timber processing has developed in all of these states.
A tight labour market
Imbalances in development

Malaysia 27
© The Economist Intelligence Unit Limited 2001 EIU Country Profile 2001
Primary oil and gas installations are necessarily located close to offshoresources. Terengganu on the east coast of the peninsula and Sabah on the islandof Borneo have reception units. Manufacturing operations using oil and gashave grown up around these primary industries, including petrochemicalfacilities in Terengganu and Pahang. Other primary industries have generatedsimilarly related manufacturing units: a tinplate production line in thesouthern state of Johor serves Malaysia’s main fruit-canning industry, forinstance. Production of plantation crops is widely dispersed among all states ofthe federation.
Kelantan is still dominated by agriculture. Rice and natural rubber account fortwo-thirds of the cultivated area. The state also produces 90% of domesticallygrown tobacco. There is substantial logging activity, but little local sawing andprocessing capacity. Income per head in Kelantan is the lowest and slowestgrowing in Malaysia.
Economic sectors
Agriculture, forestry and fisheries
In recent years the output of the agricultural, forestry and fisheries sectorstaken together has stagnated, and the relative importance of these rural-basedsectors within the economy as a whole has declined because of the rapidgrowth of the industrial and services sectors. (Reference table 12 gives historicaldata on agricultural and forestry production.)
The most important activities are subsistence or domestic food production(fisheries and the cultivation of rice being the most important subsectors),plantation crops for international markets, led by rubber, palm oil, cocoa, fruit,pepper and coconut oil, and timber.
Agriculture and forestry production, 2000(‘000 tonnes unless otherwise indicated)
Palm oil 10,839
Rubber 616
Sawlogs (‘000 cu metres) 23,898
Cocoa 70
Source: Bank Negara Malaysia, Annual Report.
Production of rice, once the dominant subsistence crop of Malay farmers, hasbeen threatened by the general drift to the towns, competing uses for land andcompetition for labour from the manufacturing industry. As a potent symbolof traditional Malay life, rice growing continues to attract special governmenthelp, such as schemes for raising yields and productivity. Malaysia is now a netimporter of rice. This is not a problem, however, because there are importantsurplus countries in the region—Thailand and Vietnam.
Rice
Agriculture is of decliningimportance
28 Malaysia
EIU Country Profile 2001 © The Economist Intelligence Unit Limited 2001
Natural rubber is Malaysia’s longest-established, large-scale agriculturalproduct. Although refinements in plant breeding and biological controls haveraised yields and enabled growers to manipulate output, the availability ofcheap or family labour is crucial to productivity levels. Plantation companiesrely increasingly on immigrant labour, and have steadily converted plantingsto more profitable oil palm. The main source of output is now the smallholdersector. Production has been declining since the late 1980s, dropping by 19.5%to 616,000 tonnes in 2000.
The palm oil sector also recruits workers from low-wage countries in theregion. Despite the difficulties in competing for labour with manufacturingindustry, output of palm oil and associated products has been expanding. In2000 palm oil output reached a record 10.8m tonnes. Malaysia continues toengage in extensive research and development activities to find new uses forpalm oil. The commodity has benefited from the view of dieticians that it is ahealthy alternative to animal fats and oilseed products, and it is also favouredbecause it is not proscribed by any religious dietary rules (an important sellingpoint in Pakistan, India and the Central Asian republics).
Malaysia is a major supplier of tropical timber. It has frequently been criticisedfor allowing the destruction of its rainforests by logging companies. In theinterests of maximising income from forest products, it has gradually extendedthe ban on direct exports of sawlogs from all states except Sarawak (althoughin the case of Sabah, the embargo was partly lifted in late 1996). It has alsoincreased statutory and administrative controls on logging and has begun toenforce more strictly the conditions applying to logging licences (includingrequirements for reafforestation). As a result, log production has fallen,affecting both exports of logs and the production of sawn timber.
Mining and semi-processing
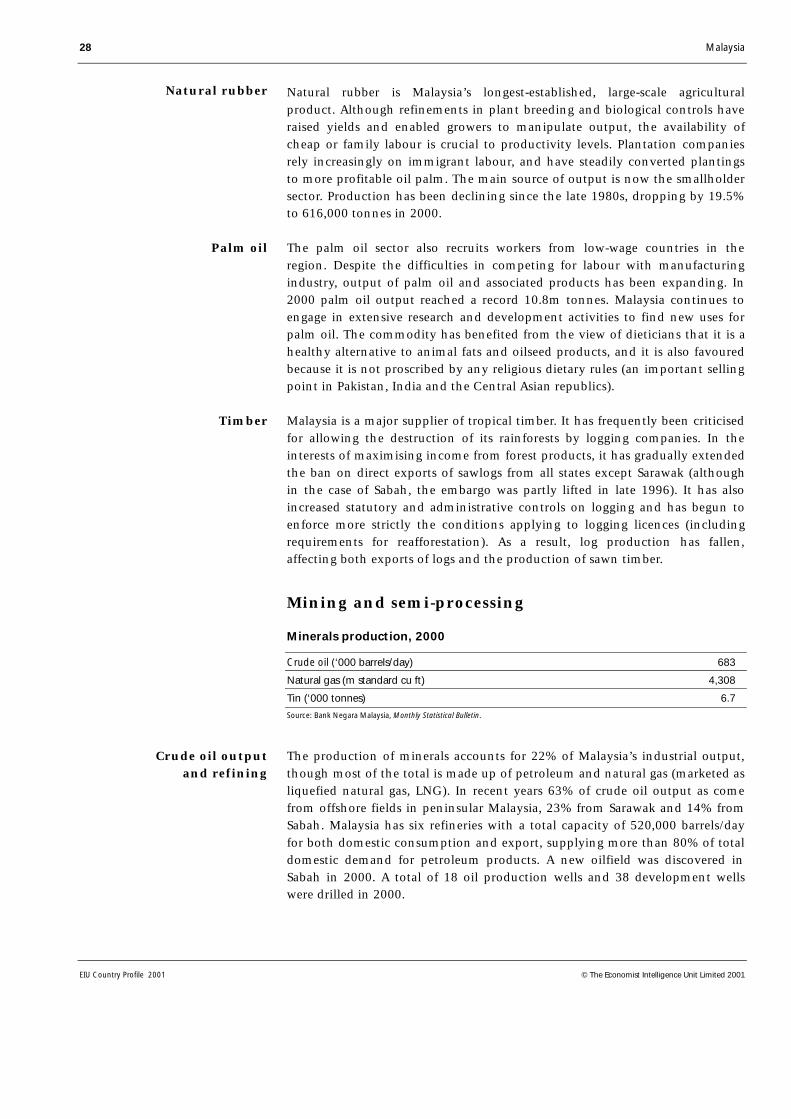
Minerals production, 2000
Crude oil (‘000 barrels/day) 683
Natural gas (m standard cu ft) 4,308
Tin (‘000 tonnes) 6.7
Source: Bank Negara Malaysia, Monthly Statistical Bulletin.
The production of minerals accounts for 22% of Malaysia’s industrial output,though most of the total is made up of petroleum and natural gas (marketed asliquefied natural gas, LNG). In recent years 63% of crude oil output as comefrom offshore fields in peninsular Malaysia, 23% from Sarawak and 14% fromSabah. Malaysia has six refineries with a total capacity of 520,000 barrels/dayfor both domestic consumption and export, supplying more than 80% of totaldomestic demand for petroleum products. A new oilfield was discovered inSabah in 2000. A total of 18 oil production wells and 38 development wellswere drilled in 2000.
Natural rubber
Palm oil
Crude oil outputand refining
Timber

Malaysia 29
© The Economist Intelligence Unit Limited 2001 EIU Country Profile 2001
In contrast to the relative stability of crude oil output, production of naturalgas continues to grow. Between 1995 and 2000 production increased by 42%.In 2000 natural gas output rose by 13.3% in response to increased utilisationby the power generation sector and stronger demand from the manufacturingsector at home and higher demand for LNG in Japan and Taiwan. The increasein demand was partly met by the opening of a new gas field in Terengganu inFebruary 2000. Three new gas fields are expected to begin production in 2002,and a further five in 2003.
Malaysian output of tin concentrates reflects the precipitous decline inmining activity since the mid-1980s. The 6,686 tonnes of tin concentrateproduced in 2000 represent a year-on-year fall in output of 8.9% owing tothe closure of some tin mines during the year. There are now around 38 unitsof all types, compared with the 141 units in operation in 1990. Malaysia’sother main mineral operation is the Mamut copper mine in Sabah. Iron oreand bauxite ore are also mined. (Reference table 13 includes historical dataon minerals production.)
Manufacturing
When, over 20 years ago, the government set out to build up export-orientedmanufacturing capacity based on inward direct investment, there was already along history of investment in import-substitution industries and an establishedpolicy of developing industries based on increased internal processing ofoutput from domestic primary industries.
Manufacturing, 2000(%)
Output growth 25.0 Export-oriented 31.6 Domestic-oriented 17.2
Share of labour force 27.5
Share of total outstanding loans 16.4
Capacity utilisation 80.0
Source: Bank Negara Malaysia, Annual Report.
The main location of export-oriented manufacturing has until recently beenthe island of Penang and the central industrial belt to the west of KualaLumpur, the Klang Valley. Other manufacturing centres are now growing up asa result of a deliberate government policy to disperse manufacturing develop-ment. The government is hoping to centre high-technology industry in the so-called Multimedia Super Corridor (MSC), a 750-sq km information-technologyzone being developed near Kuala Lumpur, although its development has beenslow owing to limited interest from potential investors.
Although the government aims to stimulate inward investment, all industrialprojects are subject to an approval system, operated through the MalaysianIndustrial Development Agency (MIDA). This involves vetting equity stakes,financing, technology transfer, local content and, increasingly, the products
Gas
Tin and other minerals
Approval system forindustrial investment
Emphasis on export-oriented industries

30 Malaysia
EIU Country Profile 2001 © The Economist Intelligence Unit Limited 2001
and processes concerned. In the past the government seemed ready towelcome any investment promising industrial employment. As skilled andsemi-skilled workers became increasingly scarce, MIDA stopped grantingapprovals to low-productivity industries, and the government encouragedexisting low-productivity industries to relocate to Thailand or Indonesia. Inthis respect, Malaysia was following a pattern set by the developmentauthorities in Singapore 20 years ago.
After years of strong growth, manufacturing output fell by 10.2% in 1998,undermined by the decline in domestic and external demand caused by theregional downturn. The turnaround was swift, with an increase of 12.9% in1999 being followed by a surge of 25%, led by overseas demand for productsfrom the electronics sector, which boosted its output by 21% in 1999 and44.8% in 2000. Manufacturing thus strengthened its position as the leadingcontributor to GDP. The 1997/98 downturn had exposed and aggravated a hostof problems bred by the prolonged, dubiously managed investment boom,which led to many company closures. The downturn taking shape in 2001could prove serious, especially in the electronics sector. (Reference table 14details changes in the output of the manufacturing sector.)
Construction
Construction has been an important contributor to GDP growth. The sectorexpanded rapidly in the years preceding the 1997/98 recession, driven bystrong private- and public-sector demand, the expectation of continuing higheconomic growth and attractive capital gains from property, and the easyavailability of funds from the local banking system and stockmarket. Havingaveraged 15.2% annually in 1994-96, growth slowed to 10.6% in 1997 owingto oversupply, the near completion of major projects, and the deferral ofseveral planned infrastructure developments. The construction sector thencontracted by 23% in 1998, and by 5.6% in 1999, as private investmentplunged. Some stability was restored in 2000, when the sector registeredgrowth of 1.1%, largely the result of government stimulation. (See Referencetable 15 for historical data on construction completions.)
Financial services
Malaysia has a fully developed range of commercial banks, merchant(investment) banks and finance companies. Malaysian banks are required toprovide loans “at reasonable cost” to priority sectors—all bumiputera groups(groups owned by ethnic Malays or other indigenous peoples), low-costhousing and small-scale enterprises. Commercial banks generally enjoyedprofitable expansion during the period of rapid economic growth. (Referencetable 28 provides historical data on banks’ assets and liabilities.) However,concern about the health of the financial system rose during the 1997/98financial crisis. Its fragility derived from the rapid expansion of credit over theprevious decade when lending to fund the investment boom surged by anannual average of almost 30%, much faster than the growth in nominal GDP.
The banking sector iswell developed
The construction slumpbottoms out

Malaysia 31
© The Economist Intelligence Unit Limited 2001 EIU Country Profile 2001
A large proportion of the credit was directed to property development andstockmarket investments. By end-1997 outstanding loans were equivalent to170% of GDP, one of the highest such ratios in the world. A sizeableproportion of these borrowings were collateralised by shares whose value hadfallen steeply. When the crisis hit, non-performing loans (NPLs), on a three-month arrears basis, climbed to over 20% of total credits by end-1998, up from3.9% two years earlier.
The government established two agencies to help the banks to cope with theNPL problem but also used the financial crisis as an opportunity to pushthrough the restructuring of the financial sector. A major consolidation of thefinancial sector was considered necessary to ensure the emergence of strong,well capitalised institutions capable of competing effectively in an increasinglyglobalised environment. In July 1999 Bank Negara Malaysia (BNM, the centralbank) unveiled a controversial plan to reduce the number of locally ownedcommercial banks, merchant banks and finance companies from 58 to six,later raised to 10. By end-2000 50 of Malaysia’s 54 domestic banks had agreedto merge into ten groups. Bank Negara introduced various tax incentives,including exemption from stamp duty and real property gains tax, in an effortto hasten the integration. The merger process is fraught with difficulties as thebanks struggle to overcome differences in corporate culture and procedure. InMarch 2001 Bank Negara published a ten-year masterplan for the financialsector, which aims to strengthen further the sector’s competitiveness in theface of increased liberalisation and globalisation.
Before the economic crisis struck, the government was seeking to transformKuala Lumpur into a regional financial centre, having introduced a range ofmeasures to liberalise the capital market. The eruption of the financial crisisand the government’s imposition of currency and capital controls all butdashed the authorities’ hopes of turning Kuala Lumpur into a regional centre.The bail-outs of politically well connected entrepreneurs to the detriment ofminority shareholders also undermined Malaysia’s free-market credentials. InMay 2001 the government scrapped the 10% levy on the repatriation of profitsfrom portfolio investments held for less than one year, the last residualrestriction on foreign investors.
In February 2001 the Securities Commission presented a ten-year masterplanfor the capital market in a move to render it more attractive to borrowers andinvestors and lower the cost of fundraising. Much of the focus is on thedevelopment of the corporate bond market. The plan also aims to develop theventure capital market, by encouraging the participation of foreigners and localinstitutional investors. Foreign majority ownership of unit trust companies isto be permitted from 2003. The masterplan also aims to strengthen corporategovernance by improving the rights of minority shareholders. The KualaLumpur Stock Exchange (KLSE) will be allowed to take action against thedirectors of listed companies and against their advisers.
The masterplan also aims to speed up the development of the fledglingderivatives market, including entitling foreign firms to act as clearing agents.This should lead to the emergence of a single local exchange by 2002 and the
Financial sector masterplan follows bank mergers
Capital market masterplan

32 Malaysia
EIU Country Profile 2001 © The Economist Intelligence Unit Limited 2001
emergence of a core group of competitive brokerages offering a wide range ofproducts and services. In June 2001 the KLSE launched a new derivativesexchange called the Malaysian Derivatives Exchange, or MDEX, aimed atintroducing new products including bond futures and Islamic index futures.The new bourse is the result of the merger in December 2000 of theCommodity and Monetary Exchange of Malaysia, or COMMEX, and the KualaLumpur Options and Financial Futures Exchange, or KLOFFE. In June 2001 theKLSE also began merger proceedings with the Malaysian Exchange of SecuritiesDealing & Automated Quotation (MESDAQ). (Reference table 16 includeshistorical data on the stock exchange.)
Other services
Services (including financial services) accounted for 47.6% of GDP in 2000.While it remains the largest sector of the economy, the share of servicesdeclined in 2000, reflecting the stronger performance of the manufacturingsector. Activity in the services sector as a whole has generally risen faster thanoverall GDP. This reflects the success of official policies in promoting the sectorin order to boost exports and encourage import substitution.
Turnover in the distributive trades and catering sector—which, at 14.9% of GDPin 2000, constituted the largest component of the services sector—fluctuateswidely with movements in the rate of growth of personal consumption.
A steady expansion in tourism and business travel during much of the1990s—partly owing to increased government support—helped to offset theslowdown in retail services growth. The economic downturn in 1997-98 hitregional travellers (visitors from member countries of the Association ofSouth-East Asian Nations, or ASEAN, account for 70% of all tourists), but wasfollowed by a quick rebound. Malaysia is aiming to diversify its tourist market,boosting both foreign and domestic tourism. The supply of hotel roomsincreased by 76% to 134,500 between 1995 and 2000. A total of 88 new hotelswere completed in 2000, bringing the total to 1,514. Average hotel occupancyrates are rising, reflecting increased foreign tourist arrivals and domestictourism activity.
The external sector
Trade in goods
International trade has long been important, especially for an economy thatdepended mainly on the export of raw materials. This openness increased asMalaysia developed its industries, which were mainly based on export-orientedmanufacturing and on imported inputs. As many of the fastest growingproduction lines, particularly in the electronics sector, were set up on the basisof low local content, the bill for imported manufactures rose along with
Retail services
Tourism
Export growth is matchedby increasing imports
A large services sector

Malaysia 33
© The Economist Intelligence Unit Limited 2001 EIU Country Profile 2001
revenue from exports. Malaysia’s merchandise trade account has usually beenin surplus: the surplus soared during the 1997/98 recession and its aftermath.In 2000 the trade account recorded another huge surplus for the thirdconsecutive year, largely the result of buoyant external demand for electronics,electrical appliances and other manufactured goods from the US and the Asiaand Australasia region. The continued high merchandise and current-accountsurpluses reflect Malaysia’s incomplete economic recovery: the demand forimported capital goods has not returned to its pre-crisis levels as privateinvestment has failed to recover its previous buoyancy. (Reference tables 17-20give a variety of export and import data.)
Direction and composition of trade, 2000(US$ m)
Exports fob US Singapore Japan Hong Kong Total
Food 84 517 112 106 1,590Rubber & manufactures 551 57 107 51 1,947Wood & manufactures 239 138 1,085 211 3,537Mineral fuels 443 1,012 2,893 13 9,335Animal & vegetable oils & fats 124 171 151 99 3,197Chemicalsa 454 683 537 389 4,755Textile fibres, yarn, cloth & manufactures 77 127 90 262 1,333Metals & manufacturesb 182 613 220 85 2,419Machinery excl electric 6,698 4,411 2,534 957 23,067Electrical, electronic equipment 9,047 8,715 4,142 1,938 37,667Transport equipment 80 105 20 37 768Clothing 765 66 65 11 1,348Furniture, lighting, prefab buildings 476 161 281 0 1,658Scientific instruments, etc 537 238 269 94 1,851Total incl others 20,155 18,050 12,781 4,440 98,158
Imports cif Japan US Singapore Taiwan Total
Food 21 186 52 39 3,016Mineral fuels 20 30 2,043 4 3,892Chemicalsa 1,424 897 883 346 6,563Paper etc & manufactures 189 115 116 85 1,158Textile fibres, yarn, cloth & manufactures 142 43 49 297 1,415Non-metallic mineral manufacturesc 421 68 312 16 1,864Iron & steel & manufacturesb 1,179 142 234 300 3,101Other metals & manufacturesb 652 179 170 143 2,463Machinery excl electric 2,997 2,152 1,469 896 11,975Electrical, electronic equipment 7,781 7,946 5,709 2,232 37,293Transport equipment 1,329 372 70 21 2,468Scientific instruments, etc 568 1,030 282 45 2,688Total incl others 17,331 13,648 11,763 4,611 82,155
a Including crude fertilisers and manufactures of plastics. b Including scrap. c Including precious metals & jewellery.
Source: Global Trade Information Services, World Trade Atlas; Department of Statistics, Malaysia.
Prior to the pegging of the ringgit:US dollar exchange rate in September 1998,Malaysia was vulnerable to fluctuations in the currencies of its main tradingpartners, particularly Japan, which supplied 22% of imports in 1997. Thegovernment’s long-term aim is to increase the domestic content of goods madewith overseas investment and technology, but in many cases this is being
The importance of the yenexchange rate
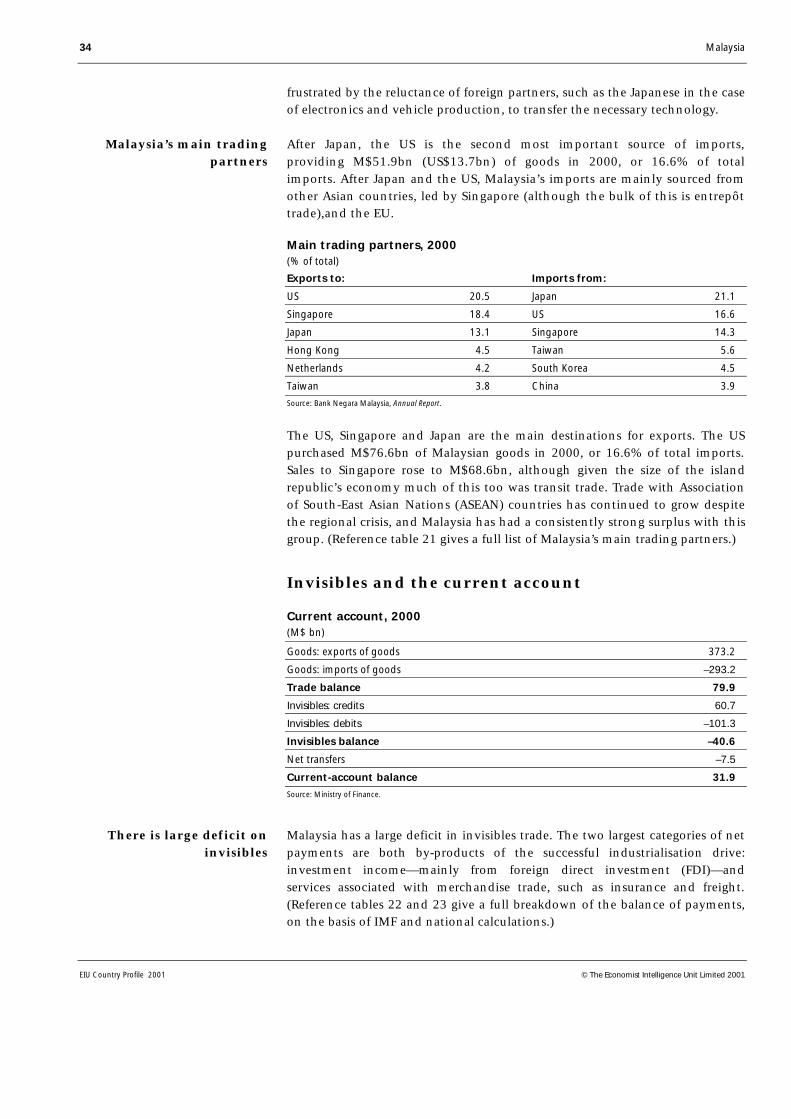
34 Malaysia
EIU Country Profile 2001 © The Economist Intelligence Unit Limited 2001
frustrated by the reluctance of foreign partners, such as the Japanese in the caseof electronics and vehicle production, to transfer the necessary technology.
After Japan, the US is the second most important source of imports,providing M$51.9bn (US$13.7bn) of goods in 2000, or 16.6% of totalimports. After Japan and the US, Malaysia’s imports are mainly sourced fromother Asian countries, led by Singapore (although the bulk of this is entrepôttrade),and the EU.
Main trading partners, 2000(% of total)
Exports to: Imports from:
US 20.5 Japan 21.1
Singapore 18.4 US 16.6
Japan 13.1 Singapore 14.3
Hong Kong 4.5 Taiwan 5.6
Netherlands 4.2 South Korea 4.5
Taiwan 3.8 China 3.9
Source: Bank Negara Malaysia, Annual Report.
The US, Singapore and Japan are the main destinations for exports. The USpurchased M$76.6bn of Malaysian goods in 2000, or 16.6% of total imports.Sales to Singapore rose to M$68.6bn, although given the size of the islandrepublic’s economy much of this too was transit trade. Trade with Associationof South-East Asian Nations (ASEAN) countries has continued to grow despitethe regional crisis, and Malaysia has had a consistently strong surplus with thisgroup. (Reference table 21 gives a full list of Malaysia’s main trading partners.)
Invisibles and the current account
Current account, 2000(M$ bn)
Goods: exports of goods 373.2
Goods: imports of goods –293.2
Trade balance 79.9
Invisibles: credits 60.7
Invisibles: debits –101.3
Invisibles balance –40.6
Net transfers –7.5
Current-account balance 31.9
Source: Ministry of Finance.
Malaysia has a large deficit in invisibles trade. The two largest categories of netpayments are both by-products of the successful industrialisation drive:investment income—mainly from foreign direct investment (FDI)—andservices associated with merchandise trade, such as insurance and freight.(Reference tables 22 and 23 give a full breakdown of the balance of payments,on the basis of IMF and national calculations.)
Malaysia’s main tradingpartners
There is large deficit oninvisibles

Malaysia 35
© The Economist Intelligence Unit Limited 2001 EIU Country Profile 2001
The deficit on the investment income account rose by 38% to M$27.9bn in2000 after M$20.3bn in 1999. The larger deficit mainly reflected higher profitsand dividends accruing to foreign direct investors, particularly in the export-oriented electronics and electrical industries and the oil sector. Bank NegaraMalaysia (BNM, the central bank) treats all profits on the overseas equity of FDIventures as if they are payments across the exchanges, even if they are retainedand reinvested. Such reinvestments are then treated as capital inflows.
A large flow of profits to overseas equity holders is a consequence of an FDI-financed industrialisation programme. Rising remittances from overseas invest-ment by Malaysian companies tend to reduce the net size of the deficit but, asthe government has relaxed the rules that formerly limited the proportion ofequity in approved investments non-residents were allowed to own, grossprofits due to non-residents have risen faster.
The weakness in Malaysia’s trade-related services is of long standing, but washighlighted by the rapid growth of exports in 1999-2000. The services deficitwidened from M$32.1bn in 1999 to an estimated M$40.6bn in 2000 because ofincreased demand for imported services together with buoyant external tradeand a higher level of domestic economic activity.
Capital flows and foreign debt
Malaysia has had a low rate of international indebtedness on both the officialand private accounts. The government established a habit of advance payment(pre-payment) of official debt, which reduced the burden of debt servicing stillfurther. A relatively small proportion of external debt (18% at end-2000) isdenominated in yen, rendering Malaysia less vulnerable than other ASEANcountries to the negative effect on debt-servicing costs of a rise of the volatileJapanese currency. Sensitive to the exchange risk of yen loans, the governmenthas long tried to hold down borrowing from Japanese sources, but was obligedto reverse its stand in late 1998 because of the need for substantial funds tounderwrite its economic recovery programme. The subsequent slide in thevalue of the yen made the about-turn less painful. Much of Malaysia’s externaldebt is denominated in US dollars. However, since medium- and long-termdebt then comprised about two-thirds of total external debt, Malaysia’s debt-servicing burden was affected less acutely by the ringgit depreciation in 1997than, for example, that of neighbouring Thailand, which had a higherproportion of short-term, non-hedged, debt. (Reference table 24 sets out WorldBank data on debt, while Reference table 25 covers aid commitments.)
The selling of ringgit and stocks as the 1997 financial and economic crisisdeepened resulted in officially estimated net private short-term outflows ofM$12.9bn in 1997 and M$20.6bn in 1998—and the imposition of capitalcontrols. Underpinned by the fixing of the exchange rate at M$3.8:US$1, thecurbs were designed to quash speculation in the local currency and shares—and therefore targeted primarily at footloose short-term flows—as well as toencourage a further easing of monetary policy to jump-start the stalledeconomy. Although the government made clear that the repatriation of
Investment income deficitis substantial
International indebtednesshas been relatively low
Restrictions on moneyflows are relaxed

36 Malaysia
EIU Country Profile 2001 © The Economist Intelligence Unit Limited 2001
principal and profits from direct investments was unaffected by the curbs,many investors felt that any regime that restricted capital flows could welldisrupt such transfers. Net long-term capital inflows, having risen fromM$11.7bn in 1994 to M$16.6bn in 1995 and M$19.1bn in 1997, fell back toM$10.6bn in 1998, before edging up to M$12.6bn in 1999. Over the last twoyears the government has gradually relaxed the capital controls. Net long-termcapital inflows fell back to M$11.1bn in 2000, after the government in May2001 abolished a flat 10% exit tax on the repatriation of profits from portfolioinvestments held for less than one year, thus removing the last residualrestriction on foreign portfolio investors. Capital flows have also been affectedby concern about the overvaluation of the ringgit. Capital controls now existfor Malaysians only. But the ringgit’s peg with the US dollar remains andoffshore ringgit trade is still banned.
Foreign debt, 1999
Total debt (US$ bn) 45.9 % of GNP 62.5
Debt-service ratio (%) 4.8
Interest payments ratio (%) 2.3
Source: World Bank, World Debt Tables.
Foreign reserves and the exchange rate
The decline in international reserves in 1997 primarily reflected large outflowsof non-resident short-term capital and intervention to support the exchangerate of the ringgit. Foreign-exchange reserves fell from US$27bn at the end of1996 to a US$20.8bn a year later, equivalent to 3.4 months of retained imports,down from four months in 1996. Fuelled by a surge in the merchandise tradesurplus, reserves rose to US$25.6bn at end-1998 and US$30.6bn at end-1999but fell to US$29.5bn at end-2000, the equivalent of 4.5 months of imports.The decline during 2000 reflected speculation over a devaluation of the ringgit,as companies hesitated to repatriate export proceedings. Reserves have sincestabilised, in part because of increased overseas borrowing. (Reference table 26provides information on foreign reserves.)
Until September 1998, the international value of the ringgit was managed byBank Negara in relation to an international basket of currencies with, untilmid-1997, allowance made for some appreciation to reflect the underlyingstrength that it owed to Malaysia’s buoyant export performance and high rateof capital inflows. Following wide fluctuations in the value of the currencyduring 1993-94, Bank Negara imposed restrictions on non-resident holdings,most of which were dismantled from late 1994 onwards. During 1995 theringgit followed the yen’s decline against the US dollar. The ringgit tumbledheavily from mid-1997 as investor confidence in the region’s economies wasundermined, triggered by the floating of the Thai baht. The ringgit has beenpegged at M$3.8:US$1 since September 1998. Initially, large capital inflowsresulting from huge current-account surpluses and rising portfolio inflowsmeant that the ringgit was undervalued at this rate, which resulted in
Foreign reserves aresubstantial
Bank Negara andthe ringgit

Malaysia 37
© The Economist Intelligence Unit Limited 2001 EIU Country Profile 2001
sterilisation by the central bank in 1999 and 2000 to reduce upward pressureon the exchange rate. Later on, ringgit undervaluation turned intoovervaluation as the US dollar remained strong against most global currencies,causing many regional currencies to fall against the ringgit in line with South-east Asia’s worsening economic and political outlook. The ringgit peg looksvulnerable but the Japanese yen will probably be the decisive influence on itscontinuation. If the yen were to fall sharply against the US dollar, Bank Negarawould no longer be able to claim that the ringgit was close to fair value andMalaysia’s export-driven economy would be badly affected. (Reference table 27provides historical data on exchange rates.)
38 Malaysia
EIU Country Profile 2001 © The Economist Intelligence Unit Limited 2001
Appendices
Regional organisations
The Association of South-East Asian Nations was established in 1967.The five original members were Indonesia, Malaysia, the Philippines, Singaporeand Thailand. Subsequent joiners were Brunei (1984), Vietnam (1995), Laosand Myanmar (1997) and, most recently, Cambodia (1999).
ASEAN summit meetings, which bring together the heads of government ofmember states, must now be held every three years. The most recent was inBrunei in 2001. Informal summits of heads of governments are also held. Inaddition, members’ foreign and economic affairs ministers meet once a year.Joint meetings of foreign and economic affairs ministers are held before eachASEAN summit. There is also a Standing Committee (consisting of themembers’ accredited ambassadors to the host country), which usually meetsevery two months. There is a permanent secretariat, based in Jakarta,Indonesia, and a number of committees.
The organisation started with some grand objectives, but has generally failed todeliver. Early hopes that ASEAN could engineer a regional economicdevelopment strategy—with particular countries concentrating on particularindustries—were soon dashed. In 1977 the Basic Agreement on theEstablishment of ASEAN Preferential Tariffs was concluded, but a decade lateronly about 5% of trade between members was covered by this system.(Members had been permitted to exclude “sensitive” sectors, a let-out clausethat a subsequent agreement in 1987 only slightly curtailed.)
Plans for a proper ASEAN Free-Trade Area (AFTA) were unveiled in 1992,with the aim of achieving this by 2008. A common effective preferential tariff(CEPT) scheme was applied in 1993, providing for the gradual reduction oftariffs on intra-ASEAN trade in certain goods over a number of years. Again,however, member states could exclude “sensitive” items, limiting progress. Anew AFTA programme, with a wider spread of products covered, was launchedin 1994. During the mid-1990s the timescale for implementing the programmewas steadily tightened, with the aim being to reduce tariffs on most goods tobelow 5% by 2000, with a full AFTA achieved by 2003. (Recent joiners havebeen allowed more time.)
The 1997-98 regional financial crisis exposed ASEAN’s failings in a brutalfashion. The organisation was unable to stop the regional currencydevaluations, or alleviate the subsequent economic hardship. A Statement onBold Measures, released at end-1998, was exactly the opposite of what the titleimplied. Unfolding events in Indonesia then moved the focus on to theorganisation’s security plans. ASEAN members’ commitment to the principle ofnon-interference in the internal affairs of other members complicated theresponse to East Timor. (Some members did eventually participate in themultinational force, but not under ASEAN auspices.)
Association of South-EastAsian Nations (ASEAN)

Malaysia 39
© The Economist Intelligence Unit Limited 2001 EIU Country Profile 2001
On the economic front, ASEAN’s slow progress towards AFTA has encouragedone of its members, Singapore, to opt instead for bilateral trade pacts.Singapore’s bilateral trade agreement with New Zealand in 2000 promptedprotests from other ASEAN members, but the island state is pursuing similaragreements with other countries, including the US. (It is unlikely that thisapproach will prove universally applicable, as the absence of an agriculturalsector in Singapore makes it much easier for it to negotiate with tradingpartners with heavily protected primary sectors.) A decision in 2001 by variousASEAN members to set up bilateral currency-swap arrangements to protectagainst currency volatility is limited in scope, and does not presage furtherASEAN economic collaboration.
The organisation’s political hopes could be severely tested in the next fewyears. Changing governments in member countries could undermine anyremaining pretence about political consensus in the region. On the securityfront, the ASEAN Regional Forums (ARFs—which bring together theASEAN ministers of foreign affairs with those of other countries, notablyChina) are likely to remain just talking shops, with little impact on changinggeopolitical trends.
Sources of information
Bank Negara Malaysia, Annual Report, Kuala Lumpur
Bank Negara Malaysia, Monthly Statistical Bulletin, Kuala Lumpur
Department of Statistics, External Trade Summary, Kuala Lumpur
Department of Statistics, Survey of Manufacturing Industries, Kuala Lumpur
Department of Statistics, Yearbook of Statistics, Kuala Lumpur
Economic Planning Unit, Eighth Malaysia Five-Year Plan (2001-2005), KualaLumpur
Malaysian Industrial Development Agency (MIDA), Statistics on theManufacturing Sector, Kuala Lumpur
Ministry of Finance, Economic Report (annual), Kuala Lumpur
Bank Negara Malaysia (BNM, the central bank): www.bnm.gov.my
Department of Statistics: www.statistics.gov.my
National News Agency, Bernama: www.bernama.com
Economic Planning Agency: www.epu.jpm.my
Malaysian Civil Service Link: mcsl.mampu.gov.my
Bank for International Settlements, International Banking and Financial MarketDevelopments (quarterly)
IMF, International Financial Statistics (monthly), Washington, DC
International Institute for Strategic Studies, Military Balance (annual), London
National statistical sources
International statisticalsources
Internet home pages

40 Malaysia
EIU Country Profile 2001 © The Economist Intelligence Unit Limited 2001
OECD, Financial Statistics (monthly), Paris
OECD, Geographical Distribution of Financial Flows to Developing Countries(annual), Paris
UN, Monthly Bulletin of Statistics
UN, World Investment Report (annual)
World Bank, World Debt Tables (annual), Washington, DC
World Bank, World Development Report (annual), Washington, DC
H Crouch, Government and Society in Malaysia, Cornell University Press,Singapore, 1996
C de Ledesma and others, Malaysia, Singapore and Brunei: The Rough Guide,Penguin, Harmondsworth, 1995
K M Endicott, An Analysis of Malay Magic, Oxford University Press, Oxford,1991
E T Gomez, Political Business: Corporate Involvement of Malaysian Political Parties,James Cook University, Queensland, 1994
E T Gomez, Chinese Business in Malaysia: Accumulation, Accommodation andAscendance, London, 1999
E T Gomez and K S Jomo, Malaysia’s Political Economy: Politics, Patronage andProfits, Cambridge, 1997
Government of Malaysia, Information Malaysia Yearbook (annual), KualaLumpur
T N Harper, The End of Empire and the Making of Malaya, Cambridge, 1999
Hussin Mutalib, Islam in Malaysia: from Revivalism to Islamic State, Singapore,1993
K S Jomo, Growth and Structural Change in the Malaysian Economy, London, 1990
R Karim, Ceritalah: Malaysia in Transition, Times Books, Kuala Lumpur, 1996
B T Khoo, Paradoxes of Mahathirism, Oxford University Press, New York, 1995
M Mahathir, The Challenge, Pelanduk, Petaling Jaya, 1986
M Mahathir, The Malay Dilemma, Times Books, Singapore, 1970
V S Naipaul, Among the Believers, Penguin, Harmondsworth, 1982
R O’Hanlon, Into the Heart of Borneo, Salamander, Edinburgh, 1984
Select bibliography
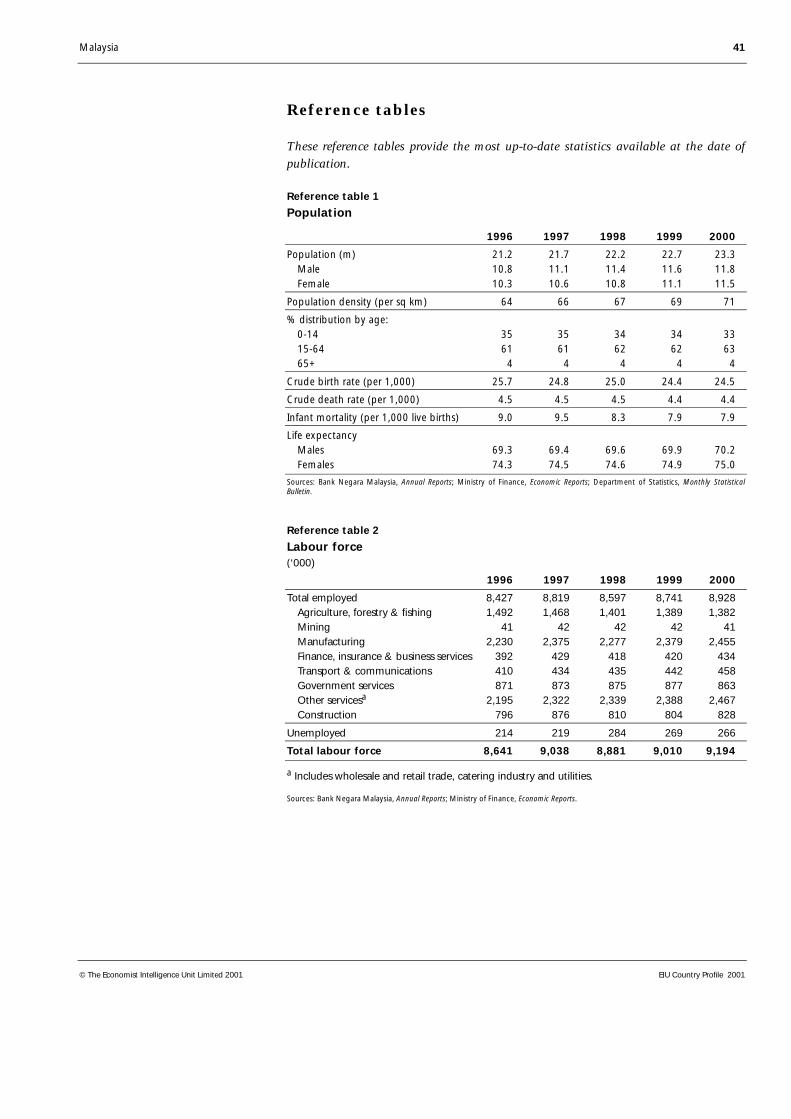
Malaysia 41
© The Economist Intelligence Unit Limited 2001 EIU Country Profile 2001
Reference tables
These reference tables provide the most up-to-date statistics available at the date ofpublication.
Reference table 1
Population
1996 1997 1998 1999 2000
Population (m) 21.2 21.7 22.2 22.7 23.3 Male 10.8 11.1 11.4 11.6 11.8 Female 10.3 10.6 10.8 11.1 11.5
Population density (per sq km) 64 66 67 69 71
% distribution by age: 0-14 35 35 34 34 33 15-64 61 61 62 62 63 65+ 4 4 4 4 4
Crude birth rate (per 1,000) 25.7 24.8 25.0 24.4 24.5
Crude death rate (per 1,000) 4.5 4.5 4.5 4.4 4.4
Infant mortality (per 1,000 live births) 9.0 9.5 8.3 7.9 7.9
Life expectancy Males 69.3 69.4 69.6 69.9 70.2 Females 74.3 74.5 74.6 74.9 75.0
Sources: Bank Negara Malaysia, Annual Reports; Ministry of Finance, Economic Reports; Department of Statistics, Monthly StatisticalBulletin.
Reference table 2
Labour force(‘000)
1996 1997 1998 1999 2000
Total employed 8,427 8,819 8,597 8,741 8,928 Agriculture, forestry & fishing 1,492 1,468 1,401 1,389 1,382 Mining 41 42 42 42 41 Manufacturing 2,230 2,375 2,277 2,379 2,455 Finance, insurance & business services 392 429 418 420 434 Transport & communications 410 434 435 442 458 Government services 871 873 875 877 863 Other servicesa 2,195 2,322 2,339 2,388 2,467 Construction 796 876 810 804 828
Unemployed 214 219 284 269 266
Total labour force 8,641 9,038 8,881 9,010 9,194
a Includes wholesale and retail trade, catering industry and utilities.
Sources: Bank Negara Malaysia, Annual Reports; Ministry of Finance, Economic Reports.
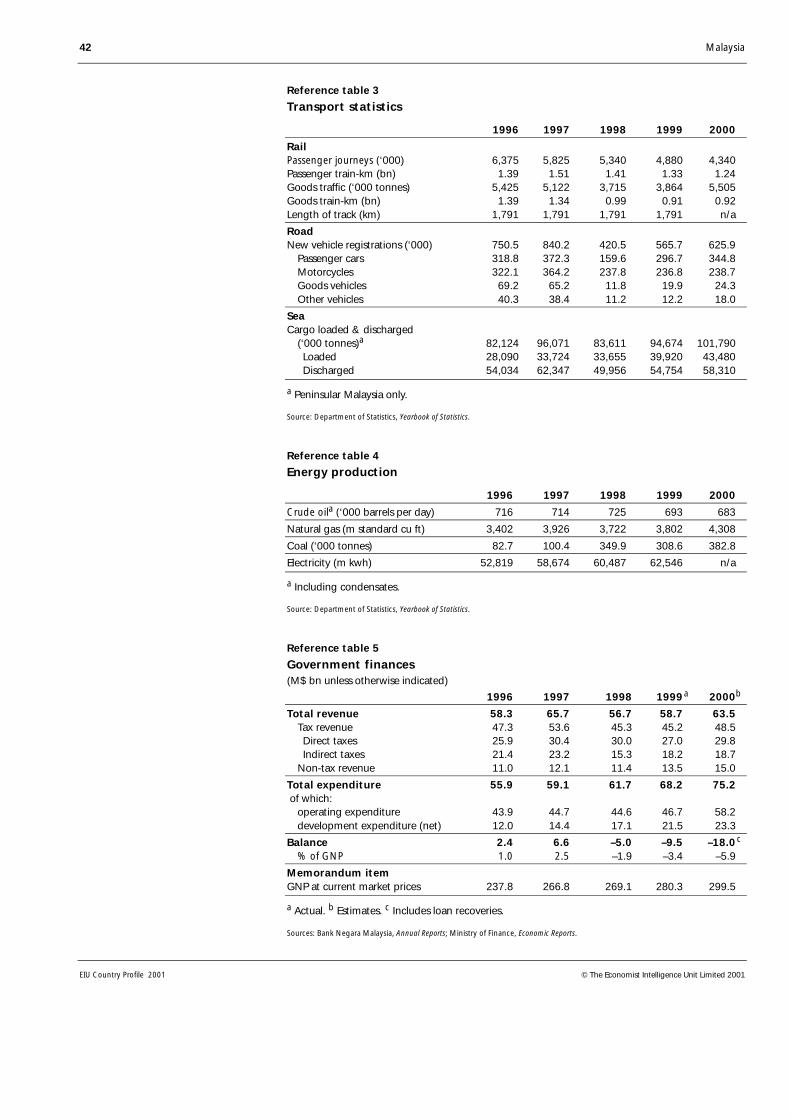
42 Malaysia
EIU Country Profile 2001 © The Economist Intelligence Unit Limited 2001
Reference table 3
Transport statistics
1996 1997 1998 1999 2000
RailPassenger journeys (‘000) 6,375 5,825 5,340 4,880 4,340Passenger train-km (bn) 1.39 1.51 1.41 1.33 1.24Goods traffic (‘000 tonnes) 5,425 5,122 3,715 3,864 5,505Goods train-km (bn) 1.39 1.34 0.99 0.91 0.92Length of track (km) 1,791 1,791 1,791 1,791 n/a
RoadNew vehicle registrations (‘000) 750.5 840.2 420.5 565.7 625.9 Passenger cars 318.8 372.3 159.6 296.7 344.8 Motorcycles 322.1 364.2 237.8 236.8 238.7 Goods vehicles 69.2 65.2 11.8 19.9 24.3 Other vehicles 40.3 38.4 11.2 12.2 18.0
SeaCargo loaded & discharged (‘000 tonnes)a 82,124 96,071 83,611 94,674 101,790 Loaded 28,090 33,724 33,655 39,920 43,480 Discharged 54,034 62,347 49,956 54,754 58,310
a Peninsular Malaysia only.
Source: Department of Statistics, Yearbook of Statistics.
Reference table 4
Energy production
1996 1997 1998 1999 2000
Crude oila (‘000 barrels per day) 716 714 725 693 683
Natural gas (m standard cu ft) 3,402 3,926 3,722 3,802 4,308
Coal (‘000 tonnes) 82.7 100.4 349.9 308.6 382.8
Electricity (m kwh) 52,819 58,674 60,487 62,546 n/a
a Including condensates.
Source: Department of Statistics, Yearbook of Statistics.
Reference table 5
Government finances(M$ bn unless otherwise indicated)
1996 1997 1998 1999a 2000b
Total revenue 58.3 65.7 56.7 58.7 63.5 Tax revenue 47.3 53.6 45.3 45.2 48.5 Direct taxes 25.9 30.4 30.0 27.0 29.8 Indirect taxes 21.4 23.2 15.3 18.2 18.7 Non-tax revenue 11.0 12.1 11.4 13.5 15.0
Total expenditure 55.9 59.1 61.7 68.2 75.2 of which: operating expenditure 43.9 44.7 44.6 46.7 58.2 development expenditure (net) 12.0 14.4 17.1 21.5 23.3
Balance 2.4 6.6 –5.0 –9.5 –18.0c
% of GNP 1.0 2.5 –1.9 –3.4 –5.9
Memorandum itemGNP at current market prices 237.8 266.8 269.1 280.3 299.5
a Actual. b Estimates. c Includes loan recoveries.
Sources: Bank Negara Malaysia, Annual Reports; Ministry of Finance, Economic Reports.

Malaysia 43
© The Economist Intelligence Unit Limited 2001 EIU Country Profile 2001
Reference table 6
Money supply(M$ m unless otherwise indicated; end-period)
1996 1997 1998 1999 2000
M1 60,585 63,365 54,135 72,447 78,216 % change 16.7 4.6 –14.6 33.8 8.0
M2 238,209 292,217 296,472 337,138 354,702 % change 19.8 22.7 1.5 13.7 5.2
M3 329,707 390,809 401,459 434,590 456,496 % change 21.2 18.5 2.7 8.3 5.0
Source: Bank Negara Malaysia, Monthly Statistical Bulletin.
Reference table 7
Interest rates(%; average rates at end-year)
1996 1997 1998 1999 2000
US$ 3-month commercial paper 5.4 5.6 5.4 5.2 6.3
3-month interbank 7.4 8.7 6.4 3.2 3.3
3-month government securities 6.4 6.8 5.3 2.7 2.9
Retail banking base lending 9.2 10.3 8.0 6.8 6.8
Retail banking savings deposits 4.1 4.2 3.9 2.8 2.7
Sources: Bank Negara Malaysia, Annual Reports; Monthly Statistical Bulletin; IMF, International Financial Statistics.
Reference table 8
Gross domestic product(M$ unless otherwise indicated)
1996 1997 1998 1999 2000
Total (bn)At current prices 253.7 281.9 283.2 300.3 340.7 US$ 100.9 100.2 72.3 78.9 89.3At constant 1987 prices 183.3 196.7 182.2 193.3 209.3 % change, year on year 10.0 7.3 –7.4 6.1 8.3
Per headAt current prices (US$) 4,758 4,618 3,257 3,608 3,848At constant 1987 prices 8,646 9,083 8,212 8,317 8,893 % change, year on year 7.4 5.1 –9.6 1.3 8.0
Sources: Bank Negara Malaysia, Annual Reports; Ministry of Finance, Economic Reports; EIU.
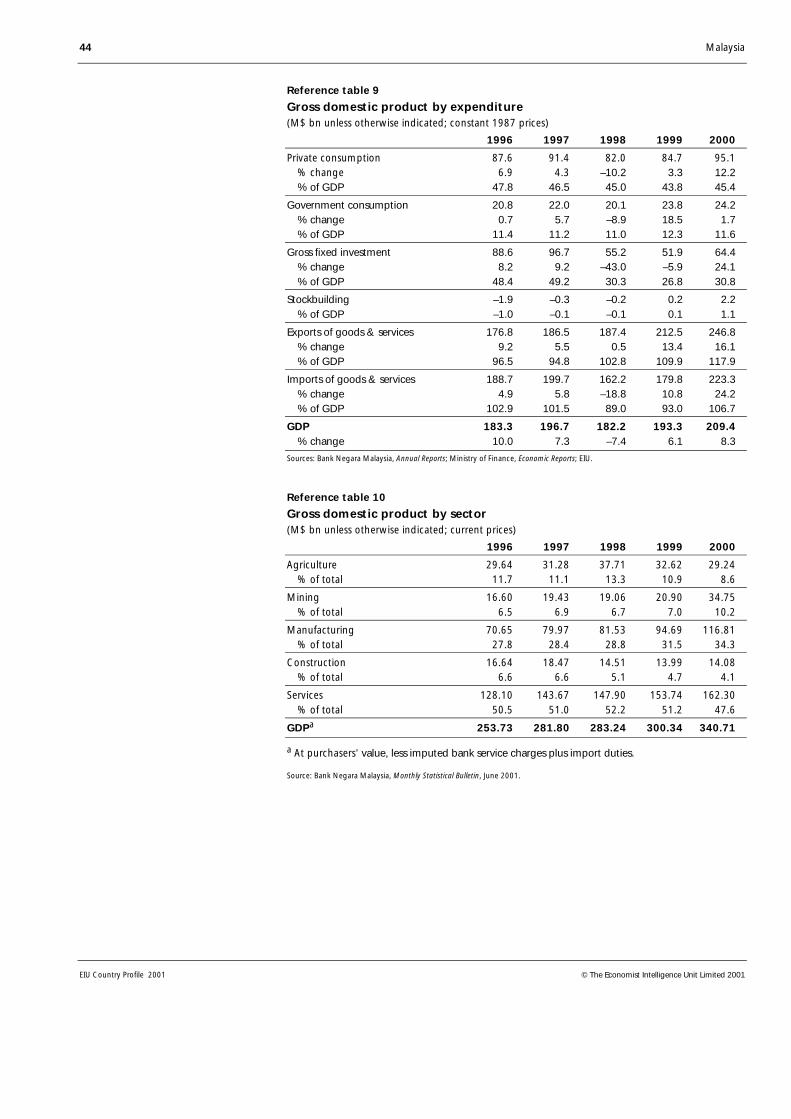
44 Malaysia
EIU Country Profile 2001 © The Economist Intelligence Unit Limited 2001
Reference table 9
Gross domestic product by expenditure(M$ bn unless otherwise indicated; constant 1987 prices)
1996 1997 1998 1999 2000
Private consumption 87.6 91.4 82.0 84.7 95.1 % change 6.9 4.3 –10.2 3.3 12.2 % of GDP 47.8 46.5 45.0 43.8 45.4
Government consumption 20.8 22.0 20.1 23.8 24.2 % change 0.7 5.7 –8.9 18.5 1.7 % of GDP 11.4 11.2 11.0 12.3 11.6
Gross fixed investment 88.6 96.7 55.2 51.9 64.4 % change 8.2 9.2 –43.0 –5.9 24.1 % of GDP 48.4 49.2 30.3 26.8 30.8
Stockbuilding –1.9 –0.3 –0.2 0.2 2.2 % of GDP –1.0 –0.1 –0.1 0.1 1.1
Exports of goods & services 176.8 186.5 187.4 212.5 246.8 % change 9.2 5.5 0.5 13.4 16.1 % of GDP 96.5 94.8 102.8 109.9 117.9
Imports of goods & services 188.7 199.7 162.2 179.8 223.3 % change 4.9 5.8 –18.8 10.8 24.2 % of GDP 102.9 101.5 89.0 93.0 106.7
GDP 183.3 196.7 182.2 193.3 209.4 % change 10.0 7.3 –7.4 6.1 8.3
Sources: Bank Negara Malaysia, Annual Reports; Ministry of Finance, Economic Reports; EIU.
Reference table 10
Gross domestic product by sector(M$ bn unless otherwise indicated; current prices)
1996 1997 1998 1999 2000
Agriculture 29.64 31.28 37.71 32.62 29.24 % of total 11.7 11.1 13.3 10.9 8.6
Mining 16.60 19.43 19.06 20.90 34.75 % of total 6.5 6.9 6.7 7.0 10.2
Manufacturing 70.65 79.97 81.53 94.69 116.81 % of total 27.8 28.4 28.8 31.5 34.3
Construction 16.64 18.47 14.51 13.99 14.08 % of total 6.6 6.6 5.1 4.7 4.1
Services 128.10 143.67 147.90 153.74 162.30 % of total 50.5 51.0 52.2 51.2 47.6
GDPa 253.73 281.80 283.24 300.34 340.71
a At purchasers’ value, less imputed bank service charges plus import duties.
Source: Bank Negara Malaysia, Monthly Statistical Bulletin, June 2001.

Malaysia 45
© The Economist Intelligence Unit Limited 2001 EIU Country Profile 2001
Reference table 11
Consumer price index(% change unless otherwise indicated)
% weightin CPI 1996 1997 1998 1999 2000
Overall CPI 100.0 3.5 2.7 5.3 2.8 1.6
Food 34.9 5.7 4.1 8.9 4.6 1.9
Beverages & tobacco 3.6 2.2 1.3 4.3 7.9 2.8
Clothing & footwear 3.6 –0.7 –0.5 0.4 –2.0 –1.7
Rent, fuel & power 21.1 3.2 3.2 4.4 1.6 1.5
Furniture & household items 5.6 1.1 0.1 3.9 1.3 0.0
Medical care 1.9 3.7 3.7 6.2 3.1 2.0
Transport & communication 17.9 1.4 0.6 –0.1 0.5 2.1
Recreation & education 5.8 3.3 0.4 3.3 2.6 0.5
Misc goods & services 5.6 2.5 4.6 7.1 1.5 0.9
IMF consumer price index (1995=100) 103.5 106.2 111.8 114.9 116.7 % change 3.5 2.6 5.3 2.8 1.6
Sources: Bank Negara Malaysia, Annual Report; IMF, International Financial Statistics.
Reference table 12
Agricultural and forestry production
1996 1997 1998 1999 2000
Palm oil (m tonnes) 8.4 9.1 8.3 10.6 10.8
Rubber (m tonnes) 1.1 1.0 0.9 0.8 0.6
Sawlogs (‘000 cu metres) 30,094 31,162 21,672 21,941 23,898
Cocoa (‘000 tonnes) 120 106 90 84 70
Source: Bank Negara Malaysia, Monthly Statistical Bulletin.
Reference table 13
Minerals production
1996 1997 1998 1999 2000
Crude oil (‘000 barrels/day) 716 714 725 693 683
Natural gas (m standard cu ft) 3,402 3,926 3,722 3,802 4,308
Bauxite (‘000 tonnes) 219 279 160 223 n/a
Copper (‘000 tonnes) 88 81 62 21 n/a
Tin (‘000 tonnes) 5.2 5.1 5.6 7.3 6.7
Iron ore (‘000 tonnes) 325 271 376 337 n/a
Sources: Bank Negara Malaysia, Annual Reports; Monthly Statistical Bulletin; Ministry of Finance, Economic Reports; Department ofStatistics, Yearbook of Statistics.

46 Malaysia
EIU Country Profile 2001 © The Economist Intelligence Unit Limited 2001
Reference table 14
Manufacturing production(% change, year on year)
1996 1997 1998 1999 2000
Chemicals 19.6 24.5 –1.8 17.1 15.1
Electrical products n/a –1.7 –14.8 2.7 28.7
Electronic products n/a 22.8 –4.2 21.2 44.8
Off-estate processing 10.3 9.8 –2.7 24.7 11.7
Food 4.4 3.8 –2.1 5.7 16.2
Non-metallic mineral products 24.5 10.1 –26.5 2.6 20.5
Wood products 11.4 –1.6 –11.3 –7.3 4.0
Textiles 0.0 5.3 –5.3 4.0 8.7
Tobacco products 7.5 19.9 –9.1 –15.5 75.3
Transport equipment 22.3 14.3 –52.2 53.5 19.1
Basic metals 17.1 13.1 –29.1 29.5 16.6
Rubber products 11.1 3.4 7.8 3.6 4.0
Metal products 12.0 11.9 –17.2 –1.1 33.8
Petroleum products 12.7 8.9 –11.5 –0.3 19.9
Beverages 15.5 –0.2 –11.9 –2.6 6.0
All manufacturing industries 12.3 12.4 –10.2 12.9 25.0
Source: Bank Negara Malaysia, Annual Report.
Reference table 15
Construction statistics(supply of new property in Kuala Lumpur & Selangor state)
Office Retail ApartmentsSq metres % occupancy Sq metres % occupancy No. of units
1996 296,742 95.5 136,964 92.8 14,568
1997 869,394 94.9 362,574 90.5 5,473
1998 873,346 79.8 395,328 59.5 14,151
1999 795,750 76.2 58,486 76.6 9,547
2000 (Jan-Sept) 732,701 75.4 239,039 78.8 n/a
Source: Bank Negara Malaysia, Annual Report.
Reference table 16
Stockmarket indicators
Kuala Lumpur Stock Exchange 1996 1997 1998 1999 2000
KLSE composite market index (Apr 4th 1986=100) 1,238 594 586 812 680
Value of shares traded (M$ bn) 463.3 408.6 115.2 185.3 244.1
Volume of shares traded (bn) 66.5 72.8 58.3 85.2 75.4
Market capitalisation (M$ bn) 807 376 375 553 444
No. of companies listed 621 708 736 757 795
Sources: Bank Negara Malaysia, Annual Report; Monthly Statistical Bulletin.

Malaysia 47
© The Economist Intelligence Unit Limited 2001 EIU Country Profile 2001
Reference table 17
Exports(M$ m; fob)
1996 1997 1998 1999 2000
Semiconductors 35,509 40,887 54,483 65,485 71,071
Electrical machinery & appliances 39,649 38,185 47,558 50,162 63,618
Electronic equipment & parts 29,123 39,889 59,692 79,400 95,737
Crude palm oil 9,436 10,810 17,779 14,475 9,948
Chemicals & chemical products 6,710 8,137 10,627 11,105 15,033
Textiles, clothing & footwear 6,963 7,616 9,361 9,467 10,388
Crude petroleum 7,212 7,069 7,509 9,306 14,241
Liquefied natural gas 4,746 6,485 5,981 6,349 11,300
Wood products 6,089 6,489 5,982 6,984 6,801
Manufactured metals 4,998 5,661 8,255 7,862 8,618
Transport equipment 4,658 4,959 8,064 5,114 2,894
Rubber products 3,586 3,959 5,739 5,061 4,740
Food, beverages & tobacco 5,299 6,050 7,124 5,554 5,729
Petroleum products 3,281 3,372 3,129 4,513 8,132
Rubber 3,509 2,971 2,829 2,344 2,571
Sawn timber 3,120 2,781 2,526 2,807 3,020
Sawn logs 2,282 2,346 1,866 2,663 2,489
Toys & sports goods 2,498 2,264 2,889 3,005 3,447
Scientific equipment 3,119 3,912 4,760 4,834 6,828
Total exports (incl others) 197,026 220,890 286,563 321,560 373,307
Source: Bank Negara Malaysia, Monthly Statistical Bulletin.
Reference table 18
Imports(M$ m; cif)
1996 1997 1998 1999 2000
Food, beverages & tobacco 9,586 10,745 11,111 11,555 12,102
Inedible crude materials 4,964 5,497 5,724 6,225 7,181
Mineral fuels 5,222 6,413 6,992 7,489 14,964
Animal fats & oils 263 494 1,041 1,056 604
Chemicals 13,331 15,379 16,275 18,790 22,542
Manufactured goods 26,452 28,279 25,059 28,467 32,979
Machinery & transport equipment 118,483 132,930 143,825 153,971 195,706
Miscellaneous manufactures 9,500 11,616 11,885 12,873 17,918
Total imports incl others 197,280 220,936 228,125 248,477 312,364
Sources: Ministry of Finance, Economic Report; Department of Statistics, Monthly Statistical Bulletin.

48 Malaysia
EIU Country Profile 2001 © The Economist Intelligence Unit Limited 2001
Reference table 19
Main traditional exports(‘000 tonnes unless otherwise indicated)
1996 1997 1998 1999 2000
Palm oil 7,324 7,609 7,513 8,964 8,863
Crude petroleum 17,494 15,872 18,013 17,725 16,672
Rubber 980 1,018 989 984 996
Sawn logs (‘000 cu metres) 6,985 6,396 5,418 6,738 6,484
Sawn timber (‘000 cu metres) 3,748 3,075 2,683 2,818 2,875
Tin 34 32 22 24 21
Source: Bank Negara Malaysia, Monthly Statistical Bulletin.
Reference table 20
Imports by category(M$ m)
1994 1995 1996 1997 1998
Consumption goods 25,319 27,623 28,089 31,700 31,105 of which: food 4,229 4,880 5,610 6307 6,665 consumer durables 5,554 5,743 5,100 5,964 4,975
Investment goods 63,150 78,776 78,907 93,567 87,349 of which: machinery 15,793 21,691 21,622 23,996 17,848 transport equipment 10,555 11,298 9,441 13,023 13,289 metal products 8,429 11,727 11,669 13,708 10,555
Intermediate goods 66,610 86,917 89,164 94,303 108,285 of which: manufacturing 55,820 75,108 75,451 79,210 93,098
Sources: Department of Statistics, External Trade Summary; Yearbook of Statistics.
Reference table 21
Main trading partners(M$ m)
1996 1997 1998 1999 2000
Exports to:US 35,822 41,124 62,130 70,391 76,584Singapore 40,290 44,352 48,689 53,106 68,592Japan 26,378 27,484 30,237 37,289 48,742Hong Kong 11,588 12,181 13,300 13,344 16,872Netherlands 5,848 8,700 13,437 16,233 15,612Taiwan 8,074 9,484 11,798 14,600 14,226Thailand 8,069 7,925 9,059 10,481 13,492South Korea 5,999 7,049 6,517 9,498 12,383UK 6,778 7,294 10,328 12,067 11,572China 4,734 5,257 7,764 8,808 11,506Total incl others 197,026 220,890 286,563 321,560 373,307
continued

Malaysia 49
© The Economist Intelligence Unit Limited 2001 EIU Country Profile 2001
1996 1997 1998 1999 2000
Imports from:Japan 48,398 48,498 44,855 51,803 65,860US 30,496 37,103 44,762 43,318 51,863Singapore 26,345 28,994 30,944 34,817 44,704Taiwan 9,823 10,575 11,647 13,259 17,521South Korea 10,235 11,352 13,126 12,974 13,921China 4,719 6,274 7,250 8,125 12,310Thailand 6,522 8,680 8,832 9,377 12,067Germany 8,435 9,715 9,019 7,703 9,276Indonesia 3,584 4,129 5,778 6,677 8,622Hong Kong 4,578 5,399 5,943 6,250 8,602Total incl others 197,280 220,936 228,125 248,477 312,364
Source: Bank Negara Malaysia, Annual Report.
Reference table 22
Balance of payments, IMF series(US$ m)
1995 1996 1997 1998 1999
Goods: exports fob 71,767 76,985 77,538 71,883 84,052
Goods: imports fob –71,871 –73,137 –74,029 –54,378 –61,404
Trade balance –103 3,848 3,510 17,505 22,648
Services: credit 11,602 15,136 15,727 11,517 11,919
Services: debit –14,981 –17,573 –18,297 –13,127 –14,736
Income: credit 2,623 2,693 2,485 1,542 2,003
Income: debit –6,767 –7,383 –7,851 –5,446 –7,500
Current transfers: credit 700 766 944 728 801
Current transfers: debit –1,717 –1,948 –2,453 –3,190 –2,529
Current-account balance –8,644 –4,461 –5,935 9,529 12,606
Direct investment in Malaysia 4,178 5,078 5,137 2,163 1,553
Inward portfolio investment –436 –268 –248 283 804
Other investment assets 1,015 4,134 –4,604 –5,269 –9,954
Other investment liabilities 2,885 533 1,912 272 978
Financial balance 7,643 9,477 2,198 –2,550 –6,619
Net errors & omissions –762 –2,502 –137 3,039 –1,275
Overall balance –1,763 2,513 –3,875 10,018 4,712
Financing (– indicates inflow)Movement of reserves 1,763 –2,513 3,875 –10,018 –4,712Use of IMF credit & loans 0 0 0 0 0
Source: IMF, International Financial Statistics.

50 Malaysia
EIU Country Profile 2001 © The Economist Intelligence Unit Limited 2001
Reference table 23
Balance of payments, national series(M$ bn)
1996 1997 1998 1999 2000
Merchandise exports fob 193.1 217.7 281.7 318.9 373.2
Merchandise imports fob –183.0 –207.4 –212.5 –232.4 –293.2
Trade balance 10.1 10.3 69.2 86.5 79.9
Services balance –18.4 –22.8 –22.2 –32.1 –40.6
Net current transfers –2.9 –4.1 –9.6 –6.5 –7.5
Current-account balance –11.2 –16.7 37.4 47.9 31.9
Official long-term capital (net) 0.7 4.6 2.1 6.7 3.9
Private long-term capital (net) 12.8 14.5 8.5 5.9 7.1
Long-term capital (net) 13.5 19.1 10.6 12.6 11.1
Basic balance 2.3 2.3 48.0 60.5 43.0
Private short-term capital (net) 10.3 –12.9 –20.6 –37.8 –34.9
Net errors & omissions –6.4 –0.3 12.9 –4.9 –11.8
Overall balance 6.2 –10.9 40.3 17.8 –3.7
a Official estimates.
Sources: Bank Negara Malaysia, Annual Report.
Reference table 24
External debt, World Bank series(US$ m unless otherwise indicated; debt stocks at year-end)
1995 1996 1997 1998 1999
Public medium- & long-term 16,023 15,702 16,808 18,158 18,929
Private medium- & long-term 11,046 12,903 15,482 17,959 19,460
Total medium- & long-term debt 27,069 28,605 32,289 36,117 38,389 Official creditors 5,490 4,205 3,983 4,505 4,588 Bilateral 3,846 2,802 2,755 3,021 3,150 Multilateral 1,644 1,404 1,228 1,484 1,438 Private creditors 21,579 24,400 28,306 31,612 33,801
Short-term debt 7,274 11,068 14,939 8,656 7,550 of which: interest arrears 0 0 0 0 0
Use of IMF credit 0 0 0 0 0
Total external debt 34,343 39,673 47,228 44,773 45,939
Principal repayments 4,450 6,343 4,276 3,802 2,486
Interest payments 1,591 2,084 2,833 2,469 2,209 of which: short-term debt 441 652 1,245 656 405
Total debt service 6,041 8,427 7,109 6,271 4,695
Ratios (%)Total external debt/GDP 41.3 42.0 50.5 65.3 62.5Debt-service ratio, paida 7.0 9.0 7.5 8.7 4.8
Note. Long-term debt is defined as having original maturity of more than one year. a Debt service as a percentage of earnings from exports ofgoods and services.
Source: World Bank, Global Development Finance.

Malaysia 51
© The Economist Intelligence Unit Limited 2001 EIU Country Profile 2001
Reference table 25
Official development assistance(US$ m)
1995 1996 1997 1998 1999
Bilateral 4,192.0 4,488.7 2,236.3 –994.3 1,310.3 of which: Japan 987.8 209.4 1,046.5 164.1 264.5 UK –113.9 259.7 236.0 –546.0 368.2 US 2,700.0 3,115.0 1,123.0 –345.0 645.0
Multilateral –113.0 –93.3 –46.5 213.3 –80.3
Total (incl others) 4,072.9 4,389.1 2,183.6 –781.1 1,227.4 of which: grants 131.6 107.1 93.8 95.0 99.8
Source: OECD, Geographical Distribution of Financial Flows to Aid Recipients.
Reference table 26
Foreign reserves(US$ m; end-period unless otherwise indicated)
1996 1997 1998 1999 2000
Foreign exchange 26,156 20,013 24,728 29,670 28,625
SDRs 166 175 205 83 105
Reserve position at the IMF 688 600 626 835 792
Total reserves excl gold 27,009 20,788 25,559 30,588 29,523
Gold (national valuation) 120 111 116 57 53
Total reserves incl gold 27,129 20,899 25,675 30,645 29,576
Memorandum itemGold (m troy oz) 2.39 2.35 2.35 1.18 1.17
Source: IMF, International Financial Statistics.
Reference table 27
Exchange rates(M$ per unit of currency unless otherwise indicated; period averages)
1996 1997 1998 1999 2000
US$ 2.5159 2.8132 3.9244 3.8000 3.8000
¥100 2.3143 2.3216 3.0040 3.4002 3.5272
S$ 1.7843 1.8856 2.3434 2.2402 2.2046
£ 3.9290 4.6134 6.4955 6.1335 5.7637
DM 1.6731 1.6217 2.2307 2.1242 1.7959
Swfr 2.0355 1.9421 2.7082 2.5891 2.2538
SDR 3.6526 3.8649 5.3188 5.2058 5.0125
Nominal effective exchange-rate index (1994=100) 103.1 100.3 77.1 77.1 82.3
Sources: Bank Negara Malaysia, Monthly Statistical Bulletin; IMF, International Financial Statistics.
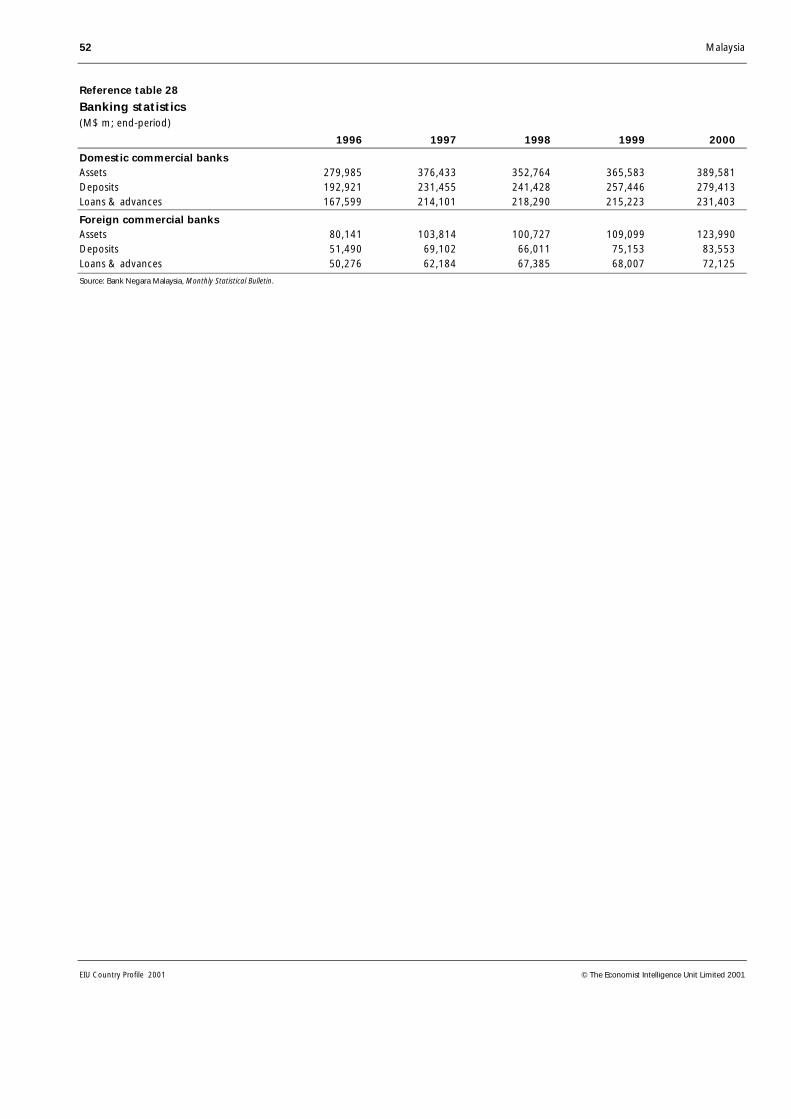
52 Malaysia
EIU Country Profile 2001 © The Economist Intelligence Unit Limited 2001
Reference table 28
Banking statistics(M$ m; end-period)
1996 1997 1998 1999 2000
Domestic commercial banksAssets 279,985 376,433 352,764 365,583 389,581Deposits 192,921 231,455 241,428 257,446 279,413Loans & advances 167,599 214,101 218,290 215,223 231,403
Foreign commercial banksAssets 80,141 103,814 100,727 109,099 123,990Deposits 51,490 69,102 66,011 75,153 83,553Loans & advances 50,276 62,184 67,385 68,007 72,125
Source: Bank Negara Malaysia, Monthly Statistical Bulletin.
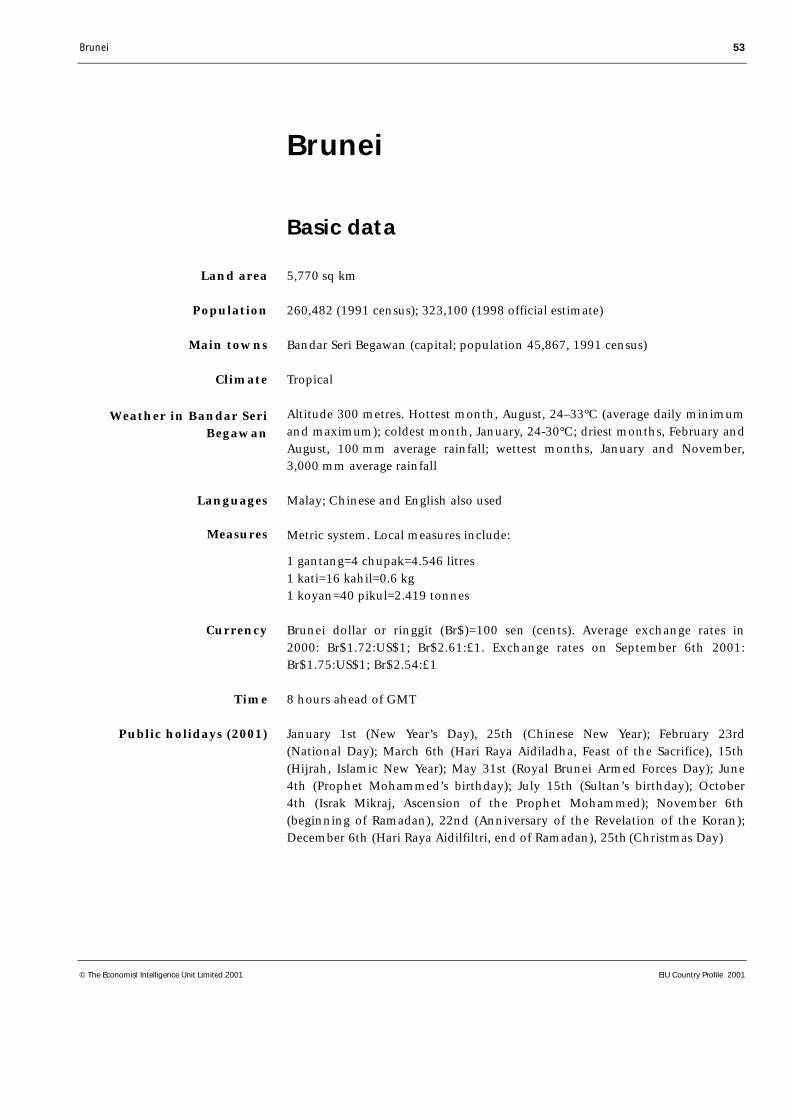
Brunei 53
© The Economist Intelligence Unit Limited 2001 EIU Country Profile 2001
Brunei
Basic data
5,770 sq km
260,482 (1991 census); 323,100 (1998 official estimate)
Bandar Seri Begawan (capital; population 45,867, 1991 census)
Tropical
Altitude 300 metres. Hottest month, August, 24–33°C (average daily minimumand maximum); coldest month, January, 24-30°C; driest months, February andAugust, 100 mm average rainfall; wettest months, January and November,3,000 mm average rainfall
Malay; Chinese and English also used
Metric system. Local measures include:
1 gantang=4 chupak=4.546 litres1 kati=16 kahil=0.6 kg1 koyan=40 pikul=2.419 tonnes
Brunei dollar or ringgit (Br$)=100 sen (cents). Average exchange rates in2000: Br$1.72:US$1; Br$2.61:£1. Exchange rates on September 6th 2001:Br$1.75:US$1; Br$2.54:£1
8 hours ahead of GMT
January 1st (New Year’s Day), 25th (Chinese New Year); February 23rd(National Day); March 6th (Hari Raya Aidiladha, Feast of the Sacrifice), 15th(Hijrah, Islamic New Year); May 31st (Royal Brunei Armed Forces Day); June4th (Prophet Mohammed’s birthday); July 15th (Sultan’s birthday); October4th (Israk Mikraj, Ascension of the Prophet Mohammed); November 6th(beginning of Ramadan), 22nd (Anniversary of the Revelation of the Koran);December 6th (Hari Raya Aidilfiltri, end of Ramadan), 25th (Christmas Day)
Land area
Population
Main towns
Climate
Weather in Bandar SeriBegawan
Languages
Measures
Currency
Time
Public holidays (2001)

54 Brunei
EIU Country Profile 2001 © The Economist Intelligence Unit Limited 2001
Political background
Brunei Darussalam, or Brunei Abode of Peace, is a small autocratic sultanatelocated on the north-west coast of Borneo. It is surrounded by the EastMalaysian state of Sarawak; and the Malaysia’s Sabah and Indonesia’sKalimantan are close neighbours. The sultan, Paduka Seri Baginda Sultan HajiHassanal Bolkiah Mu’izzaddin Waddaulah, is also prime minister, minister offinance and minister of defence. There is a hereditary aristocracy. There are fewchecks on excessive executive power. Brunei’s oil and gas industry has madethis small state one of the richest in the world.
Historical background
The Brunei sultanate rose to prominence in the 15th and 16th centuries, whenit controlled coastal areas of north-west Borneo, parts of Kalimantan and alsothe southern Philippines. The onset of European colonialism signalled thebeginning of a long period of decline. In the 19th century internal strifehastened Brunei’s decline and most of its remaining Borneo territory was lostto James Brooke, the so-called White Rajah of Sarawak, who had acquiredSarawak in 1841. Fearing absorption by Sarawak, Brunei voluntarily became aBritish protectorate in 1888. The Limbang district was lost to Sarawak in 1890,splitting the country into two. In 1906 a treaty was signed between the UK andBrunei, making Brunei a full protectorate. In 1929 oil was discovered in Seria.Oil and gas continue to be the basis of Brunei’s wealth.
The present sultan’s father, Omar Ali Saifuddien, who ascended the throne in1950, was keen to maintain a separate Brunei identity and to control its oilwealth, and resisted British proposals to merge Brunei with Sarawak and BritishNorth Borneo (Sabah). In 1959 a written constitution was introduced givingBrunei internal self-rule under British protection. Elections for a LegislativeCouncil were held in 1962, when the Parti Rakyat Brunei (Brunei People’sParty, or PRB) won a landslide victory. When the PRB was prevented fromforming a government, it staged an armed rebellion, which was suppressed byGurkha units of the British army. The state of emergency which was declaredhas since been renewed every two years. In October 1967 Sultan Omar AliSaifuddien was succeeded by his eldest son, Hassanal Bolkiah, who is thepresent sultan. Brunei became a fully independent, sovereign state onJanuary 1st 1984.
Constitution, institutions and administration
The constitution of Brunei Darussalam states that the sultan is head of statewith full executive authority, assisted and advised by five councils: theReligious Council, the Privy Council, the Council of Ministers (the cabinet),the Legislative Council and the Council of Succession. The Religious Council isresponsible for advising the sultan on matters relating to Islam; the PrivyCouncil on the award of honours; and the Council of Succession determines
Colonialism and decline
Moves to independence
The sultan rules byemergency decree

Brunei 55
© The Economist Intelligence Unit Limited 2001 EIU Country Profile 2001
the succession to the throne in the event of a dispute. The Legislative Council,initially to be a part-elected body, became a solely appointed body after theabortive rebellion in 1962, and in 1984 it was suspended. The sultan has sinceruled by emergency decree. The Council of Ministers became the cabinet in1984. The sultan is prime minister, finance minister and minister of defence.His brother, Prince Mohamed Bolkiah, is minister of foreign affairs.
The sultan and government do not see any place for liberal democracy inBrunei. It is argued that people’s concerns and views can be voiced throughofficials at the local level. In February 1993 the Mukim (district) and Kampong(village) Consultative Council was established. The council’s first generalassembly was held in May 1996. These elected officials are seen as the mostappropriate means of consultation between government and people. In 2000the government instructed the Public Service Institute to train district andvillage heads in leadership skills, which suggests that the government is keento develop this method of governance. The only registered political party, theParti Perpaduan Kebangsaan Brunei (the Brunei National Solidarity Party, orPPKB), has had a higher profile since 1999, but consultative councils willcontinue to be considered the most appropriate model for consultationbetween the people and the government.
With the Legislative Council suspended and political parties proscribed, thesultan and his government espouse a national ideology, Melayu Islam Beraja(Malay Islamic Monarchy, or MIB), which seeks to justify absolute monarchyby invoking Brunei’s history and Islam in support of the sultanate. MIB, afusion of Islamic values and Brunei Malay culture, presided over by the sultanas the defender of race and faith, has become the touchstone of loyalty. In thesmall, hierarchical society of Brunei it is not acceptable for any Malay toquestion any aspect of MIB, whether it be the pre-eminence of the Malays inBrunei, the piety and authority of the sultan, or the “Islamisation” of govern-ment policy and of society at large.
Political forces
Political activity and criticism of the system have been deterred by the absenceof elections, the banning of the PRB, the state of emergency, media controlsand censorship, the influence of MIB, and cultural and religious values.Political parties—the few that exist—lead a perilous existence. The PartiKebangsaan Demokratik Brunei (Brunei National Democratic Party, or PKDB)emerged in 1985 but was banned in 1988 and its leaders imprisoned when itcalled for free elections and an end to emergency rule. The PPKB, which splitoff from the PKDB, was more closely allied with the government, but itsactivities are circumscribed and the party has little influence. It has only about50 members and is rumoured to be subject to internal dissent.
A political backlash against the sultan’s absolute rule had seemed a growingpossibility in 2000, when falling standards of living coupled with publicityabout the lavish lifestyles of members of the royal family, especially thescandal-ridden prince Jefri, led many Bruneians to criticise the government
The national ideology
Political parties lead aperilous existence
Royal scandals and theeconomy raise dissent

56 Brunei
EIU Country Profile 2001 © The Economist Intelligence Unit Limited 2001
openly. However, high prices for oil and natural gas exports—almost the solesource of government funding—facilitated a return to a policy of extensivegovernment subsidies, delayed the planned scaling back of the extensive socialwelfare programmes and reduced the incentive to restructure the economy.However, many school leavers, who traditionally would have found work inthe large government bureaucracy, have been unable to find a job. A decline inoil and gas revenue could increase unemployment and raise the level ofpopular dissatisfaction with the government.
The ethnic Chinese minority, which numbers between 60,000 and 70,000 (thegovernment underestimates the actual figure), has considerable economicinfluence and expertise, but plays a negligible role in politics. The MIB focusesexclusively on the Malay community, adding to the existing discriminationagainst the Chinese and other non-Muslims. Workers from the Indian sub-continent and the Philippines, while important to the economy, are alsotargets for resentment. Indigenous groups, although recognised as such, tendto remain on the fringes of society unless they convert to Islam and intermarrywith Malays.
Brunei remains a conservative, orthodox religious backwater, yet the Islamicresurgence, most noticeable in the urban areas of Muslim South-east Asia, hashad some impact. The sultan has become noticeably more pious since the late1980s. The government has adopted more Islamic policies under the umbrellaof MIB. True Islam is presented as synonymous with the rule of the sultan. AnyIslamic teaching that runs counter to the status quo, or any criticism of thesultan, of the national ideology, MIB, or of the country is forbidden. The sultanand other government officials regularly warn the population to be wary ofsuch thinking or action, which it portrays as deviationist and an attack uponIslam. Notwithstanding these warnings, groups espousing alternative, and insome cases militant, Islamic thinking continue to take root and clearly enjoy ameasure of popular support.
The collapse of the Amedeo group of companies in 1998 and the exposure ofmismanagement in the Brunei Investment Agency (BIA) during 2000 were amajor blow to public confidence in the government. The sultan was largelysuccessful in escaping any guilt-by-association and emerged as a concernedruler who was willing to put the common good of the country above loyalty tohis brother, continuing to stress the need for honesty and sincerity ingovernment. Government ministers have pledged more openness andtransparency in government, although the nature of Malay society, the cultureof secrecy in government and the nature of public-sector bureaucracy militateagainst such openness and there are few signs of change. It is unclear whetherthe government intends to respond positively to the undercurrents of criticismand discontent, or whether it will merely reiterate the formula of increasedreliance on Islam as a solution to social problems.
Minorities play a negligiblerole in politics
The Islamic resurgence hashad some impact
The Amedeo collapse erodespublic confidence
Brunei 57
© The Economist Intelligence Unit Limited 2001 EIU Country Profile 2001
Key political figures
Sultan Hassanal Bolkiah: Sultan, Prime Minister, defence and financeminister. The sultan received his early education in Brunei Darussalam andKuala Lumpur, Malaysia, and trained as an officer at the Royal MilitaryAcademy, Sandhurst, UK, in 1966-67. He became crown prince in 1961 at theage of 15 and was installed as sultan on October 5th 1967. The sultan is said tobe one of the world’s richest men.
Prince Mohamed Bolkiah: Minister of foreign affairs and brother of thesultan. He received his early education in Brunei Darussalam and KualaLumpur, Malaysia, and trained as an officer at Sandhurst in 1965-67.
Prince Jefri Bolkiah: Youngest brother of the sultan, former financeminister and head of the Brunei Investment Agency. Prince Jefri is known forhis extravagant, playboy style of living, and was to be the next sultan of Bruneiuntil it was discovered that he had embezzled US$14.8bn from the governmentthrough his flagship company, Amedeo Development Corporation, whichcollapsed in 1998.
International relations and defence
Brunei is a member of the UN, the Organisation of the Islamic Conference andthe Non-aligned Movement. Of particular importance is its membership of theAssociation of South-East Asian Nations (ASEAN), which the country joined in1984 at independence. ASEAN provides Brunei with a framework for dealingwith affairs in the region and worldwide, and membership has helped toimprove relations between Brunei and its fellow members, Malaysia andIndonesia. Brunei lays claim to part of the South China Sea, as do several of itspartners in ASEAN, and China and Taiwan. In November 2000 Brunei hostedthe summit meeting of the Asia-Pacific Economic Co-operation (APEC) forum.
In 1991 the Royal Brunei Armed Forces (RBAF) were reorganised into fiveseparate services: land, navy and air forces, the armed forces services and thearmed forces training centre. In 1998 the army numbered 3,900, the navy 700and the air force 400. A large proportion of the defence budget is spent onacquiring military hardware although some orders have been suspendedrecently. Expansion of the armed forces is limited more by a lack of volunteersthan by a lack of funds.
The RBAF is not a threat to the government. However, the sultan prefers toentrust his personal security and that of the arsenal of the RBAF to his GurkhaReserve Unit (the GRU, totalling more than 2,300 personnel), whose presence,along with that of the British Gurkhas (800 Gurkhas and 200 UK support forcesbased in Seria to protect the oil facilities), lessens the chance of the RBAF turningagainst the sultan. Brunei pays for the GRU, which is led by retired Britishofficers, and provides substantial financial support for the maintenance of theBritish forces. The UK uses jungle training facilities in Temburong district, andparticipates in joint military exercises with Brunei. Brunei has also had defenceties with Singapore since the 1970s and Singaporean troops train in Brunei.
The importance of ASEAN
The armed forces anddefence links
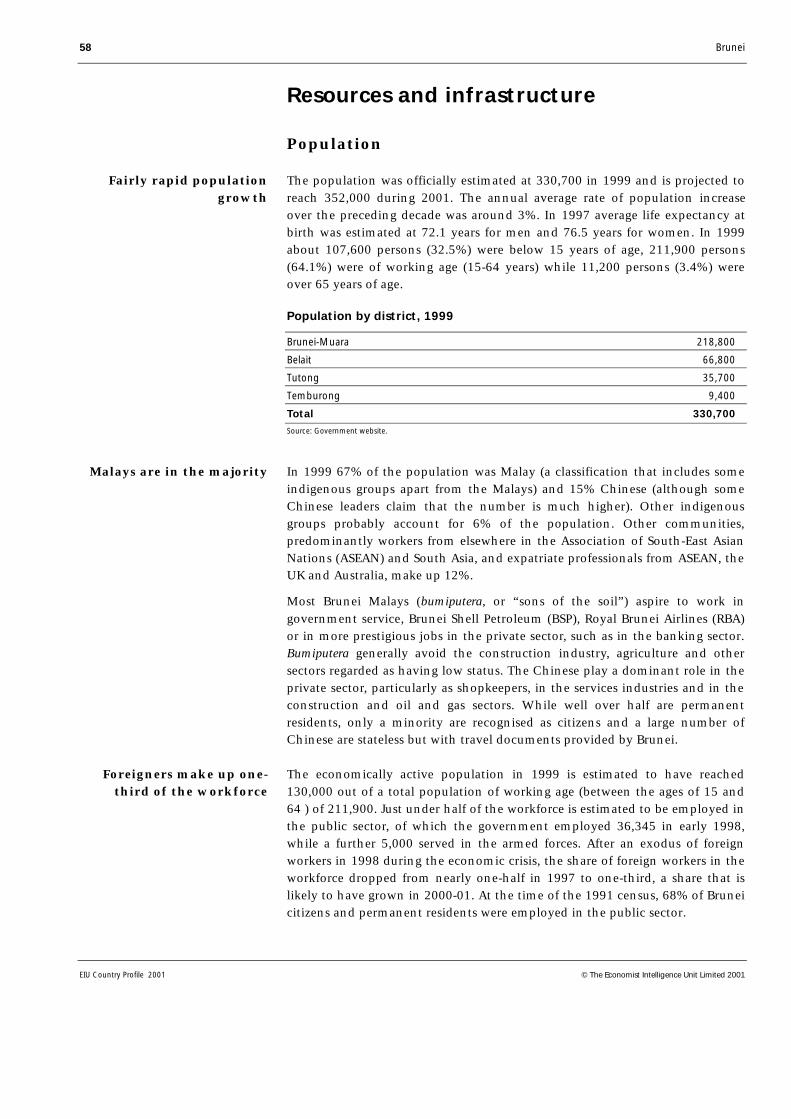
58 Brunei
EIU Country Profile 2001 © The Economist Intelligence Unit Limited 2001
Resources and infrastructure
Population
The population was officially estimated at 330,700 in 1999 and is projected toreach 352,000 during 2001. The annual average rate of population increaseover the preceding decade was around 3%. In 1997 average life expectancy atbirth was estimated at 72.1 years for men and 76.5 years for women. In 1999about 107,600 persons (32.5%) were below 15 years of age, 211,900 persons(64.1%) were of working age (15-64 years) while 11,200 persons (3.4%) wereover 65 years of age.
Population by district, 1999
Brunei-Muara 218,800
Belait 66,800
Tutong 35,700
Temburong 9,400
Total 330,700
Source: Government website.
In 1999 67% of the population was Malay (a classification that includes someindigenous groups apart from the Malays) and 15% Chinese (although someChinese leaders claim that the number is much higher). Other indigenousgroups probably account for 6% of the population. Other communities,predominantly workers from elsewhere in the Association of South-East AsianNations (ASEAN) and South Asia, and expatriate professionals from ASEAN, theUK and Australia, make up 12%.
Most Brunei Malays (bumiputera, or “sons of the soil”) aspire to work ingovernment service, Brunei Shell Petroleum (BSP), Royal Brunei Airlines (RBA)or in more prestigious jobs in the private sector, such as in the banking sector.Bumiputera generally avoid the construction industry, agriculture and othersectors regarded as having low status. The Chinese play a dominant role in theprivate sector, particularly as shopkeepers, in the services industries and in theconstruction and oil and gas sectors. While well over half are permanentresidents, only a minority are recognised as citizens and a large number ofChinese are stateless but with travel documents provided by Brunei.
The economically active population in 1999 is estimated to have reached130,000 out of a total population of working age (between the ages of 15 and64 ) of 211,900. Just under half of the workforce is estimated to be employed inthe public sector, of which the government employed 36,345 in early 1998,while a further 5,000 served in the armed forces. After an exodus of foreignworkers in 1998 during the economic crisis, the share of foreign workers in theworkforce dropped from nearly one-half in 1997 to one-third, a share that islikely to have grown in 2000-01. At the time of the 1991 census, 68% of Bruneicitizens and permanent residents were employed in the public sector.
Foreigners make up one-third of the workforce
Malays are in the majority
Fairly rapid populationgrowth
Brunei 59
© The Economist Intelligence Unit Limited 2001 EIU Country Profile 2001
Education and health
In 1999 there were 147 government schools and 60 non-government or privateschools. In 1995 55,241 children were in pre-primary and primary educationand 27,801 in secondary education, taught by around 5,540 teachers, many ofwhom were expatriates. The literacy rate (of those nine years of age and over)stood at 89.2% in 1991.
The medium of instruction at the secondary and tertiary level is mainlyEnglish, although English language skills in Brunei vary widely. There havebeen attempts to modernise the curriculum and teaching methods; currentmethods of instruction (which emphasise rote learning) do not appear to fostercreative and critical thinking skills among students.
The two main tertiary institutions are the Universiti Brunei Darussalam (UBD)and the Institut Teknologi Brunei (ITB). Many Bruneians, however, prefer tosend their children to the UK and Australia for secondary and universityeducation and the government provides scholarships for this.
Medical and dental services were, until recently, provided free to Bruneicitizens and to those employed in government service and their dependants.Since 1995 a nominal fee has been charged for hospital and dental visits. Thereare nine doctors for every 10,000 inhabitants. The central referral hospital isthe 552-bed Raja Isteri Pengiran Anak Saleha (RIPAS) Hospital in Bandar SeriBegawan. There are government hospitals in Kuala Belait, Bangar, and Tutong.Brunei Shell Petroleum has a 91-bed hospital at Seria. Total available hospitalbeds stood at 880 in 1999. Community-based outpatient services are providedin health clinics and health centres throughout the country, as well as bytravelling health clinics. For medical care not available in Brunei, citizens aresent overseas, usually to Singapore, at government expense. There is a shortageof doctors and medical staff—some Bruneians sent abroad to qualify arereluctant to return to practice at home.
Natural resources and the environment
Brunei comprises two sections, which are separated by the Limbang Rivervalley, which is part of Malaysia’s Sarawak. The larger, western part of thecountry consists of the three districts of Brunei-Muara, including the capitalBandar Seri Begawan, Tutong and Belait. The eastern part of Brunei, theTemburong district, is sparsely populated and predominantly forested. Brunei’s161-km coastline faces the South China Sea. The population is concentratedalong the coast; about three-quarters of the land area is forest.
Brunei has a high rainfall level and water is in plentiful supply. Poormaintenance of the water infrastructure results in heavy losses owing toleakage and the occasional interruption of supply. Large parts of the interiorare designated either as national park or as protected forest; logging isrestricted. There is concern about large-scale development along the coast.High-quality silica sands on the coast could be used in glass manufacture buthave not so far been exploited.
English language skillsvary widely
Nominal charges forhealthcare
Brunei is geographicallydivided

60 Brunei
EIU Country Profile 2001 © The Economist Intelligence Unit Limited 2001
Transport, communications and the Internet
There is continuing development of the road network, which totalled2,525 km in 1998. In the Seventh National Development Plan (1996-2000)Br$700m (US$406m at the 2000 average exchange rate of Br$1.724:US$1) wasallocated to road building to alleviate traffic congestion.
The level of private car ownership is high, encouraged by interest-free govern-ment car loans for civil servants, subsidised motor fuel, low road tax and thepoor state of public transport. Car sales dropped substantially during theeconomic crisis in 1997 but began to pick up again towards the end of 2000.
Since 1996 there have been attempts to improve public transport by expandingtaxi and bus services serving Bandar Seri Begawan and its environs and thereare now six routes in the district. Bus services to other districts are infrequentand irregular. There are no railways in Brunei.
The main port is Muara, 27 km from the capital. In 1995 nearly 2m tonnes offreight were discharged at the port, 50% of it originating from Singapore.Under a 25-year agreement, the Port of Singapore Authority, in a joint venturewith a local company, began to manage the container terminal at Muara in2000 and has already nearly doubled productivity. Bandar Seri Begawan port isprimarily used by passenger vessels serving the Brunei River and Temburongdistrict and the nearby Malaysian ports of Limbang and Lawas. Labuan andKota Kinabalu in Malaysia are now served by passenger ferries departing fromthe Serasa ferry terminal opened at Muara port in 1997. More than 20,000passengers per month use the ferry terminal.
Brunei International Airport at Bandar Seri Begawan is designed to handle1.5m passengers and 50,000 tonnes of cargo a year, and is being expanded.Royal Brunei Airlines (RBA) serves 22 destinations in Asia, Australia, theMiddle East and Europe, including several short-haul destinations to EastMalaysia and Indonesia. RBA has a fleet of eight Boeing 767-300ERs and twoBoeing 757-200s.
Jabatan Telekom Brunei (JTB, or Brunei Telecoms Department) is the mainprovider of telecommunications services in Brunei. A private company,DSTCom, provides cellular mobile services. The government is preparing for theprivatisation of some sections of JTB. Brunei has been connected to the Internetsince September 1995 through BruNet, a subsidiary of JTB. After complaintsabout poor service and slow connections, a second, independent InternetService Provider was licensed in 2000. BruNet has cut prices and has beeninvesting in upgraded services, including introducing an Asymmetric DigitalSubscriber Line (ASDL) in March 2000, which will speed up Internet access.
The government publishes the Government Gazette with legal information. ThePelita Brunei is a weekly Malay-language news sheet/court circular, published bythe government. There is a Brunei Darussalam Newsletter, which is publishedevery fortnight in English by the government’s Information Department,which also publishes a Daily News Digest. There is a weekly Malay-language
Roads and motor transport
Ports and shipping
Air transport
Telecommunications
Media

Brunei 61
© The Economist Intelligence Unit Limited 2001 EIU Country Profile 2001
tabloid, Media Permata, which has been published since 1995. The English-language Borneo Bulletin dates from 1953 and has been published daily onweekdays since 1990; in March 2000 the Sunday Borneo Bulletin was launched.(The Borneo Bulletin circulates in Brunei, Sarawak and Sabah.) A rival English-language daily, News Express, was launched in August 1999.
Radio Brunei has six channels broadcasting in Malay, English and Chinese. AnIslamic radio channel started operations in May 1997. The governmenttelevision network, broadcasting in Malay and English, was the sole televisionoperator until 1999, when Brunei’s first commercial cable television channel,Kristal, began broadcasting.
Energy provision
Most of Brunei’s energy production is exported. Electricity production hasgrown steadily in recent years, reaching 2.35bn kwh in 1998 whenconsumption was 2.19bn kwh, of which 56% was for household use. In 1993around 1.28m barrels of petrol were consumed, along with 736,000 barrels ofdiesel. Natural gas consumption has nearly doubled over the last ten years.(National statistics on energy production are given in Reference table 4.)
Energy balance, 2000(m tonnes oil equivalent)
Oil Gas Coal Electricity Other Total
Primary production 9.50 9.50 0.00 0.00 0.02 19.02
Imports 0.03 0.00 0.00 0.00 0.00 0.03
Exports –9.10 –8.00 0.00 0.00 0.00 –17.10
Primary supply 0.43 1.50 0.00 0.00 0.02 1.95
Losses & transfers –0.04 –1.50 –0.01 0.00 0.00 –1.55
Transformation output 0.00 0.00 0.00 0.23a 0.00 0.23
Final consumption 0.39 0.00 0.00 0.22a 0.02 0.63
Note. Losses and transfers comprise input to transformation processes, plus energy industry fuel and losses. a Output basis.
Source: Energy Data Associates.
The economy
Economic structure
Main economic indicators
Real GDP growth (2000; %)a 3.5
Consumer price inflation (1999 av; %)b 1.0
Average exchange rate (Br$:US$; 2000) 1.72
Population (2000; ‘000)b 342.0
a EIU estimate. b Government estimate.
Source: Ministry of Finance.
Electricity output growssteadily

62 Brunei
EIU Country Profile 2001 © The Economist Intelligence Unit Limited 2001
Brunei’s economy is dominated by the oil and gas sector, which in 2000 isestimated to have contributed over 50% to GDP at current prices. For most ofthe 1990s the hydrocarbons sector had steadily declined as a share of current-price GDP, reaching a low of 33.5% in 1998. During that year, the main non-oilsectors contributing to GDP were community, social, and personal services(33%), consisting primarily of government spending on health, education anddefence; construction (6.6%); retail trade (5.3%); banking and finance (4.9%);and transportation, storage and communications (4.3%).
Economic policy
Economic policy has been formulated in a series of development plans. TheSeventh National Development Plan (1996-2000), published in 1997, aimed toboost government expenditure to Br$7.2bn (US$4.2bn at the 2000 averageexchange rate of Br$1.724:US$1), compared with Br$5.5bn in 1991-95,Br$3.7bn in 1986-90 and Br$1.7bn in 1980-84. Nearly 30% of spending underthe 1996-2000 plan was allocated to social services; utilities were allocated 22%of expenditure, more than half of which was for electricity infrastructuredevelopment. A further 20% of the plan’s budget was allocated to expenditureon transport and communications, including roads and telecommunications.No data have been published indicating progress in the achievement of theplan, neither has a plan been published for the 2001-05 period. Brunei’seconomy was blown off course by the region’s 1997-98 economic crisis, thecollapse of the Amedeo group of companies and misappropriation of fundsfrom the Brunei Investment Agency (BIA). Rising oil prices in 1999-2000 easedBrunei’s economic difficulties.
Government revenue and transfers, excluding income from internationalreserves, amounted to Br$3.99bn in 1997—the latest year for which completedata are available. The main source of income for the government is corporateincome tax, set at a rate of 30%, mostly collected from the oil and gas sector. Itwas announced in July 2000 that income tax is to be levied in Brunei for thefirst time. Transfers from the BIA make up for budget shortfalls. (See Referencetable 5 for historical data on government finances.)
Summary of government finances, 1998a
(Br$ m)
Total revenue 2,775
Total expenditure –4,295
Balance –1,520
a Budget 1998.
Source: IMF Staff Country Report 99/19, Brunei Darussalam: Recent Economic Developments, drawn from Ministry of Finance, BruneiDarussalam Statistical Yearbook (various issues).
In February 2000 the Brunei Darussalam Economic Council (BDEC) issued ablunt assessment of the economy, highlighting many weaknesses and statingthat prosperity could no longer be taken for granted. In a separate “Strategy forSustainable Growth” the BDEC proposed the strengthening of both the
The oil and gas sectordominates the economy
Public finances depend onenergy revenue
The regional crisis blowsgovernment plans off course
A blunt report highlightseconomic problems

Brunei 63
© The Economist Intelligence Unit Limited 2001 EIU Country Profile 2001
government and private sector through a series of measures includingstreamlining government expenditure and the budgeting system to emphasisenational rather than ministerial priorities; promotion of local small andmedium-sized enterprises (SMEs); expansion of the tax base by introducing apersonal income tax; privatisation of some government functions andcontracting out non-core services to local SMEs; encouraging greater local andforeign participation in the economy; improving competitiveness in the oiland gas industry, including the creation of a national oil company; streng-thening and modernising the legal and regulatory framework; improvingnational productivity; reviewing education and training policies; and relaxinglimitations on the employment of skilled foreigners. No detailed implement-ation programme has been published for the proposals, little progress has beenmade and privatisation has been postponed.
Economic performance
Gross domestic product(% real change)
Annual average2000a 1996-2000
GDP 3.5 2.3
a Estimated.
Source: IMF Staff Country Report 99/19, Brunei Darussalam: Recent Economic Developments, drawn from Ministry of Finance, BruneiDarussalam Statistical Yearbook (various issues).
A major factor determining the economy’s performance is the price of oil. GDPfell sharply during the 1980s as a result of the world oil glut and theconsequent fall in prices. The performance of the economy was erratic duringthe 1990s. Real GDP growth was 4.1% in 1997 and 1% in 1998, when theregional economic crisis, the crash of the Amedeo Corporation, and plungingoil prices hit Brunei, leading to an estimated 0.5% decline in GDP in 1999.Sharply higher oil prices in the second half 1999 and in early 2000 increasedgovernment revenue and boosted growth to an estimated 3.5% in 2000,notwithstanding continued weakness in the private sector. (Data on GDPgrowth and GDP by sector are given in Reference tables 7 and 8.)
Brunei’s dependence on imports means that it is affected by global inflationtrends and currency fluctuations. Inflation is believed to have risen in 2000 asthe application of strict halal (Islamic dietary) laws led to higher food prices.Historically, inflation has been constrained by the imposition of price controlsand subsidies on essential foods and petrol. (Reference table 6 gives data on themoney supply and Reference table 9 provides data on consumer prices.)
Inflation
Growth depends on oil

64 Brunei
EIU Country Profile 2001 © The Economist Intelligence Unit Limited 2001
Economic sectors
Agriculture, forestry and fishing
Agriculture accounts for less than 2% of GDP, and Brunei has to import 80% ofits food. (Reference table 10 gives data on agricultural production.) Brunei isnearly self-sufficient in vegetables, and the production of tropical fruit is beingencouraged with a view to creating an export market. The introduction of stricthalal (Islamic dietary) regulations has hampered the development of the localsmall-scale food-processing industry and considerably increased costs.
Forest exploitation has been limited, no timber is exported and more than 80%of Brunei is still under forest—60% of the country is under primary forest.Timber extraction for local consumption is allowed, but only under strictcontrol by the Forestry Department. However, illegal logging is on the increase,especially near the Malaysian border. (Historical data on forestry output aregiven in Reference table 11.)
Fish is an important part of the local diet. Brunei’s catch in 1996 was about1,200 tonnes of fresh fish and 350 tonnes of prawns, worth Br$8.3m (US$5.9mat the 1996 average exchange rate of Br$1.41:US$1).
Mining and semi-processing
Brunei’s wealth is based on its hydrocarbons reserves, which at the beginningof 2000 were estimated at 1.4bn barrels of mainly low-sulphur oil, expected tolast 25 years, and 390bn cu metres of gas, which should last another 40 years.The government has adopted a policy aimed at conserving resources andcontinuing exploration to open up new fields, the most recent of which was a10,000-sq km area of deepwater in Brunei’s Exclusive Economic Zone in theSouth China Sea that opened in October 2000. (Data on oil and gas productionand prices are given in Reference table 12.) Oil production at the end of 2000was 191,000 barrels/day.
The Brunei Oil and Gas Authority (BOGA) plans and controls every phase ofhydrocarbons exploration, development, processing and conservation. Theauthority is also responsible for awarding mining concessions and contracts.Brunei Shell Petroleum (BSP) is the major producer, with seven offshore andtwo onshore oilfields in Brunei. The Brunei government and the Royal DutchShell Group are equal shareholders in the company. A consortium of Total-Fina-Elf and a local company has been active in oil exploration since the1980s. A 10,000-b/d BSP refinery at Seria has met domestic demand forpetroleum products since 1983.
Brunei’s liquefied natural gas (LNG) sales currently stand at 6.7m tonnes/yearand are as important a revenue earner as oil exports. The bulk of the LNG ispurchased by three Japanese utility companies under a long-term contract first
Forestry
Fishing
The Brunei Oil andGas Authority
LNG sales
Agriculture
Brunei has substantialhydrocarbons reserves
Brunei 65
© The Economist Intelligence Unit Limited 2001 EIU Country Profile 2001
signed in 1972 and extended for 20 years in 1993. It is hoped that reserves ofnatural gas will be nearly doubled and a 4m tonnes/year liquefaction plantadded by 2008. Brunei is also considering using its natural gas resources todevelop domestic petrochemicals and energy-intensive industries such asaluminium smelting.
Manufacturing
Manufacturing remains a minor portion of Brunei’s output, standing at anestimated 3% of GDP in 1998. Food processing and furniture-making are twoindustries targeted for further development. The main large-scale industriesare cement production, garment-making, and the production of pre-castconcrete structures.
Bureaucratic obstacles and delays, a shortage of skilled labour, the smalldomestic market, an unwillingness on the part of the government tounderwrite risk-taking ventures and the fact that foreigners are prohibited fromowning land have all deterred foreign capital and technology from investing inindustry in Brunei.
Construction
Growth in the construction sector during 2000 was sluggish after thegovernment cut development spending on infrastructure projects by half.Before the summit of the Asia-Pacific Economic Co-operation (APEC) forum(held in Brunei in November 2000) the government tendered out a number ofsmall projects worth Br$8.9m in the area of tourism infrastructure. Thegovernment discriminates in favour of Malay-owned companies in the awardof contracts. The construction industry will be particularly dependent ongovernment infrastructure projects over the next two years, but few largeprojects have been announced yet.
Financial services
There is no central bank in Brunei. The functions of the central bank arecarried out by the Treasury’s Department of Financial Services, the BruneiCurrency Board—which is responsible for issuing and managing thecurrency—and the Brunei Investment Agency. These bodies all come under thejurisdiction of the Ministry of Finance.
There are nine banks operating in Brunei, three locally incorporated banks andsix branches of foreign banks, of which the three largest are the Hongkong andShanghai Banking Corporation, Standard Chartered Bank, and Citibank. Thereare a number of Malaysian banks and three locally incorporated banks: theIslamic Bank of Brunei (IBB), Baiduri Bank and the Islamic Development Bankof Brunei (IDBB), formerly the Development Bank of Brunei.
Spending cuts hitconstruction
Manufacturing is a tinyproportion of GDP
There is no central bank

66 Brunei
EIU Country Profile 2001 © The Economist Intelligence Unit Limited 2001
Other services
Since 1995 a more international range of shops has come to Brunei, includingthe fast food chains, McDonald’s, Pizza Hut and Kentucky Fried Chicken, aswell as the natural cosmetics outlet, the Body Shop. Much of this new retaildevelopment is occurring at Gadong, just outside the capital. In the centre ofBandar Seri Begawan, the new Sultan Foundation complex of shops and offices,opened in 1996, houses upmarket shops.
Brunei has designated 2001 as “Visit Brunei Year”. However, a range of factorshave militated against tourism: limited access to alcohol; the high cost ofaccommodation; the lack of accommodation and transport outside the capital;and the perception that there is little of interest to see in the country. The largeareas of Brunei that are still covered in primary forest have been earmarked assites for ecotourism. Br$15m has been allocated to develop facilities at theTemburong National Park. However, until transport and accommodationfacilities are improved outside the capital, the ecotourism market is likely toremain underdeveloped.
The external sector
Trade in goods
Foreign trade, 1999(US$ m)
Merchandise exports 2,552
Merchandise imports –1,328
Trade balance 1,224
Source: IMF, Direction of Trade Statistics.
Falling oil prices, together with a surge in imports related to industrialisationand higher living standards, led to a decline in Brunei’s large trade surplusesafter 1985, with a short-lived reversal in the trend of declining surpluses in 1991.The regional economic crisis and a drop in oil prices resulted in a rare tradedeficit in 1998 but subdued import demand restored a sizeable trade surplus in1999. (Historical data on foreign trade are given in Reference tables 13-16.)
Main trading partners, 1999(% of total)
Imports from: Exports to:
Singapore 28.5 Japan 42.0
Malaysia 17.0 US 15.3
US 13.0 South Korea 11.3
Japan 8.0 Thailand 11.3
Source: IMF, Direction of Trade Statistics.
The retail sector
Tourism
The trade account returnsto surplus

Brunei 67
© The Economist Intelligence Unit Limited 2001 EIU Country Profile 2001
Exports are dominated by petroleum products: in 1998 crude oil and partlyrefined petroleum accounted for an estimated 39% of total exports, and naturalgas for a further 49%. By far the most important export market is Japan, whichaccording to IMF figures took 42% of Brunei’s exports in 1999, followed by theUS, South Korea and Thailand.
Invisibles and the current account
Current account, 1998a
(US$ m)
Goods: exports 1,894
Goods: imports –1,718
Services: receipts 486
Services: payments –774
Income: receipts 2,439
Income: payments –58
Transfers: receipts 8
Transfers: payments –192
Current-account balance 2,085
a Estimate.
Source: IMF Staff Country Report 99/19, Brunei Darussalam: Recent Economic Developments, drawn from Ministry of Finance, BruneiDarussalam Statistical Yearbook (various issues).
According to data provided by the Brunei authorities to the IMF in 1998—thelast available balance-of-payments breakdown—Brunei in the late 1990s wasrunning a services deficit of between US$300m and US$350m a year, roughlydouble the rate of the early 1990s. The income account, however, is insubstantial surplus because of returns from oil earnings invested overseas. As aresult of these large surpluses, the overall current account has historicallyregistered a substantial surplus, although at an estimated US$2.1bn in 1998 itwas 27% below the year-earlier level. (Historical data on the current accountare given in Reference Table 17.)
Capital flows and foreign debt
The sultan has invested abroad in his own right. Notable acquisitions includethe Dorchester Hotel in London, the Ritz Hotel in Paris, the Beverly Hills Hotelin California and the New York Palace Hotel. Some of these were subsequentlytransferred to the Brunei Investment Agency, as were properties recovered fromPrince Jefri. A number of Brunei companies, including those with royalconnections, have been investing in Vietnam and China since 1993.
Foreign reserves and the exchange rate
Brunei’s large foreign assets were estimated at Br$80bn (US$47bn) in 1999,according to the Borneo Bulletin, and generate a substantial investment income,
A substantial servicesdeficit
The BIA manages someinvestments
Brunei holds large foreignassets
68 Brunei
EIU Country Profile 2001 © The Economist Intelligence Unit Limited 2001
which during most years in the 1990s exceeded the combined revenue from oiland gas. About one-third of the reserves are managed on a day-to-day basis bythe Brunei Investment Agency (BIA), while the remainder is divided betweeneight foreign institutions. Up to 80% of the investments are governmentbonds, and the balance is held in cash, equities, gold and real estate. (SeeReference table 19 for historical data on international reserves.)
The Brunei dollar, or ringgit, is fully interchangeable at par with the Singaporedollar. A trend of steady appreciation was disrupted by the 1997 regionaleconomic crisis. (See Reference table 18 for historical data on exchange rates.)Rumours that the Singapore dollar and Brunei dollar peg would be cut havebeen denied by the financial authorities in both countries.

Brunei 69
© The Economist Intelligence Unit Limited 2001 EIU Country Profile 2001
Appendices
Sources of information
Borneo Bulletin (daily), Kuala Belait
Brunei Yearbook (annual), Kuala Belait
Department of Information, Brunei Darussalam Newsletter (fortnightly), BandarSeri Begawan
Negara Brunei Darussalam: National Development Committee, Ministry ofDevelopment, Seventh National Development Plan, 1996-2000, Bandar SeriBegawan, 1997
Statistics Division, Economic Planning Unit, Ministry of Finance, BruneiDarussalam Statistical Yearbook (annual), Bandar Seri Begawan
Statistics Division, Economic Planning Unit, Ministry of Finance, Census ofPopulation, 1991, 1992
Statistics Division, Economic Planning Unit, Ministry of Finance, DemographicSituation and Population Projections, 1991-2011, 1994
Borneo Bulletin online: http://www.brunet.bn/news/bb/
Brudirect: http://www.brudirect.com/
Government of Brunei Darussalam: http://www.brunei.gov.bn/government
Energy Data Associates, Bishops Walk House, 19-23 High Street, Pinner,Middlesex HA5 5PJ
International Monetary Fund, Brunei Darussalam: Recent Economic Developments,IMF Staff Country Report No. 99/19, April 1999, Washington, DC
G Braighlinn, Ideological Innovation under Monarchy: Aspects of LegitimationActivity in Contemporary Brunei, VU University Press, Amsterdam, 1992
R Heeks, Small enterprise development and the “Dutch Disease” in a small economy:the case of Brunei, IDPM Discussion Paper No. 56, April 1998, Institute ofDevelopment Policy & Management, University of Manchester
R Kershaw, Monarchy in South-East Asia: the Faces of Tradition in Transition,Routledge, London, 2000
D S Ranjit Singh, Brunei, 1839-1983: The Problem of Political Survival, OxfordUniversity Press, Singapore, 1994
G Saunders, A History of Brunei, Oxford University Press, Kuala Lumpur, 1994
Tourism Development Division, Ministry of Industry and Primary Resources,Explore Brunei: A Visitor‘s Guide, Bandar Seri Begawan, 1998
Internet home pages
Select bibliography
International sources
National statistical sources

70 Brunei
EIU Country Profile 2001 © The Economist Intelligence Unit Limited 2001
Reference tables
These reference tables provide the most up-to-date statistics available at the date ofpublication.
Reference table 1
Population
1996 1997 1998 1999 2000
Male 161,500 166,600 n/a 175,200 n/a
Female 143,600 147,800 n/a 155,500 n/a
Total 305,100 314,400 323,100 330,700 342,000 of which: Malay n/a 222,100 n/a 223,500 n/a Chinese n/a 46,300 n/a 49,300 n/a
Crude birth rate n/a 23.7 22.9 n/a n/a
Crude death rate n/a 2.8 2.9 n/a n/a
Population growth rate n/a 3.0 2.8 2.4 3.4
Note: The government’s mid-year 2001 population estimate is 352,000.
Sources: IMF Staff Country Report 99/19, Brunei Darussalam: Recent Economic Developments, drawn from Ministry of Finance, BruneiDarussalam Statistical Yearbook (various issues); Brunei Yearbook 2000; Government website.
Reference table 2
Labour force, 1991
Employers 1,018
Employees 101,377
Self-employed 3,902
Family workers 489
Unemployed 5,209
Total labour force 111,995
Source: Ministry of Finance, Brunei Darussalam Statistical Yearbook.
Reference table 3
Transport and telecommunications
1995 1996 1997 1998 1999
Roads (km) 2,470 n/a n/a 2,525 n/a
Vehicles 167,786 n/a n/a n/a 177,600 of which: private cars 139,658 n/a n/a n/a 149,738
Scheduled aircraft movements 11,916 n/a n/a 13,600 n/a
Aircraft passengers (inward) 448,400 n/a n/a n/a n/a
Seaborne cargo discharged (‘000 tonnes) 1,945 n/a n/a n/a n/a
Telephones 68,100a n/a n/a n/a n/a
a Direct exchange line.
Sources: Ministry of Finance, Brunei Darussalam Statistical Yearbook; Brunei Darussalam Key Indicators; Brunei Yearbook 2000.

Brunei 71
© The Economist Intelligence Unit Limited 2001 EIU Country Profile 2001
Reference table 4
National energy statistics
1995 1996 1997 1998 1999
ElectricityProduction (m kwh) 1,556 1,996 2,263 2,353 2,445Consumption (bn kwh) 1.4 1.9 2.1 2.2 2.3 of which: domestic 0.8 n/a n/a 1.2 n/a
Natural gasProduction (bn cu ft) 330 330 320 320 330Consumption (bn cu ft) 34 28 31 27 37
Sources: Ministry of Finance, Brunei Darussalam Statistical Yearbook; US Energy Information Administration.
Reference table 5
Government finances(Br$ m)
1993 1994 1995 1996 1997
Total revenue & transfers 3,416 4,318 4,407 3,790 3,989 Tax revenue 1,137 1,092 1,223 1,404 1,561 of which: import duty 105 101 164 183 224 corporate income tax 1,029 989 1,055 1,217 1,333 Non-tax revenue 1,137 1,155 1,227 1,456 1,282 of which: commercial receipts 248 259 264 279 303 property income 876 880 946 1,158 957 Transfers 1,142 2,072 1,957 929 1,146
Total expenditure 3,397 4,286 4,431 3,679 4,016 of which: Current 2,254 2,301 2,430 2,587 2,600 Capital 1,143 1,083 1,226 994 1,350
Balance 19 32 –24 111 –27
Balance excl transfers –1,123 –2,039 –1,981 –818 –1,173
Source: IMF Staff Country Report 99/19, Brunei Darussalam: Recent Economic Developments, drawn from Ministry of Finance, BruneiDarussalam Statistical Yearbook (various issues).
Reference table 6
Money supply(Br$ m)
1994 1995 1996 1997 1998a
Money 4,398 4,126 3,271 2,331 2,520 Currency 432 482 507 545 528 Demand deposits 3,966 3,644 2,765 1,786 1,992
Quasi-money 3,118 3,894 4,562 5,135 4,967 Time deposits 2,040 2,726 3,299 3,860 3,770 Savings & other deposits 1,078 1,168 1,263 1,276 1,197
Broad money 7,516 8,020 7,833 7,466 7,487
Prime lending rate (%) 6.0 6.5 6.5 6.5 7.0
a End-June.
Source: IMF Staff Country Report 99/19, Brunei Darussalam: Recent Economic Developments, drawn from Ministry of Finance, BruneiDarussalam Statistical Yearbook (various issues).

72 Brunei
EIU Country Profile 2001 © The Economist Intelligence Unit Limited 2001
Reference table 7
Gross domestic product
1996 1997 1998a 1999a 2000a
Total (Br$ m)At current prices 7,685 8,051 8,111 8,192 8,685At constant (1974) prices 4,050 4,215 4,257 4,236 4,384 Real change (%) 3.6 4.1 1.0 –0.5 3.5At current prices (US$) 5,450 5,422 4,857 4,847 5,049
Per head (US$)At current prices 17,624 17,246 15,009 14,658 14,764 Real change (%) 14.5 –2.1 –13.0 –2.3 0.7
a Estimates.
Sources: IMF Staff Country Report 99/19, Brunei Darussalam: Recent Economic Developments, drawn from Ministry of Finance, BruneiDarussalam Statistical Yearbook (various issues); EIU.
Reference table 8
Gross domestic product by sector(Br$ m; current market prices)
1996 1997 1998a 1999b 2000b
Agriculture, forestry & fishing 201 218 231 n/a n/a
Oil & gas sector 2,832 2,866 2,721 n/a n/a
Mining, quarrying & manufacturing 230 242 254 n/a n/a
Electricity, gas & water 79 83 88 n/a n/a
Construction 455 510 539 n/a n/a
Wholesale trade 186 205 213 n/a n/a
Retail trade 372 406 429 n/a n/a
Restaurants & hotels 119 131 138 n/a n/a
Transport, storage & communications 311 335 351 n/a n/a
Banking & finance 335 375 397 n/a n/a
Insurance 104 115 123 n/a n/a
Real estate & business services 82 87 89 n/a n/a
Ownership of dwellings 82 83 85 n/a n/a
Community, social & personal services 2,497 2,612 2,673 n/a n/a
Less banking charges –202 –217 –220 n/a n/a
GDP 7,685 8,051 8,111 8,354 8,690
a Official estimates. b EIU estimates
Sources: IMF Staff Country Report 99/19, Brunei Darussalam: Recent Economic Developments, drawn from Ministry of Finance, BruneiDarussalam Statistical Yearbook (various issues); EIU.

Brunei 73
© The Economist Intelligence Unit Limited 2001 EIU Country Profile 2001
Reference table 9
Consumer prices
1993 1994 1995 1996 1997
Index (1990=100) 107.3 109.9 116.5 118.8 120.8 % change 4.3 2.4 6.0 2.0 1.7 of which: food 2.6 1.3 2.6 3.0 3.7 clothing & footwear 8.6 2.8 5.5 –1.1 4.0 housing 5.3 2.8 2.0 –0.5 –0.4 transport & communications 5.1 4.7 14.1 3.8 –0.1
Source: IMF Staff Country Report 99/19, Brunei Darussalam: Recent Economic Developments, drawn from Ministry of Finance, BruneiDarussalam Statistical Yearbook (various issues).
Reference table 10
Agricultural production(‘000 tonnes)
1994 1995 1996 1997 1998
Rice 0.51 0.33 n/a n/a 2.90
Vegetables 4.82 5.98 n/a n/a 8.70
Fruit 0.89 1.20 n/a n/a 5.20
Source: Ministry of Industry and Primary Resources, Brunei Yearbook 2000.
Reference table 11
Forestry production(‘000 cu metres)
1991 1992 1993 1994 1995
Round timber 90.8 117.2 119.2 124.1 121.7
Sawn timber 54.2 61.0 30.0 62.5 58.6
Firewood 0.1 0.1 0.1 0.1 0.1
Source: Ministry of Industry and Primary Resources.
Reference table 12
Oil and natural gas production and prices
1996 1997 1998 1999 2000
Oil (‘000 barrels/day) 166 175 179 204 199Average price received (US$/barrel) 22.0 21.5 13.8 18.9 n/a
Gas (trn British thermal units) 321 319 319 345 n/aAverage price received (US$/m BTU) 3.7 3.8 2.9 n/a n/a
Sources: Oil and Gas Journal; IMF Staff Country Report 99/19, Brunei Darussalam: Recent Economic Developments, drawn from Ministryof Finance, Brunei Darussalam Statistical Yearbook (various issues); Petroleum Unit, Office of the Prime Minister; US Energy InformationAdministration.
Reference table 13
Balance of trade(US$ m)
1995 1996 1997 1998 1999
Merchandise exports fob 3,388 3,670 3,973 1,979 2,552
Merchandise imports cif –2,960 –3,516 –3,154 –2,353 –1,328
Trade balance 428 154 819 –374 1,224
Source: IMF, Direction of Trade Statistics.

74 Brunei
EIU Country Profile 2001 © The Economist Intelligence Unit Limited 2001
Reference table 14
Main exports(Br$ m)
1995 1996 1997 1998 1999
Crude petroleum 1,476 1,702 1,650 1,236a 1,650a
Petroleum products 111 117 110 n/a 111
Natural gas 1,561 1,583 1,860 1,534 1,860
a Includes petroleum products.
Source: IMF Staff Country Report 99/19, Brunei Darussalam: Recent Economic Developments, drawn from Ministry of Finance, BruneiDarussalam Statistical Yearbook (various issues).
Reference table 15
Main imports(Br$ m)
1994 1995 1996 1997 1998
Food and live animals 327 324 324 352 396
Chemicals 143 166 218 201 n/a
Manufactured goods 630 906 909 804 854
Machinery & transport equipment 1,172 1,039 1,033 1,229 981
Source: IMF Staff Country Report 99/19, Brunei Darussalam: Recent Economic Developments, drawn from Ministry of Finance, BruneiDarussalam Statistical Yearbook (various issues).
Reference table 16
Main trading partnersa
(US$ m)
1995 1996 1997 1998 1999
Exports to:Japan 1,883 1,955 2,108 934 1,072US 67 76 97 204 391South Korea 503 678 721 309 288Thailand 372 421 446 21 288Singapore 313 318 264 159 146Malaysia 33 38 111 3 135UK 9 14 23 277 42Total incl others 3,290 3,670 3,973 2,954 2,552
Imports from:Singapore 937 900 807 677 378Malaysia 406 426 428 332 225US 262 614 614 135 174Japan 261 278 353 103 106UK 171 245 192 468 66Germany 132 123 189 50 28France 24 32 37 324 23Total incl others 2,960 3,516 3,154 2,394 1,328
a Deduced from trading partners’ returns and subject to a wide margin of error.
Source: IMF, Direction of Trade Statistics.

Brunei 75
© The Economist Intelligence Unit Limited 2001 EIU Country Profile 2001
Reference table 17
Balance of payments, national series(US$ m)
1996 1997 1998a 1999a 2000a
Trade balance 239 662 175 1,224 n/a Exports 2,603 2,676 1,894 2,552 n/a Imports –2,364 –2,013 –1,718 –1,328 n/a
Services, net –339 –343 –288 n/a n/a Receipts 459 526 486 n/a n/a Payments –798 –869 –774 n/a n/a
Investment income, net 2,643 2,739 2,381 n/a n/a Receipts 2,772 2,853 2,439 n/a n/a Payments –129 –114 –58 n/a n/a
Current transfers, net –343 –184 –184 n/a n/a Receipts 14 12 8 n/a n/a Payments –357 –196 –192 n/a n/a
Current-account balance 2,200 2,875 2,085 n/a 3,237 % GDP 40.4 53.0 42.9 n/a 39.0
a IMF estimates.
Source: IMF Staff Country Report 99/19, Brunei Darussalam: Recent Economic Developments, drawn from Ministry of Finance, BruneiDarussalam Statistical Yearbook (various issues).
Reference table 18
Exchange rates(Br$ per unit of currency unless otherwise indicated; annual averages)
1996 1997 1998 1999 2000
US$ 1.410 1.485 1.674 1.695 1.724
¥100 1.296 1.227 1.278 1.488 1.600
DM 0.937 0.856 0.951 1.806 1.588
SDR 2.047 2.043 2.271 2.317 2.274
M$ 0.560 0.528 0.427 0.446 0.454
Bt 0.056 0.047 0.040 0.045 0.043
NT$100 5.135 5.129 4.963 5.255 5.385
Nominal effective exchange-rate index (IMF, 1995=100) 104.7 107.3 106.7 101.3 107.5
Sources: IMF, International Financial Statistics; Bloomberg.
Reference table 19
International reserves(US$ m)
1994 1995 1996 1997 1998
Official reserves 1,065 1,833 2,090 1,875 2,145 Currency board 305 332 546 507 510 Consolidated fund 759 1,501 1,544 1,369 1,635
Commercial banks 3,332 4,041 3,847 1,781 1,866
International reserves 4,396 5,874 5,937 3,656 4,011
Source: IMF Staff Country Report 99/19, Brunei Darussalam: Recent Economic Developments, drawn from Ministry of Finance, BruneiDarussalam Statistical Yearbook (various issues).
Editors: Frans Jonkers (editor); Graham Richardson (consulting editor)Editorial closing date: September 1st 2001
All queries: Tel: (44.20) 7830 1007 E-mail: [email protected]