Making pathogen hazards visible: a new heuristic to ... · is served by local community-scale...
19
Waterlines Vol. 35 No. 2 April 2016 The public health objective of sanitation is to reduce the risk of negative health outcomes from faecal contamination. For water-based sanitation systems at the household and community scale as practised in Indonesia and perhaps elsewhere, the liquid component of the effluent comprises a significant pathogen hazard. While increasing attention is paid to managing the solid fraction, the hazard in the liquid fraction goes largely unnoticed and unmanaged. This paper proposes the means for a conceptual shift to a focus on the pathogen hazards that matter post-treatment, and where those hazards enter the environment, enabling improved local risk management. Firstly, the paper proposes exponential, rather than arithmetic, representations of pathogen number or concentration, because arithmetic representations of treatment efficacy wrongly suggest low cause for concern. Secondly, the paper introduces and applies the Pathogen Hazard Diagram, a new heuristic applicable at both the local and national scale, that requires only local knowledge and general sanitation reference knowledge to construct, but which can guide policy and action, direct monitoring, and improve the efficacy of sanitation investments. Keywords: faecal pathogen, hazard, liquid effluent, efficacy of sanitation service EXPOSURE TO FAECAL PATHOGENS (viruses, bacteria, protozoa, and helminths) can lead to serious public health consequences. Around the world people suffer daily from acute diarrhoea, vomiting, and upper respiratory tract infections caused by faecal pathogens (Feachem et al., 1983), and stunted growth in children is linked to chronic gut dysfunction resulting from exposure to faecal pathogens (Schmidt, 2014; Ngure et al., 2014). The main objective of sanitation is to reduce this impact by separating people – sanitation system users, workers, and the community – from faecal pathogens (Stenström et al., 2011). For decades the main focus for achieving separation in developing countries was access to basic sanitation through improved toilets. The wording of the sanitation Millennium Development Goal (MDG) intensified the focus on toilet provision (UNSD, 2015). The sanitation sector recognized that the MDG Making pathogen hazards visible: a new heuristic to improve sanitation investment efficacy CYNTHIA MITCHELL, KUMI ABEYSURIYA, and KATIE ROSS Professor Cynthia Mitchell ([email protected]) is Deputy Director and Professor of Sustainability; Dr Kumi Abeysuriya ([email protected]) is a Senior Research Consultant; and Katie Ross ([email protected]) is a Research Principal, all at the Institute for Sustainable Futures, University of Technology Sydney. © Practical Action Publishing, 2016, www.practicalactionpublishing.org http://dx.doi.org/10.3362/1756-3488.2016.014, ISSN: 0262-8104 (print) 1756-3488 (online) http://www.developmentbookshelf.com/doi/pdf/10.3362/1756-3488.2016.014 - Tuesday, March 07, 2017 7:29:20 PM - IP Address:220.101.23.22
-
Upload
nguyendung -
Category
Documents
-
view
213 -
download
0
Transcript of Making pathogen hazards visible: a new heuristic to ... · is served by local community-scale...
Waterlines Vol. 35 No. 2 April 2016
The public health objective of sanitation is to reduce the risk of negative health outcomes from faecal contamination. For water-based sanitation systems at the household and community scale as practised in Indonesia and perhaps elsewhere, the liquid component of the effluent comprises a significant pathogen hazard. While increasing attention is paid to managing the solid fraction, the hazard in the liquid fraction goes largely unnoticed and unmanaged. This paper proposes the means for a conceptual shift to a focus on the pathogen hazards that matter post-treatment, and where those hazards enter the environment, enabling improved local risk management. Firstly, the paper proposes exponential, rather than arithmetic, representations of pathogen number or concentration, because arithmetic representations of treatment efficacy wrongly suggest low cause for concern. Secondly, the paper introduces and applies the Pathogen Hazard Diagram, a new heuristic applicable at both the local and national scale, that requires only local knowledge and general sanitation reference knowledge to construct, but which can guide policy and action, direct monitoring, and improve the efficacy of sanitation investments.
Keywords: faecal pathogen, hazard, liquid effluent, efficacy of sanitation service
ExposurE to faEcal pathogEns (viruses, bacteria, protozoa, and helminths) can lead to serious public health consequences. around the world people suffer daily from acute diarrhoea, vomiting, and upper respiratory tract infections caused by faecal pathogens (feachem et al., 1983), and stunted growth in children is linked to chronic gut dysfunction resulting from exposure to faecal pathogens (schmidt, 2014; ngure et al., 2014).
the main objective of sanitation is to reduce this impact by separating people – sanitation system users, workers, and the community – from faecal pathogens (stenström et al., 2011). for decades the main focus for achieving separation in developing countries was access to basic sanitation through improved toilets. the wording of the sanitation Millennium Development goal (MDg) intensified the focus on toilet provision (unsD, 2015). the sanitation sector recognized that the MDg
Making pathogen hazards visible: a new heuristic to improve sanitation investment efficacyCYNTHIA MITCHELL, KUMI ABEYSURIYA, and KATIE ROSS
Professor Cynthia Mitchell ([email protected]) is Deputy Director and Professor of Sustainability; Dr Kumi Abeysuriya ([email protected]) is a Senior Research
Consultant; and Katie Ross ([email protected]) is a Research Principal, all at the Institute for Sustainable Futures, University of Technology Sydney.
© Practical Action Publishing, 2016, www.practicalactionpublishing.org http://dx.doi.org/10.3362/1756-3488.2016.014, ISSN: 0262-8104 (print) 1756-3488 (online)
http
://w
ww
.dev
elop
men
tboo
kshe
lf.c
om/d
oi/p
df/1
0.33
62/1
756-
3488
.201
6.01
4 -
Tue
sday
, Mar
ch 0
7, 2
017
7:29
:20
PM -
IP
Add
ress
:220
.101
.23.
22

164 C. MITCHELL ET aL.
April 2016 Waterlines Vol. 35 No. 2
indicator of improved toilets was insufficient, and the focus is shifting towards the whole sanitation service chain and safe service delivery (strande et al., 2014: 3; ross et al., 2015). this shift is evidenced by: the sustainable Development goals (sDgs), which seek to incentivize ‘safe management’ (un, 2015); the excreta flow, or shit flow, diagram (sfD) emphasizing the sanitation service delivery chain (e.g. Blackett et al., 2014; sfD promotion Initiative, 2015); and the rapidly increasing interest in faecal sludge management (fsM) (for example, the international conference series dedicated to fsM, which drew 700 attendees to the 2015 event, see <www.fsm3.org>). these shifts broaden the assessment of risk beyond the user to workers and the community (stenström et al., 2011) and help the sector to follow and diagnose contamination risk.
faecal contamination risk results from the combination of a pathogen hazard and an exposure pathway (ropeik and gray, 2002). reducing this risk is therefore about reducing the hazard of faecal pathogens, by removal and/or inactivation through the wastewater treatment cycle, and/or reducing exposure, by limiting the opportu-nities for people to be exposed to infective pathogen doses.
a three-year collaborative, transdisciplinary action research project on community-scale sanitation in Indonesia provides the impetus and experiential grounding for this paper. sanitation-linked health statistics in Indonesia continue to be staggering. there were 120 million annual cases of illness in Indonesia associated with poor sanitation in 2006, including 89 million cases of reported diarrhoea resulting in 23,000 deaths (napitupulu and hutton, 2008). ogden et al. (2013) estimate around 60.5 million children (under 15 years) in Indonesia are at risk of helminth infection. Ministry of health research indicates that 37 per cent of children under five are stunted – the fifth highest prevalence of stunting globally (Mca – Indonesia 2013).
Indonesia’s health statistics show that there remains a strong need to reduce both the hazard of and exposure to faecal pathogens. about 3 per cent of Indonesia’s population of 250 million people have access to piped sewerage. a similar percentage is served by local community-scale systems (sanIMas) (Mitchell et al., 2015), most commonly multi-chamber containment providing primary treatment only. Most faecal waste, including urban and peri-urban, is treated on-site in septic tanks or cubluks. about 50 per cent of the urban population access groundwater for some of their household water needs (World Bank, 2012).
Each country’s sanitation infrastructure (physical and institutional) takes a particular development path, so we recognize that Indonesia’s situation is different from other countries. however, our Indonesian observations align with the drivers for and approach to a current Bill & Melinda gates foundation project aiming to assess sanitation hazards (Williams and overbo, 2015) so we contend these country-specific observations can contribute to useful generalizations.
achieving efficacy in the task of separating people and faecal material is challenging for several reasons:
• within and between classes of pathogens (viruses, bacteria, protozoa, and helminths) there are different life cycles, infective doses, and requirements for removal or inactivation;
http
://w
ww
.dev
elop
men
tboo
kshe
lf.c
om/d
oi/p
df/1
0.33
62/1
756-
3488
.201
6.01
4 -
Tue
sday
, Mar
ch 0
7, 2
017
7:29
:20
PM -
IP
Add
ress
:220
.101
.23.
22
MaKING PaTHOGEN HaZaRDS VISIBLE 165
Waterlines Vol. 35 No. 2 April 2016
• wastewater technologies differ in their impact on the various classes of pathogens; • the local specifics of wastewater systems affect efficacy: for example, influent
(toilet waste, kitchen waste, greywater), design (retention time, leakage, internal baffles, etc.), subsequent treatment for liquid and sludge streams, and effluent disposal or reuse locations (feachem et al., 1983);
• there is very little practical performance data on pathogen fate and transport in developing country settings because pathogen monitoring is complex, expensive, and technically difficult.
the diversity of factors affecting efficacy means generalized responses are likely to result in ineffective investment, which leads to calls for site-specific responses (e.g. toze, 1997). however, the global scale of the separation challenge remains signi-ficant, so instead we need new heuristics that can help to direct rapid investments at large scale that effectively reduce the hazard of and exposure to faecal pathogens.
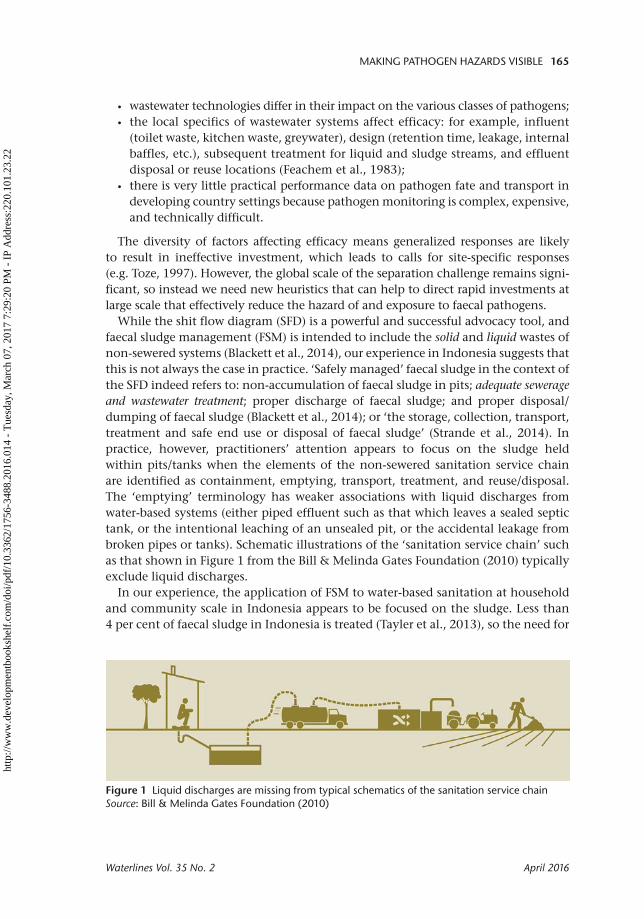
While the shit flow diagram (sfD) is a powerful and successful advocacy tool, and faecal sludge management (fsM) is intended to include the solid and liquid wastes of non-sewered systems (Blackett et al., 2014), our experience in Indonesia suggests that this is not always the case in practice. ‘safely managed’ faecal sludge in the context of the sfD indeed refers to: non-accumulation of faecal sludge in pits; adequate sewerage and wastewater treatment; proper discharge of faecal sludge; and proper disposal/dumping of faecal sludge (Blackett et al., 2014); or ‘the storage, collection, transport, treatment and safe end use or disposal of faecal sludge’ (strande et al., 2014). In practice, however, practitioners’ attention appears to focus on the sludge held within pits/tanks when the elements of the non-sewered sanitation service chain are identified as containment, emptying, transport, treatment, and reuse/disposal. the ‘emptying’ terminology has weaker associations with liquid discharges from water-based systems (either piped effluent such as that which leaves a sealed septic tank, or the intentional leaching of an unsealed pit, or the accidental leakage from broken pipes or tanks). schematic illustrations of the ‘sanitation service chain’ such as that shown in figure 1 from the Bill & Melinda gates foundation (2010) typically exclude liquid discharges.
In our experience, the application of fsM to water-based sanitation at household and community scale in Indonesia appears to be focused on the sludge. less than 4 per cent of faecal sludge in Indonesia is treated (tayler et al., 2013), so the need for
Figure 1 Liquid discharges are missing from typical schematics of the sanitation service chainSource: Bill & Melinda Gates Foundation (2010)
http
://w
ww
.dev
elop
men
tboo
kshe
lf.c
om/d
oi/p
df/1
0.33
62/1
756-
3488
.201
6.01
4 -
Tue
sday
, Mar
ch 0
7, 2
017
7:29
:20
PM -
IP
Add
ress
:220
.101
.23.
22

166 C. MITCHELL ET aL.
April 2016 Waterlines Vol. 35 No. 2
fsM is significant and is increasingly recognized. the result is that many donors and local governments are investing in sludge treatment facilities and regular desludging services, such as biennial desludging of septic tanks (see also robbins et al., 2015). however, the liquid discharges – piped effluent, intended leachate, and uninten-tional leakage (see figure 2) – are generally not considered, which means potentially significant faecal pathogen hazards are not noticed and therefore not managed. In Indonesia, where water utility coverage is limited and large segments of the population use untreated surface and groundwater (World Bank, 2012), exposure pathways for this hazard are prevalent.
this paper has two objectives. firstly, we propose a shift in how we represent pathogen numbers and concentrations, in order to focus attention on the scale of the hazard that remains post-treatment. secondly, we propose a new visual aid, the pathogen hazard Diagram, to assist in identifying the likely location and scale of hazards in practice. our focus in this paper is improving our sector’s capacity to reduce the pathogen hazards of water-based sanitation at the household and community scale, based on our experience in Indonesia, with a view to improving the efficacy of sanitation system investment, for new systems and for renovating existing systems.
our aim is to complement current initiatives that seek to reduce public health risk (such as the sfD promotion Initiative (2015), which highlights the potential public health hazards in a city’s sanitation system; sanipath (2015), which focuses on addressing exposure pathways; and the Who’s sanitation safety planning Manual (2015), which takes a generic, risk-based approach) by generating discussion and debate that draws attention to hazards that are inadvertently neglected in practice. our practice-based research institute (Institute for sustainable futures) seeks to progress public dialogue to motivate and facilitate action to improve outcomes, and it is in this spirit that the authors offer the pathogen hazard Diagram. as the first version of a conceptual tool, the authors welcome critical, constructive feedback.
Occasional/periodicsludge removal
Piped effluentInfluent
Leakage
Leakage
Leachate
Treatment unite.g. septic tank
Figure 2 Our area of concern: discharges from water-based sanitation at household or local scale
http
://w
ww
.dev
elop
men
tboo
kshe
lf.c
om/d
oi/p
df/1
0.33
62/1
756-
3488
.201
6.01
4 -
Tue
sday
, Mar
ch 0
7, 2
017
7:29
:20
PM -
IP
Add
ress
:220
.101
.23.
22
MaKING PaTHOGEN HaZaRDS VISIBLE 167
Waterlines Vol. 35 No. 2 April 2016
Pathogen hazards: exploring the fundamentals
During the conceptual development of the pathogen hazard Diagram, we became aware of three factors that may inadvertently contribute to the invisibility of pathogens. firstly, we became aware that the term ‘pathogen’ is surprisingly rare within the sector (e.g. the term is absent in the latrine focus of the MDgs and in sanitation design guidelines in Indonesia). secondly, there is incredible biological diversity and complexity encompassed within the generic term ‘pathogen’, which makes generalizations difficult. thirdly, we noticed a fundamental disjunct: although pathogen presence is generally noted in exponential terms (ten to the power of another number), removal performance is often noted in arithmetic terms (e.g. 90 per cent reduction) which although correct, may be misleading. In this section, we explore these observations and show why there is therefore a need to pay more and different attention to the liquid stream.
The term ‘pathogen’ is often absent
While there have been many impressive developments focusing attention on the need for sanitation to improve health outcomes, pathogens have been an implicit rather than explicit focus, which may impact the scale of outcomes. for example, the sDgs’ shift in focus from latrines to the sanitation service chain may implicitly seek pathogen risk reduction, but the near-finalized sDg indicators do little to directly link performance of sanitation systems with pathogen reduction. although ‘safely managed sanitation systems’ is an indicator, there is as yet no clear definition of what ‘safely managed’ means.
Economic analyses of costs and benefits of sanitation, a powerful lever for increasing sanitation spending (hutton, 2013), necessarily require high-level and simplifying assumptions. however, one potentially problematic simplifying assumption is that all technology reduces pathogen content as intended (e.g. Wsp, 2011: 111) – so on-site septic tanks without secondary treatment are incorrectly assumed to be at the upper rungs of the sanitation ladder (Wsp, 2011: 95). for septic tank analyses, including the costs of reducing hazard or exposure to deliver higher levels of health protection would provide a more representative assessment of relative costs and benefits.
Pathogen risk determinants
In this section, we explore the diversity of pathogen biology in relation to deter-minants of risk (hazard and exposure) and efficacy of hazard reduction options. there are four classes of pathogens (viruses, bacteria, protozoa, and helminths) and between and within these classes there is great diversity in everything that matters in terms of defining and assessing the hazard that pathogens may or may not represent to humans. When the World health organization (Who) first considered the reuse of human waste, they identified the complexity of the situation and designated five key determinants of higher infection risk (Who, 2006), encompassing both hazards and exposure pathways (table 1).
http
://w
ww
.dev
elop
men
tboo
kshe
lf.c
om/d
oi/p
df/1
0.33
62/1
756-
3488
.201
6.01
4 -
Tue
sday
, Mar
ch 0
7, 2
017
7:29
:20
PM -
IP
Add
ress
:220
.101
.23.
22
168 C. MITCHELL ET aL.
April 2016 Waterlines Vol. 35 No. 2
Table 1 Key determinants of pathogen risk in reuse of human waste
Key determinants of risk (WHO, 2006) Explanations and examples
Long persistence in the environment Helminth eggs can survive for months or years; bacteria, protozoa, and viruses typically for days or weeks (Feachem et al., 1983)
Long latency The interval between the time that a pathogen is excreted and the time that it can infect a new host
No concurrent exposure paths Exposure to faecal material is the only exposure route
Little or no human immunity Humans can develop immunity to most viruses, but not to protozoa or helminths. Increased prevalence of a disease in a community means increased pathogen production and higher instances of immunity where possible
Low minimum infective dose The minimum infective dose can range from relatively low to high (data from Leclerc et al., 2004 unless specified):
a. Helminths, e.g. Ascaris 1–10 eggs (Feachem, 1983)b. Viruses, e.g. rotavirus 1–10 organismsc. Protozoa, e.g. Giardia 100–102 cystsd. Bacteria, e.g. Escherichia coli O157:H7, Shigella and
Campylobacter species, 101–103 organismse. Enteric pathogens 107–108 organisms
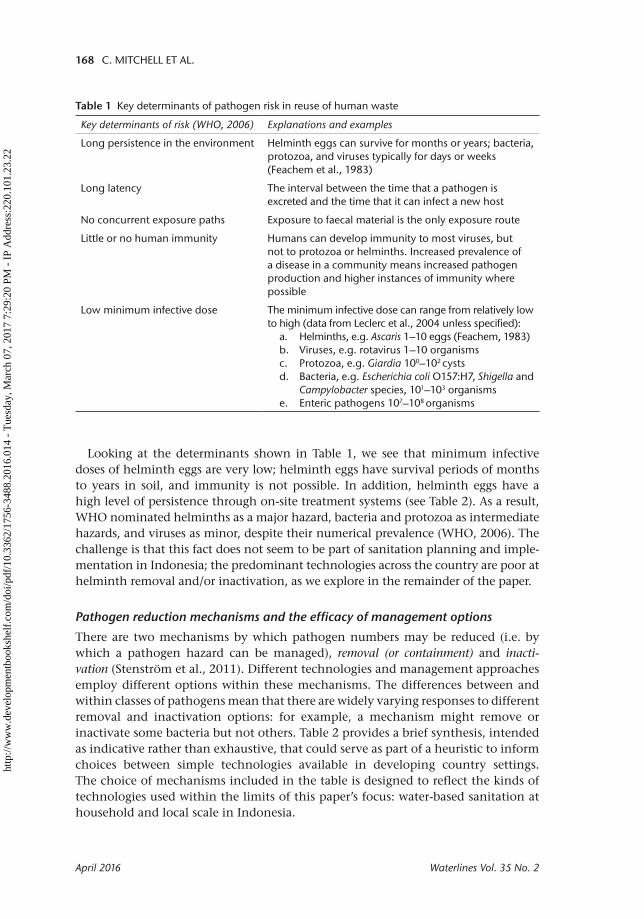
looking at the determinants shown in table 1, we see that minimum infective doses of helminth eggs are very low; helminth eggs have survival periods of months to years in soil, and immunity is not possible. In addition, helminth eggs have a high level of persistence through on-site treatment systems (see table 2). as a result, Who nominated helminths as a major hazard, bacteria and protozoa as intermediate hazards, and viruses as minor, despite their numerical prevalence (Who, 2006). the challenge is that this fact does not seem to be part of sanitation planning and imple-mentation in Indonesia; the predominant technologies across the country are poor at helminth removal and/or inactivation, as we explore in the remainder of the paper.
Pathogen reduction mechanisms and the efficacy of management options
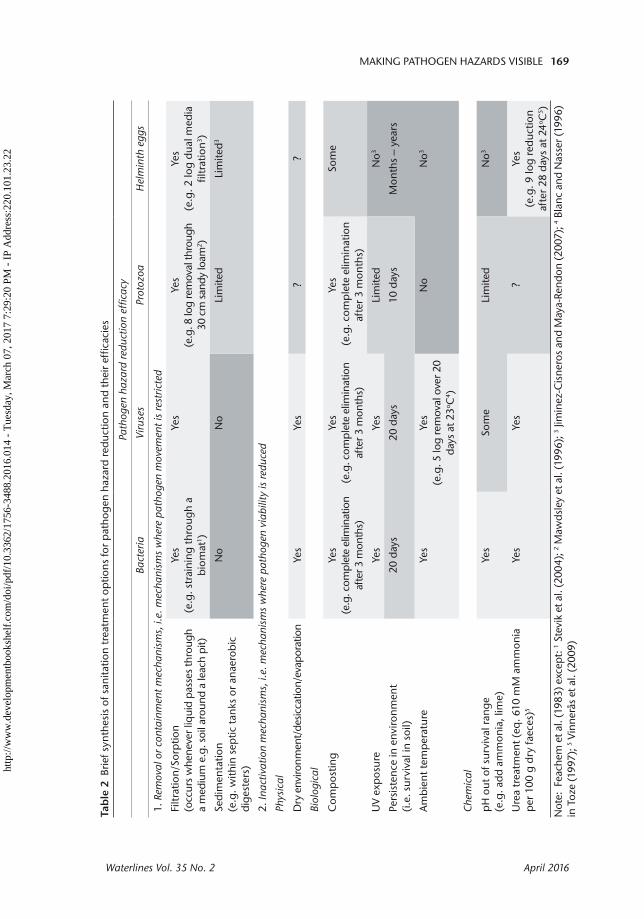
there are two mechanisms by which pathogen numbers may be reduced (i.e. by which a pathogen hazard can be managed), removal (or containment) and inacti-vation (stenström et al., 2011). Different technologies and management approaches employ different options within these mechanisms. the differences between and within classes of pathogens mean that there are widely varying responses to different removal and inactivation options: for example, a mechanism might remove or inactivate some bacteria but not others. table 2 provides a brief synthesis, intended as indicative rather than exhaustive, that could serve as part of a heuristic to inform choices between simple technologies available in developing country settings. the choice of mechanisms included in the table is designed to reflect the kinds of technologies used within the limits of this paper’s focus: water-based sanitation at household and local scale in Indonesia.
http
://w
ww
.dev
elop
men
tboo
kshe
lf.c
om/d
oi/p
df/1
0.33
62/1
756-
3488
.201
6.01
4 -
Tue
sday
, Mar
ch 0
7, 2
017
7:29
:20
PM -
IP
Add
ress
:220
.101
.23.
22
MaKING PaTHOGEN HaZaRDS VISIBLE 169
Waterlines Vol. 35 No. 2 April 2016
Tab
le 2
Brie
f syn
thes
is o
f san
itatio
n tr
eatm
ent o
ptio
ns fo
r p
atho
gen
haz
ard
redu
ctio
n an
d th
eir
effic
acie
s
Path
ogen
haz
ard
redu
ctio
n ef
ficac
y
Bact
eria
Viru
ses
Prot
ozoa
Hel
min
th e
ggs
1. R
emov
al o
r co
ntai
nmen
t mec
hani
sms,
i.e.
mec
hani
sms
whe
re p
atho
gen
mov
emen
t is
rest
ricte
d
Filtr
atio
n/So
rptio
n (o
ccur
s w
hene
ver l
iqui
d p
asse
s th
roug
h a
med
ium
e.g
. soi
l aro
und
a le
ach
pit)
Yes
(e.g
. str
aini
ng t
hrou
gh a
bi
omat
1 )
Yes
Yes
(e.g
. 8 lo
g re
mov
al th
roug
h 30
cm
san
dy lo
am2 )
Yes
(e.g
. 2 lo
g du
al m
edia
fil
trat
ion3 )
Sedi
men
tatio
n(e
.g. w
ithin
sep
tic t
anks
or
anae
robi
c di
ges
ters
)
No
No
Lim
ited
Lim
ited3
2. In
activ
atio
n m
echa
nism
s, i.
e. m
echa
nism
s w
here
pat
hoge
n vi
abili
ty is
redu
ced
Phys
ical
Dry
env
ironm
ent/
desic
catio
n/ev
apor
atio
nYe
sYe
s?
?
Biol
ogic
al
Com
pos
ting
Yes
(e.g
. com
plet
e el
imin
atio
n af
ter 3
mon
ths)
Yes
(e.g
. com
ple
te e
limin
atio
n af
ter 3
mon
ths)
Yes
(e.
g. c
omp
lete
elim
inat
ion
afte
r 3
mon
ths)
Som
e
UV
exp
osur
eYe
sYe
sLi
mite
dN
o3
Pers
iste
nce
in e
nviro
nmen
t (i.
e. s
urvi
val i
n so
il)
20 d
ays
20 d
ays
10 d
ays
Mon
ths
– ye
ars
am
bien
t tem
per
atur
eYe
sYe
s(e
.g. 5
log
rem
oval
ove
r 20
days
at 2
3o C4 )
No
No3
Chem
ical
pH
out
of s
urvi
val r
ang
e (e
.g. a
dd a
mm
onia
, lim
e)Ye
sSo
me
Lim
ited
No3
Ure
a tr
eatm
ent (
eq. 6
10 m
M a
mm
onia
p
er 1
00 g
dry
faec
es)5
Yes
Yes
?Ye
s(e
.g. 9
log
redu
ctio
n af
ter
28 d
ays
at 2
4o C5 )
Not
e: F
each
em e
t al.
(198
3) e
xcep
t: 1 S
tevi
k et
al.
(200
4); 2 M
awds
ley
et a
l. (1
996)
; 3 Jim
inez
-Cis
nero
s an
d M
aya-
Rend
on (2
007)
; 4 Bla
nc a
nd N
asse
r (19
96)
in T
oze
(199
7); 5 V
inne
rås
et a
l. (2
009)
http
://w
ww
.dev
elop
men
tboo
kshe
lf.c
om/d
oi/p
df/1
0.33
62/1
756-
3488
.201
6.01
4 -
Tue
sday
, Mar
ch 0
7, 2
017
7:29
:20
PM -
IP
Add
ress
:220
.101
.23.
22
170 C. MITCHELL ET aL.
April 2016 Waterlines Vol. 35 No. 2
the authors are acutely aware that generalizations concerning pathogen removal are problematic – for example, stevik et al.’s comprehensive review (2004) makes clear that survival of pathogenic bacteria in soils is not well understood – there are about a dozen potential mechanisms at play. a similar situation probably exists for the other three classes of pathogens; that is, there are multiple mechanisms operating. In addition, considering the focus of this paper on water-based sanitation at the household and local scale, the volume of water added to faecal waste varies enormously in practice, from 10 l per person per day (a pour flush toilet) to 200 l (a flush toilet and all other wastewater) per person per day. nonetheless, we believe some clear lines of sight are possible.
What table 2 makes clear is that many mechanisms are not efficacious across all pathogen classes, particularly helminth eggs, designated as the highest risk by Who (2006). It is equally clear that filtration and sorption are efficacious across all classes. this is significant in the practice of water-based sanitation at household and local scale in Indonesia, as we show in the following section, but before that, we want to explore one more fundamental concept, the (mis)representation of pathogen numbers and reductions.
The (mis)representation of pathogen numbers
pathogen numbers are large, and so are reported in exponential terms: for example, a person produces between 109 and 1010 bacteria per day (feachem et al., 1983: 34) (this compares well with lowe et al.’s (2007) review, which found 103–108/100 ml in septic tank influent). an infected person could produce 1010–1012 viral particles per day (leclerc et al., 2004: 390; Mccray et al., 2009: 2–34), 107 protozoa, and 104–106 helminth eggs (feachem et al., 1983: 34).
treatment technology performance is typically therefore reported in log reduc-tions (see table 2). for example, a well-sealed septic tank may remove 0–2 log10 units of helminth eggs (feachem et al., 1983: 86). If we assume the best performance of 2 log removal, in arithmetic terms, this is a 99 per cent reduction, which sounds like an excellent outcome. however, as shown in figure 3, that means the treated liquid effluent contains the remaining 102–104 helminth eggs (i.e. 100–10,000 eggs). this matters because the minimum infective dose of helminths is 1 to 10 particles (i.e. 100–101 eggs) (e.g. feachem et al., 1983). In other words, the liquid discharge from a well-sealed and well-functioning septic tank treating the waste of an infected individual could include up to 104 (10,000) infective doses per day.
In figure 3, both representations of the reduction in pathogen numbers are correct (i.e. they both represent 10,000 remaining eggs, or 99 per cent removal). the arithmetic representation however suggests that there is little to worry about in the liquid discharge. the logarithmic representation suggests otherwise, consistent with the potential for infective doses remaining in the example elucidated above. We suggest that a logarithmic representation of pathogen hazard is more likely to suggest a need for attention and action, whether the units are pathogen numbers (e.g. number excreted per person per day), pathogen concentration (e.g. colony forming units/100 ml), or infective doses.
http
://w
ww
.dev
elop
men
tboo
kshe
lf.c
om/d
oi/p
df/1
0.33
62/1
756-
3488
.201
6.01
4 -
Tue
sday
, Mar
ch 0
7, 2
017
7:29
:20
PM -
IP
Add
ress
:220
.101
.23.
22

MaKING PaTHOGEN HaZaRDS VISIBLE 171
Waterlines Vol. 35 No. 2 April 2016
We suggest that performance should not be solely assessed based on arithmetic percentage reduction, but rather through a more holistic assessment oriented towards impact: for this technology in this location with these local water-using practices, where do the pathogens go and, from first principles, what kinds of pathogen numbers would we expect in these streams? armed with this kind of heuristic, local health and sanitation professionals can then assess the potential exposure pathways and judge whether the situation is acceptable. the pathogen hazard Diagram is intended to facilitate and visualize this kind of assessment.
Introducing the Pathogen Hazard Diagram
synthesizing the arguments and ideas presented so far, we believe, at least in Indonesia, there is value in a new pathogen hazard identification and assessment heuristic. the conceptual shift is to go from focusing on ‘what is removed?’ to ‘what remains and is it a risk based on likely exposure pathways?’ In figure 4, we present our response to this need: a pathogen hazard Diagram. to be useful in practice, this new heuristic would need to be both conceptually consistent (i.e. the form of the diagram reflects the situation and makes the message clear) and readily constructed in the field. there have been many beta versions of the diagram developed and tested through our research to date, and we have been encouraged by our Indonesian colleagues to continue developing the concept. We expect the form of the diagram to continue to evolve, should practitioners see value in it, so we welcome feedback.
In this section, we introduce the pathogen hazard Diagram concept, and in the following section, we apply it to the three most common situations found in water-based sanitation at the household and local level in Indonesia.
as elucidated below, the pathogen hazard Diagram includes two important dimensions for assessing treatment system efficacy: the scale of the pathogen hazards leaving the treatment system in liquid form and the receiving location of those hazards.
this version of the pathogen hazard Diagram has been developed to help improve water-based sanitation at household and local scale as we have experienced it in
1,000,000 1,000,000a) 106 106
104
102
100
5 x 10⁵
0
750,00010,000
100
1
500,000
250,000
0
Arithmetic representation
99% removal
99% removal
Logarithmic representation
b)
Figure 3 Difference between arithmetic and logarithmic representations of pathogen numbers: two representations of ‘99 per cent removal’ of helminth eggs produced each day by one infected person
http
://w
ww
.dev
elop
men
tboo
kshe
lf.c
om/d
oi/p
df/1
0.33
62/1
756-
3488
.201
6.01
4 -
Tue
sday
, Mar
ch 0
7, 2
017
7:29
:20
PM -
IP
Add
ress
:220
.101
.23.
22
172 C. MITCHELL ET aL.
April 2016 Waterlines Vol. 35 No. 2
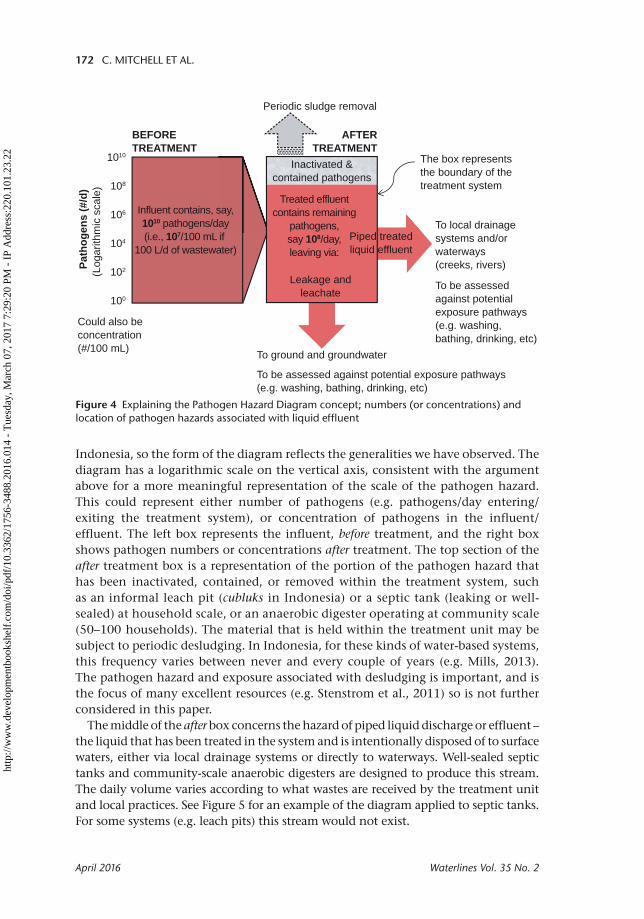
Indonesia, so the form of the diagram reflects the generalities we have observed. the diagram has a logarithmic scale on the vertical axis, consistent with the argument above for a more meaningful representation of the scale of the pathogen hazard. this could represent either number of pathogens (e.g. pathogens/day entering/exiting the treatment system), or concentration of pathogens in the influent/effluent. the left box represents the influent, before treatment, and the right box shows pathogen numbers or concentrations after treatment. the top section of the after treatment box is a representation of the portion of the pathogen hazard that has been inactivated, contained, or removed within the treatment system, such as an informal leach pit (cubluks in Indonesia) or a septic tank (leaking or well-sealed) at household scale, or an anaerobic digester operating at community scale (50–100 households). the material that is held within the treatment unit may be subject to periodic desludging. In Indonesia, for these kinds of water-based systems, this frequency varies between never and every couple of years (e.g. Mills, 2013). the pathogen hazard and exposure associated with desludging is important, and is the focus of many excellent resources (e.g. stenstrom et al., 2011) so is not further considered in this paper.
the middle of the after box concerns the hazard of piped liquid discharge or effluent – the liquid that has been treated in the system and is intentionally disposed of to surface waters, either via local drainage systems or directly to waterways. Well-sealed septic tanks and community-scale anaerobic digesters are designed to produce this stream. the daily volume varies according to what wastes are received by the treatment unit and local practices. see figure 5 for an example of the diagram applied to septic tanks. for some systems (e.g. leach pits) this stream would not exist.
To ground and groundwater
Could also beconcentration(#/100 mL)
1010
108
106
104
102
100
To local drainagesystems and/orwaterways(creeks, rivers)
The box represents the boundary of thetreatment system
Periodic sludge removal
BEFORETREATMENT
Path
ogen
s (#
/d)
(Log
arith
mic
sca
le)
AFTERTREATMENT
To be assessed against potential exposure pathways (e.g. washing, bathing, drinking, etc)
To be assessedagainst potentialexposure pathways(e.g. washing,bathing, drinking, etc)
Influent contains, say,1010 pathogens/day(i.e., 107/100 mL if
100 L/d of wastewater)
Inactivated &contained pathogens
Piped treatedliquid effluent
Leakage andleachate
Treated effluentcontains remaining
pathogens,say 108/day,leaving via:
Figure 4 Explaining the Pathogen Hazard Diagram concept; numbers (or concentrations) and location of pathogen hazards associated with liquid effluent
http
://w
ww
.dev
elop
men
tboo
kshe
lf.c
om/d
oi/p
df/1
0.33
62/1
756-
3488
.201
6.01
4 -
Tue
sday
, Mar
ch 0
7, 2
017
7:29
:20
PM -
IP
Add
ress
:220
.101
.23.
22

MaKING PaTHOGEN HaZaRDS VISIBLE 173
Waterlines Vol. 35 No. 2 April 2016
the lowest part of the after box comprises the two potential streams directed towards soil, and which may or may not reach groundwater, depending on local conditions. one of these potential streams is intentional – the leachate that leaves a cubluk in Indonesia, for example. the other stream is leakage and is unintentional – it is associated with systems that were designed not to leak, but are leaking anyway, because of broken pipes, poorly constructed tanks, or operational damage. for a well-sealed septic tank, these streams would not exist.
We recognize that pathogen monitoring is complex, costly, and rare, so there is very little local information on pathogen prevalence in Indonesia. for that reason, the pathogen hazard Diagram needs to be able to be constructed without local data, using instead first principles and basic sanitation sector knowledge (such as feachem et al.’s (1983) classic work) of pathogen production, prevalence, and hazard reduction options (such as those elaborated in table 2) embedded in local practices. a pathogen hazard Diagram can therefore draw attention to where local pathogen monitoring should occur, were the opportunity available to do so, as well as helping to make an argument for resources being directed towards local monitoring.
the scale on the pathogen hazard Diagram could be reported as numbers of pathogens, as we have done here and in the following figures, or as a concentration. Bacteria are often reported as cfu/100 ml, so if we assumed 100 l of water was added to a septic system per person per day, then the production numbers noted above (109–1010 bacteria per day according to feachem et al., 1983) would become, for example, 106–107 bacteria per 100 ml of septic influent. the concentration of pathogens matters a great deal in the exposure pathway component of risk assessment, because it determines how much contaminated water an exposed individual would need to ingest.
Applying the Pathogen Hazard Diagram
In this section, we apply the pathogen hazard Diagram to three common scenarios in water-based sanitation at the household and local community scale in Indonesia. the latest statistics from Indonesia suggest that 77 per cent of the population is served by on-site systems, ranging from well-sealed septic tanks to less formal, unsealed cubluks. figure 5 shows the pathogen hazard Diagram for a system for the former, and figures 6 and 7 explore the two most common scenarios for the latter.
Mills’ (2013) study of nearly 200 on-site household systems across six cities in Indonesia identified 16 per cent of systems with a well-sealed design. Mills also identified that septic tanks in Indonesia are likely to be small (around 0.5–1 m3) and therefore have a low hydraulic residence time, are unlikely to be baffled, and are unlikely to be desludged.
according to feachem et al. (1983), ‘in a septic tank having a normal retention time (1–3 days), the effluent produced will be rich in all pathogens contained in the influent’. feachem et al. (1983: 86) estimate 0–2 log removal for all four classes of pathogens in well-designed septic tanks with residence times from 1 to 3 days. stenström et al. (2011) suggest even less: 1 log or less for the helminths hookworm and Ascaris, 0.5 log for bacteria. the Who sanitation safety planning guide (2015: 129) suggests removal of helminth eggs is less than 0.5 log.
http
://w
ww
.dev
elop
men
tboo
kshe
lf.c
om/d
oi/p
df/1
0.33
62/1
756-
3488
.201
6.01
4 -
Tue
sday
, Mar
ch 0
7, 2
017
7:29
:20
PM -
IP
Add
ress
:220
.101
.23.
22
174 C. MITCHELL ET aL.
April 2016 Waterlines Vol. 35 No. 2
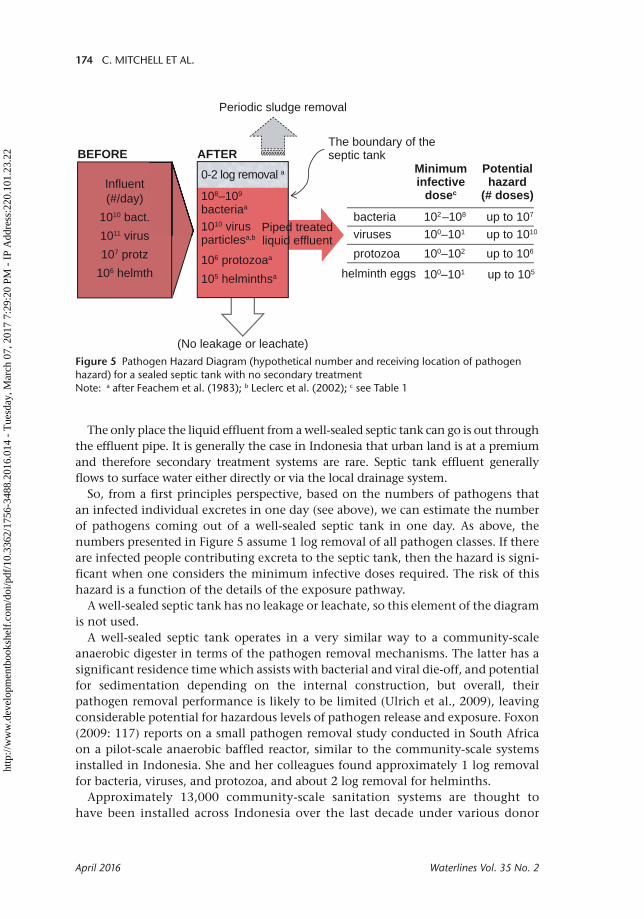
the only place the liquid effluent from a well-sealed septic tank can go is out through the effluent pipe. It is generally the case in Indonesia that urban land is at a premium and therefore secondary treatment systems are rare. septic tank effluent generally flows to surface water either directly or via the local drainage system.
so, from a first principles perspective, based on the numbers of pathogens that an infected individual excretes in one day (see above), we can estimate the number of pathogens coming out of a well-sealed septic tank in one day. as above, the numbers presented in figure 5 assume 1 log removal of all pathogen classes. If there are infected people contributing excreta to the septic tank, then the hazard is signi-ficant when one considers the minimum infective doses required. the risk of this hazard is a function of the details of the exposure pathway.
a well-sealed septic tank has no leakage or leachate, so this element of the diagram is not used.
a well-sealed septic tank operates in a very similar way to a community-scale anaerobic digester in terms of the pathogen removal mechanisms. the latter has a significant residence time which assists with bacterial and viral die-off, and potential for sedimentation depending on the internal construction, but overall, their pathogen removal performance is likely to be limited (ulrich et al., 2009), leaving considerable potential for hazardous levels of pathogen release and exposure. foxon (2009: 117) reports on a small pathogen removal study conducted in south africa on a pilot-scale anaerobic baffled reactor, similar to the community-scale systems installed in Indonesia. she and her colleagues found approximately 1 log removal for bacteria, viruses, and protozoa, and about 2 log removal for helminths.
approximately 13,000 community-scale sanitation systems are thought to have been installed across Indonesia over the last decade under various donor
Influent(#/day)
1010 bact.1011 virus107 protz
106 helmth
BEFORE AFTER
(No leakage or leachate)
Periodic sludge removal
0-2 log removal a
The boundary of theseptic tank
bacteria 102–108 up to 107
108–109
bacteriaa
1010 virusparticlesa,b
106 protozoaa
105 helminthsa
viruses 100–101 up to 1010
protozoa 100–102 up to 106
helminth eggs 100–101 up to 105
Minimuminfective
dosec
Potentialhazard
(# doses)
Piped treatedliquid effluent
Figure 5 Pathogen Hazard Diagram (hypothetical number and receiving location of pathogen hazard) for a sealed septic tank with no secondary treatment Note: a after Feachem et al. (1983); b Leclerc et al. (2002); c see Table 1
http
://w
ww
.dev
elop
men
tboo
kshe
lf.c
om/d
oi/p
df/1
0.33
62/1
756-
3488
.201
6.01
4 -
Tue
sday
, Mar
ch 0
7, 2
017
7:29
:20
PM -
IP
Add
ress
:220
.101
.23.
22
MaKING PaTHOGEN HaZaRDS VISIBLE 175
Waterlines Vol. 35 No. 2 April 2016
Influent(#/day)
1010 bact.1011 virus107 protz
106 helmth
Logs retained andremoved by
system (incl. soil)is unknown,
but likelyto be high
leakage andleachate
BEFORE AFTER
(No periodic sludge removal)
The boundary of thecubluk plus adjacent soil
(No piped effluent)
Multiple mechanisms reducing pathogen hazard (See Table 2): Containment,Filtration/Absorption, Desiccation, Persistence, Temperature, etc.
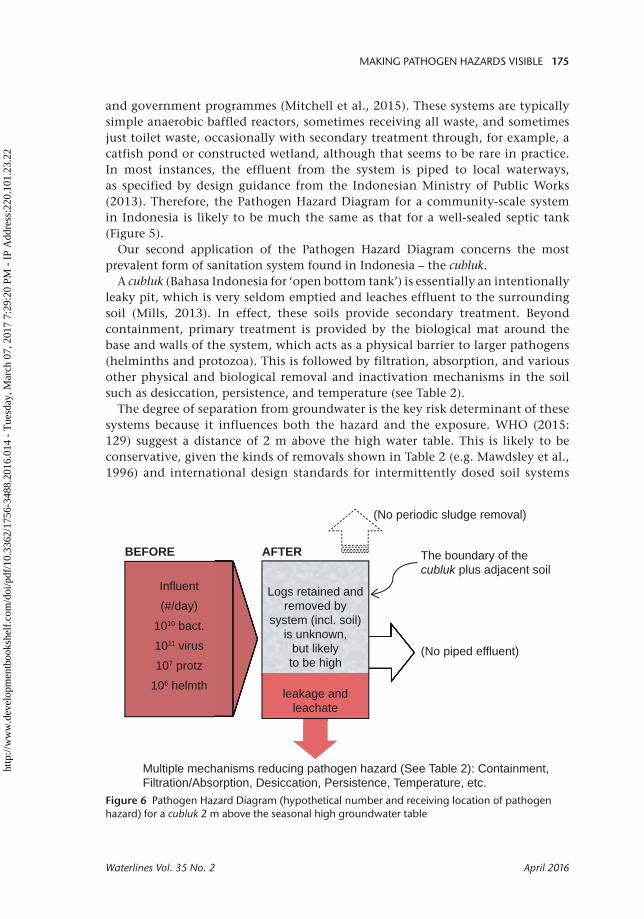
Figure 6 Pathogen Hazard Diagram (hypothetical number and receiving location of pathogen hazard) for a cubluk 2 m above the seasonal high groundwater table
and government programmes (Mitchell et al., 2015). these systems are typically simple anaerobic baffled reactors, sometimes receiving all waste, and sometimes just toilet waste, occasionally with secondary treatment through, for example, a catfish pond or constructed wetland, although that seems to be rare in practice. In most instances, the effluent from the system is piped to local waterways, as specified by design guidance from the Indonesian Ministry of public Works (2013). therefore, the pathogen hazard Diagram for a community-scale system in Indonesia is likely to be much the same as that for a well-sealed septic tank (figure 5).
our second application of the pathogen hazard Diagram concerns the most prevalent form of sanitation system found in Indonesia – the cubluk.
a cubluk (Bahasa Indonesia for ‘open bottom tank’) is essentially an intentionally leaky pit, which is very seldom emptied and leaches effluent to the surrounding soil (Mills, 2013). In effect, these soils provide secondary treatment. Beyond containment, primary treatment is provided by the biological mat around the base and walls of the system, which acts as a physical barrier to larger pathogens (helminths and protozoa). this is followed by filtration, absorption, and various other physical and biological removal and inactivation mechanisms in the soil such as desiccation, persistence, and temperature (see table 2).
the degree of separation from groundwater is the key risk determinant of these systems because it influences both the hazard and the exposure. Who (2015: 129) suggest a distance of 2 m above the high water table. this is likely to be conservative, given the kinds of removals shown in table 2 (e.g. Mawdsley et al., 1996) and international design standards for intermittently dosed soil systems
http
://w
ww
.dev
elop
men
tboo
kshe
lf.c
om/d
oi/p
df/1
0.33
62/1
756-
3488
.201
6.01
4 -
Tue
sday
, Mar
ch 0
7, 2
017
7:29
:20
PM -
IP
Add
ress
:220
.101
.23.
22

176 C. MITCHELL ET aL.
April 2016 Waterlines Vol. 35 No. 2
receiving septic tank effluent, which specify much smaller distances: for example, 0.5 m (usEpa 2002: 4–5) for absorption trenches and 0.3–1.3 m for Wisconsin Mounds (EtI, 1998). Movement of liquid will also be a function of local soil conditions, build-up of organic materials, effluent volumes and flowrates, and so forth.
there appears to be very little, if any, field data about pathogen movement in these systems in Indonesia or elsewhere, but a first principles approach, using data from studies elsewhere, would suggest, antithetically, that a cubluk above the seasonal high groundwater table may be managing the pathogen hazard quite well, and certainly better than a well-sealed septic tank connected to local drainage and water-courses. this suggestion accords with Kolsky (2015), whose model suggests ‘unsafe return’ actually increases and ‘safe return’ decreases as sewers replace improved pit toilets in ghana.
figure 7, on the other hand, represents a cubluk that is periodically inundated; that is, it becomes hydraulically connected to the groundwater table. under these conditions, the function of the adjacent soil as a treatment device is reduced, but by how much is difficult to predict, and again there is very little, if any, field data. larger pathogens (helminths and protozoa) will still be more readily filtered out than smaller pathogens, and Who (2006) does nominate helminths as the highest risk. the question of setback distances then becomes particularly significant for exposure pathways – in Jakarta, 60 per cent of homes are reported to have wells within 3 m of a septic tank (tejalaksana, 2010).
Influent(#/day)
1010 bact.
1011 virus
107 protz
106 helmth
Logs retained andremoved by system
is unknown
BEFORE AFTER
(No periodic sludge removal)
The boundary of the cubluk
(No piped effluent)
Multiple mechanisms reducing pathogen hazard (See Table 2): Containment,Filtration/Absorption, Persistence, Temperature, etc.
Figure 7 Pathogen Hazard Diagram (hypothetical number and receiving location of pathogen hazard) for a cubluk periodically inundated via the groundwater table
http
://w
ww
.dev
elop
men
tboo
kshe
lf.c
om/d
oi/p
df/1
0.33
62/1
756-
3488
.201
6.01
4 -
Tue
sday
, Mar
ch 0
7, 2
017
7:29
:20
PM -
IP
Add
ress
:220
.101
.23.
22

MaKING PaTHOGEN HaZaRDS VISIBLE 177
Waterlines Vol. 35 No. 2 April 2016
How could the Pathogen Hazard Diagram help at scale?
as illustrated in the preceding discussion, pathogen hazard Diagrams are developed through a process of ‘thought experiments’ for specific contexts using available information even when specific and reliable pathogen data is not available. our intention is to help to draw attention to what existing treatment technologies actually do and do not achieve in practice, with respect to pathogen removal; what levels of pathogens are likely to remain in effluents; and where those pathogens go in the environment, enabling identification of potential local exposure pathways. our goal is to help inform and improve risk-based sanitation planning and implementation.
In addition to complementing existing risk-based approaches, the pathogen hazard Diagram can potentially help ‘at scale’, for example in guiding national and local policy, in assessing the need for additional treatment, and in directing monitoring resources.
across Indonesia, a lack of awareness of the practical pathogen hazards of popular sanitation systems may inadvertently contribute to worsening the health situation. there is at present a move in Indonesia to replace leaching/leaking cubluks with well-sealed septic tanks, which would then discharge into drainage channels and local waterways. In addition, in order to meet current national government targets, Indonesia plans to invest in a further 100,000 community-scale systems in the next few years (Mitchell et al., 2015). Discharging these effluents into waterways occurs without awareness of the hazard, and therefore without consideration of the potential risk. the pathogen hazard Diagram could help to direct attention to the remaining hazard in the effluent stream and to encourage investment, firstly, in understanding the situation a little better, including potential exposure pathways and possibly pathogen monitoring, and secondly, in systems and retrofits that will actually reduce the hazard and the risk.
for example, a comparison of the pathogen hazard Diagrams can reveal that septic tanks that drain effluent to surface waters (figure 5) may perform worse than well–placed cubluks (figure 6). although upgrading cubluks to septic tanks may be viewed as a step up on the ‘sanitation ladder’ (unDp, 2006), the pathogen hazard Diagram can highlight where such a step may increase the hazard. on the other hand, if cubluks are performing poorly (figure 7) an upgrade to septic tanks with effluent sewers that transport effluent for off-site secondary treatment (Who, 2015) can bring significant improvements in hazard reduction.
the pathogen hazard Diagram also reveals that local-scale sanIMas systems are likely to release a significant hazard direct to waterways, so the national guidelines could require a form of secondary treatment (e.g. an unsealed constructed wetland or simple sand filter).
at a local level, applying the pathogen hazard Diagram heuristic could help with monitoring in two ways. Where resources are available to monitor, the pathogen hazard Diagram could direct where monitoring should occur. Where monitoring resources are not yet available, the pathogen hazard Diagram can help to show the need for and value of local monitoring.
http
://w
ww
.dev
elop
men
tboo
kshe
lf.c
om/d
oi/p
df/1
0.33
62/1
756-
3488
.201
6.01
4 -
Tue
sday
, Mar
ch 0
7, 2
017
7:29
:20
PM -
IP
Add
ress
:220
.101
.23.
22
178 C. MITCHELL ET aL.
April 2016 Waterlines Vol. 35 No. 2
at a global level, there is increasing awareness of the need to pay attention to liquid effluents (e.g. Williams et al., 2015). the pathogen hazard Diagram makes clear that there are significant knowledge gaps in terms of pathogen fate and transport at the local level, and so it helps to direct global research programmes to fill this gap, including developing new, simple technologies that reduce the pathogen hazard as early as practical in the sanitation chain.
Conclusion
While great progress is being made in sanitation planning and implementation, in practice, at least in Indonesia, the liquid stream from water-based sanitation receives scant attention, despite the fact that the scale of the pathogen hazard in this stream is sometimes considerable. risk comprises both hazard and exposure pathways. In Indonesia, exposure pathways are significant, with questionable and/or limited treatment of both piped and informal water supplies, so reducing the public health hazard at source represents a valuable intervention. a simple heuristic that is power-fully visual and that requires only local knowledge and general sanitation reference knowledge can help to focus attention on what matters, and therefore guide local sanitation investment decisions towards new and retrofit technologies that reduce the pathogen hazard.
Acknowledgements
the authors would like to sincerely thank those who provided valuable feedback during the development of this paper: associate professor Juliet Willetts, university of technology sydney; the two reviewers of the first manuscript; Jim coucouvinis, Indonesia Infrastructure Initiative; and professor peter Kolsky, university of north carolina.
References
Bill & Melinda gates foundation (2010) Water, Sanitation & Hygiene Fact Sheet [pdf] <https://docs.gatesfoundation.org/documents/water-sanitation-hygiene-fact-sheet-2010.pdf> [accessed 3 March 2016].
Blackett, I., hawkins, p. and heymans, c. (2014) The Missing Link in Sanitation Service Delivery: A Review of Fecal Sludge Management in 12 Cities, pp. 1–8, targeting the urban poor and Improving services in small towns, Water and sanitation program research Brief, Washington, Dc: Wsp.
Environmental technology Initiative (EtI) (1998) Mound Systems: Fact Sheet [pdf], Morgantown, WV: national small flows clearinghouse <www.nesc.wvu.edu/pdf/WW/publications/eti/mounds_tech.pdf> [accessed 29 february 2016].
feachem, r.g., Bradley, D.J., garelick, h. and Mara, D.D. (1983) Sanitation and Disease: Health Aspects of Excreta and Wastewater Management, new York: John Wiley & sons <http://go.worldbank.org/Zs7f3M9xg1> [accessed 29 february 2016].
http
://w
ww
.dev
elop
men
tboo
kshe
lf.c
om/d
oi/p
df/1
0.33
62/1
756-
3488
.201
6.01
4 -
Tue
sday
, Mar
ch 0
7, 2
017
7:29
:20
PM -
IP
Add
ress
:220
.101
.23.
22
MaKING PaTHOGEN HaZaRDS VISIBLE 179
Waterlines Vol. 35 No. 2 April 2016
foxon, K.M. (2009) Analysis of a Pilot Scale Anaerobic Baffled Reactor Treating Domestic Wastewater, phD thesis, Durban, south africa: university of KwaZulu-natal.
hutton, g. (2013) ‘global costs and benefits of drinking-water supply and sanitation interven-tions to reach the MDg target and universal coverage’, Journal of Water and Health 11(1): 1–12 <http://dx.doi.org/10.2166/wh.2012.105>.
Indonesian Ministry of public Works (2013) petunjuk pelaksanaan Dala alokasi Khusus sanitasi lingkungan Berbasis Masyarakat (Implementation guidelines for community based sanitation funded by special allocation grant DaK slBM), Jakarta: Indonesian Ministry of public Works.
Jimenez-cisneros, B.E. and Maya-rendon, c. (2007) ‘helminths and sanitation’, in a. Méndez-Vilas (ed.), Communicating Current Research and Educational Topics and Trends in Applied Microbiology, 1, pp. 60–71, Extremadura: formatex <http://www.formatex.org/microbio/> [accessed 3 March 2016].
Kolsky, p. (2015) ‘can we estimate what happens after the toilet, and is it worth trying?’ presentation at the Water and Health Conference 2015, The Water Institute at University of North Carolina, Chapel Hill.
leclerc, h., schwartsbrod, l. and Dei-cas, E. (2004) ‘Microbial agents associated with waterborne diseases’, in t.E. cloete, J. rose, l.h. nel and t. ford (eds.), Microbial Waterborne Pathogens, pp. 1–54, london: IWa publishing.
lowe, K.s., rothe, n.K., tomaras, J.M.B., DeJong, K., tucholke, M.B., Drewes, J., Mccray, J.E. and Munakata-Marr, J. (2007) Influent Constituent Characteristics of the Modern Waste Stream from Single Sources: Literature Review, WErf project 04-DEc-1, alexandria, Va: Water Environment research foundation.
Mawdsley, J.l., Brooks, a.E. and Merry, r.J. (1996) ‘Movement of the protozoan pathogen Cryptosporidium parvum through three contrasting soil types’, Biology and Fertility of Soils 21: 30–6.
Mccray, J., lowe, K., geza, M., Drewes, J., roberts, s., Wunsch, a., radcliffe, D., amador, J., atoyan, J., Boving, t., Kalen, D. and loomis, g. (2009) State of the Science: Review of Quantitative Tools to Determine Wastewater Soil Treatment Unit Performance, alexandria, Va: Water Environment research foundation (WErf).
Mca – Indonesia (2013) Stunting and the Future of Indonesia [pdf], <http://mca-indonesia.go.id/wp-content/uploads/2015/01/Backgrounder-stunting-En.pdf> Jakarta: Mca – Indonesia [accessed 29 february 2016].
Mills, f. (2013) Assessment of Sludge Accumulation and Pit Filling Rates in Indonesia, Washington, Dc: World Bank Water and sanitation program.
Mitchell, c., ross, K., abeysuriya, K., puspowardoyo, p. and Wedahuditama, f. (2015) Effective Governance for the Successful Long-term Operation of Community Scale Air Limbah Systems: Mid-term Observations Report, sydney: Institute for sustainable futures, university of technology sydney.
napitupulu, l. and hutton, g. (2008) Economic Impacts of Sanitation in Indonesia [pdf], Jakarta: World Bank, Water and sanitation program <https://www.wsp.org/sites/wsp.org/files/ publications/esi_indonesia.pdf> [accessed 1 March 2016].
ngure, f.M., reid, B.M., humphrey, J.h., Mbuya, M.n., pelto, g. and stoltzfus, r.J. (2014) ‘Water, sanitation, and hygiene (Wash), environmental enteropathy, nutrition, and early child development: making the links’, Annals of the New York Academy of Sciences 1308(1): 118–28 <http://dx.doi.org/10.1111/nyas.12330>.
ogden, s., gallo, K., Davis, s., Mcguire, c., Meyer, E., addiss, D. and haddad, D.(2013) WASH and the Neglected Tropical Diseases: A Manual for WASH Implementers – Indonesia, sightsavers,
http
://w
ww
.dev
elop
men
tboo
kshe
lf.c
om/d
oi/p
df/1
0.33
62/1
756-
3488
.201
6.01
4 -
Tue
sday
, Mar
ch 0
7, 2
017
7:29
:20
PM -
IP
Add
ress
:220
.101
.23.
22
180 C. MITCHELL ET aL.
April 2016 Waterlines Vol. 35 No. 2
DfID, International trachoma Initiative, children Without Worms, Wateraid, Wash advocates, Emory university center for global safe Water, and care usa.
robbins, D., carriero, M. and suartana, n. (2015) ‘utilising rapid technical assessments to develop a city-wide desludging programme’, Water 21, June 2015.
ropeik, D. and gray, g. (2002) Risk: A Practical Guide for Deciding What’s Really Safe and What’s Really Dangerous in the World Around You, new York: houghton Mifflin harcourt.
ross, K., abeysuriya, K. and Mitchell, c. (2015) ‘Developing principle-based targets and indicators for the sDgs’, in 2015 International Conference on Sustainable Development, 23–24 September 2015, New York.
sanipath (2015) ‘sanipath rapid assessment tool’ [online], Bill & Melinda gates foundation, Emory rollins school of public health and center for global safe Wash <sanipath.org> [accessed 1 March 2016].
schmidt, c.W. (2014) ‘Beyond malnutrition: the role of sanitation in stunted growth’, Environmental Health Perspectives 122(11): 298–303 <http://dx.doi.org/10.1289/ehp.122-a298>.
sfD promotion Initiative (2015) Manual for SFD Production Draft Version 1.0 [online], sustainable sanitation alliance <www.susana.org/en/resources/library/details/2357> [accessed 1 March 2016].
stenström, t.a., seidu, r., nelson, E. and christian, Z. (2011) Microbial Exposure and Health Assessments in Sanitation Technologies and Systems [pdf], stockholm, sweden: stockholm Environment Institute <www.ecosanres.org/pdf_files/Microbial_Exposure_&_health_assessments_in_sanitation_technologies_&_systems.pdf> [accessed 1 March 2016].
stevik, t.K., aa, K., ausland, g. and hanssen, J.f. (2004) ‘retention and removal of pathogenic bacteria in wastewater percolating through porous media: a review’, Water Research 38(6): 1355–67 <http://dx.doi.org/10.1016/j.watres.2003.12.024>.
strande, l., ronteltap, M. and Brdjanovic, D. (eds) (2014) Faecal Sludge Management: Systems Approach for Implementation and Operation, london: IWa publishing.
tayler, K., siregar, r., Darmawan, B., Blackett, I. & giltner, s. (2013) ‘Development of urban septage management models in Indonesia’, Waterlines 32(3): 221–36 <http://dx.doi.org/ 10.3362/1756-3488.2013.023>.
tejalaksana, a. (2010) ‘urbanization and water quality control for the source of water in Jakarta’, in Water Environment Partnership in Asia (WEPA): The First International Workshop. Coping Strategies for Water Environmental Challenges in Asia, hanoi, Viet nam: section of clearinghouse, state Ministry of Environment, Indonesia.
toze, s. (1997) Microbial Pathogens in Wastewater: Literature Review for Urban Water Systems Multi-divisional Research Program, technical report no 1/97, June 1997, Dickson, act: csIro land and Water, australia.
ulrich, a., reuter, s. and gutterer, B. (eds.) (2009) Decentralised Wastewater Treatment Systems (DEWATS) and Sanitation in Developing Countries: A Practical Guide, Bremen, germany: BorDa and loughborough, uK: Water, Engineering and Development centre (WEDc).
un (2015) ‘sustainable Development goals’ [online], sustainable Development Knowledge platform <https://sustainabledevelopment.un.org/?menu=1300> [accessed 28 october 2015].
united nations Development programme (unDp) (2006) Human Development Report 2006, Beyond Scarcity: Power, Poverty and the Global Water Crisis [online], new York: unDp <http://hdr.undp.org/en/content/human-development-report-2006> [accessed 1 March 2016].
http
://w
ww
.dev
elop
men
tboo
kshe
lf.c
om/d
oi/p
df/1
0.33
62/1
756-
3488
.201
6.01
4 -
Tue
sday
, Mar
ch 0
7, 2
017
7:29
:20
PM -
IP
Add
ress
:220
.101
.23.
22

MaKING PaTHOGEN HaZaRDS VISIBLE 181
Waterlines Vol. 35 No. 2 April 2016
united nations statistics Division (unsD) (2015) ‘Millennium Development goals Indicators: goal 7 Ensure environmental sustainability’ [online] <http://mdgs.un.org/unsd/mdg/Metadata.aspx?IndicatorId=31> [accessed 29 august 2015].
us Epa (2002) Onsite Wastewater Treatment System Manual [pdf], Washington, Dc: office of Water, us Environmental protection agency <https://www.norweco.com/pdf/Epa/625r00008.pdf> [accessed 8 March 2016].
Vinnerås, B., hedenkvist, M., nordin, a. and Wilhelmson, a. (2009) ‘peepoo bag: self-sanitising single use biodegradable toilet’, Water Science and Technology 59(9): 1743–9 <http://dx.doi.org/10.2166/wst.2009.184>.
Water and sanitation program (Wsp) (2011) Economic Assessment of Sanitation Interventions in Indonesia: A Six-country Study Conducted in Lao PDR, the Philippines and Vietnam under the Economics of Sanitation Initiative (ESI), technical paper, Jakarta: Water and sanitation program.
Williams, a.r. and overbo, a. (2015) Unsafe Return of Human Excreta to the Environment: A Literature Review [pdf], chapel hill, nc: the Water Institute at unc <https://waterinstitute.unc.edu/files/2015/07/BMgf_unsafereturn_litreview_unc_16June15.pdf> [accessed 3 March 2016].
World Bank (2012) Indonesia Water Investment Roadmap 2011–2014 [pdf], Washington, Dc: World Bank <http://water.worldbank.org/sites/water.worldbank.org/files/publication/WatEr-Indonesia-Water-Investment-roadmap-2011-2014.pdf> [accessed 3 March 2016].
World health organisation (Who) (2006) Guidelines for the Safe Use of Wastewater, Excreta and Greywater, geneva: Who.
Who (2015) Sanitation Safety Planning: Manual for Safe Use and Disposal of Wastewater, Greywater and Excreta, geneva: Who.
http
://w
ww
.dev
elop
men
tboo
kshe
lf.c
om/d
oi/p
df/1
0.33
62/1
756-
3488
.201
6.01
4 -
Tue
sday
, Mar
ch 0
7, 2
017
7:29
:20
PM -
IP
Add
ress
:220
.101
.23.
22


![Informed [Heuristic] Search - University of Delawaredecker/courses/681s07/pdfs/04-Heuristic...Informed [Heuristic] Search Heuristic: “A rule of thumb, simplification, or educated](https://static.fdocuments.in/doc/165x107/5aa1e13c7f8b9a84398c48b6/informed-heuristic-search-university-of-delaware-deckercourses681s07pdfs04-heuristicinformed.jpg)