Making Intelligent Systems Team Players - ntrs.nasa.gov · PDF fileMaking Intelligent Systems...
108
NASA Technical Memorandum 104807 f ,, , J Making Intelligent Systems Team Players A Guide to Developing Intelligent Monitoring Systems Sherry A. Land Jane T. Malin Carroll Thronesberry Debra L. Schreckenghost (NASA-TR-I04801) RAKING INTELLIGENT SYSTEMS TEAM PLAYERS. A GUIUE TO DEVELOPING INTELLIGENT MONITORING SYSTEMS (NASA. Johnson Space Center) lO0 p G3/63 N95-30925 Unclas 0058496 July 1995 https://ntrs.nasa.gov/search.jsp?R=19950024504 2018-05-22T08:56:59+00:00Z
Transcript of Making Intelligent Systems Team Players - ntrs.nasa.gov · PDF fileMaking Intelligent Systems...

NASA Technical Memorandum 104807
f ,, ,
J
Making Intelligent SystemsTeam Players
A Guide to Developing IntelligentMonitoring Systems
Sherry A. Land
Jane T. Malin
Carroll Thronesberry
Debra L. Schreckenghost
(NASA-TR-I04801) RAKINGINTELLIGENT SYSTEMS TEAM PLAYERS. AGUIUE TO DEVELOPING INTELLIGENTMONITORING SYSTEMS (NASA. Johnson
Space Center) lO0 p
G3/63
N95-30925
Unclas
0058496
July 1995
https://ntrs.nasa.gov/search.jsp?R=19950024504 2018-05-22T08:56:59+00:00Z


NASA Technical Memorandum 104807
Making Intelligent Systems Team Players
A Guide to Developing Intelligent Monitoring Systems
Sherry A. LandJane T. Malin
Lyndon B. Johnson Space Center
Houston, Texas
Carroll Thronesberry
Debra L. Schreckenghost
Metrica, Inc.
Houston, Texas
July 1995

This publication is available from the NASA Center for AeroSpace Information,800 Elkridge Landing Road, Linthicum Heights, MD 21090-2934 (301) 621-0390.

Contents
Section
Introduction ............................................................................................................................Purpose .................................................................................................................................Scope ......................................Expected Use ............................... __.'.'_.'_.'.'.'.'.'.'.'.'.'.'.'.'.'.'.'.'.'.'.'.'._'.'._'.__........................................... :::iiiiOrganization ............................................................................................................................Additional Information ............................................................................................................
11.11.1.11.1.21.21.31.3.11.3.21.3.31.3.4
22.12.1.12.t.22.1.32.1.3.12.1.3.22.1.3.32.1.42.22.2.12.2.22.2.32.32.3.12.3.22.3.2.12.3.2.22.3.2.32.3.32.3.3.12.3.3.22.3.42.3.52.3.5.12.3.5.22.3.5.32.3.5.42.3.62.42.4.12.4.22.4.3
Real-Time Monitoring Systems .................................................................................Types of Monitoring Systems ...................................................................................Rule-based vs. Procedural Systems ............................................................................Passive vs. Active Systems .........................................................................................Scope of Monitoring Systems ...................................................................................Supported Development Approach ...........................................................................Participatory Design .................................................................................................Iterative Development ...............................................................................................Refinement Through Team Interaction with Prototype ..............................................Evolution of the System (Adaptation of Boehm's Spiral) ..........................................
Understanding the System and Determining Requirements .......................................Project Plan ..............................................................................................................Goals and Objectives .................................................................................................Risks .........................................................................................................................Roles of Team Members ...........................................................................................Software Engineer ....................................................................................................Technical or Task Expert ..........................................................................................Human Factors Engineer ..........................................................................................Schedule and Resources ............................................................................................Understanding the Human Task ................................................................................Existing Task(s) ........................................................................................................The Impact of the New System .................................................................................Tools for Understanding the Task .............................................................................Understanding Supported Operations .......................................................................System Components .................................................................................................Data ..........................................................................................................................Finding the Data .......................................................................................................Understanding the Data ............................................................................................Subtleties in Working with Data ......................................................................... . ......System Configurations ..............................................................................................State Diagrams ..........................................................................................................Procedural Timelines ................................................................................................Creating a Storyboard ...............................................................................................Failure Space ............................................................................................................Transition Timing .....................................................................................................Data Questionable On/Off-Ramifications to the System .............................................Failure of Data to Change During an Expected Transition ........................................Multiple Data Values Active, Indicating Conflicting States ........................................Relationships with Other Systems ..............................................................................Information Requirements ........................................................................................Information from Current Displays ...........................................................................User-Requested Information .....................................................................................Gathering of Information .........................................................................................
33.1
Building the System ..................................................................................................Organization of the Knowledge Base ........................................................................
Page
4444555666
99999
10101011111112121212131314141515192020202122242323232424
2525
iii

Section .......... . ...................................................................................................................... Page
3.1.13.1.23.23.2.13.2.23.2.33.2.43.2.53.2.63.33.3.13.3.1.13.3.1.23.3.1.33.3.23.3.33.3.3.13.3.3.23.3.3.33.3.3.43.3.43.3.4.13.3.4.23.3.4.33.3.4.43.3.53.43.4.13.4.23.4.33.53.63.6.13.6.23.7
Module Organization ................................................................................................ 25Organization within Modules .................................................................................... 27Object and Structure Design ..................................................................................... 29System vs. Subsystem Design .................................................................................... 29Object Design ........................................................................................................... 29Class Hierarachy ....................................................................................................... 30Inter-Object Structure (Relations) ............................................................................. 31System Variables and Parameters .............................................................................. 31Grouping of Objects ................................................................................................. 32Rules ........................................................................................................................ 32
Organization and Classification ................................................................................. 32Rules versus Procedures ............................................................................................ 33Generic Rules ........................................................................................................... 33
Rule Categories ......................................................................................................... 34Making Rules Robust ................................................................................................ 34Initial State and Command Monitoring Rules ............................................................ 34Developing from State Diagrams .............................................................................. 34Identification of Sequency Asymmetry ..................................................................... 35Initial Rule Development .......................................................................................... 35Considering Redundancy in Rule Development ........................................................ 37Status Monitoring Rules ............................................................................................ 38Transition Timing ..................................................................................................... 38Data Questionable On/Off-Ramifications to the System ............................................. 39Failure of Data to Change During an Expected Transition ........................................ 41Multiple Data Values Active, Indicating Conflicting States ........................................ 41Correction Rules ....................................................................................................... 41Event Timing ............................................................................................................ 43The DESSY Timer .................................................................................................... 43Timing in DESSY ..................................................................................................... 44Timing Issues ........................................................................................................... 45Quick Test Buttons and Displays ............................................................................... 46Setting Up for Real Time ....................... . .................................................................. 46Setting Up the Knowledge Base ................................................................................ 47Using Real-Time Data ............................................................................................... 48Setting Up for End Users .......................................................................................... 48
44.14.24.2.14.2.24.2.34.34.3.14.3.24.3.2.14.3.2.24.3.3
Working with Real-Time Data ................................................................................... 49Related Work ............................................................................................................ 49
Types of Data Problems ............................................................................................ 50Loss of Data ............................................................................................................. 50Erratic Data .............................................................................................................. 50
Data Lags and Irregularities During Operational Events ............................................ 51Data Handling Methods ............................................................................................ 51Rule Disabling .......................................................................................................... 52Context-Sensitive Bounded Pattern Recognition ........................................................ 52The Lower Limit ....................................................................................................... 53The Upper Limit ....................................................................................................... 54Graceful Recovery .................................................................................................... 54
55.15.1.15.1.25.1.35.2
Evolving the System through the User Interfaces ...................................................... 56Understanding the User Interface .............................................................................. 56The Window into the Expert System ......................................................................... 56Layers of the Interface .............................................................................................. 56Elements of the Interface .......................................................................................... 57Preliminary User Interface Design ............................................................................ 57
iv
Section
5.2.15.2.25.35.3.15.3.25.3.35.45.4.15.4.25.4.2.15.4.2.25.4.2.35.4.2.45.4.2.55.4.35.55.5.15.5.25.5.35.65.6.15.6.25.6.35.75.7.15.7.25.7.3
66.16.1.16.1.26.1.36.26.36.3.16.3.26.46.4.16.4.26.56.66.7
77.17.1.17.1.27.1.37.1.47.27.37.47.57.5.1
.......... . ...................................................................................................................... Page
Getting Started ..........................................................................................................Gathering Information Elements ...............................................................................Evolution of the User Interface .................................................................................
Designing for Change ..............................................................................................Guilding the Evolution ............................................................................................Using a Library .......................................................................................................The DESSY User Interface .......................................................................................DESSY Interface Requirements ................................................................................DESSY Display Examples ........................................................................................Telemetry Data ........................................................................................................Switches and Talkbacks ...........................................................................................
Graphical Icons .......................................................................................................Text Displays ...........................................................................................................Navigational Items ...................................................................................................DESSY Screen Arrangement .....................................................................................User Input and Control .............................................................................................Real Inputs ...............................................................................................................Resets .......................................................................................................................Acknowledgments and Logs .....................................................................................Expert System Management .....................................................................................Control of the Data Interface ....................................................................................Control of the External Software Interface(s) ............................................................Control of the Expert System ....................................................................................The Developer Interface ...........................................................................................Knowledge Base Organization ..................................................................................Access Modes ...........................................................................................................Developer Displays ...................................................................................................
Testing the System ....................................................................................................Verification and Validation .......................................................................................Definitions ................................................................................................................Verification of Rules .................................................................................................Validation of the Knowledge Base ............................................................................Creating Test Objects ................................................................................................Writing Test Cases .....................................................................................................Simulation Procedures ..............................................................................................Scenario and Configuration Development .................................................................Testing with Real Data ..............................................................................................Real Data and System Validation ..............................................................................Completeness Checking ............................................................................................Real-Time Performance ............................................................................................
Testing for Continuous Improvement .......................................................................Certification Testing .................................................................................................
Documentation and User Training ............................................................................Documentation Within the Knowledge Base ..............................................................Knowledge Base Organization ..................................................................................State Diagrams ..........................................................................................................Flight Rules and Other Support Documentation ........................................................Documentation Overhead .........................................................................................Documentation of Requirements ...............................................................................Documentation of Testing ........................................................................................The Cue Card: Map to the User Interface .................................................................The Tutorial: Interactive Exploration of the Intelligent System ................................The Tutorial as a Training Tool ................................................................................
585859596O61616161626363636565656566666666666667676768
696969697070707071717171727272
7474747676767779818181
v

Section ......... . .......................................................................................................................
7.5.27.5.37.67.6.17.6.27.7
Page
The Tutorial as Documentation ................................................................................. 82Tutorial Design ......................................................................................................... 82Demonstrations ......................................................................................................... 82Effective Demonstrations .......................................................................................... 82Organization of the Software to Support Demonstrations .......................................... 83The Developer-User Handover .................................................................................. 83
References ............................................................................................................................... 84
DESSY End Effector Failures .......................................................................... A-1DESSY Cue Cards ............................................................................................ B-1
Appendix AAppendix B
vi

Table
1234
Tables
Active and Inactive States of Binary DESSY Telemetry'. ...........................................Data Changes During the MPM Stow Procedure .......................................................Data Problems and Solutions ....................................................................................Rule With Two Pieces of Data and Two Context Variables .........................................
Page
14165253
Figure
1234567891011121314151617181920212223242526272829303132
Figures
Complete monitoring and diagnostic system .............................................................Adaptation of Boehm's spiral model to operational prototyping ...............................Remote manipulator system (Shuttle arm) .................................................................State diagram with transit edge between static states ...................................................State diagram with transit state between static states ................................................State diagram for the end effector snare system "'"Subsection of the snare state diagram depicting an aborted state ...............................Snare capture sequence timeline ...............................................................................Complete end effector capture sequence timeline ......................................................MPM stowing timeline with transition timing ............................................................Simplified DESSY module hierarchy .......................................................................Multiple system configurations for DESSY ............................................................. i.Conceptual illustration of workspace organization ....................................................Example of the MPM system and MPM object definitions ........................................Generic rules used with the class hierarchy ................................................................The manipulator positioning mechanism state diagram .............................................DESSY timer definition..An MSID sensor objecti.i;_ii_;;_;;;;.'f.'.'.'.'._'."_ ................................................................
Examples of data lags and irregularities ....................................................................Sets of immediate data and additional context ...........................................................Example of S and S' for immediate data and additional context ................................The original DESSY display design for the MPM/MRL system .................................Existing RMS console displays .................................................................................Information requirements document .........................................................................End effector and MPM/MRL screens ........................................................................Intelligent system life cycle .......................................................................................End effector module hierarchy .................................................................................End effector sample workspace hierarchies ...............The End Effector DESSY Requirements Document ish'o_e'neciiiiiiiiiiiiii_.'.'.'.'._iiiiiillDESSY Test Case Log--first run ................................................................................DESSY Test Case Log--second run ...........................................................................Screen snapshot for recording data patterns ..............................................................
Page
58
13171718181919212627283033354447515354596062647375757779808O
vii


Introduction
Purpose
The purpose of this Developers' Guide is to assist developers of intelligent systems who work in the spaceindustry and related industries in their development of complete and reliable monitoring systems. Inpreparing this guide, we have drawn from the experiences of 5 years of work in the evolution of theDEcision Support SYstem (DESSY), a real-time application that supports monitoring and fault detection.This guide documents our strategies and lessons learned so that other developers of other systems canwork more productively.
This guide is not intended to provide theoretical methodology discussions of various development issuesor to act as a complete documentary on the development process. It is, rather, intended to be a source ofhands-on experiences from which other developers can draw to gain a better understanding of theproblems they face. A cookbook approach is used, with step-by-step instructions and examplesclarifying the stages of developing the system. Because DESSY was developed using the G2programming tool, the examples provided are in G2. However, we discuss all examples in a generic wayto allow developers using other development tools to find the guide useful.
The true value of this guide lies in examples provided from a real case study (DESSY), which developerscan tailor to their own projects. Our goal is to eliminate time wasted in reinventing the wheel, and tomake the development process as smooth and efficient as possible.
Scope
This guide is based solely on experiences in developing the DESSY expert system in the G2programming environment offered by Gensym Corporation. To understand its scope, the reader mustunderstand the scope of DESSY itself, as well as have some understanding of G2 or a G2-1ike tool.DESSY monitors Space Shuttle telemetry data in real time and uses the real-time capabilities offered bythe G2 package. DESSY also takes advantage of the object-oriented capabilities provided by the G2software. In reading the guide, it will be helpful to be familiar with G2, but it is not required. The guideis written with assumption that the user has a familiarity with object-oriented programming and rule-based systems. Throughout this guide, the software system will be referred to as intelligent system orexpert system or knowledge base interchangeably. Although much of the discussion focuses on rule-based systems, usually described by the term expert system, many of the principles could be applied toany type of monitoring intelligent system.
It is also important to understand the boundaries of DESSY's monitoring capabilities. DESSY monitorstelemetry data and makes inferences about commands, state transitions, and simple failures. It is not afailure analysis system capable of performing in-depth failure diagnostics. It is the authors' opinion thatreal-time monitoring and failure analysis are separate functions that should remain separate. DESSYdoes, however, identify simple failures detected from telemetry data. In short, DESSY performs failuredetection, rather than failure diagnostics.
The key phrases that summarize the characteristics of DESSY are expert system, real-time, datamonitoring, rule-based, o_ect oriented, and failure detection.
Expected Use
This guide should be used by expert system developers who want to expedite the develop_nent process.Although an initial scanning of the entire guide is recommended, it is primarily intended to be usedthroughout the development process as a reference guide. We have outlined the steps in building DESSYthat worked well for that particular project, and we feel the sequence is general enough to be applied toother expert systems development tasks. It may be that the organization of this manual does not suityour specific development needs. In that case, we ask that you remain open to the specific task examplesfound throughout the sections. The guide can be used in sequence or in a purely reference manner.Although we recommend proceeding with your development in the sequenced steps, the examples thatare provided will usually stand alone and should be helpful at any point in your development.

Organization
The organization of this guide has been set up to reflect what the authors believe to be the organizationof the complete development process. The guide begins with a philosophical discussion of preliminaryissues related to development and various development approaches. The first section, entitled "Real TimeMonitoring Systems," should be read first to enable the reader to understand the attitudes and orientationsof the authors.
The remaining sections deal with the process of producing the expert system. Section 2, "Determiningthe System Requirements," deals with initial project tasks such as the development of the project planaswell as the process of understanding the existing tasks of the people involved with the system to besupported, i.e., the expert systems domain. Also involved in these preliminary activities is the definitionof the project scope and the identification of requirements.
Once the developer has the preliminary tasks of section 2 underway, he can move on to section 3,
"Building the System." In this section, design and development phases have been merged. This approachwas used primarily because of the nature of the development tool. The G2 tool and others that have agraphical development environment support the combination of design and development rather wellbecause design requirements can be quickly captured within the tool. Once the design is encoded, thedevelopment process is greatly simplified. In fact, at times encoding the design actually accomplishesparts of the development as well. In any case, these concepts have been combined as a single (butiterative) phase and are presented in section 3.
Another area of great concern in developing intelligent monitoring systems is understanding the datasource. Section 4, "Working with Real-Time Data," addresses issues software developers face when tyingmonitoring systems to real data sources. These issues center on noisy and unreliable real-time data. Theproblems are discussed in this section, along with a methodology used to overcome them.
Section 5, "Evolving the System through the User Interface," relates the close tie of operationalprototyping and software evolution with the user interface of the intelligent system. The user interface isthe window into the intelligent system during design and development as well as during use. This sectionprovides insight in using the intelligent system interface, beginning with a storyboard, to guide softwareevolution to its final state.
Section 6, "Testing the System," covers a crucial phase in the life of the project. Although testing isamong the iterative steps of design and development, we chose to treat it separately because it differssomewhat from the other steps in that the end users (flight controllers in the case of DESSY) must behighly involved in the testing phase. This contrasts with the design and development phase, which ismore a programmer's task. (although the end user certainly must be involved in all project phases.)Section 6 discusses verification and validation, and covers various types of testing that are necessarythroughout the system development.
Documentation and training are also important parts of an intelligent system project, particularly sincethe system will almost certainly evolve as new information is learned or as the physical system beingmonitored changes. Thus we have included Section 7, "Documentation and User Training," whichdiscusses the types of documentation and training we felt were necessary during DESSY development.
Finally several appendices are included which contain specific DESSY documentation. Appendix A,"DESSY End Effector Failures," includes listing of rules from DESSY, and Appendix B, "DESSY CueCards," contains the cue cards from both DESSY subsystems. These appendices are intended to providesoftware developers with further detailed information about DESSY.
Additional Information
This Developer's Guide is actually only part of a larger body of information designed to assist intelligentsystems developers. Also available are an electronic library, software demonstrations, and additionaldocumentation. The Control Center Library For Application Reuse and Exchange (CLARE) is anelectronic library containing sample applications or their documentation and on-line literature, including
2

thisDeveloper'sGuide,to supportcontrolcentersoftwaredevelopers. CLARE has been developed in thehypertext mark-up language (html) for Mosaic browsing. The goal of CLARE is to provide interactive,on-line support for requirements definition, concurrent development and improvement of advancedsoftware. CLARE is available at the following URL: http://tommy.jsc.nasa.gov/-clare.
Demonstrations of DESSY and other intelligent systems software are also available currently through theIntelligent Systems Branch at Johnson Space Center, and eventually will be through CLARE. Forinformation about obtaining a demonstration or for further information about CLARE or other relatedsoftware, contact the authors of this document.
Finally, additional literature is available to support software developers. The "Making IntelligentSystems Team Players" (Malin and Schreckenghost, 1991) document set provides case studies andsoftware design information related to DESSY. This document is available electronically throughCLARE.

Section 1
Real-Time Monitoring Systems
Because the definition of real-time monitoring systems may vary from source to source, the definition asapplied to the DESSY project is provided. DESSY monitors a set of Shuttle telemetry data which has anupdate rate of once per second. Any reasoning done in DESSY involving time uses the second as theunit. Because G2, and therefore DESSY, runs on the UNIX operating system, which is not a true real-time operating system, real-time processing is limited. Thus for DESSY, real-time monitoring meansmonitoring data which is periodically updated once a second, processing that data in the allotted time,and reasoning over that data in that same second. It is recommended that the reader gain a thoroughunderstanding of real-time processing; however, that discussion is beyond the scope of this document.
The following sections cover topics germane to understanding real-time monitoring systems. Section 1.1,"Types of Monitoring Systems," addresses different system classifications. Section 1.2, "Scope ofMonitoring Systems," covers trade-offs associated with limiting an expert system's scope. Finally,"Supported Development Approach" (section 1.3) explains the operational prototyping approach usedthroughout this guide.
1.1 Types of Monitoring Systems
Monitoring systems can be broken into categories by their logical structures and the classification of theirdomains. Logically, a system may contain rules, procedures, or both, depending upon the nature of themonitored activities. Likewise, the system may be used for monitoring passive or inactive systems inwhich the goal is to observe fairly static sensor readings and flag anomalies, or the software may monitorvery active systems in which changes are expected and normal. Challenges of working with real-timedata apply in any case.
1.1.1 Rule-based vs. Procedural Systems
DESSY is primarily a rule-based system, but does contain procedures. Although the focus of this guideis on rule-based systems, there are similarities in the ways in which rules and procedures are used, andthere are many systems, like DESSY, that use a mix of rules and procedures.
When should rules be chosen over procedures and vice versa? Procedures are lines of code that aresequentially executed. When activities take place that are known to be sequential, procedures are themore appropriate model. It is often the case in monitoring data and anomalies, however, that there aremany paths that may occur in a given set of data over a specified time period or activity sequence. Inthese situations, rules are the more appropriate model. It will be up to the developer to use theappropriate tool for a particular scenario. In any case, both techniques are available and can be usedseparately or together. (Bachant and Soloway, 1989)
This guide focuses primarily on developing rules since DESSY contains mostly rules. However many ofthe steps presented apply to writing either rules or procedures, and many of the issues dealing withhandling real-time data may be applicable to both rules and procedures alike.
1.1.2 Passive vs. Active Systems
Another distinction between types of monitoring expert systems is whether a system is passive or active.If a system monitors operations in which little or no change in the data is expected, the system is passive.The goal of a passive system is to remain in its current state. Any change from this state indicates anerror. The original Bus Loss Smart System (BLSS) is an example of an expert system that is normallypassive. This G2 system monitors Shuttle power buses, which normally remain in a static configuration.
In contrast, an active system expects frequent data changes, and therefore configuration changes, as a partof normal activities. These expected changes cause monitoring to be more complex, due in part to themultiple configurations that are expected to occur. Additionally, it can be challenging to monitor a statetransition in which multiple data values change simultaneously or over a period of time. (Gabrielian andFranklin, 1988)
4

DESSYis anexampleof anactivesystem,althoughDESSYoperatespassivelyfor longperiodsof time.Mostsystemshavebothpassiveandactivestagesduringthemonitoringprocess.Thesoftwaredevelopershouldbecomeawareof all systemconfigurationsandtransitionswhenplanningtheexpertsystem.Onlywhenthesehavebeenidentifiedandthoroughlyunderstoodcandevelopmentbegin.
1.2 Scope of Monitoring Systems
Anotherfactorin planningareal-timemonitoringsystemis thescopeof thesystem.Real-timesystemshavethespecificjob of keepingupwithadatastreamin realtime. Any furtheranalysisof thedatausesvaluableCPUresources.Thusit is importantto realizethatthereis a significanttrade-offbetweenstrictdatamonitoringanddataanalysis.Thistrade-offis dueto limitedperformanceandwill alwaysexistgivenareal-worldsituation.Althoughby necessityanymonitoringsystemperformssomeanalysis,theauthorsbelieveit is necessaryto limit theanalysisfunctionalityof areal-timemonitoringsystem.In anidealscenario,amonitoringsystemandananalysis(ordiagnostic)systemareworkingsideby side.Themonitoringsystemwatchesthedata,makesbasicstateandstatusconclusions,andthenfeedsthoseconclusionsinto thediagnosticsystem.Thediagnosticsystem,whichmightserveasadatabaseor alsoincluderecommendedactions,is runoff-line,i.e.,notreal-time.This is necessary because this type ofsystem will have many information sources, including human inputs and other data parameters, that arenot part of the telemetry stream. Figure 1 depicts the scenario the authors feel will most adequately meetthe needs of the complete monitoring and diagnostic system.
data
data
state
real-time I status
monitoring I v
Figure 1.
human input
other parameters
diagnosticsI I I I o I II II IIl I l I Illllll IIiiiii ii ill ii iiiii
- recommendeddata base -
: actionsI
Complete monitoring and diagnostic system.
1.3 Supported Development Approach
This developer's guide supports operational prototyping, a software development approach thatoriginated from observations of successful intelligent system projects at Johnson Space Center, althoughsimilar approaches have been employed by other organizations. (Jordan, et. al., 1989) The approach iscalled operational because the mature products are capable of functioning in an operationalenvironment--receiving data from operational sources and providing conclusions in a timely fashion inconjunction with human operators. The approach is called prototyping because it is informal anditerative. The key features of operational prototyping are participatory design, iterative development, andrefinement through team interaction with the prototype.
1.3.1 Participatory Design
Participatory design refers to the practice of including users on the software development team. Usershave an intimate understanding of the human task being supported by the software system. Whilesystems analysts and programmers could usually learn to perform the users' tasks, the training time wouldoften be considerable and their competency of task performance would still be lower than that of ahighly experienced user. Consequently, including a user on the design team is usually more efficient andallows a more thorough consideration of the supported human task. These advantages become strongeras the human task becomes more complex.

For example,DESSYis anintelligentsystemdesignedto supportmonitoringof theSpaceShuttlepayloadbayarmby ground-basedflight controllers.Themonitoringtaskis difficult, complex,anddependentonextensiveengineeringknowledgeof theShuttlearm. By includinga flight controller,thedevelopmentteamavoidstheneedto performanexhaustiveandexpensivetaskanalysis.The risks ofoverlooking some of the users' needs, or of making the system unusable within the context of the users'other ongoing tasks, are also avoided.
The value of participatory design can be summarized by the following statement taken from SpaceOperations Seminar held October 20, 1992, at the University of Houston at Clear Lake. "The users knowwhat they don't want, but not necessarily what they do want." Having a user play an active role indevelopment greatly increases the chances of producing a system that the user both wants and can use.
1.3.2 Iterative Development
Iterative development is an approach whereby the software system is developed as a series of successiveapproximations to the final product rather than as a single, monolithic, integrated system. Iterativedevelopment is especially good for projects with unstable requirements. Examples are software systemsthat provide innovative support of user tasks and those that include innovative applications of newtechnology. Because these projects are innovative, developers are likely to make discoveries of newrequirements after they have begun the project. If they have adopted an iterative approach, it will beeasier to respond to those discoveries by revising the current system and revising plans for futureenhancements. If, on the other hand, they have adopted a monolithic approach, these discoveries willprobably come too late to be of any value to the current system.
For example, if the first iteration of development involves the core of the basic architecture, thedevelopers can verify whether that architecture has the desired properties before designing the remainderof the system in detail. If the architecture proves to have unanticipated problems, it is much easier tochange the architecture and redirect the remainder of the project with a minimal cost in developmentresources. Because developers have the least amount of experience with innovative projects, they aremore likely to need redirecting, thereby making iterative development especially valuable in these cases.
1.3.3 Refinement Through Team Interaction with Prototype
The third key feature of operational prototyping is refinement through team interaction with theprototype. Because the team interacts with a prototype, each person is able to see the implications ofdesign decisions. What You See Is What You Get, or WYSIWYG, is a descriptor for applications thatimmediately show the full implications of user input. Prototyping is the WYSIWYG of analysis anddesign. Also, because all team members interact with the prototype, several viewpoints can be consideredsimultaneously. If the team has expertise in intelligent systems development, Space Shuttle subsystemengineering, user task performance, and human factors engineering, then the implications of a proposedchange can be evaluated from each of those perspectives. Because these viewpoints can be consideredsimultaneously, the team is able to make dynamic trade-offs. For example, if a proposed change seemsideal except for implementation feasibility, the intelligent system developer can voice an objection alongwith the reason behind it. At that point, a brainstorming session can ensue in which potential alternativesare proposed by all participants. In this situation, with all experts present, a solution that satisfies allparticipants is much more likely to be found. This is the impetus behind concurrent engineering insystems development.
1.3.4 Evolution of the System (Adaptation of Boehm's Spiral)
A common problem with rapid prototyping is a type of wandering project development, in which theproject has no defined goals and tends to follow the interests of the developer. The objective is tobalance goal-directed development with the ability to respond to unexpected discoveries duringdevelopment. An adaptation of Boehm's spiral model is the best way to achieve that balance. Thisadaptation is illustrated in figure 2. As a spiral, this approach has two types of components, a cycliccomponent and an outward progression component.
The component illustrated in panel A of figure 2 is the cyclic component. Starting with the upper leftquadrant, each development iteration begins with a consideration of objectives, alternatives, and

constraints.This is followedby ariskanalysisin whichalternativesareevaluatedanda strategyforresolvingthoserisks is formulated. The third step is to plan the next prototype iteration. The final step isto develop and evaluate the next prototype iteration. Each prototype iteration is expected to be anenhancement of the previous iteration.
The second component of the spiral is an outward progression, across cycles. It is illustrated in panel Bof figure 2. According to Boehm's spiral model, the issues posing the greatest risk to the project are to beaddressed first. If there is an aspect of that application that cannot be accomplished as planned, it isimportant to discover that fact early. If the project must be scrapped, it can be scrapped before manyresources have been expended. If the application must be redesigned as the result of unanticipateddiscoveries, it is better to make those discoveries before the remainder of the application has been built.As a rule of thumb, the risky aspects of the project are addressed early, reserving the better understoodportions of the project for subsequent development iterations.
In the DESSY project, Boehm's spiral has been adapted for rule-based systems to support real-timemonitoring of space systems by flight controllers via telemetry downlinks. The sequencing of systemdevelopment is based on a combination of perceived risk and a need to develop a useful softwarearchitecture and object structure. The progression of development for DESSY modules is presented as anexample. These recommendations are not presented so that developers will follow them withoutdeviation. Instead, active consideration is recommended based on the specific risks of the project athand--and active reconsideration as the project continues. The reasoning behind recommendations isshown as an example of how to make the sequencing decisions rather than as a justification forsequencing all projects in exactly this manner.
The objectives addressed by successive DESSY iterations are:
1. Displaying relevant telemetry values in a readily understood fashion
2. Inferring (from telemetry data) and displaying the current state (usually the physicalposition) of the subsystem being monitored
3. Making the rules resilient to noisy and occasionally missing telemetry data values
4. Making inferences about the status (health, failure configurations) of the monitoredsubsystem
This sequence of development is based primarily on risk. The displays currently in use by flightcontrollers show telemetry values. The worst way in which the replacement systems could fail would beto prevent the display of telemetry in a reliable, understandable manner. If the telemetry can still be seeneven if the state and status inferencing fails, the software can still be used. Furthermore, since the stateand status inferences also use telemetry values, it is desirable to develop the telemetry software objectsbefore writing state and status rules. Consequently, the objective of displaying relevant telemetry valuesin readily understood fashion must be addressed before anything else.
Next, the state (position or orientation) inferences need to be developed. Once the state rules have beenwritten, enough complexity has been incorporated that testing with real, noisy data streams is challenging.If the noisy data can be accommodated, then the status rules have a stable foundation. Otherwise, statusinferences based on faulty state conclusions are useless. Status rules are developed last because they arebased on expectations established by the state conclusions. Thus, the sequencing of development shouldbe driven by a consideration of risks to the project.

alternatives, \
altematives, analyze \
constraints risks I
Develop, Plan next /
_k vestry prototype /
Panel A. Cyclic component of spiral development.
St'11ratus inferences
J Robust rules (noisy data)
J State inferences
J Graphic display of telemetry
Panel B. Outward progression of spiral -- across development cycles.
Figure 2. Adaptation of Boehm's spiral model to operational prototyping.

Section 2
Understanding the System and Determining Requirements
The first step in building any successful software application is to understand the system and determinethe software requirements. To ensure this step is achieved, several steps must take place. First, apreliminary project plan should be developed and agreed upon by all team members. Section 2.1,"Project Plan," provides some suggestions for activities in developing the plan. Next, the developer(s)should understand the human tasks in order to produce a correct and useful representation of those tasks.This includes understanding existing tasks, how these tasks relate to the supported operations, and howthe tasks will be changed after the new system is in place. These issues are discussed in Section 2.2,"Understanding the Human Task," and Section 2.3, "Understanding Supported Operations." Once theseinitial steps are taken, the project scope and definition can be determined and included in the projectplan. Finally, information requirements, discussed in section 3.4, should be well understood beforeprogramming takes place. Meeting each of the subtasks will provide order to the project and increase thechances of success.
2.1 Project Plan
The project plan begins during the first development iteration, shown in figure 2, panel A, in the"Determine Objectives, Alternatives, and Constraints" quadrant, and should be reconsidered with eachdevelopment cycle. During each cycle, project team members decide whether the plan should beupdated, depending on the formality of the plan, the importance of changes, and the resources available.The formality of the plan depends on the project team. Some managers will require a formal document.Others will request a briefing of the project plan. At any rate, the following information should beincluded in the project plan so it can assist in guiding the project and building consensus about projectobjectives.
2.1.1 Goals and Objectives
One of the most important measures to prevent "wandering project development" is to build consensusamong managers and the development team on project goals and objectives and to clearly documentthese goals and objectives. An important consideration for truly innovative projects is that the projectdirection should occasionally change, based on new discoveries. Consequently, it is important todistinguish goals that will define project success from those which are secondary and concernimplementation.
2.1.2 Risks
The explicit identification of risks and constraints helps to identify the best development sequence, thepeople to include on the development team, and the amount of effort to spend in avoiding the risks.Knowing up front the types of risks likely to occur can prevent common pitfalls and greatly enhance thedevelopment process.
2.1.3 Roles of Team Members
In operational prototyping, people with critical expertise interact with a prototype to improve its design.To achieve a successful software product, it is helpful to have a development team composed of the rightmix of individuals, each having a key role throughout the project. The determination of critical expertisewill depend on project objectives and project risks, but it will usually include user task expertise,softwaredevelopment expertise, and human factors expertise. While the number of people on anoperational prototyping team should probably be between two and six, the specific number is lessimportant than the following:
• All needed critical expertise must be represented.
• Every viewpoint must be discussed openly when interacting with the prototype.
• The whole team must meet regularly around the current prototype.

• Teamdiscussionsshouldusuallybedirectedtowardimprovements,ratherthanacceptanceorrejection.
• Eachproposedimprovementmustbeevaluatedinteractivelyby theteamsothatsolutionscanbenegotiatedwhicharereasonablyoptimalfor eachviewpoint.
Throughoutthedevelopmentprocess,eachteammembershouldbeawareof therolesheor sheneedstoplay. Specifically,thereis theroleplayedin softwaredesignanddevelopment,andlaterin constructionof softwaretestcases.Thisrole is filled primarilyby asoftwareengineer.In addition,technicalexpertiseis neededaboutthephysicalsystemthatis to bemonitoredandthehumantasksinvolvedin monitoringthatsystem.Development,userevaluation,andsystemtestingareall importantpartsof thetechnicalexpertroles. Finally,ahumanfactorsengineermustoverseeusabilityissues,ensuringthatthefinalproductmeetstheuserrequirementsandimprovestheoverallprocess.Thefollowingdiscussionhighlightstherolesof eachteammemberandprovidessomeinsightobtainedduringtheDESSYproject.
2.1.3.1 Software Engineer
The software engineer (SE) should be knowledgeable about the development software and environment.He or she is both the designer and developer of the complete software system and will be responsible forensuring that adequate testing is performed throughout the project life cycle. In the DESSY case, thisrole was shared by various individuals throughout the project.
Although it is useful for the SE be familiar with the development tool, in reality this person may belearning the tool during the development process. If this is the case for your project, exploit helpprovided from your tool's vendor. A willingness to aggressively pursue vendor help can be a greatpayoff to the project, while providing good feedback to the vendor on the usability of their product.
Also of particular importance for the software engineer is understanding performance constraints of thetool. Because the final application will be working in real time, it is important to know how to maximizeperformance. This is not a strength of DESSY, and in retrospect the developers feel a greater emphasisshould have placed on performance.
2.1.3.2 Technical or Task Expert
The technical expert (TE) provides knowledge about the physical system being monitored, as well as themonitoring process. This person, who is usually an end user of the software system as well, must fullyunderstand both the system hardware and the human monitoring process. Because other members of theteam are unlikely to understand these aspects, it is crucial to have an experienced expert who is willing tobe an active participant in the project. A predetermined number of hours per week should be set asidefor the TE and SE to work jointly on the project and exchange ideas.
Besides providing technical knowledge and possibly filling the role of user-evaluator, the TE also hasresponsibilities in software testing. Although the software engineer can create the tests to check theprogram logic (verification), the technical expert must verify that the system correctly reflects the realprocess; i.e., the technical expert must check the model and associated rules and procedures that theprogrammer has constructed. Thus the TE is responsible for the validation part of the testing process.
2.1.3.3 Human Factors Engineer
The third major player in the software development team is the human factors engineer (HFE). The HFEis responsible for ensuring that the system meets usability requirements including not only the graphicalinterface, but the usability of the system as a whole. The HFE would likely present an initial interfacedesign from which other team members can work, and would be responsible for overseeing the interfacedesign throughout the development process.
10

Additionally,this teammembermustinterfacebetweenthesoftwareengineerandthetechnicalexpert/enduser,both (or all) of whommaynotbe trainedin humancomputerinteractionissues.The HFE mustwork with the SE in developing an interface that the software will support, while working with the TE todevelop a meaningful interface. It is the HFE's responsibility to make sure the final software interfacesatisfies all team members.
2.1.4 Schedule and Resources
A schedule with resource allocations is a necessary part of any project. The schedule sets expectationsabout the project duration and the amount of effort that will probably be expended. Lack of resourcesand other responsibilities of team members, however, can lead to schedule slips. If your developmentteam is similar to that of DESSY, it will be composed of dedicated people, but people who have otherimportant responsibilities that by necessity often take precedence over software development. Beprepared to adjust the project schedule to meet the needs of the entire team.
Schedules for operational programming have some special features because of the exploratory nature ofthe approach. First, if some milestones are not negotiable, they should be specifically identified. Thiswill allow contingency planning when surprises are encountered during development. Second, whilemajor events and expected completion dates should be identified through the completion of the project, itis probably not reasonable to plan a detailed schedule throughout the project. Detailed schedulingshould go through the next development cycle. After that, the project may need to respond to newdiscoveries by changing directions, thus rendering obsolete any detailed plans for subsequent iterations.Developers must strike a balance, sticking to the important objectives without unnecessarily restrictingtheir explorations of ways to accomplish them efficiently and effectively.
2.2 Understanding the Human Task
Once a preliminary project plan has been developed, some effort to understand the human task(s) shouldbe put forth to ensure that the intelligent system will accurately automate or supplement these tasks.(Malin and Schreckenghost, 1991) This includes both existing tasks that the potential users perform andnew or altered tasks after the system has been implemented. The following sections provide helpful hintson accomplishing this understanding and outlines some specific tools that can be helpful.
2.2.1 Existing Task(s)
Understanding the existing tasks of the user (flight controller) can be very challenging, especially whenyou must attempt to emulate those tasks. The need to have a team member who understands the usertasks emphasizes the strength of participatory design in operational prototyping. In ideal circumstances,the end user is always available to assist the programmer in developing software that precisely fits in theuser's workplace. Because circumstances are rarely ideal, however, the following recommendations aremade to assist the developer in understanding the tasks.
Regular meetings should be held with the end user (technical expert) to discuss the tasks. Initialdiscussion will cover existing tasks; eventually the development team will need feedback from the user onthe software's model of existing tasks; finally, the team will need to evaluate the impact of the software onthe tasks.
Work should be done in the end user's work environment when possible. This will allow all teammembers to objectively observe the user performing the task, and the user is likely to do a better job atevaluating the software if software inspection is done within the user's own environment. Finally, thesystem will eventually need to be integrated into the user's work environment. Occasional developmentsin this area will greatly expedite the ultimate integration process.
In addition to working closely with the end user, the development team may wish to map out the existingtasks. Section 2.2.3 discusses common tools available for understanding the user's tasks. This isparticularly important if the end user in unavailable throughout much of the development process.
11

2.2.2 The Impact of the New System
Once the existing human tasks are well understood, the development team should evaluate how the newintelligent system will effect those tasks. This is important to ensure that the right problems are beingsolved and the new software will provide a true enhancement over the existing system. It is also importantto provide some up front insight to the end user on upcoming changes to existing tasks.
Because the applications covered in this guide are of the automated monitoring type, a key element of thenew task is that of human supervision of the new system. It must be understood how this supervisory taskimpacts other responsibilities of the user. For example, will the intelligent system display replace existingdisplays or will the user have an additional screen to monitor? Will the user be required to interact withthe intelligent system or will it require only monitoring? In any case, the impact of the system should beanalyzed up front and the user should be made aware of this impact as soon as possible.
2.2.3 Tools for Understanding the Task
Understanding the human monitoring task may be difficult for members of the development team notfamiliar with the users' work environment. Interviews with end users, both those on the development teamand other users, are recommended. If possible, it is also helpful for the software developers to sit in withusers during operations. This allows objective observations of the work environment and determinationof how the software system will fit in.
Other tools available that might help the team understand the users' tasks are data flow diagrams and statediagrams. A data-flow diagram reflects changes in data as the system changes. A state diagram reflectschanges in system state due to data changes. Both these tools might be used as a communicationsmedium when communicating with the user. In any case, building a good relationship with the end user,whether or not the user is a member of the development team, will help the team better understand thetask at hand and lead to a better end product.
2.3 Understanding Supported Operations
To successfully establish the project scope and definition, the supported operations must first beunderstood by the development team. This includes familiarity with both the hardware system and thetelemetry downlink parameters. Elements of the operations are composed of system components,telemetry data, system configurations, failure space, and relationships between the system being modeledand other systems. Outlining these elements will prevent wandering of the project and keep thedevelopment team focused.
2.3.1 System Components
The first step in understanding supported operations is the identification of the pieces and subpieces ofthe hardware systems that are being monitored. Identification of the hardware to be supported will helpin establishing preliminary boundaries for the software system. As with other steps in building thesystem, even hardware identification may be iterative. As the system evolves, the scope of the hardwaremay change to reflect interfaces with other systems or lack of available telemetry data.
A goal of DESSY is to eventually monitor telemetry associated with all parts of the Shuttle arm. Tomanage such a large set of data, the original DESSY designers divided the arm into several functionalsubsystems, two of which are covered in the existing DESSY and thus used throughout this guide. Thefirst subsystem to be modeled was the MPM/MRL subsystem. The MPMs, or manipulator positioningmechanisms, are the pedestals the arm rests on when it is cradled in the payload bay. MPMs can bestowed or deployed, respectively indicating whether the arm is in the rolled in or roiled out position in the.payload bay. The MRLs, or manipulator retention latches, are the latches that latch the arm down when itts cradled in the payload bay. The MRLs can be latched or released. There are four MPMs and threeMRLs. They are depicted in figure 3. (Collins, 1988)
12

__ EndEffector
Aftand MRL
-,;Ip.o'_ __ Mid__..._'-- Fwd MPM and MRL
Shk _ RMS MPM andMRLMPM (arm)
Figure 3. Remote manipulator system (Shuttle arm).
Hardware components are hierarchial in nature, and once the primary hardware is identified, the teammust delve deeper into the system to find additional hardware components. For example, each MRL andthe shoulder MPM (where the arm is attached) contain two motors. Because there is telemetry availablefor each of these components, they were modeled as separate objects within DESSY. Other hardwarecomponents identified were various switches and power sources or paths. Not all hardware componentshave sensors, and although they might be modeled within the software system, they cannot be directlymonitored.
The end effector system, the second RMS subsystem to be modeled, was also broken down into itshardware components. At the highest level, the system has two functional subpieces: the snaremechanism and the rigidizing mechanism. The snare mechanism can be in an open or closed position.The rigidizing mechanism can be rigid, derigid, or extended. The end effector also has two motors thatdrive both these mechanisms. Other hardware includes switches and several external systems. Thelocation of the end effector on the Shuttle arm is also depicted in figure 3.
Identification of system hardware is crucial because not only does it allow the developer to understandthe functional system, it provides the imtial template for the expert system model. The next section, Data,will further refine that template. Identification of data may be thought of as the hardware model at thesensor level for which telemetry is available. How to choose the appropriate data to include in the modelis discussed below.
2.3.2 Data
2.3.2.1 Finding the Data
Once you have an idea of what hardware will be monitored, finding the data associated with that hardwareshould be straightforward. As with other steps, finding data will probably be an iterative process.Telemetry that is flagged for use may drive additional hardware to be included in the design and viceversa. For the mission control environment, most existing data is displayed on the console displays.Obtaining a copy of all the associated console displays for the subsystem being modeled is a good placeto start.
Other important sources for gaining information about data include drawings of the Space Shuttle panels,schematics, and the SDRS DTE Display Description Report (SDRS, 1992). The technical expert or enduser will need to assist the developer with data identification. Obtaining a copy of SDRS is of particularimportance because this document contains the MSID numbers needed by the application to get theindividual pieces of data. Schematics will also have specific telemetry information in them and areimportant to use in understanding the data flow. Beware of questionable information, however.
13

Documentationcancontainmistakes,particularlywhenit includesmuchnumericdata. As arule ofthumb, when in doubt ask the expert.
2.3.2.2 Understanding the Data
Once the data sources have been located, the challenge of working with data just begins. The nextimportant step is to understand the data and how changes in system hardware configuration lead to datachanges. A good place to start is with the schematics. All team members should learn to read schematics.This is a crucial step in thoroughly understanding the system and related data. Determine the data set tobe used and be prepared to stay within the monitoring/diagnostic bounds that it provides, at least initially.You may want to identify other data that would be good candidates for expansion of the knowledge base,or perhaps will be needed when the existing set just can't to the monitoring job.
Other considerations necessary in DESSY involved working with binary telemetry data. The data state (1or 0) must be understood; i.e., it must be determined which state implies active and which inactive. Forexample, in DESSY there were several key types of data available. Depending on the type, some data hadan active state of 1 and others had an active state of 0. Table 1 displays some types of DESSY data andtheir states. This information can be obtained from system schematics or from the expert.
Table 1. Active And Inactive States Of Binary DESSY Telemetry
Data Active Inactive
microswitches 1 0
opstats 0 1
enables 0 1
command 1 0
mech pwr 1 0
2.3.2.3 Subtleties in Working with Data
Finally, there axe some subtleties in working with telemetry data of which the development team shouldbe aware. Below are some specific questions and issues to keep in mind when looking for telemetry dataand understanding how it works. With these are included experiences with the MPM/MRL and endeffector subsystems.
Telemetry Overlap Within the System--Is there any telemetry used in more than one operation, providingdifferent indications at different times?
Some opstats (motor data) are used in both MRL and MPM operations. This same data indicateseither MRL or MPM motor activity, depending on the operation. (Operation must be determinedby context.)
Data Overlap with Outside Systems--Is there any telemetry used also in other systems?
Some DESSY opstats are also used for the KU band antenna. This same data indicates eitherDESSY activity or KU band activity, depending on the operation. (Operation must be determinedby context.)
14

Lack of Data for Symmetric Operations--What are the cases where there is telemetry for one operation,but no telemetry for the reverse (symmetric) operation? Data will not always be symmetric for symmetricoperations.
In the MPM system, there is a stow command indicator, but no deploy command indicator.Likewise for MRLs, there is a latch command indicator, but no release command indicator.Additional data had to be used to determine command.
Single Telemetry Point--What are the cases where there is only a single piece of telemetry on which aconclusion can be based?
Even though we have an MPM stow command indicator, that single data point might fail.Therefore we look at additional data related to stowing to make the conclusion. Wheneverpossible, we want to look at multiple data when making a conclusion.
2.3.3 System Configurations
The process of understanding system configurations involves knowing both the hardware and related datathat are used in each configuration, and understanding the relationship between changes in the hardwareand changes in its corresponding data. Not only does the developer need to identify system states, whichidentify configurations, but he or she also needs to understand the procedural operations involved inmaking a transition from one state to another. Two tools are particularly useful in understanding systemconfigurations and procedures. Each is discussed in the following subsections.
2.3.3.1 State Diagrams
An excellent tool for mapping changes in state of the hardware system is the state diagram, where thestates and transitions are represented as a directed graph. Each system state, or configuration, isillustrated as a state node, and the transitions between them are illustrated as edges. For the purposes ofmodeling the system based on telemetry, transitions between nodes are driven by changes in thetelemetry.
The example below illustrates IVtPM system states and transitions during the MPM stow procedure. Table2 identifies each MPM state involved in a stow and shows the related data states (active/inactive) during
each phase. Note that the transition state is identified as a valid state. This is appropriate because datachanges are involved both entering and leaving this state. Furthermore, even though it is a transition, i.e.,a change from one static state to another, there is a finite time period that the physical system remains inthis state. Thus, in the example a deployed state, an in-transit state, and a stowed state are identified.Explanations of the data presented in this example are as follows. Table 2 provides the data values of thesteps of the MPM stow procedure.
When identifying state changes for your system, we recommend constructing a table similar to that shownabove. To construct the table follow these steps:
,, Identify the valid states, including transition states.• Identify all data associated with these states.• Identify data values for each state.• Include new states if data changes indicate you should do so.
After a table like that shown in table 2 is constructed, you should be prepared to construct the statediagram. Developing the state diagram will lead to better understanding of the monitored process.Figure 4 shows a first pass for a state diagram for the MPM stow procedure. (It did not include the State2 of table 2.) All stable (or static) states, the beginning (deployed) state and the ending (stowed) statewere identified. The transition state was initially represented as an edge. Since the stowing process takes32 seconds, the edge was labeled accordingly.
15

Table 2. Data Changes During the MPM Stow Procedure
MPM Stow Procedure
State 1 MPM deployed deploy microswitches
stow microswitches
stow opstats
stow command
active
inactive
inactive
inactive
State 2 MPM stow-in-transit deploy microswitches
stow microswitches
stow opstats
stow command
inactive
inactive
active
active
State 3 MPM stowed deploy microswitches
stow microswitches
stow opstats
stow command
inactive
active
inactive
inactive
Key: deploy microswitches: indicates a deployed statestow microswitches: indicates a stowed statestow opstats: indicates motors are stowingstow command: indicates a stow command is being given
16

Standard State Diagram
transit
(32 seconds)
Figure 4. State diagram with transit edge between static states.
However, the "transit" state concept is important. After the initial diagram was complete, it was thenrevised to include the transition state as a valid state in the diagram. Note that both state diagrams areequivalent representations of the same process. The transition edge of figure 4 became a new state with"epsilon" edges going between it and the states it previously connected. The epsilon notation, commonlyfound in state diagrams, simply means there is an instantaneous transition between states with no timedelay involved. Figure 6 illustrates the revised state diagram used throughout DESSY development.Although either diagram could be used, the one depicted in figure 5 represents the states and transitionsmore precisely. (Hopcroft, 1979)
Revised (epsilon) State Diagram
Figure 5. State diagram with transit state between static states.
Once the procedural data changes have been identified and the state diagram developed, the developerwill have a fairly complete view of the operation, At this point, the developer should construct a statediagram covering all procedures, with data changes labeled directly on it. Figure 6 provides a morecomplete state diagram, an example of the end effector snaring system. Six states have been identified,along with the three microswitches that indicate state changes. In this example motor (opstat) andcommanding data that affect the changes are not shown. The procedures shown include the snare closingwith capture, closing without capture, and opening. The snare closing with capture procedure isrepresented in the bolded states. The important information to note from this figure is the states and theirrelationships to one another, the data values, and the timing information indicating how long the systemwould nominally remain in the given transition state.
Note that there is no failure information represented in figure 6. State diagrams may be extended toinclude non-nominal operations. Figure 7 shows a section of the snare state diagram from figure 6 withan "aborted close" state added. The concept illustrates a simple extension to the state diagram as definedabove. It will be covered in more detail in section 3.3.4, where status rules are discussed.
17

End Effector Snare System State Diagram
OPEN
open = 1close = 0
capt = 0
open = 0close = 0
capt = 0
(1-2 sec)
open = 0close = 1
capt = 1
CLOSED-
NO-CAP
open = 0close = 1
OPENING capt = 0
open = 0 open = 0close = 0 close = 0
capt = 0 capt = 1
(1-2 sec) (0-1 sec)
Figure 6. State diagram for the end effector snare system.
Snare State Diagram with Aborted State
commanding
___ _ regained
Figure 7. Subsection of the snare state diagram depicting an aborted state.
18

In summary, state diagrams are essential step to understanding the system configurations that the teamwill need to model. They should be constructed as soon as the relevant data has been identified. Inaddition to providing information to the developer, their graphical nature allows them to serve as aneffective communication tool between the developer and system expert or end user. State diagrams are aclassic computer science tool that should be fully exploited.
2.3.3.2 Procedural Timelines
A second tool that can be extremely helpful in understanding the system procedures and transitions is theprocedural timeline. Timelines give a chronological step-by-step description of the system transitionstates. They may, in fact, contain the same information as the state diagram; however, they may be moreuseful in some cases. They are most useful in modeling procedures with multiple transition phases.
The timeline shown in figure 8 shows the end effector snare capture sequence. This sequence isillustrated within the state diagram in figure 6. The corresponding state nodes are shown in bold circles.The snare system is initially in the static state of "open." The "closing" state lasts 1-2 seconds and the"captured" state lasts about a second. The final static state is "closed." The boundaries between thetimeline bars are equivalent to the epsilon edges of the state diagram.
Snare Capture Sequence
closing captured
open N_ / closed
01 23 45678
IIIIIIIIII1. Figure 8. Snare capture sequence timeline.
Figure 9 shows the complete end effector capture sequence of which the snare capture of figure 8 is thefirst part. Also shown are the two rigidizing steps and the final state of "closed and rigid." The end statesof the timeline are static or steady states, wNle transition states are depicted within specific time intervals.
Complete End Effector
Capture Sequence
open closing closedand (snare rigidizing 1 rigidizing2 and
0 1 2 3 4 5 6 7 8 9 10111213141516171819 20
Illllllllllll II IIIlllll.
Figure 9. Complete end effector capture sequence timeline.
An extension of the timeline tool might include labeling of data changes at bar transitions. Basically, it isup to the developer to get the most out of a tool like this or the state diagram tool. In DESSY, both wereused, as well as other means of representing the system to enable the team to gain a more thorough
19

understandingof thesystemandits operations.As withstatediagrams,this tool shouldbeexploitedtothefullestextentto aid thedeveloperin understandingthephysicalsystem.
2.3.4 Creating a Storyboard
A storyboard captures the types of information that the intelligent system will display and the types ofinteraction between the intelligent system and the human user (Schreckenghost, 1990). It is also theforerunner of the user interface. Once data has been identified and operations understood, work oncreating the storyboard can begin. This will include sketches of displays and information about how thehuman would interact with and interpret these displays. A "story" can be constructed illustrating how thehuman would interact with the intelligent system in a sample scenario. Initially, sample scenarios shouldaddress normal operations, but can later be extended to include failures. These scenarios can also beused when developing test cases (see section 6.3).
The storyboard is useful in working out information requirements with the user. This technique can beused to distinguish requirements for functions needed to do the task, from requirements aboutpresentation. For example, two telemetry values may need to be compared over a specified time--afunctionality requirement. The means of comparison might be using overlaid plots--a presentationrequirement. Both types of requirements should be specified.
Once in place, the intelligent system will change operations. Another use for storyboards is in steppingthrough typical operational situations to test how well the user can respond to these situations using thenew system. This approach helps in assessing operational changes and in preventing adverse changes(e.g., changes that increase workload or cause loss of needed information). Adjustments can made tointelligent system requirements or possibly to operational procedures.
Storyboards are often created using simple drawing and word processing programs, although they mightbe sketched by hand or developed in the selected prototyping tool. The storyboard will serve as atemplate for later design and development, but it is unlikely that the final design will closely reflect detailsfound in the initial storyboard. They are, however, very effective for conveying working ideas to othermembers of the development team. Use this tool to capture early design ideas, but remain open tochange as the design evolves.
2.3.5 Failure Space
Understanding the failure space of the hardware system to be monitored may be the most difficult part ofthe development tasks. Although, as stated in section 1, the authors believe a real-time monitoring systemis not usually a failure diagnostics system, there is still status monitoring that must be done and the overallhealth of the system must be determined. In the DESSY project, the scope of failure detection waslimited to status information that could be determined from telemetry data. This would not include, forexample, information heard over voice loops. Even with this definition, mapping out the failure spacewas challenging. It can be difficult to find all relevent data for failures you want to include and justifythe elimination of failures that are beyond the scope of the system.
There are, however, some standard types of failure that may be included in real-time monitoring systems.Each of these types is presented in the following subsections.
2.3.5.1 Transition Timing
Once state diagrams and procedural timelines are complete, the developer will know the length of timethe system normally spends in each state. Thus a feature that should be implemented in the monitoringsystem is a mechanism for timing the procedural operations. In the DESSY project, we implemented astopwatch-like timer. It can be started, stopped, paused, reset, and resumed. DESSY timers monitor allsignificant procedural activities.
Once a procedure begins, the appropriate DESSY timer is started. If the procedure (or proceduresegment) completes within the allotted time, a nominal time will be reported by the timer. This nominaltime has been preset in the timer or is determined by expert system rules. It is usually a range rather thana single number. If, however, the procedure spends more time in a transition state than is known to be
20

allowed,ananomalycanbeflagged. In theMPM/MRLsubsystemtherewereactuallyseveraltimesofinterestperprocedure.Becausetwo redundantmotorsdriveboththeMPMsandMRLs,therecouldbeanominaltime if both motors worked properly, a "single-motor-drive" time if one motor failed, or a "two-phase-motor-drive" time if one motor worked nominally and the other functioned in a degraded state.
In addition to obtaining transition times, the developer must consider how to flag a transition failing tostart or end. Both these actions involve using information available in the timer. When appropriate data,often command or motor activity, indicates a transition is taking place, the timer is started. If after sometime period, however, the data reflecting positional indicators do not respond, a failure to begin thetransition has occurred and can be declared. Because sets of data do not always change simultaneously, itis necessary to include a "subtransition" period from a static state to a transition state, i.e., a second or twoto allow the transition to take place. This was not modeled in the state diagrams, but in the real systemmust be considered.
Finally, just as the monitoring system must watch for the failure of a transition to occur, it must also flag asystem being stuck in a transition state. This is not straightforward, because unlike a transition endingmarked by changing data, a transition that falls to end has no data indication, but rather a lack ofindication. In this case, the timer must flag that the transition did not end. Specifically, a timeout limit isidentified. If the timer should reach the timeout limit, a failure has occurred.
Figure 10 summarizes the type of events that should be timed. Each timing indication leads to a differentstatus result (including nominal). Note that each status actually corresponds to a time range, and thelabels show the maximum time for that status. Each timing space shown below is covered by a differentrule, and all possible time ranges are covered.
stowing failed
to begin
1MPM Stowing Status Times
nominalstow tln_
slngle-pha_, on one single motormot(x stow time stow time stowing failed
0 4 8 12 16 2024 28 3236404448 52 5660 64 68 72
IIII IIIIII II I IIII I I1.
Figure 10. MPM stowing timeline with transition timing.
2.3.5.2 Data Questionable On/Off--Ramifications to the System
Another type of status a real-time expert system should detect is a data value known to be in an incorrectstate. DESSY flags a data value as "questionable-on" if it is active when it is expected to be inactive(according to other system information). Likewise, a data value that is inactive when it is expected to beactive is flagged as "questionable-off." The method of detecting the questionable-on/off data status variessignificantly depending on the type of data. Some parameters that are used to identify questionable dataare system state, other redundant sensors, and expected transition activities.
Note that the descriptor "questionable" is used to mark suspect data. This is because the data may or maynot represent a known failure, and the expert system (and human) may not have the necessaryinformation to conclude a failure. The flagging of data as questionable-on/off in fact is usually the firststep for any further DESSY status conclusions. The questionable flag allows DESSY to alert the user thatsomething in not nominal without making any uncertain failure conclusions.
Once the data has been marked as questionable, however, further rules may process this information tomake conclusions about the data and its ramifications on the hardware system. For examPle, it may be
21

determinedthat the questionable-on value indicates a "stuck on" microswitch. If the appropriateinformation is available, the status can be upgraded.
A second use for the questionable data status feeds into the diagnostic rules, giving them a less certain ordefinitive nature. For example, in the MPM system a certain active deploy microswitch would inhibit oneof the redundant motors from stowing, causing a single-motor stow to occur, should stowing becommanded. If the microswitch has been given a questionable-on status, a system status of expect-single-motor-stow (as opposed to single-motor-stow) is provided. This strategy allows DESSY to present suspectanomalies to the user without taking the risk of giving the user faulty conclusions. Once additionalinformation is available and the motor inhibit is confirmed by other data, the system message can beupgraded to single-motor-stow.
2.3.5.3 Failure of Data to Change During an Expected Transition
A third type of failure the expert system should monitor is failures during transitions. Given an expectedoperation, the human and expert system should know a priori the set of data that will change. If anysubset of this data does not change at the expected time, an anomaly is obvious. The expert system musthave status rules capable of identifying appropriate pieces or sets of data that do not change whenexpected and flag that data at the time of transition. This includes, but is not limited to, failures detectedthrough transition timing.
When flagging suspect data, DESSY will usually mark the data as questionable. However, during atransition the evidence may be strong enough to identify real failures rather than just questionablesituations. Depending on the specifics of the scenario, the developer may be able to conclude immediatestatus information at this time.
An example of "failure of data to change" may occur at the beginning of an MPM stowing operation. Atthis time two stow opstats indicating motor activity will become active, and the two stow microswitchesindicating stow position will go inactive. A stow command indicator is also available. Thus for thisparticular transition, there are five pieces of telemetry which directly and jointly indicate the operationinitiation. If any one (or more than one) of these five pieces of data does not act as expected, ananomaly can be flagged.
To conclude, the system developer must identify the entire set of data that indicates a transition andconsider the possibility of each piece (or subset) of data in the set not responding. Each piece and subsetidentified will likely require a separate status rule.
2.3.5.4 Multiple Data Values Active, Indicating Conflicting States
A final type of anomaly that the intelligent system should identify is that of data values indicatingconflicting states, i.e., an impossible configuration. These anomalies are flagged when the system is staticand no operational activity is expected to occur. They are discovered either by observing that twoconflicting data values are simultaneously active, in which case they might both be marked asquestionable-on; or for a more sophisticated approach, given that the system is in a known configuration,the suspect data that conflicts with this configuration can be marked as questionable-on and possiblefurther diagnostics performed. This second approach is preferred when possible because it furtherisolates the suspect telemetry.
An example of this type of failure occurs when the MPM system is in the stowed configuration, and asingle deploy microswitch turns active. This conflicting deploy microswitch would be marked asquestionable-on. Alternatively, a single stow microswitch becoming inactive would be marked asquestionable-off. Another example occurs when the end effector snare is known to be open, and with noprocedural operations the close microswitch becomes active. The close microswitch is marked asquestionable-on.
The developer and expert must outline all known nominal configurations of the system, and for eachconfiguration, determine data values from other sensors that would indicate conflicting conditions. Thenfor each piece of data or subset of data, a separate diagnostic rule can be formed.
22

Althoughthis maynotbeanexhaustivesetof failuretypes,theyarethemostcommonandeasilyidentified. DESSYdetectsall of thesetypes,andin manycasespassesontheinformationto furtherfailuredetectionrules.A completelistingof failuresin theDESSYendeffectorexampleis giveninAppendix A.
2.3.6 Relationships with Other Systems
Finding the relationships between the system being modeled and the outside world can be elusive. Theexpert must be thoroughly involved in this step. How the system affects its neighboring systems, both innominal and off-nominal operations, as well as how those systems affect it, should both be modeled.System overlap and dependencies may occur during select normal operations or happen only duringfailures. In either case these scenarios may add complexities to the monitoring the system.
Specific examples of overlap between systems include ambiguities of data that belong to multiplesystems. That is, a single piece of telemetry may represent different systems at different times. Forexample some opstats that indicate MPM/MRL motor activity can also be active when the KU-bandantenna is being used and there is no current MPM/MRL activity. This is due to a change inconfiguration outside the scope of the expert system. Additional data must be used to indicate trueMPM/MRL activity so that the KU-band activity does not falsely indicate this. As another example, if alogic switch fails or is turned off, subsets of the MPM/MRL opstats will become active, depending uponthe particular switch. Again, it must be assured that this does not incorrectly suggest MPI_UMRL activity.
Thus the developer must be aware that there may be overlaps in the use of certain subsets of telemetryand design the system to account for them. If this is not done, the result is most likely to be falseconclusions of system activity.
Other issues in dealing with external systems include understanding how failures outside the scope of themonitored system will affect system performance. An obvious example is a power related failure. If afailure occurs in the power source to your system, the system will likely be reconfigured to allow for aredundant power source. The developer must be aware of how this affects the system model. It mustthen be determined if accounting for the situation is within the defined scope of the project.
Likewise, the effects that failures in the monitored system have on external systems should be determined.Although this is stepping into diagnostics, the effects your system will have on the outside world may beeasy to determine in some cases. Again, it must be decided whether accounting for these situations iswithin the project scope.
In conclusion, it is important to remember that the relationships between the monitored system andexternal systems do exist and must be identified and understood. The expert will play a key role inidentifying this information for the developer. Once these interfaces and interactions have beenidentified, the team can decide which are within scope of the expert system project.
2.4 Information Requirements
Information requirements should be well understood so that all necessary information is available to thedevelopment team throughout the development process. Information sources should be identified andthe information sought out before application development begins. The first place from whichinformation can be extracted is the current user displays. The expert/user can identify additionalinformation sources used in his or her job. Finally there are some standard information sources in theaerospace environment that the development team should acquire.
2.4.1 Information from Current Displays
The user's current displays are a crucial source of information because they contain the standard set ofdata that the user has available. Understanding the displays and how they are used should be one of thefirst joint tasks of the development team. Specifically, the user must identify which data is used for whichsubtasks, which is displayed but not used, which is most crucial, and which is most frequently used.Questions like this will help shape the user interface of the expert system display and will help define theinitial storyboard.
23

As theteamworksto understand how the current displays are used, they must objectively identify bothpositive and negative aspects of the displays. Factors might include screen layout and groupings of data,text vs. graphical representations, and color. Other questions the team might ask are: How is the usernotified when data begins to change; where and how is status information displayed; and how and whyare subsets of data grouped? The human factors team member is responsible for assisting the expert/userin deriving this information.
2.4.2 User-Requested Information
It is likely that the user makes use of information not found on existing displays. Any additionalinformation that the intelligent system can provide will further help the user do his or her job and add tothe usefulness of the software. Here the difficulty often lies in identifying this information. Again thehuman factors team member has the responsibility to assist the user. Team members must go through theuser's monitoring process to identify the less obvious information on which the user relies. Examplesfrom DESSY include stopwatch timing and handwritten logs. Having this information available throughthe intelligent system further increases the usefulness and credibility of the software.
2.4.3 Gathering of Information
Before the design and development phase of the project begins, all relevant sources of informationshould be located. Finding these items ahead of time will make the process more efficient. Below is a listand brief description of items used in DESSY. The expert/user should assist the team in locating this typeof information.
• Schematics and Drawings----_ovide assistance in understanding the physical system and how failuresoccur and propagate. Also may provide telemetry information.
• SDRS--Provides displays with listings of available telemetry including MSID number, label, type, andlocation on display.
• Console Handbooks--Provide detailed descriptions of the system, its procedures, and the monitoringprocess.
• Current Displays---_ovides a graphic of what is currently used during the monitoring process.
• Failure Modes and Effects Analysis (FMEA) Documents--Provides detailed information aboutfailures, their causes, and their effects.
• Malfunction Procedures--Provides information on malfunction procedures for failure diagnosticsand recovery.
Once this information is located, it should be made readily available to all team members. Keeping thesedocuments and all other information related to the expert system in an easy-to-access central location willmake the entire team's job easier.
24

Section 3
Building the System
Once you have completed the preliminary activities of understanding real-time monitoring systems anddetermining the requirements for the system you wish to build, you will be ready to move on to the nextphase of the intelligent system project. Section 3 covers both the design and development phases of theapplication. The authors have chosen to merge the design and development processes into a single stepbecause the high level nature of the G2 (or G2-1ike) programming tool supports, and in fact necessitates,this concept. Object-oriented, graphical development tools support creating the software design withinthe tool itself. This leads to development as an extension of existing templates rather than recreatingdefinitions and objects in a separate development step.
In the DESSY project, the authors found that the design and development phases went hand in hand,forming an iterative process. The DESSY object structure was designed by creating a definitions classhierarchy in G2. Once these definitions were created, they were immediately available for use, i.e.development. It did not make sense to separate object design, definition, and implementation. Thedefinitions and their object instantiations did frequently change, thus leading to iterative development.
The key concept one must accept to use this section is that this approach is one of iterative refinements ofa single design-development process. This section presents six major steps in the design anddevelopment process. Section 3.1, "Organization of the Knowledge Base," prepares you in the setup ofthe architecture of the knowledge base, including grouping of objects, rules, and displays. Section 3.2,"Object and Structure Design," provides insight into how the physical system should be modeled inobject-oriented programming. Section 3.3, "Rules," is essential reading for developers of real-timemonitoring rules. Rules have been broken into several key categories, and this section provides anexplanation of the use and development of each type. "User Interface Design" is discussed in section 3.4,and section 3.5 covers issues involved in "Setting Up for Real Time." Finally section 3.6, "Setting Up forEnd Users," provides a heads-up on subtle yet key issues involved in preparing the system for end users.
NOTE: Because section 3 covers the development of the knowledge base, it will be more closely relatedto the G2 tool than other sections. Many of the examples will be G2 specific. When possible, exampleswill be generic enough so that developers using other real-time expert system tools will find theinformation useful. However, the focus is on providing help to developers using G2, and in factproviding many G2-specific tips along the way.
3.1 Organization of the Knowledge Base
A well organized knowledge base will be easier for the development team to understand. Theorganization will be iterative, and the developer's willingness to change the organization as the knowledgebase matures will lead to an application that all members of the team can use. This aspect of creating theintelligent system parallels traditional programming, and the experienced programmer will be familiarwith these concepts. This section covers both module and workspace organization. A module in the G2application corresponds to a file containing a subset of the knowledge base. A workspace is a workwindow within a module on which objects and rules and all other G2 items are placed. It is important forthe knowledge base to be organized at both levels.
3.1.1 Module Organization
Modularization is an important part of knowledge base design, although there is not one right way tomodularize. As the system evolves, changes will be made to the module architecture.
G2 modules are files which contain pieces of the knowledge base. As with traditional programming,these files dependend upon one another. For example, the lowest level modules contain definitions.Once these are constructed, object modules can be built which use them. Rules and displays which usethose objects can then be built within higher level modules.
25
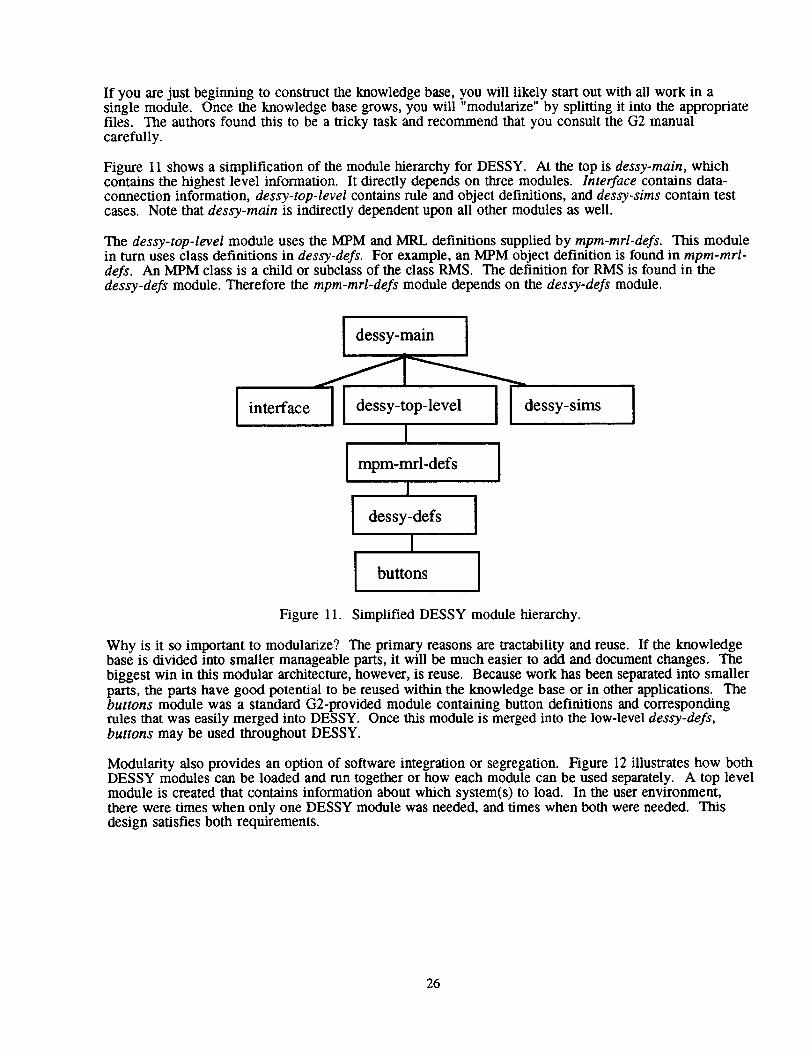
If youarejustbeginningto constructthe knowledge base, you will likely start out with all work in asingle module. Once the knowledge base grows, you will "modularize" by splitting it into the appropriatefiles. The authors found this to be a tricky task and recommend that you consult the G2 manualcarefully.
Figure 11 shows a simplification of the module hierarchy for DESSY. At the top is dessy-main, whichcontains the highest level information. It directly depends on three modules. Interface contains data-connection information, dessy-top-level contains rule and object definitions, and dessy-sims contain testcases. Note that dessy-main is indirectly dependent upon all other modules as well.
The dessy-top-level module uses the MPM and MRL definitions supplied by mpm-rarl-defs. This modulein turn uses class definitions in dessy-defs. For example, an MPM object definition is found in mpm-mrl-defs. An MPM class is a child or subclass of the class RMS. The definition for RMS is found in thedessy-defs module. Therefore the mpra-mrl-defs module depends on the dessy-defs module.
interface
dessy-main ]
[ ] dessy-top-level
I
[ mpm-mrl-defs [
I
I dessy-defs [
I
I butt°as ]
I dessy-sims !
Figure 11. Simplified DESSY module hierarchy.
Why is it so important to modularize? The primary reasons are tractability and reuse. If the knowledgebase is divided into smaller manageable parts, it will be much easier to add and document changes. Thebiggest win in this modular architecture, however, is reuse. Because work has been separated into smallerparts, the parts have good potential to be reused within the knowledge base or in other applications. Thebuttons module was a standard G2-provided module containing button definitions and correspondingrules that was easily merged into DESSY. Once this module is merged into the low-level dessy-defs,buttons may be used throughout DESSY.
Modularity also provides an option of software integration or segregation. Figure 12 illustrates how bothDESSY modules can be loaded and run together or how each module can be used separately. A top levelmodule is created that contains information about which system(s) to load. In the user environment,there were times when only one DESSY module was needed, and times when both were needed. Thisdesign satisfies both requirements.
26

dessy-main [
ee-module ImP m-mrl-mod
lee-main [
Iee-module [
mpm-mrl-main
Impm-mrl-mod
Figure 12. Multiple system configurations for DESSY.
Another module reuse win for DESSY was in the creation of a separate DESSY training application. TheDESSY tutorial used existing DESSY modules with an additional module layer built around them toreplace the normal interface. Because of the design, the definition and rule modules were easily pluggedin to the tutorial. This provided the benefit that when the rule module was edited for DESSY, the tutorialautomatically received those changes. Modularization was a big time saver in this aspect of the problem.
The only disadvantage that arose due to modularity in DESSY was that it impacted software loading time.Many small G2 files take longer to load than a single file containing the entire knowledge base. For themission control environment, these loading minutes can be crucial. G2 provides a capability for savingthe knowledge base as a single file. Thus modularity may be kept in the development version of yourintelligent system, and the delivered product can be merged into a single file.
3.1.2 Organization within Modules
Workspace organization parallels modular design. The developer should establish a convention fororganizing workspaces within the modules. G2 provides the capability for setting up knowledge baseorganization, but does not enforce or even encourage the developer to proceed in this manner. G2 isglobal, giving the developer the capability to program with no organizational structure whatsoever.Because of this lenience, we stress the importance of the developer maintaining self discipline anddeveloping the knowledge base in a structured, well organized manner.
Because each workspace is assigned to a G2 module, workspace organization occurs within a module. Aparallel organization should be maintained for all modules. First, set up a root workspace with pointers toall other workspaces--a top-level workspace that allows movement to any other workspace, either directlyor through other workspaces. Figure 13 illustrates this concept.
To implement this concept in G2, create a workspace and name it something like module-name-root.Then create a definition called "workspace (ws) holder" or something similar. The icon should besomething simple, like a small box. For each new high-level workspace needed, create a ws-holder objectand give it the name of the workspace you want to create. Create a subworkspace for the ws-holder. Thatwill be your new workspace. These subworkspaces can either be work areas or can hold workspaceholders to other lower level workspaces.
For purposes of best navigating through the system, assign names to only high-level workspaces. This isdue to the way G2 presents workspace names through the Get Workspace* command. Using the G2"Free Text" works nicely to indicate the name of a workspace. When searching directly for a workspaceusing the G2 Inspect, you may search for the ws-holder with the appropriate name, and then go to itssubworkspace. This method provides for well organized tracking and an easy path to workspaces,
27

ROOT
_WS-1 /
['] WS-2 -
["] WS-3 -
['] WS-4_
WS -4
I
•._W S - 3
[']WS-5
[3 WS-6
t,- WS-2
['] WS-7
WS-8
[7 WS-9
IIII1 Figure 13. Conceptual illustration of workspace organization.
Now that the structure for workspace organization have been outlined, the details of segmenting workinto different categories will be covered. Work breakdown begins with subsystems at the module level.Within modules there is a recommended breakdown as well. Below is a list of workspace categories andsubcategories. The top level items might be the named workspaces listed on the highest level rootworkspace. Although an example and suggestions are provided, it is important to remember that theexact implementation will depend on the structure of your knowledge base.
• Definitions
Object DefsDisplay DefsMSID (data) Defs
• Objects- Object-type- 1- Object-type-2- etc.
• User Interface- Screen-1- Screen-2- etc.
Rules
- Corrective (always on)- Monitoring (deactivatable)
- State Transition- Commanding- Status
* G2 commands will be denoted with Helvetica font.
28

• Relation- Definitions- Rules
• Initialization
• Data Interface (MSID)
• Simulations (Testing)
• Documentation
The sample list should give you an idea of how to begin to break down your knowledge base; however, itis just one implementation tailored to DESSY. In addition, note that this breakdown does not followobject-oriented programming in the purest sense because the controlling roles, which parallel methods,have been separated from the objects they manipulate. In true object-oriented programming, objects andtheir methods are more closely tied. The approach taken to separate the roles and objects was primarilyfor organizational purposes. G2 roles can manipulate multiple objects, leading to complexities inclassifying rules based on their associated objects. The authors found this approach to be effective andappropriate.
3.2 Object and Structure Design
Good object and structure design is crucial for a well designed expert system. The sections below discussthe various elements in an object-oriented system. They primarily center on factors in the objectstructure itself, but also include relations between objects and object groupings. Most of the discussionthat follows reflects traditional object-oriented methodology; however, G2-specific examples will beincluded.
3.2.1 System vs. Subsystem Design
Any hardware system is likely made up of pieces and subpieces and should be modeled accordingly.This is the case for DESSY. For example, although there is a single MPM system, there are actually fourindividual MPMs making up the system--the shoulder, forward, mid, and aft MPM. DESSY has beenimplemented such that the MPM state diagram and rules apply to each individual MPM. In addition, anoverview system state diagram has been developed which is dependent not on the telemetry data, but onappropriate changes of state in all individual MPM state diagrams. Thus when each of the four individualMPMs moves to a stowed state, the system level MPM reflects the stowed state. This approach allows oneto capture two distinct levels of system monitoring--that of the individual pieces of the system and that ofthe system functioning as a whole. More detailed failure tracking is possible since more information isrecorded about the individual MPMs. At the same time, a glance at system state (and status) as a whole isavailable.
3.2.2 Object Design
The first step in constructing objects is to develop the initial object structure and hierarchy, including thesystem and subsystem hierarchies. Object attributes should be defined, including state, or position, status,or operational health, and command, if commanding is associated with the operation of the item. In G2,object attributes might be other objects themselves. For instance, each MRL has two motors and fourmicroswitch MSIDs. These six items are modeled in DESSY as both attributes of an MILL and objectsthemselves. In addition, the motor objects have their own attributes, which include additional MSIDobjects. This representation is useful because it closely matches the true system structure.
As you construct the object design, be prepared for system/subsystem cases that seem very similar, but aresubtly different and therefore often need a different approach. To contrast the MRLs, the MPM systemcontains four MPMs; however, only the shoulder MPM contains motors. Thus the choice for MPMs wasto place two motor objects within the MPM-system object, rather than in the shoulder MPM where themotors are physically located. This allowed all MPM objects to remain symmetric. It did, however,necessitate slightly different reasoning strategies when dealing with MPMs than when dealing with MRLs.
29

It is importantto notethatsometimessystemsseemverysimilar,but theirsubtledifferencesaremanifestedwheriyouattemptto modelthemassoftwareobjects.Figure14illustratestheDESSYdesignof theMPM systemandMPMs.
A final caution: thedevelopermustunderstandthesubtletiesof thesystemsbeforedecidingonanobjectdesign.Beconsistent,butdon'tgetboggeddownby systemsimilaritiesthatmaynotbethatsimilarat thedetaillevel. And if theneedarises,bewilling to changeyourobjectdesignto includenewlydiscoveredor understoodinformation.
MPMMPM
System
attributes attributes
System-State State
System-Status Status
Command Stow MSID's
Motors Deploy MSID's
Timing
Figure 14. Example of the MPM system and MPM object definitions.
3.2.3 Class Hierarchy
As with conventional object-oriented programming, class hierarchy plays a powerful role in expertsystem design. G2 is very strong in its ability to reason over class hierarchies, which proved a greatadvantage throughout the knowledge base development process. A particularly good illustration isDESSY's MSID hierarchy. The highest level MSID definition for DESSY is MSID-def. It contains all theattributes of an MSID. Below it are, for example, end-effector-MSIDs and MPM/MRL-MSIDs. Withineach of these groups are microswitch-MSIDs, opstat-MSIDs, and commanding-MSIDs. In addition thereare power-MSIDs, enable-MSIDs, and switch-indication MSIDs. Within the MPM/MRL-microswitchesthere are stow-MSIDs, latch-MSIDs, deploy-MSIDs, and release-MSIDs. The breakdown of various levelscould continue.
The point is that with only minor exception, all these MSID definitions are identical. Each lower level hasinherited exactly the same attribute slots as its parents and other ancestors. Why then this elaboratebreakdown? It reflects a desire to reason about a subclass at any of these levels. In G2 a single rule caneither reason over all MSID-defs or reason only over all microswitch-MSIDs or only the stow-microswitch-MSIDs. This is a very powerful feature that allows manipulation of only the desired objects.
3O

ThroughoutDESSYdevelopment,theclasshierarchycontinuedto berefinedto allowrulesto reasonoverspecificgroupsof objects.Thisled topowerfulyetconciserules. Unfortunately,if youarenotusingG2,yourtoolmaynothavethisstrongobjectstructure.If thisis thecase,youshouldstudythecapabilitiesof thetool youhaveandattemptto exploitits objectreasoningcapabilitiesto thefullestextent.
3.2.4 Inter-Object Structure (Relations)
There are times when you may wish to reason over a group of objects not associated through the classhierarchy. This may be because your tool does not allow the association, or it may simply be because theitems were not related enough to be defined within the same hierarchy. G2 provides another powerfulway to logically tie two (or more) objects together for reasoning purposes. G2 relations act as pointersbetween any G2 objects. The relation is associated with any two classes in the class hierarchy, and theninstantiated between any two instances in those classes. The relation may be a one way pointer or it maybe bidirectional. It may be one-to-one, one-to-many, or many-to-many.
An example of the use of a relation in DESSY is the association of an instance of the timer class with aninstance of the MRL or MPM class. Four RMS timer objects were created to correspond to FWD-MRL,MID-MRL, AFT-MRL, and the system-MPM objects. A relation was defined which tied an RMS timer toan RMS object. Once the definition was set up, four rules were written to tie each timer to the appropriateobject. Thus a single timer was associated with each MRL and the MPM system. A rule example isshown below.
"Initially conclude that FWD-MRL-TIMER is-a-timer-of Forward-MRL."
Creating this link then provided reasoning capabilities such as
"...start the timer that is-a-timer-of the MRL..."
where is-a-timer-of is the actual relation that references the tie. This capability allowed generic timerrules to be written, rather than creating specific rules for each timer/object pair.
A second example of the use of relations in DESSY is in tying the specific MSIDs to their displays. AnMSID display class was defined. Its icon is a box that is light blue when data is inactive and dark bluewhen data becomes active. A bidirectional, one-to-one relation ties each MSID to its appropriate bluebox. Thus it is possible to reference the-msid-of any blue box, or the-msid-display-of any MSID forwhich a display is defined. This implementation allowed separation of the user interface and datahandling portions of the intelligent system. It made reasoning over the displays (for user interfacepurposes) very simple and concise.
In summary, relations are yet another extremely valuable tool that G2 provides to keep knowledge basesmore concise and therefore more maintainable. Because the concept of relations is very similar to theconcept of pointers, it is likely that whatever tool you are using, there will be some level of this capabilityprovided. It is another feature that should be exploited to optimize the expert system developmentprocess.
3.2.5 System Variables and Parameters
As you construct objects and associated attributes, you will be defining variables and parameters for theexpert system. In G2 the difference between variables and parameters is that variables may or may nothave a value at any time, i.e., they may be "NULL." Parameters, on the other hand, always have somevalue, even if it is the symbol "none." This guide will follow G2's use of these terms. Other systems willlikely have similar concepts.
There are three key attributes associated with the objects that model the hardware system. They are state,status, and command. These items should be made parameters so that they are always given a value,rather than being allowed to have a value of NULL. It may be that upon initialization, or at any time forthat matter, the value of one of these attributes is unknown. Assigning the value unknown, or something
31

semanticallyequivalent,to theattributeis analternativeif thatis thecase.Thustheexpertsystemwilldirectlyconcludethattheattribute'svalueis unknown,ratherthantheitembeingunknown(NULL)becausedataand/orotherinformationwasnotavailableto makea conclusion.Thatis, theexpertsystemknowsthatit doesn'tknow. Thissubtledifferencein approachprovidesthedeveloperwith morecontroloverexpertsystemconclusions.
Whenis it advisableto usevariables rather than parameters? In DESSY variables are used for the valuesof MSID data because it should be clear whether or not the data has been set or whether it is not available.In this case a value of NULL is quite informative because it is directly tied to the availability of thetelemetry link. In addition, variables are used for items that need to time out. Along with the "NULL"value, G2 variables have validity intervals that allow the last set value to be good for a given time period.Variables are used with a time out or validity interval when the value is to be valid for only a specifiednumber of seconds. For example, MSIDs have an attribute called "flicker." This value is set to true if thedata value has flickered, or repeatedly turned on and off for a few seconds. Flicker is valid for about 4seconds. Thus if the data has been noisy, a flicker value of true would prevent that data from being usedin diagnostic rules. After the time period is up, flicker is automatically returned to false because the datais no longer unstable.
Whether object attributes are parameters, variables, or other objects with attributes of their own willdepend on your specific design. Most likely the knowledge base will include all of these. You mustdecide which is most appropriate for each individual circumstance using the guidelines provided.
3.2.6 Grouping of Objects
The final area in the discussion of object design is the groupings of objects within the knowledge base.Because DESSY's display portion has been partitioned from the reasoning portion, most of the realobjects are hidden, while their displays are presented to the user. G2 provides an icon slot for each objectdefinition, which means that any object can have its display associated directly with that object, ratherthan having a separate display object and tying them together with relations. Your implementation willdepend on the design goals of the expert system. If there is some possibility that the front end, ordisplay, might eventually be replaced or upgraded with another tool, it is advisable to initially separateobjects from display objects. If this is not a design criteria, however, you may wish to take advantage aG2's "icon-attribute" feature. Keep in mind that while separating display objects from the rest of thesystem will create a more segmented and cleaner system, these additional objects could lead toperformance hits. The purpose of your system will be a major factor in this decision.
3.3 Rules
Once preliminary object design is underway, rule construction can begin. This section discusses severalissues relevant to creating a maintainable and robust rule set. It starts with a discussion of theorganization and types of rules within the knowledge base and then discusses some important factors inwriting rules that are robust. Sections are provided on specific categories of rules you will build in theknowledge base. As you read this section, it is advisable to frequently refer to section 4, "Working withReal Time Data." It complements section 3.3 by explaining how to make your monitoring system robustenough to handle real data and its problems.
3.3.1 Organization and Classification
Rules should be well organized for the knowledge base to be maintainable and easily debugged. It isuseful to break rules into categories aligning with workspace organization. The subsections below discussadditional issues that must be addressed during initial rule development.
32

3.3.1.1Rules versus Procedures
A rule-based system not only includes rules, but uses both rules and procedures as needed. G2 providesboth rule and procedure writing capabilities, as do many expert system development tools. Although theflexibility of rule sets often makes them the best choice, the sequential nature of procedures makes themmore useful at times. Don't hesitate to include procedures when they are appropriate. Although mostDESSY logic was written using rules, there were times when procedures were either necessary orappropriate.
The primary use of procedures in DESSY related to timing and the activation and deactivation of sets ofrules. Certain sets of rules apply only to particular situations and require continuous poling for a set ofevents. Because leaving these rules on continuously would bog the system down, we used procedures toturn on, or enable, these rules during the times they were needed, and then turn off, or disable, them oncethe situation had passed. An example is diagnostic timing rules that flag an MPM stow or deploy timingout. These rules are enabled when the stow/deploy begins. If the operation took longer than the allowedtime, these diagnostic rules would fire and indicate the anomaly. Whether the operation is nominal orcontains failures, the rules are disabled once the stow/deploy completes. Thus procedures were used inmonitoring steps that called for control of diagnostic rules.
3.3.1.2 Generic Rules
Generic rules allow fewer rules covering more objects to be written. They reason over classes of objects,rather than individual object instances. G2 is particularly strong in this area due to its powerful object-oriented capabilities. As you develop the expert system, you will likely enhance the object hierarchy toallow for the creation of generic rules that cover precise subclasses of objects. Segments of generic rules,along with the class hierarchy the rules address, is shown in figure15. The Stow-Microswitch-MSID is asubclass of the Microswitch-MSID which is a subclass of MSID. Rules can be written for each level.Developing generic rules will lead to a smaller, more maintainable knowledge base.
Stow
Microswitch Microswitch
MSID MSID
MSID
For every MSID
If the MSID is...
For every Microswitch-MSID
If the Microswitch-MSID is...
For every Stow-Microswitch-MSID
If the Stow-Microswitch-MSID is...
Figure 15. Generic rules used with the class hierarchy.
33

3.3.1.3Rule Categories
Rules should also be broken into appropriate categories according to their functionality.DESSY includes are
The categories
• State--Rules that use data and existing state information to conclude a new state
• Status--Rules that use data and other scenario information, such as state or command, toconclude system health
• Command--Rules that use commanding and other relevant data, along with scenario information,to conclude a command, including a command of none
• Correction--Rules that watch for a precise data pattern, given a state or status that conflicts withthat pattern, and invoke a corrective action to adjust the state or status
• Data Handling--Rules that manipulate raw data
• User Interface--Rules that manipulate a display item on the interface
Categorizing rules leads to more effective management of the knowledge base. It is also necessary toallow disabling of rule sets. Each of these rule categories is discussed in more detail in the followingsections.
3.3.2 Making Rules Robust
The primary element that separates real-time data monitoring intelligent systems from off-line intelligentsystems is their interaction with continuously changing data. In theory, data changes come in batchesand rules are written based on a snapshot of data in the system at a given time. In reality, there arenumerous "contaminations" of this idealistic scenario. These contaminations include noisy data and lagsin data changes. Their effect is that the idealistic snapshot oriented rules simply don't work or workpoorly. To overcome these problems, rules need to be built to be robust enough to function properlyeven in the presence of noisy or lagging data.
The issue of dealing with bad data has been addressed in section 4, Working with Real Time Data. Thissection was derived from a paper called "A Monitoring System with Tolerance for Real Time DataProblems." (Land, 1993) Other particularly relevant work is found in Chandrasenkaran and Punch, 1987,and Chandrasenkaran and Punch, 1988. Throughout the remainder of this section, the reader shouldreference section 4 for techniques in developing rules to withstand the problems of real data.
3.3.3 Initial State and Command Monitoring Rules
Now begins a discussion of building rules in G2. State and command rules will be discussed first,followed by status rules and finally correction rules. The subsections below explain the necessary steps inthe rule writing process.
3.3.3.1 Developing from State Diagrams
State diagrams allow the development team to obtain a good understanding of the monitored processesand their states. Before you begin writing state and commanding rules, you will want to have completedstate diagrams. Section 2.3.3.1 provides an in-depth explanation of the construction of state diagrams.Figure 16 is a state diagram for the MPM system. This example will be used in the following discussionof the construction of state and command rules.
34

MPM State Diagram
stow-microl = 0
stow-micro2 = 0
deploy-opl = 0
deploy-op2 = 0
DEPLOY
-IN-
TRANSIT
(32 sec)
deploy-micro1 = 1deploy-micro2 = 1
deploy-opl = 1
deploy-op2 = l
STOWED DEPLOYED
stow-microl = 1
stow-micro2 = 1
stow-op 1 = 1
stow-op2 = 1stow-cmd = 0
STOW
- IN -
TRANSIT
(32 sec)
deploy-microl = 0
deploy-micro2 = 0
stow-opl = 0
stow-op2 = 0stow-cmd = 1
Figure 16. The manipulator positioning mechanism state diagram.
3.3.3.2 Identification of Sequence Asymmetry
Before developing the set of rules corresponding to a state diagram, identify procedural symmetry.Notice in the example in figure 16 that both the stowing and deploying operations use microswitch(microl and micro2) and opstat (opl and op2) data. The stowing operation has a command (cmd)indicator, but there is no command indicator for deploying. Small discrepancies such as this arecommon in procedural symmetry. Because the data is slightly different, otherwise symmetric rules formonitoring these operations will be slightly different as well. Except for this discrepancy, however, thestowing and deploying operations are symmetric.
3.3.3.3 Initial Rule Development
Once state diagrams are defined, you are ready to create initial state and command rules. This discussionwill continue with the example in figure 16 and construct rules for MPM stowing and deploying. A ruleis created for each state transition and each command value. The rules will form a cycle to cover alltransitions. The rule construction that follows will be for a nominal case scenario. It is important torealize that these rules are simplified versions of actual DESSY rules. They are a first cut, and working
DESSY rules are in many cases much more complex. These complexities will be addressed in latersections. The rules have been consecutively numbered for clarity. Curly braces { } denote comments.Notice that there are both MPM rules and MPM-system rules (see figure 14) and that these two sets ofrules interact with one another.
35

State Change Rules: Stowed --> Deploy-in-Transit
Rule #1MPM
If the state of the MPM is Stowedand stow-microswitch-1 = 0 {becomes inactive}and stow-microswitch-2 = 0 {becomes inactive}and the command of MPM-System is deploy {determined from opstats}Then conclude that the state of the MPM is Deploy-in-Transit
Rule #2_ate of MPM-System is Stowedand Shld-MPM is Deploy-in-Transitand Fwd-MPM is Deploy-in-Transitand Mid-MPM is Deploy-in-Transitand Aft-MPM is Deploy-in-TransitThen conclude that the state of MPM-System is Deploy-in-Transitand conclude that the status of MPM-timer is Start
State Change Rules: Deploy-in-Transit --> Deployed
Rule #3MPM
If the state of the MPM is Deploy-in-Transitand deploy°microswitch-1 = 1 {becomes active}and deploy-microswitch-2 = 1 {becomes active}and the command of MPM-System is none {determined from opstats}Then conclude that the state of the MPM is Deployed
Rule #4IF_5"_'_ate of MPM-System is Deploy-in-Transitand Shld-MPM is Deployedand Fwd-MPM is Deployedand Mid-MPM is Deployedand Aft-MPM is DeployedThen conclude that the state of MPM-System is Deployedand conclude that the command of MPM-System is noneand conclude that the status of MPM-timer is Off
State Change Rules: Deployed --> Stow-in-Transit
Rule #5MPM
If the state of the MPM is Deployedand deploy-microswitch-1 = 0 {becomes inactive}and deploy-microswitch-2 = 0 {becomes inactive}and the command of MPM-System is stow {determined from opstats}Then conclude that the state of the MPM is Stow-in-Transit
Rule #6lFtl_'_'_ate of MPM-System is Deployedand Shld-MPM is Stow-in-Transitand Fwd-MPM is Stow-in-Transitand Mid-MPM is Stow-in-Transitand Aft-MPM is Stow-in-TransitThen conclude that the state of MPM-System is Stow-in-Transitand conclude that the status of MPM-timer is Start
36

State Change Rules: Stow-in-Transit --> Stowed
Rule #7MPM
If the state of the MPM is Stow-in-Transitand stow-microswitch-1 = 1 {becomes active}and stow-microswitch-2 = 1 {becomes active}and the command of MPM-System is none {determined from opstats}Then conclude that the state of the MPM is Stowed
Rule #8]l_"6-_ate of MPM-System is Stow-in-Transitand Shld-MPM is Stowedand Fwd-MPM is Stowedand Mid-MPM is Stowedand Aft-MPM is StowedThen conclude that the command of MPM-System is noneand conclude that the state of MPM-System is Stowedand conclude that the status of MPM-timer is Off
Command Rule: Deploy
Rule #9_mmand of MPM-System is not deployand the state of the MPM-System is not deployedand deploy-opstat-1 = 0 {becomes active}and deploy-opstat-2 = 0 {becomes active}Then conclude that the command of MPM-System is Deploy
Command Rule: Stow
Rule #10It the command of MPM-System is not stowand the state of MPM-System is not stowedand stow-opstat-1 = 0 {becomes active}and stow-opstat-2 = 0 {becomes active}and stow-command-indicator = 1 {becomes active}Then conclude that the command of MPM-System is Stow
Again, the above examples are simplified versions of the rules that are in DESSY. Although they arelogically correct, they may not function well when faced with less than perfect data or if failures occur.The following sections elaborate on how the final rules are evolved.
3.3.3.4 Considering Redundancy in Rule Development
Once the initial state and command rules have been developed, the task of writing real, more robust rulescan be addressed. The above rules work well in an idealistic scenario, but would not hold up under noisydata or under even a minor system anomaly. Section 4.3.2, "Context-Sensitive Bounded PatternRecognition," is particularly relevant to the following discussion.
First note that each rule that references this type of data has two redundant microswitches and opstats.Because of this redundancy, there exists a flexibility in testing for the data change. An or statement,rather than an and statement, can be used for each of these data changes. This allows the system tomonitor state or command changes even if a single piece of data fails or does not respond. This casemay occur due to a single sensor failure, or it may result from bad data. Note that the or is no.._!texclusive;thus either one or both microswitches becoming active causes the condition to be true.
3?

Thus,for example,thestatechangeStowed-->Deploy-in-Transitrule becomesRule #1 iFor each MPMIf the State of the MPM is Stowedand ( stow-microswitch-1 = 0 {becomes inactive}
or stow-microswitch-2 = 0 {becomes inactive} )and the command of MPM-System is deploy {determined from opstats}Then conclude that the state of the MPM is Deploy-in-Transit
The Deploy command rule becomes
Rule #12
If the command of MPM-System is not deployand the state of MPM-System is not deployedand ( deploy-opstat-1 = 0 {becomes active}
or deploy-opstat-2 = 0 {becomes active} )Then conclude that the command of MPM-System is Deploy
If the two redundant pieces of data were the only data available for the rule conclusion, we would likelyrequire both to respond before a conclusion is made. However, since there is other informationsupporting each rule (such as state and current command), one of the redundant data pieces is enough tomake the conclusion.
One additional piece of information can be included in these rules. Because these rules may fire basedon one redundant sensor, the sensor should be checked to make sure it is indeed functional, that is, notpreviously failed. Suspect sensors will have been marked as questionable-on or questionable-off. Thusthe Stow-to-Deploy-in-Transit rule changes as follows.
Rule # 13For each MPMIf the state of the MPM is Stowedand ( ( stow-microswitch-1 = 0 {becomes inactive}
and the status of stow-microswitch-1 is not questionable-off)or (stow-microswitch-2 = 0 {becomes inactive}
and the status of stow-microswitch-2 is not questionable-off) )and the command of MPM-System is deploy {determined from opstats}Then conclude that the state of the MPM is Deploy-in-Transit
Writing rules in this manner allows the expert system to continue monitoring in the event that a singlefailure occurs or a single piece of data lags in its change; however, it also accounts for previous knownsensor failures. Because other data indicates that the system is proceeding in its expected path, the expertsystem follows the new configuration.
3.3.4 Status Monitoring Rules
There are many types of status monitoring rules. The developer should begin status rule development byidentifying failures of which detection is straightforward. Primary categories of status rules have beenidentified in Section 2.3.5, "Failure Space." Examples are provided for each of these areas.
3.3.4.1 Transition Timing
A set of rules will cover transition timing for each transition state in the state diagram. These includenominal transition, off-nominal successful transitions, and failed transitions. Examples for the MPMsystem deploy operation are provided below. Each rule uses a transit-time value which is determined bythe timer. The state change rules in the previous section set the timer to start in rules indicating thebeginning of a transition and to off in rules indicating a transition ending. Details of event timing arediscussed later. For now assume that transit-time is properly set.
38

MPM NominalMotorDeployRule #14Whenever the transit-time of MPM-System receives a valueand when the value of the transit-time of MPM-System > 0 secondsand the value of the transit-time of MPM-System < 36 secondsand the system-state of MPM-System is deployedThen conclude that the deploy-system-status of MPM-System is nominal-deploy
MPM Nominal and Two Phase Motor Deploy
Rule #15Whenever the transit-time of MPM-System receives a valueand when the value of the transit-time of MPM-System >= 36 secondsand the value of the transit-time of MPM-System <= 40 secondsand the system-state of MPM-System is deployedThen conclude that the deploy-system-status of MPM-System is nominal-and-two-phase-motor-deploy
MPM Single Motor Deploy
Rule #16Whenever the transit-time of MPM-System receives a valueand when the value of the transit-time of MPM-System > 40 secondsand the value of the transit-time of MPM-System <= 72 secondsand the system-state of MPM-System is stowedThen conclude that the stow-system-status of MPM-System is single-motor-stow
MPM Deploy Failed
Rule #17tor any mpm Mif the state of M is deploy-in-transitand the system-state of MPM-System is deploy-in-transitand the command of MPM-System is deploy {the motors are on}and (the status of MPM-timer is on and the timer-count of mpm-timer > 72 seconds {note thattransit-time is not set}and deploy-microswitch-1 = 0 {is inactive}and deploy-microswitch-2 = 0 {is inactive}and the deploy-status of M is not failed-due-to-deploy-indicators-failureThen conclude that the deploy-status of M is failed-due-to-deploy-indicators-failure
Note that these timing rules cover the full range of possible time values. The last rule is slightly differentin that the failure is concluded at the individual MPM level rather than at the MPM system level. This isbecause if the failure is due to a pair of deploy microswitches failing to close, the single MPM with theanomaly can be identified. If all MPMs obtain this failure status, the failure is propagated to the MPMsystem with another rule.
3.3.4.2 Data Questionable On/OffuRamifications to the System
The next type of status rules are those that identify individual pieces of data as questionable-on andquestionable-off. These rules may be as simple as detecting a single piece of conflicting data in a set, orthey may be complex and involve a series of events taking place.
The value of these rules is twofold. First the user is made aware of suspect sensors. DESSY flags suspectdata by placing a yellow border around the sensor display. Second, a value of questionable-on/off can beused in other rules to predict off-nominal behavior, prevent a faulty sensor from causing a statemonitoring rule to incorrectly fire, or provide further diagnostics.
39

Rule #18For anystow-msid Sif S = 1 {active}and the value of S as of 1 second ago = 1and the command of MPM-System is deployand the system-state of MPM-System is deploy-in-transitand the value of the system-state of MPM-System as of 2 seconds ago is deploy-in-transitThen conclude that the status of S is questionable-on
Rule #18 flags the failure to lose a stow microswitch when a deploy is initiated. Recall that it takes theloss of only one microswitch to conclude deploy-in-transit for each MPM. Also note that a delay hasbeen added to ensure that the microswitch is stuck on, rather than just slow to change. The rnicroswitch ismarked questionable-on.
Rule #19For any stow-msid Swhenever S receives a valueand when S = 1and the system-state of MPM-System is deployedThen conclude that the status of S is questionable-on
Rule #19 flags a stow microswitch becoming active when the system is in a static state of deployed and nomicroswitch activity is expected. The microswitch is marked questionable-on.
Rule #20For any stow-msid Sif S=0
and the value of S as of 1 second ago = 0and the value of S as of 2 seconds ago = 0and the value of S as of 3 seconds ago = 0and the system-state of MPM-System is stowedand the system-state of MPM-System as of 1 second ago is stowedand the system-state of MPM-System as of 2 seconds ago is stowedand the system-state of MPM-System as of 3 seconds ago is stowedThen conclude that the status of S is questionable-off
Rule #20 flags a stow microswitch becoming inactive when the system is in a static state of stowed and nomicroswitch activity is expected. The delay of 3 seconds is necessary to ensure that the system is indeedstatic and a deploy has not been initiated. Removing the delay would cause the rule to fire,inappropriately, at the beginning of a deploy procedure. The microswitch is marked questionable-off.
Rule #21For any stow-msid Swhenever S receives a valueand when S = 0and the system-state of MPM-System-Port is stowedand the command of MPM-System-Port is noneand the power of MPM-System-Port is unpoweredThen conclude that the status of S is questionable-off
Rule #2 1 flags a stow microswitch becoming inactive when the system is in a static state of stowed and nomicroswitch activity is expected. It does not require a delay because other information is provided toensure that a deploy has not been initiated. The microswitch is marked questionable-off.
The four rules above are examples of how data is marked as questionable-on and questionable-off inDESSY. Other expert systems will have rules which differ from those above; however, these types of rulesshould be written for any data monitoring expert system.
40

3.3.4.3 Failure of Data to Change During an Expected Transition
Throughout the monitoring process, there will be times of expected data change. This often occurs whenthe start of some event has been signaled by command data. When a command is detected (provided it isnot a faulty indication), there is a known set of data that is expected to change. The rule below providesan example of this scenario where commanding initiates a deploy sequence, but the stow indicators arenot lost as expected. In reality, because transitions take time to start, DESSY waits for 4 seconds ofcommanding to give the data time to change before it concludes it has failed to change. Also because thecommand rule caused the timer to initiate, it is reset to zero if the following rule fires.
Rule #22It the state of any mpm M is stowedand the deploy-status of M is not deploy-failed-to-initiateand the command of MPM-System-Port is deployand the value of the command of MPM-System as of 1 second ago is deployand the value of the command of MPM-System as of 2 seconds ago is deployand the value of the command of MPM-System as of 3 seconds ago is deployand the value of the command of MPM-System as of 4 seconds ago is deployand the stow-microswitch-1 of M = 1and the stow-microswitch-2 of M = 1Then conclude that the deploy-status of M is deploy-failed-to-initiateand conclude that the timer-count of repro-timer = 0
3.3.4.4 Multiple Data Values Active, Indicating Conflicting States
Multiple active data that indicate conflicting states is another easily detected anomaly. Although thesedata will be marked questionable-on, and in fact the example shown is a repeat of Rule #19 from section3.3.4.2, it is important to take this alternative view to ensure all conflicting data cases are identified.
Rule #23For any stow-msid Swhenever S receives a valueand when S = 1and the system-state of MPM-System is deployedThen conclude that the status of S is questionable-on
In the above example, because the MPM-System is deployed, a stow microswitch becoming active clearlyindicates conflicting data. Other data conflicts, such as an active deploy microswitch for a stowed MPMstate, should also be identified by expert system rules.
3.3.5 Correction Rules
Correction rules are fundamental to the authors' philosophy of building expert systems. Their veryexistence is based on the premise that the expert system will eventually make a mistake or omission. Thiscould be the result of faulty logic; however, it is more likely due to noisy data or periods where datadrops out. In DESSY, correction rules have been used extensively and have prevented disaster on severaloccasions. Section 4.3.3, "Graceful Recovery," provides another view of this development technique.
Below are several examples of correction rules, each covering a different aspect of DESSY monitoring.The nature of each rule is described.
Rule #24It the system-state of MPM-System is not deployedand the system-state of MPM-System is not stow-in-transitand the system-state of MPM-System is not deploy-in-transitand the state of shld-mpm is deployedand the state of fwd-mpm is deployedand the state of mid-mpm is deployedand the state of aft-mpm is deployedThen conclude that the system-state of MPM-System is deployed
41

Rule #24 corrects the situation in which all individual MPMs have a state of deployed; however, theMPM-System does not have a state of deployed. Although this situation is unlikely, it might occurbecause of a data drop-out or because of a lack of machine performance, i.e., hardware problems.
A side effect of this rule is that it can be used to correctly initialize the expert system upon start-up.When the system is first turned on, the state is unknown. If the data indicates that the MPM is deployed,the individual MPMs will first obtain the state of deployed, and this rule in turn will set the MPM systemto deployed. Rules like this should be written for all known stationary positions.
Rule #25
If the system-state of MPM-System is not deployedand the system-state of MPM-System is not deploy-in-transitand the system-state of MPM-System is not stow-in-transitand (the count of each deploy-msid D such that (D = 1) > 6)Then conclude that the system-state of MPM-System is deployed
Rule #25 is similar to rule #24, but takes a slightly different approach. It sets the MPM system to deploy,but uses the fact that there are more than six (out of a possible eight) deploy microswitches active. It mayalso be used to initialize the system. The rule allows for either (1) one of the four MPMs not beingdeployed, or (2) one or two or the four MPMs having a questionable-off deploy microswitch. Note thatthe rule depends on the expert's knowledge that in these cases the MPM system would still be considereddeployed.
Rule #26It the command of MPM-System is deployand (the deploy-sys-a-contact of MPM-Switch is open and the deploy-sys-b-contact of
MPM-Switch is open )Then conclude that the command of MPM-System is none
Rule #26 removes an MPM deploy command if both deploy-contacts, directly determined by opstattelemetry, are open or inactive. Whether or not the command was expected and/or desired, once theopstat command telemetry becomes inactive, this rule removes the command inference from the expertsystem.
Rule #27For any MPM Mif the state of M is deploy-in-transitand the status of M is deploy-failed-to-initiateThen conclude that the status of M is operational
Rule #27 provides an example of resetting a failure conclusion that is no longer valid. In this scenario,the status of the MPM is deploy-failed-to-initiate; however, the state is deploy-in-transit, invalidating thestatus conclusion. This situation would occur if the deploy had initially failed, but later had successfullystarted. This rule resets the status to operational. The temporary failure can be recorded.
Rule #28For any MSID Mif the status of M is questionable-onand the value of M is inactiveThen conclude that the status of M is functional
Rule #29For any MSID Mif the status of M is questionable-offand the value of M is activeThen conclude that the status of M is functional
Rules #28 and #29 adjust the status of a questionable MSID, once it retums to normal. If an MSID isquestionable-on, but becomes inactive, the questionable-on status is no longer valid. In the same way, ifan MSID is questionable-off and becomes active, the status is updated to functional. Other corrective
42

rulesmayadjusthigherlevelstatusconclusionsbasedon theseMSIDstatusupdates.Theanomaliesarerecorded.
Correctiverulesareanextremelyimportantpartof a real-timeexpertsystembecausetheyprovidethesystema gracefulrecoverymechanismif a faultyconclusionwasmadeor if thefailureobservedwasintermittent.Unlikemonitoringrules,correctionrulesshouldalwaysremainactivesincetheyarevalidunderall circumstances,evenin thefaceof noisydata. Correctiverolesmightbethoughtof astheaxiomsof theexpertsystem.Forfurtherinformationonwritingrulesdealingwithnoisydata,seeLand,1992,andLand,1993.
3.4 Event TimingEveryexpertsystemthatmonitorsreal-timeoperationswill needatimingmechanism.In theDESSYproject,arobusttimerwasdevelopedthatisavailablethroughtheControlCenterLibraryfor ApplicationReuseandExchange(CLARE,1994)andcaneasilybe implementedintootherexpertsystems.Thisguideprovidesanoverviewof timerfunctionalityandaddresseswritingrulesto monitoreventsandprovidetiming-relateddiagnostics.
3.4.1 The DESSY Timer
The DESSY timer has four key controls or commands: it can be started, stopped, reset, and resumed.The functionality of timer is described below. Rules are usually used to send the appropriate commandto the timer.
• Start--Sets the timer to 0 and then starts it
• Stop---Stops the timer at current value
• Reset--Sets the timer to 0
• Resume--Starts the timer without resetting it
The Start and Stop functions represent basic timer functionality. The Reset function allows a timer to bezeroed out, if desired, after its use. The Resume function was developed because on occasion a pauseoccurred in operations, and the paused time was not to be included in the total final time count. Forexample, MPM operations are timed only while MPM motors are running; i.e., the transition is activelyoccurring, rather than allow the clock to continue ticking even if the motors are temporarily stopped.One might also choose to time the entire operation, including pauses, with an additional timer.
The timer definition is provided in figure 17. The state of the timer may be on or off, and the status maybe nominal or timed-out. The timer-count is any integer greater than or equal to zero. The timeout-limitis any integer greater than or equal to one. A set of timer control rules controls most of the timermechanism. Only the command is set by external rules, and only the timeout-limit is preset for a givenoperation.
When the command receives a value of start or resume, the timer control rules change the state to on. Astate of on in turn causes timer-count to begin increments. If the expert system is connected to real-timedata, the timer-count is calculated from the incrementing mission elapsed time (MET) MSID. If theexpert system is not connected to real-time data, the timer count is calculated from the incrementingsystem clock in the computer. For accuracy in timing real-time mission operations, it is advisable tocompute time from the MET (or other downlisted time), rather than the computer's clock, which is subjectto performance problems.
43

TIMER
Notes OK
Name DEMO-TIMER
Command start
State on
Status nominal
Timer-Count 0
Timeout-Limit 32
Figure 17. DESSY timer definition.
As with start and resume, commands of stop or reset cause the timer control rules to change the state, butthis time to off. Timer-count will no longer be incremented and, given that the command was stop,monitoring rules can then access timer-count based on the occurrence of the timer state change.Whenever timer-count exceeds the preset timeout-limit, the timer status is automatically changed totimed-out. This information can then be propagated to diagnostic rules. The full timer implementation,including detailed descriptions and control rules, can be found in the Control Center Library forApplication Reuse and Exchange (CLARE, 1994).
3.4.2 Timing in DESSY
Below are example rules of the DESSY timer used in MPM operations. They include extensions of Rules#2 and #4 found in section 3.3.3.3. Keep in mind that your system and specific implementation mayvary significantly.
Rule #30 sets the timer command to start based on the MPM-System being in-transit. The start-time isalso recorded from OI-MET-TIME. Rule #31 sends a stop command to the timer based on the end ofthe transition. The stop-time is recorded from OI-MET-TIME and the transit-time is recorded from thetimer-count. Of course, transit-time could also be derived from stop-time through start-time; these valuesshould be equal.
Rule #30If the state of MPM-System is Stowedand Shld-MPM is Deploy-in-Transitand Fwd-MPM is Deploy-in-Transitand Mid-MPM is Deploy-in-Transitand Aft-MPM is Deploy-in-TransitThen conclude that the state of MPM-System is Deploy-in-Transitand conclude that the command of MPM-Timer is Startand conclude that the start-time of MPM-System = OI-MET-TIME
Rule #31If the state of MPM-System is Deploy-in-Transitand Shld-MPM is Deployedand Fwd-MPM is Deployedand Mid-MPM is Deployedand Aft-MPM is Deployed
44

Thenconcludethat thestateof MPM-Systemis Deployedandconcludethatthecommandof MPM-Systemis noneandconcludethat thestop-timeof MPM-System= OI-MET-TIMEandconcludethatthetransit-timeof MPM-System= thetimer-count
of MPM-Timerandconcludethatthecommandof MPM-TimerisStop
3.4.3 Timing Issues
Even with the timing mechanism provided, there are still several issues to be resolved for the expertsystem to successfully time events. The logic of timing events for your system should be carefullyanalyzed. Several questions which arose in DESSY event timing are submitted below, along with DESSY'ssolution. Keep in mind that your solutions might be quite different.
• Given a changing data set, do you start/stop the timer at the first piece of data changing, or do youwatch for 2,3 .... pieces?
DESSY usually watches for more than a single piece of data before concluding anything.
• Which type of data should the timer command be based on: opstat (motor) data, command data, ormicroswitch data?
DESSY uses opstat data and command data (when available) to determine command. Then thecommand inference and microswitch data together determine a state change.
• Should the period after the command is given and before position indicators are lost also be timed?
DESSY uses only one timer for each event; however, there are diagnostic rules that detect ifmicroswitches fail to be lost after a command has been given for x seconds. An additional timer forthis purpose would be useful.
• If there is a pause in operations, do you time that? do you include it?
DESSY pauses the timer when there is a pause in operations. If it is desired to time pauses also, anadditional timer could be added.
• If operations stop, and are then reversed, what should the timer indicate?
DESSY had a surprise the first time this behavior was observed/ This may or may not be possible inyour system. Here we record the "forward" time, and then restart the timer. Other non-timer rules areneeded to detect this behavior. This timer behavior should really depend on the system and what theexpert would like to see.
• Are the failure detection (time-out) timers the same objects as the operations timers?
DESSY had only one timer per operation. Sets of diagnostic rules were used, with a rulecorresponding to each status-related time indication. However, an alternative approach would be tocreate a timer with several time-out limits, each relating to a different timing anomaly category.
In conclusion, keep in mind the many factors that must be considered when developing timing rules.Writing event timing rules requires close work with the expert. You will want to ask which data is used bythe expert when manually timing events in the current system. Once this is done, you will have to decidewhich rules (commanding, state transition) contain timer command control, and how detailed thediagnostics should be for event timing. The authors encourage you to investigate CLARE to see the latestinformation about the DESSY timer.
45

3.5 Quick Test Buttons and Displays
Throughout role development, testing should be done. G2 provides several standard button types whichmake simple testing easy. In addition, simulations can be written using G2 procedures. These testprocedures should include both nominal operations and single data point failure operations. Below aresome example test buttons and displays that G2 provides. We focus on how they were used in thedeveloper's interface rather than the end user's interface. Other software development environments willlikely have similar items.
Action Buttons--Useful for the initiation of some action. Sets of action buttons can change the valueof any variable or parameter. They were found to be the fastest method of implementing very simpletests. Action buttons can also be used to launch procedures. The were used extensively in DESSYfor starting the simulation procedures.
Radio Buttons--Useful for toggling variables among specified sets of values. Although not as quickas action buttons, radio buttons provide a very effective way for rapid testing. They are mutuallyexclusive and provide for setting a value upon start-up.
• Check Boxes--Useful for setting true/false values. They are similar to radio buttons, but a singlecheck box acts in an on/off manner to set a value.
Slide Rules--Useful for selecting a value from a range for a variable or parameter. Slide rules alsobehave as display devices in G2, changing value when their associated variable or parameter changesvalue through another source.
Procedures--Particularly useful for creating simulation scenarios. Procedures were used throughoutDESSY development to create test scenarios. They may contain wait statements which providenecessary delays for a scenario, allowing data values to be directly set from the test procedures.
Readout Tables--Useful for displaying a value. They are a very quick mechanism for displaying anyG2 variable or parameter value and provide immediate verification that the values are responding asexpected. Although the look of readout tables can not be modified, they are quite adequate forsupplying the information the developer needs to see.
User-Defined Menu Choices--Very useful for associating a set of menu choices with any displayitem. A primary use of User-Defined Menu Choices in DESSY was to associate menu choices of"active" and "inactive" with each MSID display. Thus, the developer could easily set a data value fortesting purposes at any time during development. In addition, a user-defined menu choice might calla procedure that changes a set of data values or starts a simulation. Although the G2 menu choiceswere slightly difficult to use and could be improved, they were valuable because they made datavalues accessible. Note that G2 does provide the capability to remove this feature from the end user,while preserving it for a developer's further testing.
3.6 Setting Up for Real Time
Setting up the expert system to monitor real-time data is a crucial part of expert system development. Upto this point the system has been self-contained, and testing procedures have been handcrafted to producedesired results. Real-time data (live or recorded) will provide the system with a new plateau of testingpossibilities, and likely a new level of challenges to go with it.
The first step in setting up for real-time data is to identify the data source(s). DESSY originally used theReal Time Data Systems (RTDS) data source; however, this data source has recently been replaced by theInformation Sharing Protocol (ISP) data source. The DESSY team's experiences with setting up for theRTDS data are discussed with a focus on the expert system's behavior towards real time data. See CLAREfor more information about DESSY's data interface.
46

3.6.1 Setting Up the Knowledge Base
The G2 tool provides an interface object and interface code to tie it to real-time data. The DESSY team
was fortunate to obtain both RTDS and ISP data interface objects from their respective organizationsrather than having to develop one. Creating the real-time interface can be a difficult task. When possible,developers should obtain a predeveloped interface and avoid writing (and likely duplicating) this code.A data interface should be a standard element in any real-time expert system library. For purposes ofstandardization and time savings, it should be developed only once, by a team that thoroughlyunderstands the data source.
In addition to setting up the data interface, the individual sensors (i.e., MSIDs) in your knowledge basemust be configured to use real-time data. Each instance of a sensor object must have its table filled inappropriately. This includes the MSID identification number, the telemetry server's name, and otherinformation about that sensor. Again, the DESSY team obtained the sensor object template from theauthors of RTDS. Figure 18 shows a sensor (MSID) object. See CLARE to find information on the latestMSID definitions for the currently used real-time data interface.
SHLD-MPM-STOW-MICROSWITCH-1
OptionsNotes
Name
Data typeInitial value
Last recorded value
History keeping spec
Validity intervalData server
Default update intervalGsi interface name
Gsi variable status
CategoryParam name
Param type
Sample numberCvt type
Status
Flicker
Microswitch value
do forward chain, breadth first backward chain
OK
SHLD-MPM-STOW-MICROSWITCH- 1,
quantitynone0
keep history w/max age of data pts = 5 secindefinite
telemetry-server13 weeks
rtds-data-server
0
msid
v54x0820ecal
1
none
functional
false
open
Figure 18. An MSID sensor object.
The final component in setting up the expert system to use real-time data is to obtain the data sourceitself. This involves identifying the data source, verifying that the data stream is available to yourmachine, and understanding how to connect to and control the real-time test data. The three sources ofreal-time data the DESSY project used were live mission data, live Shuttle Mission Simulator (SMS) data,and recorded data from either of these sources. Although mission and simulation data are valuablebecause of their surprise element, prerecorded playback data is the most useful because many failures canbe recorded on a single tape (file) and these failures can be played back at will as the system is correctedand refined. Section 6, "Testing the System," will provide an explanation on testing with each of thesedata sources.
47

Once the knowledge base and data source are ready, the real-time data testing can began. Setting up thereal-time data source is not a trivial task, and you should get help from the data host organization or fromother available help organizations. Details on setting up the data source are beyond the scope of thisguide. The advice to developers is to get help from someone who is experienced in this area. Reuse ofother developers' codes and knowledge will save your development team valuable resources.
3.6.2 Using Real-Time Data
Once the real-time data source and sensor objects have been set up and the data connection has beenestablished, real-time testing can begin. During this stage of project development, many unknowns willlikely surface and the iterative nature of application development will become apparent. Rules whichperformed ideally given ideal data scenarios may now malfunction due to the inpreciseness of real data.Be prepared for design changes during this step. It is likely you will have to retrace many of the steps insection 3, and you may even need to revise your understanding of the system and consult section 2again. However, following the development steps outlined in these sections should minimize knowledgebase changes.
As you begin using real-time data, keep in mind that Section 6, "Testing the System," provides insightinto the testing process. As with any type of testing, nominal cases should be checked first to verify thesystem's basic functionality, and then more complex cases, i.e., failure cases, can be addressed. It mayturn out that even in nominal cases the behavior of the data is not ideal. You will need to make sure yoursystem is robust enough to handle the normal data discrepancies that occur in the operations it monitors.
3.7 Setting Up for End Users
Setting up for end users involves providing the finishing touches that will allow someone unfamiliar withthe expert system to readily use it. This includes instructions on starting up and shutting down thesystem. If you are using Motif, you will likely want to allow users to launch the system from a Menurather than having them use a command line prompt. You will need to make sure the users' path hasbeen correctly set for both the G2 (or other) applications and for your expert system and make sure thedisplay variables are correctly set (assuming you are working in a Unix environment). This may involvechanging the environment on the users' workstation. Since the workstation will likely be running otherapplications as well, coordination with other workstation users is necessary.
To help users feel comfortable with the system, a basic instruction sheet should be provided with anoverview of software use. For DESSY color cue cards were created for the MPM/MRL and end effector
systems. A black and white copy of these cue cards is provided in Appendix B of this guide. This typeof overview sheet is common for software applications, and has been useful for DESSY users.
In addition to the cue card, a DESSY tutorial was written in G2 "on top of" the DESSY system. Thetutorial provides detailed explanations of each item on the DESSY screen. The tutorial is discussed insection 7. It is an important part of preparing the end users to work with the expert system.
In conclusion, the most important element in setting up for end users is to ensure that it is as simple aspossible for users to understand and use your system. Many (possibly most) users do not havesignificant software experience and may in fact be uncomfortable with software. You must encouragethem to use the system by making it not only a beneficial, but also a simple task.
48

Section 4
Working with Real-Time Data
A major challenge for intelligent monitoring systems is to handle real-time data robustly. Section 4addresses problems in and solutions to handling data that is often unpredictable and unreliable. Theprincipal real-time telemetry data problems that are encountered in the space operations domain include(1) missing data, (2) erratic or noisy data and (3) data lags and irregularities during state transitions,commanding, and other operational events. A combination of methods evolved throughout DESSYdevelopment that address these areas include rule disabling, use of context and expectations to makeassessments that tolerate some bad data, and graceful recovery through system correction when reliabledata returns.
When working with real-time data, one must expect the unexpected in data problems. In spite of filteringand other techniques to keep bad data out of the system, some will always get through. When it does, theonly choice is to design for recovery when things return to normal. Real-time data monitoring systemsthat reside in high-risk environments, such as NASA's Mission Control Center, must be built to be robustenough to handle bad and missing data. Although the specifics of these techniques will differ from oneproject to another, the guidelines presented here provide a good set of ground rules from which a robustsystem can be built for real-time monitoring.
Section 4.1 covers "Related Work," which gives other approaches to addressing the real-time datachallenges. References are provided. Section 4.2, "Types of Data Problems," explains the cause andeffects of each of the data problems. Section 4.3, "Data Handling Methods," elaborates on the techniquesused in DESSY to build a robust system that could withstand these data problems. Examples of rules andtechniques used in DESSY are provided throughout.
4.1 Related Work
Conventional approaches such as data filtering or data validation may be used to deal with someunreliable data, but they are often insufficient to eliminate all bad data, and can even introduce dataproblems. Even if it were possible to filter out the bad data, the use of unfiltered data is desirable becauseit gives the human monitor a better understanding of the telemetry. Human experts routinely toleratesignificant amounts of bad data in monitoring and diagnosis, whether or not it has been preprocessed inthese standard ways.
Statistical approaches to data problems in diagnostic systems (Cooper, 1990, Paasch and Agogino, 1992,and Wellman, 1990) use sampling and statistical testing techniques or probability estimates. Samplingand testing approaches, which are forms of preprocessing, may require sample sizes or sensorredundancies that are not available. Additionally, such approaches are somewhat unreliable and cannoteliminate all data problems. Probability estimation approaches suffer from tractability problems in caseswhere the possible failure space is high, and certainty estimates may be difficult to obtain from thedomain expert. Statistical approaches have proven to be useful in cases that can accommodate theirlimitations; however, they remain incomplete because they do not provide for recovery from wrongconclusions.
Another approach to problem data is to concentrate on diagnosing sensor failures (Scarl, 1987). Once asensor failure is diagnosed, the faulty data can be eliminated until the sensor is fixed. This approachrequires sensor redundancy or testing to identify the failures, and shifts the focus from operationsmonitoring to sensor diagnosis. DESSY does include a limited amount of faulty sensor identification;however, the majority of the data problems in telemetry monitoring systems are not due to sensor failures,but are temporary data noise. Unlike sensor failures, these data problems are both transient and expected(Shontz, et. al, 1992). While sensor diagnosis may be prudent and useful, it does not address thetelemetry data problems.
A knowledge-based approach to dealing with bad data is to rely on diagnostic expectations and thepreponderance of the data (Chandrasekaran and Punch, 1987). DESSY uses such an approach, basingconclusions on operational context and expected data patterns. Such an approach provides graceful
49

degradationin thefaceof baddata(Hayes-Roth,et al, 1983), permitting reasonable interim assessmentswhile eliminating most false conclusions. However, since bad data will inevitably enter the system, arecovery approach is needed. Recovery should be more graceful than a system restart. A system shouldbe able to recover by incrementally reinterpreting data as it is gathered (DeCoste, 1991). DESSY uses atechnique its developers have deemed graceful recovery. New data is reevaluated as it enters the system,and adjustments are made to expert system conclusions based on that data.
The data handling techniques implemented in DESSY have repeatedly proven effective in maintainingrobust expert system operation while tolerating bad data. Disabling rules when data is unreliable mirrorsthe human process of ignoring bad data. The pattern recognition approach, similar to that presented byChandrasekaran and Punch (1987), allows tolerance in conclusions by considering context andexpectations and by marking data as questionable if discrepancies occur. The DESSY approach differsfrom Chandrasekaran; however, in that if the expert system makes a mistake based on bad data, a gracefulrecovery mechanism is used. Although each of the techniques presented has merit by itself, it is theircombination that most reflects the human monitoring process leading to a system with a human-like levelof tolerance to data problems.
4.2 Types of Data Problems
The DESSY approach to dealing with unreliable telemetry data is distinctive because of its objective ofachieving human-like tolerance to bad data. Data problems such as loss of data, erratic or noisy data, anddata lags and irregularities are tolerated by monitoring data quality, using diagnostic expectations, andcorrecting wrong conclusions when good data returns. The following sections explain each type of dataproblem. Section 4.3 provides their DESSY solutions.
4.2.1 Loss of Data
The most common and well understood data problem is a loss of data. Data loss usually takes the formof a complete loss of signal (LOS) and may be either unexpected or expected, i.e., when the Shuttleenters the Zone of Exclusion (ZOE) where there is no telemetry downlink. Unexpected data loss mayoccur as a complete or partial loss of data, usually due to ground processing or computer hardwareproblems.
Although LOS seems like a simple phenomenon to account for, hardware implementation of telemetryprocessors can complicate the situation. Depending upon how a particular telemetry processor handlesperiods of LOS, the monitoring system may receive an inactive state for all data values, no data values atall, or a static flame of the last data values. In the case of the DESSY data source, the Real-Time DataSystems (RTDS), the last 4-5 seconds of data is repeatedly replayed until the signal returns. Yet anotherpossibility is that nonsense data is received during periods of LOS. The first step in dealing with loss ofdata due to signal loss is to find out the form of data that will be received during this time.
The DESSY data source provided a data quality measurement from the telemetry processor from whichLOS could be concluded. OI-Quality indicates the telemetry processor's assessment of data quality foreach data frame. However, OI-Quality does not always reliably reflect true data quality. There is often alag between the data quality drop and OI-Quality's reflection of this drop. Even when the lag does notappear, the low quality indication often occurs in the same data frame that includes bad or missing data,making it impossible to filter the data or to alert the system of its presence. Inevitably, bad data due to anLOS periodically enters the system. Methods such as rule disabling and graceful recovery address thisproblem.
4.2.2 Erratic Data
Erratic data is unstable and does not meet expected behavior for a given operational context. Erratic datamay occur at any time, but is most likely to be seen immediately before or after LOS or at the time ofstate transitions. Erratic data is characterized by frequent flipping of bits On the binary case) in aparticular data set. Bit flipping occurs when a data value toggles or flips between values of 0 and 1. Thissignature may also result from intermittent sensor failures, and that possibility should not be ruled out.For large sets of data, however, it is more likely that any bit flipping is due to bad telemetry data ratherthan bad sensors.
50

ForDESSY,periodssurroundinganexpectedLOSarea commontimefor erraticdatato appear.As theSpaceShuttlemovesin or outof asatellite'srange,thetelemetrylink hasaperiodof degradation,duringwhich the OI-Quality has not yet dropped. The result is often a significant amount of bad data enteringDESSY. Because there has been no previous low quality indication, DESSY has no indication of thedegraded data. The second situation in which erratic data often occurs is near the beginning and end of astate transition. This type of erratic data is discussed in the next section. Context-sensitive boundedpattern recognition and graceful recovery can be used to deal with both types of problems.
4.2.3 Data Lags and Irregularities During Operational Events
The final type of data problem results from unexpected data activity when data is expected to changebecause of an operational event such as a state transition or commanding. Data that is expected tochange may flicker or lag before reaching a new stable state. Given a set of data that is expected tochange at transition time T, subsets may flicker or lag, causing the data transition to occur over somedelta time t. Typically delta t is 1 to 3 seconds. Figure 19 depicts five examples of data transitions fromlow to high values, including a normal data transition and four anomalous cases. The delta time for thisdata set, 2 seconds, is the time it took for every piece of data in the set to change to its new expectedvalue.
nominaltransition
1 sec delay
2 sec delay
1 sec flicker
1 see flicker
3t = 2 secEvent Start I
-2 -1 0 1 2 3
I
D1
D2
D3
D4
D5
4
Figure 19. Examples of data lags and irregularities.
Data lags and irregularities during operational events may be caused by telemetry noise or by thephysical properties of the hardware being monitored. In either case, there is no smooth transition.Failing to include this behavior in the system's monitoring rules will often lead to erroneous conclusions.
4.3 Data Handling Methods
Now that the types of data problems experienced by real-time monitoring systems have been explained,the focus will turn to solving those problems. Table 3 lists the data problems with their applicablesolutions from the DESSY approach. Each method works independently to prevent or correct erroneousexpert system conclusions resulting from bad or missing data, but it is their combination that ensures arobust program capable of lengthy periods of uninterrupted use in operations. The techniques arediscussed in the following sections.
51

Table 3. Data Problems and Solutions
Data Problem Solution Methods
loss of data rule disabling, graceful recovery
erratic data pattern recognition, graceful recovery
data lags and irregularities during pattern recognition, graceful recoveryoperational events
4.3.1 Rule Disabling
The most straightforward method of dealing with data of uncertain quality is to ignore it by notresponding to changes in that data. In any system there will be 0rues when data quality is so low that thedata should not be used at all. The intelligent system should have the capability to ignore data when it isunreliable, by a method such as disabling rule sets. Modularity within the software (see section 3.1,
• "Organization of the Knowledge Base") separates rules for data monitoring, state transition detection,• : failure diagnosis, expert system control, and user interface. This partitioning allows the enabling or
disabling of appropriate groups of rules when necessary. Certain diagnostic and state transition rule setsare disabled in DESSY when the value of OI-Quality is any number other than 100. When qualityreturns, the rules are again enabled.
Although this tactic seems simple enough, the quality indicator and its corresponding data are in the sametime frame, making immediate disabling impossible. Also, as the Shuttle enters or leaves the ZOE, thetelemetry link deteriorates, making OI-QuaUty itself unreliable at that time. However, even thougherroneous data may have already entered the system, it is still desirable to disable rules to minimizefurther faulty conclusions.
Disabling rules is the simplest of the techniques used in dealing with real-time data problems.Unfortunately, it effectively eliminates the usefulness of the expert system during the time the rules aredisabled, retaining only its function as a raw data monitoring source. For this reason, the technique isonly used when absolutely necessary--when it is certain that quality is low and data is unreliable.
To supplement automatic rule disabling, the DESSY user may also turn off the expert system portion ofDESSY at any time, leaving DESSY to act as only a data monitor. Actually, this turning off merely graysout the parts of the DESSY display that present expert system conclusions, allowing DESSY to continueto work in the background. Section 5.6.3, "Control of the Expert System," elaborates on this concept.Even if DESSY has made incorrect conclusions and the user has grayed out the expert system part of theDESSY screen, the built in self-corrective rules should eventually lead to recovery. The intent is that evenif DESSY has been turned off due to erroneous expert system conclusions, it will recover by itself, andthe user will once again be able to use the expert system part of DESSY. Nonetheless, this feature givesthe user the opportunity to override the expert system at the level of the user interface (Malin andSchreckenghost, 1991).
4.3.2 Context-Sensitive Bounded Pattern Recognition
The second technique implemented to ensure DESSY's robustness deals with characteristics of the sets ofdata that DESSY uses to detect events and identify failures. Because of problems with data lags andirregularities, the expert system often has insufficient or even erroneous evidence from the data set uponwhich it can determine the occurrence of an event. Also, because of the nature of space operations, thereis often an insufficient amount of sensor data available, making event determination even more difficult.
52

For example,if theeventis anMPMstow,thereareonly two sensors to indicate the stowed state once theMPM has reached its new stowed position. This data set is insufficient to determine the stowed state.DESSY requires that all rules except recovery rules tolerate a single data failure in any set of dataconsidered. If one of these two pieces of data was active and the other inactive due to a data problem, thestate would be inconclusive. The data must therefore be supplemented with additional information.
When appropriate, context such as the system state or the detection of a prior event is included. Whencontext is considered in a rule, a context variable (CV) is used. Context variables are simply knownpieces of relevant information. They may be a combination of data and/or information and may beeither G2 variables or parameters. Use of CVs supplements the data set, and some rules use only CVs.Table 4 gives an example of a DESSY rule using two pieces of data and two CVs. CV use also simplifiedthe verification process.
Table 4. Rule With Two Pieces of Data and Two Context Variables
DESSY Rule: state transition
If the state of any MPM is stow-in-transit
and (the sysl-stow-microswitch = 1
or the sys2-stow-microswitch =1)
and the command of MPM-SYSTEM is stow
then conclude that the state of the MPM is stowed
Data/CV set
CV
data
data
CV
conclusion
Following are the general guidelines developed in determining necessary data sets and context variablesfor DESSY rules. The lower limit or minimum requirements needed to make reliable conclusions isaddressed, followed by a brief discussion on the upper limit or maximum data set recommended.Establishment of a lower limit is necessary because enough data must be observed to correctly monitor anevent, given that some predetermined amount or percentage of the data set being considered is bad. Anupper limit is established because of the impact the data set size has on computer hardware performance.An example from DESSY is provided.
4.3.2.1 The Lower Limit
Given an operational event, there exists a set of data S that the intelligent system directly monitors todetermine when the event occurs. In addition, there exists a second, usually larger, set S', a superset of S,that makes up the context in which the event will occur. Figure 20 depicts this concept. The set S'indicates state, status, and any other operational context of the system being monitored and includes bothdata and CVs. Humans may verbally testify to monitoring S when watching for an event to occur, but inreality it is the entire context set, S', that the human observes. DESSY attempts this behavior.
Figure 20. Sets of immediate data and additional context.
53

TheCVsfromS' in theexampleof Table 4, which concludes an MPM stow operation, are the currentMPM state and MPM command. Thus we have the following sets.
Sstowed = {sysl-stow-microswitch, sys2-stow-microswitch}
S'stowed = {sys 1-stow-microswitch, sys2-stow-microswitch,
current state, command}
The resulting concept is shown in figure 21.
Figure 21. Example of S and S' for immediate data and additional context.
If the set S were the only data considered, a constraint that both data elements be active would need to beimposed to eliminate ambiguity and ensure a stowed state had been reached; however, this does not meetDESSY's requirement to continue to monitor given a single failure. Because context is considered in theextended set S', the constraints to require only one of the two rnicroswitches to be active in determiningthe stowed state can be relaxed. Because the set size of two for S is insufficient for determining the eventgiven DESSY's requirements, S' offers a more plausible solution.
Even in the case where three pieces of telemetry are available, the data is probably insufficient. Althoughin actual operations, a double hardware failure must occur to lose two of the three sensors, in a situationwith noisy data, it is possible that two of these three may erroneously become turned on. In this case, alarger data set including CVs is desirable. CVs such as state and command in the example above can beused to obtain the minimum information set by imposing physical constraints or providing the currentsystem configuration. CVs limit the scope of a rule, and thus limit the chance that it will fire incorrectlygiven it has received bad data.
4.3.2.2 The Upper Limit
In real-time operations, every piece of data observed has an associated performance cost. Thus there arelimits on the amount of data DESSY is allowed to inspect in most rules. The best way to implement this isthrough context variables which hold summaries of data values and are usually already stored in DESSYfor other purposes. Use of CVs provides constraints limiting the size of inspected data sets. DESSY usesthe upper bound per rule of four pieces of telemetry data or two to three pieces of data given a CV. Thereal-time expert system should usually not be overloaded with a larger set, although there will beexceptions in safety critical or unreliable areas.
4.3.3 Graceful Recovery
Although some expert systems attempt graceful degradation in the face of trouble, DESSY has extendedthis concept to one of graceful recovery. If the system makes faulty conclusions because of bad data, aset of corrective rules act to restore the expert system once good data returns. This includes correction ofindividual data, state, and status. The system does not have to be restarted by the user because thecorrections automatically restore offending parts of the knowledge base.
Corrective rules are similar to other system monitoring rules, except that they do not allow for anyinconsistencies in the data sets they observe when making conclusions; i.e., every piece of data in the setmust be exactly correct. Additionally, corrective rules are written only for the cases that it can be
54

determinedwithcertaintythatthesystemis in aparticularconfiguration.Theserules,therefore,canbethoughtof astheaxiomsof theexpertsystem.Theycanbeassimpleasdeterminingthatasinglepieceof datais reliableagainbecauseit returnedto alegitimatevalueafterit hadpreviouslybeendeemedunreliable.A more sophisticated example is the reevaluation of system state when all microswitch data
for a new state becomes active.
Examples of corrective rules are shown below. The first example shows the reevaluation of the status of asingle microswitch. If the microswitch status is questionable-on because the microswitch isinappropriately active, and then the microswitch value returns to inactive (0), the status is set to functional.The second example reevaluates the state of MPMs. If the state is not stowed, but both stow microswitchindicators become active (1), then the MPM state is set to stowed. Section 3.3.5, "Correction Rules," givesdetailed instructions on the construction of corrective rules and provides further examples.
Corrective Rule: Microswitch Status
If the status of sysl-stow-microswitch is questionable-onand the sysl-stow-microswitch = 0then conclude that the status of sysl-stow-microswitch is functional
Corrective Rule: MPM State
If the state of any MPM is not stowedand the sysl-stow-microswitch = 1and the sys2-stow-microswitch = 1then conclude that the state of the MPM is stowed
These correction features have not only been useful, but also have good side effects. Complementing thecorrection rules, initialization rules allow DESSY to be started during any stable MPM/MRL configurationand to be initialized to the proper states and statuses. The MPM state rule shown would initialize MPMstate to stowed if DESSY were started with the MPM in the stowed position. If DESSY is started duringtransition periods, once the transition is complete, DESSY can initialize itself. This has been an importantand even necessary DESSY feature.
55

Section 5
Evolving the System through the User Interface
The user interface is the window into the monitoring application and is therefore a crucial part of theoverall system design. It is separate from, yet intricately linked to, the expert system, and should berecognized as one of the many components that make up the complete system. Like the expert systempart of the application, the user interface is developed iteratively. This section presents some guidelinesfor creating this vital application component, starting with "Understanding the User Interface" and"Preliminary User Interface Design" (sections 5.1 and 5.2). It then discusses "Evolution of the UserInterface" (section 5.3), and provides an application display example in section 5.4, "The DESSY User
Interface." Section 5.5 discusses User Input and Control," or how the user interacts with the intelligentsystem during operations. Section 5.6, "Expert System Management.," covers management of dataproblems and problems with the expert system itself. Finally, section 5.7, "Developer's Interface,"addresses those displays which assist the developer throughout the life of the system. (After all, as adeveloper of these systems, you are a software user too.)
5.1 Understanding the User Interface
Because the user interface is such an important aspect of the monitoring application, its design should becarefully thought out before development begins. The user interface is more than just a screen. Earlyuser interface design will help drive expert system requirements. The following sections explain therelationship of the user interface to the expert system and define the parts of the interface that establishthis relationship.
5.1.1 The Window into the Expert System
Graphics provide an excellent communication medium, and the user and developer may find this aneffective means for gaining a mutual understanding of both the operations being monitored and theexpert system. The DESSY project started with a storyboard which included the preliminary userinterface and information on the functionality of each interface item. This storyboard served as a basisfor initial interface development and expert system design. Storyboards are discussed in section 2.3.4.
The design of the user interface, like the design of the knowledge base, is iterative and interactive.Significant changes in the user interface may mean new or revised expert system rules. At each step inthe process, allowing the user to interact with the interface, and thus the intelligence behind it, willexpedite the development process by exposing problems or confirming good ideas. Because the userinterface acts as the window into the system, it is useful not only for identifying user interface issues, butfor disclosing problems hidden in the expert system as well.
In addition to the user interface window, which is designed for the end user, the developer's interface canfunction in a parallel manner for the developer. A common mistake in user interface design is assumingthat the user needs access to all displays the developer can access. The developer should construct aninterface, not necessarily available to the user, to allow interaction with the expert system from adeveloper's perspective. This concept is discussed in section 5.6.
5.1.2 Layers of the Interface
The user interface of any software application can be broken down into several layers corresponding tosteps in its design. The highest level layer is the information content of the displays. This includes data,state, and status information to be displayed, as well as any other information relative to the monitoredsystem. This level of display definition is purely abstract and does not include graphics or behaviordefinitions.
Once the appropriate information to be included in the interface has been identified, the display elements'appearance and behavior can be established. Icon descriptions such as graphics, color, and size can bedefined for each item of information, and the behavior regulating the icons can be determined. Behavior
includes actions such as color changes and icon changes (e.g., the DESSY end effector snare icon depicts
56

thesnaresin openandclosedpositions).Togethertheappearanceandbehaviormakeup thecompletedisplaydefinitionfor eachinformationalitem,themiddleinterfacelayer.
Finally,thelayerof overallscreendesign can be established by creating a display layout that makeseffective use of individual display items. Almost always, screen "real estate" is an issue; i.e., there will beonly a limited amount of screen space available for the interface. This will likely be a major factor in theinterface design, and it may drive a redesign of individual display elements. Pop-ups, temporary displaywindows related to particular screen elements, are a useful mechanism to include relevant, but lessimportant information in the user interface. Pop-ups lead to navigational issues such as how and where topop up, minimizing the distraction from more important screen information.
The three user interface layers described above will be implemented in steps, but as with other expertsystem development will be iterative, with each step influencing the outcome of the other two.Distinguishing among these activities, however, will help lay the foundation for a useful and reliableexpert system user interface.
5.1.3 Elements of the Interface
In addition to identifying the layers that are involved in user interface design, it is helpful to understandthe types of elements present. The four categories of interface displays used in DESSY are text, icons,graphs and plots, and navigational items. Each is discussed briefly below.
Text displays contain ASCII characters and are found primarily as messages or description boxes.Messages are useful for logging events, particularly if they require a time stamp or should be recorded inan event log. Messages are also useful in alerting or warning the user of the occurrence of an event.Description boxes are used to display the current value in a set of changing information. This includesparameters such as state (snares are open, closed, opening, closing...), status (snares are nominal, failed-to-closed...), and time. Both types of text displays can be color-coded and recorded in a file.
Icons are a second type of display item. Icons may be graphical or symbolic. Graphical icons maycontain complex drawings and include motion and color schemes. They have the advantage of moreaccurately reflecting a graphical view of some subsystem part. Symbolic icons are simple geometricshapes, usually having a color to indicate state or status. They are useful because they simplify screendesign, and may be easier for humans to monitor. It may not be possible to say precisely whether anicon is graphical or symbolic; rather it may fall somewhere in the middle of this spectrum. The questionof which type of icon is better remains unresolved. It will likely depend on the situation, and a mix oficon types may be the most appropriate.
Graphs and plots are common displays that show trending. Although they are very useful, they requiresignificant screen space and may be most appropriate as pop-ups. DESSY does not currently containgraphs or plots; however, this is clue more to limitations of the G2 environment than to their usefulness.There are, however, several applications for these items within the operations community. See theCLARE library to locate these applications.
The final type of display item is the navigational item. Although these displays do not show data, theyare an important part of the user interface. The most obvious navigational item is the button. Buttonscan bnng up or hide additional displays, or give the user control over some expert system feature. Inaddition to buttons, pull-down menus are very effective in allowing the user to navigate though the expertsystem. In G2, any display item can have a menu associated with it. Examples of menu use in DESSYinclude going to pop-up displays and resetting the status of an MSID. Both buttons and menus werefound to be very effective in DESSY, not only in the user interface, but in the developer interface as well.
5.2 Preliminary User Interface Design
Before developing the user interface, one must understand the existing displays of the users. This sectionprovides help in understanding these displays and in tying the displays you design to them. Also coveredis help on getting started in gathering the information elements.
57

5.2.1 Getting Started
For the expert system display to be accepted by end users and have a good chance for success, it shoulddirectly relate to existing displays. For this to happen, the developer must study the existing displays andtheir use and determine positive characteristics. The connection of the expert system display to existingdisplays might be as simple as having the data arranged the same way or on the same area of the screen.Although the design should be driven by existing display(s), one should be wary of jeopardizing animproved display design. Some design compromises may be beneficial in the short run, but the end goalof improved displays should remain in sight. As the system evolves, additional improvements can occur.
Once you have an understanding of the existing displays, you are ready to begin display development.Because of the nature of operational prototyping, it is important to begin development soon in the designprocess, providing the flexibility to change as the design matures and more information becomesavailable. As you construct the initial display, remember to capture all information in current display(s)that the system will monitor. Because the expert system will perform the human task of monitoring, it isimportant to provide the flight controller with all data with which the system makes conclusions. This willallow the controller to verify the expert system's decisions, and the confidence level in the system canevolve.
5.2.2 Gathering Information Elements
There are several standard items which seem appropriate for real-time monitoring systems. Items fromthe DESSY display which might also be suitable for other expert systems are presented. Figure 22 showsthe original (but not final) MPM/MRL DESSY display. Compare this information to that of figure 23,the existing RMS console display. This DESSY display contained most of the MPM/MRL data that
existed in the console display, along with its expert-system-supplied information. The original displayconcepts served well in providing the ability to understand the operations; however, changes were madeas the system evolved.
Although the original DESSY display design was only preliminary, it helped significantly in identifyingnecessary display elements and display layout. Basic information identified for the expert system displayis listed below. Also given are the types of display element used to represent information.
• Raw telemetry data- simple displays show active/inactive state
• Telemetry "comps"- simple displays represent two or more pieces of data- data items have been combined by and or or to represent a single value
• System state and status- text boxes give concise message- icons depict real objects when feasible- pop-ups lead to more detailed information- color coding indicates problems
• Timing- timers are located in appropriate screen area
• Event recording- message log stores and records events
• Generic mission information
- header or panel display includes GMT/MET
For each information type, the display elements must be identified, defined, and assembled into the initialdisplay design. As the preliminary design is created, you will be constructing a storyboard that will helplay the foundation of both the display and intelligence of the expert system. Section 2.3.4 discussescreating a storyboard, the key element in tying the support operations to the user interface display. Oncethe initial storyboard is in place, you can begin its evolution into the application software.
58

IMT 01:12:03"1 VEHICLE OVll
EVENT SUMMARY
103:09:13:00 RULES The Port MRL has failed to release.
103:09:12:42 RULES The Port MRL Release commanded.
103:09:13:0o RULES The Po_ MRL has failed to relee.¢_.
103:O9:12:42 RULES The Pod MRL Relsase ¢orrt,rnanded
103:09:11:36 COMPS DAP in free driP.
103:09:10:20 RULES The MPM has deployed successfully
103:09:09:06 RULES MPM DEPLOY commanded.
MPM/MRL MESSAGE,_
i 103:09:12:42 RULES MRL Mid Release commanded
103:09:13:00 RULES The Pod MRL has failed to release.
103:O9:12:50 RULES MRL Forward Release achieved.
Elal:_ed lirne 8 sec.103:09:12:50 RULES MRL Aft Release achieved.
Elapsed ta_e 8 Me.
103:09:12:44 RULES MRL Forward in lransit
103:09:12:44 RULES MRL Aft in transit
103:O9:12:42 RULES The Pod MRL release commanded
10_:o9:12:42 RULES MRL Fo,rwatd Release commanded.
Figure 22. The original DESSY display design for the MPM/MRL system.
5.3 Evolution of the User Interface
Throughout expert system development, the user interface will evolve to meet design requirements.assist you in this development, the following sections are provided with suggestions and guidelines.
To
5.3.1 Designing for Change
Developers can promote user interface evolution by designing for change in two major areas. First, aseparation of the user interface from the expert system will simplify design changes. Second, a well-structured display class hierarchy, like the expert system's class hierarchy, will lead to flexibility andencourage reuse of displays. In addition to taking these initial design steps, the developer should remainopen to potential change. The purpose of early design and prototyping is to better understand thesystem and learn what changes need to be made.
In DESSY separate display classes were developed with sets of rules to control their object instances.Changes in these classes and rules did not effect the expert system logic. This design provides the optionof using an alternative interface environment if the need arises. Even if G2 (or some other developmenttool) has been chosen to construct the user interface, it is possible that another interface tool mayeventually take its place because of performance or flexibility, or even for political reasons. In any case,separation of the interface from the expert system should make the software more readable andmaintainable.
Display class hierarchy is as important in the structure of displays as is the class hierarchy of the expertsystem. A strong display class structure will allow reasoning over appropriate sets of display items andwill promote reuse. The hierarchy will evolve as the user interface evolves and will contribute to thedevelopment process. For a detailed discussion of class hierarchy of the expert system and its benefits,see section 3.2.3.
59

4 5F/V 48/lO3
OGMT 266:19:21:54 O MET 1:23:20:54 SITETDR 01179 GN22 S M24 B F8RGMT266:I9:21:54 U/D R ATE I
AC AMPS
SHL SR. MID 1. AFT 2 AC1
MPM 2. FWD 1, MID 2 AC2
MPM l, FWD 2, AFT ] AC3
7 DAY 2 1 1RMS MPM/MRL/JETTISON RR3592 CH096
OPER
STAT
213
4
5
67
8
MR) MOTOR CONTROL ASSEMBLIES
I 2 3 4
PL SEL 2 RETEN LOGIN SYS I OFF
PWR SYS 2 OFF
D
D
D
D
LAT 1 [..AT 2 LAT 3 LAT 4 LAT 5PL SEL A B A B A B A B A B
1 tAT 0 0 0 0 0 0 0 0 0 0P.DY 0 0 0 0 0 0 0 0 0 0
REL 0 0 0 0 0 0 0 0 0 0
2 LAT 0 0 0 0 () 0 0 0 0 0
RDY 0 0 0 0 0 0 0 0 0 0
P.EL 0 0 0 0 0 0 0 0i 0 0
3 LAT 0 0 0 0 0 O 0 0 0 0RDY 0 01 0 0 0 0 0 0 0 0
REL 0 0 0 0 0 0 0 0 0 0
CRT SCRATCH PAD
CRT 1 GNC 201 l
RESU ME
CRT 2 GNC 2210CRT 3 GNC OS
CRT 4 SM 2 200
SHOULDER BRACE
RELEASE PL BAY MECH PWR SYS ] 0
0 IND SYS 2 0
SHL FW'D MID AFT
AC BUS 0 0 0 0 0 0 0 0ENABLE 0 0 0 0 0 0 0 0
MPM STOW 1 0 0 0 0 0 0 0
0 DPLY I l 1 1 1 1 1 1
MRL [..AT 0 0 0 0 0 0
0 RDY 0 0 0 0 0 0
REL ! I 1 1 1 1
GUIL SYS A D D D
0 SYS B D D D
JETT SYS A D D D
0 SYS B D D D
RMS TEMPS HTR SYS A: ONS Y SP EP WP W Y WR EE
LED 5 9 59 5 9 5 6 5 6 5 6 56
ABE 59 59 5 6 5 6 59
S ILL TEMPS
D D D
fA fB fC
4.40 3.76 2.56
4.24 4.24 3.12
2.72 3.36 3.92
Figure 23. Existing RMS console displays.
5.3.2 Guiding the Evolution
The process of operational prototyping is evolving a software design to its final state. For this evolutionto be successful, close cooperation must exist between the developer and user. The developer will havethe responsibility for soliciting feedback from the user, and the primary mechanism for obtaining thisfeedback is through user interaction with the expert system through the user interface. Cooperativeevaluation of the interface will lead to changes in both the expert system logic and the user interfaceitself. Because users do not always understand the importance of their role in providing this feedback,the developer must take the initiative to encourage user interaction.
In addition to working with a key user contact, it is important for the developer to expose the other usersto the application. Although it is appropriate for a single user to represent the user base, additional usersinteracting with the software will lead to a more complete design.
As the software is evaluated and improved, the sophistication of both the expert system and interface willgradually increase. Thus the level of complexity of the scenarios presented should increase as well.Initially, user interaction will consist of "playing with" screen displays. Soon, however, simple nominalcase scenarios should be presented so user(s) can evaluate the system as a whole. These scenariosgradually become more complex and include failures. Finally, canned demos are replaced by real dataplaybacks. This concept of iterative operational prototyping with increasingly complex scenarios leads toa well-designed system in which all interested users have a chance to understand the system and makecontributions.
60

5.3.3 Using a Library
Throughout this guide we have mentioned CLARE,* the Control Center Library for Application Reuse &Exchange. Using a library can greatly enhance development and improve the final application. Specificbenefits of using a library include potential code reuse, better requirements understanding, andavailability and guidance of standards.
The most obvious benefit derived from a library is time saved by reuse of code, provided that the code iswell-tested and does indeed meet the specific requirements. A goal of CLARE is to include sampleapplications, or pointers to applications, for each library item. By providing accessible examples, librariescan expedite software development and eliminate redundant efforts.
A less obvious but equally important benefit of libraries is their contribution to requirements definition.Having access to an example application similar to an idea you have in mind, even if it does not exactlymeet your needs, can help you better understand your own requirements and solidify them. It may alsobe that a modified version of the existing application will meet your specific needs. Thus additional timesavings can be achieved by having access to working examples that help you understand the problem youare solving.
A third library benefit is the information that supports the development of application standards over awide user community. This is beneficial for maintenance purposes as well as cross-disciplineunderstanding of applications of other groups. For example, if all flight controllers choose a singleplotting program, or choose navigation buttons that look the same, they will be a step ahead inunderstanding each other's applications. And even if flight controllers are not interested their neighbors'applications, management and software developers likely will be.
Use of a well maintained library could be a great benefit to the NASA mission operations community.The authors of CLARE encourage its use and urge developers to make their own contributions.
5.4 The DESSY User Interface
Now that the key concepts in user interface development have been introduced, the DESSY example willbe presented. In figures 22 and 23, the original DESSY screen design was shown along with the existingRMS console display. The following sections provide more recent DESSY screens along with theconcepts that were incorporated into their displays. More information is also available through CLARE.
5.4.1 DESSY Interface Requirements
DESSY design began with a storyboard. The original screen design is shown in figure 22. However,design consists of much more than a plan for the screen. In the information-gathering step of interfacedesign, key concepts were identified for inclusion in DESSY. Excerpts from an informationrequirements document for DESSY are shown in figure 24. Most details have been removed. Thisdocument corresponds to the information layer of the interface design.
The second layer of the interface as defined in section 5.1.2 is made up of display elements. DESSY usestext displays, icons, and navigational items and incorporates a Hypercard-like approach in that it makessignificant use of pop-ups to get additional information on display objects. The screen is designed toinclude a hierarchical representation of expert system information by presenting high level informationon the main screen and more detailed information on subscreens. The following section discusses theMPM/MRL and EE DESSY displays, including display elements as well as screen layout.
5.4.2 DESSY Display Examples
DESSY currently monitors two RMS subsystems: the manipulator positioning mechanisms and themanipulator retention latches (MPM/MRL) and the end effector (EE). Each subsystem has its owndisplay. An overview discussion of these two screens and their displays is provided. A detailedexplanation of these screens is available in the form of cue cards, which are shown in Appendix B.
*URL: http://tommy.j sc.nasa.gov/-clare
61

5.4.2.1 Telemetry Data
The first items of interest on the DESSY displays are the telemetry data boxes. On the MPM/MRLdisplay these are represented as a set of small boxes in the center of the display. Because each piece ofdata is closely tied to a particular MPM or MRL, the layout of the display is such that the data boxes areplaced underneath the MPM or MRL to which they are related. In addition, each column pair representsthe system-1 and system-2 subparts of the MPM and MRL.
:iiiii!i!!i_iiiiiii!!i_iiiii!ili
Figure 24. Information requirements document.
62

Thedataboxesfor the endeffectoraregroupedandlabeledaccordingto functionality.This is becausetheoperationsof thetwo endeffectorparts,snareandrigidizer,aremorehighly integratedthanMPMsandMRLs. Endeffectoractivityalmostalwaysincludesdatachangesin bothsystems,whileMPM andMRL activitiesare independent. Thus while the MPM/MRL screen divides data based on the physicalsystems, the EE screen corresponds more closely to operational activity. The MPM/MRL and EE screensare shown in figure 25.
5.4.2.2 Switches and Talkbacks
Both the MPM/MRL and EE displays contain switch and talkback icons. These were created in attempt toprovide flight controllers with some indication of what the onboard crew saw. DESSY switches are insome cases driven directly by telemetry and at other times by expert system inference, depending uponthe availability of the data. For example, the MPM Stow switch can be set to the stow position by a singleStow Command MSID; however, there is no Deploy Command MSID, and therefore other data sets theswitch position during a deploy. In either case the switch represents the position of the actual hardwareswitch on board the Shuttle. Talkbacks are often merely single data boxes; however, they may be morecomplex. The MPM and MRL talkbacks are each comps made up of the logical "and" of data values forthe system-1 of their respective systems. Because the onboard talkbacks behave in this manner, DESSY'stalkbacks were constructed to use telemetry to do so as well.
Using icons such as switches and talkbacks does seem to add depth to the user interface, providing a moreappealing screen. There is, however, a pitfall to using such realistic graphics. Switch failures, faulty data,or incorrect expert system inferencing (perhaps based on faulty data) can all lead to an expert systemswitch or talkback state that does not reflect the tree state of the onboard hardware. It is important tomake sure the users understand that switches and talkbacks, like other display objects, can only reflect thedata they receive. They are data and/or expert system displays only and cannot be relied on as a certainreflection of the onboard hardware configuration.
5.4.2.3 Graphical Icons
Both DESSY displays use graphical icons to correspond to the systems they monitor. Square boxesrepresent MPMs and triangles represent MRLs, while more detailed snare and rigidizer pictorials are usedfor the end effector. The MPM boxes and MRL triangles lead to further MPM/MRL pop-ups with moregraphical icons. Their advantage is that they are simple, yet still convey necessary information with amore complex graphic available if desired. They also have three color states--red, yellow, and green--corresponding to failed, degraded, and nominal status.
The snare and rigidizer icons contain a more detailed icon description, eliminating the need for pop-ups.These icons change their shape to reflect the current state of their corresponding system parts. Forexample, the snare icon depicts the snares as being open, in transit, or closed. For both systems,providing these pictorial icons along with text supports a quick state and status view of the entire system.
5.4.2.4 Text Displays
Text displays are also a major part of the DESSY screens, reflecting the icons discussed in the previoussection. Because they provide summary level information, they are immediately visible at a glance. TheMPM/MRL screen contains text displays for the state and status of each of the two systems. State andstatus text displays are also available for individual MPMs and MRLs through their pop-ups.
The end effector screen contains text displays for the states of the snare and rigidizer, and consolidatedsystem text displays for the state and status of the end effector system. It was the integrated nature of thesnare and rigidizer subparts that led to this display design.
In addition to the text boxes, a message list is available for both displays. Any event can be recorded tothis log. Examples include state changes, power start-ups, and failures. These events are all time-stampedand may be stored in an electronic file.
63
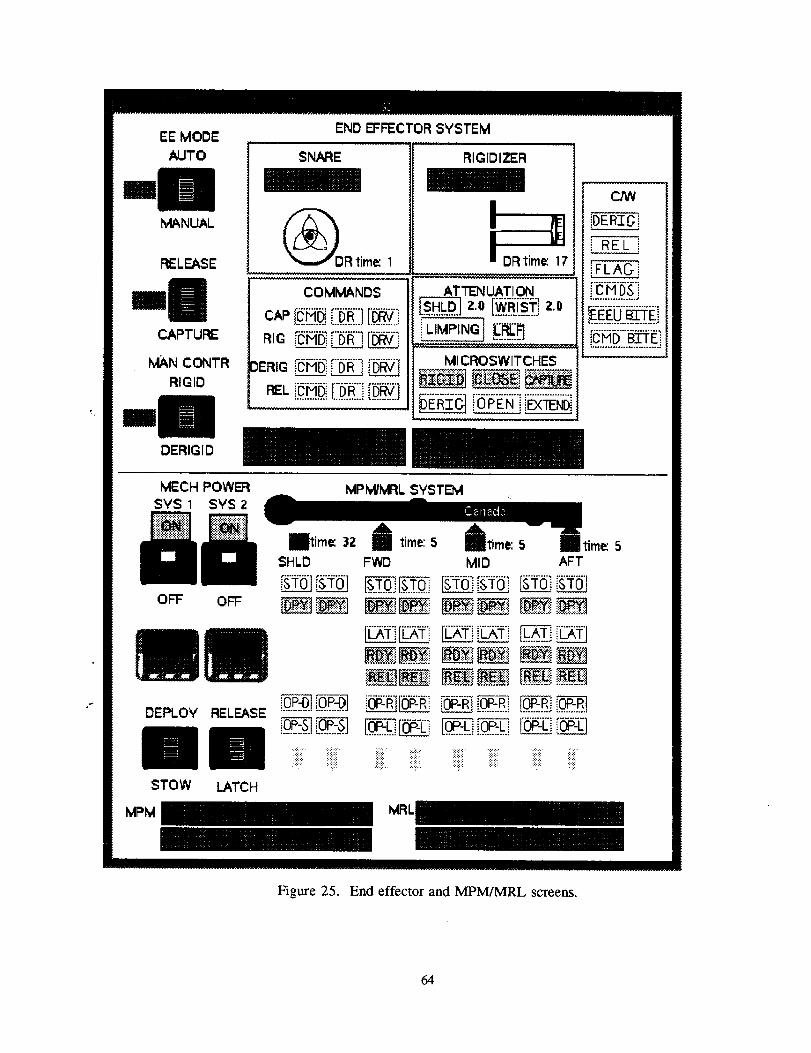
EE MODE
AUTO
MANUAL
RELEASE
CAPTURE
_N CONTRRIGID
END EFFECTOR SYSTEM
(_DR time: 1
RIGIDIZER
AT TENUATION
i LIMPING] rl"E_
MICROSWITCHES
C_
DERIG__ i
DERIGID
MECH POWERSYS 1 S¥S 2
OFF OFF
DEPLOY RELEASE
STOW
MPM
LATCH
MPM/MRL SYSTEM
IItime: 32SHLD
ii!iiiii¸ iiiiiii¸
I time: 5FWD
Illltime: 5 IlI time: 5MID AFT
Figure 25. End effector and MPM/MRL screens.
64

5.4.2.5 Navigational Items
DESSY makes extensive use of navigational items. Both displays contain buttons and menus to reachpop-ups or control the expert system. The same types of buttons and menus are available in both. Seethe cue cards in Appendix B for a more detailed explanation of the navigational items.
5.4.3 DESSY Screen Arrangement
The screen layout of the intelligent system is another important aspect of the user interface. DESSYscreens, shown in figure 25, contain a status overview, switch and talkback displays, system icons, andgroups of data displays. An attempt was made to make the two screens as symmetric as possible;however, differences in systems led to differences in their user interfaces. The grouping of similardisplays and the arrangement of those groupings is the feature of the DESSY screens on which thissection focuses.
The DESSY status appears near the top or bottom of the screen to support a "status at a glance." Subparticons, e.g., snare and rigidizer icons of the end effector system, are grouped with their state and timers,supporting the next level of information detail. Switches and talkbacks, which reflect those found onboard, appear together. Finally, various types of data displays are grouped according to function.
In the end effector system, command, microswitch, and alarm data all form data groups. They areoutlined and labeled on the EE screen. The commands group forms a grid whose rows represent which
_'." command is being given (CAP, RIG,...) and whose columns represent command type (CMD, DR, DRV).Microswitch and opstat data for the MPM/MRL system are grouped similarly, but have been alignedunder the corresponding MPM or MRL icon, and are also in columns corresponding to their system A orsystem B power source. The rows of data in this grid correspond to the particular data type (STO micro,DPY micro...). Study the figure to understand these concepts. During operations, a "flow" emerges,within and among the groups, of changing data patterns. This flow must be easy for the human tofollow.
Screen layout is perhaps the trickiest part of user interface design. The storyboard stage of softwaredesign and requirements definition first addresses this challenging issue. Use the DESSY examples forinspiration, but do not allow them to limit your own ideas. Keep in mind that appropriate groupings ofdata and consideration of flow will allow construction of a screen that best supports monitoringoperations.
5.5 User Input and Control
Users of intelligent monitoring systems will have some interaction with the software, affecting its output.This will likely be limited for real-time operations, but may include a significant amount of input if thesystem performs diagnostics. The following sections address three types of input a user might provide toan intelligent system.
5.5.1 Real Inputs
A type of input avoided by DESSY is "real input," or information that affects the logic of the expertsystem. This might include setting a variable, forcing a rule to fire, or changing a data value. The inputmight be used to reset or change part of the intelligent system, or it might be supplemental information tobe used for further state or status determination, or for diagnostics. DESSY avoids this type ofinformation because it is currently strictly a data monitoring system. The credibility of all DESSYconclusions can be directly tied to telemetry.
Intelligent monitoring systems that can be altered by end users are more complex, but are notunreasonable. Issues of concern include affects on real- time monitoring, tracking of user input, and"undo's" or correction of user mistakes. This feature would be most useful in diagnostics where the real-time nature of monitoring systems is not in jeopardy. Some future version of DESSY might include sucha feature, as long as performance is not impaired.
65

5.5.2 Resets
Resets involve changing some expert system part to a default value, removing the current value from thesystem. This is similar to, but not exactly the same as, inputting a real value into the system. Resets donot cause chaining and do not affect expert system logic. They simply replace the current visible valuewith the default value. They are used to remove incorrect or outdated information from the userinterface.
Examples of resets used in DESSY include (1) setting a timer to zero, (2) setting the status of a data valueto functional, and (3) setting the status of a subsystem to operational. Each of these actions removes thedisplay value and resets the value in the knowledge base object, but has no other affect on the expertsystem.
System resets might be used if the expert system has made faulty conclusions or if the user no longerwishes to see a failure annunciation. Resets should always be recorded, along with any explanationnecessary to justify the user's action.
5.5.3 Acknowledgments and Logs
Acknowledgments and logs have no affect on the expert system, but may affect the expert systemdisplay. An acknowledgment is used to verify that the user has seen an expert system conclusion. Itshould change the related user interface display, may include a reset, and should always be logged. Logsare used to record any information the user deems necessary. In addition to common events beinglogged automatically, it is a good idea to provide a log for any additional information the user wishes torecord.
5.6 Expert System Management
In addition to understanding how to use the expert system to monitor operations, the end user shouldlearn something of how the expert system works and how to manage it. Areas where expert systemmanagement is necessary include control of the data interface, control of interfaces to other softwareapplications, and control of the expert system itself. These will be discussed in the sections below. Inaddition, the user should be provided with a simple mechanism for launching and shutting down theexpert system.
5.6.1 Control of the Data Interface
Although the end user should not be required to understand details of the data interface, he or she shouldknow the basics of how the expert system gets its data so that if problems with the data source arise, theuser may have options for recovery. G2 programs have an interface object which acts as the connectionport between your knowledge base and the G2 Standard Interface (GSI) program. The GSI program isitself the interface between G2 and the data source. As a developer, you will want to identify all normaldata connectivity problems and provide indicators should these problems be detected. Although the userneed not understand the details, providing access to the connection object status and presenting the userwith a simple diagnosis of the situation will shorten the time to recovery and perhaps even eliminate thedeveloper's or data manager's involvement. Sometimes recovery may be as simple as a restart orswitching the data source workstation. At other times it may be more severe. In any case, providing theuser with the knowledge and power to solve simple problems will benefit everyone.
5.6.2 Control of the External Software Interface(s)
Control of external software interfaces follows the same guidelines as control of the data source interface.Provide users with easy access to simple status information, and give them a chance to diagnose theproblem themselves if they so choose.
5.6.3 Control of the Expert System
The mechanism for controlling the expert system within DESSY was designed to allow users to continueto use the data monitoring parts of the DESSY display, even if the expert system was determined to beunreliable and thus unusable. This might conceivably occur because of bad data, insufficient computer
66

performance,or faulty logic. In anycase,theDESSYdeveloperswantedDESSYto beusefulasadatamonitoringdisplayevenif theexpertsystemcouldnotcurrentlybeused.
DESSYusersareprovidedwithacontrolbuttonthathastheeffectof turningoff thepartof the expertsystem display that reflects the monitoring and diagnostic activities. The specific action is to grey-out thepart of the display related to the expert system, while leaving visible the portions of the screen that simplydisplay telemetry data. Thus any distracting faulty conclusions are dimmed while data continues to beprevalent.
This function has been deemed control of the expert system; however, it is actually a control of thedisplay. For the user ,however, the net effect is for the expert system part of DESSY to be turned off.Although within the DESSY code there is a capability for disabling rules, and in fact appropriate rules aredisabled in cases of loss of signal (LOS), the specific action referred to above is actually user interfacecontrol.
5.7 The Developer Interface
A final area of importance in developing the expert system and its interface is constructing a usefuldeveloper interface. Many of the aspects of the developer interface were covered in the design andorganization subsections of section 3, "Building the System." Here are provided some additionalsuggestions specifically related to the developer's interaction with the software, for developers are softwareusers too, and users may at times play the developer's role.
5.7.1 Knowledge Base Organization
Good knowledge base organization, discussed in section 3.1, is a crucial aspect of the developer interface.The developer must be able to navigate through the knowledge base quickly and must be able to easilylocate items. G2 is very lenient in allowing developers to construct KBs with little or no organization.Thus developers must enforce this discipline upon themselves and organize the knowledge base so that itis useful to them and others who might develop or maintain it.
5.7.2 Access Modes
A strength of the G2 environment is that it allows G2 Modes to be defined that set specified restrictionson knowledge base items. These restrictions include actions such as going to pop-ups, activating pull-down menus, or preventing an item from being deleted or moved. The G2 manual should be consultedfor a complete list of knowledge base restrictions.
In DESSY four modes are especially useful: (1) the administrator mode, provided as the G2 defaultmi3de, (2) an end-user or operator mode, (3) a testing mode, and (4) a demo mode.
The administrator mode has no restrictions. It gives the developer full access to knowledge base items.
The end-user or operator mode has significant restrictions to restrain the user from "messing up" theknowledge base or "getting into trouble." It restricts the user in such activities as moving display items,changing rules, and deleting objects. In addition, the end-user mode provides appropriate pop-up menusfor items while hiding unneeded G2-provided menu choices. (See the G2 manual for help inunderstanding these concepts.) In short, the end-user mode provides the polishing to make theapplication as user friendly as possible.
The testing mode is useful to developers because appropriate testing activities such as "change value" or"start test procedure X" can be added to item menus to expedite testing. Other unneeded menu choicesmay be hidden, and restrictions such as those given to end users may be used to prevent thedeveloper/tester from accidentally harming the knowledge base during this phase. The developer woulddefine testing restrictions as needed to expedite the testing process.
Finally, a demo mode was found to be quite useful, giving a knowledge base demonstrator theappropriate menu choices, while hiding unnecessary G2 menu choices. In addition, many of the usual
67

end-userrestrictionsmaybeappliedto preventaccidentsduringademonstration.Thedevelopershoulddefinethismodeto allowdemonstrationsto goassmoothlyaspossible.
5.7.3 Developer Displays
The final area of the developer interface is developer displays, items usually hidden from the end userthat the developer uses in understanding or testing the system. Displays to help the developer understandthe system include state diagrams and rule documentation. These items are not used as part of theknowledge base logic, but are there simply to help the developer create the system and to help futuredevelopers extend or maintain it. They also serve as a valuable aid to the developer in communicatingwith the end users.
There are a number of displays which aid in debugging and testing. G2 provides many simple buttonsand displays; these were discussed in section 3.5. In addition, the developer may want to construct panelsof frequently used items for quick access to those items. Examples from DESSY include a button panelcontaining the various button types used in DESSY development and a demonstration panel containing aset of buttons that launch select demo procedures. These items were found to be helpful throughoutDESSY development.
Once your knowledge base development is complete, you may decide to delete most developer displays ifperformance or knowledge base size is an issue. If you do not have these restraints, however, leavingthese developer aids in the knowledge base will ease system maintenance and help future developersunderstand the work you have done.
68
Section 6
Testing the System
After each cycle in the design and development of the expert system, a testing phase occurs. Althoughtesting is generally thought of as the final stage of the application, and indeed certification or qualityassurance testing should conclude software development, testing must occur regularly throughoutoperational prototyping.
Each member of the development team plays a role in ensuring the software is tested to the users' andorganizations' requirements; this section attempts to define the unique roles. The developer must create atest plan which includes testing the software at all appropriate levels. In creating this plan, the developermust be aware of the various types of testing that should take place. The user(s) must be prepared toprovide test case scenarios. The scenarios should vary in complexity and detail, and evolve to includemore and more realistic situations.
The sections that follow cover various aspects of testing real-time monitoring systems. Section 6.1,"Verification and Validation," discusses rule consistency issues, while section 6.2, "Creating Test Objects,"reviews test object mechanisms discussed in section 5.6, "Developer's Interface." "Writing Test Cases" isdiscussed in section 6.3 and "Testing with Real Data" in Section 6.4. Section 6.5, "Real TimePerformance," brings up some important performance-related issues and section 6.6, "Testing forContinuous Improvement," relates testing to the overall operational prototyping process. Section 6.7,"Certification Testing," explains the final testing process used to gain certification of the intelligentsystem.
6.1 Verification and Validation
Verification and Validation (V&V) are common buzz words in software testing. Although DESSY'stesting included V&V, most work done in this phase focused on test case scenarios. V&V are brieflycovered as related to the DESSY project. See (Chandrasenkaran and Punch, 1987) and(Chandrasenkaran and Punch, 1988)
.6.1.1 Definitions
Verification involves ensuring that the code you write is logically correct and "bug-free." Validation, onthe other hand, involves ensuring that the problem you have addressed truly meets the requirements ofthe actual problem. Because there are numerous papers availablein the topics, the details of thesedefinitions are not covered. Instead, the focus is on how each concept was applied in DESSY.
6.1.2 Verification of Rules
Sophisticated software tools are commercially available to verify rule sets. However, because DESSYrules were separated into relatively small sets, manual verification sufficed. For each set, the telemetryrelevant to that set was identified, along with all possible patterns of that telemetry. Because the telemetrywas isolated into small groups, the problem was tractable. Valid configurations, both nominal and off-nominal, and invalid or impossible configurations were identified. Of course any data configurationcould occur due to noisy data, but no diagnostic or monitoring rules need be written for meaninglessconfigurations. However, care must be taken to ensure that meaningless data configurations resultingfrom subsets of noisy data do not cause diagnostic rules to fire incorrectly. This is achieved by ensuringthat the scope of the diagnostics rules is narrow enough that these rules are not triggered by noisy data,while being broad enough to catch a variety of failures. See section 3.3.4, "Status Monitoring Rules."
DESSY also has some rule chaining; however, even chained-to rules are ultimately derived from telemetryin real-time monitoring systems. This concept was handled by the small rule sets using small data sets(perhaps two or three pieces of data) acting as a single parameter in the rule antecedents and conclusions.(See section 4.3.2, "Context-Sensitive Bounded Pattern Recognition"). A single parameter with severalstates, for example an MPM command parameter with states of Deploy, Stow and none, could be verifiedand then used as a single element in rule verification. State diagrams and tables listing related data wereuseful in identifying valid data sets for various system configurations. This approach worked adequately
69

for DESSYbecausethelevelsof chainingareshallow,i.e.,usuallytwoor threerulesdeep. A morecomplexexpertsystemwouldlikely requirea morerigorousverificationapproach.
6.1.3Validation of the Knowledge Base
Only the user expert can reliably validate a knowledge base because this task requires a deepunderstanding of system operations. The approach used in DESSY was to use real test scenarios, eithermission or simulation data, to validate expert system behavior. Many times in this process it wasdiscovered that the developers, and even the expert, had made incorrect assumptions about data behavior,and DESSY rules had to be changed. Even the end user may find it difficult to correctly recall exact databehavior of all operations and failures. Having access to the expert was particularly important in thisphase of software testing.
Testing with real data and having the user expert closely involved both in development and testing werethe validation approaches applied to DESSY. It is important to have access to reliable test examples forall operational scenarios modeled, and multiple similar test cases which might include noisy data elementsare even better. Although no formal validation mechanisms were applied, this approach was found to bereliable and led to a correct and robust system.
6.2 Creating Test Objects
To thoroughly test the knowledge base, it is useful for the developer to create a suite of test objects thatare easily accessible throughout development, to both the development team and the end users. Theseinclude test buttons, readout tables, and operational scenarios procedures. Section 3.5, "Quick TestButtons and Displays," provides detailed discussions of many test objects one can create in G2. Section5.6, "Developers' Interface," illustrates other ways G2 can be used to enhance the testing process.Scenario procedures are discussed in the following section.
Test objects can be created and placed with their relevant rule sets and/or objects, or they may be locatedon separate testing panels. The former approach can make locating the objects easier, while the latterallows simpler scenario construction and provides the capability for these objects to be stripped out of thefinal delivered system. Your knowledge base may include both.
Providing a separate test panel for end users was found useful in DESSY verification. Users canconfigure the panel with select data patterns by setting MSIDs, and observe the results on the DESSYscreen. This is more favorable than directly setting the displays because users can create a dataconfiguration scenario on the test panel and then observe that scenario on the DESSY screen. Users alsowant easy access to MSID number during testing, which is available on the test panel. The test panel is animportant DESSY display because it allows users to build confidence in the system by directly controllingits inputs.
6.3 Writing Test Cases
Once you have satisfactorily tested individual knowledge base components with quick test buttons anddisplays, you can began developing operational scenarios. Although there are several methods of doingthis in G2 (e.g., using the G2 built-in simulator or reading a test data file through G2's GFI interface),scenario testing in DESSY was done using a very simple G2 mechanism, the G2 procedure.
6.3.1 Simulation Procedures
The G2 procedural language is very similar to Pascal and can be used to manipulate almost anyknowledge base item. Its key benefits in scenario development are its ability to execute statements bothsequentially and in parallel, its ability to launch other procedures as either dependent children processes(waits on return) or independent processes (executes in parallel), and its wait statement. These featuresallow the developer to construct very flexible test scenarios. In addition, G2 procedures have standardprocedural features such as local and passed parameters, if and case statements, and error handlingcapabilities.
70

6.3.2 Scenario and Configuration Development
In developing test procedures, the programmer should begin with simple nominal case scenarios. Ascenario can be developed for each known system operation, and scenarios should cover all nominalconfigurations defined in the state diagrams. These nominal case scenarios can gradually be extended toinclude the effects of noisy data or single sensor failures. It is important to verify that the expert systemreacts appropriately to nominal scenarios before more complex failure scenarios are explored. Verifyingnominal procedure activity is key in the validation part of testing.
It will be helpful to write procedures as generically as possible, passing in appropriate parameters, andbreaking procedures into smaller building blocks to expedite the overall testing process. For example, inthe DESSY MPM/MRL system, the RMS Power-Up and Power-Down subsequences were written as stand-alone procedures. They were then called out by higher level procedures as part of a simple scenario. Ifdesired, more complex scenarios, possibly including both MPM and MRL operations, could also beconstructed, primarily for demo purposes.
Once a complete suite of nominal procedures has been constructed, the failure spaces can be explored.Standard types of failures, discussed in section 2.3.5, should be included in the test scenarios. Makingthese procedures flexible with appropriate input parameters will expedite testing. In DESSY, some failurescenarios even included a randomness factor. For example, the test scenario might fail a randomlyselected microswitch, and then proceed with operations. Adding randomness to test scenarios increasestheir usefulness in verification by checking system behavior and in validation by proposing newscenarios.
In addition to creating test scenarios, it was useful to create procedures to set up particular dataconfigurations. Examples include an MPM-stowed procedure which simultaneously sets all stowmicroswitches to active and deploy microswitches to inactive, or an MRL-latched procedure which setslatch micros to active and release micros to inactive. Note that these are not scenarios--they are staticsystem configurations. They provide yet another way for the developer and user to interact with theexpert system.
6.4 Testing with Real Data
Although "canned demos" or scenario procedures are an excellent means for testing a knowledge base,there is no substitute for testing with real telemetry data, running from a real data source. This data maybe live or prerecorded; it may be from a mission or from a simulation from the Shuttle Mission Simulator(SMS). Any of these sources will work; however, access to all of them is ideal.
6.4.1 Real Data and System Validation
Real data will provide the ultimate validation test for your knowledge base. Because even experts can bemistaken about the details of operations, data taken directly from those operations provide the mostreliable source for system validation. In fact, even though SMS simulation data should be thoroughlyused and is the only practical way to test a wide range of real failure scenarios, only mission data providesunquestionably accurate test cases.
The best way to test and validate a knowledge base for NASA's mission control environment is to obtain atest suite of scenarios generated by the SMS. This is not necessarily a straightforward task, and help fromthe flight controller will be needed. Once the test suite of all known failure classes is constructed, the datashould be fed into the expert system and records should be kept of system performance. Because it isunlikely that the expert system will pass all tests the first time around, the developer and user team shouldbe prepared to resolve any problems, whether they be verification or validation problems, and replay thetest suite. Only when the expert system can give satisfactory performance during the entire suite should itbe considered validated and ready to use.
6.4.2 Completeness Checking
An inevitable limitation of expert systems is incompleteness, their inability to detect all failures, even allknown failures. Rather, expert systems can only detect failures which have been specifically entered intothe system knowledge base. It is important for the expert system development team to see that the user
71

groupunderstandsthiscommon-senselimitation,anddoesnot expect super expert capability to detectany failure whatsoever.
Real time data testing can help increase the completeness of the expert system by exposing failures thatthe expert may have forgotten or not known about. In DESSY, several new failure scenarios werediscovered during the testing phase, leading to improvements to the software. Although the developerswere able to verify DESSY behavior for many known configurations, it is not possible to track all possiblesequences of data. Thus it is unlikely that a knowledge base can ever be thought of as complete. In anycase, testing the system with real data will increase expert system completeness and decrease the chancesthat the system will miss a known failure.
6.5 Real-Time Performance
Another issue that arises during the real-time testing phase is that of expert system performance. Becauseperformance can vary greatly depending on the computer platform and its load, it is important to testyour software under the same loading conditions that it will operate under during real operations. Thistesting setup should represent the exact configuration, including computer and software load, monitor,and network load.
In an earlier phase of the DESSY project, development and testing was done on a SPARC 2 platform withonly one copy of G2 running. At that time the mission control environment consisted of a DEC with aMasscomp display. There was also the possibility of multiple G2s being used simultaneously in thecontrol center. DESSY was deployed into this environment without any performance testing. It was thendiscovered that the Masscomp display could not support the expert system's graphics. Needless to say,this set the application back and greatly lowered user acceptance.
A related performance issue for DESSY is software loading time. Because DESSY is made up of manysoftware modules, it takes several minutes to load. In the mission control environment when operationsoccur rapidly, this is often unacceptable. The solution was to merge the final DESSY into a single file toreduce load time. G2 also has a "strip text" option, which can decrease the size of the knowledge baseand reduce load time.
Testing in the actual operational environment is extremely important. This testing should include thathardware and time constraints that exist in real operations. The DESSY developers learned this lessonand hope future software developers can learn from these experiences!
6.6 Testing for Continuous Improvement
Developers should remember that testing is only one phase of the entire development process. As youbegin to test, establish expectations of making improvements; do not have an accept or reject attitude.Because of the nature of operational prototyping, you will have constructed a system that is evolving.You should develop appropriate evaluation criteria for where you are in the process and plan your testcases and expectations accordingly. Following the levels of testing defined above, quick test buttons anddisplays, simple scenario procedures, complex scenario procedures, and finally real data will allow you toevolve the system into a robust tool that can be deployed into the user's environment.
6.7 Certification Testing
Certification testing is the final phase of testing in which a software application is approved for use on aflight controller's console for the purpose of making flight-related decisions. It occurs after all othertesting has been performed, as shown in figure 26, which depicts the life cycle of an intelligent system. Itincludes both a number of integrated simulations and "flight following." In both forms of certificationtesting, the flight controllers perform their jobs without knowing what problems to expect. This providesa realistic test of how well the intelligent system supports the flight controllers in performing their job.
72

Design andDevelopment
Testing forContinuous
Improvement
StoryboardCertification
Testing
Figure 26. Intelligent system life cycle.
Integrated simulations, the first type of certification testing, help test the software by confronting it with alarge number of failure situations (more than would be expected from a comparable amount of actualmission data). Simulations are considered integrated when they involve more than just one flight controldiscipline. Not only does an integrated simulation allow a fuller portrayal of a complex problem, it alsotests performance in the presence of all other software in the control center. It allows detection ofperformance problems and difficulties in receiving telemetry streams when the computers are loaded.
Flight following is a testing situation in which live mission data is directed to the software application, butflight-related decisions are not based on the results from that application. Flight following typicallypresents fewer problems from the monitored system than simulations, but tends to present the softwarewith noisier data. Consequently, flight following tests the software more rigorously in terms of receivingtelemetry and dealing with noisy data, whereas simulations test software more rigorously in terms ofdetecting monitored process problems.
Certification is a stamp of approval given to a software application when it has been shown trustworthyenough to be relied upon for flight-related decisions. This trustworthiness is rarely stated in purelyquantifiable terms, probably because there are a number of ways the software can perform differentlyfrom its user's expectations. One critical error might be enough to deny certification, whereas a numberof noncritical surprises might be tolerated.
DESSY certification is expected to occur in phases. Initial certification will be for presentation oftelemetry. Later certification will be for expert system performance. In other words, DESSY will beconsidered useful for supporting flight-related decisions if it presents telemetry reliably. Later, afterconsiderably greater experience with DESSY's fault recognition logic (and when that logic has provenitself accurate and reliable) the expert system portion of DESSY will be certified. There is also indicationthat a related application called the Remote Manipulator System Checkout software, or RMSCO, will alsoundergo a phased certification. (See CLARE for information on this application.) This will allowRMSCO to provide early, basic support for monitoring RMS checkout procedures, followed by later,enhanced support. It illustrates the certification process as a stamp of trustworthiness for a specific typeof support.
73

Section 7
Documentation and User Training
As in any software project, documentation and user training are both necessary steps toward a completedeliverable product. This section discusses specific knowledge base aspects that should be documentedand provides several effective training mechanisms. Sections 7.1, "Documentation within the KnowledgeBase," discusses several knowledge base structures that can be used to support documentation. Then"Documentation of Requirements," which aids in the evolutionary prototyping process, and"Documentation of Testing," necessary to ensure that the software correctly supports the task, are coveredin sections 7.2 and 7.3.
The next sections focus on user training; however, setting up the suggested training tools is anotherexcellent way to further document your knowledge base. Section 7.4 discusses cue cards and theirbenefits. Section 7.5, "The Tutorial: Interactive Exploration of the Expert System," provides yet anotherexample of an effective documentation/training tool. Scenario demonstrations are discussed in Section7.6 This construct provides documentation of test scenarios as well providing a template for effectivedemonstrations. Finally, Section 7.7 discusses the steps in "The Developer-User Handover," includingdelivery of documentation and training materials, as well as the software itself.
7.1 Documentation Within the Knowledge Base
A variety of tools can be used to effectively document your knowledge base. Discussed are several typesof documentation found in DESSY, including organization strategies which provide easy-to-follow mapsinto the knowledge base. Other documentation forms such as state diagrams and references tosupporting literature are also useful. They can be left within the application itself to support furtherdevelopment and maintenance, or can be stored in a separate knowledge base module that is merged intothe system when needed. Modularizing the documentation segment of the knowledge base may beadvisable if performance or knowledge base size is an issue.
7.1.1 Knowledge Base Organization
One of the most effective means of documenting a knowledge base is to properly organize it so that anoutline of the software is provided within the hierarchy. The G2 tool supports this type of organizationby allowing users to create hierarchies of both workspaces and modules. Sections 3.1.1 and 3.1.2,discuss these concepts.
Modules are G2 files which allow the user to logically separate software where needed. They containdependencies upon one another, forming a hierarchy. To create a workspace hierarchy within a module,a workspace holder object is defined which serves as the basis of the internal hierarchy structure. Theseworkspace holders are then labeled appropriately, providing an outline of the software within a modulefrom the highest to lowest levels.
How do modules and workspace holders contribute to documentation? Because these structures force theuser to think of software in a structured, hierarchical manner, an outline will be formed of the software asthe system evolves. This outline can serve as the backbone of code documentation. For example, at thehighest level, the module hierarchy provides insight into software. Figure 27 shows the end effectormodule hierarchy. Even from this abstract view, it is easily seen that this knowledge base contains rulesassociated with the end effector, uses a timer, and contains predefined simulations.
Within each module workspaces also form hierarchical outlines of the software. In DESSY each modulehas a root workspace from which all others are created. Examples of workspace hierarchies from two ofthe modules are provided in figure 28. The EE-Defs module, to which EE-DEFS-ROOT belongs,contains a variety of end effector definitions as well as some objects and specific end effector timerinformation. EE-RULES-ROOT, from the EE-Rules module, contains all end effector rules. Having thisstructure easily accessible not only documents the types of rules provided, but gives the peruser quickaccess to any rule category.
74

lee-module [I
I Ilee-rules I [ dessy-heade_
I
[ee-defsl[_ [ dessy-def_I
[aessy-aefsJI
,Ibuttonsl [ buttont
I
! interface[
Figure 27. End effector module hierarchy.
EE-DEFS-ROOT [
D E-MSID-DEFS
_ EE-DISPLAY-DEFS
D EE-DEFS
D EE-OBJECSFS
D EE-TIMER-WS
EE-DEACTIVATABLE-RULES
D EE-SYS-STATUS-RULES
D RIGIDIZER-RULES
D SNARE-RULES
D EE-DERI G-ALARM-RULES
EE-RELEASE-ALARM-RULES
• • •
lEE-RULES-ROOT [
D EE-DEACTIVATABLE-CTRL-RULES
_ EE-DISPLAY-RELATIONS-RULES
-ON-RULES
.-_ EE -DEAC_T_VATAB LE-RULES
EE-ALWAYS-ON-RULES
EE-SYSTEM-STATE-RULES
D EE-STATUS-CORRECTION-RULES
DEE-MODE-RULES
D EE-MAN-CTRL-RULES
Figure 28. End effector sample workspace hierarchies.
75

TheEE-RULES-ROOTtells theknowledgebaseinspectorthatsomerulesaredeactivatableandothersalwaysremainturnedon. Thesubcategoriesof rulescanthenbefollowedaswell. Notethatthoseshownin figure27 representonly apartiallistingof all endeffectorrulescategories.TheMPM/MRLmodulehasa similarmoduleandworkspacehierarchy,soanyonefamiliarwith theendeffectormoduleshouldbeableto perusethismoduleaswell,andviceversa.
Theworkspaceandmodulehierarchiesarejust thebeginningof knowledgebasedocumentation,buttheyrepresentan importantfirst stepthatshouldleadto othergooddocumentationhabits.Documentationshouldbeeasilylocatedandshouldbereadable.A strongknowledgebaseorganizationwill supportboththesefactors.
7.1.2 State Diagrams
Another form of documentation useful in DESSY is the state diagram. Originally used as a tool tounderstand states or physical orientations of a hardware system, state diagrams can also serve to documentthis understanding and the rules which result. Figure 16 showed the state diagram of the MPM. BecauseMPM state change rules were constructed directly from this diagram, it remains an ideal graphicaloverview of the state change rules. It captures the significant knowledge embedded in the rules and iseasy for an expert system novice to understand.
State diagrams may be static or animated to reflect the current state of a running system. They may behierarchical in nature and reflect substates of a given state. Although these extensions were not fullyexplored in DESSY, they are simple to construct and might be appropriate for your knowledge basedocumentation. If performance is an issue and you feel state diagrams would impair your runningknowledge base, the state diagrams could be stored in a separate module that is eliminated from themodule hierarchy during run time.
7.1.3 Flight Rules and Other Support Documentation
Support documentation, probably taken directly from literature and flight manuals, should be exploitedthroughout knowledge base construction. Although it is not feasible or even desirable to have all supportdocumentation on line, that is, recorded within your software, you will probably want to includereferences to relevant documentation wherever possible.
Flight rules and schematics are specific examples of sources for documentation. In DESSY some expertsystem rules reflect a specific flight rule, information which would be useful to the flight controller users.Tables from schematics that contain data set configurations and their implications are also useful. Thesetables can be included and enhanced by highlighting current scenarios within the table. DESSY containsseveral of these animated tables.
Documentation with credible sources will give credibility to your knowledge base. Some documentationwill serve only as a developer's guide to your system knowledge, while other documentation may beaccessible by the user when the system is running. Keep in mind that providing references for rules anddefinitions will not only help other developers, but will help you as you return to parts of the knowledgebase you haven't recently visited. In any case, consistency, thoroughness, and preciseness will lead to ausable and maintainable system.
7.1.4 Documentation Overhead
The only disadvantages to documentation in a real-time system are knowledge base size and potentialperformance impacts. If performance or size is an issue, you may need to limit the level ofdocumentation included in the run time system. This can be done in two ways. First, it may be possibleto record much of the documentation in a separate module that is not loaded when the run time system isdeployed. This solves performance issues; however, it might prevent you from placing documentationnear rules and objects where this information would be most useful. Second, you may want to includeonly reference pointers instead of the reference documentation itself. Although this limits theinformation available to the user or developer, it may be all that is needed for parts of the expert system.
76

In DESS¥,on-linedocumentationwaslimitedto preventtheknowledgebasefrom becomingtoolargeandsothatperformancewouldnotbeaffected.However,selectreferenceinformationthatflightcontrollerssaidwouldbeusefulin performingtheirrun timetaskswasincluded. Examplesincludetelemetrybubblepop-upscorrespondingto displayedMSIDsandlogic tablestakenfrom subsystemschematics.In addition,intelligencewasaddedto logictablesto providetheuserwithevenfurtherassistance.
Thespecifictypeandamountof documentationfor yoursystemwill dependona numberof factors,includingperformance,availability,anduserneed. Documentingthroughouttheprototypingprocess,however,canimproveunderstandingof theapplication,andthereforeproducea superiorknowledgebaseproduct.
7.2 Documentation of Requirements
Documentation of requirements can help guide developers through prototyping, as well as provide a toolfor tracking progress. The DESSY requirements document was a living document throughout DESSYdevelopment. It was not a formal list of application "shalls." This document contains plans for futuredevelopment as well as accomplishments.
Specific information in the requirements document includes, for example, identification of displays andtheir functions; identification of system states, commands, and failures determined by the expert system;special features such as resilience to noisy data; logging capabilities; and test case scenarios. A shortenedversion of the End Effector DESSY requirements document is provided in Figure 29.
Figure 29. The End Effector DESSY Requirements Document, shortened.
77

Figure29. (concluded)
78

7.3 Documentation of Testing
Section 6 discussed the necessary steps and motivation for testing expert system software. There are twoindependent phases in system testing. The first is to find logic errors in rules so that the system may beevolved and changed to correctly monitor operations. The second phase begins only when the first iscomplete. It is to verify that there are no errors in the rules and that no additional changes need to bemade. Both phases need to be thoroughly documented.
When testing is done to evolve and correct the system, test runs are repeatedly made and the resultsrecorded. DESSY has a test file book in which each test run was recorded, along with the expert system'sbehavior and any corrections that were made to the system for that run. A subsequent run for that casewould again record behavior and document corrections if any were needed. Figure 30 shows an examplefrom the Test Case Log used in DESSY, and figure 31 shows a subsequent run after modifications weremade. Also provided is a set of simplified screen snapshots on which particular data patterns can beeasily recorded. An example is shown in figure 32. Note that the example shown provides the MET,indicating that the data came from real telemetry, rather than a "canned" test procedure written bydevelopers. Tests made with canned data would be recorded similarly.
After sufficient testing has been done and appropriate changes to the system made, a final set of runs forall test cases is made to verify that no further changes are needed. These should be recorded in the TestCase Log as well. Once all testing is complete, the Test Case Log may be thought of as deliverabledocumentation. If later it is determined that the expert system needs modification, the Log may be usedagain and the process repeated.
Procedure: Test Case: #12
MET Event
Tries to Deploy, but stops half wayand returns to stow.
Comments on Test Case
00:02:27:1200:02:27:1400:02:27:1500:02:27:2600:02:27:2800:02:27:4400:02:27:45... (omitted
Mech Pwr OnLost Mech PwrMech Pwr & Opstats OnLost part of STO microsLost remaining STO microsLost DEP Opstat-2Lost DEP Opstat-1
here, but recorded in original)
See data patterns recorded in diagram.The opstats are turning on within 1second of each other.
DESSY Conclusion(s) Performance Corrective Action & Rationale
Potential-Single-Motor-Driverecorded @ 02:28:18
Shouldn't be concluding this. Review Potential-Singlerules. They do not appearto be complete.
DESSY MPM/MRL Test Case Log Initials Date.
Figure 30. DESSY Test Case Log-first run.
79

Procedure: .MP=M..[_J_v. Test Case: #12b
MET Event
Tries to Deolov. but stons haft wayand returns to stow,
_onT_
see previous see previous
DESSY Conclusion(s) Performance Corrective Action & Rationale
Nominal Stow
(PSMD was removed)
Timer was not resetting whensystem changed in-transitdirections.
Added condition to MPMTimer Resume Rule tocheck if Timer = OFF.OK now.
DESSY MPM/MRL Test Case Log Initials Date
Figure 31. DESSY Test Case Log--second run.
stow
release
I MET: 00:02:27:44
SHLD FWD MID APT
Figure 32. Screen snapshot for recording data patterns. Anomalous data is circled.
80

7.4 The Cue Card: Map to the User Interface
The Cue Card is an excellent means of knowledge base documentation, as well as a tool that can begreatly beneficial to end users both in learning the system and as a system reference. The cue cardscreated for the DESSY MPlVl/MRL and end effector modules are available as Appendix B. The cue cards,which consist of two color pages each, have specific formats and contain select types of information.Because DESSY does not include a users guide, the cue card is especially important as a reference toflight controllers.
The first page of each DESSY cue card provides a thorough description of all screen displays. Asnapshot of the screen is shown, and each item is labeled and includes a brief statement about the item'sfunction. Listings of all possible expert system conclusions for the system state and status are provided.Color interpretations can also be found on this page.
Page two of the cue card focuses on navigation through displays and contains information on buttons,tables, and pop-ups. An example is shown for every item type that has a pop-up, such as the telemetrybubbles associated with MSIDs. Directions for viewing these pop-ups are given. Any special windowsassociated with particular buttons are shown and described. Any tables that provide the user withsupplemental information are also provided.
Cue cards should be included with any software products delivered to the mission operationsenvironment. They are not difficult to construct and provide excellent screen documentation. They arean effective communication tool, serving as a descriptive overview to anyone not familiar with theintelligent system. In addition, their conciseness and convenience make them the ideal reference card foruse during mission operations.
7.5 The Tutorial: Interactive Exploration of the Intelligent System
A second type of documentation which is also quite effective in user training is the interactive tutorial.The tutorial, if built properly, will allow a novice user to peruse the expert system interface and gain anunderstanding of each display piece without any outside help. The DESSY tutorial was designed as apage turner, which means that the user browses through a series of pages, each referencing a particularexpert system aspect. The screen is assembled piece by piece as the user progresses through the tutorial.Once the user has completed this section, a demo section is available. Here the user runs test casescenarios, gaining a complete view of the expert system use in mission operations.
7.5.1 The Tutorial as a Training Tool
Like the cue card, the tutorial focuses on the expert system through the user interface, rather thancovering specific rules and design strategies. Most end users do not need or want access to this moreadvanced information. Interested users would be welcome to explore these aspects of the expert systemalong side the developer. The pages of the tutorial contain simple explanations about screen items, howthey are used, and how they will change when data is present. User input buttons are provided to causetutorial displays to change based on the user's simulation of data. Thus the users can interact with thedisplays as well as read about their functionality.
The DESSY tutorial covers both the MPM/MRL and end effector subsystems and contains both missionheader and summary information. As the tutorial user traverses the pages of the DESSY tutorial, theMPM/MRL or end effector screen is built one section at a time. At the completion of the tutorial section,the entire screen is built. This gives the user a chance to focus on each screen item, but concludes with aview of the screen as a whole. In addition, sections may be repeated and pages may be traversed forwardsor backwards, providing a means to review any subsection at any time.
Once the user has completed this part of the tutorial, he or she can move to the demonstrations section.
This part of the tutorial is intended for users who understand the basic display items and are ready to seehow operational scenarios cause those items to behave together. There are MPM/MRL and end effectordemos to run, and the user can choose from nominal case demos or a variety of failure case demos.When appropriate, there are even some random elements present to keep these demonstrations interesting.
81

Thetutorialwasfoundto beanexcellenttrainingmechanismfor newusers. It is simple to use andrequires no outside expert intervention or guidance. The DESSY developers feel that a tool such as thisprovides an ideal training mechanism for new software users.
7.5.2 The Tutorial as Documentation
As well as being an effective training tool, the tutorial was useful in documenting both displays and testscenarios. Because there is no DESSY users guide, the tutorial was important for initial user reference, aswell as for documenting display behaviors and storing test procedures. Because it can be easily viewedby a variety of end users, it served as a means for user verification of test procedures and expert systemconclusions. As a documentation forum, the tutorial and cue card together are a more than adequatereplacement for a users guide and are in many ways superior.
7.5.3 Tutorial Design
One of the primary advantages of the DESSY tutorial was that it was simple to create. There were twomain areas where work had to be done. First, the pages of the page-turner had to be constructed andappropriate text written. This included making sure the users could only turn to pages which wereappropriate from their current position within the tutorial. Second, because the screen was to beconstructed piece by piece and users were to interact with each piece, an altered copy of the expert systemscreen had to be stored in which each appropriate screen section could be viewed separately. User inputbuttons were created for each section to give the tutorial browser control of these screen displays. Theremaining parts of the expert system, however, remained unchanged, and the tutorial was simply added asa layer on top of the intelligent system.
7.6 Demonstrations
Bnilders of software applications are frequently asked to provide demonstrations along with theirdelivered products. This may be thought of as part of the documentation process and might evenprovide introductory training to users and their supervisors. In the DESSY project, numerousdemonstrations have been given and a recommended demo approach has evolved. The followingsections contain the DESSY developers' view of effective demonstration techniques and discuss how toorganize software to provide effective demonstrations.
7.6.1 Effective Demonstrations
The two basic sources of scenarios for demonstrations are prerecorded data that can be played backduring the demo and user-written demonstration procedures, called "canned" demos. DESSY demostypically used user-written procedures because this provided maximum flexibility during the demo. Forexample, complicated scenarios with rapidly changing data can be broken into sequential steps, each stepplayed at a time. Once the scenario is understood, the entire demo sequence is played. This gives theaudience a better understanding of complex scenarios. In addition, the selection of demo procedures islimited only by what the developers have constructed, thus providing a wide range of demo alternatives.
Using playback data for demonstrations has advantages as well, primarily because this is more realisticthan canned demo procedures. Viewers may see the updating of the telemetry clocks corresponding todata changes, which gives the demo increased credibility. The disadvantage of these demos is thatmanipulation of the playback software may be cumbersome. Choices of demonstration scenarios willalso be limited by available playback files.
Whichever demonstration method is used, demos should begin with a brief description of the softwarefunctionality and its intended user base. A tour of the screen should then be provided with a quickdescription of each screen element, and any particularly interesting pop-ups should be pointed out. It isusually best to present a simple nominal case scenario first to give users an easy case to follow while youpoint out expert system features. This can be followed by failure scenarios that illustrate more advancedexpert system capabilities. Finally, demonstrations are concluded with a few words about future projectwork. Because every demo is a chance to "sell" the software, it is important to provide the most completeview of the application, and look for opportunities for others to contribute to or expand on your work.
82

7.6.2 Organization of the Software to Support Demonstrations
Easy access to the canned demonstration procedures made giving DESSY demos go much moresmoothly. DESSY contains a header with buttons providing various expert system functions. One of thebuttons, labeled "Demos," leads to workspaces with a variety of demonstration choices. Included are thestandard nominal and failure-related scenarios that are typically run, and access to other procedures thatmight become appropriate during the demonstration. These scenarios are in fact the same test cases usedfor knowledge base testing and in the tutorial. They are contained within a simulation module whichmay be optionally loaded along with the rest of the KB. Thus, through careful organization of theknowledge base, the use of test scenarios for a variety of purposes can be optimized.
7.7 The Developer-User Handover
The final stage of expert system development is the handover of the application to the user community.Although this may mark the end of the project life as you have known it, it is only the beginning of thenext project phase--that of software maintenance. Continued open communication between the originaldevelopers and the software maintainers is important for the continued success of the intelligent system.Although the software may no longer primarily be your responsibility, keep in mind that its success stilldepends on your willingness to follow the application through its remaining life cycle and help maintainit when necessary.
The DESSY project is currently in the handover phase. The DESSY developers have met with theindividuals responsible for maintaining the software in the control center environment. Although acompleted product was delivered, there is still additional work to be done. For example, the controlcenter data source is changing and the message logger currently used by the flight controllers is differentfrom that used by DESSY. DESSY will need to be altered to accommodate both these changes, and theDESSY team will be involved. The bottom line is that the software developer's ties to the project are neverentirely eliminated. Being willing to maintain those ties at least in a consulting capacity will give theapplication the greatest chance of success in its new environment.
The traditional waterfall model of software development perpetuates the perception that software can bestatic. A common misconception is that if the requirements can be adequately identified and met, thereshould be no further need to change the software. However, it is unrealistic to presume that anything canremain static. Job responsibilities change over time. Other software supporting the user's jobperformance will change. New hardware and software technology present new opportunities to supporthuman performance even better. Further experience with a software application can reveal oversights inits design. Any of these conditions can result in a need for the application to change. If an applicationcannot be modified gracefully to fit the new requirements, it will need to be replaced by a new one.Continued developer ties with the user communitymake it more likely that the delivered softwareapplication can be modified gracefully to continue good support to the users.
In Section 6.7, the idea of phased certification was introduced, based on experiences with both theDESSY and RMSCO software. In these cases, there will likely be a portion of the software which has beendelivered and a portion which is still under active development. While there is active developmentassociated with a project, the lines of communication remain open so that requirements changes to thedelivered portion can be detected as the user discovers them. This continued communication will helpthe developer to keep the application current so that it continues to support the user's needs.
Because DESSY is in the handover phase, we are likely to learn more about this topic after this documentis published. Consequently, the user may wish to check the World Wide Web (WWW) page whichcontains an updated version of this document. This page is viewable by anyone with an Internetconnection and an html viewer such as Mosaic or Netscape. The address (Uniform Resource Locator, orURL) is
http://tommy.jsc.nasa.gov/~clare/Developers_Guide/
83

References
Bachant, Judith and Soloway, E., "The Engineering of SCON," Communications of the ACM, 32:3, March1989, pp. 311-317.
Chandrasekaran, B. and Punch, W.F. III, "Data Validation During Diagnosis: A Step Beyond TraditionalSensor Validation," Proc. AAAI-87, Seattle, WA.
Chandrasekaran, B. and Punch, W.F. III, "Hierarchical Classification: Its Usefulness for Diagnosis andSensor Validation," IEEE Journal on Selected Areas in Communications, June 1988, pp. 884-891.
CLARE, Control Center Library of Applications for Reuse and Exchange, 1994.
Collins, David, "Payload Deployment and Retrieval System Overview Workbook," PDRS OV 2102, MissionOperations Directorate, Johnson Space Center, Houston, Texas, February, 1988. (JSC internal document)
Cooper, G.F, "The Computational Complexity of Probabilistic Inference Using Bayesian Belief Networks,"Artificial Intelligence 42, 1990.
DeCoste, D, Dynamic Across-Time Measurement Interpretation, Artificial Intelligence 51, 1991.
Dvorak, Daniel, "Expert Systems for Monitoring and Control," AI 87-55, The University of Texas at Austin,Austin, Texas, May, 1987.
Gabrielian, A. and Franklin, M.K., "State-Based Specification of Complex Real-Time Systems," Proceedings,Real-Time Systems Symposium, Huntsville, AL, December 6-8, 1988, pp. 2-11.
Hayes-Roth, F.,Waterman, and Lenat, Building Expert Systems, New York:: Addison-Wesley, 1983.
Hopcroft, John E., et al., Introduction to Automata Theo_, Languages, and Computation, New York:Addison-Wesley, 1979.
Jordan, W., Keller, K., et al, "Software Storming: Combining Rapid Prototyping and KnowledgeEngineering," Computer, May 1989.
Land, Sherry, Malin, J., and Culp, D., "A Monitoring System with Tolerance for Real-Time Data Problems,"Conference on Artificial Intelligence Applications, 1993.
Land, Sherry, Malin, J., and Culp, D., "DESSY: Making a Real-Time Expert System Robust and Useful,"SOAR 1992 [Proceedings of Sixth Annual Space Operations, Applications, and Research Symposium].
Malin, Jane, Schreckenghost, D., et al., "Making Intelligent Systems Team Players: Case Studies and DesignIssues," NASA Technical Memorandum 104738, September 1991.
Malin, Jane, Schreckenghost, Debra, and Thronesbery, Carroll, "Design for Interaction Between Humans andIntelligent Systems During Real-Time Fault Management," Proceedings of Fifth Annual Space Operations,Applications, and Research Symposium, Johnson Space Center, Houston, Texas, July 9-11, 1991.
Marcot, Bruce, "Testing Your Knowledge Base," AI Expert, August 1987, pp. 42-47.
Moore, Robert and Kramer, Mark, "Expert Systems in On-Line Process Control," Lisp Machines, Inc., LosAngeles, California., [198_].
Paasch, R.K. and Agogino, A.M., Automated Diagnosis for the Time of Flight Scintillation Array:Development of a Structural and Behavioral Reasoning System, Proc. 8th CAIA, 1992.
Padalkar, Samir, et. al., "Real-Time Fault Diagnostics," IEEE Expert, June 1991, pp. 75-85.
84

SDRSDTEDisplayDescriptionReports:Displays3582M,1024K,.1030E,3592I,April 8, 1992.[JohnsonSpaceCenterinternalreport.]
Scarl,E.A.,etal..,"DiagnosisandSensorValidationThroughKnowledgeof StructureandFunction,"IEEETrans. Syst. Man Cybern. 17 (3), 1987.
Schreckenghost, Debra, Human-Computer Interface Design Concepts (DESSY blue book), W124, Mitre,Corp., Houston, Texas, July 2, 1990.
Shontz, W.E., et al., Flight Deck Engine Advisor Final Report, NASA Contractor Report 189562, LangleyResearch Center, Hampton, VA., February 1992.
Simpson, William and Sheppard, J., "System Complexity and Integrated Diagnostics," IEEE Design & Test ofComputers, September 1991, pp. 16-30.
Wellman, M.P., "Fundamental Concept of Qualitative Probabilistic Networks," Artificial Intelligence 44,1990.
85


Appendix A
DESSY End Effector Failures


Appendix A
DESSY End Effector Failures
NOMINAL SEQUENCESauto release
auto capturemanual release
manual captureee checkout (capture and release)
EE FLAG FAILURES (inconsistent talkbacks'rigid-derigidclose-opencaptured-openextend-not-derigidextend-rigid
EE CMDS FAILURESrelease with commands alarm
capture with commands alarm(this is the least mature area of ee fault recognition)
UNCOMMANDED RELEASE/CAPTUREuncommanded derigiduncommanded release
manual capture sequence with uncommanded release
AUTO TIMEOUT FAILURES
auto release with derig timeoutauto release with snare timeoutauto release with extend timeoutauto capture with snare timeoutauto capture with rigl timeoutauto capture with rig2 timeoutauto release commanding with no talkback effectsauto capture commanding with no talkback effects
MANUAL TIMEOUT FAILURESmanual release with derig timeoutmanual release with snare timeoutmanual release with extend timeout
manual capture with snare timeoutmanual capture with rigl timeoutmanual capture with rig2 timeout
SEQUENCE VIOLATIONSauto capture without limpauto release with CLOSE ms failed on
capture with auto mode switch failed offcapture with manual mode switch failed offrelease with auto mode switch failed offrelease with manual mode switch failed off
A-1


Appendix B
DESSY Cue Cards


B-1

=:
B-2
C

=O
I,p.(
*wq
o.
O[-
U.]
U.l
ZUJ
_0_
tJ
_o=_
.hi=
6
O o
._-_.1.'-_..-_ O_1 _ _._ o _
B-3
oo
U_
u_
t_,.ol" . O '_
oo_.f,_..
_ge
o o
.__._o=.__
__ .-_;._
l:_,O C_ O R- •
•_.-o o o
o o
.___ _-_
e_ .= e- e" e"
_.'-_ 0 '_ _ _ _
_ _._ ._ ._ _ _ _
o
9m
o _._.._ _ _
_ _-B _--'-_ ,_.
N_ _ _ _ -__.__
al
_._ _

o
u_
r_
o
=
o,4
©
U
_T_
Z
U_
%
%
%
X
X
X
X ]i°
B
I_1_
• !
i.- _' =o _ o o
_ x x_ 6 _
-................_x xx
_= _,_x×_
i_ x _Ix x x_
! x _ x _
_') O:
]3-4

Form ApprovedREPORT DOCUMENTATION PAGE OMB No. 0704-O188
Public reporting burden for this collection of information is estimated to average 1 hour per response, including the time for reviewing instructions, searching existing data sources,
gathering and maintaining the date needed, and completing and reviewing the collection of Information. Send comments regarding this burden estimate or any other aspect of this collection
of information, including suggestions for reducing this burden, to Washington Headquarters Services, Directorate for information Operations arid Reports, 1215 Jefferson Davis Highway,
Suite 1204, Arlington, VA 22202-4302, and to the Office of Management end Budget, Paperwork Reduction Project (0704-018a}, Washington , DC 20503.
1. AGENCY USE ONLY (Leave Blank) 2. REPORT DATE 3. REPORT TYPE AND DATES COVERED
July 1995 Technical Memorandum
4. TITLE AND SUBTITLE 5. FUNDING NUMBERS
A Guide to Developing Intelligent Monitoring Systems
6. AUTHOR(S)
Sherry A. Land; Jane T. Malin; Carroll Thronesbery*; Debra L. Schreckenghost*
7. PERFORMING ORGANIZATION NAME(S) AND ADDRESS(ES)
Lyndon B. Johnson Space Center
Automation, Robotics, and Simulation Division
Houston, Texas 77058
9. SPONSORING/MONITORING AGENCY NAME(S) AND ADDRESS(ES)
National Aeronautics and Space Administration
Washington, D.C. 20546-0001
8. PERFORMING ORGANIZATIONREPORT NUMBERS
S-790
10. SPONSORING/MONITORINGAGENCY REPORT NUMBER
TM-104807
11. SUPPLEMENTARY NOTES
*Metrica Inc., Houston, Texas
12a. DISTRIBUTION/AVAILABILITY STATEMENTUnclassified/Unlimited
Available from the NASA Center for AeroSpace Information (CASI)
800 Elkridge Landing Road
Linthicum Heights, MD 21090-2934
(301) 621-0390 Subject Category: 63
12b. DISTRIBUTION CODE
13. ABSTRACT (Maximum 200 words)
This reference guide for developers of intelligent monitoring systems is based on lessons learned by developers of the DEcision
Support SYstem (DESSY), an expert system that monitors Space Shuttle telemetry data in real time. DESSY makes inferences
about commands, state transitions, and simple failures. It performs failure detection rather than in-depth failure diagnostics. A
listing of rules from DESSY and cue cards from DESSY subsystems are included to give the development community a better
understanding of the selected model system. The G-2 programming tool used in developing DESSY provides an
object-oriented, rule-based environment, but many of the principles in use here can be applied to any type of monitoring
intelligent system. The step-by-step instructions and examples given for each stage of development are in G-2, but can be used
with other development tools. This guide first defines the authors' concept of real-time monitoring systems, then tells
prospective developers how to determine system requirements, how to build the system through a combined
design/development process, and how to solve problems involved in working with real-time data. It explains the relationships
among operational prototyping, software evolution, and the user interface. It also explains methods of testing, verification, and
validation. It includes suggestions for preparing reference documentation and training users.
14. SUBJECT TERMS
Expert Systems, Artificial Intelligence, Computer Systems Programs, Monitors, Real
Time Operation, Manuals
17. SECURITY CLASSIFICATION 18. SECURITY CLASSIFICATIONOF REPORT OF THIS PAGE
Unclassified Unclassified Unclassified
NSN 7540-01-280-5500
15. NUMBER OF PAGES103
16. PRICE CODE
19. SECURITY CLASSIFICATION 20. LIMITATION OF ABSTRACTOF ABSTRACT
Standard Form 298 (Rev 2-89)Prescribed by ANSI Std. 239-18
298-102