Making health service work for the poor: incentives for strengthening health systems performance
32
World Health Organization Making health service work for the poor: incentives for strengthening health systems performance Berlin, 8-10 July 2002 Orvill Adams Director, Department of Health Service Provision Evidence and Information for Health Policy
-
Upload
prunella-ronny -
Category
Documents
-
view
17 -
download
0
description
Making health service work for the poor: incentives for strengthening health systems performance. Berlin, 8-10 July 2002 Orvill Adams Director, Department of Health Service Provision Evidence and Information for Health Policy. Overview. Policy makers and the public need information - PowerPoint PPT Presentation
Transcript of Making health service work for the poor: incentives for strengthening health systems performance

World Health Organization
Making health service work for the poor:incentives for strengthening health systems
performance
Berlin, 8-10 July 2002
Orvill AdamsDirector, Department of Health Service Provision
Evidence and Information for Health Policy

World Health Organization
Overview
• Policy makers and the public need information
– New data sources– New indicators and measures
• Service provision needs to be more efficient
– through information & accountability– through direct incentives

World Health Organization
What policy makers need to know
• Identification of the population at risk - the poor
• Health conditions of the poor
• Degree to which interventions are reaching the poor
• information on provider characteristics and costs

World Health Organization
WHO response
• Populations surveys, DHS, LSMS
• World health survey - 91 plus countries, rolling out to 191 over 3 years
• CHOICE
– WHO initiative to provide evidence on the effectiveness and costs of major health interventions for 17 sub-regions of the world
– Cost-effectiveness information can be used to identify the allocatively efficient set of interventions
World Health Organization
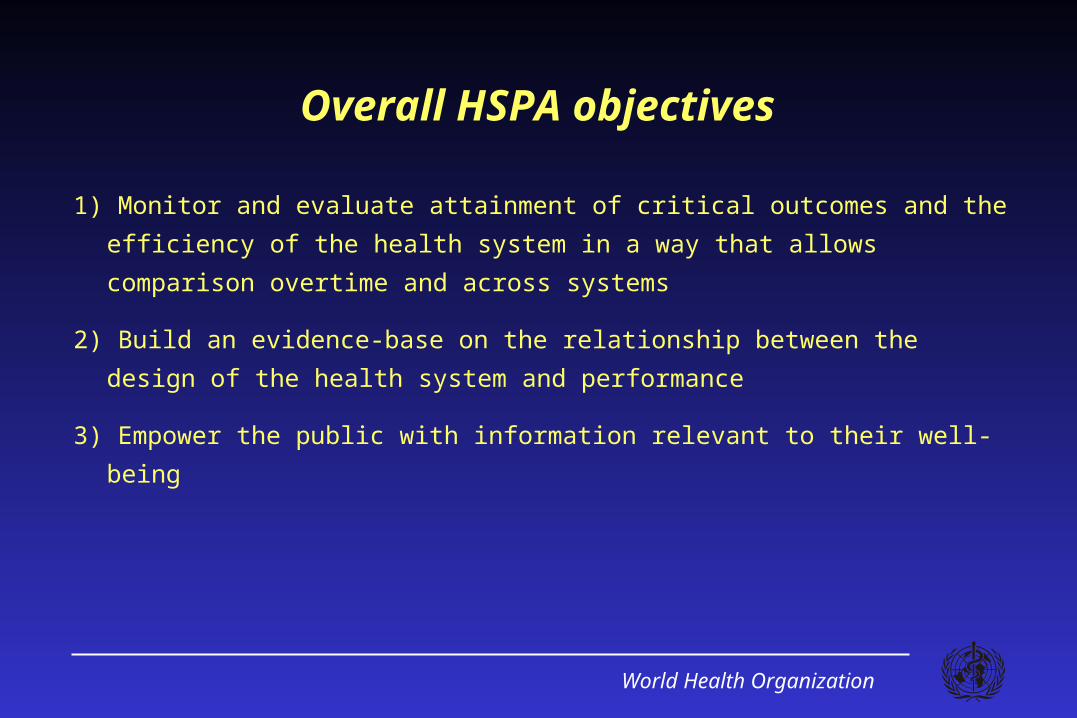
Overall HSPA objectives
1) Monitor and evaluate attainment of critical outcomes and the efficiency of the
health system in a way that allows comparison overtime and across systems
2) Build an evidence-base on the relationship between the design of the health
system and performance
3) Empower the public with information relevant to their well-being

World Health Organization
Health system goals
Health Health
ResponsivenessResponsiveness
Financial ContributionFinancial Contribution
LevelLevel DistributionDistribution
QualityQuality EquityEquity
Efficien
cyE
fficiency

World Health Organization
WHO world health survey CORE modules
Modules– Health ( description & valuation)– Health system responsiveness– Health financing and expenditure– Adult mortality – Risk factors and chronic diseases – Assets
Modules (continued)– Coverage key interventions– Provider survey (under
development)
• Based on scientific review of existing instruments • Developed through:
– Cognitive interviews & cultural applicability tests – Reliability - stability of application– Cross-population comparability
Flexible shell:Flexible shell: additional modules could be added by countries as needed additional modules could be added by countries as needed

World Health Organization
Coverage interventions
• Maternal care - antenatal care, attended delivery
• Child health - immunization
• Prevention of STI and HIV/AIDS
• Malaria and TB
• HIV/AIDS - mother-to child transmission, ARV treatment, chronic care
• Chronic conditions - angina, epilepsy, asthma, depression, diabetes, arthritis
• Cancer screening, vision and hearing, road traffic injuries
• Water and sanitation

World Health Organization
Definition of effective coverage
The probability of receiving a necessary health The probability of receiving a necessary health
intervention conditional on the presence of a intervention conditional on the presence of a
health care needhealth care need
The probability of receiving a necessary health The probability of receiving a necessary health
intervention conditional on the presence of a intervention conditional on the presence of a
health care needhealth care need

World Health Organization
Provider characteristics and provider surveys
• Indicators of this instrumental goal (linked to intrinsic goals)
• National health accounts - basic and detailed matrices (type of care, type of provider, service)
• Facility surveys - including aspects of responsiveness, fairness in financing, human resources, provider performance assessment, burden of disease

World Health Organization
Health inequalities: Ghana
Child health inequalities in Ghana
0.005.00
10.0015.0020.0025.0030.0035.0040.00
U2MR 1
994
U2MR 1
997
No vacin
ation
s 19
94
No vacin
ation
s 19
97
No ant
enat
al ca
re 1
994
No ant
enat
al ca
re 1
997
%
poorest quintile second third fourth richest quintile
Maternal health inequalities in Ghana
0.00
10.0020.00
30.0040.00
50.0060.00
70.00
% unattended births1994
% unattended births1997
poorest quintile second third
fourth richest quintile

World Health Organization
Health inequalities: Indonesia
Maternal health inequalities in Indonesia
0.00
20.00
40.00
60.00
80.00
100.00
% unattended births 1994 % unattended births 1997
poorest quintile second third fourth richest quintile
Child health inequalities in Indonesia
0.005.00
10.0015.0020.0025.0030.0035.0040.0045.0050.00
U2MR 1
994
U2MR 1
997
No vacin
ation
s 19
94
No vacin
ation
s 19
97
No ant
enat
al ca
re 1
994
No ant
enat
al ca
re 1
997
%
poorest quintile second third fourth richest quintile

World Health Organization
Decomposition of inequality index
0.0
0.1
0.2
0.3
0.4
0.5
0.6
0.7
Para
guay
Com
oro
s
Peru
Guate
mala
Dom
Rep
Zim
babw
e
Boliv
ia
Benin
Moro
cco
Eritr
ea
Bangla
desh
Uganda
Kenya
Ghana
Burk
ina
Colo
mbia
Haiti
Nepal
Nam
ibia
Indonesia
Yem
en
Bra
zil
Uzbekis
tan
Pakis
tan
Egypt
Rw
anda
Mali
Nig
eria
Mozam
biq
ue
Cote
Zam
bia
Mala
wi
Centr
al A
fr
Ineq
uali
ty i
nd
ex
Ineq. in perm income Ineq in education Ineq in hth system access Increasing hth system access Unaccounted variation

World Health Organization
Service provision needs to be more efficient
• Through better information & accountability
• Through direct incentives

World Health Organization
Why don’t the poor have access to health services?
• The public sector fails:
– Lack of resources?
– Low efficiency?
– Political biased allocation of resources?
• The private sector fails:
– Unequal income distribution and lack of “effective demand”
– Imperfect markets

World Health Organization
Inefficient resource allocation: Ratio of nurses to doctors in L.A. and Caribbean
0
1
2
3
4
5
En
ferm
ero
s p
or
1.00
0 in
hab
ita
nte
s
0 1 2 3 Médicos por 1.000 inhabitantes
Guyana
Argentina
Jamaica Costa Rica
Panama
UruguayNicaragua Chile
Haiti Brazil
Barbados
El SalvadorDominican Republic
HondurasBoliviaMexico Colombia
Guatemala
Trinidad & Tobago
Venezuela
Surinam
Paraguay
Ecuador
Peru
3 nurses per doctor in N. America
Source: PAHO, 1998

World Health Organization
Infa
nt
Mo
rta
lity
(pe
r 1,
000
bir
ths
)
Public Health Expenditure ($PPP/person)20.00 200.00 2000.00
15
75
150
DZA
AGO
ARG
AUSAUT
AZE
BGD
BLR
BEL
BEN
BOL
BRA
BGR
BFABDIKHM
CMR
CAN
TCD
CHL
CHN
COL
CIV
CUBCZE
PRK
DNK
DOM
ECU
EGY
SLV
ETH
FIN
FRA
GEO
DEU
GHA
GRC
GTM
GIN
HTI
HND
HUN
IND
IDN
IRN
IRQ
ISRITA
JPN
KAZ
KEN
LAO
LBY
MDG
MWI
MYS
MLI
MEX
MAR
MOZ
MMR NPL
NLD
NER
NGAPAK
PRY
PERPHL
POL
PRT
KOR
ROMRUS
SAU
SEN
SVK
ZAF
ESP
LKA
SDN
SWE
CHE
SYRTJKTHA
TUN
TUR
UGA
UKR
GBR
TZA
USA
UZBVEN
VNM
YEMZMB
ZWE
Note: For countries with population > 5 millionSource: WHO
Infant mortality varies across countriesthat spend similar amounts on health

World Health Organization
GDP Per Capita (ppp$)
10000 20000 30000 40000
0
20
40
60
80
100
Regression Line
Ou
t-of
-poc
ket
sh
are
of h
ealt
h s
pen
ding
(%
)
Out-of-pocket share declines with income

World Health Organization
HF
C
0
.2
.4
.6
.8
1
1 2 3 4 5 6 7 8 9 10
Burundi
HF
C
0
.2
.4
.6
.8
1
1 2 3 4 5 6 7 8 9 10
Latvia
HF
C Expenditure decile
0
.2
.4
.6
.8
1
1 2 3 4 5 6 7 8 9 10
Romania

World Health Organization
Why is efficiency of health services important?
• Reduces the amount of public services that can be provided
• Reduces the quality of public services
• Leads to inequities in service provision
• Lowers productivity
• Reduces international competitiveness

World Health Organization
Sources of inefficiency: the agency problem
Principal and agent:
• Different objectives
• Different information
• Cost of restructuring is high
• Efficient contracts are hard to find

World Health Organization
Approaches to the agency problem
• Non-pecuniary motivation
• Pay for output
• Pay by effort
• Fixed payments and agent assumes risk
• Is it enough?
• Can you precisely define outputs?
• Is effort measurable?
• Can you accept bankruptcies and overpayments?
World Health Organization
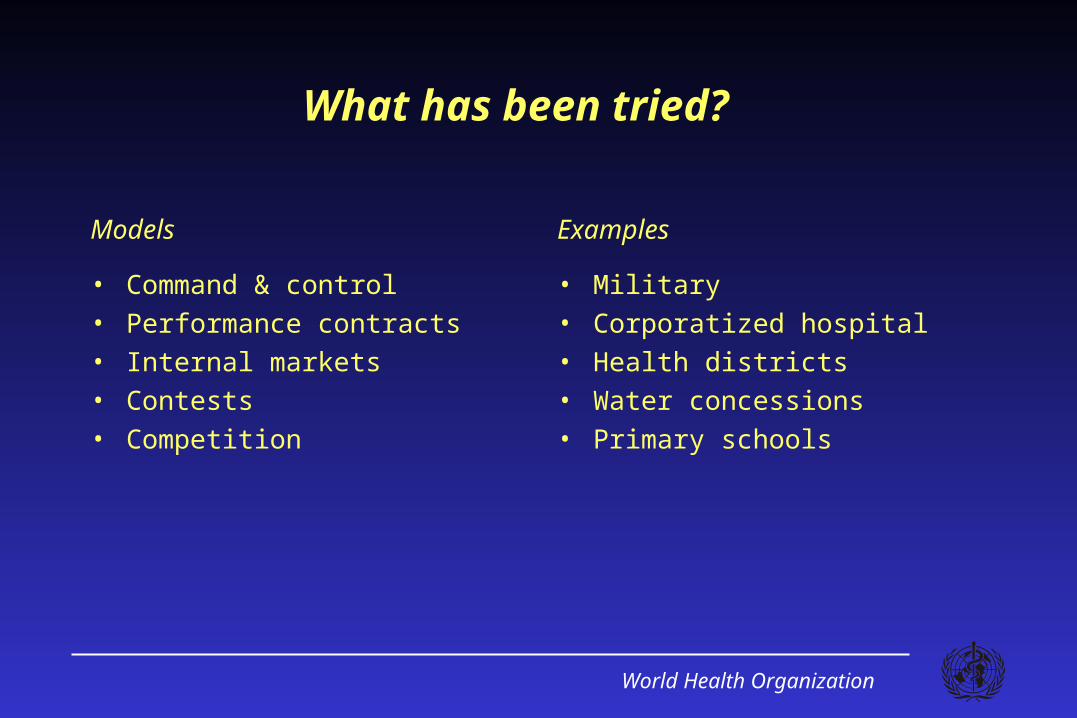
What has been tried?
Models
• Command & control• Performance contracts• Internal markets• Contests• Competition
Examples
• Military• Corporatized hospital• Health districts• Water concessions • Primary schools

World Health Organization
Typically in the private sector . . .
• Non-pecuniary motivation
• Pay for output
• Pay by “effort”
• Fixed payments and agent assumes risk
• “Team players” & awards
• Only for piecework
• Salaried workers
• Contractors

World Health Organization
Typically in the public sector . . .
• Motivation and vocation may be difficult to achieve at a large scale
• Limited managerial discretion over workforce
• Measurement of outputs is difficult

World Health Organization
Health systems have the problems of markets . . .
Down side:
• Moral hazards
• Administrative and marketing costs
• Difficulty mobilizing public resources
• Variable quality
Potentially:
• Incentives for good performance
• Attention to consumer
• Incentive to collect
• Accommodation of differences among population groups

World Health Organization
. . . and problems of bureaucracies
Down side:
• Inefficient allocations that raise costs
• Lack of transparency
• Restricted managerial discretion
• Unresponsive to clients
Potentially:
• National planning
• Easier to be redistributive
• Potentially lower administrative costs
• “Fair”

World Health Organization
Improving health services for the poor through incentives
• Purchasing insurance coverage: Colombia
• Rewarding performance: Haiti
• Incentives for staff: Kenya

World Health Organization
Coverage expanded especially among the poorin Colombia
0
5
10
15
20
25
30
1990 1995 1997 2000
Aff
ilia
tes
(m
illi
on
s)
Contributors
Subsidized
Fuente: Sanchez, 2000

World Health Organization
0
10
20
30
40
50
60
70
80
90
Immunization 3+ prenatal FP discontin. ORT Correct ORT 4+ FP available
Baseline
ResultTarget
Results of active purchasing: NGO in Haiti
Source: R. Eichler, “Strategic Purchasing in Haiti to Improve Health”, EUROLAC Case Study, World Bank, 2002.
World Health Organization
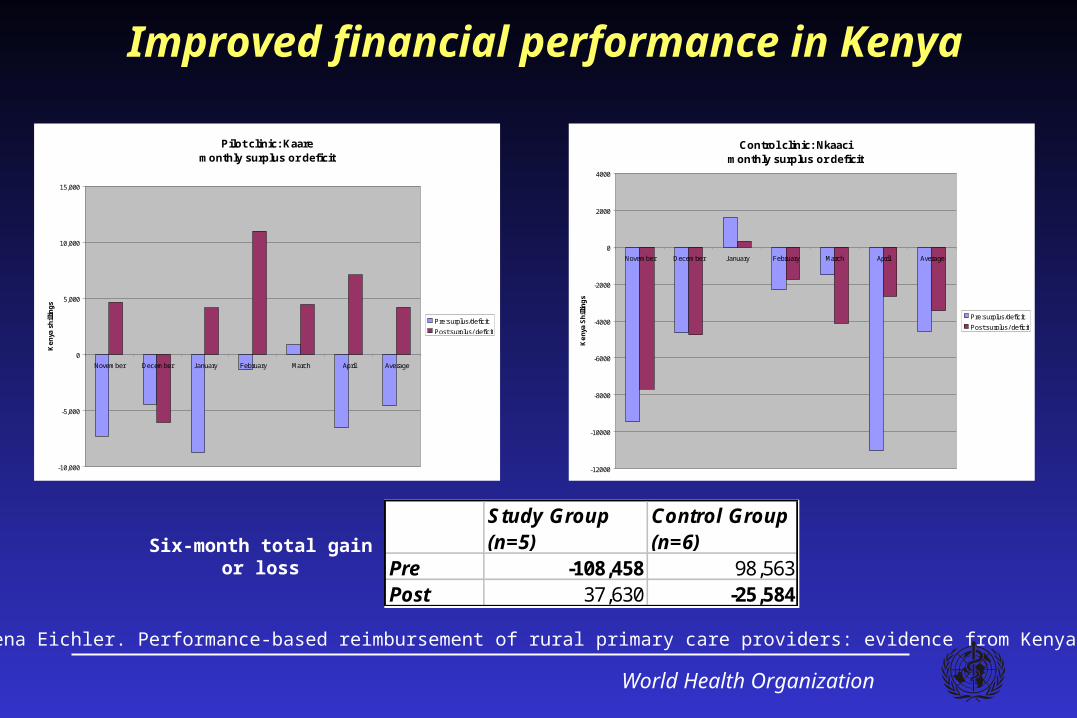
Improved financial performance in Kenya
Pilot clinic: Kaaremonthly surplus or deficit
-10,000
-5,000
0
5,000
10,000
15,000
November December January February March April Average
Ke
nya
sh
illin
gs
Pre:surplus/deficit
Post:surplus/ deficit
Control clinic: Nkaacimonthly surplus or deficit
-12000
-10000
-8000
-6000
-4000
-2000
0
2000
4000
November December January February March April Average
Ke
nya
Sh
illin
gs
Pre:surplus/deficit
Post:surplus/ deficit
Source: Rena Eichler. Performance-based reimbursement of rural primary care providers: evidence from Kenya
Study Group (n=5)
Control Group (n=6)
Pre -108,458 98,563Post 37,630 -25,584
Six-month total gain or loss

World Health Organization
Conclusion
• When health services are inefficient the poor suffer disproportionately
• Incentives (external and internal) have been shown to work
• WHO programs will provided information need by decision makers