Strengthening Capacity for Monitoring - World...
52
Transcript of Strengthening Capacity for Monitoring - World...
Strengthening Capacity for Monitoringand Evaluation In Uganda:
A Results Based ManagementPerspective
ECD Working Paper Series ♦ No. 8
Arild Hauge
� � � � � � � � � � � � � � � � � � � � � � � � � � � � � � � � � �
Improvingmonitoring andevaluationsystems inUganda wouldhelp thegovernment totranslate itspublic sectorreforms intogreater povertyreduction.Planning,budgeting, andincentiveswould bestrengthened bya focus onpovertyoutcomes,impacts, andgoals ratherthan onrecordinginputs,activities, orimmediateoutputs.
January 2001The World BankWashington, D.C. www.worldbank.org/html/oed

Copyright 2001Operations Evaluation DepartmentPartnerships & Knowledge Programs (OEDPK)Email: [email protected]: [email protected]: 202-473-4497Facsimile: 202-522-3125
Evaluation Capacity Development (ECD) helps build sound governance in countries—improvingtransparency and building a performance culture within governments to support better managementand policymaking, including the budget process—through support for the creation or strengtheningof national/sectoral monitoring and evaluation systems. OED aims to identify and develop good-practice approaches in countries, and to share the growing body of experience with ECD efforts.
The OED Working Paper series disseminates the findings of work in progress to encourage theexchange of ideas about enhancing development effectiveness through evaluation. An objective of theseries is to get the findings out quickly, even if the presentations are somewhat informal. The paperscarry the names of the authors and should be cited accordingly.
The findings, interpretations, opinions, and conclusions expressed in this paper are entirely those of theauthors. They do not necessarily represent the views of the Operations Evaluation Department or anyother unit of the World Bank, its Executive Directors, or the countries they represent.
iii
CONTENTS
Foreword v
List of Abbreviations vi
Executive Summary vii
1.0 Introduction: Defining the conceptual perspective 1
2.0 Overview of Existing M&E Arrangements 4
2.1 Context of development planning and management 42.2 Overall M&E coordination 62.3 Overall PEAP goals and targets 82.4 Poverty monitoring 92.5 PAF monitoring 102.6 Civil society role 122.7 Donor Monitoring and Evaluation activities 132.8 M&E training and capacity development 14
3.0 Strategic Directions for M&E Development 16
3.1 Coordination and harmonization 163.2 Clarity of development goals, targets and performance indicators 173.3 Incentives for contribution to results 183.4 Devolution of managerial autonomy 193.5 Role of civil society in enforcing transparency and accountability 203.6 PEAP partnerships principles 203.7 Skills and training 21
4.0 NEXT STEPS 24
4.1 Refinement of PEAP goals and targets 244.2 Continuous monitoring of service delivery 244.3 Expand scope of reporting harmonization 254.4 Finalization of poverty monitoring strategy 254.5 Identify and disseminate “good practice” approaches to M&E 25
Annex 1: Context of Development Planning and Management 26
A: PEAP as national development framework 26B: Budget process 26C: Sector planning 28D: Decentralized service delivery 29E: External assistance 30F: Accountability institutions 31G: Public service management and reform initiatives 32

iv
Annex 2: PEAP Goals and Targets 34
Annex 3: External Assistance 37
Annex 4: Note on methodology and people met 38

v
FOREWORD
The Operations Evaluation Department (OED) of the World Bank has a long-standing program of supportto strengthen monitoring and evaluation (M&E) capacities in developing countries, as an important part ofsound governance. In providing this support, OED works closely with the Bank’s operational areas, withgovernments and with other donors. African countries assisted under this program in recent years includeGhana and Benin.
This report on Uganda has been prepared in response to a request from the national authorities that theWorld Bank assist in reviewing opportunities for strengthening of M&E functions. The governmentappreciates that strengthening its systems for M&E will assist its preparation of Poverty ReductionStrategies and its budget decision-making and prioritization processes. It will also strengthen managementof government activities within ministries and in local governments, and will support accountabilityrelationships with civil society, the parliament and others.
With the strong support of the Bank’s Africa Region, two missions to Uganda were undertaken, in Apriland October 2000, during which workshops and meetings were held with a number of senior officials,NGOs, academics and donors. A draft version of this report was presented to a brainstorming workshop forsenior officials, and to a separate workshop for civil society. These workshops provided a valuableopportunity for feedback and further refinement of the analysis and priority actions identified forstrengthening M&E functions.
The analysis in this report is intended to provide a strategic framework for GOU to address and debate, in aholistic and systemic manner, the entire range of decision making processes and institutionalresponsibilities from which M&E requirements and practices emanate. Development efforts ultimately onlywork when founded on local needs, perceptions and institutional realities. The development of M&E needsto encompass the views, experiences and perspectives of senior GOU officials and other stakeholders,including civil society, the private sector and other donors.
The report was prepared by Arild Hauge, and the task manager was Keith Mackay (OED). The strongsupport of Ritva Reinikka and Denyse Morin, of the Bank’s Africa region, has been very valuable.
Osvaldo Feinstein Manager
Partnerships and Knowledge Programs, OEDPK
vi
ABBREVIATIONS
ACBF - African Capacity Building FoundationAfDB - African Development BankAG - Auditor GeneralAIDS - Acquired Immune Deficiency SyndromeBFP - Budget Framework PaperCAO - Chief Administrative OfficerCAS - (World Bank) country assistance strategyCBMIS - Community-based Management
Information SystemCCS - Commitment Control SystemCDF - Comprehensive Development FrameworkCG - Consultative GroupCIDA - Canadian International Development AgencyDAC - Development Assistance Committee of OECDDDP - District Development PlanDREPS - District resource endowment profilesECD - Evaluation capacity developmentEPRC - Economic Policy Research CentreESIP - Education Strategic Investment ProgrammeEU - European UnionFMS - Financial Management SystemFY - Fiscal yearGOU - Government of UgandaHDR - Human Development ReportHIPC - Highly Indebted Poor CountryIDA - International Development AssociationIGG - Inspector General of GovernmentIMF - International Monetary FundIMR - Infant Mortality RateLG - Local GovernmentLGDP - Local Government Development ProgrammeLGBFP - Local Government Budget Framework PaperLGFC - Local Government Finance CommissionLTEF - Long term expenditure frameworkMAAIF - Ministry of Agriculture, Animal Industry And FisheriesM&E - Monitoring and evaluationMECD - Monitoring & evaluation capacity developmentMEI - Ministry of Ethics and IntegrityMAAIF - Ministry of Agriculture, Animal
Husbandry and FisheriesMEI - Ministry of Ethics and IntegrityMES - Ministry of Education and SportsMFPED - Ministry of Finance, Economic
Planning and DevelopmentMGLSD - Ministry of Gender, Labour and Social DevelopmentMIS - Management Information SystemMISR - Makerere Institute of Social ResearchMLWE - Ministry of Lands, Water and EnvironmentMMR - Maternal Mortality RateMLG - Ministry of Local Government
MPS - Ministry of Public ServiceMTEF - Medium Term Expenditure FrameworkMWHC - Ministry of Works, Housing and CommunicationsNAT - National Assessment TeamsNEMA - National Environmental Management AuthorityNGO - Non Government OrganizationNHDR - National Human Development ReportNIS - National Integrity SurveyNIVES - National Integrity Values and Ethical StandardsNPA - National Planning AuthorityNSDS - National Service Delivery SurveyOAG - Office of the Auditor GeneralOECD - Organisation for Economic Co-operation and DevelopmentOED - Operations Evaluation DepartmentOOB - Output oriented budgetingOP - Office of the PresidentOPM - Office of the Prime MinisterOVP - Office of the Vice PresidentPAC - Public Accounts CommitteePAF - Poverty Action FundPEAP - Poverty Eradication Action PlanPHC - Primary Health CarePFP - Policy Framework PaperPIP - Public Investment ProgrammePMAU - Poverty Monitoring and Analysis UnitPPA - Priority Programme AreasPRSC - Poverty Reduction Support CreditPRSP - Poverty reduction strategy paperPS - Permanent SecretaryPSC - Public Service CommissionPSRCC - Public Service Reform Coordinating CommitteePSRRC - Public Service Review and
Reorganization CommissionPSRP - Public sector reform programmeRBM - Results-based ManagementROM - Results oriented managementSDC - Swiss Development CooperationSDU - Service Delivery UnitSIDA - Swedish International Development AgencySWG - Sector working groupTA - Technical assistanceUBOS - Uganda Bureau of StatisticsUDN - Uganda Debt NetworkULAA - Uganda Local Authorities AssociationUPE - Universal primary educationUPPA - Uganda Participatory Poverty AssessmentUSAID - U.S. Agency for International DevelopmentUshs - Uganda ShillingsWB - World BankWBI - World Bank Institute
vii
EXECUTIVE SUMMARY
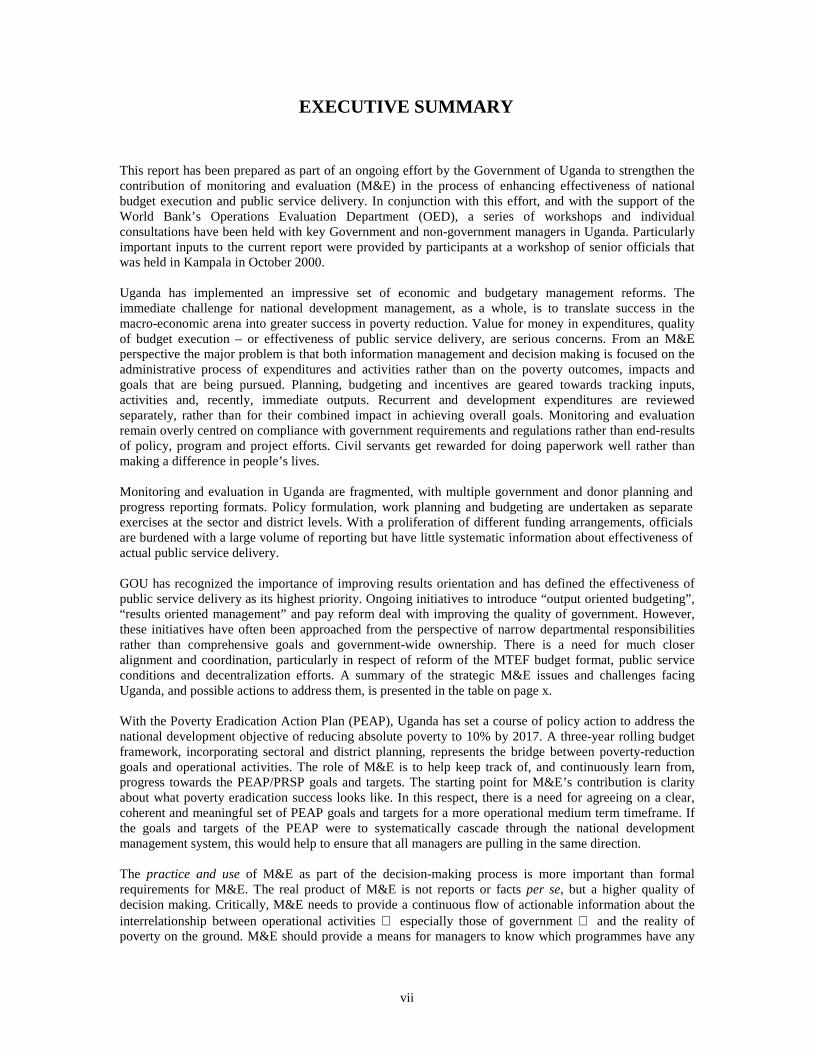
This report has been prepared as part of an ongoing effort by the Government of Uganda to strengthen thecontribution of monitoring and evaluation (M&E) in the process of enhancing effectiveness of nationalbudget execution and public service delivery. In conjunction with this effort, and with the support of theWorld Bank’s Operations Evaluation Department (OED), a series of workshops and individualconsultations have been held with key Government and non-government managers in Uganda. Particularlyimportant inputs to the current report were provided by participants at a workshop of senior officials thatwas held in Kampala in October 2000.
Uganda has implemented an impressive set of economic and budgetary management reforms. Theimmediate challenge for national development management, as a whole, is to translate success in themacro-economic arena into greater success in poverty reduction. Value for money in expenditures, qualityof budget execution – or effectiveness of public service delivery, are serious concerns. From an M&Eperspective the major problem is that both information management and decision making is focused on theadministrative process of expenditures and activities rather than on the poverty outcomes, impacts andgoals that are being pursued. Planning, budgeting and incentives are geared towards tracking inputs,activities and, recently, immediate outputs. Recurrent and development expenditures are reviewedseparately, rather than for their combined impact in achieving overall goals. Monitoring and evaluationremain overly centred on compliance with government requirements and regulations rather than end-resultsof policy, program and project efforts. Civil servants get rewarded for doing paperwork well rather thanmaking a difference in people’s lives.
Monitoring and evaluation in Uganda are fragmented, with multiple government and donor planning andprogress reporting formats. Policy formulation, work planning and budgeting are undertaken as separateexercises at the sector and district levels. With a proliferation of different funding arrangements, officialsare burdened with a large volume of reporting but have little systematic information about effectiveness ofactual public service delivery.
GOU has recognized the importance of improving results orientation and has defined the effectiveness ofpublic service delivery as its highest priority. Ongoing initiatives to introduce “output oriented budgeting”,“results oriented management” and pay reform deal with improving the quality of government. However,these initiatives have often been approached from the perspective of narrow departmental responsibilitiesrather than comprehensive goals and government-wide ownership. There is a need for much closeralignment and coordination, particularly in respect of reform of the MTEF budget format, public serviceconditions and decentralization efforts. A summary of the strategic M&E issues and challenges facingUganda, and possible actions to address them, is presented in the table on page x.
With the Poverty Eradication Action Plan (PEAP), Uganda has set a course of policy action to address thenational development objective of reducing absolute poverty to 10% by 2017. A three-year rolling budgetframework, incorporating sectoral and district planning, represents the bridge between poverty-reductiongoals and operational activities. The role of M&E is to help keep track of, and continuously learn from,progress towards the PEAP/PRSP goals and targets. The starting point for M&E’s contribution is clarityabout what poverty eradication success looks like. In this respect, there is a need for agreeing on a clear,coherent and meaningful set of PEAP goals and targets for a more operational medium term timeframe. Ifthe goals and targets of the PEAP were to systematically cascade through the national developmentmanagement system, this would help to ensure that all managers are pulling in the same direction.
The practice and use of M&E as part of the decision-making process is more important than formalrequirements for M&E. The real product of M&E is not reports or facts per se, but a higher quality ofdecision making. Critically, M&E needs to provide a continuous flow of actionable information about theinterrelationship between operational activities especially those of government and the reality ofpoverty on the ground. M&E should provide a means for managers to know which programmes have any
viii
discernable impact upon poverty and those that don’t; monitor changes in the environmental or non-programme factors that also have a bearing upon poverty; and help guide changes in programme strategy ordesign of new interventions.
In Uganda, social and economic change is currently monitored by a range of institutions andmethodologies, without sufficient attention to the link between public service delivery efforts on the onehand and poverty eradication outcomes on the other. The establishment of a poverty monitoring networkand steering committee, and the drafting of a national poverty monitoring strategy, represents an importantstep towards coordination and focus in poverty monitoring. Harmonization of different project progressreporting formats has also been initiated, and represents a potentially substantial resource saving for GOU.Under the Poverty Action Fund, there are eleven separate work planning and reporting schemes underformulation. A wide range of institutions is involved in inspection and audit, but there is insufficientcoordination of visits, reporting and follow-up.
A major challenge of institutional and human resource capacity development remains for Uganda toimplement its decentralization programme. Responsibility for service delivery is gradually beingdecentralized to districts and frontline service providers, but the center still consumes the bulk of resourcesand retains control of expenditure patterns. The current modus operandi of the poverty action fund, underwhich strong central control is exercised over conditional grants to the districts, undermines the ability ofdecentralized service providers to tailor their actions to the nature of local demands. The devolution ofmanagerial responsibility needs to be accompanied by establishment of M&E capacities at the district, sub-district and frontline service provider levels.
With clarity and consensus about goals and expectations as its starting point, M&E can be a vehicle forbuilding partnerships within Government and between Government, civil society and external cooperationpartners. M&E can improve stakeholder communication and can help in building agreement on desirablepoverty reduction outcomes and strategies. Uganda has taken a number of commendable steps to increasetransparency and consultation in the budget process. The sector working groups that prepare budgetframework papers bring together central and line ministries, civil society and donors. Decisions aboutfunding allocations are widely disseminated, including use of the media and public notice boards. However,much remains in stimulating transparency in terms of feedback from public service users. Ministerialmanagement information systems still cannot provide systematic service delivery records. There is also anopportunity to harness Uganda’s pilot status within the CDF initiative to elicit donor support for closeralignment of their activities to the PEAP and for development of a unified, national M&E system.
GOU has recognized the importance of strengthening of M&E. Making headway will necessarily be anongoing and long-term process of awareness building, institutional liaison, systems adjustment and skillsformation. It will require policy consultations and operational action on several fronts. The most criticalshort-term actions that can help in developing M&E would include:
Refinement of PEAP goals and targets: Sectoral planning and management efforts need to be guided by aclear and consistent set of medium-term goals and targets. PEAP’s long-term (year 2017) goal should bebroken down to measures of poverty eradication success in e.g. 2002, 2005 and 2010.
Continuous monitoring of service delivery: It is critical that the current national service delivery surveynot be approached as “yet another study” primarily to be digested by academics. Rather, the survey findingsmust be utilized to establish a base line, goals and targets for service reach and client satisfaction that are,in turn, used to inform work planning, budgeting and managerial performance assessment.
Expand scope of reporting harmonization: The mandate for current efforts to define a uniform format forproject progress reporting should be expanded to encompass harmonization of reporting pertaining tobroader sector and poverty programmes. A further item of harmonization would be donor M&Earrangements, as articulated in the proposed CDF/PEAP partnership principles.
Finalization of poverty monitoring strategy: Ongoing efforts to draft a national poverty monitoringstrategy represent an important opportunity for bringing closure to existing uncertainties regarding the

ix
objectives, roles and responsibilities for M&E. MFPED appears as the logical champion of the necessarytask of bringing alignment, coherence and synergy to Uganda’s approach to results management and M&Einitiatives and activities.
Identification and dissemination of “good practice” approaches to M&E: Uganda already has a numberof activities and initiatives that broadly address the M&E concerns raised by this report. It would be usefulto actively seek out and promote individual practices and instruments, among those that exist at the sector,district and facility levels, that appear to best fit Uganda’s overall development management needs.

x
Summary of Strategic Issues, Challenges and Possible ActionsOverallM&ETask
Monitor & provide feedback on progress in poverty alleviation
StrategicM&EIssues
1. Coordinationandharmonization
2. Developmentgoals, targetsandperformanceindicators
3. Incentives forcontribution toresults
4. Devolutionof managerialautonomy
5. Role of civilsociety inenforcingtransparencyandaccountability
6. PEAPpartnershipsprinciples
7. M&E skillstraining
Positiveelements inUganda
* Draft PovertyMonitoringStrategy* Sector WorkingGroups (SWG) asnexus of planning,budgeting* Efforts toharmonize projectprogress reporting* Earmarking of5% of PAF fundsfor ‘monitoring &accountability’
* PEAP/PRSP asoverall frameworkof poverty priorities* Training in ROM(results orientedmanagement) beingpiloted* “Indicator retreat”as part of budgetcycle
* Recognition ofservice deliveryeffectiveness asimperative of publicmanagement* National ServiceDelivery Survey2000
* Decentralizedresponsibility forservice delivery* Introduction ofoutput orientedbudgeting (OOB)* Comprehensivedistrict plans* LGDP capacitydevelopment
* Consultativenature of PEAPprocess* Transparency ofbudget process* Practice of publicnotices* Significantcapacity of NGO’s* Government/ civilsociety dialogue atcentral level
* Draft/CDFpartnershipprinciples* Trend towardsbudget support* Consultativegroup meetingbeing scheduledas part of budgetcycle
* Awareness ofM&E importance* Availability oflocal researchers;local academicand trainingtraditions
Somechallengesbeing en-countered
* Separateplanning andreporting formatsfor differentfunding sources* Sector/districtpolicies, budgetsworkplansapproached asseparate exercises* Alignment andcoordination ofdifferent resultsmanagementinitiatives* 1/3 of ODA isTA outside ofGovernmentbudget
* Inconsistency inclarity of goals atsector level* PEAP goalscorrespond toministerial activitiesrather than povertyoutcomes* Few goals aredefined withmeasurabletimeframe, baselineand targets* Weak linkagebetween sectoraland district goals
* Performanceassessed in terms ofexpenditure andbureaucraticactivity* Weak linkagebetween resourceallocation andperformance* Rewards gearedto good paper-work* Inconsistentenforcement ofsanctions for poorperformance*corruption largelyunpunished?
* Generally weakmanagementcapacities at locallevels* Prescribedspending ratios ofconditional grantscheme giveslittle flexibilityfor managers toadapt to localneeds* Number andlevel of postsdirected from thecenter
* Need forimprovedstakeholderconsultation inpriority-setting* 1/3 of ODA is TAoutside ofGovernmentbudgets and M&Epractices* GOU/NGOdialogue at centernot mirrored atlocal levels
* 1/3 of ODA isTA outside ofGovernmentbudgets andM&E* Nearly 300stand-aloneprojects remain* Twentyseparate annualprogrammereviews* Local donorscannot departfrom corporateM&E guidelines
* Weakmanagementskills at LGlevels* Likely increasein demand formanagement andconduct of M&Edealing withinter-relationshipbetween servicedelivery andpoverty outcomes
Possibleactions toaddresschallenges
* Identification ofan M&E championministry/agency* Establishment of‘core M&E’arrangements (suchas via a formalM&E framework),harmonization ofterminology,reporting formatsand periodicity* Improvedcoordinationbetween inspectionand audit agencies
* Cascading ofPEAP goals andtargets throughplanning, budgetingand work planningat sector, districtand facility levels* LTEF focus ondefining medium-term PEAP goals &targets
* Introduction ofreach and outcomesas yardstick ofsuccess andperformance reward* Use of NSDS asbarometer of clientsatisfactionimprovements* Introduce valuefor money concernsin Finance Act*introduction ofclient servicecharters
* Allow greaterlocal autonomyover recruitment,salaries and non-wageexpenditures*Ensure strongerlocal oversight asthe quid pro quo*Introduction ofparticipatoryM&E practices askey managementfunction
* Extendtransparencypractice fromallocation toexecution* Client‘Reportcards’ ascomplement toNSDS* Make NGO’seligible for PAF‘monitoring &accountability’funding*introduction ofclient servicecharters
* Leverage ofdonor support forCDF and PEAPto increasesynergy inplanning,reporting &review* PRSC policymatrix as jointplanning &reviewmechanism
* Strengthenlocal capacity forprogrammeevaluation skillstraining, e.g. viatraining-of –trainers atnationalinstitutions* Coordinateduse of fundingearmarked forM&E underPAF, LGDP andEFMPII* Establishmentof nationalevaluationassociation

1
1. INTRODUCTION: DEFINING THE CONCEPTUALPERSPECTIVE
The results based management perspective to national monitoring and evaluation capacity developmentbuilds upon four key principles:
(i) Good M&E reaches beyond the bureaucratic process to downstream results, outcomes
The purpose of all development activity is to improve some aspect of the human, social or economiccondition of an identified or implied group of people. A results based management (RBM1) approach toM&E puts emphasis on downstream results – the social or economic progress that any policy, programmeor project aims at (whether explicitly or only implicitly expressed).
Outputs represent the immediate product or completion of administrative activity – for which managers canbe held objectively accountable, such as completion of boreholes or classroom construction or distributionof medicines to health facilities.
The concept of reach provides a gauge of the extent to which government efforts meet the needs ofclients/beneficiaries, usually expressed in terms of relative coverage, access to or use of programmes,services or facilities. This concept also encompasses the degree of client/beneficiary satisfaction with theseoutputs and services.
Outcomes represent the intermediate change or response that follows from outputs and their reach.Outcomes are desirable and necessary changes along the road to intended ultimate developmental goals –e.g. the creation of skills and employment opportunities as one means to achieve poverty eradication.
Although managers routinely need information about many administrative details surrounding their area ofresponsibility (inputs, activities and outputs), indications of effort or bureaucratic progress per se are notevidence of the end results that are to be achieved. It is therefore crucial that they also keep their eyes onhow their efforts translate into improvements in actual service delivery and progress with the outcomes thatsociety expects.
The establishment of quantifiable targets and the measurement of change at the reach and outcomes levelscan help bridge the gap between bureaucratic action on the one hand and the tracking of progress with long-term developmental goals on the other.
If the focus of M&E only covers intentions and efforts, there is no guarantee that the data collected willguide managers towards actually making a difference. M&E must therefore extend beyond tracking levelsof expenditure, bureaucratic activities and adherence to administrative requirements and procedures, butalso to progress with actual results on the ground.
Monitoring embodies the continuous tracking of different inputs, activities, outputs and reach andoutcomes. The most critical role of evaluation is to improve understanding of the interrelationship between
1 The 1999 OED Annual Review of Development Effectiveness, Annex 6, “Managing for results” makes a presentation of RBM in adevelopment management context.
M&E Focus:
Inputs Activities Outputs Reach Outcomes Development Goals
Bureaucratic Process: Efforts Development Effects:Results

2
service delivery efforts (i.e. inputs, activities and outputs) on the one hand and reach and poverty outcomeson the other.
(ii) The M&E function is inextricably linked to clarity of goals on the one hand and M&Einformation use on the other
M&E cannot be addressed from the narrow perspective of progress reporting, seen in isolation from itsfoundation of purpose and the reality of its use.
Firstly and above all, M&E is intended to support the process of creating development results. When wellconceived and practiced, M&E guides managers towards achieving their goals – whether theirresponsibilities are at the policy, programme or project levels. M&E lets managers, together with theirrespective constituency of stakeholders, know whether progress is being made – knowing which strategieswork and which don’t. The starting point for meaningful M&E is then clarity about the goals andobjectives, or outcomes, which are being pursued.
Secondly, the formal rules and regulations that surround M&E (often expressed as requirements ofprogramme design and progress reporting) or the act of producing M&E information are less importantthan how the function of M&E is actually being used – e.g. in the processes of policy analysis, resourceallocation, work planning and daily operational management. The real product of M&E is not reports orfacts per se, but a higher quality of decision making.
In addition to the importance of M&E’s accountability function, a results based management approachrecognizes its role as a learning function – helping managers and stakeholders act on the basis ofunderstanding what really works and what doesn’t. Reach and outcomes provide a direction for managerialorientation that can help improve effectiveness of service delivery (“keeping one’s eyes on the ball”). Theact of identifying, tracking and analyzing outcomes lends focus to stakeholder dialogue and helps inascertaining the relevance of intermediate resource and activity planning.
Information about what poverty actions are effective and what are not, needs to be incorporated intosystems and incentives for feedback, learning, sanctions and reward. Otherwise there is no guarantee thatactions follow the goals that have been set.
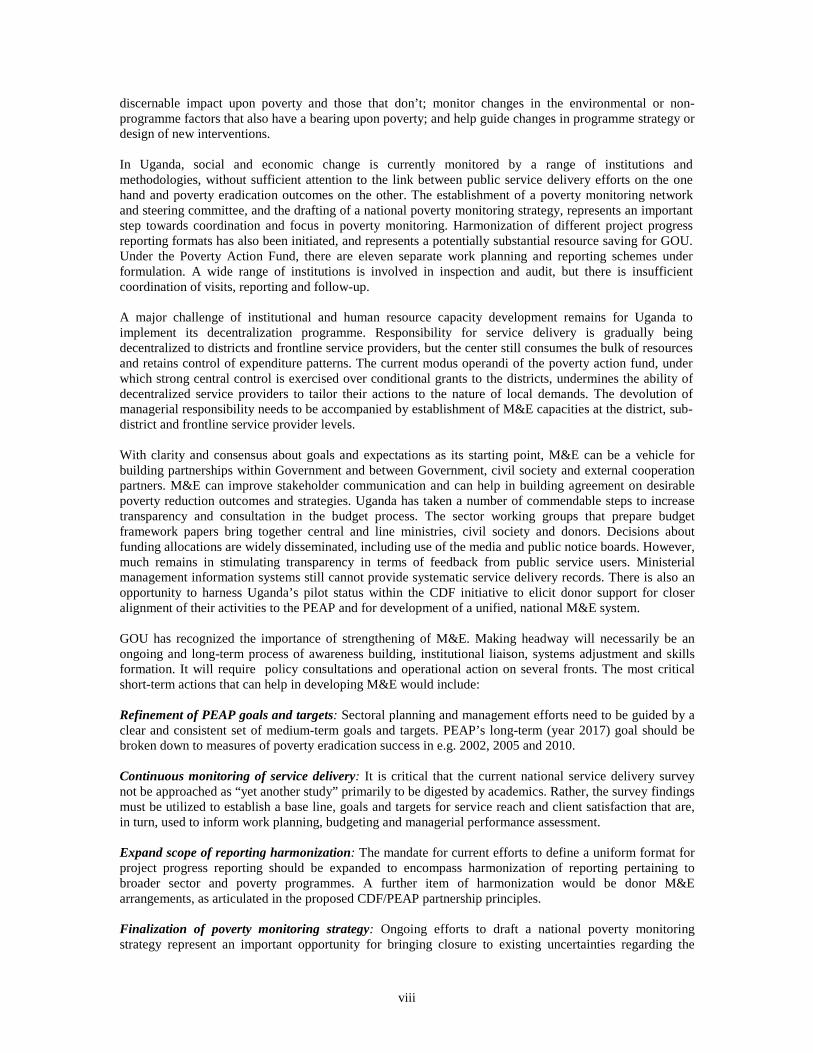
(iii) Capacity development requires a ‘systems’ approach
Capacity expresses the ability to effectively, efficiently and sustainably perform functions, solve problemsand set and achieve objectives. Capacity is the power of something (a system, an organization, or a person -individually or collectively) to perform or to produce. However, a single person possessing the power toperform or produce only reflects the capacity of that person, and not necessarily a capacity on the part of aninstitution or system.
Capacity does need skills, staff, logistical resources – but this is not enough. Existence of physical facilitiesor development of technical skills does not lead to capacities if addressed in isolation from the essentialmanagerial processes of any given organization. If individual abilities do not fit into the patterns andprocesses of decision making, the skills acquired from training may be unused. Capacity development,irrespective of field, is therefore not synonymous with technical training of individuals. Moreover,individual organizations do not function in a vacuum either – they operate within a wider set of values and
M&ERequirementsand Reports
Clarity of Objectivesand Targets:
* Policies* Programmes* Projects
M&E use in decisionmaking:
* Policy Analysis* Resource Planning* Performance Review
3
systems, and are dependent on a complex and organic policy and institutional environment. Any onegovernment ministry or agency, for example, is part of a broader system of institutional liaison within thepublic service, with which it has a shared mission and some common characteristics of culture andincentives.
Successful capacity development therefore needs a ‘systems’ approach, whereby skills are seen within abroader context of organizational mandates, patterns of decision making and institutional liaison, and theprevailing managerial culture, values and incentives.
(iv) Learning from international experience; generic success factors
The realities, opportunities and constraints facing any particular country will in many ways be unique.Efforts to strengthen M&E functions must be therefore be tailored carefully according to countrycircumstances – political, institutional, social and cultural – if they are to be successful. However, somecommon and generic features of M&E success exist. Successful M&E capacity development efforts havebeen identified by OED as often including the following characteristics:
• Forms part of a public sector management reform program• Promotes a results orientation and a poverty reduction and growth focus• Connects oversight of public expenditures at central, sector and regional level• Involves civil society, NGOs, private sector• Supports parallel initiatives by other development assistance agencies• Develops and implements a customized training program for ECD• Establishes linkages with financial management and accountability programs• Develops linkages with statistical system improvements• Establishes linkages with research initiatives• Contributes to improved M&E for country/sector assistance strategies and Bank financed projects
M&E is, above all, a good management practice. The results based M&E prism brings impetus to some ofthe concerns that are frequently raised from alternative angles to analysis of national developmentmanagement:
• Accountability: Value for money; follow-up to malpractice and audit• Governance: Participation; transparency• Public sector management: Policy implementation; performance management• Financial management: Budget execution; expenditure quality
Individual Skills
Organizational decision-making
Public service culture, values & incentives

4
2.0 OVERVIEW OF EXISTING M&E ARRANGEMENTS
2.1 Context of development planning and management2
Uganda has undertaken comprehensive reforms in economic management, and has within the last decadeachieved stabilization of its public finances. The average real rate of GDP growth has been 6.9 percent perannum since 1990/91, resulting in an annual 3.7 percent increase in real GDP per capita and a 20 percentdecline in poverty (headcount index) from 1992 to 1997. On the social front, important progress has beenmade in respect of e.g. primary school enrollment and in reduction of HIV/AIDS prevalence.
With national aspirations and directions for long-term development having been brought into focus throughthe Vision 2025 exercise, the Poverty Eradication Action Plan (PEAP) has guided the formulation ofGovernment policy in Uganda since its inception in 1997. PEAP has been coordinated by the Ministry ofFinance, Planning and Economic Development (MFPED) and represents Uganda’s response to theComprehensive Development Framework (CDF) initiative, and has been revised into the format of theWorld Bank/IMF Poverty Reduction Strategy Paper (PRSP).
The overall objective of the PEAP is to reduce the incidence of absolute poverty from 44% in 1996/97 to10% by 2017. Uganda’s current MTEF three year rolling budget system represents the interface betweenPEAP goals and operational management. A consultative process drawing on the activities of sectorworking groups (SWG) culminates in agreed sectoral Budget Framework Papers (BFP) that are normallycompleted by end of April. The SWGs bring together key central ministries, the respective technicalagencies, NGO’s and the donor community in the process of preparing sectoral BFP’s. PEAP is buttressedby the Poverty Action Fund (PAF), which has been established as a vehicle for channeling incrementalresources made available through HIPC into the Priority Programme Areas (PPA) of primary health,primary education, water and sanitation, agricultural extension and rural roads.
The budget process in Uganda is characterized by relative transparency and openness, with MFPED havingintroduced a number of measures to keep the public informed and involved throughout the cycle, includingan annual retreat with civil society and donor stakeholders to review experiences from the previous budgetcycle. To further strengthen results orientation within the MTEF process, MFPED is introducing outputoriented budgeting (OOB). As part of its effort to further improve expenditure management, theGovernment has embarked on the modernization of its fiscal systems. It plans to commence this processwith a fiscal management study (FMS) under IDA Economic and Financial Management Programme(EFMPII3). The FMS will provide a roadmap for the computerization of GOU's fiscal systems beginningwith the budgeting and accounting processes at central and local levels. EFMPII also addressesharmonization of the central and local government planning processes and institutionalization of thepreparation of local government BFP’s.
GOU’s policy of decentralization4 is founded on the devolution of responsibility for planning, resourcemanagement and service delivery to 45 districts with further administrative units at the county, sub-county,parish and village levels. While the local governments (LG’s) in Uganda are autonomous corporate entities,the Ministry of Local Government (MLG) and its decentralization secretariat exercises broad oversight oftheir performance, and functions as coordinators of policy and central support facilities for thedecentralization work.
The bulk of transfers to LG, currently 78%, are conditional grants, which are negotiated between lineministries and individual LG’s. There are currently 23 different conditional grant schemes, of which 11 arefunded through the PAF. Individual LG’s prepare separate “activity based” workplans for each of theeleven PAF conditional grants schemes. The basic conditionality of the conditional grants is associated
2 Further details of the policy and institutional context are provided in Annex 1.3 World Bank, October 1999, “Second Economic and Financial Management Project”, Project Appraisal Document, Washington D.C.4 The system of local government in Uganda is provided for in the 1995 Constitution and the 1997 Local Government Act.

5
with adherence to very detailed controls over the types of expenditure allowed. District managers needcentral authority approval for any re-allocations in excess of 10% of resources. Releases of PAF funds arecontingent upon compliance with the reporting requirements. The IDA-supported local governmentdevelopment project (LGDP5) will provide technical and financial resources to enable the development,testing and application of a range of participatory planning, budgeting and resource allocation proceduresand programme management systems in a sub-set of LGs.
Uganda is in the middle range of developing countries’ aid dependence, with OECD/DAC estimating6 totalODA to Uganda equivalent to 12.1% and 7.1% of GNP in 1997 and 1998, respectively. An increasingshare, currently 19%, of external assistance is being channeled into budget support, either in the form ofgeneral PAF support or earmarked for specific sectors, in particular for the health and education sectors,which is then subject to monitoring and review with donor involvement in the SWG process.
Government has recognized the need to enhance the integrity and accountability of its institutions by (i)increasing public oversight through increased transparency, education and awareness, (ii) promotingcapacity building; and (iii) strengthening enforcement of laws and penalties. To this end, the ‘GovernmentStrategy and Plan of Action to Fight Corruption and Build Ethics and Integrity in Public Office’ has beenprepared by the Ministry of Ethics and Integrity (DEI)7) and was launched by H.E. The President in July2000.
An innovative way of introducing accountability is represented by the existing stipulation that districts postmandatory public notices for every conditional grant under PAF each quarter – giving details of workplans,their costs and funds released.
The Ministry of Public Service (MPS) is host to the Public Service Commission (PSC), which guidesappointments, service conditions and government payroll; as well as the 1997—2002 Public Sector ReformProgramme (PSRP), which is overseen by the Public Service Reform Coordinating Committee (PSRCC)8
one goal is to achieve a smaller, better paid and better performing public service. To inform thedevelopment of a Pay Reform Strategy9 being formulated by MPS, studies have recently been completed onjob evaluation and market comparators. A new performance appraisal scheme, to enable individuals to beassessed against jointly agreed performance targets that are clear, measurable and related to Governmentobjectives, is being piloted for introduction from the beginning of year 2001. Performance contracts havebeen introduced at the level of Permanent Secretaries, but not yet at other levels of management. A resultsoriented management scheme (ROM) was initiated back in 1995, and Cabinet has now approved a plan forits introduction to all ministries and districts. The ROM, which is coordinated by MPS, introduces alogframe approach to definition of goals and objectives.
5 World Bank, October 1999, “Local Government Development Program”, Project Appraisal Document, Washington D.C.6 http://www.oecd.org/dac/images/AidRecipient/uga.gif7 MEI’s predecessor, the Department of Ethics and Integrity (DEI), in the Office of the President, was (reportedly) established as aresult of a previous (donor) evaluation of the government’s anti-corruption strategy (1998).8 Chaired by the Vice President, and attended by the Permanent Secretaries of the Ministries of Education, Public Service, Justice andConstitutional Affairs, Finance, Planning and Economic Development, and Local Government.9 MPS, August 2000, “(Draft) Proposed Pay Reform Strategy for the Public Service”
6
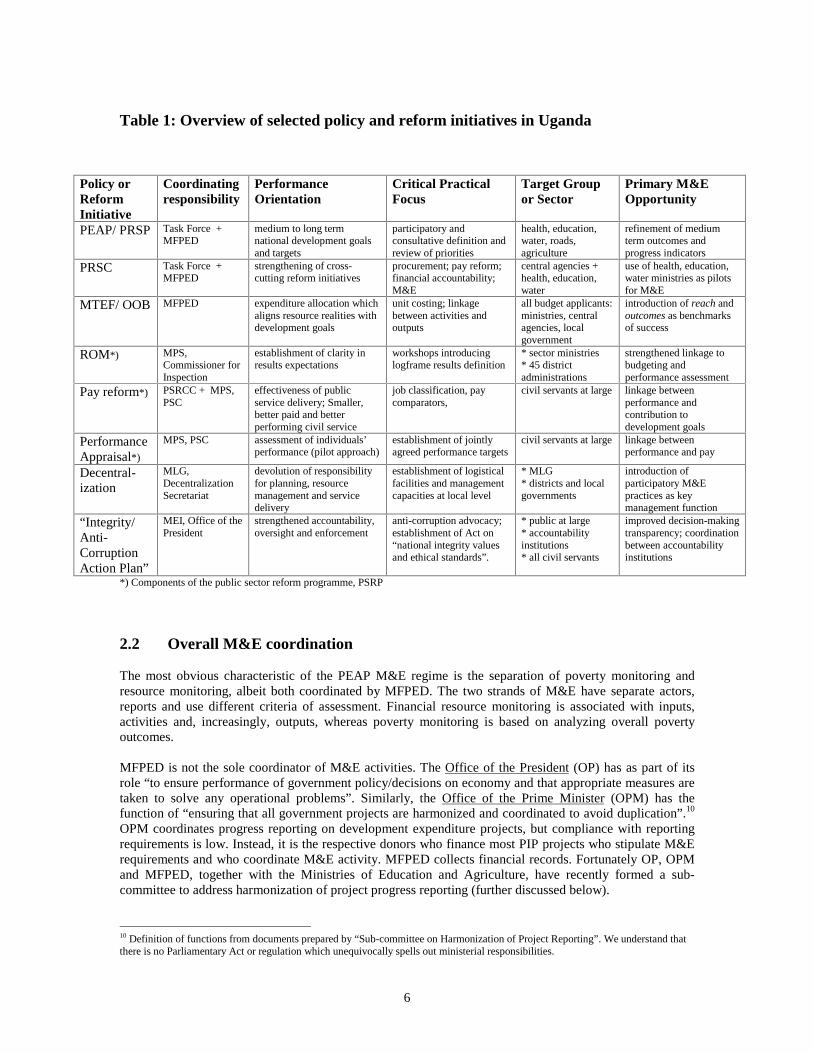
Table 1: Overview of selected policy and reform initiatives in Uganda
Policy orReformInitiative
Coordinatingresponsibility
PerformanceOrientation
Critical PracticalFocus
Target Groupor Sector
Primary M&EOpportunity
PEAP/ PRSP Task Force +MFPED
medium to long termnational development goalsand targets
participatory andconsultative definition andreview of priorities
health, education,water, roads,agriculture
refinement of mediumterm outcomes andprogress indicators
PRSC Task Force +MFPED
strengthening of cross-cutting reform initiatives
procurement; pay reform;financial accountability;M&E
central agencies +health, education,water
use of health, education,water ministries as pilotsfor M&E
MTEF/ OOB MFPED expenditure allocation whichaligns resource realities withdevelopment goals
unit costing; linkagebetween activities andoutputs
all budget applicants:ministries, centralagencies, localgovernment
introduction of reach andoutcomes as benchmarksof success
ROM*) MPS,Commissioner forInspection
establishment of clarity inresults expectations
workshops introducinglogframe results definition
* sector ministries* 45 districtadministrations
strengthened linkage tobudgeting andperformance assessment
Pay reform*) PSRCC + MPS,PSC
effectiveness of publicservice delivery; Smaller,better paid and betterperforming civil service
job classification, paycomparators,
civil servants at large linkage betweenperformance andcontribution todevelopment goals
PerformanceAppraisal*)
MPS, PSC assessment of individuals’performance (pilot approach)
establishment of jointlyagreed performance targets
civil servants at large linkage betweenperformance and pay
Decentral-ization
MLG,DecentralizationSecretariat
devolution of responsibilityfor planning, resourcemanagement and servicedelivery
establishment of logisticalfacilities and managementcapacities at local level
* MLG* districts and localgovernments
introduction ofparticipatory M&Epractices as keymanagement function
“Integrity/Anti-CorruptionAction Plan”
MEI, Office of thePresident
strengthened accountability,oversight and enforcement
anti-corruption advocacy;establishment of Act on“national integrity valuesand ethical standards”.
* public at large* accountabilityinstitutions* all civil servants
improved decision-makingtransparency; coordinationbetween accountabilityinstitutions
*) Components of the public sector reform programme, PSRP
2.2 Overall M&E coordination
The most obvious characteristic of the PEAP M&E regime is the separation of poverty monitoring andresource monitoring, albeit both coordinated by MFPED. The two strands of M&E have separate actors,reports and use different criteria of assessment. Financial resource monitoring is associated with inputs,activities and, increasingly, outputs, whereas poverty monitoring is based on analyzing overall povertyoutcomes.
MFPED is not the sole coordinator of M&E activities. The Office of the President (OP) has as part of itsrole “to ensure performance of government policy/decisions on economy and that appropriate measures aretaken to solve any operational problems”. Similarly, the Office of the Prime Minister (OPM) has thefunction of “ensuring that all government projects are harmonized and coordinated to avoid duplication”.10
OPM coordinates progress reporting on development expenditure projects, but compliance with reportingrequirements is low. Instead, it is the respective donors who finance most PIP projects who stipulate M&Erequirements and who coordinate M&E activity. MFPED collects financial records. Fortunately OP, OPMand MFPED, together with the Ministries of Education and Agriculture, have recently formed a sub-committee to address harmonization of project progress reporting (further discussed below).
10 Definition of functions from documents prepared by “Sub-committee on Harmonization of Project Reporting”. We understand thatthere is no Parliamentary Act or regulation which unequivocally spells out ministerial responsibilities.

7
Separation of poverty and financial monitoring
Coordination is additionally complicated by plans recently being made11 for establishment of a NationalPlanning Authority (NPA), as provided for in Uganda’s 1995 Constitution. The establishment of NPAwould clearly impact on the dynamic of national development planning and management – by virtue of theactual responsibilities, functions and manpower capacities that were vested in a new institution12. It iscritical that the eventual establishment of the national planning agency, NPA, does not lead to a furtherdispersement and blurring of M&E responsibilities.
It is clear that the SWG process has been a useful mechanism for M&E at the sector level. However, not allsectors have adopted the comprehensive planning approach. Also, the approach to M&E varies between thesectors that do. The education SWG has an M&E sub-group13, whilst the health SWG has a “monitoringand supervision” sub-group. The emphasis placed on the review function is commendable, but theirworkplans and reports suggest that there has been little attempt to coordinate the format or direction of theirrespective work.
11 We understand that a Cabinet decision was made in September 2000 to the effect of proceeding with the establishment of NPA. Anallocation of Ushs 50mn was provided in 1999/200 budget estimates.12 The Constitution only provides for NPA’s establishment, with a mandate to be prescribed at a later date by Parliament.13 Which, inter alia, has drafted its own comprehensive M&E framework.
Poverty Monitoring:
PovertyStatus Report
AnnualHouseholdSurvey
NationalServiceDeliverySurvey
UPPAP-ParticipatoryAssessment
PovertyForum
PovertyMonitoringSteeringCommittee
PovertyMonitoring –TechnicalS’committee
PovertyMonitoringNetwork
UBOS
EPRC
MISR
Donor-fundedoverseasresearchinstitutes
Institutions Coordination Products
PAFMonitoringCommittee
District PAFMonitoringCommittees
SectorWorkingGroups
MTEF CommitmentControlSystem
Inspection &Audit:
- IGG- Treasury- Ministry- District- OAG- Donors
AccountingOfficers
InstitutionsCoordinationProducts
Financial Monitoring:
AnnualBudgetReports
QuarterlyProgressReports
Ad HocPovertyStudies
Ad HocTrackingStudies
Audit andInspectionReports
DistrictPlans
SectorPolicies& Plans
PEAP/PRSP
PAFGrantWorkplans
Plans &goals:

8
Consideration should be given to providing SWG’s with a mandate for agenda-setting in respect of researchand evaluation, allowing sector stakeholders to jointly synthesize what has come out of the entire range ofconsultations, reports and review instruments – and then to demonstrate how the lessons drawn relate toproposals for the future. The initiative would have an important effect in terms of establishing transparencyto future learning intentions.
It is crucial that the decentralization effort is not accompanied by a proliferation of disparate reviewmechanisms at the district level. Development of a comprehensive district review mechanism has thepotential to provide synergy and scale economy in comparison to the alternative of conducting stand-aloneevaluations and reviews for the many different projects, funding schemes and cooperative agencies that areactive within a district.
2.3 Overall PEAP goals and targets
The PEAP/PRSP itself will be revised every two years, based on findings and recommendations of thePoverty Status Report (PSR), which was first prepared in 1999 and will next be repeated in 2001. Intentionsare, in fact, that the PSR itself will constitute the updated PRSP.
GOU intends that the monitoring of PEAP/PRSP should be built on continuous two-way flows ofinformation between beneficiaries, service providers and policy makers – in order for design andimplementation strategies to be continually modified from knowledge about what works and what doesn’t.However, in the PEAP the treatment of monitoring is frequently expressed as an option or aspiration ratherthan as a definite intention. For example, there are several passages where it is said that a specific measure“….should be” or “….could be” rather than will be monitored. The danger is that compliance withmonitoring and reporting requirements will not be enforced because it matters little if one does or not.
The overall goal of PEAP is to reduce headcount poverty to 10% by year 2017. Under the PEAP pillars, atotal of 46 sub-objectives have been defined. Targets have been established for twelve of these, whereas 34have associated monitoring indicators without targets having been identified. The PEAP goals, sub-goals,targets and monitoring indicators are attached in Annex 2a. Within the PRSP document, on the other hand,a sub-set of eight targets and associated monitoring indicators has been highlighted (see Annex 2b).
A general observation about the PEAP/PRSP structure is that there is a gap between its single, very long-term overall goal on the one hand and the many short-term operational strategies and plans on the other.More broadly, the lack of clarity in the structure of PEAP goals and targets translates into insufficientcoherence in operational planning. Medium-term expenditure plans, as reflected in BFP’s, do not alwaysmirror PEAP goals or have clear expectations about results on the ground. The terminology used todescribe results is often confused: for example, the concept of outcomes is often used interchangeably withoutputs. The preparation of sector and district policies, budgets and activity plans is undertaken as workexercises separate from each other. More technical issues that arise from review of the PEAP goals, targetsand monitoring indicators include:
1. The subgoals primarily correspond to areas of ministerial activity, rather than overriding orcross-cutting poverty outcomes.
2. For most of the PEAP subgoals no targets have been established.3. Not all targets are clear or time-bound.4. Few of the monitoring indicators have a baseline.5. Responsibility and methodology for monitoring indicators is not clear.
In recognition of the need for improved clarity in the PEAP structure of goals and targets, a retreat withsector ministries has been included in the current budget process, at which sectoral performance indicatorswill be discussed. In addition to clarification of goals, it will be necessary to agree on a common results andperformance terminology, e.g. for what to associate with terms like targets, benchmarks, milestones,indicators, baseline, goals, reach, outcomes and outputs.
9
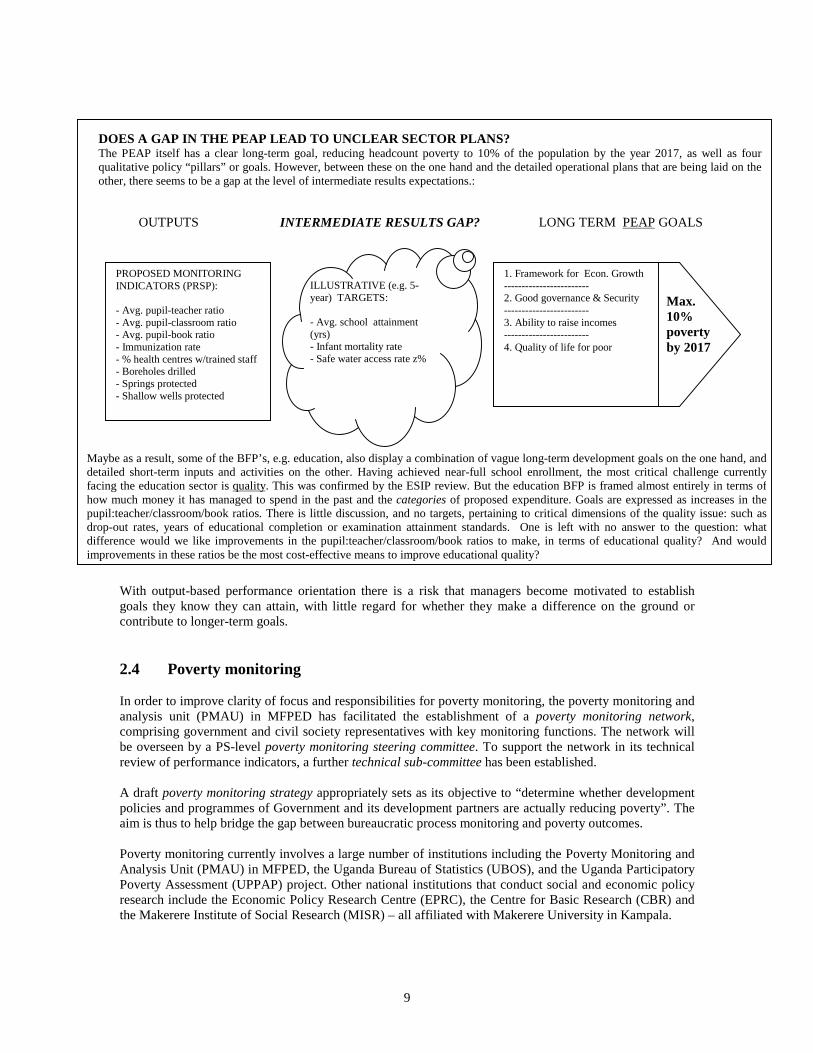
With output-based performance orientation there is a risk that managers become motivated to establishgoals they know they can attain, with little regard for whether they make a difference on the ground orcontribute to longer-term goals.
2.4 Poverty monitoring
In order to improve clarity of focus and responsibilities for poverty monitoring, the poverty monitoring andanalysis unit (PMAU) in MFPED has facilitated the establishment of a poverty monitoring network,comprising government and civil society representatives with key monitoring functions. The network willbe overseen by a PS-level poverty monitoring steering committee. To support the network in its technicalreview of performance indicators, a further technical sub-committee has been established.
A draft poverty monitoring strategy appropriately sets as its objective to “determine whether developmentpolicies and programmes of Government and its development partners are actually reducing poverty”. Theaim is thus to help bridge the gap between bureaucratic process monitoring and poverty outcomes.
Poverty monitoring currently involves a large number of institutions including the Poverty Monitoring andAnalysis Unit (PMAU) in MFPED, the Uganda Bureau of Statistics (UBOS), and the Uganda ParticipatoryPoverty Assessment (UPPAP) project. Other national institutions that conduct social and economic policyresearch include the Economic Policy Research Centre (EPRC), the Centre for Basic Research (CBR) andthe Makerere Institute of Social Research (MISR) – all affiliated with Makerere University in Kampala.
Max.10%povertyby 2017
1. Framework for Econ. Growth------------------------2. Good governance & Security------------------------3. Ability to raise incomes------------------------4. Quality of life for poor
LONG TERM PEAP GOALSOUTPUTS
PROPOSED MONITORINGINDICATORS (PRSP):
- Avg. pupil-teacher ratio- Avg. pupil-classroom ratio- Avg. pupil-book ratio- Immunization rate- % health centres w/trained staff- Boreholes drilled- Springs protected- Shallow wells protected
ILLUSTRATIVE (e.g. 5-year) TARGETS:
- Avg. school attainment(yrs)- Infant mortality rate- Safe water access rate z%
INTERMEDIATE RESULTS GAP?
DOES A GAP IN THE PEAP LEAD TO UNCLEAR SECTOR PLANS?The PEAP itself has a clear long-term goal, reducing headcount poverty to 10% of the population by the year 2017, as well as fourqualitative policy “pillars” or goals. However, between these on the one hand and the detailed operational plans that are being laid on theother, there seems to be a gap at the level of intermediate results expectations.:
Maybe as a result, some of the BFP’s, e.g. education, also display a combination of vague long-term development goals on the one hand, anddetailed short-term inputs and activities on the other. Having achieved near-full school enrollment, the most critical challenge currentlyfacing the education sector is quality. This was confirmed by the ESIP review. But the education BFP is framed almost entirely in terms ofhow much money it has managed to spend in the past and the categories of proposed expenditure. Goals are expressed as increases in thepupil:teacher/classroom/book ratios. There is little discussion, and no targets, pertaining to critical dimensions of the quality issue: such asdrop-out rates, years of educational completion or examination attainment standards. One is left with no answer to the question: whatdifference would we like improvements in the pupil:teacher/classroom/book ratios to make, in terms of educational quality? And wouldimprovements in these ratios be the most cost-effective means to improve educational quality?

10
UBOS household surveys are conducted on an annual basis, and are being used to prepare estimates oftrends in poverty and its demographic composition. It is clear that there is scope for studies such as these tobe more widely used e.g. for more detailed analysis of trends and determinants of poverty and servicedelivery at the sectoral and local levels. Demographic and Health Surveys are conducted in a 5-year cycle,whereas a Census is undertaken decennially – next in 2002. Finally, UBOS maintains the district resourceendowment profiles (DREPS) database, comprising information about e.g. topographical characteristics,natural resources and land use in the districts.
The data collection for an updated national service delivery survey (NSDS) was completed in 3Q/00, withthe report expected in 1Q/01. The NSDS represents a comprehensive set of data14 covering household-levelperceptions of access, use and satisfaction in the areas of crime/justice/law & order; transport services;good governance; water and sanitation; health services; education; agricultural and veterinary extensionservices. MPS and MFPED have agreed that UBOS will take over responsibility for coordinating futureNSDS surveys, which are planned to be conducted on an annual basis, eventually in conjunction with theannual household surveys.
The NSDS is an initiative of significant systemic importance – not in terms of being a study, but as apotential instrument for operational management. The NSDS can be adopted as a dynamic barometer ofgovernment service reach, being used for target-setting and performance assessment pertaining toimprovements in levels of service delivery and client satisfaction. Client satisfaction data have theadvantage of offering some comparability across sectors, districts and over time. An additional operationaluse of the NSDS would be the articulation of “client service charters” – commitments to departmental andfacility-level performance. If the concept of client service, or reach, is truly embraced by national decisionmakers, by committing to gear systems and practices to it, not just of M&E but also of work planning,budgeting and performance incentives –it could lead to a material improvement in effectiveness ofgovernment service delivery.
Qualitative and participatory approaches to poverty monitoring are used by the Uganda ParticipatoryPoverty Assessment (UPPAP) project. Such work has already been an input to the Spring 2000PEAP/PRSP revision and has had a direct influence on national policy in terms of budgetary allocations towater supply and the priority given to improving security.
2.5 PAF monitoring
Basic government-wide expenditure control is exercised through the Commitment Control System (CCS).The introduction of the CCS has helped reign in over-commitments and the build-up of domestic arrears.
The PAF monitoring committee, which reviews policies and operations, meets quarterly under MFPEDcoordination, and includes donor, line ministry and civil society participation. District PAF monitoringmeetings are coordinated by a civil society organization, the Uganda Debt Network.
General PAF conditional grant work planning and reporting guidelines15 have been prepared by MFPED,whilst eleven grant-specific guidelines are being prepared by the respective sector ministries, forfinalization by January 2001. LG’s plan and report separately for the individual PAF and other conditionalgrants.
The PAF guidelines include work planning and progress reporting based on review of:
• National objective of the grant• District priorities and needs• Strategies to achieve objectives
14 Drawing on a sample of 15,000 respondents in 1,350 villages and all 45 districts.15 “Poverty Action Fund: 2000-2001 General Guidelines for the Planning and Operation of Conditional Grants”, MFPED, April 2000.
11
• Quantifiable activities• Cost of activities
PAF workplans form the basis of a “Letter of Understanding” with the respective line ministries and are,ultimately, consolidated into the LGBFP. Guidance and technical assistance on drawing up the workplans isgiven at the Regional Budget Framework Meetings and independently by the respective sector ministries.
The PAF guidelines apply to the non-wage component of expenditures. The fact that the majordevelopment and recurrent expenditures are reviewed as separate issues undermines the objective ofcomprehensive results planning and management.
The central instrument for more operational M&E is the review and inspection pertaining to quarterly andannual progress reporting, which itself forms part of the work planning and budget cycles. According tothe PAF guidelines, progress reporting is complemented by monitoring through a system of physical visits:
• Quarterly visits by Districts (to service facilities)• Quarterly visits by MFPED Treasury Inspectorate• Quarterly visits by Line Ministries• Half-yearly value for money audits by Auditor General• Ad hoc visits by MLG and IGG
Monitoring visits have a reporting format that encompasses:
• Verification of progress as reported• Identification of problems in implementation and give recommendations for their solution• Outline of issues needing follow up• Outline of progress in resolving issues raised in previous monitoring reports
The priority issue for inspection and monitoring visits appears to be maintenance of financialaccountability. However, indications are that few of the agencies involved have been able to maintain theintended inspection frequency and coverage, due mainly to a lack of manpower resources.
More evaluative and reflective perspectives have been provided by value-for-money audits and expendituretracking studies. A total of three such studies have been undertaken to date, two in education, in 1996 and2000 and one in health in 2000, through use of private sector consultants.
5% of PAF funds, equivalent to US$ 2-4 million p.a., are earmarked for “Monitoring and Accountability”(Table 2).
Clear criteria need to be established for the allocation of PAF monitoring and accountability funds. It isimportant that these funds are not simply co-opted as incremental funding for basic operations of Uganda’saccountability institutions.
A further PAF grant, i.e. additional to the overall allocation of 5% of PAF, for district monitoring andaccountability, is being introduced from f.y. 2001/2002.

12
Table 2: Allocation of PAF Monitoring and Accountability Funds
1998/99Outturn
1999/00Budget
2000/01 Proposed
Ushs Bn. Ushs Bn. Ushs Bn. US$ mn16
Inspector General of Government 1.40 1.95 2.21 1.47Auditor General 0.00 0.91 1.14 0.76Directorate of Accounts 0.11 0.19 0.23 0.15Districts 0.05 1.75 3.64 2.42Line Ministries 1.17 1.32 1.66 1.10Other Accountability Institutions 1.44 1.16 1.46 0.97MFPED 0.03 0.49 0.56 0.37Total 4.20 7.76 10.90 7.26Source: MFPED, Background to the Budget 2000/01, p.48.
2.6 Civil society role
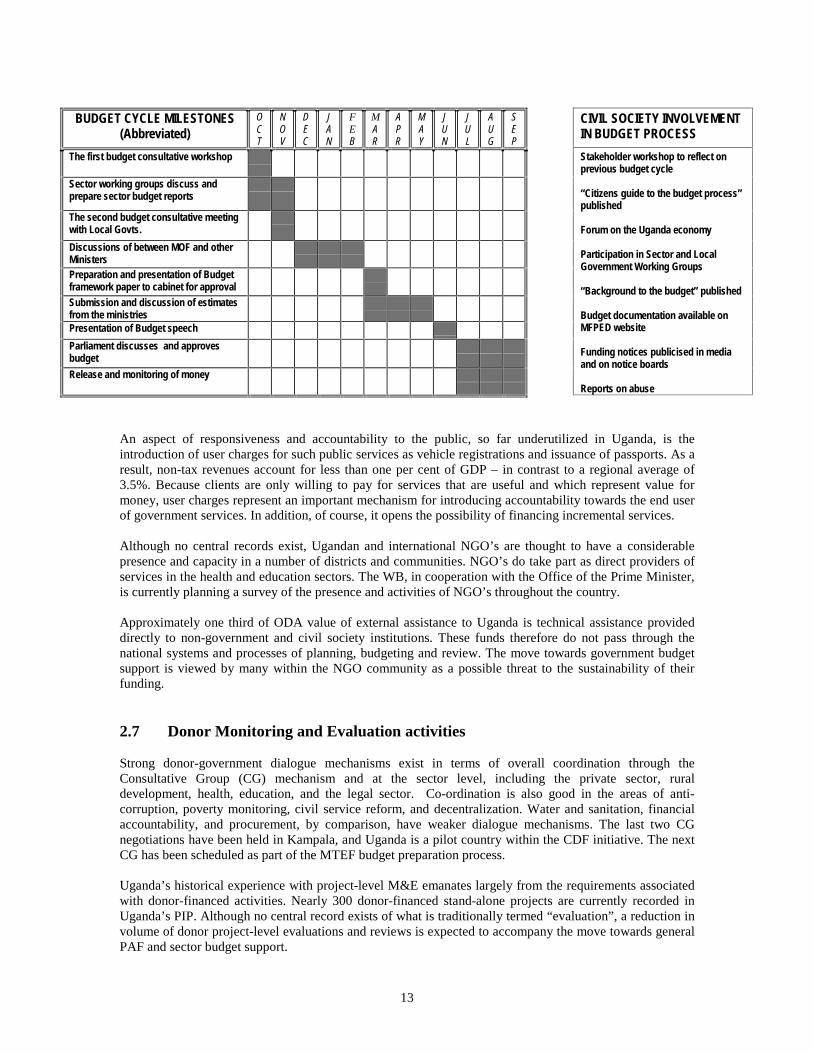
The transparency measures and consultative efforts that have been introduced as part of the GOU budgetprocess are in many ways unique and have undoubtedly given a boost to government credibility with thepublic. Civil society is informed through basic transparency, such as publication of the “citizens’ guide tothe budget process”, but more importantly it influences the annual budget decision making process throughits participation in stakeholder reflection workshops, the forum on the Uganda economy, and the sectorworking groups (see following chart).
MFPED continues its efforts to seek active participation of members of Parliament in the budget process.
Each year, the Makerere Institute of Social Research (MISR) convenes the national Poverty Forum ,bringing together government and civil society for discussion of national poverty priorities and strategies.
A particularly positive and noteworthy practice in Uganda is the posting of notices of UPE grant fundingallocations in the school districts17. This forces transparency and accountability into administrators’dialogue with their constituency of clients or end users. People appear at school administrators’ doordemanding to know what has happened to “their” funds. The new PAF guidelines makes public noticesmandatory for all PAF workplans and funds.
The Uganda Debt Network (UDN) coordinates civil society monitoring of PAF activity in the districts, andpresents a quarterly report on behalf of civil society to the national PAF monitoring committee. UDN alsoconveys its monitoring results to broader civil society through published reports, PAF briefing papers,newsletters, radio and TV talk shows and a web site on the internet.
Civil society clearly has an important role to play in the fight against corruption by demanding greatertransparency and accountability from government. To facilitate this Government intends to review theOfficial Secrets Act in the light of international best practice and replace it with modern access togovernment information and whistleblower protection laws.
16 Based on Ushs/US$ exchange rate = 1.500/117 This followed a public expenditure tracking survey conducted in 1996 which found substantial diversion and ‘leakage’ ofgovernment funds in the education sector.
13
An aspect of responsiveness and accountability to the public, so far underutilized in Uganda, is theintroduction of user charges for such public services as vehicle registrations and issuance of passports. As aresult, non-tax revenues account for less than one per cent of GDP – in contrast to a regional average of3.5%. Because clients are only willing to pay for services that are useful and which represent value formoney, user charges represent an important mechanism for introducing accountability towards the end userof government services. In addition, of course, it opens the possibility of financing incremental services.
Although no central records exist, Ugandan and international NGO’s are thought to have a considerablepresence and capacity in a number of districts and communities. NGO’s do take part as direct providers ofservices in the health and education sectors. The WB, in cooperation with the Office of the Prime Minister,is currently planning a survey of the presence and activities of NGO’s throughout the country.
Approximately one third of ODA value of external assistance to Uganda is technical assistance provideddirectly to non-government and civil society institutions. These funds therefore do not pass through thenational systems and processes of planning, budgeting and review. The move towards government budgetsupport is viewed by many within the NGO community as a possible threat to the sustainability of theirfunding.
2.7 Donor Monitoring and Evaluation activities
Strong donor-government dialogue mechanisms exist in terms of overall coordination through theConsultative Group (CG) mechanism and at the sector level, including the private sector, ruraldevelopment, health, education, and the legal sector. Co-ordination is also good in the areas of anti-corruption, poverty monitoring, civil service reform, and decentralization. Water and sanitation, financialaccountability, and procurement, by comparison, have weaker dialogue mechanisms. The last two CGnegotiations have been held in Kampala, and Uganda is a pilot country within the CDF initiative. The nextCG has been scheduled as part of the MTEF budget preparation process.
Uganda’s historical experience with project-level M&E emanates largely from the requirements associatedwith donor-financed activities. Nearly 300 donor-financed stand-alone projects are currently recorded inUganda’s PIP. Although no central record exists of what is traditionally termed “evaluation”, a reduction involume of donor project-level evaluations and reviews is expected to accompany the move towards generalPAF and sector budget support.
BUDGET CYCLE MILESTONES(Abbreviated)
OCT
NOV
DEC
JAN
FEB
MAR
APR
MAY
JUN
JUL
AUG
SEP
CIVIL SOCIETY INVOLVEMENTIN BUDGET PROCESS
The first budget consultative workshop
Sector working groups discuss andprepare sector budget reports
The second budget consultative meetingwith Local Govts.
Discussions of between MOF and otherMinistersPreparation and presentation of Budgetframework paper to cabinet for approvalSubmission and discussion of estimatesfrom the ministriesPresentation of Budget speech
Parliament discusses and approvesbudget
Release and monitoring of money
Stakeholder workshop to reflect onprevious budget cycle
“Citizens guide to the budget process”published
Forum on the Uganda economy
Participation in Sector and LocalGovernment Working Groups
“Background to the budget” published
Budget documentation available onMFPED website
Funding notices publicised in mediaand on notice boards
Reports on abuse
14
The many different donor requirements for M&E place a severe burden on the limited GOU capacities forM&E. Budget support and the SWG mechanism has reduced need for compliance with these requirements,in particular in the health, education and agriculture sectors. However, for those officials involved with theremaining project-level donor activities, compliance with M&E requirements constitute a considerableportion of work.
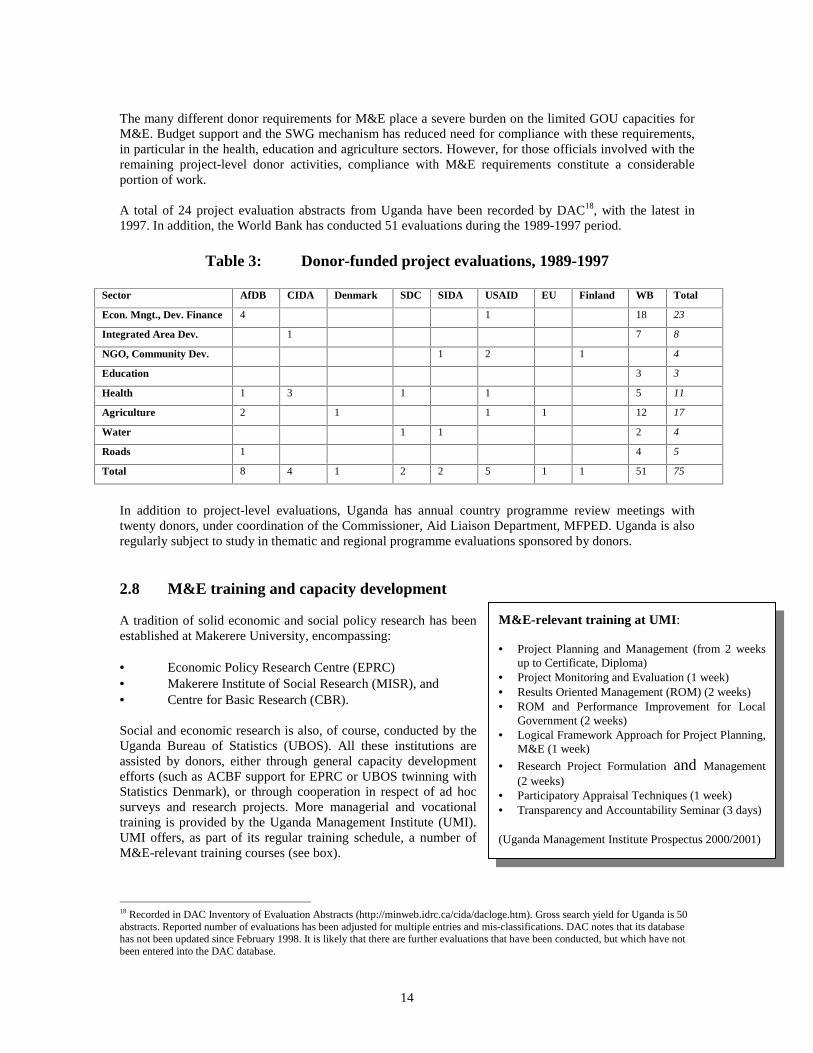
A total of 24 project evaluation abstracts from Uganda have been recorded by DAC18, with the latest in1997. In addition, the World Bank has conducted 51 evaluations during the 1989-1997 period.
Table 3: Donor-funded project evaluations, 1989-1997
Sector AfDB CIDA Denmark SDC SIDA USAID EU Finland WB Total
Econ. Mngt., Dev. Finance 4 1 18 23
Integrated Area Dev. 1 7 8
NGO, Community Dev. 1 2 1 4
Education 3 3
Health 1 3 1 1 5 11
Agriculture 2 1 1 1 12 17
Water 1 1 2 4
Roads 1 4 5
Total 8 4 1 2 2 5 1 1 51 75
In addition to project-level evaluations, Uganda has annual country programme review meetings withtwenty donors, under coordination of the Commissioner, Aid Liaison Department, MFPED. Uganda is alsoregularly subject to study in thematic and regional programme evaluations sponsored by donors.
2.8 M&E training and capacity development
A tradition of solid economic and social policy research has beenestablished at Makerere University, encompassing:
• Economic Policy Research Centre (EPRC)• Makerere Institute of Social Research (MISR), and• Centre for Basic Research (CBR).
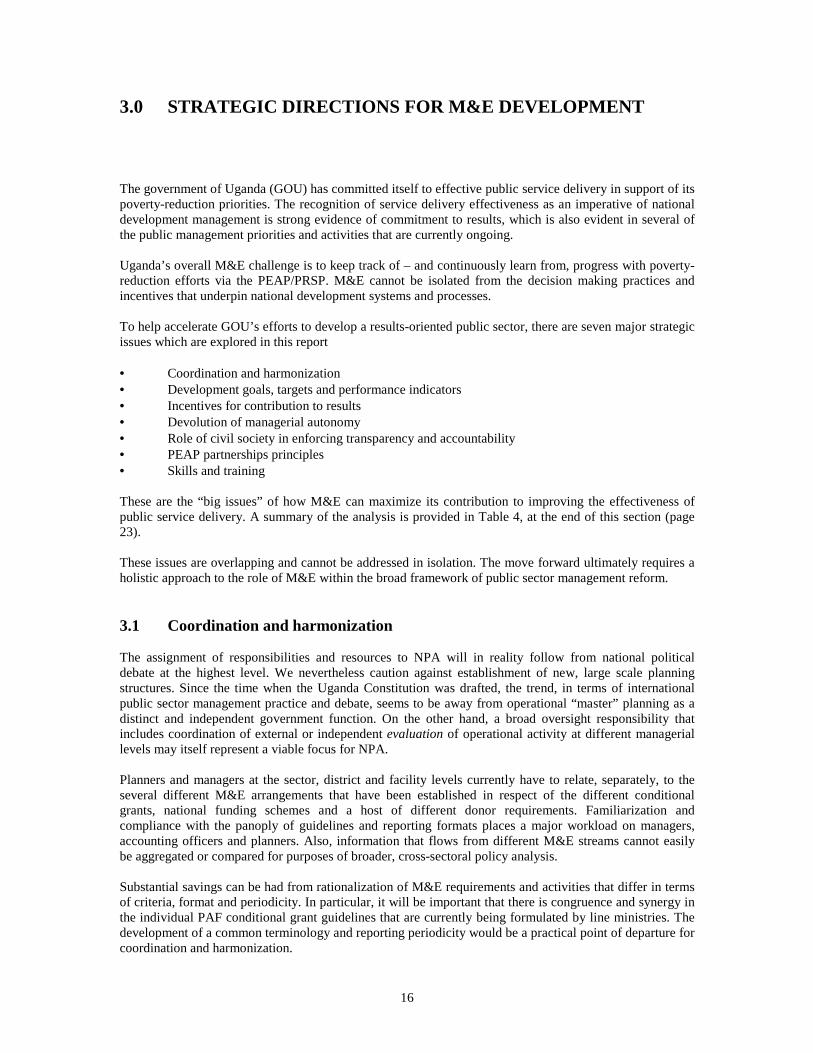
Social and economic research is also, of course, conducted by theUganda Bureau of Statistics (UBOS). All these institutions areassisted by donors, either through general capacity developmentefforts (such as ACBF support for EPRC or UBOS twinning withStatistics Denmark), or through cooperation in respect of ad hocsurveys and research projects. More managerial and vocationaltraining is provided by the Uganda Management Institute (UMI).UMI offers, as part of its regular training schedule, a number ofM&E-relevant training courses (see box).
18 Recorded in DAC Inventory of Evaluation Abstracts (http://minweb.idrc.ca/cida/dacloge.htm). Gross search yield for Uganda is 50abstracts. Reported number of evaluations has been adjusted for multiple entries and mis-classifications. DAC notes that its databasehas not been updated since February 1998. It is likely that there are further evaluations that have been conducted, but which have notbeen entered into the DAC database.
M&E-relevant training at UMI:
• Project Planning and Management (from 2 weeksup to Certificate, Diploma)
• Project Monitoring and Evaluation (1 week)• Results Oriented Management (ROM) (2 weeks)• ROM and Performance Improvement for Local
Government (2 weeks)• Logical Framework Approach for Project Planning,
M&E (1 week)
• Research Project Formulation and Management(2 weeks)
• Participatory Appraisal Techniques (1 week)• Transparency and Accountability Seminar (3 days)
(Uganda Management Institute Prospectus 2000/2001)

15
M&E skills and capacities constitute a component of several assistance projects and programmes funded byCDF partners – e.g. in support of ministerial planning and management objectives. In other projects, thereare M&E skills and capacity development activities that cater to the projects themselves.
Donor sponsored capacity development activities relevant to the broader M&E skills environment include:
DFID: DFID, most broadly, has been a supporter of public sector management and reform inUganda. An important current project is the Financial Accountability and DecentralizationSupport Project, which inter alia aims at “mitigating the fiduciary risk in publicexpenditure management, for both taxpayers and donors; maximizing value for money,efficiency and effectiveness in the use of public funds; and enhancing transparency andaccountability”. The objectives of this project are clearly congruent with WB support bothfor financial management and decentralization, which underlines the need for closecoordination in this area.
UN: Both UNDP and UNICEF consider poverty monitoring as part of their strategicconcentration areas. Ongoing and planned assistance includes support for the PovertyForum, UPPAP, PMAU/MFPED, NHDR (UNDP) and the community based managementinformation system (CBMIS) programme (UNICEF).
DANIDA: Denmark provides support for UBOS, as well as planning and M&E activities in theagriculture and water sectors.
WB: M&E is of relevance to the goals and objectives of WB-funded programmes in support ofcentral and local government management, including EFMPII, LGDP and PRSC.
Under the LGDP, a draft M&E manual for district management is to be developed, with training tooperationalize it. Tentative provisions include funds for training of 600 heads of departments from districtsand municipal LG’s. It is important that MFPED and MLG jointly ensure that this effort be coordinated interms of national M&E imperatives rather than narrow project interests.
Analytical and evaluative activity, at current levels of demand, does not seem to have been constrained bythe availability of Ugandan economists, statisticians or social scientists with the technical qualifications toconduct surveys, evaluations and other social research. There are many professionals, albeit mainly basedin Kampala, from the academic, NGO and private sector consulting communities, who are ready for suchwork and who have the requisite facilities for data processing, reporting and presentation. However, there isa general need for strengthening of management and planning capacities, both at the central and districtlevels.
16
3.0 STRATEGIC DIRECTIONS FOR M&E DEVELOPMENT
The government of Uganda (GOU) has committed itself to effective public service delivery in support of itspoverty-reduction priorities. The recognition of service delivery effectiveness as an imperative of nationaldevelopment management is strong evidence of commitment to results, which is also evident in several ofthe public management priorities and activities that are currently ongoing.
Uganda’s overall M&E challenge is to keep track of – and continuously learn from, progress with poverty-reduction efforts via the PEAP/PRSP. M&E cannot be isolated from the decision making practices andincentives that underpin national development systems and processes.
To help accelerate GOU’s efforts to develop a results-oriented public sector, there are seven major strategicissues which are explored in this report
• Coordination and harmonization• Development goals, targets and performance indicators• Incentives for contribution to results• Devolution of managerial autonomy• Role of civil society in enforcing transparency and accountability• PEAP partnerships principles• Skills and training
These are the “big issues” of how M&E can maximize its contribution to improving the effectiveness ofpublic service delivery. A summary of the analysis is provided in Table 4, at the end of this section (page23).
These issues are overlapping and cannot be addressed in isolation. The move forward ultimately requires aholistic approach to the role of M&E within the broad framework of public sector management reform.
3.1 Coordination and harmonization
The assignment of responsibilities and resources to NPA will in reality follow from national politicaldebate at the highest level. We nevertheless caution against establishment of new, large scale planningstructures. Since the time when the Uganda Constitution was drafted, the trend, in terms of internationalpublic sector management practice and debate, seems to be away from operational “master” planning as adistinct and independent government function. On the other hand, a broad oversight responsibility thatincludes coordination of external or independent evaluation of operational activity at different manageriallevels may itself represent a viable focus for NPA.
Planners and managers at the sector, district and facility levels currently have to relate, separately, to theseveral different M&E arrangements that have been established in respect of the different conditionalgrants, national funding schemes and a host of different donor requirements. Familiarization andcompliance with the panoply of guidelines and reporting formats places a major workload on managers,accounting officers and planners. Also, information that flows from different M&E streams cannot easilybe aggregated or compared for purposes of broader, cross-sectoral policy analysis.
Substantial savings can be had from rationalization of M&E requirements and activities that differ in termsof criteria, format and periodicity. In particular, it will be important that there is congruence and synergy inthe individual PAF conditional grant guidelines that are currently being formulated by line ministries. Thedevelopment of a common terminology and reporting periodicity would be a practical point of departure forcoordination and harmonization.

17
The recent establishment of an interministerial committee for harmonization of project progress reporting isan important initiative. However, it is crucial that coordination not be approached merely to the level ofprojects and the function of progress reporting. There are several initiatives of GOU that rest upon conceptsof results based management that are broadly similar in objective but which have so far been uncoordinatedin their approach; e.g. OOB, pay reform and ROM. Participants at the M&E workshop that was held inKampala in conjunction with the PRSC pre-appraisal mission in October 200019, recognized the need forestablishment of a high-level interministerial committee with responsibility for coordination of overallnational M&E issues. The structures that have been formed for preparation of a poverty monitoringstrategy, overseen by a permanent secretary level steering committee, may represent the forum that is mostsuitable for such coordination.
In conjunction with an increasing emphasis on results and M&E, experience in other countries suggests thevalue of having a designated ministry, and a senior official within it, as an anchor for coordination,advocacy and capacity-building. With its central role in the PEAP/PRSP and budget processes, MFPEDappears as a logical champion of M&E in Uganda.
3.2 Clarity of development goals, targets and performance indicators
The PEAP has an unequivocal poverty goal for year 2017, but is not clear about what progress will beneeded or the outcomes that are desirable by e.g. 2002, 2005 and 2010. Without a clear and common set offirst order goals and targets cascading through a national development management system, it is not giventhat there is congruence between planning and management activity or that everybody is pulling in thesame direction (see graph):
Horizontally: between poverty-reduction policies, strategies, workplans, budgets and performanceassessment
Vertically: between central, sectoral, district and unit management levels.
The absence of development goals that permeate different levels of the system can lead to significantinefficiencies in planning, monitoring, review and evaluation activity. The end result can be an unnecessarypaper-filling workload as well as overlap in operations. The assessment of performance becomes subjective– sometimes opaque.
MFPED should therefore coordinate an effort to revisit the PEAP in order to extract clear and consistentdevelopment goals, targets and performance indicators. Sectoral and corresponding district policies, workplans and budgets should then be expressed in terms of contribution to agreed PEAP/PRSP objectives.
19 Held on 19 October, with participants from MFPED, MLG, MEI, MWHC, MES, MAAIF; Office of the President; Office of thePrime Minister; IGG; Moroto and Gulu district administrations, UBOS, MISR.
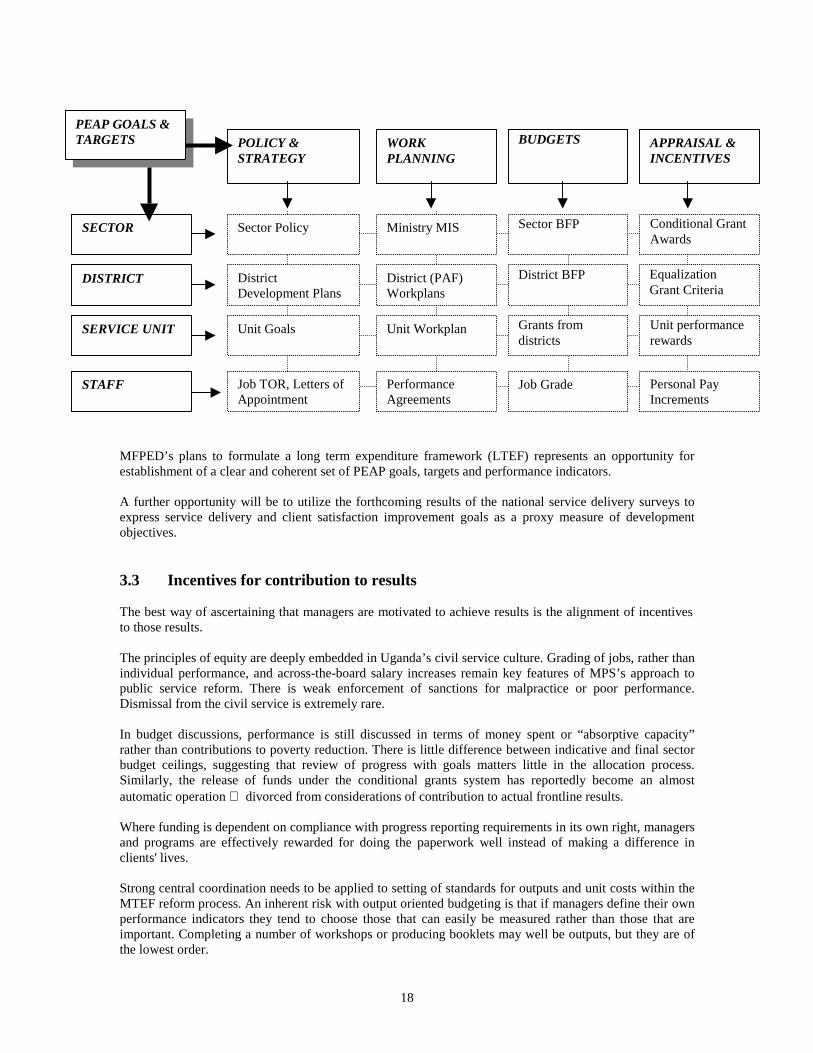
18
MFPED’s plans to formulate a long term expenditure framework (LTEF) represents an opportunity forestablishment of a clear and coherent set of PEAP goals, targets and performance indicators.
A further opportunity will be to utilize the forthcoming results of the national service delivery surveys toexpress service delivery and client satisfaction improvement goals as a proxy measure of developmentobjectives.
3.3 Incentives for contribution to results
The best way of ascertaining that managers are motivated to achieve results is the alignment of incentivesto those results.
The principles of equity are deeply embedded in Uganda’s civil service culture. Grading of jobs, rather thanindividual performance, and across-the-board salary increases remain key features of MPS’s approach topublic service reform. There is weak enforcement of sanctions for malpractice or poor performance.Dismissal from the civil service is extremely rare.
In budget discussions, performance is still discussed in terms of money spent or “absorptive capacity”rather than contributions to poverty reduction. There is little difference between indicative and final sectorbudget ceilings, suggesting that review of progress with goals matters little in the allocation process.Similarly, the release of funds under the conditional grants system has reportedly become an almostautomatic operation divorced from considerations of contribution to actual frontline results.
Where funding is dependent on compliance with progress reporting requirements in its own right, managersand programs are effectively rewarded for doing the paperwork well instead of making a difference inclients' lives.
Strong central coordination needs to be applied to setting of standards for outputs and unit costs within theMTEF reform process. An inherent risk with output oriented budgeting is that if managers define their ownperformance indicators they tend to choose those that can easily be measured rather than those that areimportant. Completing a number of workshops or producing booklets may well be outputs, but they are ofthe lowest order.
SECTOR
DISTRICT
SERVICE UNIT
POLICY &STRATEGY
Sector Policy
DistrictDevelopment Plans
Unit Goals
WORKPLANNING
Ministry MIS
District (PAF)Workplans
Unit Workplan
BUDGETS
Sector BFP
District BFP
Grants fromdistricts
Job TOR, Letters ofAppointment
PerformanceAgreements
Job Grade
APPRAISAL &INCENTIVES
Conditional GrantAwards
Equalization Grant Criteria
Unit performancerewards
Personal PayIncrements
STAFF
PEAP GOALS &TARGETS

19
To strengthen the attention of civil servants on poverty-reduction outcomes, the definition of goals,performance and implementation success should be broadened from an emphasis on processes and outputsto encompass achievements in contributing to outcomes. An immediate step would be to broaden the focuson physical outputs to encompass measures of reach: service facility access, coverage, use and clientsatisfaction.
The introduction of reward for contribution to PEAP outcomes20 or service delivery improvements as adeterminant of resource allocation and individual performance assessment would provide a strongincentive to maximize effectiveness of poverty reduction efforts. A weakness of the ROM initiative to datehas been that its activities focus on the conduct of workshops that develop skills pertaining to formulationof results statements – without clear linkages to the core operational realities of budgeting, work planningor performance assessment. Seen in isolation, what is learned may be the verbose language of grandintentions, often far removed from what is practically possible. Success with ROM is not reached at the endof a workshop or even when everyone knows what it is about; it only works when everyone changes theway they act in their daily business. In recognition of the need to tie ROM more closely to the operationalprocesses, MFPED efforts are underway for closer alignment with the OOB initiative.
Adoption of service delivery reach and client satisfaction as a key focus for departmental, district andfacility level goal definition and target-setting would provide a barometer for measurement ofimprovements in effectiveness of poverty reduction efforts.
3.4 Devolution of managerial autonomy
Even though responsibility for delivery of all major public services has been transferred to localgovernment, the bulk of budget resources and professional staff remain with central agencies.
One of the shortcomings of the current MTEF process is that the wage bill is largely outside theexpenditure allocation process carried out by the sector working groups. This is because the staffing levelsare typically taken as given and any pay increase is allocated across the board. As a result, a key part oftotal expenditures is effectively ring-fenced in sector working groups’ expenditure allocations. It would beuseful to provide a greater role for the sector working groups to make explicit recommendations withrespect to staffing and pay levels and possible pay increases by categories when such increases relate toimproved service delivery.
The PAF underlines the contradiction between on the one hand ambitions to decentralize and on the otherincreased central influence over resource allocation. Both Government and donors acknowledge that theconditional grant system limits the ability of LGs to budget for local needs. LG’s are, for example, notpermitted to pay salaries that are sufficient to attract and retain appropriately qualified personnel. In someareas the lack of flexibility concerning the optimal mix and means and ways to provide the services hascompromised optimal service provision21. If districts are to deliver services efficiently, they need to beequipped with information and greater authority to make trade-offs between wage, non-wage recurrent, andcapital expenditures.
20 Outcomes and Accountability: The obvious problem with development outcomes is attribution – that change usually emanates fromthe collective efforts of many different managers, programmes or institutions. Their separate contribution can rarely be objectivelydetermined. Mechanical measurement of change in outcome indicators is therefore usually not satisfactory as an exclusive basis forindividual performance assessment or enforcement of accountability. What managers can and should be held accountable for is“keeping their eyes on the ball” - by:(i) identifying outcomes upon which they aim to have an influence.(ii) ascertaining that outcome-level change is monitored.(iii) explaining how the activities and outputs they are responsible for make a difference to the outcomes that are being pursued.Assessment of contribution to outcomes is ultimately qualitative. But, at the end of the day, it is better to have approximateinformation about important issues than to have precise information about what might be irrelevant.21 NORAD, SIDA and Danida, October 2000, “Public Financial Management Issues in Uganda”, Joint Review.

20
3.5 Role of civil society in enforcing transparency and accountability
The importance of mobilizing public service users themselves as monitors of public service delivery hasbeen recognized by GOU. At a recent WB workshop22 in Kampala, held in conjunction with the preparationof the current report, a number of NGO’s and parliamentarians affirmed the role of civil society inassessing public sector performance and in enforcing accountability.
The success that has been had with the practice of public notices should be exploited and expanded to itsfullest. It can be replicated in a broad range of sectoral and local planning and management operations. Theposting of notices could be applied not just for resource allocations, but also for other aspects of publicsector operations such as appointments and promotions, work planning and decision making criteria.
To facilitate the practice, it is recommended that all operating units be requested to designate anappropriate space for posting of notices. A practice of placing notices in newspapers and through radiobroadcasts would give additional thrust. Failure to facilitate appropriate public notices can be made asanctionable managerial responsibility, with NGO’s involved in monitoring compliance.
Instant mini-surveys or client ‘reportcards’ - where service users upon exit from a facility rate differentaspects of facility service provision, should be considered as a mechanism for direct end user feedback onservice facility quality23. Reportcards can be used to monitor aspects of client satisfaction on a daily basis,can be tailored to individual service facilities, and can be fed directly into frontline operational decisionmaking. Reportcards complement the NSDS by being an ongoing practice rather than sporadic ‘snapshot’exercise. Report cards can be used to monitor performance relative to national standards establishedthrough NSDS or relative to commitments made in client charters established by individual ministries orthe service providers themselves.
The Community Based Management Information System (CBMIS) initiative, which aims to helpcommunities articulate their development needs and priorities, as well as MGLSD efforts to mobilizecommunities in the local development planning and management process, can be harnessed instrengthening transparency and participation in the M&E function.
In order to maintain the credibility that initial transparency initiatives has created, it will be important thatgovernment is seen to act upon cases of malpractice that surface through civil society monitoring of publicservices.
3.6 PEAP partnerships principles
It is recommended that donors, in the spirit of their support for the CDF initiative, should be requested tohelp ascertain that all domestic development efforts are fully aligned with national policy priorities andM&E practices. The PEAP partnership principles24 should be vigorously promoted.
CDF partners can, moreover, be requested to support the pooling of project and programme-levelmanagement and M&E skills/training components and activities into a coordinated, civil-service widecapacity development effort. Although locally based donor agencies may have little autonomy over theiragency policies, Uganda’s pilot status within the HIPC and CDF initiatives may be leveraged for medium-term change in practices.
22 “Assessing public sector performance – a role for civil society”, held in Kampala 16 October 2000.23 The practice of “suggestion boxes” is widespread, but responses are reportedly not systematically analysed or acted upon.Suggestions boxes are, in any case, highly vulnerable to biased sampling errors.24 Original set of principles identified at CDF-sponsored Stockholm Conference “Making Partnership Work on the Ground”, August1999. Quoted in Revised PEAP (Vol. I) Draft 3, July 2000.
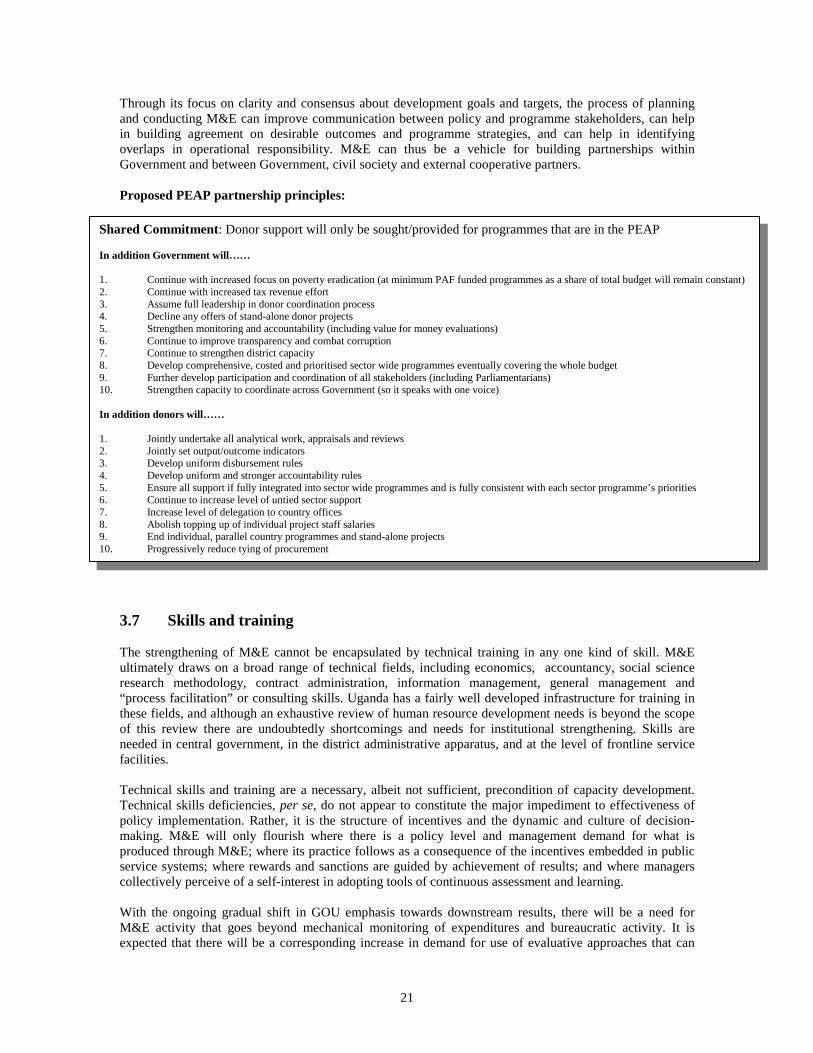
21
Through its focus on clarity and consensus about development goals and targets, the process of planningand conducting M&E can improve communication between policy and programme stakeholders, can helpin building agreement on desirable outcomes and programme strategies, and can help in identifyingoverlaps in operational responsibility. M&E can thus be a vehicle for building partnerships withinGovernment and between Government, civil society and external cooperative partners.
Proposed PEAP partnership principles:
3.7 Skills and training
The strengthening of M&E cannot be encapsulated by technical training in any one kind of skill. M&Eultimately draws on a broad range of technical fields, including economics, accountancy, social scienceresearch methodology, contract administration, information management, general management and“process facilitation” or consulting skills. Uganda has a fairly well developed infrastructure for training inthese fields, and although an exhaustive review of human resource development needs is beyond the scopeof this review there are undoubtedly shortcomings and needs for institutional strengthening. Skills areneeded in central government, in the district administrative apparatus, and at the level of frontline servicefacilities.
Technical skills and training are a necessary, albeit not sufficient, precondition of capacity development.Technical skills deficiencies, per se, do not appear to constitute the major impediment to effectiveness ofpolicy implementation. Rather, it is the structure of incentives and the dynamic and culture of decision-making. M&E will only flourish where there is a policy level and management demand for what isproduced through M&E; where its practice follows as a consequence of the incentives embedded in publicservice systems; where rewards and sanctions are guided by achievement of results; and where managerscollectively perceive of a self-interest in adopting tools of continuous assessment and learning.
With the ongoing gradual shift in GOU emphasis towards downstream results, there will be a need forM&E activity that goes beyond mechanical monitoring of expenditures and bureaucratic activity. It isexpected that there will be a corresponding increase in demand for use of evaluative approaches that can
Shared Commitment: Donor support will only be sought/provided for programmes that are in the PEAP
In addition Government will……
1. Continue with increased focus on poverty eradication (at minimum PAF funded programmes as a share of total budget will remain constant)2. Continue with increased tax revenue effort3. Assume full leadership in donor coordination process4. Decline any offers of stand-alone donor projects5. Strengthen monitoring and accountability (including value for money evaluations)6. Continue to improve transparency and combat corruption7. Continue to strengthen district capacity8. Develop comprehensive, costed and prioritised sector wide programmes eventually covering the whole budget9. Further develop participation and coordination of all stakeholders (including Parliamentarians)10. Strengthen capacity to coordinate across Government (so it speaks with one voice)
In addition donors will……
1. Jointly undertake all analytical work, appraisals and reviews2. Jointly set output/outcome indicators3. Develop uniform disbursement rules4. Develop uniform and stronger accountability rules5. Ensure all support if fully integrated into sector wide programmes and is fully consistent with each sector programme’s priorities6. Continue to increase level of untied sector support7. Increase level of delegation to country offices8. Abolish topping up of individual project staff salaries9. End individual, parallel country programmes and stand-alone projects10. Progressively reduce tying of procurement
22
help improve knowledge about interrelationships between operational programmes and service delivery onthe one hand and the reality of poverty or development changes on the other. Amongst the training that ison offer in Uganda, a noteworthy absence is planning and conduct of programme evaluation. Another areaof skills for which a demand may emerge, will be the planning and conduct of client satisfaction surveysand scorecards – in particular at the district and service provider facility levels.
Under both the LGDP and EFMPII IDA projects there are funding opportunities that are relevant to M&Ecapacity and skills development25. In addition, part of the 5% of PAF earmarking for “monitoring andaccountability” should be considered as a funding source for evaluation skills development.
M&E skills can be placed on the agenda of the Government Training Policy Framework that is currentlybeing prepared, as well the district management capacity development efforts that are being planned underthe LGDP.
A further element of skills and capacity development would be the establishment of a national evaluationassociation, a proposal that was made by participants at the M&E workshop organized by MFPED inKampala in October 2000.
25 Component 4 of LGDP, valued at US$ 12.7m, is aimed at supporting the management, monitoring and evaluation functions withinthe context of Uganda’s decentralization programme.

23
Table 4: Summary of Strategic Issues, Challenges and Possible Actions
OverallM&ETask
Monitor & provide feedback on progress in poverty alleviation
StrategicM&EIssues
1. Coordinationandharmonization
2. Developmentgoals, targetsandperformanceindicators
3. Incentives forcontribution toresults
4. Devolutionof managerialautonomy
5. Role of civilsociety inenforcingtransparencyandaccountability
6. PEAPpartnershipsprinciples
7. M&E skillstraining
Positiveelements inUganda
* Draft PovertyMonitoringStrategy* Sector WorkingGroups (SWG) asnexus of planning,budgeting* Efforts toharmonize projectprogress reporting* Earmarking of5% of PAF fundsfor ‘monitoring &accountability’
* PEAP/PRSP asoverall frameworkof poverty priorities* Training in ROM(results orientedmanagement) beingpiloted* “Indicator retreat”as part of budgetcycle
* Recognition ofservice deliveryeffectiveness asimperative of publicmanagement* National ServiceDelivery Survey2000
* Decentralizedresponsibility forservice delivery* Introduction ofoutput orientedbudgeting (OOB)* Comprehensivedistrict plans* LGDP capacitydevelopment
* Consultativenature of PEAPprocess* Transparency ofbudget process* Practice of publicnotices* Significantcapacity of NGO’s* Government/ civilsociety dialogue atcentral level
* Draft/CDFpartnershipprinciples* Trend towardsbudget support* Consultativegroup meetingbeing scheduledas part of budgetcycle
* Awareness ofM&E importance* Availability oflocal researchers;local academicand trainingtraditions
Somechallengesbeing en-countered
* Separateplanning andreporting formatsfor differentfunding sources* Sector/districtpolicies, budgetsworkplansapproached asseparate exercises* Alignment andcoordination ofdifferent resultsmanagementinitiatives* 1/3 of ODA isTA outside ofGovernmentbudget
* Inconsistency inclarity of goals atsector level* PEAP goalscorrespond toministerial activitiesrather than povertyoutcomes* Few goals aredefined withmeasurabletimeframe, baselineand targets* Weak linkagebetween sectoraland district goals
* Performanceassessed in terms ofexpenditure andbureaucraticactivity* Weak linkagebetween resourceallocation andperformance* Rewards gearedto good paper-work* Inconsistentenforcement ofsanctions for poorperformance*Corruption largelyunpunished?
* Generally weakmanagementcapacities at locallevels* Prescribedspending ratios ofconditional grantscheme giveslittle flexibilityfor managers toadapt to localneeds* Number andlevel of postsdirected from thecenter
* Need forimprovedstakeholderconsultation inpriority-setting* 1/3 of ODA is TAoutside ofGovernmentbudgets and M&Epractices* GOU/NGOdialogue at centernot mirrored atlocal levels
* 1/3 of ODA isTA outside ofGovernmentbudgets andM&E* Nearly 300stand-aloneprojects remain* Twentyseparate annualprogrammereviews* Local donorscannot departfrom corporateM&E guidelines
* Weakmanagementskills at LGlevels* Likely increasein demand formanagement andconduct of M&Edealing withinter-relationshipbetween servicedelivery andpoverty outcomes
Possibleactions toaddresschallenges
* Identification ofan M&E championministry/agency* Establishment of‘core M&E’arrangements (suchas via a formalM&E framework),harmonization ofterminology,reporting formatsand periodicity* Improvedcoordinationbetween inspectionand audit agencies
* Cascading ofPEAP goals andtargets throughplanning, budgetingand work planningat sector, districtand facility levels* LTEF focus ondefining medium-term PEAP goals &targets
* Introduction ofreach and outcomesas yardstick ofsuccess andperformance reward* Use of NSDS asbarometer of clientsatisfactionimprovements* Introduce valuefor money concernsin Finance Act*Introduction ofclient servicecharters
* Allow greaterlocal autonomyover recruitment,salaries and non-wageexpenditures*Ensure strongerlocal oversight asthe quid pro quo*Introduction ofparticipatoryM&E practices askey managementfunction
* Extendtransparencypractice fromallocation toexecution* Client‘Reportcards’ ascomplement toNSDS* Make NGO’seligible for PAF‘monitoring &accountability’funding*introduction ofclient servicecharters
* Leverage ofdonor support forCDF and PEAPto increasesynergy inplanning,reporting &review* PRSC policymatrix as jointplanning &reviewmechanism
* Strengthenlocal capacity forprogrammeevaluation skillstraining* Availability ofM&E fundingwithin PAF,LGDP andEFMPII* Establishmentof nationalevaluationassociation
24
4.0 NEXT STEPS
Ugandan authorities have recognized the importance of instilling an orientation towards real results in theirpoverty eradication efforts. Effectiveness of public service delivery has been defined as the current themeof development management and reform. A number of actions and initiatives, which relate to theimperative of results orientation, are underway. The major problem with e.g. PEAP formulation, OOB,ROM, pay reform, local government capacity development, poverty and service delivery monitoring hasbeen that these efforts have been dealt with as separate and compartmentalized issues.
From an M&E perspective, the overall challenge for government is then coordination; to bring alignment,coherence and synergy to the order of development goals, poverty eradication progress measures, workplanning instruments, managerial incentives, programme review and performance assessment practices.MFPED has proven its ability to bring consultation and coordination to multi-sectoral national tasks, suchas formulation of the PEAP and economic management reform. With its inevitable responsibility for theresource component of the decision making equation, MFPED is logical champion of the coordination taskat hand.
The previous section sought to highlight some of the major strategic areas in which improvements, as seenfrom an M&E perspective, can be made. These will require policy consultations and operational action onseveral fronts. The strengthening of results orientation and M&E is necessarily an ongoing and long-termprocess of advocacy and awareness building, institutional liaison, systems adjustment and skills formation.GOU is encouraged to explicitly recognise and work to strengthen it within the PEAP/PRSP andCAS/PRSC frameworks. The policy matrix being prepared for the PRSC appropriately defines M&E as across-cutting public sector reform issue within a results management context.
This report highlights some strategic issues that seem critical in the specific context of Uganda. However, itis for GOU to validate and prioritise among the many possible avenues for addressing the issues raised. Theimmediate priority would be to establish a more detailed action plan and timetable for coordination,technical reviews and assignment of responsibilities. In the following section, a small number of specificshort-term actions critical to making headway with M&E and results orientation are proposed.
4.1 Refinement of PEAP goals and targets
In the current budget cycle and ongoing revision of the PEAP, emphasis must be placed on distillation ofclear and consistent poverty goals, targets and performance indicators pertaining to the reach and outcomelevels of change – covering a medium term timeframe such as 2, 5 and 10 years. If the process ofidentifying performance indicators is left entirely to ministries themselves they are likely to respond withmeasures that primarily reflect efforts and processes. Central coordination and civil society involvementwill therefore be required to ensure that measures identified will represent a comprehensive and coherentreflection of real progress with poverty eradication.
4.2 Continuous monitoring of service delivery
The 2000 national service delivery survey, the results of which will be available shortly, represents animmediate opportunity for operationalising service reach and client satisfaction. It is critical that the NSDSnot be approached as “just yet another study”, but rather as an instrument for establishing goals and targetsin respect of client service improvements and standards for performance assessment via an instrumentsuch as client service charters. In this regard, it will be important that the regular conduct of the NSDS isassured and that service delivery data be integrated with ministerial MIS systems.

25
4.3 Expand scope of reporting harmonization
The mandate for current efforts to define a uniform format for project progress reporting should beexpanded to encompass harmonization of reporting pertaining to broader sector and poverty programmes. Itwould be useful to establish an inventory of the entire body of domestic M&E and reporting guidelines inorder to establish a “core set” of M&E arrangements common to all funding schemes, expenditure types,sectors, and administrative levels. An immediate concern would be review of the sector-specific PAFguidelines that are under preparation by line ministries. A further item of harmonization would be donorM&E arrangements, as articulated in the proposed CDF/PEAP partnership principles.
4.4 Finalization of poverty monitoring strategy
Ongoing efforts, coordinated by MFPED, to draft a national poverty monitoring strategy represent animportant opportunity for bringing closure to existing uncertainties regarding the objectives, roles andresponsibilities for M&E. The national poverty forum, the poverty monitoring steering committee and thepoverty monitoring network are forums that bring together the appropriate senior and technical levelofficials from government and from civil society. These structures can be brought to bear on the needsidentified above for refining PEAP results indicators and for harmonization of reporting. The povertymonitoring strategy should comprise more than a technical review of PEAP monitoring indicators. Thestrategy should seek establish the linkage between the two currently separate streams of poverty andresource monitoring.
4.5 Identify and disseminate “good practice” approaches to M&E
Uganda already has a number of activities and initiatives that broadly relate to the M&E concerns raised bythis report. The overall opportunity is to bring alignment, coherence and synergy to what exists. This willalso require economy and prioritization among the diverse approaches and methodologies at hand. Webelieve that it would be useful to actively seek out and promote individual practices and instruments,among those that exist at the sector, district and facility levels, that appear to best fit Uganda’s overalldevelopment management needs. The issue is not one of imposing a uniform system of M&E onto theresponsibilities of already overburdened managers, but rather for GOU to take a holistic stance on whatrepresents a sensible balance between the ideal and the practical.
26
ANNEX 1: CONTEXT OF DEVELOPMENT PLANNING ANDMANAGEMENT
Uganda has undertaken comprehensive reforms in economic management, and has within the last decadeachieved stabilization of its public finances. The average real rate of GDP growth has been 6.9 percent perannum since 1990/91, resulting in an annual 3.7 percent increase in real GDP per capita and a 20 percentdecline in poverty (headcount index) from 1992 to 1997. On the social front, important progress has beenmade in respect of e.g. primary school enrollment and in reduction of HIV/AIDS prevalence. Uganda’shuman development index, a composite measure of incomes, longevity and literacy rates, has improvedfrom 0.329 in 1992 to .509 in 199926. However, although the proportion of Ugandans living in consumptionpoverty fell from 56% in 1992 to 44% in 1997, wide disparities remain in the rate of welfare gain.
External acclaim for Uganda’s recent development management efforts is evidenced by her advancedposition within the highly indebted poor country (HIPC) initiative, being the first country to qualify forenhanced HIPC relief, as well as the trend towards programmatic aid entrusted to national authorities.
A: PEAP as national development framework
With national aspirations and directions for long-term development having been brought into focus throughthe Vision 2025 exercise, the Poverty Eradication Action Plan (PEAP) has guided the formulation ofGovernment policy in Uganda since its inception in 1997.
PEAP has emanated from a broad process of analysis, reflection and consultation – drawing on localcommunities, civil society, the donor community and the government. The formulation of PEAP has beencoordinated by the Ministry of Finance, Planning and Economic Development (MFPED).
The PEAP represents Uganda’s response to the Comprehensive Development Framework (CDF) initiative,and has been revised into the format of the World Bank/IMF Poverty Reduction Strategy Paper (PRSP).
The overall objective of the PEAP is to reduce the incidence of absolute poverty from 44% in 1996/97 to10% by 2017.
The PEAP is established on four major pillars:
• Creating a framework for economic growth and transformation• Ensuring good governance and security• Directly increasing the ability of the poor to raise their incomes• Directly increasing the quality of life for the poor
B: Budget process
Uganda’s current MTEF three year rolling budget system represents the interface between PEAP goals andoperational management. The fiscal year is July—June, and the annual budget cycle starts in October withan inter-ministerial workshop at which tentative budget ceilings are announced by MFPED. A consultativeprocess drawing on the activities of the sector working groups (SWGs discussed below) follows this andculminates in agreed sectoral Budget Framework Papers (BFP) that are normally completed by end of
26 “Uganda National Human Development Report 2000”, UNDP, Kampala, forthcoming
27
April. In parallel, but commencing in November, a similar process is undertaken with the 45 districts underthe coordination of the Ministry of Local Government (MLG). As an input to their BFP preparation, mostdistricts prepare a District Development Plan (DDP). The sector and district BFP’s are ultimatelyconsolidated into the MTEF. MFPED conducts its review of the MTEF process through the series of BFPconsultative meetings and has established a unit for Budget Policy and Evaluation, headed by aCommissioner.
The budget process in Uganda is characterized by relative transparency and openness, with MFPED havingintroduced a number of measures to keep the public informed and involved throughout the cycle27,including an annual retreat with civil society and donor stakeholders to review experiences from theprevious budget cycle28.
Both ministries and districts have planning units with officers responsible for coordinating strategyplanning, budget preparation, monitoring and reporting. Accounting Officers have responsibility foraccounts management, expenditure control and liaison with the audit functions. Each administrative unithas a Chief Administrative Officer (CAO) – in Ministries this is the Permanent Secretary (PS).
PEAP is buttressed by the Poverty Action Fund (PAF), which has been established as a vehicle forchanneling incremental resources made available through HIPC into the Priority Programme Areas (PPA)of primary health, primary education, water and sanitation, agricultural extension and rural roads. Inaddition to HIPC, the PAF includes budget support funds pledged by external donors. PAF spending isprojected to increase by 35 percent in 2000/01; 10 percent in 2001/02 and 17 percent in 2002/03. PAFspending will increase, as a share of GOU expenditures, from 22.7 percent in 1998/99 to 32.5 percent in2002/03.
The MTEF budget format has been important in introducing a planning horizon that extends beyondindividual projects and financial years. To further extend the resource planning horizon, a long-termexpenditure framework (LTEF), covering a 10-year period, is being considered.
The resource constrained budget system helps induce realism in sector planning. To further strengthenresults orientation within the MTEF process, MFPED is introducing output oriented budgeting (OOB). Theapproach is based on unit costing, yet to be established, whereby types of outputs are given a standard valueagainst which budget proposals and performance can be assessed. Our recommendation is that strongcentral coordination be applied to setting of standards for outputs and unit costs. An inherent risk withoutput oriented budgeting is that if managers define their own performance indicators they tend to choosethose that can easily be measured rather than those that are important. Completing a number of workshopsor producing booklets may well be outputs, but they are of the lowest order.
As part of its effort to further improve expenditure management, the Government has embarked on themodernization of its fiscal systems. It plans to commence this process with a fiscal management study(FMS) under IDA Economic and Financial Management Programme (EFMPII29). The FMS will provide aroadmap for the computerization of GOU's fiscal systems beginning with the budgeting and accountingprocesses at central and local levels. EFMPII also addresses harmonization of the central and localgovernment planning processes and institutionalization of the preparation of local government BFP’s.
27 MFPED, “Improving Budget Transparency in Uganda: Informing stakeholders and including them in the budget process”, Phase IReport. See also Gariyo, Zie, May 2000, “Citizen involvment in the budgetary process in Uganda”, Uganda Debt Network, Glasgow(http://www.worldbank.org/participation/ugandabudget.htm).28 MFPED, October 2000, “(Draft) Report on Forum on Stakeholder’s Reflection on the Previous (FY1999/01) Budget Process”.29 World Bank, October 1999, “Second Economic and Financial Management Project”, Project Appraisal Document, Washington D.C.
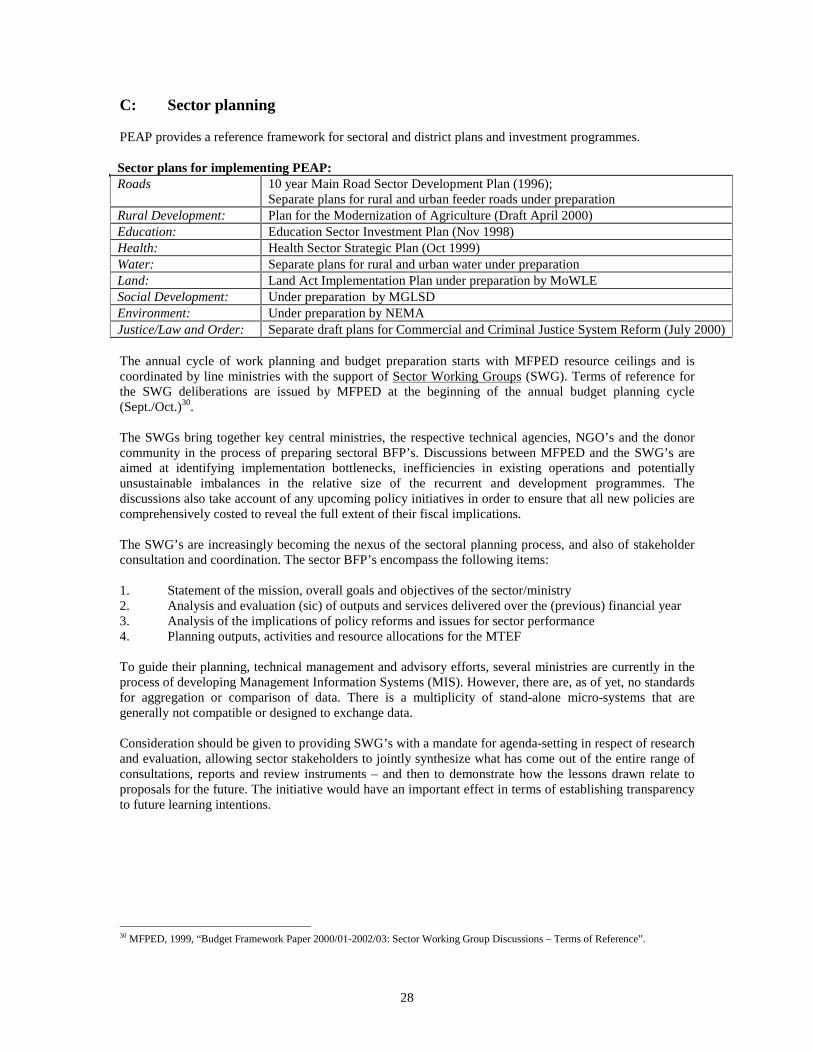
28
C: Sector planning
PEAP provides a reference framework for sectoral and district plans and investment programmes.
Sector plans for implementing PEAP:Roads 10 year Main Road Sector Development Plan (1996);
Separate plans for rural and urban feeder roads under preparationRural Development: Plan for the Modernization of Agriculture (Draft April 2000)Education: Education Sector Investment Plan (Nov 1998)Health: Health Sector Strategic Plan (Oct 1999)Water: Separate plans for rural and urban water under preparationLand: Land Act Implementation Plan under preparation by MoWLESocial Development: Under preparation by MGLSDEnvironment: Under preparation by NEMAJustice/Law and Order: Separate draft plans for Commercial and Criminal Justice System Reform (July 2000)
The annual cycle of work planning and budget preparation starts with MFPED resource ceilings and iscoordinated by line ministries with the support of Sector Working Groups (SWG). Terms of reference forthe SWG deliberations are issued by MFPED at the beginning of the annual budget planning cycle(Sept./Oct.)30.
The SWGs bring together key central ministries, the respective technical agencies, NGO’s and the donorcommunity in the process of preparing sectoral BFP’s. Discussions between MFPED and the SWG’s areaimed at identifying implementation bottlenecks, inefficiencies in existing operations and potentiallyunsustainable imbalances in the relative size of the recurrent and development programmes. Thediscussions also take account of any upcoming policy initiatives in order to ensure that all new policies arecomprehensively costed to reveal the full extent of their fiscal implications.
The SWG’s are increasingly becoming the nexus of the sectoral planning process, and also of stakeholderconsultation and coordination. The sector BFP’s encompass the following items:
1. Statement of the mission, overall goals and objectives of the sector/ministry2. Analysis and evaluation (sic) of outputs and services delivered over the (previous) financial year3. Analysis of the implications of policy reforms and issues for sector performance4. Planning outputs, activities and resource allocations for the MTEF
To guide their planning, technical management and advisory efforts, several ministries are currently in theprocess of developing Management Information Systems (MIS). However, there are, as of yet, no standardsfor aggregation or comparison of data. There is a multiplicity of stand-alone micro-systems that aregenerally not compatible or designed to exchange data.
Consideration should be given to providing SWG’s with a mandate for agenda-setting in respect of researchand evaluation, allowing sector stakeholders to jointly synthesize what has come out of the entire range ofconsultations, reports and review instruments – and then to demonstrate how the lessons drawn relate toproposals for the future. The initiative would have an important effect in terms of establishing transparencyto future learning intentions.
30 MFPED, 1999, “Budget Framework Paper 2000/01-2002/03: Sector Working Group Discussions – Terms of Reference”.
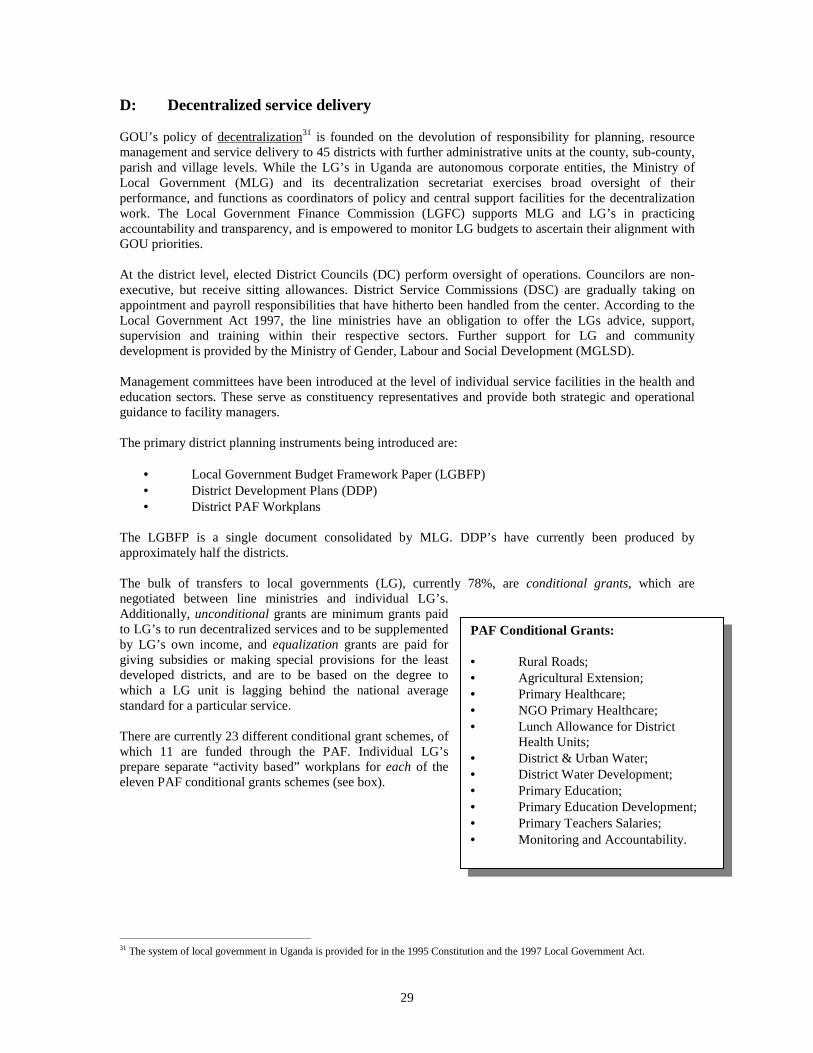
29
D: Decentralized service delivery
GOU’s policy of decentralization31 is founded on the devolution of responsibility for planning, resourcemanagement and service delivery to 45 districts with further administrative units at the county, sub-county,parish and village levels. While the LG’s in Uganda are autonomous corporate entities, the Ministry ofLocal Government (MLG) and its decentralization secretariat exercises broad oversight of theirperformance, and functions as coordinators of policy and central support facilities for the decentralizationwork. The Local Government Finance Commission (LGFC) supports MLG and LG’s in practicingaccountability and transparency, and is empowered to monitor LG budgets to ascertain their alignment withGOU priorities.
At the district level, elected District Councils (DC) perform oversight of operations. Councilors are non-executive, but receive sitting allowances. District Service Commissions (DSC) are gradually taking onappointment and payroll responsibilities that have hitherto been handled from the center. According to theLocal Government Act 1997, the line ministries have an obligation to offer the LGs advice, support,supervision and training within their respective sectors. Further support for LG and communitydevelopment is provided by the Ministry of Gender, Labour and Social Development (MGLSD).
Management committees have been introduced at the level of individual service facilities in the health andeducation sectors. These serve as constituency representatives and provide both strategic and operationalguidance to facility managers.
The primary district planning instruments being introduced are:
• Local Government Budget Framework Paper (LGBFP)• District Development Plans (DDP)• District PAF Workplans
The LGBFP is a single document consolidated by MLG. DDP’s have currently been produced byapproximately half the districts.
The bulk of transfers to local governments (LG), currently 78%, are conditional grants, which arenegotiated between line ministries and individual LG’s.Additionally, unconditional grants are minimum grants paidto LG’s to run decentralized services and to be supplementedby LG’s own income, and equalization grants are paid forgiving subsidies or making special provisions for the leastdeveloped districts, and are to be based on the degree towhich a LG unit is lagging behind the national averagestandard for a particular service.
There are currently 23 different conditional grant schemes, ofwhich 11 are funded through the PAF. Individual LG’sprepare separate “activity based” workplans for each of theeleven PAF conditional grants schemes (see box).
31 The system of local government in Uganda is provided for in the 1995 Constitution and the 1997 Local Government Act.
PAF Conditional Grants:
• Rural Roads;• Agricultural Extension;• Primary Healthcare;• NGO Primary Healthcare;• Lunch Allowance for District
Health Units;• District & Urban Water;• District Water Development;• Primary Education;• Primary Education Development;• Primary Teachers Salaries;• Monitoring and Accountability.
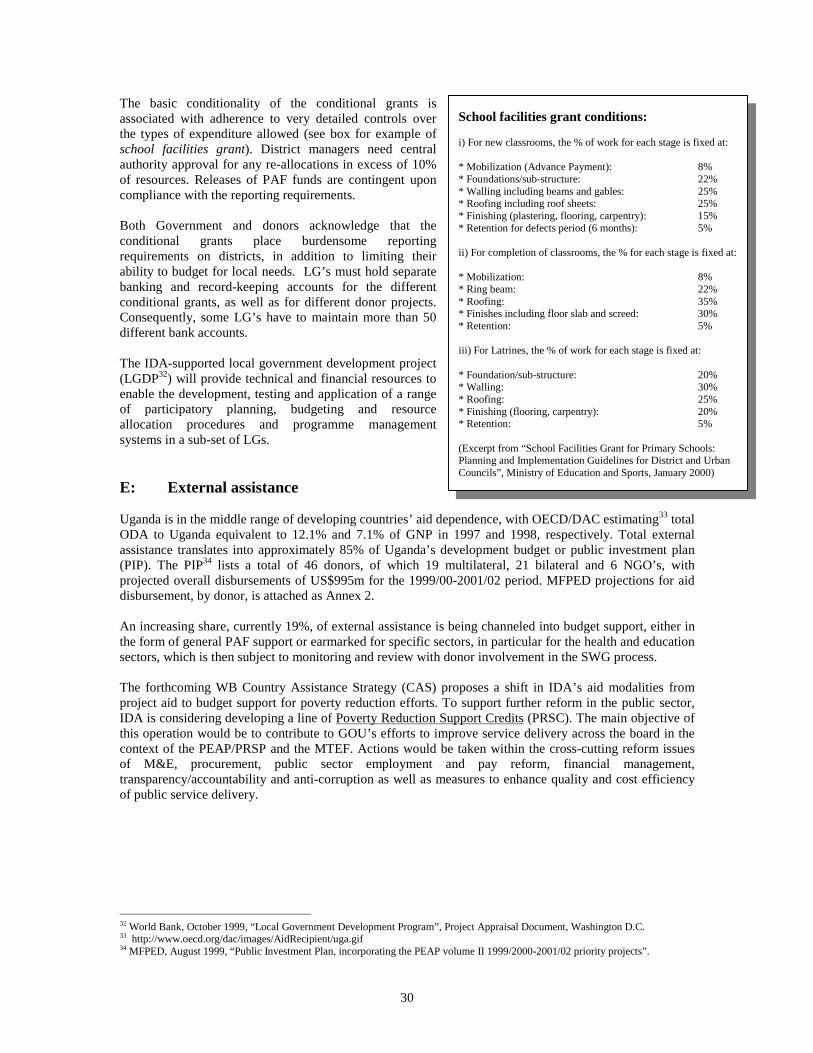
30
The basic conditionality of the conditional grants isassociated with adherence to very detailed controls overthe types of expenditure allowed (see box for example ofschool facilities grant). District managers need centralauthority approval for any re-allocations in excess of 10%of resources. Releases of PAF funds are contingent uponcompliance with the reporting requirements.
Both Government and donors acknowledge that theconditional grants place burdensome reportingrequirements on districts, in addition to limiting theirability to budget for local needs. LG’s must hold separatebanking and record-keeping accounts for the differentconditional grants, as well as for different donor projects.Consequently, some LG’s have to maintain more than 50different bank accounts.
The IDA-supported local government development project(LGDP32) will provide technical and financial resources toenable the development, testing and application of a rangeof participatory planning, budgeting and resourceallocation procedures and programme managementsystems in a sub-set of LGs.
E: External assistance
Uganda is in the middle range of developing countries’ aid dependence, with OECD/DAC estimating33 totalODA to Uganda equivalent to 12.1% and 7.1% of GNP in 1997 and 1998, respectively. Total externalassistance translates into approximately 85% of Uganda’s development budget or public investment plan(PIP). The PIP34 lists a total of 46 donors, of which 19 multilateral, 21 bilateral and 6 NGO’s, withprojected overall disbursements of US$995m for the 1999/00-2001/02 period. MFPED projections for aiddisbursement, by donor, is attached as Annex 2.
An increasing share, currently 19%, of external assistance is being channeled into budget support, either inthe form of general PAF support or earmarked for specific sectors, in particular for the health and educationsectors, which is then subject to monitoring and review with donor involvement in the SWG process.
The forthcoming WB Country Assistance Strategy (CAS) proposes a shift in IDA’s aid modalities fromproject aid to budget support for poverty reduction efforts. To support further reform in the public sector,IDA is considering developing a line of Poverty Reduction Support Credits (PRSC). The main objective ofthis operation would be to contribute to GOU’s efforts to improve service delivery across the board in thecontext of the PEAP/PRSP and the MTEF. Actions would be taken within the cross-cutting reform issuesof M&E, procurement, public sector employment and pay reform, financial management,transparency/accountability and anti-corruption as well as measures to enhance quality and cost efficiencyof public service delivery.
32 World Bank, October 1999, “Local Government Development Program”, Project Appraisal Document, Washington D.C.33 http://www.oecd.org/dac/images/AidRecipient/uga.gif34 MFPED, August 1999, “Public Investment Plan, incorporating the PEAP volume II 1999/2000-2001/02 priority projects”.
School facilities grant conditions:
i) For new classrooms, the % of work for each stage is fixed at:
* Mobilization (Advance Payment): 8%* Foundations/sub-structure: 22%* Walling including beams and gables: 25%* Roofing including roof sheets: 25%* Finishing (plastering, flooring, carpentry): 15%* Retention for defects period (6 months): 5%
ii) For completion of classrooms, the % for each stage is fixed at:
* Mobilization: 8%* Ring beam: 22%* Roofing: 35%* Finishes including floor slab and screed: 30%* Retention: 5%
iii) For Latrines, the % of work for each stage is fixed at:
* Foundation/sub-structure: 20%* Walling: 30%* Roofing: 25%* Finishing (flooring, carpentry): 20%* Retention: 5%
(Excerpt from “School Facilities Grant for Primary Schools:Planning and Implementation Guidelines for District and UrbanCouncils”, Ministry of Education and Sports, January 2000)
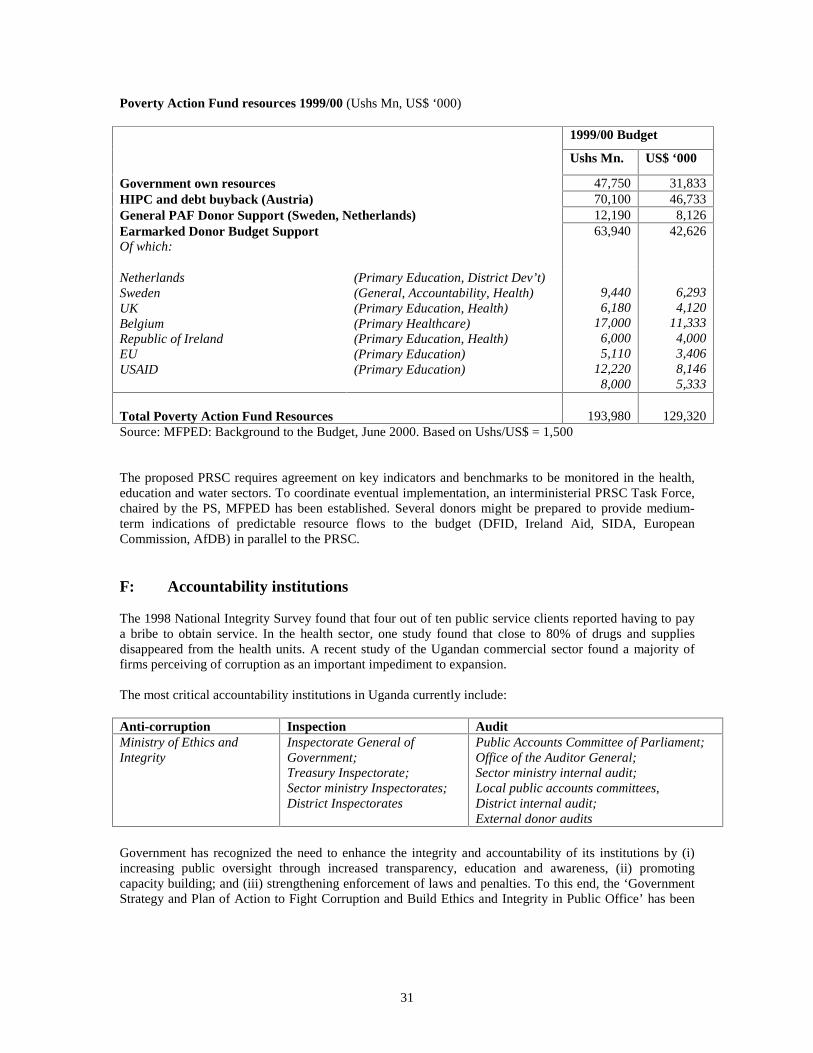
31
Poverty Action Fund resources 1999/00 (Ushs Mn, US$ ‘000)
1999/00 Budget
Ushs Mn. US$ ‘000
Government own resources 47,750 31,833HIPC and debt buyback (Austria) 70,100 46,733General PAF Donor Support (Sweden, Netherlands) 12,190 8,126Earmarked Donor Budget SupportOf which:
NetherlandsSwedenUKBelgiumRepublic of IrelandEUUSAID
(Primary Education, District Dev’t)(General, Accountability, Health)(Primary Education, Health)(Primary Healthcare)(Primary Education, Health)(Primary Education)(Primary Education)
63,940
9,4406,180
17,0006,0005,110
12,2208,000
42,626
6,2934,120
11,3334,0003,4068,1465,333
Total Poverty Action Fund Resources 193,980 129,320Source: MFPED: Background to the Budget, June 2000. Based on Ushs/US$ = 1,500
The proposed PRSC requires agreement on key indicators and benchmarks to be monitored in the health,education and water sectors. To coordinate eventual implementation, an interministerial PRSC Task Force,chaired by the PS, MFPED has been established. Several donors might be prepared to provide medium-term indications of predictable resource flows to the budget (DFID, Ireland Aid, SIDA, EuropeanCommission, AfDB) in parallel to the PRSC.
F: Accountability institutions
The 1998 National Integrity Survey found that four out of ten public service clients reported having to paya bribe to obtain service. In the health sector, one study found that close to 80% of drugs and suppliesdisappeared from the health units. A recent study of the Ugandan commercial sector found a majority offirms perceiving of corruption as an important impediment to expansion.
The most critical accountability institutions in Uganda currently include:
Anti-corruption Inspection AuditMinistry of Ethics andIntegrity
Inspectorate General ofGovernment;Treasury Inspectorate;Sector ministry Inspectorates;District Inspectorates
Public Accounts Committee of Parliament;Office of the Auditor General;Sector ministry internal audit;Local public accounts committees,District internal audit;External donor audits
Government has recognized the need to enhance the integrity and accountability of its institutions by (i)increasing public oversight through increased transparency, education and awareness, (ii) promotingcapacity building; and (iii) strengthening enforcement of laws and penalties. To this end, the ‘GovernmentStrategy and Plan of Action to Fight Corruption and Build Ethics and Integrity in Public Office’ has been

32
prepared by the Ministry of Ethics and Integrity (DEI)35 and was launched by H.E. The President in July2000.
Several constraints to the implementation of the plan of action remain, e.g., lack of resources, both humanand financial, low public sector salaries, weak information management, and social, historical and culturalfactors contributing to elevating informal rules over the formal ones.
There is clearly room for accountability institutions and ministry inspectorates to improve the coordinationof their visits, selection of districts and review of follow up to earlier inspection findings andrecommendations. A further concern with accountability arrangements is that the 1964 Public Finance Actdoes not compel accounting officers to obtain value for money nor for the Auditor General to examine andvalidate for this. Considerable uncertainty therefore remains in obtaining comfort that value for money hasbeen achieved in budget execution. In line with the recent draft country financial accountabilityassessment36, we recommend that this issue be addressed in the revision of the Act.
An innovative way of introducing accountability is represented by the existing stipulation that districts postmandatory public notices for every conditional grant under PAF each quarter – giving details of workplans,their costs and funds released.
G: Public service management and reform initiatives
The 1989 Public Service Review and Reorganization Commission (PSRRC) found that the Uganda PublicService was marked by a bloated structure, inefficiency and poor performance. Problems identified were adysfunctional organization, poor management skills, inadequate pay, moonlighting, corruption and a lack ofdiscipline.
The number of staff employed by the Public Service has been cut from over 320,000 in 1990 to 157,000 in1997. The number of Ministries has been reduced from 38 in 1992 to 14 in 1998.
The Ministry of Public Service (MPS) is host to the Public Service Commission (PSC), which guidesappointments, service conditions and government payroll; as well as the 1997—2002 Public Sector ReformProgramme (PSRP), which is overseen by the Public Service Reform Coordinating Committee (PSRCC)37.
An overall goal of government reform is to achieve a smaller, better paid and better performing publicservice. Some categories of public servants have had their pay increased almost tenfold over the 1993—97period. MPS estimates that, on average, Public Service pay is still only 42% of the salaries for comparablejobs in the private sector. The pay differential is greater at senior management levels, but smaller withincertain professions such as teaching and nursing. A small number of staff working within the civil serviceenjoy relative prosperity in donor funded pay enclaves. Although the average rate of staff turnover is only4.2% p.a., low pay remains a constraint to motivation for many civil servants.
To inform the development of a Pay Reform Strategy38 being formulated by MPS, studies have recentlybeen completed on job evaluation and market comparators. GOU has recognized that improvements in paywill not automatically result in better motivated staff or improved performance. Staff are unlikely toperform to their potential unless they are clear about the standard of conduct and performance required ofthem, and that there are differentiated sanctions and rewards. Moving pay closer to private sector levelsmust therefore be accompanied by a fundamental shift in management attitudes, and the establishment of adifferent work culture.
35 MEI’s predecessor, the Department of Ethics and Integrity (DEI), in the Office of the President, was (reportedly) established as aresult of a previous (donor) evaluation of the government’s anti-corruption strategy (1998).36 World Bank, September 2000, “First Draft: Republic of Uganda Country Financial Accountability Assessment”, Washington D.C.37 Chaired by the Vice President, and attended by the Permanent Secretaries of the Ministries of Education, Public Service, Justice andConstitutional Affairs, Finance, Planning and Economic Development, and Local Government.38 MPS, August 2000, “(Draft) Proposed Pay Reform Strategy for the Public Service”.
33
A results oriented management scheme (ROM) was initiated back in 1995, and Cabinet has now approved aplan for its introduction to all ministries and districts. The ROM, which is coordinated by MPS, introducesa logframe approach to definition of goals and objectives. A weakness of the ROM initiative to date hasbeen that its activities focus on the conduct of workshops that develop skills pertaining to formulation ofresults statements – without clear linkages to the core operational realities of budgeting, work planning orperformance assessment. Seen in isolation, what is learned is the verbose language of grand intentions,often far removed from what is practically possible. Success with ROM is not reached at the end of aworkshop or even when everyone knows what it is about; it only works when everyone changes the waythey act in their daily business. In recognition of the need to tie ROM more closely to the operationalprocesses, MFPED efforts are underway for closer alignment with the OOB initiative.
A new performance appraisal scheme, to enable individuals to be assessed against jointly agreedperformance targets that are clear, measurable and related to Government objectives, is being piloted forintroduction from the beginning of year 2001. Performance contracts have been introduced at the level ofPermanent Secretaries, but not yet at other levels of management.

34
ANNEX 2: PEAP GOALS AND TARGETS
a) PEAP goals, targets and monitoring indicators
PEAPGOAL39
TARGET MONITORING INDICATORS
1. Creating a framework for economic growth and transformation1.1 Sustainingeconomic growth
7% GDP growth Real consumption per capita; Real GDP/GNP per capita;Investment/GDP; Savings/GDP; Real output by sector; ‘Green’national accounts; Investor/business confidence
1.2 Macroeconomicstability and incentives
5% inflation Inflation; Real exchange rate misalignment; Effective rates ofprotection by sector
1.3 Efficient andequitable tax system
A higher ratio of tax to GDPin the medium term
Tax/GDP ratio; Share of taxes in expenditure
1.4 Debt strategy Debt/GDP; Debt service/exports; Net inflows to public sector ondebt and in total
1.5 Poverty focus ofpublic expenditure
Share of directly poverty-reducing service delivery in (a)government (b) total public spending; Incidence of benefits ofpublic expenditure by income group, gender region
1.6 Financial sectorreform
Real volume and sectoral composition of credit to the private sector
1.7.3 Main roads Condition of roads; Length of roads improved1.8 Commercial sectorlaw reform
Popular perception of quality of judiciary; Investor perception offunctioning of legal system
1.10 Tertiary education Enrollment increased to50.000 by 20038000 students at Makerere30% improvement incompletion90% post-qualificationemployment rate
Total enrollment; Enrollment by socio-economic group, district;Completion rates; Post-qualification employment
2. Good governance and security2.1 Overallsector goalsand humanrights
Public awareness about rights
2.2 Security Casualties from military conflict; Number of people displaced byconflict; Living conditions in protected villages
2.4Transparent,efficient andpoverty-focussedpublicexpenditure
Proportion of high-level corruption cases prosecuted; Publicperception of corruption; Incidence of misappropriation of publicfunds
2.5 Deliveringefficient andhonest publicservices
Proportion of service users paying illegal charges
2.6 Law andorder
Crime rates; Size of remand population; Average length of timespent on remand
2.6.1 CriminalJudiciary andprosecution
Number of cases completed; Size of case backlog; Average delayin bringing cases to court
39 Excludes PEAP/PRSP sub-goals for which neither targets nor monitoring indicators have been defined.
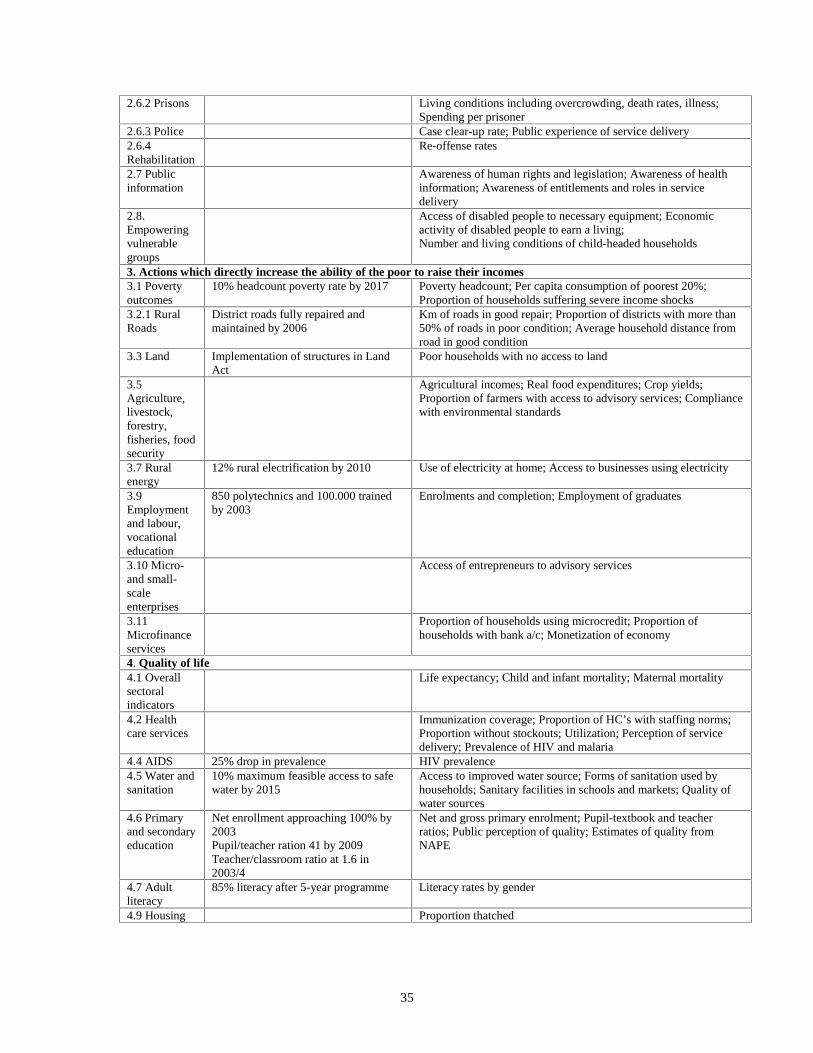
35
2.6.2 Prisons Living conditions including overcrowding, death rates, illness;Spending per prisoner
2.6.3 Police Case clear-up rate; Public experience of service delivery2.6.4Rehabilitation
Re-offense rates
2.7 Publicinformation
Awareness of human rights and legislation; Awareness of healthinformation; Awareness of entitlements and roles in servicedelivery
2.8.Empoweringvulnerablegroups
Access of disabled people to necessary equipment; Economicactivity of disabled people to earn a living;Number and living conditions of child-headed households
3. Actions which directly increase the ability of the poor to raise their incomes3.1 Povertyoutcomes
10% headcount poverty rate by 2017 Poverty headcount; Per capita consumption of poorest 20%;Proportion of households suffering severe income shocks
3.2.1 RuralRoads
District roads fully repaired andmaintained by 2006
Km of roads in good repair; Proportion of districts with more than50% of roads in poor condition; Average household distance fromroad in good condition
3.3 Land Implementation of structures in LandAct
Poor households with no access to land
3.5Agriculture,livestock,forestry,fisheries, foodsecurity
Agricultural incomes; Real food expenditures; Crop yields;Proportion of farmers with access to advisory services; Compliancewith environmental standards
3.7 Ruralenergy
12% rural electrification by 2010 Use of electricity at home; Access to businesses using electricity
3.9Employmentand labour,vocationaleducation
850 polytechnics and 100.000 trainedby 2003
Enrolments and completion; Employment of graduates
3.10 Micro-and small-scaleenterprises
Access of entrepreneurs to advisory services
3.11Microfinanceservices
Proportion of households using microcredit; Proportion ofhouseholds with bank a/c; Monetization of economy
4. Quality of life4.1 Overallsectoralindicators
Life expectancy; Child and infant mortality; Maternal mortality
4.2 Healthcare services
Immunization coverage; Proportion of HC’s with staffing norms;Proportion without stockouts; Utilization; Perception of servicedelivery; Prevalence of HIV and malaria
4.4 AIDS 25% drop in prevalence HIV prevalence4.5 Water andsanitation
10% maximum feasible access to safewater by 2015
Access to improved water source; Forms of sanitation used byhouseholds; Sanitary facilities in schools and markets; Quality ofwater sources
4.6 Primaryand secondaryeducation
Net enrollment approaching 100% by2003Pupil/teacher ration 41 by 2009Teacher/classroom ratio at 1.6 in2003/4
Net and gross primary enrolment; Pupil-textbook and teacherratios; Public perception of quality; Estimates of quality fromNAPE
4.7 Adultliteracy
85% literacy after 5-year programme Literacy rates by gender
4.9 Housing Proportion thatched

36
b) PRSP Goals and Targets
Sector 1998/99 1999/00 2000/01 2001/02 2002/03Education:
Avg. pupil-teacher ratioAvg. pupil-classroom ratioAvg. pupil-book ratio
681316
581186
48994
45883
45793
Health:
Immunisation rate (DPT3)% of health centers with trained staff
35%33%
45%55%
60%61%
70%63%
80%65%
Water:
Boreholes drilledSprings protectedShallow wells protected
10609001000
11009001100
12808001420
15007001700

37
ANNEX 3: EXTERNAL ASSISTANCE PROJECTED AIDDISBURSEMENTS BY TOP 20 DONORS, 1999/00-2001/02(Total, US$m)
Donor 1999/00-2001/02,US$m
IDA 328.0Denmark 162.3European Union 100.6ADF + ADB 59.2Germany 49.8USAID 34.0UNICEF 27.2Italy 24.0Japan 23.4GEF 22.7United Kingdom 17.7UNDP 16.9Egypt 13.9Austria 11.5Sweden 11.1IFAD 10.9Netherlands 10.9WFP 10.8Norway 8.5China 7.3Total for top 20 donors 950.7Total for 26 other donors 44.8Overall projection for 1999/00-2001/02
995.5
Source: Public Investment Plan, 1999/00-2001/02, Annex 2, MFPED August 1999.

38
ANNEX 4: NOTE ON METHODOLOGY AND PEOPLE MET
The OED “Diagnostic Guide and Action Framework for Evaluation Capacity Development” has served asan analytical reference source for the work; providing a conceptual framework, detailed checklists of issuesrelating to incentives, roles and responsibilities, plus a menu of options to strengthen demand and supply ofM&E.
The collection of data for this report was undertaken through a series of interviews and through review ofdocuments during a visit to the World Bank in Washington in March 2000 and two missions to Uganda inApril and October 2000, respectively. During the latter mission a one-day M&E seminar was held inconjunction with MFPED. During the two missions to Uganda we also participated in meetings of:
* PERC/PRSC Task Force* Education Sector Working Group, M&E subcommittee* M&E harmonization committee* Country financial accountability seminar* Monthly donor meeting* Civil Society seminar on “Assessing Government Performance”* Pay reform workshop
People met during Uganda country visits, 2-17 April and 4-20 October 2000
Ainebyona P.Delius Asiimwe
Economist MFPEDResearch Fellow, Makerere Institute of Social Research
Benedict Baraza District Salaries Officer, MubendeRobert Barungi Deputy Headteacher, Kasambiya SchoolLawrence Bategeka Economist, UNDPMoses BekabyeBella BirdBisamalaAlbert K. ByagumishaJohn I.K. ByaruhangaCandirn FlorenceNoah K. DavisKari Egge
Director, Parliamentary Budget OfficeSocial Development Advisor, DFIDEAR, Office of the Prime MinisterAssistant Commissioner Education Planning, MESEconomist, MFPEDPAS, Inspectorate General of GovernmentCountry Director, WFPDeputy Representative, UNICEF
Joseph EllorGrace Ekudu
M&E Officer, EPD, MESProgramme Planning Officer, UNICEF
Okello FrancisDr. Kim Forss
AFO, Moroto DistrictEvaluation Consultant, Sweden
R. Greenhill SE/BPED, MFPEDGuzu D.Morten Heide
NCDIP, NUDIPUFirst Secretary, Royal Norwegian Embassy
David Igulu M&E Officer, UNICEFE.C. JjuukoAlain Joaris
Reporter, Uganda ConfidentialEconomic Advisor, EC Delegation
Mohammed KabaaleKabanu KabonanukyeRose Kafeero
Economist, MFPEDResearcher, MISRCommissioner, Public Service Inspection, MPS
James Kahoza Auditor General

39
Brenda Kafuko MalingaMargaret Kakande
Deputy Director/MSS, Ministry of Ethics & IntergrityPoverty Analyst, Poverty Monitoring Unit, MFPED
Hamzah KakoozaJames K. KaleboJulius KapwepweHarald Karlsnes
Reporter, Radio StarDirector, Uganda Management InstitutePA, UWONETCounsellor, Norwegian Embassy
Norah KatumbaSylvia KeeraDr. J. Kiyaga-NsubugaBritt Hilde Kjoelaas
Senior Economist, MFPEDM & E Advisor,Decentralisation Secretariat, MLGDeputy Director, Uganda Management InstituteFirst Secretary, Norwegian Embassy
Florence Kuteesa Commissioner, Budget Policy and Evaluation, MFPEDPaul Kyama Programme Officer, MLGJohn Kyewalabye Clinical Officer, Kasambya Health ClinicEric Lakidi,Philippe Loop
Reporter, New VisionEconomic Advisor, EC Delegation
Dr. Lwasampijjaf District Health Officer, Mubende DistrictMagona J.M.Sirage MakumbiPhilip Mangeni
AC/SS, MFPEDR.P, East AfricanC/TI, MFPED
Speciosa Mankabirwa Registered Midwife, Kasambya Health ClinicPhillip W. Marugeni Commissioner, MFPEDA. Mayanja Director, Audit Dept.Laban MbulamukoLars MoellerDr. David Muduuli
S. Economist MFPEDPMDU, MFPEDPrincipal Private Secretary to the Vice President
Mary Muduli Director, Budget Dept, MFPEDJane Musika Ag. Chief of Div, Decentralization Secretariat, MOLGAndrew Musoke District Planning Officer, Mubende DistrictDr. N.B. MusisiDr. Ngila Mwase
Director, MISREconomic Advisor, UNDP
Aggrey MwesigwaSolomon MutembaMuwuluke LucySuleiman NamaraH.N. Nayer
Economist, President’s OfficeResearcher, MUBSPrincipal Economist, MFPEDPrincipal Economist, Office of the Prime MinisterFiscal Federalism Adviser, MFPED
William NdoleireMicheal NserekoAsaph NuwagiraJoe K. NuwamanyaDr. Marios Obwona
Senior Economist, MFPEDEconomist, MFPEDM & E Advisor, MAAIFCommissioner, Coordination & Monitoring, Office of the Prime MinisterSenior Research Fellow, EPRC, Makerere University
Patrick OcailapDr. John Odiki
Commissioner, Aid Liaison Department, MFPEDSenior Research Fellow, EPRC, Makerere University
M.H.O. Ogwang Asst. Commissioner, Budget Policy & Evaluation, MFPEDCyriona OkelloFrancis OkoriMathew OkotRobert OkudiMartin Onyach-Olaa
Economist, MoWHCPI, MLGS/Finance, Gulu DistrictPrincipal Economist, MFPEDCoordinator, Programme Management Unit, MOLG
Jimmy OrombitGeorge A.OtimSteve RiceJ. RuhwezaJohn Rudman
Radio UgandaA/Commissioner, MAAIFEconomist, MFPEDFO, MFPEDAdvisor to Director Budget, MFPED
Yosuke Shimamura Social Sector Economist, MFPED
40
Michel SidibeB.O. SimonsenFredrick SsemogerereGeorge Sserungogi
Representative, UNICEFCS/Advisor, UBOSDistrict Service Commission Secretary, Mubende DistrictPF, MFPED
Moses SsonkoDaouda Toure
Finance Officer, MFPEDResident Representative, UNDP
Prof. Sam Tulya-Muhika Chairman, International Development ConsultantsF. Tumuheirwe C/MEP, MFPEDMr. E. Tumusiime-Mutebile Principal Secretary, MFPEDStephen Tumutegyereize Information Systems Officer, MOLGGerald TwijukyeFrancis X.K. Wagaba
Researcher, Uganda Debt NetworkChief, Planning Div., Decentralization Secretariat, MOLG
Dr. Brian Wall Chief Project Analyst, Evaluation & Audit, Ireland AidEdward WalugembeMr. Michael Wamibu
Principal Statistician, MESPrincipal Economist, MFPED
S. Wenkere-Kisembu Director, Decentralization Secretariat, MOLGAlan WhitworthTim Williams
Policy Advisor, MFPEDGovernance Advisor, DFID
George YiggaKharim Ziwa
Special Needs Teacher, Kasambiya SchoolPower FM
41
Other Papers in This Series
#1: Keith Mackay. Lessons from National Experience.
#2: Stephen Brushett. Zimbabwe: Issues and Opportunities.
#3: Alain Barberie. Indonesia’s National Evaluation System.
#4: Keith Mackay. The Development of Australia’s EvaluationSystem.
#5: R. Pablo Guerrero O. Comparative Insights from Colombia, China and Indonesia.
#6: Keith Mackay. Evaluation Capacity Development: A Diagnostic Guide and Action Framework.
#7: Mark Schacter. Sub-Saharan Africa: Lessons from Experience in Supporting Sound Governance.
These and other papers are available from OED’s website for evaluationcapacity development:http://www.worldbank.org/html/oed/evaluation/html/monitoring_and_evaluation_capa.html