Major Malfunction - environmenttexascenter.org€¦ · Major Malfunction Air Pollution from...
43
Major Malfunction Air Pollution from Industrial Malfunctions and Maintenance in Texas in 2017
Transcript of Major Malfunction - environmenttexascenter.org€¦ · Major Malfunction Air Pollution from...

Major MalfunctionAir Pollution from Industrial Malfunctions and
Maintenance in Texas in 2017

Luke Metzger and Grant Durow, Environment Texas
Major MalfunctionAir Pollution from Industrial
Malfunctions and Maintenance in Texas in 2017
January 2019

The authors wish to thank the Environmental Integrity Project for providing the data for which this analy-sis was done. We also thank Josh Kratka of the National Environmental Law Center, Gabriel Clark-Leach and Ilan Levin of Environmental Integrity Project, Neil Carman of the Lone Star Chapter of the Sierra Club and Adrian Shelley of Public Citizen for their review of drafts of this document, and for their valuable insights and suggestions. Thanks also to Brian Zabcik of Environment Texas and Elizabeth Ridlington of Frontier Group for editorial support.
Environment Texas Research & Policy Center thanks Houston Endowment for making this report possible.
The authors bear responsibility for any factual errors. The recommendations are those of Environment Texas Research & Policy Center. The views expressed in this report are those of the authors and do not necessarily reflect the views of our funders or those who provided review.
2018 Environment Texas Research & Policy Center. Some Rights Reserved. This work is licensed under a Creative Commons Attribution Non-Commercial No Derivatives 3.0 U.S. License. To view the terms of this license, visit http://creativecommons.org/licenses/ by-nc-nd/3.0/us.
Acknowledgments
Environment Texas Research & Policy Center is a 501(c)(3) organization. We are dedicated to protecting our air, water and open spaces. We investigate problems, craft solutions, educate the public and decision-makers, and help the public make their voices heard in local, state and national debates over the quality of our environment and our lives. For more information about Environment Texas Research & Policy Center or for additional copies of this report, please visit www.environmenttexascenter.org.
Layout: To The Point Collaborative, tothepointcollaborative.com
Cover: Valero oil refinery in Port Arthur, Texas. Credit: Environmental Integrity Project/Garth Lenz, International League of Conservation Photographers
Table of ContentsExecutive Summary . . . . . . . . . . . . . . . . . . . . . . . . . . . . . . . . . . . . . . . . . . . . . . . . . . . . . 4
Air Pollution in Texas . . . . . . . . . . . . . . . . . . . . . . . . . . . . . . . . . . . . . . . . . . . . . . . . . . . 9
Top Polluters During Emissions Events . . . . . . . . . . . . . . . . . . . . . . . . . . . . . . . . . . . 11
Clean Air Permitting and Enforcement . . . . . . . . . . . . . . . . . . . . . . . . . . . . . . . . . . . 18
How Texas handles emissions events . . . . . . . . . . . . . . . . . . . . . . . . . . . . . . . . . . . . . . . . . . . . . . . . . . . . . . . . . . . . . 18
Few violations result in penalties . . . . . . . . . . . . . . . . . . . . . . . . . . . . . . . . . . . . . . . . . . . . . . . . . . . . . . . . . . . . . . . . . 20
Enforcement under attack . . . . . . . . . . . . . . . . . . . . . . . . . . . . . . . . . . . . . . . . . . . . . . . . . . . . . . . . . . . . . . . . . . . . . . . 22
Conclusion and Recommendations . . . . . . . . . . . . . . . . . . . . . . . . . . . . . . . . . . . . . . . 24
Methodology . . . . . . . . . . . . . . . . . . . . . . . . . . . . . . . . . . . . . . . . . . . . . . . . . . . . . . . . . . 26
Appendices . . . . . . . . . . . . . . . . . . . . . . . . . . . . . . . . . . . . . . . . . . . . . . . . . . . . . . . . . . . 29
Notes . . . . . . . . . . . . . . . . . . . . . . . . . . . . . . . . . . . . . . . . . . . . . . . . . . . . . . . . . . . . . . . . 37
4 MAJOR MALFUNCTION
Executive Summary
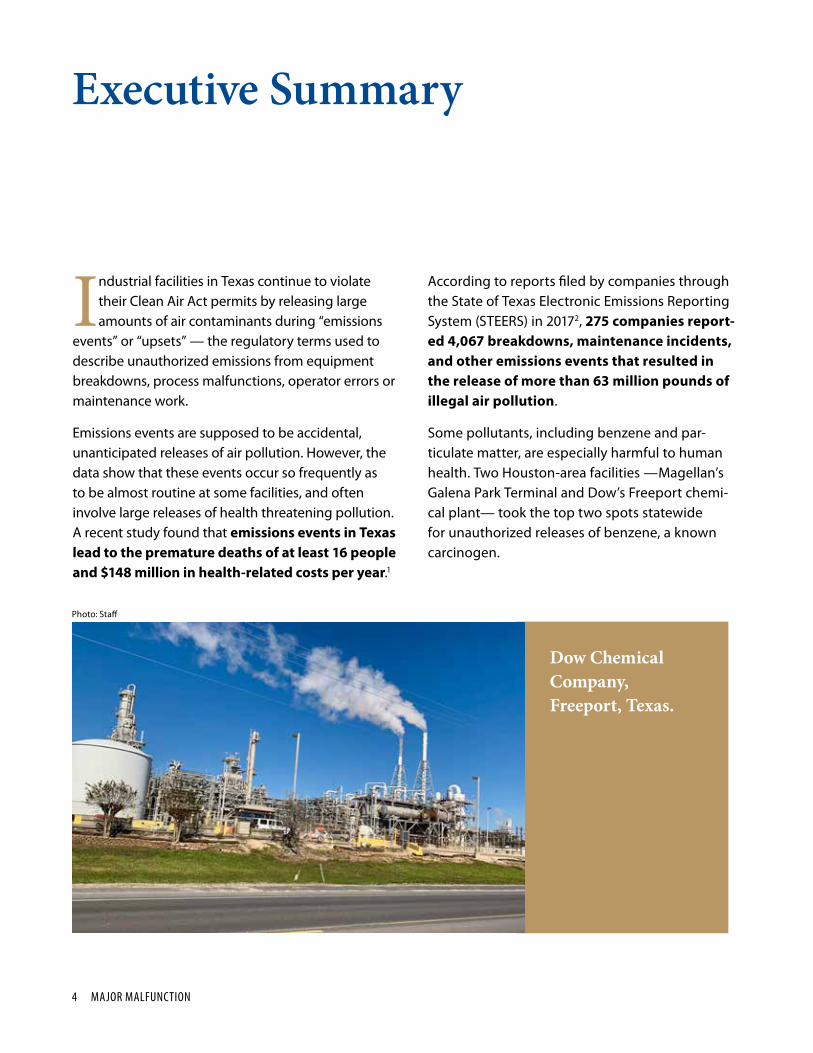
Industrial facilities in Texas continue to violate their Clean Air Act permits by releasing large amounts of air contaminants during “emissions
events” or “upsets” — the regulatory terms used to describe unauthorized emissions from equipment breakdowns, process malfunctions, operator errors or maintenance work.
Emissions events are supposed to be accidental, unanticipated releases of air pollution. However, the data show that these events occur so frequently as to be almost routine at some facilities, and often involve large releases of health threatening pollution. A recent study found that emissions events in Texas lead to the premature deaths of at least 16 people and $148 million in health-related costs per year.1
According to reports filed by companies through the State of Texas Electronic Emissions Reporting System (STEERS) in 20172, 275 companies report-ed 4,067 breakdowns, maintenance incidents, and other emissions events that resulted in the release of more than 63 million pounds of illegal air pollution.
Some pollutants, including benzene and par-ticulate matter, are especially harmful to human health. Two Houston-area facilities —Magellan’s Galena Park Terminal and Dow’s Freeport chemi-cal plant— took the top two spots statewide for unauthorized releases of benzene, a known carcinogen.
Photo: Staff
Dow Chemical Company, Freeport, Texas.

Executive Summary 5
Valero’s Port Arthur refinery had the high-est unauthorized emissions of particulate matter, linked to a range of cardiovas-cular problems, including heart attacks, strokes, and congestive heart failure3, fol-lowed by Arkema’s Crosby chemical plant and Phillips 66’s oil refinery in Borger.
Members of the public submitted hun-dreds of complaints to the Texas Com-mission on Environmental Quality (TCEQ) regarding emissions events in 20175. In one case, after the Seminole Gas Process-ing Plant in west Texas reported an unau-thorized release of more than 1.1 million pounds of sulfur dioxide over the course
§¥†‡
Table ES-1: Top 10 Emitters of Benzene During Malfunction and Maintenance4, 2017
Rank Facility Name Facility Owner County Total Pounds
1 Galena Park Terminal Magellan Terminals Holdings,
Seaway Pipeline Inc.,
KM Liquids Terminals LLC
Harris 12,835
2 Dow Texas Operations Freeport The Dow Chemical Company Brazoria 8,870
3 Flint Hills Resources Port Arthur Facility
Flint Hills Resources Port Arthur, LLC Jefferson 6,712
4 Big Tony Compressor Station MarkWest Energy East Texas Gas Company Panola 4,797
5 Chevron Phillips Chemical Cedar Bayou Plant
Chevron Phillips Chemical Company Harris 4,215
6 Shell Oil Deer Park Shell Oil Company and
Shell Chemical LP
Harris 4,156
7 Equistar Corpus Christi Plant Equistar Chemicals, LP Nueces 4,030
8 Exxon Mobil Chemical Baytown Olefins Plant
Exxon Mobil Corporation Harris 3,604
9 Silvertio 76 17 Unit P 1H Anadarko E&P Onshore LLP Loving 2,338
10 Parks Compressor Station Targa Pipeline Mid-Continent WestTex LLC Midland 2,274
Valero oil refinery in Port Arthur, Texas.
Photo: Environmental Integrity Project/Garth Lenz, International League of Conservation Photographers

6 MAJOR MALFUNCTION
of sixteen days6, a complaint was filed with the TCEQ alleging that the emissions were “impact-ing children at a summer camp.”7
Despite the thousands of violations totaling hundreds of millions of pounds of unauthorized pollution, and despite hundreds of citizen complaints, the vast major-
Figure ES-1. Enforcement Actions Agains Emissions Events 2011-2017
Table ES-2: Top 10 Emitters of Particulate Matter During Malfunction and Maintenance, 2017
Rank Facility Name Facility Owner County Total Pounds
1 Valero Port Arthur Refinery The Premcor Refining Group Inc. Jefferson 287,810
2 Arkema Crosby Plant Arkema Inc. Harris 20,180
3 Borger Refinery Phillips 66 Company Hutchinson 12,033
4 Pasadena Refining System Pasadena Refining System Inc. Harris 11,958
5 Sweeny Refinery Phillips 66 Company Brazoria 9,921
6 Valero McKee Refinery Diamond Shamrock Refining Company, LP Moore 9,851
7 Western Refining El Paso Western Refining Company, LP El Paso 3,308
8 Marshall Plant Cabot Norit Americas, Inc. Harrison 3,186
9 Owens Corning Insulating Systems Waxahachie Plant
Owens Corning Insulating Systems, LLC Ellis 2,145
10 ISP Technologies Texas City Plant ISP Technologies Inc. Galveston 1,921

Executive Summary 7
ity of violations escape any consequence. The TCEQ levied financial penalties against just 58 facilities in 20178. Looking back over the last seven years, the total number of enforcement orders filed by TCEQ is less than 3 percent of the total number of emis-sions events recorded by the agency in that time. The trend since 2011 is that enforcement actions are declining.
In the few cases when fines are issued at all, the fines are on average a fraction of what TCEQ is au-thorized to levy. Under state law, TCEQ is authorized to collect penalties as high as $25,000 per day per violation9.
• If TCEQ levied the maximum penalty against emissions events in 2017, using the agency’s practice of counting each 24-hour period of an event as a single violation regardless of how many individual pollutants were released, they could have collected at least $277 million in fines.
• If instead the TCEQ followed the practice of the EPA and the Texas Attorney General’s Office and counted each pollutant released during
an emissions event as a separate violation10, a practice called “speciation,” TCEQ could collect as much as $2.3 billion in fines for 2017 emissions events.
TCEQ has wide discretion in determining the amount of a penalty and rarely assesses the maxi-mum. The agency’s penalty policy11 directs staff to calculate a penalty based on factors including the degree of harm and a facility’s past record of com-pliance. In 2017, TCEQ levied a total of $1,281,047 in fines for emissions events12, or $0.02 per pound of unauthorized emissions.
To fill the void, environmental groups and local governments in Texas have been forced to file suit to enforce air pollution limits when the government fails to do so.
• Last year, Petrobras’s Pasadena Refining Systems, Inc. — which had ranked number one in Texas for unauthorized releases of particulate matter in 2016 according to a 2017 study13 — settled a lawsuit with Environment Texas and the Sierra Club, agreeing to reduce emissions events and
Pasadena Refining Systems Incorporated, Pasadena, Texas.
Photo: Staff

8 MAJOR MALFUNCTION
pay a $3.5 million penalty14. Since our first analy-sis of emissions events in 2016 and since the citizen lawsuit was filed against it, Petrobras has reduced its unauthorized emissions of particulate matter by 83%.
• Harris County District Attorney Kim Ogg filed criminal charges against the CEO and plant manager of Arkema’s Crosby, Texas, facility for “recklessly” releasing chemicals into the air during Hurricane Harvey.15 According to reports the company filed with TCEQ, Arkema emitted more than 20,000 pounds of particulate matter during Hurricane Harvey, second highest in the state in 2017.
A 2001 legislative analysis suggested, “the fre-quency of unplanned upset events raises concerns that the upsets may be part of normal operating procedures.”16 These events are largely preventable and should not be tolerated as normal operating procedures.
In order to reduce illegal air pollution and hold vio-lators accountable, the state should:
• Develop a plan to reduce emissions events and increase compliance
• Adopt mandatory minimum penalties for emissions events
• Eliminate the “affirmative defense” from penalties that is offered to polluters
• Revoke a facility’s permit after repeated viola-tions until the facility implements plans to return to compliance
• Require sources operating under a standard permit or permit by rule (“PBR”) to obtain a source-specific New Source Review permit and/or a Title V operating permit when emissions events cause source emissions to exceed standard permit/PBR limits or Title V major source threshold
• Establish additional monitors, including SO2 monitors in the Permian basis, to accurately measure air quality impacts from unauthorized emissions from industrial sources
At the national level:
• Congress should reject efforts to weaken or eliminate the ability of citizen groups to sue to enforce environmental laws when government agencies are not enforcing the law
• Congress should maintain, and increase, funding for enforcement by the EPA
• EPA should maintain, and vigorously defend in court, its requirement that states strengthen rules dealing with emissions from equipment startups, shutdowns, and malfunctions.

Air Pollution in Texas 9
• 45678910111213141516
Air Pollution in Texas
Despite significant progress, air pollution levels in many parts of Texas still threaten public health.
• Researchers at the Massachusetts Institute of Technology found in a 2013 study that more than 14,000 Texans lose their lives each year due to air pollution, including 3,583 Texans who die prema-turely due to particulate matter released by autho-rized and unauthorized industrial emissions.17 A 2018 study published by the American Chemical
Society looked specifically at unauthorized pollu-tion during emissions events and found that they result in the premature deaths of at least 16 people and $148 million in health costs in Texas on average per year.18
• According to the UT School of Public Health, children living within two miles of the heavily industrialized Houston Ship Channel face a 56 percent greater risk of contracting leukemia, which researchers link to oil refineries and chemical plants.19
Shell Oil Deer Park facility
Photo: Alamy
10 MAJOR MALFUNCTION
Reports filed with the TCEQ in 2017 demonstrate that many Texans are concerned about emissions events.
• A resident of west Texas contacted TCEQ on June 16 alleging that emissions from the James Lake Gas Plant and Seminole Gas Processing Plant in Ector and Gaines Counties, respectively, are “impacting children at a summer camp.”20 Indeed, the Seminole Gas Processing Plant reported a release of 1,192,726 pounds of sulfur dioxide on June 15.21 This event was one of the largest emissions events contributing to Seminole Gas Processing Plant’s status as the second-largest unauthorized emitter of sulfur dioxide in Texas in 2017. James Lake Gas Plant released 21,249 pounds of sulfur dioxide during an emissions event lasting from June 12 to June 15.22
• A resident of Houston wrote to TCEQ on October 16 that, “In light of the large number and amount of pollutants released during Hurricane/Tropical Storm Harvey (not to mention the delay in publicly reporting them), I think the EPA and especially TCEQ have lost a lot of trust with the people of Texas. Please enforce the Clean Air Act and hold these companies responsible to stay within the limits allowed by the permits they hold.”23 Exxon-Mobil’s Baytown Refinery and Shell Oil’s Deer
Park facility both reported emissions events on October 15 while Chevron Phillips’s Chemical Cedar Bayou Plant reported an event on October 16.24
• On September 19, a resident of Port Arthur filed a complaint with TCEQ “stat[ing] that a tank at Valero exploded and was on fire” and that “odors were coming from the fire.”25 This complaint was filed on the exact same day that Valero Port Arthur Refinery, owned by the Premcor Refining Group Inc., reported a major emissions event resulting from a tank fire. This event released 286,284 pounds of particulate matter, making it one of the largest particulate matter emissions events of the year.26
• Dow Texas Operations Freeport, owned by the Dow Chemical Company and located in Brazo-ria County, had a significant ongoing emissions event from December 4 to December 12. This event resulted in the release of 24,233 pounds of carbon monoxide, 5,214 pounds of nitrogen oxide, and 329 pounds of benzene.27 A citizen wrote TCEQ on December 8 that “we live within 5 miles of the Dow Freeport site and not only is the air quality horrible, the cancer rate is one of the highest in the country.”28

Top Polluters During Emissions Events 11
According to the TCEQ, “emissions events are upset events or unscheduled MSS (Main-tenance, Startup and Shutdown) activities
from a common cause that result in unauthorized emissions of air contaminants.”29
According to a study by researchers at Indiana University, emissions events result when “pollu-tion abatement systems — such as scrubbers, bag-houses, or flares that curtail emissions before they are released—fail to fully operate as the result of an unexpected malfunction, startup or shutdown,”30 resulting in the release of illegal air pollution. They may be a result of equipment breakdowns, process malfunctions or operator error or may occur during the startup and shutdown of equipment. In a 1982 memo, EPA’s Assistant Administrator for air wrote that while there are circumstances where startups and shutdowns might legitimately result in emissions, “startup and shutdown of process equipment are part of the normal operation of a source and should be accounted for in the design and implementa-tion of the operating procedure for the process and control equipment. Accordingly, it is reasonable to expect that careful planning will eliminate violations of emission limitations during such periods.”31
Emissions events are largely avoidable. Rather than flaring32 excess gases at facilities, permittees can capture and recycle most gases with a gas recovery system. If flaring took place only during serious emer-
gencies, there would be a significant reduction in air emissions. Second, companies can increase staffing and preventive maintenance, and provide better training to allow for further monitoring of leaks, equipment malfunctions, and other potential sources of emissions, and ensure faster responses when emissions events do occur. Finally, companies should improve and expand upon backup systems, including backup power sources, to reduce the impact of events like electrical failures and major weather events that might otherwise require equip-ment shut-downs and start-ups.
Under Texas law, companies must create an “emis-sions event” report each time a plant has an unau-thorized release of air pollution, whether the event is caused by a malfunction or a planned activity such as equipment maintenance. Companies must file their reports within 24 hours of when the pollu-tion event occurs.33 The Texas Commission on Envi-ronmental Quality requires companies to publicly disclose upset events that release a “reportable” quantity of pollutants via the State of Texas Envi-ronmental Electronic Reporting System (STEERS). These reports are available on the TCEQ’s Air Emis-sion Event Report database at: http://www2.tceq.texas.gov/oce/eer/.
An initial report must be filed within 24 hours, and a final report within two weeks. Emissions events below the reporting threshold, known as “record-
Top Polluters During Emissions Events
12 MAJOR MALFUNCTION
able emission events,” are to be recorded and kept in documents held on-site at the facility.
This analysis is drawn only from self-reported viola-tions that were submitted, via STEERS, to the TCEQ. The numbers do not include emissions from the unreported “recordable emissions events,” and thus actually under-represent the amount of illegal air pol-lution released in Texas.
Different air contaminants harm people and the envi-ronment in different ways, and so this report pres-ents six separate snapshots, each one a “top 10” list based on different pollutants of concern. The rank-ings below show the state’s top ten industrial plants responsible for the highest levels of self-reported air
pollution from malfunctions and maintenance for six pollutants of concern: sulfur dioxide, hydrogen sulfide, nitrogen oxides, benzene, particulate mat-ter, and volatile organic compounds.
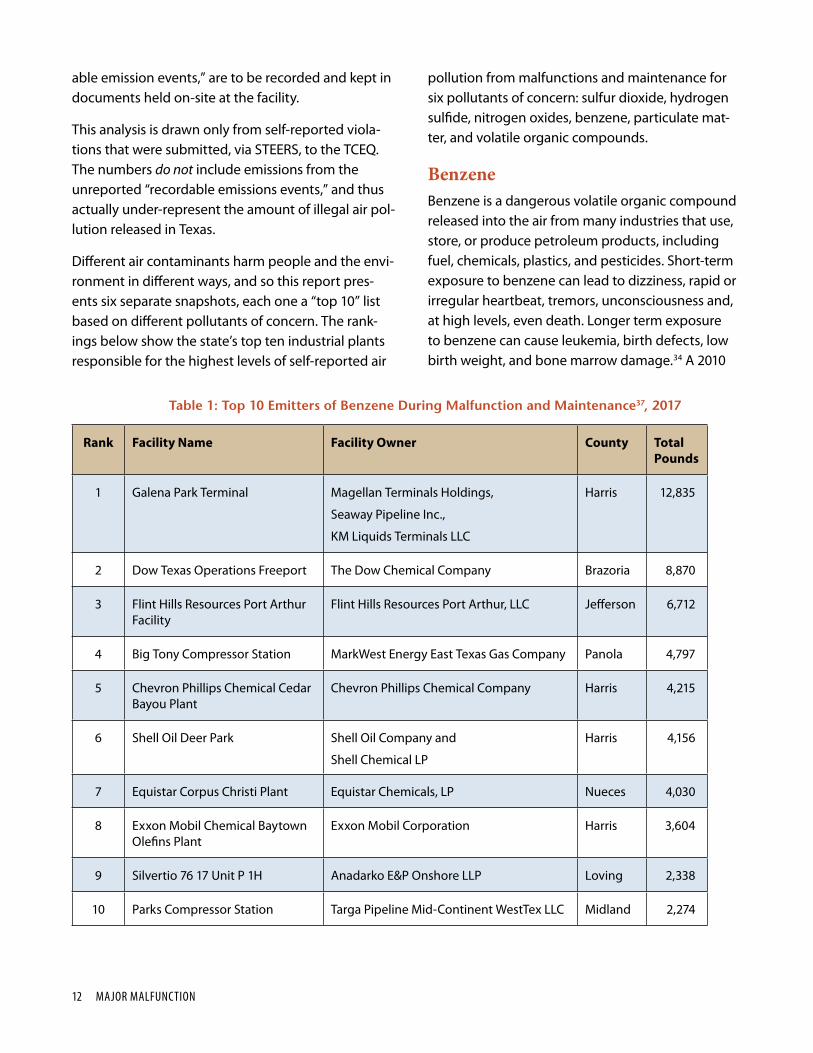
BenzeneBenzene is a dangerous volatile organic compound released into the air from many industries that use, store, or produce petroleum products, including fuel, chemicals, plastics, and pesticides. Short-term exposure to benzene can lead to dizziness, rapid or irregular heartbeat, tremors, unconsciousness and, at high levels, even death. Longer term exposure to benzene can cause leukemia, birth defects, low birth weight, and bone marrow damage.34 A 2010
Table 1: Top 10 Emitters of Benzene During Malfunction and Maintenance37, 2017
Rank Facility Name Facility Owner County Total Pounds
1 Galena Park Terminal Magellan Terminals Holdings,
Seaway Pipeline Inc.,
KM Liquids Terminals LLC
Harris 12,835
2 Dow Texas Operations Freeport The Dow Chemical Company Brazoria 8,870
3 Flint Hills Resources Port Arthur Facility
Flint Hills Resources Port Arthur, LLC Jefferson 6,712
4 Big Tony Compressor Station MarkWest Energy East Texas Gas Company Panola 4,797
5 Chevron Phillips Chemical Cedar Bayou Plant
Chevron Phillips Chemical Company Harris 4,215
6 Shell Oil Deer Park Shell Oil Company and
Shell Chemical LP
Harris 4,156
7 Equistar Corpus Christi Plant Equistar Chemicals, LP Nueces 4,030
8 Exxon Mobil Chemical Baytown Olefins Plant
Exxon Mobil Corporation Harris 3,604
9 Silvertio 76 17 Unit P 1H Anadarko E&P Onshore LLP Loving 2,338
10 Parks Compressor Station Targa Pipeline Mid-Continent WestTex LLC Midland 2,274

Top Polluters During Emissions Events 13
Table 2: Top 10 Emitters of Nitrogen Oxides During Malfunction and Maintenance, 2017
study by the University of Texas School of Public Health and the Texas Department of State Health Services found that women living in neighbor-hoods with higher-than-average levels of ben-zene are more likely to give birth to babies with serious neurological defects.35 The World Health Organization warns that there is no safe level of benzene exposure.36
Nitrogen Oxides (NOx)According to the National Institutes for Health38, breathing nitrogen oxides can cause a range of health effects, including aggravation of asthma, nausea and headaches. Nitrogen oxides also combine with volatile organic compounds and sunlight to form ground-level ozone, commonly known as smog. Smog causes a host of respira-
Rank Facility Name Facility Owner County Total Pounds
1 Goldsmith Gas Plant DCP Operating Company Ector 167,837
2 Equistar Corpus Christi Plant Equistar Chemicals LP Nueces 90,362
3 James Lake Gas Plant James Lake Midstream, LLC Ector 88,383
4 Enterprise Mont Belvieu Complex
Enterprise Products Operating LLC Chambers 84,243
5 Dow Texas Operations Freeport The Dow Chemical Company Brazoria 77,939
6 Chevron Phillips Chemical Cedar Bayou Plant
Chevron Phillips Chemical Company LP Harris 77,620
7 Midkiff Gas Plant Targa Pipeline Mid-Continent WestTex LLC Reagan 72,326
8 Exxon Mobil Baytown Refinery Exxon Mobil Corporation Harris 68,448
9 Denver Unit CO2 Recovery Plant Occidental Permian Ltd. Yoakum 55,115
10 Driver Gas Plant Targa Pipeline Mid-Continent WestTex LLC Midland 51,609
Dow Texas Operations Freeport, Brazoria County, Texas
Photo: Gwen Schroeder

14 MAJOR MALFUNCTION
Table 3: Top 10 Emitters of Particulate Matter During Malfunction and Maintenance, 2017
tory consequences, ranging from coughing, wheez-ing and throat irritation, to asthma, increased risk of infection, and permanent damage to lung tissue.39 Enterprise’s Mont Belvieu Complex, Dow’s Freeport facility, Chevron Phillips Cedar Bayou plant, and ExxonMobil’s Baytown complex, all located in the Houston Galveston nonattainment area for ozone40,
Valero oil refinery in Port Arthur, Texas.
Rank Facility Name Facility Owner County Total Pounds
1 Valero Port Arthur Refinery The Premcor Refining Group Inc. Jefferson 287,810
2 Arkema Crosby Plant Arkema Inc. Harris 20,180
3 Borger Refinery Phillips 66 Company Hutchinson 12,033
4 Pasadena Refining System Pasadena Refining System Inc. Harris 11,958
5 Sweeny Refinery Phillips 66 Company Brazoria 9,921
6 Valero McKee Refinery Diamond Shamrock Refining Company, LP Moore 9,851
7 Western Refining El Paso Western Refining Company, LP El Paso 3,308
8 Marshall Plant Cabot Norit Americas, Inc. Harrison 3,186
9 Owens Corning Insulating Systems Waxahachie Plant
Owens Corning Insulating Systems, LLC Ellis 2,145
10 ISP Technologies Texas City Plant ISP Technologies Inc. Galveston 1,921
were among the top unauthorized polluters of nitro-gen oxides in 2017.
Particulate MatterParticulate matter (PM), commonly called soot, is one of the deadliest forms of air pollution. It can trigger a range of cardiovascular problems, including heart
Photo: Environmental Integrity Project/Garth Lenz, International League of Conservation Photographers
Top Polluters During Emissions Events 15
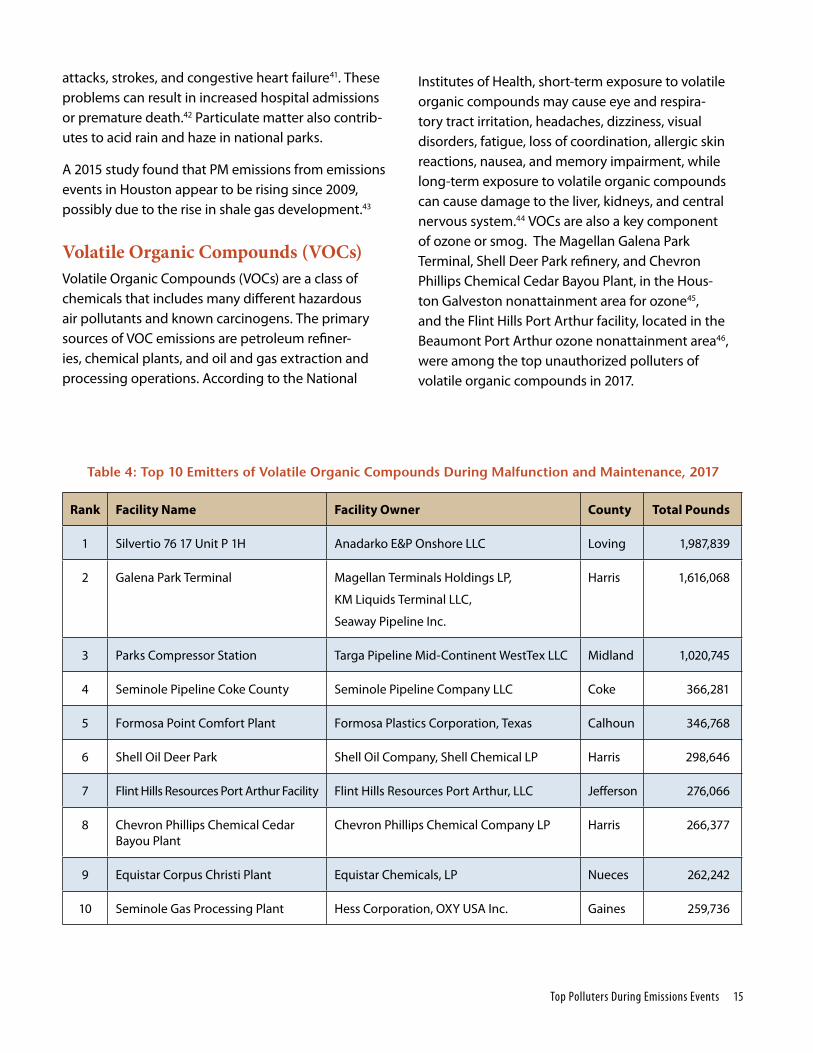
Table 4: Top 10 Emitters of Volatile Organic Compounds During Malfunction and Maintenance, 2017
Rank Facility Name Facility Owner County Total Pounds
1 Silvertio 76 17 Unit P 1H Anadarko E&P Onshore LLC Loving 1,987,839
2 Galena Park Terminal Magellan Terminals Holdings LP,
KM Liquids Terminal LLC,
Seaway Pipeline Inc.
Harris 1,616,068
3 Parks Compressor Station Targa Pipeline Mid-Continent WestTex LLC Midland 1,020,745
4 Seminole Pipeline Coke County Seminole Pipeline Company LLC Coke 366,281
5 Formosa Point Comfort Plant Formosa Plastics Corporation, Texas Calhoun 346,768
6 Shell Oil Deer Park Shell Oil Company, Shell Chemical LP Harris 298,646
7 Flint Hills Resources Port Arthur Facility Flint Hills Resources Port Arthur, LLC Jefferson 276,066
8 Chevron Phillips Chemical Cedar Bayou Plant
Chevron Phillips Chemical Company LP Harris 266,377
9 Equistar Corpus Christi Plant Equistar Chemicals, LP Nueces 262,242
10 Seminole Gas Processing Plant Hess Corporation, OXY USA Inc. Gaines 259,736
attacks, strokes, and congestive heart failure41. These problems can result in increased hospital admissions or premature death.42 Particulate matter also contrib-utes to acid rain and haze in national parks.
A 2015 study found that PM emissions from emissions events in Houston appear to be rising since 2009, possibly due to the rise in shale gas development.43
Volatile Organic Compounds (VOCs)Volatile Organic Compounds (VOCs) are a class of chemicals that includes many different hazardous air pollutants and known carcinogens. The primary sources of VOC emissions are petroleum refiner-ies, chemical plants, and oil and gas extraction and processing operations. According to the National
Institutes of Health, short-term exposure to volatile organic compounds may cause eye and respira-tory tract irritation, headaches, dizziness, visual disorders, fatigue, loss of coordination, allergic skin reactions, nausea, and memory impairment, while long-term exposure to volatile organic compounds can cause damage to the liver, kidneys, and central nervous system.44 VOCs are also a key component of ozone or smog. The Magellan Galena Park Terminal, Shell Deer Park refinery, and Chevron Phillips Chemical Cedar Bayou Plant, in the Hous-ton Galveston nonattainment area for ozone45, and the Flint Hills Port Arthur facility, located in the Beaumont Port Arthur ozone nonattainment area46, were among the top unauthorized polluters of volatile organic compounds in 2017.
16 MAJOR MALFUNCTION
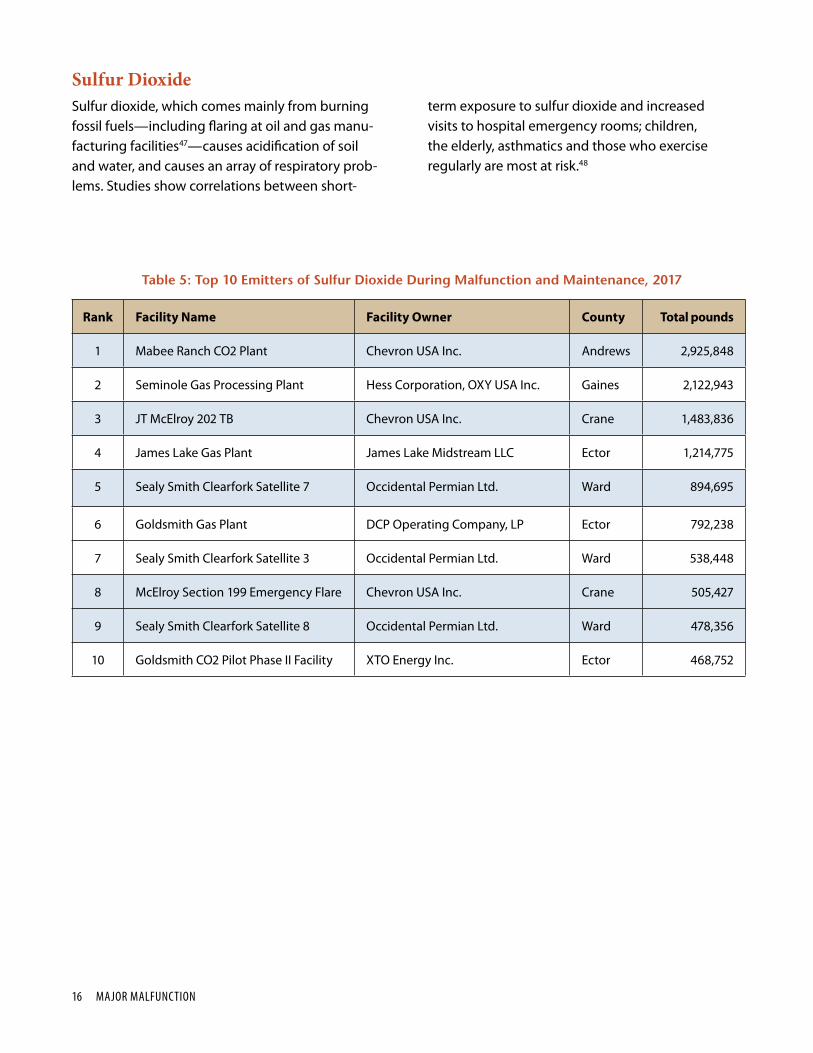
Table 5: Top 10 Emitters of Sulfur Dioxide During Malfunction and Maintenance, 2017
Rank Facility Name Facility Owner County Total pounds
1 Mabee Ranch CO2 Plant Chevron USA Inc. Andrews 2,925,848
2 Seminole Gas Processing Plant Hess Corporation, OXY USA Inc. Gaines 2,122,943
3 JT McElroy 202 TB Chevron USA Inc. Crane 1,483,836
4 James Lake Gas Plant James Lake Midstream LLC Ector 1,214,775
5 Sealy Smith Clearfork Satellite 7 Occidental Permian Ltd. Ward 894,695
6 Goldsmith Gas Plant DCP Operating Company, LP Ector 792,238
7 Sealy Smith Clearfork Satellite 3 Occidental Permian Ltd. Ward 538,448
8 McElroy Section 199 Emergency Flare Chevron USA Inc. Crane 505,427
9 Sealy Smith Clearfork Satellite 8 Occidental Permian Ltd. Ward 478,356
10 Goldsmith CO2 Pilot Phase II Facility XTO Energy Inc. Ector 468,752
Sulfur DioxideSulfur dioxide, which comes mainly from burning fossil fuels—including flaring at oil and gas manu-facturing facilities47—causes acidification of soil and water, and causes an array of respiratory prob-lems. Studies show correlations between short-
term exposure to sulfur dioxide and increased visits to hospital emergency rooms; children, the elderly, asthmatics and those who exercise regularly are most at risk.48
Top Polluters During Emissions Events 17
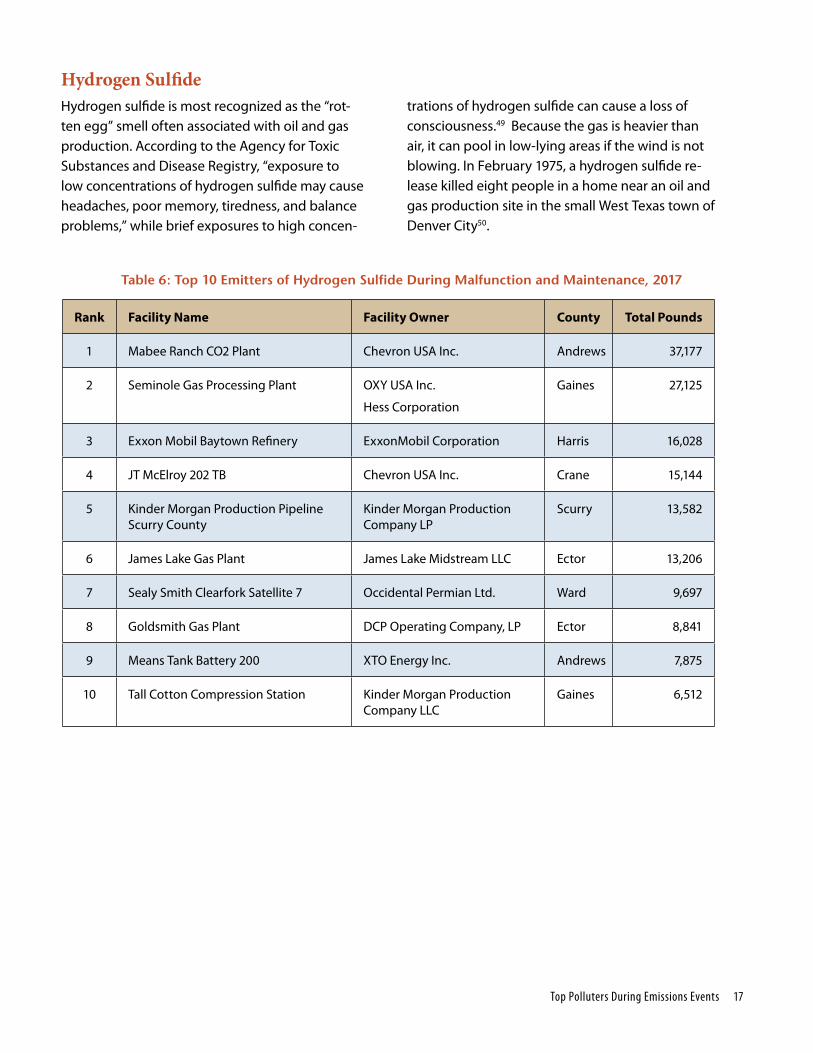
Table 6: Top 10 Emitters of Hydrogen Sulfide During Malfunction and Maintenance, 2017
Rank Facility Name Facility Owner County Total Pounds
1 Mabee Ranch CO2 Plant Chevron USA Inc. Andrews 37,177
2 Seminole Gas Processing Plant OXY USA Inc.
Hess Corporation
Gaines 27,125
3 Exxon Mobil Baytown Refinery ExxonMobil Corporation Harris 16,028
4 JT McElroy 202 TB Chevron USA Inc. Crane 15,144
5 Kinder Morgan Production Pipeline Scurry County
Kinder Morgan Production Company LP
Scurry 13,582
6 James Lake Gas Plant James Lake Midstream LLC Ector 13,206
7 Sealy Smith Clearfork Satellite 7 Occidental Permian Ltd. Ward 9,697
8 Goldsmith Gas Plant DCP Operating Company, LP Ector 8,841
9 Means Tank Battery 200 XTO Energy Inc. Andrews 7,875
10 Tall Cotton Compression Station Kinder Morgan Production Company LLC
Gaines 6,512
Hydrogen SulfideHydrogen sulfide is most recognized as the “rot-ten egg” smell often associated with oil and gas production. According to the Agency for Toxic Substances and Disease Registry, “exposure to low concentrations of hydrogen sulfide may cause headaches, poor memory, tiredness, and balance problems,” while brief exposures to high concen-
trations of hydrogen sulfide can cause a loss of consciousness.49 Because the gas is heavier than air, it can pool in low-lying areas if the wind is not blowing. In February 1975, a hydrogen sulfide re-lease killed eight people in a home near an oil and gas production site in the small West Texas town of Denver City50.
18 MAJOR MALFUNCTION
Congress has declared that the purpose of the Clean Air Act (CAA) is “to protect and en-hance the quality of the Nation’s air resourc-
es so as to promote the public health and welfare and the productive capacity of its population.”51
How Texas handles emissions eventsThe Texas Clean Air Act52, which mirrors many aspects of the federal Clean Air Act, prohibits facilities from discharging pollutants “in such concentration and of such duration that … are or may tend to be injurious to or to adversely affect human health or welfare, animal life, vegetation, or property.”
Under the CAA, a State Implementation Plan (“SIP”) must be developed that sets forth how the state will achieve and maintain compliance with National Ambient Air Quality Standards (“NAAQS”) set by the United States Environmental Protection Agency (“EPA”) to protect human health and the environ-ment. As part of Texas’ obligations under its SIP, TCEQ issues to stationary sources of air pollution permits which define the maximum amount of a given pollut-ant each facility is allowed to release.53
Texas regulations define “unauthorized emissions” as those that “exceed any air emission limitation in a permit, rule or order of [TCEQ].”54 Permits sometimes include unambiguous language stating that emis-sions from upset events are not authorized, even when they would otherwise fall “within the flexible permit emission cap or an individual emission limit.”55 Under such permits, emissions of individual pollut-
ants during an upset event are separate violations of the prohibition against upset emissions, one for each pollutant so emitted. Under other permits, upset emissions frequently exceed the maximum hourly or annual emission limits that are intended to keep emissions from flares and other emission sources within legally required limits.
Reportable Events and Recordable EventsCompanies document emissions events in two pri-mary ways.
First, the TCEQ requires permittees to publicly report information about “emissions events” that release greater than a certain threshold quantity of pollut-ants; these are called “reportable emissions events.” Permittees are required to submit this information to the TCEQ through the State of Texas Environmen-tal Electronic Reporting System (“STEERS”). These reports are to be submitted “as soon as practicable, but not later than 24 hours after the discovery of a re-portable emissions event.”56 Reports are then posted on a TCEQ website the next morning and are open to the public.57
Second, the TCEQ requires permittees to document information about smaller “emissions events” that release less than the threshold quantities that trigger public reporting. Documentation of these “record-able emissions events” is kept on-site at the com-pany’s facility, but are not submitted to the TCEQ via a STEERS report.
Clean Air Permitting and Enforcement
Clean Air Permitting and Enforcement 19
Investigation, Enforcement, and Corrective ActionsTCEQ’s “Agency Philosophy”58 states that it will “en-sure consistent, just, and timely enforcement when environmental laws are violated,” but also that it seeks to “promote and foster voluntary compliance with environmental laws and provide flexibility in achieving environmental goals.” The data would sug-gest TCEQ emphasizes the latter over the former goal.
The TCEQ is supposed to investigate each reportable emissions event but, according to the Environmental Integrity Project’s Ilan Levin, the “investigations” are almost always paperwork reviews and rarely involve on-site inspections. Furthermore, the number of in-vestigations of emissions events in FY18 declined by almost 8 percent from the previous year, even as the number of emissions events increased 12 percent and the volume of emissions increased 4.9 percent.59
Following the review of documents filed by a per-mittee, the TCEQ determines whether it will initiate enforcement. This determination is based, in part,
on whether the event is deemed to be “excessive” and whether the permittee has qualified for an “affirmative defense” from penalties. The affirma-tive defense effectively exempts facilities which exceed permit limits during emissions events from financial penalties, although a facility may still be ordered to take steps to prevent future violations.
According to the Texas Administrative Code, “Upset events that are determined not to be excessive emissions events are subject to an affirmative defense to all claims and enforcement actions brought for these events other than claims for administrative technical orders and actions for in-junctive relief.”60 The owner or operator must prove it has met 11 different criteria in order to qualify for the defense — including that the unauthorized emissions could not have been prevented, that all possible steps were taken to minimize the impact of the unauthorized emissions on ambient air qual-ity, and that the emissions did not contribute to a condition of air pollution.
Year Number of emissions events
Number of events receiving TCEQ
penalties
Percentage of events penalized
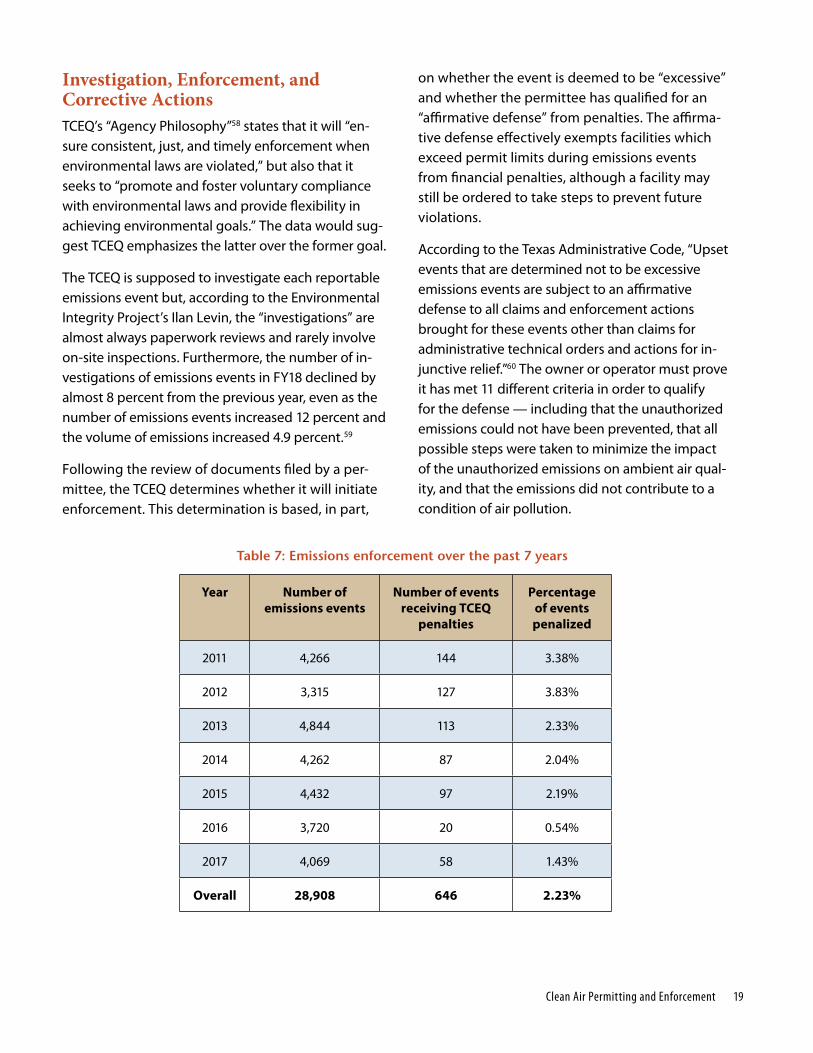
2011 4,266 144 3.38%
2012 3,315 127 3.83%
2013 4,844 113 2.33%
2014 4,262 87 2.04%
2015 4,432 97 2.19%
2016 3,720 20 0.54%
2017 4,069 58 1.43%
Overall 28,908 646 2.23%
Table 7: Emissions enforcement over the past 7 years
20 MAJOR MALFUNCTION
When permittees file a report of an emissions event to STEERS, they must select on the reporting form either “yes” or “no” to indicate whether the permit-tee believes it meets the affirmative defense stan-dard. An ExxonMobil manager testified at trial in the Environment Texas v. ExxonMobil case that he checks the “yes” box for every emissions event without fail, despite not actually investigating or confirming whether ExxonMobil has in fact met all 11 affirma-tive defense criteria.61
As TCEQ’s follow-up investigation almost always relies primarily on a review of documents filed by the permittee, it is very difficult for the investigator to then prove that the permittee is not eligible for the affirmative defense.
The U.S. Environmental Protection Agency found that the affirmative defense serves as a barrier to effective oversight of polluting industries. In June 2015, the EPA directed Texas and 35 other states to revise their SIPs to eliminate these affirmative de-fense provisions.62 The TCEQ ignored EPA’s directive and retained the affirmative defense criteria, while adding a new paragraph to the rule stating that the listed affirmative defense criteria “are not intended to limit a federal court’s jurisdiction or discretion to determine the appropriate remedy in an enforce-ment action.”63
Even if a company claims an affirmative defense, TCEQ can still determine that an emissions event was “excessive,” based on a set of standards laid out in the agency’s Enforcement Initiation Criteria, including the frequency, cause, quantity, impact, and duration of an emissions event.64 In that case, TCEQ will not accept an affirmative defense. In FY18, TCEQ determined that just 13 emissions events were excessive, down from 14 in FY17.65
If TCEQ determines there was a violation resulting from an emissions event and the affirmative defense criteria have not been met, it may (but is not re-quired to) issue a Notice of Violation (NOV), a written
notification to the permittee. NOVs set “a prescribed time period [for the permittee] to return to compli-ance and provide documentation that all violations have been corrected.”66 TCEQ tells permittees that the agency “may elect to visit the site and verify that the violations have been corrected, or it may be enough for you to submit documentation to us.” If TCEQ is satisfied that all violations have been corrected, no enforcement action is taken.67
If violations are not corrected in time, the permittee may then be issued a Notice of Enforcement (NOE), and TCEQ may try to negotiate a financial penalty with the company. The TCEQ has authority to issue administrative enforcement orders (without filing a lawsuit in court) and is able to seek penalties up to the statutory cap of $25,000 per day68, although fines rarely if ever are that high. Generally, TCEQ will negotiate an “agreed order” in which the permittee “agrees to the terms and conditions of the adminis-trative order, including the penalty.”69 TCEQ may also refer cases to the Office of the State Attorney General, which may elect to pursue civil or criminal action through the courts.
Few violations result in penaltiesIn 2017, there were 4,067 reported unauthorized emissions events across the state of Texas which resulted in the release of hundreds of millions of pounds of dangerous pollutants70. The TCEQ only levied penalties against 58 emissions events (most if not all of which occurred before 2017). Looking back over the last seven years, the total number of en-forcement orders filed by TCEQ is less than 3 percent of the total number of emissions events recorded by the agency in that time.71
The trend since 2011 shows that enforcement actions are declining.72
In the few cases when fines are issued at all, the fines are on average a fraction of what TCEQ is authorized to levy.

Clean Air Permitting and Enforcement 21
• If TCEQ levied the maximum penalty against emissions events in 2017, using the agency’s practice of counting each event as a single viola-tion regardless of how many individual pollutants were released, they could have collected at least $277 million in fines.
• If instead the TCEQ followed the practice of the EPA and the Texas Attorney General’s Office and counted each pollutant released during an emissions event as a separate violation73, a practice called “speciation,” TCEQ could collect as much as $2.3 billion in fines for 2017 emissions events.74
TCEQ has wide discretion in determining the amount of a penalty and rarely assesses the maximum. The agency’s penalty policy75 directs staff to calculate a penalty based on factors including the degree of harm and a facility’s past record of compliance. In 2017, a to-tal of $1,281,047 was assessed in administrative penal-ties for these 58 emissions events, amounting to $0.02 per pound of unauthorized emissions in 2017.
The small size of TCEQ’s fines is often dwarfed by the huge size of the companies being penalized.
For example, in an administrative order last year, the TCEQ addressed two separate emissions events caused by the petrochemical company Chevron
Phillips in May and June of 2016. These two events released a combined amount of 8,302 pounds of volatile organic compounds, 8,622 pounds of toxic carbon monoxide, and 1,745 pounds of dangerous ni-trogen oxides. Despite releasing a combined total of 18,671 pounds of hazardous pollutants, the company was assessed only a $9,038 administrative penalty by TCEQ for the release of these toxic compounds.
To put that number into perspective, that meant that Chevron Phillips was fined about $0.48 per pound of illegal emissions. Furthermore, Chevron Phillips reported a total sales revenue of approximately $9 billion in 2017. The penalty imposed on it by the TCEQ accounted for less than 0.0001% of its total sales revenue in 2017.
As this example demonstrates, even in the relatively rare instances when the TCEQ does take action against unauthorized emissions, the agency’s efforts remain lackluster and ineffective in punishing pollut-ers to a degree that would deter them from commit-ting future infractions.
An example of how this insufficient level of enforce-ment contributes to continued emissions events can be seen in the case of the Houston-based petro-chemical company Phillips 66. While the TCEQ did as-
Figure 1: Enforcement Actions Agains Emissions Events 2011-2017

22 MAJOR MALFUNCTION
sess penalties for several infractions by the company in 2016, the penalty did not successfully deter the company from committing future violations. Despite receiving a $19,688 administrative penalty in May of 2017 for two emissions events that had occurred on January 9 and April 14 in 2016, facilities operated by Phillips 66 still went on to illegally emit thousands of pounds of pollutants in 2017.76 For example, on May 16, 2017, less than a week after being notified of this administrative penalty, Phillips 66’s Borger Refinery in Hutchinson County released 2,677 pounds of sulfur dioxide without permit authorization. If anything, one could argue that the TCEQ’s spotty record of penalizing companies for emissions events has em-boldened permittees to continue their violations with little fear of meaningful repercussions.
TCEQ has noted that “equitable treatment requires that violators not come out ahead economically to the disadvantage of those entities that spend sub-stantial resources to comply with the law,”77 but in some cases, penalties issued by TCEQ are less than the economic benefit the company gained as a result of the violation. For example, in an Agreed Order ad-opted on Sep. 26 2017, the TCEQ found that Intercon-tinental Terminals Company in Harris County “failed to prevent unauthorized emission of 1,509 pounds of benzene from a storage tank.”78 The emissions event began on February 12, 2016 and lasted 125 hours and 30 minutes. This event occurred due to a tank deformation that allowed fluid displacement above the internal floating roof, resulting in the release of pressure into the tank lateral piping and diffuser. Since the emissions event was reported late, the Respondent is precluded from asserting an affirma-tive defense under 30 Tex. Admin. Code § 101.222. TCEQ determined the company enjoyed an economic benefit of $6,902, but levied a fine of just $3,983.79
In a 2003 review of TCEQ enforcement80, the Office of the State Auditor found the agency “does not consis-tently ensure violators are held accountable” and that “violators often have economic benefits that exceed their penalties, which could reduce their incentive
to comply.” In response, TCEQ launched a review of its enforcement program and penalty policy, but ac-cording to former TCEQ Commissioner Larry Soward, appointed by Governor Perry in 2003, “little came of that self review.”81
A February 2018 analysis by the Texas Observer found that when the TCEQ does take enforcement action, it disproportionately targets small businesses, such as family-owned gas stations, while mostly turning a blind eye to major pollution events caused by large oil and gas corporations.82
Enforcement under attackGiven the TCEQ’s failure to consistently hold pollut-ers to account, citizen groups and local governments have stepped up to enforce state and federal clean air laws themselves. The Clean Air Act contains a “citizen suit” provision that allows private citizens affected by violations of the law (or the non-profit groups to which they belong) to bring an enforce-ment suit in federal court. They can file such public interest enforcement cases after first providing 60 days prior notice to the violator and to state and fed-eral environmental agencies, to give the government a chance to bring the enforcement case itself.
If the government does not file its own enforcement case within the 60-day notice period, citizens can then seek a court order requiring compliance with the law and a monetary penalty of up to $93,750 per day for each violation of the Act83. Since 2008, envi-ronmental groups in Texas have successfully sued at least 4 facilities over illegal air pollution resulting from emissions events.
The Texas Clean Air Act also allows local governments to file suit against polluters. For example, Harris County has sued dozens of facilities over various pol-lution violations84.
In response, polluters have worked to change the law to shield themselves from these lawsuits. In 2015, Governor Abbott signed HB 1794 into law, which
Clean Air Permitting and Enforcement 23
sets a five-year statute of limitations and a $4.3 mil-lion cap on penalties on pollution lawsuits brought by local governments, split between the local and state government. And in 2017, Governor Abbott signed HB 2533 into law, which requires local govern-ments to notify the TCEQ and state Attorney General 90 days in advance of a suit.85 If the state government chooses to initiate its own enforcement proceedings, the local government is preempted from moving forward with its own suit.
Bills have also been filed in the United States Con-gress to shield polluters. For example, according to the Waterkeeper Alliance, HR 1179, the so-called “Discouraging Frivolous Lawsuits Act,” introduced in February 2017 by Rep. Tom Rice (R-SC), would create
a new requirement for the citizen to pay the defendant’s attorney fees if the citizen did not ultimately prevail in court, forcing would-be plaintiffs to risk financial ruin by filing good-faith citizen suits86.
As mentioned previously, in 2015 EPA di-rected 36 states, including Texas, to remove affirmative defenses from their SIPs. Industry groups sued to block the EPA’s action, but in April 2017 the new Trump Administration leadership at the EPA asked the DC Circuit Court of Appeals to delay oral arguments over the SIP call so it could “reconsider all or part” of the rule. In July, EPA officials met to discuss, among other things, “initiating” the rule’s withdrawal.87
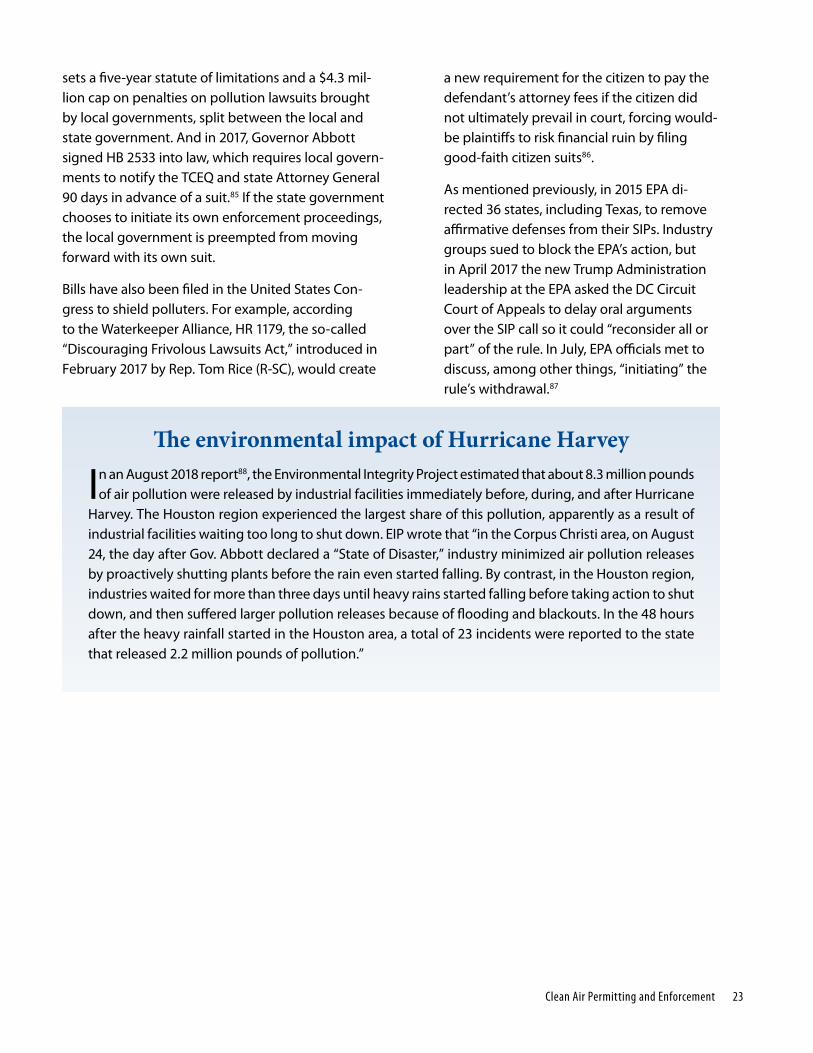
The environmental impact of Hurricane Harvey
In an August 2018 report88, the Environmental Integrity Project estimated that about 8.3 million pounds of air pollution were released by industrial facilities immediately before, during, and after Hurricane
Harvey. The Houston region experienced the largest share of this pollution, apparently as a result of industrial facilities waiting too long to shut down. EIP wrote that “in the Corpus Christi area, on August 24, the day after Gov. Abbott declared a “State of Disaster,” industry minimized air pollution releases by proactively shutting plants before the rain even started falling. By contrast, in the Houston region, industries waited for more than three days until heavy rains started falling before taking action to shut down, and then suffered larger pollution releases because of flooding and blackouts. In the 48 hours after the heavy rainfall started in the Houston area, a total of 23 incidents were reported to the state that released 2.2 million pounds of pollution.”

24 MAJOR MALFUNCTION
Conclusions and Recommendations
Air pollution spikes resulting from malfunc-tions and maintenance events – because they can release large amounts of pol-
lutants in a short amount of time – are especially harmful to people and the environment. Allowing industries to pollute the air with impunity erodes the public’s confidence in the agencies charged with protecting our health, while at the same time providing no incentive for polluters to clean up.
State and federal officials have the tools they need to protect our health and our environment from dangerous air pollution. They can do more to hold accountable the industrial plants that routinely release excessive air pollution as a result of pre-ventable malfunctions and maintenance activities. Consistent and robust enforcement of laws already on the books is the most direct and effective way to rein in rogue polluters.
Congress has also empowered citizens to take enforcement actions to clean up air pollution when the government agencies charged with protect-ing the air we breathe fail to do their jobs. Until the TCEQ improves its enforcement, citizen groups should exercise this right and file citizen suits to force polluters and scofflaws to install modern pol-
lution control equipment and pay meaningful penal-ties for air pollution violations.
Companies should not be allowed to use malfunc-tions and maintenance as a blanket excuse to spew unlimited amounts of dangerous pollutants into the air we Texans breathe without serious consequences or accountability. Strict and consistent enforcement of permit limits will not only create a financial incen-tive for industries to better maintain their plants and invest in modern equipment, but also protect public health and the environment.
In order to reduce illegal air pollution and hold viola-tors accountable, the state should:
• Develop a plan to reduce emissions events and increase compliance
• Adopt mandatory minimum penalties for emissions events
• Eliminate the “affirmative defense” from penalties that is currently available to polluters
• Revoke a facility’s permit after repeated violations until the facility implements plans to return to compliance
Policy Recommendations 25
• Require sources operating under a standard permit or permit by rule (“PBR”) to obtain a source-specific New Source Review permit and/or a Title V operating permit when emissions events cause source emissions to exceed standard permit/PBR limits or Title V major source threshold
• Establish additional monitors, including SO2 monitors in the Permian basis, to accurately measure air quality impacts from unauthorized emissions from industrial sources
At the national level:
• Congress should reject efforts to weaken or elimi-nate the ability of citizen groups to sue to enforce environmental laws
• Congress should maintain, and increase, funding for enforcement by the EPA
• EPA should maintain, and vigorously defend in court, its requirement that states strengthen rules dealing with equipment malfunctions and mainte-nance startups, shutdowns, and malfunctions.
26 MAJOR MALFUNCTION
Methodology and Data
This report ranks the state’s worst air polluters based on companies’ self-reports of emis-sions of air pollution from malfunctions and
maintenance. This report is based on analysis of the reports filed with the State of Texas Electronic Emis-sions Reporting System (STEERS) for 2017. This data is publicly accessible (http://www2.tceq.texas.gov/oce/eer/) and allows members of the public to track unauthorized releases of air pollution by county, or from any facility of interest. We followed the same methodology as in the 2017 report Breakdowns in Enforcement by Environmental Integrity Project and Environment Texas.
The Environmental Integrity Project obtained this data from the Texas Commission on Environmental Quality (TCEQ) via a February 27, 2018 Public Informa-tion Act request. EIP then reviewed the data and re-moved duplicate entries and obvious errors. EIP then graciously provided the data to Environment Texas Research and Policy Center, which used it to calculate regional and statewide tallies.
For this report, we analyzed the most recent full year, 2017, for which information is available for emissions events. While the details of each of the thousands of self-reported emissions events have not yet been verified by state regulators, our analyses of these reports and of the raw emissions data – self-reported
by companies – that they contain is clear evidence of rampant and ongoing air pollution violations.
This report only looks at unplanned emissions events and not at routine emissions. Company self-reported data can be subject to reporting errors, although the STEERS system allows companies two weeks to make any corrections to entries made in their initial reports. And in some cases, facilities will make changes to their “final” reports well after the two-week deadline. In mid-November 2018, Environment Texas Research and Policy Center spot-checked data regarding espe-cially large emissions events in the spreadsheet from EIP against the online STEERS system to capture any late changes.
Additionally, previous research has documented both under-reporting of emissions89, for example of particulate matter, and over-reporting90 (by including routine emissions along with those from emissions events).
All the rankings in this report, including our use of terms such as “top” or “worst” polluters, are based on company self-reports of emissions from their own malfunctions, start-up and shut-down events, and maintenance events. We also chose to combine similar or similarly named pollutant categories (e.g., tallies of nitrogen oxides include nitrogen oxide,
Methodology 27
nitrous oxides, nitrogen dioxide, nitrogen monoxide and other variations) to most accurately represent the total impact of each category of pollution. The category of volatile organic compounds (VOCs) is based on a list from TCEQ obtained at http://www.tceq.texas.gov/assets/public/implementation/air/ie/pseiforms/contams.xlsx. Additional information about chemicals that are VOCs was included from the Centers for Disease Control’s Glossary of Volatile Organic Compounds (https://www.cdc.gov/nceh/clusters/fallon/glossary-voc.pdf); Gang Wang et al., “Characteristics and Source Apportionment of VOCs in the Suburban Area of Beijing, China,” Atmospheric Pollution Research, 7(4):711-724, July 2016, available at (https://www.sciencedirect.com/science/article/pii/S1309104215300386); and Hy-Bon’s The ABCs of VOC Emissions from Quad O Facilities (https://hy-bon.com/blog/voc-emissions-from-quad-o-facilities/) to confirm that “non-methane non-ethane natural gas” reported in the STEERS data is VOCs. We did not in-clude reported emissions of “natural gas” in our tally.
To calculate TCEQ’s enforcement rates, we started by reviewing the list of STEERS reports for 2017 provided to us by Environmental Integrity Project. We then found the annual administrative air enforcement tables attached to TCEQ’s FY17 Annual Enforcement Report91 and used the docket numbers listed in the tables to download each air enforcement order from the TCEQ’s Integrated Database: http://www14.tceq.texas.gov/epic/eCID/. However, this report only cov-ered the Fiscal Year 2017, so an open records request was submitted to and fulfilled by the TCEQ to obtain all the air enforcement orders issues from September through December of 2017.
Next, we determined which emissions event(s), if any, was addressed by each enforcement order. This was done by searching each individual enforce-ment order for an incident number connected to a specific STEERS event. These numbers are typically found within parentheses in either the “Findings of Fact” or “Allegations” sections of the enforcement order. Enforcement orders that did not have a specific
STEERS incident number in their report and were not connected to an emissions event were then not in-cluded in administrative penalty calculations. We also learned directly from TCEQ that no civil or criminal enforcement actions were filed in court by the State of Texas in 2017.
Using this information, we calculated the percentage of reported events that were subject to enforcement for 2017. This was done by taking the total number of air enforcement orders issued in 2017 that ad-dressed a specific emissions event and comparing that number to the total number of STEERS air emis-sions events taking place in 2017. The total number of STEERS emissions events in 2017 was calculated from data obtained from the TCEQ by the Environ-ment Integrity Project. Enforcement rates for prior years were calculated in the 2017 report Breakdowns in Enforcement by Environmental Integrity Project and Environment Texas.
Top 10 lists in this document were determined by using the 2017 events report in the STEERS data obtained and cleaned by EIP and spot-checked by Environment Texas Research & Policy Center against the online STEERS records. We used the pivot table function in Excel to tally emissions from each facil-ity for each pollutant and rank the highest-emitting facilities.
To identify the most polluting facilities for each TCEQ enforcement region were identified by using the “TCEQ Region” column to select for the facilities in each region. Total emissions from each facility were tallied and facilities were ranked.
We calculated possible fines, we first divided the “du-ration (hours)” column by 24 to calculate the duration in days of each pollution event. We rounded those in-cidents up to the nearest whole number (ex. 25 hours equals 2 days). Then we estimated fines in two ways:
1) The method of EPA and the Texas Attorney General where the $25,000 per day cap is applied against each pollutant in each 24 hour period. The number

28 MAJOR MALFUNCTION
of pollutants emitted over each time frame (<1 day, 2 days, 3 days, etc.) were totaled and multiplied by $25,000 and the number of days they were emitting a pollutant to find the maximum fine TCEQ could have imposed.
2) TCEQ’s method where the $25,000 per day cap is applied against each 24 hour period of an individual emissions event regardless of the number of pollut-ants released.
For the minimum or TCEQ method of assessing fines, we pulled out all the “complaint incident numbers” and removed all the duplicates using Excel’s ”remove duplicates” function so that each incident number
appeared once. Then we matched each incident number with the duration in days that we calculated. We summed the number of incident days and multi-plied that by $25,000.
After Environmental Integrity Project and Environ-ment Texas published our 2017 report Breakdowns in Enforcement, which first found that TCEQ issues fines against fewer than 3 percent of emissions events, TCEQ staff responded to the media by stating that 7 percent of events receive Notices of Violations (NOVs). As discussed earlier in the report, NOVs do not in-clude financial penalties, and thus are not included in our percentage of emissions events receiving fines.

Appendices 29
Table 8: Top 10 Malfunction and Maintenance Polluters, 2017
Rank Facility Name Facility Owner County Total Pounds
1 Waha Header Compressor Station Trans-Pecos Pipeline, LLC Pecos 3,882,744
2 Mabee Ranch CO2 Plant Chevron USA, Inc. Andrews 3,259,671
3 Seminole Gas Processing Plant Hess Corporation,
OXY USA Inc.
Gaines 3,029,793
4 Galena Park Terminal Magellan Terminals Holding, LP Harris 2,529,318
5 Silvertio 76 17 Unit P 1H Anadarko E&P Onshore LLC Loving 2,156,133
6 ExxonMobil Beaumont Refinery ExxonMobil Oil Corporation Jefferson 1,737,392
7 James Lake Gas Plant James Lake Midstream LLC Ector 1,573,139
8 JT McElroy 202 TB Chevron USA Inc. Crane 1,530,642
9 Parks Compressor Station Targa Pipeline Mid-Continent WestTex LLC
Midland 1,377,095
10 Goldsmith Gas Plant DCP Operating Company, LP Ector 1,141,200
Appendix: Tables of Worst Polluters Statewide and by Metro Area
30 MAJOR MALFUNCTION
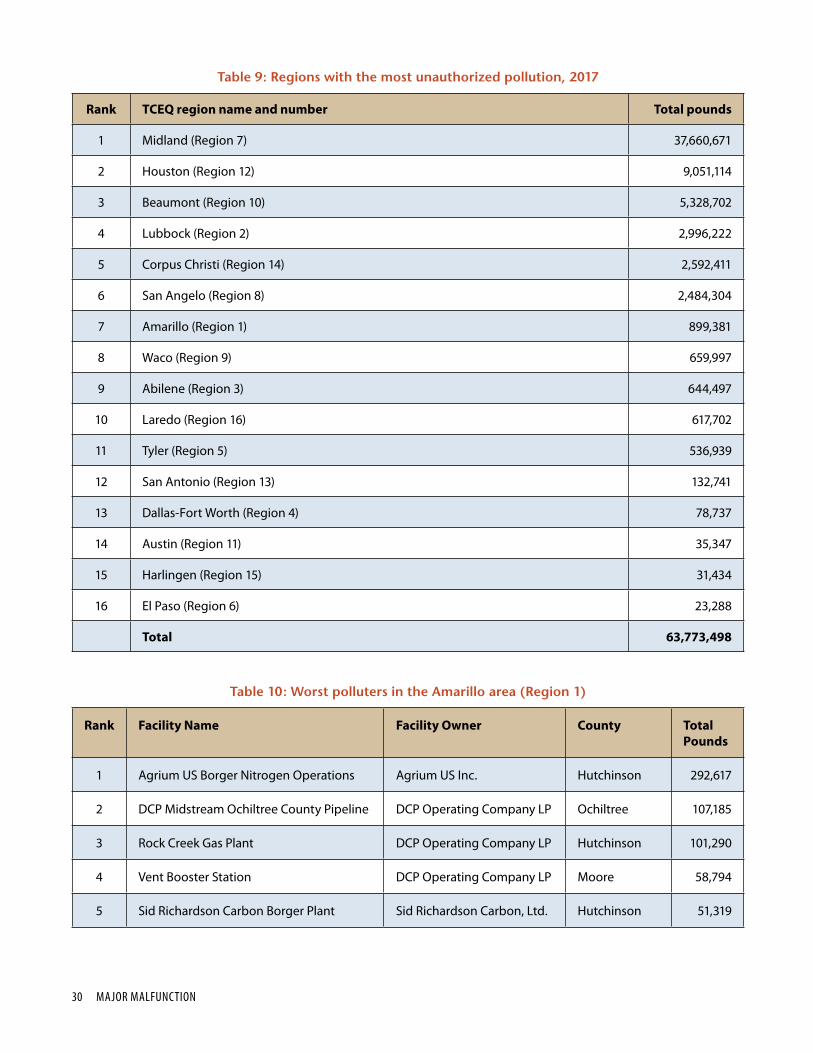
Table 9: Regions with the most unauthorized pollution, 2017
Rank TCEQ region name and number Total pounds
1 Midland (Region 7) 37,660,671
2 Houston (Region 12) 9,051,114
3 Beaumont (Region 10) 5,328,702
4 Lubbock (Region 2) 2,996,222
5 Corpus Christi (Region 14) 2,592,411
6 San Angelo (Region 8) 2,484,304
7 Amarillo (Region 1) 899,381
8 Waco (Region 9) 659,997
9 Abilene (Region 3) 644,497
10 Laredo (Region 16) 617,702
11 Tyler (Region 5) 536,939
12 San Antonio (Region 13) 132,741
13 Dallas-Fort Worth (Region 4) 78,737
14 Austin (Region 11) 35,347
15 Harlingen (Region 15) 31,434
16 El Paso (Region 6) 23,288
Total 63,773,498
Table 10: Worst polluters in the Amarillo area (Region 1)
Rank Facility Name Facility Owner County Total Pounds
1 Agrium US Borger Nitrogen Operations Agrium US Inc. Hutchinson 292,617
2 DCP Midstream Ochiltree County Pipeline DCP Operating Company LP Ochiltree 107,185
3 Rock Creek Gas Plant DCP Operating Company LP Hutchinson 101,290
4 Vent Booster Station DCP Operating Company LP Moore 58,794
5 Sid Richardson Carbon Borger Plant Sid Richardson Carbon, Ltd. Hutchinson 51,319

Appendices 31
Table 11: Worst polluters in the Lubbock area (Region 2)
Rank Facility Name Facility Owner County Total Pounds
1 Denver Unit CO2 Recovery Plant Occidental Permian Ltd. Yoakum 824,153
2 Slaughter Gasoline Plant Occidental Permian Ltd. Hockley 479,457
3 Cornell Field Flare Site XTO Energy Inc. Yoakum 452,183
4 Willard CO2 Separation Plant Oxy USA WTP LP;
Occidental Permian Ltd.
Yoakum 340,515
5 Mallet CO2 Recovery Plant Occidental Permian Ltd. Hockley 233,331
Table 12: Worst polluters in the Abilene area (Region 3)
Rank Facility Name Facility Owner County Total Pounds
1 Sacroc Carbon Dioxide Treatment Plant Kinder Morgan Production Company LLC
Scurry 153,882
2 Kinder Morgan Production Pipeline Scurry County
Kinder Morgan Production Company LP
Scurry 132,641
3 Salt Creek Gas Plant Oxy USA WTP LP Kent 111,228
4 Louis Dreyfus Pipeline Callahan County Louis Dreyfus Pipeline LP Callahan 55,524
5 Bowie Compressor Station Davis Gas Processing Inc. Montague 32,053
Table 13: Worst polluters in the Dallas-Fort Worth area (Region 4)
Rank Facility Name Facility Owner County Total Pounds
1 Munson Compressor Station Targa Midstream Services LLC Denton 34,916
2 West Johnson County Compressor Station
Cowtown Gas Processing Partners LP Johnson 16,902
3 Wylie Water Plant North Texas Municipal Water District Collin 16,472
4 Versacold Logistics Services Versacold Texas LP Tarrant 2,358
5 Owens Corning Insulating Systems Waxahachie Plant
Owens Corning Insulating Systems, LLC
Ellis 2,145

32 MAJOR MALFUNCTION
Table 14: Worst polluters in the Tyler area (Region 5)
Rank Facility Name Facility Owner County Total Pounds
1 Enable Gas Transmission Pipeline Cass County
Enable Gas Transmission, LLC Cass 238,987
2 Pittsburg Gas Plant Enbridge G&P LP Camp 146,084
3 Duke Energy Field Services Pipeline Panola County
DCP Operating Company LP Panola 35,784
4 Marshall Plant Cabot Norit Americas, Inc. Harrison 27,140
5 Enbridge Pipelines NE Texas Pipeline Panola County
Enbridge Pipelines (NE Texas) L.P. Panola 21,849
Table 15: Worst polluters in the El Paso area (Region 6)
Rank Facility Name Facility Owner County Total Pounds
1 Western Refining El Paso Western Refining Company LP El Paso 12,603
2 Newman Power Station El Paso Electric Company El Paso 5,506
3 Capitan Compressor Station Delaware Basin Midstream LLC Culberson 5,164
Table 16: Worst polluters in the Midland-Odessa area (Region 7)
Rank Facility Name Facility Owner County Total Pounds
1 Waha Header Compressor Station Trans-Pecos Pipeline LLC Pecos 3,882,744
2 Mabee Ranch CO2 Plant Chevron USA Inc. Andrews 3,259,671
3 Seminole Gas Processing Plant Hess Corporation
OXY USA Inc.
Gaines 3,029,793
4 Silvertio 76 17 Unit P 1H Anadarko E&P Onshore LLC Loving 2,156,133
5 James Lake Gas Plant James Lake Midstream LLC Ector 1,573,139
Appendices 33
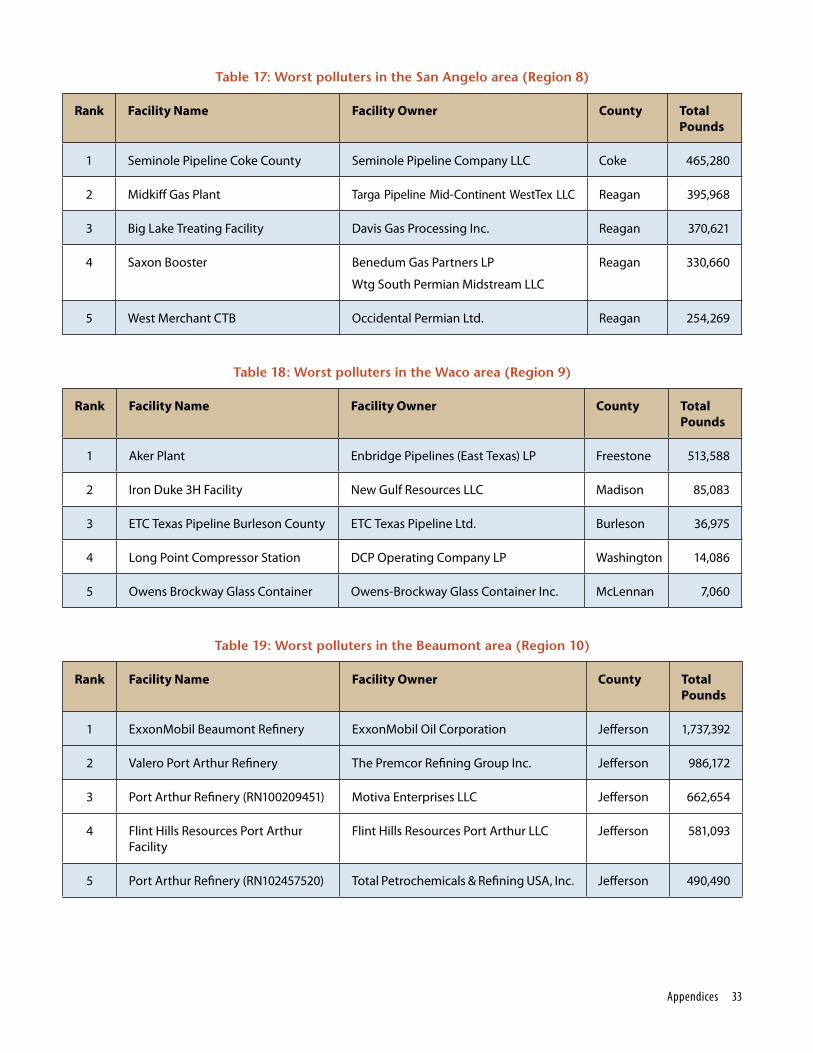
Table 17: Worst polluters in the San Angelo area (Region 8)
Rank Facility Name Facility Owner County Total Pounds
1 Seminole Pipeline Coke County Seminole Pipeline Company LLC Coke 465,280
2 Midkiff Gas Plant Targa Pipeline Mid-Continent WestTex LLC Reagan 395,968
3 Big Lake Treating Facility Davis Gas Processing Inc. Reagan 370,621
4 Saxon Booster Benedum Gas Partners LP
Wtg South Permian Midstream LLC
Reagan 330,660
5 West Merchant CTB Occidental Permian Ltd. Reagan 254,269
Table 18: Worst polluters in the Waco area (Region 9)
Rank Facility Name Facility Owner County Total Pounds
1 Aker Plant Enbridge Pipelines (East Texas) LP Freestone 513,588
2 Iron Duke 3H Facility New Gulf Resources LLC Madison 85,083
3 ETC Texas Pipeline Burleson County ETC Texas Pipeline Ltd. Burleson 36,975
4 Long Point Compressor Station DCP Operating Company LP Washington 14,086
5 Owens Brockway Glass Container Owens-Brockway Glass Container Inc. McLennan 7,060
Table 19: Worst polluters in the Beaumont area (Region 10)
Rank Facility Name Facility Owner County Total Pounds
1 ExxonMobil Beaumont Refinery ExxonMobil Oil Corporation Jefferson 1,737,392
2 Valero Port Arthur Refinery The Premcor Refining Group Inc. Jefferson 986,172
3 Port Arthur Refinery (RN100209451) Motiva Enterprises LLC Jefferson 662,654
4 Flint Hills Resources Port Arthur Facility
Flint Hills Resources Port Arthur LLC Jefferson 581,093
5 Port Arthur Refinery (RN102457520) Total Petrochemicals & Refining USA, Inc. Jefferson 490,490

34 MAJOR MALFUNCTION
Table 20: Worst polluters in the Austin area (Region 11)
Rank Facility Name Facility Owner County Total Pounds
1 Flag Pond Booster DCP Operating Company, LP Lee 23,634
2 Luling Gas Plant Davis Gas Processing, Inc. Caldwell 6,108
3 Bastrop Pump Station Magellan Crude Oil Pipeline Company LP
Bastrop 1,808
4 Sand Hill Energy Center City of Austin DBA Austin Energy Travis 1,550
5 Austin White Lime McNeil Plant and Quarry Austin White Lime Company Travis 1,200
Table 21: Worst polluters in the Houston/Galveston area (Region 12)
Rank Facility Name Facility Owner County Total Pounds
1 Galena Park Terminal Magellan Terminals Holdings,
Seaway Pipeline Inc.,
KM Liquids Terminals LLC
Harris 2,529,318
2 Chevron Phillips Chemical Cedar Bayou Plant
Chevron Phillips Chemical Company LP
Harris 820,475
3 Exxon Mobil Baytown Refinery Exxon Mobil Corporation Harris 805,174
4 Chocolate Bayou Plant Ineos USA LLC Brazoria 719,293
5 Dow Texas Operations Freeport The Dow Chemical Company Brazoria 696,744
Table 22: Worst polluters in the San Antonio area (Region 13)
Rank Facility Name Facility Owner County Total Pounds
1 Bowman West 141H 146H Production Facility
Texas American Resources Operating Company
Atascosa 36,091
2 Schorp-White 3H Production Facility Cabot Oil and Gas Corporation Frio 23,104
3 CGT New Braunfels CGT US Limited Comal 11,351
4 Pickens B 2H et al Production Facility Cabot Oil and Gas Corporation Frio 11,145
5 Pearsall Compressor Station Enterprise Products Operating LLC Frio 6,482
Appendices 35
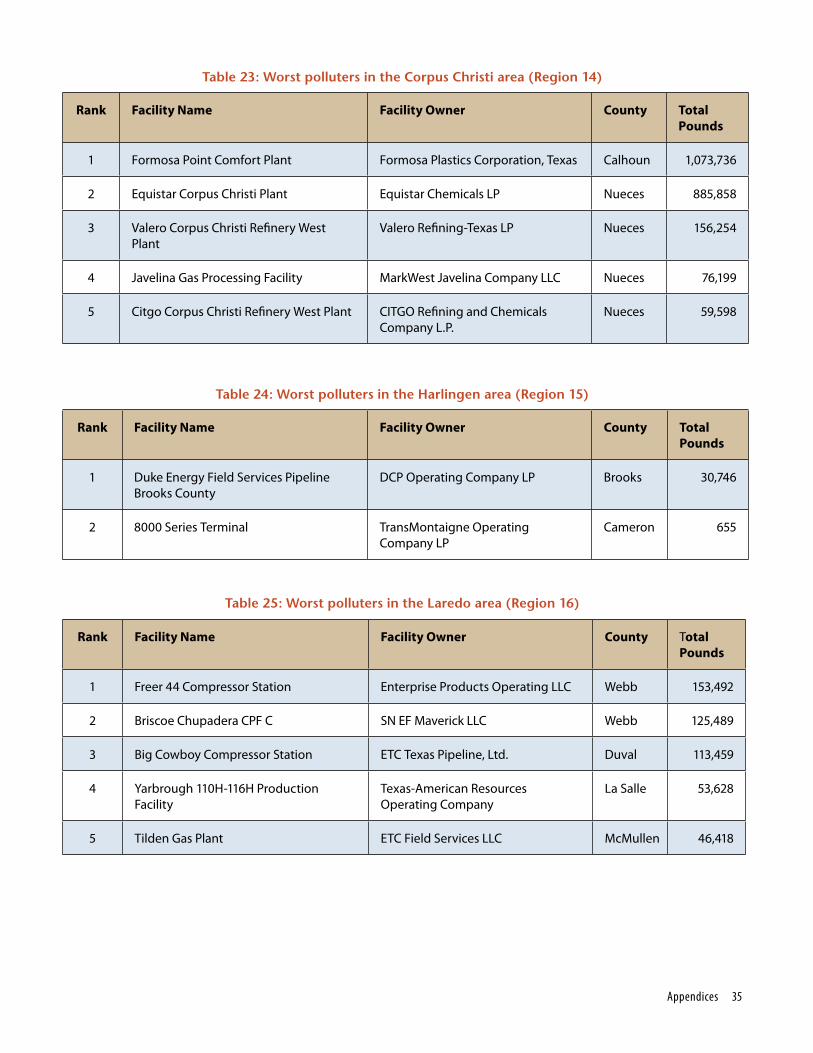
Table 23: Worst polluters in the Corpus Christi area (Region 14)
Rank Facility Name Facility Owner County Total Pounds
1 Formosa Point Comfort Plant Formosa Plastics Corporation, Texas Calhoun 1,073,736
2 Equistar Corpus Christi Plant Equistar Chemicals LP Nueces 885,858
3 Valero Corpus Christi Refinery West Plant
Valero Refining-Texas LP Nueces 156,254
4 Javelina Gas Processing Facility MarkWest Javelina Company LLC Nueces 76,199
5 Citgo Corpus Christi Refinery West Plant CITGO Refining and Chemicals Company L.P.
Nueces 59,598
Table 24: Worst polluters in the Harlingen area (Region 15)
Rank Facility Name Facility Owner County Total Pounds
1 Duke Energy Field Services Pipeline Brooks County
DCP Operating Company LP Brooks 30,746
2 8000 Series Terminal TransMontaigne Operating Company LP
Cameron 655
Table 25: Worst polluters in the Laredo area (Region 16)
Rank Facility Name Facility Owner County Total Pounds
1 Freer 44 Compressor Station Enterprise Products Operating LLC Webb 153,492
2 Briscoe Chupadera CPF C SN EF Maverick LLC Webb 125,489
3 Big Cowboy Compressor Station ETC Texas Pipeline, Ltd. Duval 113,459
4 Yarbrough 110H-116H Production Facility
Texas-American Resources Operating Company
La Salle 53,628
5 Tilden Gas Plant ETC Field Services LLC McMullen 46,418

36 MAJOR MALFUNCTION
Table 26: Total emissions per year 2015-2017
Year Total pounds of emissions
Percent change from previous year
2015 84,095,686
2016 50,248,782 -40%
2017 63,773,498 +27%
Total 198,117,966
As in years past, many significant emissions events in 2017 did not occur in short bursts. Many took place over long periods of time and were the result of inaction by facility owners. These events could last for months on end before these owners took action to stop these particularly damaging long-term events.
Table 27: Top 10 Longest Emissions Events, 2017
Rank Facility Name Facility Owner County Event Start Date
Event End Date
Total Hours
1 Seminole Gas Processing Plant
OXY USA Inc. Gaines 3/22/17 8/12/17 3,432
2 Port Arthur Refinery (RN102457520)
Total Petrochemicals & Refining USA, Inc.
Jefferson 9/23/17 2/9/18 3,338
3 Arkema Crosby Plant Arkema Inc. Harris 12/11/17 3/28/18 2,569
4 Sealy Smith Clearfork facilities
Occidental Permian Ltd. Ward 5/12/17 8/27/17 2,568
5 F Foster Satellite 1 Occidental Permian Ltd. Ector 6/28/17 10/9/17 2,475
6 Port Arthur Facility German Pellets Texas LLC Jefferson 4/16/17 7/21/17 2,304
7 Bennett Ranch Central Tank Battery
Occidental Permian Ltd. Yoakum 2/1/17 5/5/17 2,226
8 BASF Beaumont Argo Plant BASF Corporation Jefferson 2/20/17 5/10/17 1,889
9 Bastrop Pump Station Magellan Crude Oil Pipeline Company, LP
Bastrop 7/13/17 9/28/17 1,856
10 Waha Header Compressor Station
Trans-Pecos Pipeline LLC Pecos 10/5/17 11/30/17 1,343
Notes 37
1. Zirogiannis, Nikolaos, Alex J. Hollingsworth, and David M. Konisky. “Understanding Excess Emissions from Industrial Facilities: Evidence from Texas.” ACS Publications. January 27, 2018. Accessed November 30, 2018. https://pubs.acs.org/doi/10.1021/acs.est.7b04887.
2. We looked at calendar year 2017. TCEQ’s annual enforcement report does their own annual tallies based on their fiscal year (9/1/2017 – 8/31/2018).
3. “Health Effects of Particulate Matter.” World Health Organization, 2013. Accessed December 3, 2018. http://www.euro.who.int/__data/assets/pdf_file/0006/189051/Health-effects-of-particulate-matter-final-Eng.pdf.
4. Caiazzo, Fabio, Akshay Ashok, Ian A. Waitz, Steve H.L. Yim, and Steven R.H. Barrett. Air pollution and early deaths in the United States. Part I: Quantifying the impact of major sectors in 2005. May 31, 2013. Accessed December 7, 2018. http://www.coolgreenschools.com/wp-content/uploads/2015/07/US-air-pollution-paper.pdf.
5. Caiazzo, Fabio, Akshay Ashok, Ian A. Waitz, Steve H.L. Yim, and Steven R.H. Barrett. Air pollution and early deaths in the United States. Part I: Quantifying the impact of major sectors in 2005. May 31, 2013. Accessed December 7, 2018. http://www.coolgreenschools.com/wp-content/uploads/2015/07/US-air-pollution-paper.pdf.
6. Caiazzo, Fabio, Akshay Ashok, Ian A. Waitz, Steve H.L. Yim, and Steven R.H. Barrett. Air pollution and early deaths in the United States. Part I: Quantifying the impact of major sectors in 2005. May 31, 2013. Accessed December 7, 2018. http://www.coolgreenschools.com/wp-content/uploads/2015/07/US-air-pollution-paper.pdf.
7. Caiazzo, Fabio, Akshay Ashok, Ian A. Waitz, Steve H.L. Yim, and Steven R.H. Barrett. Air pollution and early
deaths in the United States. Part I: Quantifying the impact of major sectors in 2005. May 31, 2013. Accessed December 7, 2018. http://www.coolgreenschools.com/wp-content/uploads/2015/07/US-air-pollution-paper.pdf.
8. Caiazzo, Fabio, Akshay Ashok, Ian A. Waitz, Steve H.L. Yim, and Steven R.H. Barrett. Air pollution and early deaths in the United States. Part I: Quantifying the impact of major sectors in 2005. May 31, 2013. Accessed December 7, 2018. http://www.coolgreenschools.com/wp-content/uploads/2015/07/US-air-pollution-paper.pdf.
9. Caiazzo, Fabio, Akshay Ashok, Ian A. Waitz, Steve H.L. Yim, and Steven R.H. Barrett. Air pollution and early deaths in the United States. Part I: Quantifying the impact of major sectors in 2005. May 31, 2013. Accessed December 7, 2018. http://www.coolgreenschools.com/wp-content/uploads/2015/07/US-air-pollution-paper.pdf.
10. Caiazzo, Fabio, Akshay Ashok, Ian A. Waitz, Steve H.L. Yim, and Steven R.H. Barrett. Air pollution and early deaths in the United States. Part I: Quantifying the impact of major sectors in 2005. May 31, 2013. Accessed December 7, 2018. http://www.coolgreenschools.com/wp-content/uploads/2015/07/US-air-pollution-paper.pdf.
11. Caiazzo, Fabio, Akshay Ashok, Ian A. Waitz, Steve H.L. Yim, and Steven R.H. Barrett. Air pollution and early deaths in the United States. Part I: Quantifying the impact of major sectors in 2005. May 31, 2013. Accessed December 7, 2018. http://www.coolgreenschools.com/wp-content/uploads/2015/07/US-air-pollution-paper.pdf.
12. Caiazzo, Fabio, Akshay Ashok, Ian A. Waitz, Steve H.L. Yim, and Steven R.H. Barrett. Air pollution and early deaths in the United States. Part I: Quantifying the impact of major sectors in 2005. May 31, 2013. Accessed December
Notes

38 MAJOR MALFUNCTION
7, 2018. http://www.coolgreenschools.com/wp-content/uploads/2015/07/US-air-pollution-paper.pdf.
13. Caiazzo, Fabio, Akshay Ashok, Ian A. Waitz, Steve H.L. Yim, and Steven R.H. Barrett. Air pollution and early deaths in the United States. Part I: Quantifying the impact of major sectors in 2005. May 31, 2013. Accessed December 7, 2018. http://www.coolgreenschools.com/wp-content/uploads/2015/07/US-air-pollution-paper.pdf.
14. Caiazzo, Fabio, Akshay Ashok, Ian A. Waitz, Steve H.L. Yim, and Steven R.H. Barrett. Air pollution and early deaths in the United States. Part I: Quantifying the impact of major sectors in 2005. May 31, 2013. Accessed December 7, 2018. http://www.coolgreenschools.com/wp-content/uploads/2015/07/US-air-pollution-paper.pdf.
15. Caiazzo, Fabio, Akshay Ashok, Ian A. Waitz, Steve H.L. Yim, and Steven R.H. Barrett. Air pollution and early deaths in the United States. Part I: Quantifying the impact of major sectors in 2005. May 31, 2013. Accessed December 7, 2018. http://www.coolgreenschools.com/wp-content/uploads/2015/07/US-air-pollution-paper.pdf.
16. Caiazzo, Fabio, Akshay Ashok, Ian A. Waitz, Steve H.L. Yim, and Steven R.H. Barrett. Air pollution and early deaths in the United States. Part I: Quantifying the impact of major sectors in 2005. May 31, 2013. Accessed December 7, 2018. http://www.coolgreenschools.com/wp-content/uploads/2015/07/US-air-pollution-paper.pdf.
17. Caiazzo, Fabio, Akshay Ashok, Ian A. Waitz, Steve H.L. Yim, and Steven R.H. Barrett. Air pollution and early deaths in the United States. Part I: Quantifying the impact of major sectors in 2005. May 31, 2013. Accessed December 7, 2018. http://www.coolgreenschools.com/wp-content/uploads/2015/07/US-air-pollution-paper.pdf.
18. Zirogiannis, Nikolaos, Alex J. Hollingsworth, and David M. Konisky. Understanding Excess Emissions from Industrial Facilities: Evidence from Texas. January 27, 2018. Accessed December 7, 2018. https://pubs.acs.org/doi/abs/10.1021/acs.est.7b04887?src=recsys&journalCode=esthag.
19. Horswell, Cindy, and Susan Carroll. “Study: Children near Ship Channel Face More Risk.” Houston Chronicle. July 25, 2011. Accessed November 30, 2018. https://www.chron.com/news/houston-texas/article/Study-Children-near-Ship-Channel-face-more-risk-1583566.php.
20. “Complaint Status.” Default Page - Texas Commission on Environmental Quality. June 16, 2017. Accessed December 03, 2018. http://www2.tceq.texas.gov/oce/waci/index.cfm?fuseaction=home.complaint&incid=261131.
21. “TCEQ Air Emission Event Reports Search.” Texas Commission on Environmental Quality. July 14, 2017. Accessed November 30, 2018. http://www2.tceq.texas.gov/oce/eer/index.cfm?fuseaction=main.getDetails&target=260392.
22. “TCEQ Air Emission Event Reports Search.” Texas Commission on Environmental Quality. June 19, 2017. Accessed November 30, 2018. http://www2.tceq.texas.gov/oce/eer/index.cfm?fuseaction=main.getDetails&target=260221.
23. Complaint was submitted to TCEQ via NeighborhoodWitness.org and cc’d to Environment Texas Research and Policy Center.
24. “TCEQ Air Emission Event Reports Search.” Texas Commission on Environmental Quality. October 27, 2017. Accessed November 30, 2018. http://www2.tceq.texas.gov/oce/eer/index.cfm?fuseaction=main.getDetails&target=270307.
“TCEQ Air Emission Event Reports Search.” Texas Commission on Environmental Quality. May 17, 2017. Accessed November 30, 2018. http://www2.tceq.texas.gov/oce/eer/index.cfm?fuseaction=main.getDetails&target=270258.
“TCEQ Air Emission Event Reports Search.” Texas Commission on Environmental Quality. November 2, 2017. Accessed November 30, 2018. http://www2.tceq.texas.gov/oce/eer/index.cfm?fuseaction=main.getDetails&target=270257.

Notes 39
25. “Air Emission Event Report Database Incident 268139.” Default Page - Texas Commission on Environmental Quality. Accessed December 06, 2018. http://www2.tceq.texas.gov/oce/waci/index.cfm?fuseaction=home.complaint&incid=268181.
26. “TCEQ Air Emission Event Reports Search.” Default Page - Texas Commission on Environmental Quality. Accessed December 06, 2018. http://www2.tceq.texas.gov/oce/eer/index.cfm?fuseaction=main.getDetails&target=268139.
27. “TCEQ Air Emission Event Reports Search.” Texas Commission on Environmental Quality. December 21, 2017. Accessed November 30, 2018. http://www2.tceq.texas.gov/oce/eer/index.cfm?fuseaction=main.getDetails&target=273578.
28. Complaint was submitted to TCEQ via NeighborhoodWitness.org and cc’d to Environment Texas Research and Policy Center.
29. “Annual Enforcement Report Fiscal Year 2018.” TCEQ Annual Enforcement Reports, November 2018. Accessed December 5, 2018.
30. “Air Pollution From Industrial Shutdowns and Startups a Grave Danger to Public Health.” EcoWatch. April 26, 2018. Accessed December 05, 2018. https://www.ecowatch.com/air-pollution-startups-shutdowns-2534981679.html.
31. Bennett, Kathleen M. “Policy on Excess Emissions during Startup, Shutdown, Maintenance, and Malfunctions.” Office of Air, Noise, and Radiation, February 15, 1983. February 25, 1998. Accessed December 5, 2018. https://www.epa.gov/sites/production/files/documents/excess-start-rpt.pdf.
32. Flaring is used to burn off flammable gas released during pressure buildups. Gases are piped to a remote, usually elevated, flaring rig and burned in an open flame in the open air (Evans, Leslie B., and William M. Vatavuk. “Section 3: VOC Controls.” Environmental Protection Agency, September 2000. September 2000. Accessed December 5, 2018. https://www3.epa.gov/ttncatc1/dir1/cs3-2ch1.pdf).
33. Texas Commission on Environmental Quality, Texas Administrative Code, A. (Tex.). Accessed December 7, 2018. http://texreg.sos.state.tx.us/public/readtac$ext.TacPage?sl=R&app=9&p_dir=&p_rloc=&p_tloc=&p_ploc=&pg=1&ti=30&ch=101&rl=201.
34. World Health Organization Public Health and Environment. Exposure to Benzene: A Major Public Health Concern. 2010. Accessed December 7, 2018. https://www.who.int/ipcs/features/benzene.pdf.
35. Tresaugue, Matthew. “Study links benzene exposure in Texas neighborhoods with spina bifida.” The Dallas Morning News (Dallas, TX), October 2010. Accessed December 7, 2018. https://www.dallasnews.com/news/texas/2010/10/28/Study-links-benzene-exposure-in-Texas-4925.
36. World Health Organization Public Health and Environment. Exposure to Benzene: A Major Public Health Concern. 2010. Accessed December 7, 2018. https://www.who.int/ipcs/features/benzene.pdf.
37. All tables in the report refer to emissions “during malfunction and maintenance”. We use this phrase to refer to all unauthorized emissions resulting from emissions events and unscheduled startup, shutdown or maintenance.
38. “Nitrogen Oxides: Your Environment, Your Health | National Library of Medicine.” U.S. National Library of Medicine. Accessed December 05, 2018. https://toxtown.nlm.nih.gov/chemicals-and-contaminants/nitrogen-oxides.
39. “Ground-level Ozone Basics.” EPA. October 31, 2018. Accessed December 05, 2018. https://www.epa.gov/ground-level-ozone-pollution/ground-level-ozone-basics#formation.
40. Texas Commission on Environmental Quality. “Houston-Galveston-Brazoria: Current Attainment Status.” Texas Commission on Environmental Quality. Last modified November 9, 2018. Accessed December 7, 2018. https://www.tceq.texas.gov/airquality/sip/hgb/hgb-status.
40 MAJOR MALFUNCTION
41. Anderson, Jonathan O., Josef G. Thundiyil, and Andrew Stolbach. Clearing the Air: A Review of the Effects of Particulate Matter Air Pollution on Human Health. December 23, 2011. Accessed December 7, 2018. https://www.ncbi.nlm.nih.gov/pmc/articles/PMC3550231/.
42. “Health and Environmental Effects of Particulate Matter (PM).” EPA. June 20, 2018. Accessed December 05, 2018. https://www.epa.gov/pm-pollution/health-and-environmental-effects-particulate-matter-pm.
43. “An Assessment of emissions events trends within the Greater Houston area during 2003 – 2013.”
44. US National Library of Medicine. “Volatile Organic Compounds (VOCs).” ToxTown. Last modified May 31, 2017. Accessed December 7, 2018. https://toxtown.nlm.nih.gov/chemicals-and-contaminants/volatile-organic-compuounds-vocs.
45. Texas Commission on Environmental Quality. “Houston-Galveston-Brazoria: Current Attainment Status.” Texas Commission on Environmental Quality. Last modified November 9, 2018. Accessed December 7, 2018. https://www.tceq.texas.gov/airquality/sip/hgb/hgb-status.
46. Texas Commission on Environmental Quality. “Beaumount-Port Arthur: Current Attainment Status.” Texas Commission on Environmental Quality. Last modified November 9, 2018. Accessed December 7, 2018. https://www.tceq.texas.gov/airquality/sip/bpa/bpa-status
47. Environmental Protection Agency, Frequent, Routine Flaring May Cause Excessive, Uncontrolled Sulfur Dioxide Releases (Oct. 2000). Accessed December 7, 2018. https://www.epa.gov/sites/production/files/documents/flaring.pdf.
48. Centers for Disease Control Agency for Toxic Substances and Disease Registry. Public Health Statement for Sulfur Dioxide. December 1998. Accessed December 7, 2018. https://www.atsdr.cdc.gov/phs/phs.asp?id=251&tid=46.
49. Centers for Disease Control Agency for Toxic Substances and Disease Registry. Public Health Statement for Hydrogen Sulfide. January 21, 2015. Accessed December 7, 2018. https://www.atsdr.cdc.gov/phs/phs.asp?id=387&tid=67.
50. Lubbock Avalanche-Journal (Lubbock, TX). “Denver City Remembers H2S Tragedy.” September 15, 2010. Accessed December 7, 2018. https://www.lubbockonline.com/article/20100915/NEWS/309159883.
51. 42 U.S.C. § 7401(b)(1).
52. https://statutes.capitol.texas.gov/Docs/HS/htm/HS.382.htm
53. CAA’s Prevention of Significant Deterioration (“PSD”) program, Part C of Subchapter I of the Act, 42 U.S.C. §§ 7474-7492, and New Source Review (“NSR”) program, Part D of Subchapter I of the Act, 42 U.S.C. §§ 7501- 7515.
54. 30 Tex. Admin. Code § 101.1(108).
55. Flexible Permit No. 18287, Issued to ExxonMobil’s Baytown Refinery by TCEQ under the CAA’s New Source Review program § Special Conditions 38 & 39 (2018).
56. HEALTH AND SAFETY CODE TITLE 5. SANITATION AND ENVIRONMENTAL QUALITY, Tex. Health & Safety Code Ann. (Sept. 1, 1989). Accessed December 7, 2018. https://statutes.capitol.texas.gov/Docs/HS/htm/HS.382.htm.
57. Texas may be the only state in the U.S. to have such comprehensive reporting requirements and transparent data of unauthorized pollution and is to be commended for this program.
58. “Mission Statement and Agency Philosophy.” TCEQ. Accessed December 05, 2018. https://www.tceq.texas.gov/agency/mission.html.
59. “Annual Enforcement Report Fiscal Year 2018.” TCEQ Annual Enforcement Reports, November 2018. Accessed December 5, 2018.
60. “Environmental Quality.” Texas Administrative Code. Accessed December 05, 2018. https://texreg.sos.state.tx.us/public/readtac$ext.TacPage?sl=R&app=9&p_dir=&p_rloc=&p_tloc=&p_ploc=&pg=1&p_tac=&ti=30&pt=1&ch=101&rl=222.
Notes 41
61. From transcript of trial proceedings, Day 8, February 20, 2014, in Environment Texas Citizen Lobby, Inc and Sierra Club v. Exxon Mobil Corporation et al.
62. Environmental Protection Agency, State Plans to Address Emissions During Startup, Shutdown and Malfunction: Final Action on Response to Petition for Rulemaking, Restatement of Policy, Findings of Inadequacy and Call for Revisions, H.R. Doc. (). Accessed December 7, 2018. https://www.epa.gov/sites/production/files/2016-03/documents/20150522fs.pdf.
63. Swift, Whit. “TCEQ Adopts Changes to Affirmative Defense Rule in Response to EPA SIP Call.” Bracewell. November 3, 2016. Accessed December 05, 2018. https://www.energylegalblog.com/blog/2016/11/03/tceq-adopts-changes-affirmative-defense-rule-response-epa-sip-call.
64. Environmental Protection Agency, Texas Chapter 101 - General Air Quality Rules, H.R. Doc. (Jan. 10, 2011). Accessed December 7, 2018. https://www.epa.gov/sites/production/files/2017-07/documents/ch_101_sect_101.221-101.224.pdf.
65. “Annual Enforcement Report Fiscal Year 2018.” TCEQ Annual Enforcement Reports, November 2018. Accessed December 5, 2018. https://www.tceq.texas.gov/assets/public/compliance/enforcement/enf_reports/AER/FY18/enfrptfy18.pdf.
66. “Enforcement Definitions.” Texas Commission on Environmental Quality. June 28, 2018. Accessed December 05, 2018. https://www.tceq.texas.gov/compliance/enforcement/definitions.html#noe.
67. In its FY18 Annual Enforcement Report, TCEQ writes that, “in many cases it (an NOV) is enough to encourage compliance, thereby halting possible damage to the environment.” However, the data in this and similar reports over the last several years show that TCEQ’s enforcement strategy is not in fact leading to higher rates of compliance. As an example, the second highest category of repeat offenders (at 15%) is petroleum refineries. https://www.tceq.texas.gov/assets/public/compliance/enforcement/enf_reports/AER/FY18/enfrptfy18.pdf
68. Shaw, Bryan W., Ph.D., P.E., Toby Baker, Zak Covar, and Richard A. Hyde, P.E. “Penalty Policy.” Penalty Policy, April 1, 2014. April 1, 2014. Accessed December 5, 2018, https://www.tceq.texas.gov/assets/public/comm_exec/pubs/rg/rg253/penaltypolicy2014.pdf. Note that under the federal Clean Air Act, the maximum penalty is $93,750 per day per violation.
69. Texas Commission on Environmental Quality. “Enforcement Definitions.” Texas Commission on Environmental Quality. Last modified June 28, 2018. Accessed December 7, 2018. https://www.tceq.texas.gov/compliance/enforcement/definitions.html.
70. See methodology
71. See methodology for the 2017 numbers and the 2017 Environmental Integrity Project and Environment Texas report Breakdowns in Enforcement for the 2011-2016 numbers.
72. See methodology for the 2017 numbers and the 2017 Environmental Integrity Project and Environment Texas report Breakdowns in Enforcement for the 2011-2016 numbers
73. Vogel, Chris. “A Quiet Hell.” Houston Press (Houston, TX), December 16, 2009. Accessed December 7, 2018. https://www.houstonpress.com/news/a-quiet-hell-6574526.
74. See methodology
75. Shaw, Bryan W., Ph.D., P.E., Toby Baker, Zak Covar, and Richard A. Hyde, P.E. “Penalty Policy.” Penalty Policy, April 1, 2014. April 1, 2014. Accessed December 5, 2018, https://www.tceq.texas.gov/assets/public/comm_exec/pubs/rg/rg253/penaltypolicy2014.pdf.
76. “TCEQ CR Query.” Search TCEQ Data - Texas Commission on Environmental Quality - www.tceq.texas.gov. Accessed December 05, 2018. Docket no. 2016-1192-AIR-E http://www14.tceq.texas.gov/epic/eCID/index.cfm?fuseaction=main.reportResults&requesttimeout=9000.
42 MAJOR MALFUNCTION
77. “Annual Enforcement Report Fiscal Year 2018.” TCEQ Annual Enforcement Reports, November 2018. Accessed December 5, 2018.
78. “TCEQ CR Query.” Search TCEQ Data - Texas Commission on Environmental Quality - www.tceq.texas.gov. Accessed December 05, 2018. Docket no. 2017-0542-AIR-E http://www14.tceq.texas.gov/epic/eCID/index.cfm?fuseaction=main.reportResults&requesttimeout=9000.
79. “Penalty Calculation Worksheet.” Search TCEQ Data - Texas Commission on Environmental Quality - www.tceq.texas.gov. Accessed December 05, 2018. Docket no. 2017-0542-AIR-E. Downloaded from TCEQ database under filings. http://www14.tceq.texas.gov/epic/eCID/index.cfm?fuseaction=main.reportResults&requesttimeout=9000.
80. State Auditor’s Office, An Audit Report on The Commission on Environmental Quality’s Enforcement and Permitting Functions for Selected Programs, A. (Tex. Dec. 2003). Accessed December 7, 2018. https://www.sao.texas.gov/ Reports/Main/04-016.pdf.
81. Barer, David. “Investigation: For environmental violators, state often cuts deals.” KXAN (Austin, TX), August 9, 2016. Accessed December 7, 2018. https://www.kxan.com/news/investigations/state-of-enforcement/1156462741.
82. Sadasivam, Naveena. “Too Big to Fine, Too Small to Fight Back.” The Texas Observer. July 25, 2018. Accessed December 05, 2018. https://www.texasobserver.org/too-big-to-fine-too-small-to-fight-back/.
83. Marks, Roger. “EPA Raises Civil Penalties for Environmental Noncompliance.” Lion Technology Inc., July 5, 2016. Accessed December 7, 2018. https://www.lion.com/lion-news/july-2016/epa-raises-civil-penalties-for-environmental-nonco.
84. Malewitz, Jim. “Harris County in Crosshairs of Pollution Lawsuit Limits.” The Texas Tribune (Austin, TX), May 20, 2015. Accessed December 7, 2018. https://www.texastribune.org/2015/05/20/senate-backs-bill-cap-pollution-payouts/.
85. A. 2533, 2017 Leg. State House, 85th (Tex. June 15, 2017). Accessed December 7, 2018. https://legiscan.com/TX/bill/HB2533/2017.
86. Waterkeeper Alliance (San Francisco, CA). “Fighting for the Right to Stop Pollution in the Bay.” May 2, 2017. Accessed December 7, 2018. https://waterkeeper.org/fighting-for-the-right-to-stop-pollution-in-the-bay/.
87. Reilly, Sean. “EPA Weighed Rollback of Obama Startup-shutdown Rule.” E&E News PM. September 25, 2018. Accessed December 05, 2018. https://www.eenews.net/eenewspm/2018/09/25/stories/1060099695.
88. Phillips, Ari, and Gabriel Clark-Leach. “Preparing for the Next Storm.” Environmental Integrity Project, August 16, 2018. August 16, 2018. Accessed December 5, 2018. http://www.environmentalintegrity.org/wp-content/uploads/2018/08/Hurricane-Harvey-Report-Final.pdf.
89. Bozlaker, A. et al., Insights into PM10 sources in Houston, Texas: Role of petroleum refineries in enriching lanthanoid metals during episodic emission events, Atmospheric Environment, 2013.
90. McCoy, B. et al., How big is big? How often is often? Characterizing Texas petroleum refining upset air emissions, Atmospheric Environment, July 2010.
91. “Annual Enforcement Report Fiscal Year 2017.” TCEQ Annual Enforcement Reports, November 2017. Accessed December 5, 2018. https://www.tceq.texas.gov/assets/public/compliance/enforcement/enf_reports/AER/FY17/enfrptfy17.pdf.