MaGenTa Practical WPF Charts and Graphics · PDF filei Practical WPF Charts and Graphics...
709
THE EXPERT’S VOICE ® IN .NET Practical WPF Charts and Graphics Jack Xu Advanced chart and graphics programming with the Windows Presentation Foundation
-
Upload
hoangtuyen -
Category
Documents
-
view
276 -
download
17
Transcript of MaGenTa Practical WPF Charts and Graphics · PDF filei Practical WPF Charts and Graphics...

XuW
PF Charts and Graphics
Companion eBook Available
Practical
trim = 7.5" x 9.25" spine =1.34375" 712 page count
The eXPeRT’s VOIce® In .neT
Practical
WPF Charts and Graphics
Jack Xu
Advanced chart and graphics programming with the Windows Presentation Foundation
this print for content only—size & color not accurate
BOOks fOR PROfessIOnals By PROfessIOnals®
cyan MaGenTa
yellOW Black
US $54.99
Shelve in: .NET
User level: Intermediate–Advanced
www.apress.comSOURCE CODE ONLINE
Companion eBook
See last page for details
on $10 eBook version
THE APRESS ROADMAP
Pro WPF in C# 2008
Practical WPF Charts and Graphics
Pro Silverlight 3 in C#
WPF Recipes in C# 2008
Foundation Expression Blend 2
Practical WPF Charts and GraphicsDear Reader,
If you’ve picked up this book, then you must know how important charts and graphics are in every Windows application. Whether you’re a professional pro-grammer, a scientist, an engineer, a teacher, or a student, you will always end up dealing with chart and graphics applications to some degree.
I’ve been working with charts and graphics for many years. As a theoretical physicist, my work involves extensive numerical computations and graphical representations of calculated data. I still remember how hard it was in the early days to present computational results graphically. I often spent hours creating publication-quality charts by hand, using a ruler, graph paper, and rub-off let-tering. Around that time, I started paying attention to various development tools I could use to create integrated applications. The C# and Windows Presentation Foundation (WPF) development environment made it possible to create such integrated applications because the .NET platform is one of the best development tools available that provides the computational capabilities to both generate data as a simulation engine and to display it in a variety of graphical representations.
I wrote this book with the intention of providing you with a comprehensive explanation of WPF chart and graphics capability, and I paid special attention to creating various charts that can be used directly for real-world applications. In this book, I wanted to show you how to create a variety of graphics and charts that range from simple two-dimensional (2D) line plots to complicated three-dimensional (3D) surface graphs.
In short, this is more than just a book—it’s a powerful 2D and 3D charts and graphics package. You will find that many of the examples in the book can be imme-diately used in your real-world applications, and that many others will inspire you to create advanced graphical and sophisticated chart capabilities of your own.
Jack Xu, PhD
Author of
Practical C# Charts and Graphics
Practical Silverlight Programming
Practical WPF Graphics Programming
Practical Numerical Methods with C#


i
Practical WPF Charts and Graphics
Advanced Chart and Graphics Programming with the Windows Presentation Foundation
Jack Xu

ii
Practical WPF Charts and Graphics
Copyright © 2009 by Jack Xu
All rights reserved. No part of this work may be reproduced or transmitted in any form or by any means, electronic or mechanical, including photocopying, recording, or by any information storage or retrieval system, without the prior written permission of the copyright owner and the publisher.
ISBN-13 (pbk): 978-1-4302-2481-5
ISBN-13 (electronic): 978-1-4302-2482-2
Printed and bound in the United States of America 9 8 7 6 5 4 3 2 1
Trademarked names may appear in this book. Rather than use a trademark symbol with every occurrence of a trademarked name, we use the names only in an editorial fashion and to the benefit of the trademark owner, with no intention of infringement of the trademark.
Lead Editor: Ewan Buckingham Technical Reviewer: Todd Meister Editorial Board: Clay Andres, Steve Anglin, Mark Beckner, Ewan Buckingham, Tony
Campbell, Gary Cornell, Jonathan Gennick, Michelle Lowman, Matthew Moodie, Jeffrey Pepper, Frank Pohlmann, Ben Renow-Clarke, Dominic Shakeshaft, Matt Wade, Tom Welsh
Copy Editor: Elliot Simon Compositor: MacPS, LLC Indexer: BIM Indexing and Proofreading Services Artist: April Milne
Distributed to the book trade worldwide by Springer-Verlag New York, Inc., 233 Spring Street, 6th Floor, New York, NY 10013. Phone 1-800-SPRINGER, fax 201-348-4505, e-mail [email protected], or visit http://www.springeronline.com.
For information on translations, please e-mail [email protected], or visit http://www.apress.com.
Apress and friends of ED books may be purchased in bulk for academic, corporate, or promotional use. eBook versions and licenses are also available for most titles. For more information, reference our Special Bulk Sales–eBook Licensing web page at http://www.apress.com/info/bulksales.
The information in this book is distributed on an “as is” basis, without warranty. Although every precaution has been taken in the preparation of this work, neither the author(s) nor Apress shall have any liability to any person or entity with respect to any loss or damage caused or alleged to be caused directly or indirectly by the information contained in this work.
The source code for this book is available to readers at http://www.apress.com. You will need to answer questions pertaining to this book in order to successfully download the code.

iii
For my family, Ruth, Anna, Betty, and Tyler
iv
Contents at a Glance
■Contents at a Glance ............................................................................................. iv ■Contents ................................................................................................................. v ■About the Author ................................................................................................. xv ■Technical Reviewer ............................................................................................ xvi ■Acknowledgments ............................................................................................. xvii ■Introduction ........................................................................................................ xix ■Overview of WPF Programming .............................................................................1 ■2D Transformations .............................................................................................11 ■WPF Graphics Basics in 2D ..................................................................................59 ■Colors and Brushes ............................................................................................123 ■2D Line charts ....................................................................................................163 ■Specialized 2D Charts ........................................................................................217 ■Stock Charts ......................................................................................................275 ■Interactive 2D Charts .........................................................................................305 ■2D Chart Controls ..............................................................................................333 ■Data Interpolations ............................................................................................393 ■Curve Fitting ......................................................................................................419 ■3D Transformations ...........................................................................................445 ■WPF Graphics Basics in 3D ................................................................................499 ■3D Charts with the WPF 3D Engine ....................................................................531 ■3D Charts Without the WPF 3D Engine ..............................................................571 ■Specialized 3D Charts ........................................................................................633 ■Index ..................................................................................................................673

v
Contents
■Contents at a Glance ............................................................................................. iv ■Contents ................................................................................................................. v ■About the Author ................................................................................................. xv ■Technical Reviewer ............................................................................................ xvi ■Acknowledgments ............................................................................................. xvii ■Introduction ........................................................................................................ xix ■Chapter 1: Overview of WPF Programming ...........................................................1
New features in WPF ...................................................................................................... 1 XAML Basics ................................................................................................................... 2
Why Is XAML Needed? ........................................................................................................................... 2 Creating XAML Files............................................................................................................................... 2 Code-Behind Files ................................................................................................................................. 3
Your First WPF Program .................................................................................................. 4 Properties in XAML ................................................................................................................................ 5 Event Handlers in Code-Behind Files .................................................................................................... 5
Code-Only Example......................................................................................................... 7 XAML-Only Example ....................................................................................................... 9
■Chapter 2: 2D Transformations ............................................................................11 Basics of Matrices and Transformations ...................................................................... 11
Vectors and Points ............................................................................................................................... 11 Scaling ................................................................................................................................................. 12 Reflection ............................................................................................................................................ 13 Rotation ............................................................................................................................................... 13 Translation ........................................................................................................................................... 14
Homogeneous Coordinates ........................................................................................... 15 Translation in Homogeneous Coordinates ........................................................................................... 15

vi
Scaling in Homogeneous Coordinates ................................................................................................. 16 Rotation in Homogeneous Coordinates ............................................................................................... 17 Combining Transforms ........................................................................................................................ 18

■ CONTENTS
vi
Vectors and Matrices in WPF ........................................................................................ 19Vector Structure ...................................................................................................................................19Matrix Structure ...................................................................................................................................21Matrix Operations.................................................................................................................................22Matrix Transforms................................................................................................................................25Creating Perpendicular Lines...............................................................................................................31
Object Transformations in WPF..................................................................................... 36MatrixTransform Class.........................................................................................................................38ScaleTransform Class ..........................................................................................................................42TranslateTransform Class ....................................................................................................................45RotateTransform Class.........................................................................................................................48SkewTransform Class ..........................................................................................................................52Composite Transforms.........................................................................................................................55
■Chapter 3: WPF Graphics Basics in 2D................................................................592D Coordinate Systems in WPF..................................................................................... 59
Default Coordinates..............................................................................................................................59Custom Coordinates.............................................................................................................................62Custom Coordinates for 2D Charts.......................................................................................................67
2D Viewport.....................................................................................................................................72Zooming and Panning .....................................................................................................................73Resizable Canvas ............................................................................................................................76
Basic 2D Graphics Shapes in WPF ................................................................................ 80Lines.....................................................................................................................................................80Rectangles and Ellipses .......................................................................................................................82Polylines...............................................................................................................................................86Polygons...............................................................................................................................................88
Paths and Geometries................................................................................................... 91Line, Rectangle, and Ellipse Geometries..............................................................................................92GeometryGroup Class...........................................................................................................................93CombinedGeometry Class ....................................................................................................................95PathGeometry Class.............................................................................................................................98
Lines and Polylines .........................................................................................................................99Arcs.................................................................................................................................................99Bezier Curves ................................................................................................................................100
Geometry and Mini-Language............................................................................................................102Hit Testing..........................................................................................................................................105
Custom Shapes ........................................................................................................... 108Star Class...........................................................................................................................................108ArrowLine Class .................................................................................................................................112

■ CONTENTS
vii
Testing Custom Shapes .....................................................................................................................117
■Chapter 4: Colors and Brushes..........................................................................123Colors.......................................................................................................................... 123
System Colors ....................................................................................................................................124Color Picker........................................................................................................................................127
Brushes....................................................................................................................... 134SolidColorBrush .................................................................................................................................134LinearGradientBrush ..........................................................................................................................137RadialGradientBrush ..........................................................................................................................141DrawingBrush ....................................................................................................................................144
Custom Colormap and Shading................................................................................... 147Custom Colormap Brushes.................................................................................................................147Testing Colormap Brushes .................................................................................................................153Color Shading.....................................................................................................................................155Testing Color Shading ........................................................................................................................159
■Chapter 5: 2D Line charts..................................................................................163Simple Line Charts...................................................................................................... 163
Creating Simple Line Charts ..............................................................................................................163How It Works......................................................................................................................................166
Line Charts with Data Collection................................................................................. 166Chart Style .........................................................................................................................................166Data Series.........................................................................................................................................168Data Collection ...................................................................................................................................170Creating Line Charts...........................................................................................................................171
Gridlines and Labels.................................................................................................... 174Chart Style with Gridlines...................................................................................................................174Creating a Chart with Gridlines ..........................................................................................................179
Legends ...................................................................................................................... 183Legend Class......................................................................................................................................183Creating a Chart with a Legend .........................................................................................................188
Symbols ...................................................................................................................... 192Defining Symbols ...............................................................................................................................192Symbols Class....................................................................................................................................193Creating a Chart with Symbols ..........................................................................................................200
Line Charts with Two Y Axes....................................................................................... 203Why We Need Two Y Axes..................................................................................................................203Chart Style with Two Y Axes ..............................................................................................................205DataSeries and DataCollection with Two Y Axes ...............................................................................211

■ CONTENTS
viii
Creating a Chart with Two Y Axes......................................................................................................213
■Chapter 6: Specialized 2D Charts......................................................................217Bar Charts ................................................................................................................... 217
DataSeries for Bar Charts ..................................................................................................................217DataCollection for Bar Charts.............................................................................................................218Creating Simple Bar Charts................................................................................................................224Creating Group Bar Charts .................................................................................................................229Creating Overlay Bar Charts...............................................................................................................233Creating Stacked Bar Charts..............................................................................................................234
Stair-Step Charts ........................................................................................................ 236DataSeries for Stair-Step Charts........................................................................................................236DataCollection for Stair-Step Charts ..................................................................................................237Creating Stair-Step Charts .................................................................................................................238
Stem Charts ................................................................................................................ 241DataCollection for Stem Charts..........................................................................................................241Creating Stem Charts .........................................................................................................................242
Error Bar Charts .......................................................................................................... 244DataSeries for Error Bars ...................................................................................................................244DataCollection for Error Bars .............................................................................................................246Creating Error Bar Charts ...................................................................................................................248
Area Charts ................................................................................................................. 250DataSeries for Area Charts.................................................................................................................250DataCollection for Area Charts...........................................................................................................251Creating Area Charts ..........................................................................................................................253
Polar Charts ................................................................................................................ 255Chart Style for Polar Charts................................................................................................................255DataCollection for Polar Charts ..........................................................................................................260Creating Polar Charts .........................................................................................................................261
Pie Charts.................................................................................................................... 265Pie Chart Style....................................................................................................................................265Legend for Pie Charts.........................................................................................................................268Creating Pie Charts ............................................................................................................................269
■Chapter 7: Stock Charts ....................................................................................275Static Stock Charts ..................................................................................................... 275
Text File Reader .................................................................................................................................275DataSeries and DataCollection for Stock Charts................................................................................278Hi-Lo Stock Charts .............................................................................................................................281Hi-Lo Open-Close Stock Charts..........................................................................................................285Candlestick Stock Charts ...................................................................................................................286

■ CONTENTS
ix
Moving Averages ........................................................................................................ 287Simple Moving Averages....................................................................................................................287
Implementation .............................................................................................................................288Creating SMA Curves ....................................................................................................................290
Weighted Moving Averages ...............................................................................................................293Implementation .............................................................................................................................293Creating WMA Curves ...................................................................................................................295
Exponential Moving Averages ............................................................................................................296Implementation .............................................................................................................................297Creating EMA Curves ....................................................................................................................299
Using Yahoo Stock Charts in WPF............................................................................... 300Connecting to Yahoo Stock Charts.....................................................................................................300Creating Yahoo Stock Charts in WPF .................................................................................................302
■Chapter 8: Interactive 2D Charts.......................................................................305Automatic Tick Placement .......................................................................................... 305
Optimal Tick Spacing .........................................................................................................................305Creating Charts with Automatic Ticks................................................................................................309
Chart Panning with a Mouse....................................................................................... 313Chart Zooming with a Mouse ...................................................................................... 317Chart Zooming with a Mouse Wheel ........................................................................... 322Retrieving Chart Data.................................................................................................. 326
■Chapter 9: 2D Chart Controls.............................................................................333Line Chart Control ....................................................................................................... 333
Defining Dependency Properties........................................................................................................335Using the Line Chart Control ..............................................................................................................343
Creating a Simple Line Chart ........................................................................................................343Creating Multiple Line Charts........................................................................................................346
Specialized 2D Chart Control ...................................................................................... 350Bar Chart Control................................................................................................................................350
Implementation .............................................................................................................................350Creating Bar Charts.......................................................................................................................352Creating Multiple Bar Charts.........................................................................................................355
Stair-Step Chart Control.....................................................................................................................361Implementation .............................................................................................................................361Creating Stair-Step Charts ............................................................................................................364
Stem Chart Control.............................................................................................................................365Implementation .............................................................................................................................365Creating Stem Charts ....................................................................................................................367

■ CONTENTS
x
Error Bar Control ................................................................................................................................369Implementation .............................................................................................................................369Creating Error Bar Charts ..............................................................................................................371
Area Chart Control..............................................................................................................................373Implementation .............................................................................................................................373Creating Area Charts .....................................................................................................................375
Polar Chart Control.............................................................................................................................377Implementation .............................................................................................................................377Creating Polar Charts ....................................................................................................................379
Pie Chart Control ................................................................................................................................381Implementation .............................................................................................................................381Creating Pie Charts .......................................................................................................................383
Creating Multiple Charts ....................................................................................................................385
■Chapter 10: Data Interpolations ........................................................................393Linear Interpolation..................................................................................................... 393
Algorithm ...........................................................................................................................................393Implementation ..................................................................................................................................394Testing Linear Interpolation ...............................................................................................................395
Lagrange Interpolation................................................................................................ 398Algorithm ...........................................................................................................................................398Implementation ..................................................................................................................................398Testing Lagrange Interpolation ..........................................................................................................399
Barycentric Interpolation ............................................................................................ 401Algorithm ...........................................................................................................................................402Implementation ..................................................................................................................................402Testing Barycentric interpolation.......................................................................................................403
Newton Divided-Difference Interpolation.................................................................... 406Algorithm ...........................................................................................................................................406Implementation ..................................................................................................................................408Testing Newton Divided-Difference Interpolation ..............................................................................409
Cubic Spline Interpolation........................................................................................... 411Algorithm ...........................................................................................................................................412Implementation ..................................................................................................................................412Testing Cubic Spline Interpolation .....................................................................................................415
■Chapter 11: Curve Fitting ..................................................................................419Linear Algebraic Equations ......................................................................................... 419
Gauss-Jordan Algorithm ....................................................................................................................420Implementation ..................................................................................................................................420
Least-Squares Fit........................................................................................................ 422

■ CONTENTS
xi
Straight-Line Fit .......................................................................................................... 423Implementation ..................................................................................................................................423Testing Straight-Line Fit ....................................................................................................................424
Linear Regression ....................................................................................................... 427Implementation ..................................................................................................................................427Testing Linear Regression..................................................................................................................429
Polynomial Fit ............................................................................................................. 433Implementation ..................................................................................................................................433Testing Polynomial Fit........................................................................................................................434
Weighted Linear Regression ....................................................................................... 437Implementation ..................................................................................................................................438Exponential-Function Fit ....................................................................................................................439
■Chapter 12: 3D Transformations .......................................................................4453D Matrices in WPF..................................................................................................... 445
3D Points and Vectors ........................................................................................................................445Matrix3D Structure.............................................................................................................................448Matrix3D Operations ..........................................................................................................................449Matrix3D Transforms .........................................................................................................................453Rotation and Quaternion ....................................................................................................................456
Projections .................................................................................................................. 459Orthographic Projections ...................................................................................................................460
Multiview Projections....................................................................................................................460Axonometric Projections ...............................................................................................................461
Perspective Projections......................................................................................................................463One-Point Perspective Projections................................................................................................464Two-Point Perspective Projections ...............................................................................................465Three-Point Perspective Projections.............................................................................................466Perspective Projection Matrix .......................................................................................................466
Views and Projections in WPF..................................................................................... 467View Transform..................................................................................................................................468Perspective Projection .......................................................................................................................470
View Frustum ................................................................................................................................470Perspective Transform Matrix.......................................................................................................471Implementing Perspective Transforms .........................................................................................474Testing Perspective Projections....................................................................................................475
Orthographic Projection .....................................................................................................................479Orthographic Transform Matrix.....................................................................................................480Implementing Orthographic Transforms .......................................................................................482Testing Orthographic Projections..................................................................................................482

■ CONTENTS
xii
Object Transforms in WPF .......................................................................................... 484ScaleTransform3D Class....................................................................................................................485TranslateTransform3D class ..............................................................................................................489RotateTransform3D Class ..................................................................................................................491MatrixTransform3D Class...................................................................................................................493Combining Transforms.......................................................................................................................496
■Chapter 13: WPF Graphics Basics in 3D............................................................4993D Graphics Basics ..................................................................................................... 499
Viewport3D.........................................................................................................................................5003D Objects in WPF..............................................................................................................................500Geometry and Mesh ...........................................................................................................................501GeometryModel3D and Surfaces .......................................................................................................503Illuminating the Scene .......................................................................................................................504Camera Position .................................................................................................................................505Simple Triangle in 3D.........................................................................................................................506
Basic 3D Shapes ......................................................................................................... 508Coordinate Axes and Wireframe ........................................................................................................508Creating a Cube..................................................................................................................................510Creating a Sphere ..............................................................................................................................515Creating a Cylinder.............................................................................................................................518Creating a Cone..................................................................................................................................523Creating a Torus.................................................................................................................................526
■Chapter 14: 3D Charts with the WPF 3D Engine ................................................531Simple Surfaces.......................................................................................................... 531
Rectangular Meshes ..........................................................................................................................531SimpleSurface Class ..........................................................................................................................533Creating Simple Surfaces ..................................................................................................................536
Parametric Surfaces ................................................................................................... 541ParametricSurface Class....................................................................................................................541Creating Parametric Surfaces ............................................................................................................545
Helicoid Surface............................................................................................................................545Sphere Surface .............................................................................................................................547Torus Surface................................................................................................................................548Quadric Surfaces...........................................................................................................................549
Extruded Surfaces....................................................................................................... 551ExtrudeSurface Class.........................................................................................................................551Creating Extruded Surfaces ...............................................................................................................554
Surfaces of Revolution................................................................................................ 556RotateSurface Class...........................................................................................................................557

■ CONTENTS
xiii
Creating Surfaces of Revolution.........................................................................................................561
Surface Shading.......................................................................................................... 563SurfaceShading Class ........................................................................................................................563Creating Shaded Surfaces .................................................................................................................567
■Chapter 15: 3D Charts Without the WPF 3D Engine...........................................5713D Coordinate System ................................................................................................ 571
Azimuth and Elevation View...............................................................................................................571Creating a Cube..................................................................................................................................573
Chart Style in 3D ......................................................................................................... 5783D Coordinate Axes............................................................................................................................584Gridlines .............................................................................................................................................589Labels.................................................................................................................................................592Testing the Project .............................................................................................................................599
3D Line Charts............................................................................................................. 601Implementation ..................................................................................................................................601Testing the Project .............................................................................................................................604
3D Surface Charts ....................................................................................................... 606Implementation ..................................................................................................................................606
DataSeries Class ...........................................................................................................................606Chart Functions.............................................................................................................................608DrawSurfaceChart Class ...............................................................................................................610
Mesh Charts .......................................................................................................................................614Curtain Charts ....................................................................................................................................619Waterfall Charts .................................................................................................................................623Surface Charts ...................................................................................................................................626
■Chapter 16: Specialized 3D Charts....................................................................633Implementation ........................................................................................................... 633
2D Chart Style ....................................................................................................................................633Draw3DChart Class ............................................................................................................................638
Color Charts on the X-Y Plane..................................................................................... 641Implementation ..................................................................................................................................641Testing X-Y Color Charts ....................................................................................................................644
Contour Charts ............................................................................................................ 647Algorithm ...........................................................................................................................................647Implementation ..................................................................................................................................648Testing Contour Charts ......................................................................................................................652
Combination Charts..................................................................................................... 654X-Y Charts in 3D.................................................................................................................................654

■ CONTENTS
xiv
Contour Charts in 3D..........................................................................................................................655Filled Contour Charts..........................................................................................................................659Mesh Contour Charts .........................................................................................................................660Surface Contour Charts......................................................................................................................662Surface-Filled Contour Charts............................................................................................................663
3D Bar Charts.............................................................................................................. 663Implementation ..................................................................................................................................664Testing 3D Bar Charts ........................................................................................................................670
Index.....................................................................................................................673

■ CONTENTS
xv
About the Author
Jack Xu has a Ph.D in theoretical physics and has over 15 years of programming experience in Basic, Fortran, C, C++, Matlab, and C#. He specializes in numerical computation methods, algorithms, physical modeling, computer-aided design (CAD) tool development, graphical user interfaces, and 3D graphics. He is the author of several books about .NET programming, including Practical C# Charts and Graphics, Practical WPF Graphics Programming, Practical Silverlight Programming, and Practical Numerical Methods with C#

■ CONTENTS
xvi
Acknowledgments
First, I want to thank the whole Apress team, especially my editor, Ewan Buckingham, for giving me the opportunity to write this book. His trust, comments, questions, and patience helped me greatly as I was writing. I would also like to thank my copy editor, Elliot Simon, for ensuring that all the text flowed clearly and fit Apress’ book style; and my coordinating editor, Anita Castro, for holding my feet to the fire to meet aggressive deadlines.
This book would not have been possible without my technical editor, Todd Meister, who deserves my sincere thanks for his excellent and insightful technical review comments. His suggestions helped me to improve the overall quality of the book. He also double-checked all code examples and technical instructions to ensure that you, the readers, would be able to follow them completely.
As always, I’m grateful to my wife, Dr. Ruth Zhang, and my lovely children Anna, Betty, and Tyler, for their patience, understanding, and encouragement.

Introduction
Overview Welcome to Practical WPF Charts and Graphics. This book will provide all the tools you need to develop professional chart and graphics applications using the Windows Presentation Foundation (WPF) and C# based on the .NET Framework. I hope this book will be useful for WPF and C# programmers of all skill levels.
We’ve all heard the saying “A picture’s worth a thousand words.” Charts and graphics play a very important role in every Windows application. They make data easier to understand, add interest to reports, and have wide applications in our daily life. The scientific, engineering, and mathematics community always has a need to present data and results graphically. Microsoft’s .NET platform with C# and WPF is one of the few and best development tools available for providing the computational capabilities both to generate data as a simulation engine and to display it in a variety of graphical representations based on the WPF graphics capability.
As a C# programmer, you are probably already familiar with Windows Forms, the mature and full-featured development tool. Windows Forms is built on top of the .NET Framework and uses the Windows Application Programming Interface (API) to create the visual appearance of standard user interface elements. It provides all kinds of tools for laying out windows, menus, dialogs, and controls. You can also develop graphics applications based on Windows Forms using the Graphical Device Interface (GDI+). However, creating a feature-rich graphics application using Windows Forms can be a difficult and tedious task. For example, Windows Forms provides no tools for creating three-dimensional (3D) graphics applications. Even a 3D point, the simplest of 3D graphics objects, must be defined first in a suitable 3D coordinate system before it can be used as a 3D graphics object.
WPF changes the landscape of graphics programming completely. At first, you might think that WPF just provides another way to create windows, menus, dialogs, and controls. However, WPF has much more to offer than any other Windows programming framework. It integrates three basic Windows elements — text, controls, and graphics — into a single programming model and puts these three elements in the same element tree in the same manner.
Without WPF, developing a graphics application would involve a number of different technologies, ranging from GDI/GDI+ for 2D graphics to Direct3D or OpenGL for 3D graphics. WPF, on the contrary, is designed as a single model for graphics application development, providing seamless integration between such services within an application. Similar constructs can be used for creating animations, data binding, and 3D models.
To take further advantage of new, powerful graphics hardware technologies, WPF implements a vector-based graphics model. This allows for graphics to be scaled based on screen-specific resolution without the loss of image quality, something impossible to do with fixed-size raster graphics. In addition, WPF leverages Direct3D for vector-based rendering and makes use of the graphics processing unit on any video card that implements DirectX in hardware.
With WPF, graphics elements can easily be integrated into any part of your user interface. For example, WPF provides 2D shape elements that can be involved in the user interface (UI) tree like other elements can. You are free to mix these shapes with any other kind of element, such as a button. The WPF 3D model is based on Direct3D technology and allows you to create a custom 3D shape library that

■ INTRODUCTION
xviii
can be reused in your projects. The main benefits that WPF offers in creating 3D graphics are its ease of use and its ability to integrate 3D content anywhere in applications.
As you may have already noticed, a plethora of WPF programming books are currently available in bookstores. The vast majority of these books are general-purpose user guides and tutorials that explain the basics of WPF and how to use it in implementing simple WPF applications. To help users take full advantage of WPF graphics features, however, requires a book that provides an in-depth introduction specifically to WPF chart and graphics programming.
This book is written with the intention of providing a complete and comprehensive explanation of WPF chart and graphics capability, and it pays special attention to creating various charts that can be used directly in real-world WPF applications. Much of this book contains original work based on my own programming experience when I was developing commercial computer-aided design (CAD) packages. Without WPF and the .NET Framework, developing advanced charts and graphics is a difficult and time-consuming task. To add even simple charts or graphs to your applications, you might often have to waste effort creating a chart program or buy commercial graphics and chart add-on packages.
Using third-party graphics and chart add-on products in your applications has several drawbacks, however:
• It isn’t cost effective — it might cost hundreds or thousands of dollars for a sophisticated graphics
and chart package.
• Compatibility is an issue — these third-party graphics and chart add-on tools are usually
provided as DLL or COM components, which often lead to unexpected interface exceptions and
unstable operations.
• There is little flexibility — from users’ point of view, these packages appear to be black boxes
because the source code is usually not provided, making it hard for users to add or modify any
functionalities. You might find that these third-party products lack the special features you want
in your applications, even though these products often provide an excess of extraneous
functionalities you will never use.
• The coding is inefficient — these third-party add-on tools are often very large packages that
contain far more functionalities than you will ever need in your applications. Even for a simple
program, the final release tends to be huge due to the use of third-party add-ons. This is very
inefficient for both coding management and distribution.
• License royalty is another issue — some third-party add-ons require not only the developing
license, but also the distributed license royalty, resulting in an unnecessary increase in the
development cost.
• Finally, maintenance is a problem — in most cases, third-party tools use a different programming
language than the one you use in developing your applications, so you have to maintain the
codes in an unmanaged manner.
Practical WPF Charts and Graphics provides everything you need to create your own advanced charts and graphics in your WPF applications. It shows you how to use C# and WPF to create a variety of graphics and charts that range from simple two-dimensional (2D) X-Y plots to complicated three-dimensional (3D) surface graphs. I will try my best to introduce you to C# and WPF chart and graphics programming in a simple way — simple enough to be easily followed by a beginner who has no prior experience developing WPF chart and graphics applications. You can learn from this book how to create a full range of 2D and 3D color graphics applications and how to use custom chart controls to create impressive graphic and chart effects without having to buy expensive third-party add-on products.

■ INTRODUCTION
xix
What This Book Includes This book and its sample code listings, which are available for download from the Apress web site or my own web site, www.DrXuDotNet.com, provide you with:
• A complete, in-depth instruction on practical chart and graphics programming with C# and WPF.
After reading this book and running the example programs, you will be able to add various
sophisticated charts and graphics to your WPF applications.
• Ready-to-run example programs that allow you to explore the chart and graphics techniques
described in the book. You can use these examples to understand better how the chart and
graphics algorithms work. You can modify the code examples or add new features to them to
form the basis of your own projects. Some of the example code listings provided in this book are
already sophisticated chart and graphics packages that you can use directly in your own real-
world WPF applications.
• Many classes in the sample code listings that you will find useful in your WPF chart and graphics
programming. These classes include matrix manipulation, coordinate transformation,
colormaps, chart controls, and the other useful utility classes. You can extract these classes and
plug them into your own applications.
Is This Book for You? You don’t have to be an experienced WPF developer or an expert to use this book. I designed this book to be useful to people of all levels of WPF programming experience. In fact, I believe that if you have some experience with the programming language C#, Windows Forms, HTML, and the .NET Framework, you will be able to sit down in front of your computer, start up Microsoft Visual Studio 2008 and .NET 3.5, follow the examples provided in this book, and quickly become proficient with WPF chart and graphics programming. For those of you who are already experienced WPF developers, I believe this book has much to offer as well. A great deal of the information in this book about chart and graphics programming is not available in other WPF tutorial and reference books. In addition, you can use most of the example programs in this book directly in your own real-world application development. This book will provide you with a level of detail, explanation, instruction, and sample program code that will enable you to do just about anything related to WPF charts and graphics.
Perhaps you are a scientist, an engineer, a mathematician, a student, or a teacher rather than a professional programmer; nevertheless, this book is still a good bet for you. In fact, my own background is in theoretical physics, a field involving extensive numerical calculations as well as graphical representations of calculated data. I devoted my efforts to this field for many years, starting from undergraduate up to Ph.D. My first computer experience was with FORTRAN. Later on, I had programming experience with Basic, C, C++, and MATLAB. I still remember how hard it was in the early days to present computational results graphically. I often spent hours creating a publication-quality chart by hand, using a ruler, graph paper, and rub-off lettering. A year later, our group bought a chart-and-graphics package; however, I still needed to prepare my data in a proper format in order to process it with this package. During that time, I started paying attention to various development tools I could use to create integrated applications. I tried to find an ideal development tool that would allow me not only to generate data easily (computation capability) but also to represent data graphically (graphics and chart power). The C# and WPF development environment made it possible to develop such integrated applications. Ever since Microsoft .NET 1.0 came out, I have been in love with the C# language, and I

■ INTRODUCTION
xx
have been able to use this tool successfully to create powerful graphics and chart applications, including commercial CAD packages.
WPF developers and technical professionals can use the majority of the example programs in this book routinely. Throughout the book, I’ll emphasize the usefulness of WPF chart and graphics programming to real-world applications. If you follow closely the instructions presented in this book, you’ll easily be able to develop various practical WPF chart and graphics applications, from 2D graphics and charts to sophisticated 3D surface chart packages. At the same time, I won’t spend too much time discussing programming style, execution speed, or code optimization, because a plethora of books out there already deal with these topics. Most of the example programs you’ll find in this book omit error handling. This makes the code easier to understand by focusing only on the key concepts and practical applications.
What Do You Need to Use This Book? You’ll need no special equipment to make the best use of this book and understand the algorithms. To run and modify the sample programs, you’ll need a computer capable of running either Windows Vista or Windows XP. The software installed on your computer should include Visual Studio 2008 and .NET 3.5 standard edition or higher. If you have Visual Studio 2005 and .NET 3.0, you can also run most of the sample code with few modifications. Please remember, however, that this book is intended for Visual Studio 2008 and .NET 3.5 and that all of the example programs were created and tested on this platform, so it is best to run the sample code on the same platform.
How the Book Is Organized This book is organized into 16 chapters, each of which covers a different topic about WPF chart and graphics programming. The following summaries of each chapter should give you an overview of the book’s content. Chapter 1, Overview of WPF Programming, introduces the basics of WPF and reviews some of the general aspects of WPF programming, including the XAML files you need to define user interfaces. Chapter 2, 2D Transformations, covers the mathematical basics of 2D graphics programming. It discusses 2D vectors, matrices, and transformations in the homogeneous coordinate system, including translation, scaling, reflection, and rotation. These 2D matrices and transformations allow WPF applications to perform a wide variety of graphical operations on graphics objects in a simple and consistent manner. Chapter 3, WPF Graphics Basics in 2D, reviews some fundamental concepts of 2D graphics and the 2D drawing model in WPF. It introduces coordinate systems and basic 2D shapes. Chapter 4, Colors and Brushes, covers the color system and brushes that WPF uses to paint graphics objects. It introduces a variety of brushes and their transformations. You’ll learn how to create exotic visual effects using different brushes, including gradient and drawing brushes. Chapter 5, 2D Line Charts, contains instructions on how to create elementary 2D X-Y line charts. It introduces basic chart elements, including chart area, plot area, axes, title, labels, ticks, symbols, and legend. These basic chart elements are common in the other types of charts as well.

■ INTRODUCTION
xxi
Chapter 6, Specialized 2D Charts, covers the specialized charts often found in commercial chart packages and spreadsheet applications. These specialized charts include bar charts, stair-step charts, stem charts, charts with error bars, pie charts, area charts, and polar charts. Chapter 7, Stock Charts, shows how to create a variety of stock charts in WPF, including the standard Hi-Lo Open-Close stock charts, Candlestick stock charts, and moving averages. In addition, it discusses embedding Yahoo stock charts into WPF applications. Chapter 8, Interactive 2D Charts, demonstrates how to implement interactive charts, which allow the user to interact with them by using a mouse to zoom, pan, and retrieve data from the chart. Chapter 9, 2D Chart Controls, shows how to put 2D chart applications into a custom user control and how to use such a control in WPF applications. Chapter 10, Data Interpolations, explains the implementation of several interpolation methods, which can be used to construct new data points within the range of a discrete set of known data points. Chapter 11, Curve Fitting, explains a variety of curve-fitting approaches that you can apply to data containing noise, usually due to measuring errors. Curve fitting tries to find the best fit to a given set of data. Chapter 12, 3D Transformations, extends the concepts described in Chapter 2 into the third dimension. It explains how to define 3D graphics objects and how to translate, scale, reflect, and rotate these 3D objects. It also describes transformation matrices that represent projection and transformations, which allow you to view 3D graphics objects on a 2D screen. You’ll also learn how WPF defines 3D vectors, matrices, and projections. Chapter 13, WPF Graphics Basics in 3D, explores the basics of 3D models in WPF. It introduces Viewport3D, the 3D geometry and the mesh model, lighting, and camera, among other topics. You’ll also learn how to create basic 3D shapes directly in WPF. Chapter 14, 3D Charts with the WPF 3D Engine, explains how to create various 3D surface charts, from simple surfaces to complex surfaces, using rectangular meshes and a variety of techniques, including parameterization, extrusion, and revolution. It also describes how to add lighting and shading effects to these surfaces. Chapter 15, 3D Charts Without the WPF 3D Engine, begins with a description of the coordinate system used in 3D charts and graphics and shows you how to create 3D coordinate axes, tick marks, axis labels, and gridlines without using the WPF 3D engine. It then explains techniques for creating simple 3D surface charts. Chapter 16, Specialized 3D Charts, shows how to create a wide variety of 3D charts, including contour charts, 3D bar charts, and 3D combination charts. In creating these charts, you will use a few specialized techniques, including Z-order, to manipulate the data displayed on your 2D computer screen.

■ INTRODUCTION
xxii
Using Code Examples You may use the code in this book in your own applications and documentation. You don’t need to contact the author or the publisher for permission, unless you are reproducing a significant portion of the code. For example, writing a program that uses several chunks of code from this book doesn’t require permission. Selling or distributing the example code listings does require permission. Incorporating a significant amount of example code from this book into your applications and documentation also requires permission. Integrating the example code from this book into commercial products is not allowed without written permission of the author and publisher.
Customer Support I am always interested in hearing from readers and would enjoy learning of your thoughts on this book. You can send me comments by e-mail to [email protected]. I also provide updates, bug fixes, and ongoing support via the Apress web site
www.apress.com
and my own web site:
www.DrXuDotNet.com
You can also obtain the complete source code for all of the examples in this book from the foregoing web sites.

C H A P T E R 1
■ ■ ■
1
Overview of WPF Programming
Windows Presentation Foundation (WPF) is a next-generation graphics platform included in Microsoft .NET Framework 3.0 and 3.5. It allows you to build advanced user interfaces (UIs) that incorporate documents, media, two-dimensional (2D) and three-dimensional (3D) graphics, animations, and weblike characteristics. Built on the .NET Framework 3.0 and 3.5, WPF provides a managed environment for developing applications using the Windows operating system. Like other features of the .NET Framework 3.0 and 3.5, WPF is available for Windows Vista, Windows XP, Windows Server 2003, and Windows Server 2008.
In a pre-WPF world, developing a Windows application would have required the use of several different technologies. For instance, in order to add forms and user controls to your application, you needed to use the Windows Forms included in the .NET Framework. You had to use GDI+ to create images and 2D graphics. To add 3D graphics, you would have needed to use Direct3D or OpenGL.
WPF is designed to be a unified solution for application development, providing a seamless integration of different technologies. With WPF, you can create vector graphics or complex animations and incorporate media into your applications to address all of the areas just listed.
New features in WPF WPF introduces several new features that you can take advantage of when you develop your WPF applications. To utilize powerful new graphics hardware, WPF implements a vector graphics model based on Direct3D technology. This allows graphics to scale according to screen-specific resolution without losing image quality, something impossible to do with fixed-size raster graphics. WPF leverages Direct3D for vector-based rendering, using the graphics-processing unit on any video card with built-in DirectX implemented. In anticipation of future technology, such as high-resolution display, WPF uses a floating-point logical pixel system and supports 32-bit ARGB colors.
Furthermore, to easily represent UI and user interaction, WPF introduces a new XML-based language called Extensible Application Markup Language (XAML). XAML allows applications to dynamically parse and manipulate user interface elements at either design time or runtime. It uses the code-behind model, similar to ASP.NET programming, allowing designers and developers to work in parallel and to seamlessly combine their work into a compelling user experience. Of course, WPF also allows you to opt out of using XAML files when you develop WPF applications, meaning you can still develop your applications entirely in code, such as C#, C++, or Visual Basic.
Another new feature is the resolution-independent layout. All WPF layout dimensions are specified using device-independent pixels. A device-independent pixel is one ninety-sixth of an inch in size and resolution-independent, so your results will be similar regardless of whether you render to a 72-DPI (dots per inch) monitor or a 19,200-DPI printer.

CHAPTER 1 ■ OVERVIEW OF WPF PROGRAMMING
2
WPF is also based on a dynamic layout. This means that a UI element arranges itself on a window or page according to its content, its parent layout container, and the available screen area. Dynamic layout facilitates localization by automatically adjusting the size and position of UI elements when the strings they contain change length. By contrast, the layout in Windows Forms is device-dependent and more likely to be static. Typically, Windows Forms controls are positioned absolutely on a form using dimensions specified in hardware pixels.
XAML Basics As mentioned previously, using XAML to create a UI is a new feature in WPF. In this section, I’ll present an introduction to XAML and consider its structure and syntax. Once you understand the basics of XAML, you can easily create a UI and layout in WPF applications.
Why Is XAML Needed? Since WPF applications can be developed entirely in code, it is perfectly natural to ask, “Why do I even need XAML in the first place?” The reason can be traced back to the issue of efficient implementation of complex, graphically rich applications. A long time ago, developers realized that the most efficient way to develop such applications was to separate the graphics portion from the underlying code. This way, designers could work on the graphics while developers could work on the code behind the graphics. Both parts could be separately designed and refined, without any versioning headaches.
Before WPF, it was impossible to separate the graphics content from the code. For example, when you work with Windows Forms, you define every form entirely in C# code or any other language. As you add controls to the UI and configure them, the program needs to adjust the code in corresponding form classes. If you want to decorate your forms, buttons, and other controls with graphics that designers have developed, you have to extract the graphic content and export it to a bitmap format. This approach works for simple applications, but it is very limited for complex, dynamic applications. In addition, graphics in bitmap format can lose their quality when they are resized.
The XAML technology introduced in WPF resolves these issues. When you develop a WPF application in Visual Studio, the window you create isn’t translated into code. Instead, it is serialized into a set of XAML tags. When you run the application, these tags are used to generate the objects that compose the UI.
XAML isn’t a must in order to develop WPF applications. You can implement your WPF applications entirely in code; however, the windows and controls created in code will be locked into the Visual Studio environment and only available to programmers. There is no way to separate the graphics portion from the code.
In other words, WPF doesn’t require XAML. However, XAML opens up a world of possibilities for collaboration, because many design tools understand the XAML format.
Creating XAML Files There are some standard rules for creating an XAML file. First, every element in an XAML file must relate to an instance of a .NET class. The name of the element must match the name of the class exactly. For example, <TextBlock> tells WPF to create a TextBlock object.
In an XAML file, you can nest one element inside another. This way, you can place an element as a child of another element. For example, if you have a Button inside a Canvas, this means that your UI contains a Canvas that has a Button as its child. You can also set the properties of each element through attributes.
Let’s look at a simple XAML structure:

CHAPTER 1 ■ OVERVIEW OF WPF PROGRAMMING
3
<Window x:Class="WPFOverview.FirstWPFProgram" xmlns="http://schemas.micro.softcom/winfx/2006/xaml/presentation" xmlns:x="http://schemas.microsoft.com/winfx/2006/xaml" Title=" FirstWPFProgram" Height="300" Width="300"> <Grid> <TextBlock>Hello, WPF!</TextBlock> </Grid> </Window>
This file includes three elements: a top-level Window element, which represents the entire window; a Grid; and a TextBlock that is placed inside the Grid as a child. You can use either a Window or a Page as the top-level element in WPF. A Page is similar to a Window, but it is used for navigable applications. WPF also involves an Application file that defines application resources and startup settings. If you start with a new WPF Window (or Page) project, Visual Studio will automatically generate an Application file called App.xaml. In this book, I’ll use Window as the top-level WPF element, though you can just as easily use Page.
The starting tag for the Window element includes a class name and two XML namespaces. The xmlns attribute is a specialized attribute in XML that is reserved for declaring namespaces. The two namespaces in the preceding code snippet will appear in every WPF XAML file. You only need to know that these namespaces simply allow the XAML parser to find the right classes. Also notice the three properties inside the tag: Title, Height, and Width. Each attribute corresponds to a property of the Window class. These attributes tells WPF to create a 300-by-300 window with the title FirstWPFProgram.
Inside the Window tag is a Grid control that in turn contains a TextBlock with its Text property set to “Hello, WPF!” You can also create the same TextBlock using the following snippet:
<TextBlock Text="Hello, WPF!"/>
Code-Behind Files XAML is used to create the UI for your application; but in order to make your application function, you need to attach event handlers to the UI. XAML makes this easy using the class attribute:
<Window x:Class="WPFOverview.FirstWPFProgram"… … >
The x namespace prefix places the class attribute in the XAML namespace, which means that this is a more general part of the XAML language. This example creates a new class named WPFOverview.FirstWPFProgram, which derives from the base Window class.
When you create a WPF Windows application, Visual Studio will automatically create a partial class where you can place your event-handling code. Previously, we discussed the simple XAML file WPFOverview.xaml. If you create a WPF Windows application named FirstWPFProgram, Visual Studio will automatically generate the following code-behind file:
using System; using System.Windows; using System.Windows.Controls; using System.Windows.Media; namespace FristWPFProgam { /// <summary> /// Interaction logic for FirstWPFProgram.xaml /// </summary> public partial class FirstWPFProgram : Window

CHAPTER 1 ■ OVERVIEW OF WPF PROGRAMMING
4
{ public FirstWPFProgram() { InitializeComponent(); } } }
When you compile this application, XAML is translated into a CLR-type declaration that is merged with the logic in the code-behind class file (FirstWPFProgram.xaml.cs in this example) to form one single unit.
The foregoing code-behind file contains only a default constructor, which calls the InitializeComponent method when you create an instance of the class. This is similar to the C# class in Windows Forms.
Your First WPF Program Let’s consider a simple WPF example. Open Visual Studio 2008 and create a new WPF Windows
Application project called WPFOverview. Remove the default window1.xaml and window1.xaml.cs files from the project and add a new WPF Window to the project. Name it StartMenu, which will add two files, StartMenu.xaml and StartMenu.xaml.cs, to the project. Open the App.xaml file and change its StartupUri property from window1.xaml to StartMenu.xaml. By doing this, you make the StartMenu window the main menu window, from which you can access all of the examples in the project. You can examine the source code for these two files to see how you implement them. This file structure will be used for accessing code examples in each chapter throughout this book. Add another new WPF Window to the project and name it FirstWPFProgram. Figure 1-1 shows the results of running this example. It includes several controls: a Grid, which is the most common control for arranging layouts in WPF, a StackPanel inside the Grid used to hold other controls, including a TextBlock, a TextBox, and two Button controls. The goal of this example is to change the text in the TextBlock accordingly when the user enters text in the TextBox. At the same time, the text color or font size of the text in the TextBlock control can be changed when the user clicks the Change Text Color or Change Text Size button.
Figure1-1. Your first WPF program example.

CHAPTER 1 ■ OVERVIEW OF WPF PROGRAMMING
5
Properties in XAML Open the default FirstWPFProgrm.xaml file and add the following code to the file:
<Window x:Class="WPFOverview.FirstWPFProgram" xmlns="http://schemas.microsoft.com/winfx/2006/xaml/presentation" xmlns:x="http://schemas.microsoft.com/winfx/2006/xaml" Title=" FirstWPFProgram" Height="300" Width="300"> <Grid> <StackPanel> <TextBlock Name="textBlock" Margin="5" TextAlignment="Center" Text="Hello WPF!"/> <TextBox Name="textBox" Margin="5" Width="200" TextAlignment="Center" TextChanged="OnTextChanged"/> <Button Margin="5" Width="200" Content="Change Text Color" Click="btnChangeColor_Click"/> <Button Margin="5" Width="200" Content="Change Text Size" Click="btnChangeSize_Click"/> </StackPanel> </Grid> </Window>
You can see that the attributes of an element set properties of the corresponding object. For example, the TextBlock control in the preceding XAML file configures the name, margin, text alignment, and text:
<TextBlock Name="textBlock" Margin="5" TextAlignment="Center" Text="Hello WPF!"/>
In order for this to work, the TextBlock class in WPF must provide corresponding properties. You specify various properties for other controls that affect your layout and UI in a similar fashion.
To achieve the goal of this example, you will need to manipulate the TextBlock, TextBox, and Button controls programmatically in the code-behind file. First, you need to name the TextBlock and TextBox controls in your XAML file. In this example, these controls are named textBlock and textBox. Although in a traditional Windows Forms application every control must have a name, in a WPF application you only need to name the elements that are manipulated programmatically. Here, for example, you don’t need to name the Grid, StackPanel, and Button controls.
Event Handlers in Code-Behind Files In the previous section, you learned how to map attributes to corresponding properties. However, to make controls function you may sometimes need to attach attributes with event handlers. In the foregoing XAML file, you must attach an OnTextChanged event handler to the TextChanged property of the TextBox. You must also define the Click property of the two buttons using two click event handlers: btnChangeColor_Click and btnChangeSize_Click.
This assumes that there should be methods associated with names OnTextChanged, btnChangeColor_Click, and btnChangeSize_Click in the code-behind file. Here is the corresponding code-behind file for this example:

CHAPTER 1 ■ OVERVIEW OF WPF PROGRAMMING
6
using System; using System.Windows; using System.Windows.Controls; using System.Windows.Media; namespace WPFOverview { public partial class FirstWPFProgram : Window { public FirstWPFProgram () { InitializeComponent(); } private void OnTextChanged(object sender, TextChangedEventArgs e) { textBlock.Text = textBox.Text; } private void btnChangeColor_Click(object sender, RoutedEventArgs e) { if (textBlock.Foreground == Brushes.Black) textBlock.Foreground = Brushes.Red; else textBlock.Foreground = Brushes.Black; } private void btnChangeSize_Click(object sender, RoutedEventArgs e) { if (textBlock.FontSize == 11) textBlock.FontSize = 24; else textBlock.FontSize = 11; } } }
Note that event handlers must have the correct signature. The event model in WPF is slightly different than that in earlier versions of .NET. WPF supports a new model based on event routing. The rest of the preceding code-behind file is very similar to that used in Windows Forms applications with which you are already familiar.
Running this example produces the results shown in Figure 1-1. If you type any text in the text box field, the same text as in the text block will appear. In addition, the color or font size will change depending on which button is clicked.
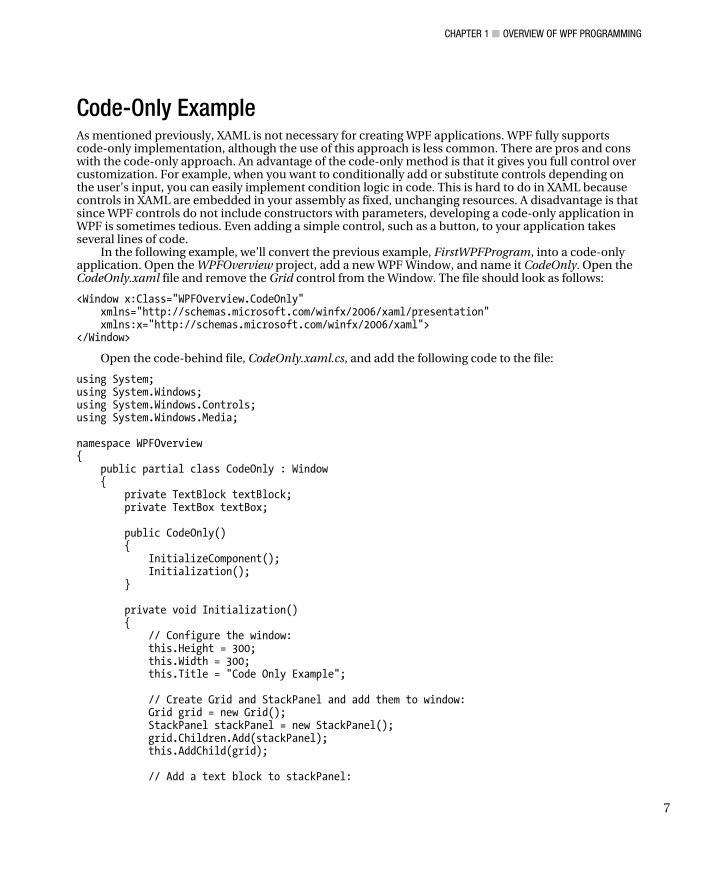
CHAPTER 1 ■ OVERVIEW OF WPF PROGRAMMING
7
Code-Only Example As mentioned previously, XAML is not necessary for creating WPF applications. WPF fully supports code-only implementation, although the use of this approach is less common. There are pros and cons with the code-only approach. An advantage of the code-only method is that it gives you full control over customization. For example, when you want to conditionally add or substitute controls depending on the user’s input, you can easily implement condition logic in code. This is hard to do in XAML because controls in XAML are embedded in your assembly as fixed, unchanging resources. A disadvantage is that since WPF controls do not include constructors with parameters, developing a code-only application in WPF is sometimes tedious. Even adding a simple control, such as a button, to your application takes several lines of code.
In the following example, we’ll convert the previous example, FirstWPFProgram, into a code-only application. Open the WPFOverview project, add a new WPF Window, and name it CodeOnly. Open the CodeOnly.xaml file and remove the Grid control from the Window. The file should look as follows:
<Window x:Class="WPFOverview.CodeOnly" xmlns="http://schemas.microsoft.com/winfx/2006/xaml/presentation" xmlns:x="http://schemas.microsoft.com/winfx/2006/xaml"> </Window>
Open the code-behind file, CodeOnly.xaml.cs, and add the following code to the file:
using System; using System.Windows; using System.Windows.Controls; using System.Windows.Media; namespace WPFOverview { public partial class CodeOnly : Window { private TextBlock textBlock; private TextBox textBox; public CodeOnly() { InitializeComponent(); Initialization(); } private void Initialization() { // Configure the window: this.Height = 300; this.Width = 300; this.Title = "Code Only Example"; // Create Grid and StackPanel and add them to window: Grid grid = new Grid(); StackPanel stackPanel = new StackPanel(); grid.Children.Add(stackPanel); this.AddChild(grid); // Add a text block to stackPanel:
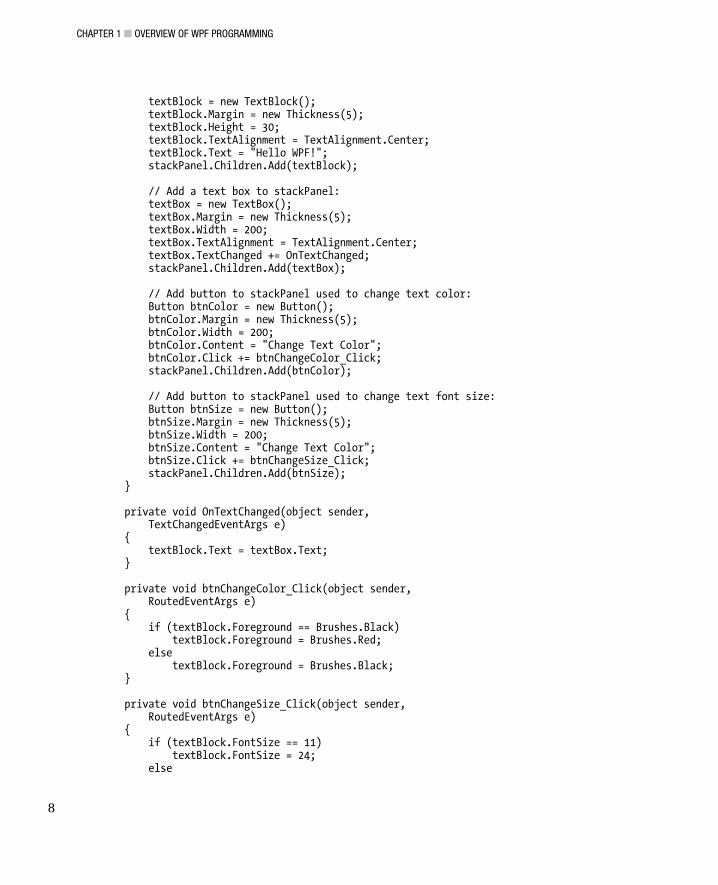
CHAPTER 1 ■ OVERVIEW OF WPF PROGRAMMING
8
textBlock = new TextBlock(); textBlock.Margin = new Thickness(5); textBlock.Height = 30; textBlock.TextAlignment = TextAlignment.Center; textBlock.Text = "Hello WPF!"; stackPanel.Children.Add(textBlock); // Add a text box to stackPanel: textBox = new TextBox(); textBox.Margin = new Thickness(5); textBox.Width = 200; textBox.TextAlignment = TextAlignment.Center; textBox.TextChanged += OnTextChanged; stackPanel.Children.Add(textBox); // Add button to stackPanel used to change text color: Button btnColor = new Button(); btnColor.Margin = new Thickness(5); btnColor.Width = 200; btnColor.Content = "Change Text Color"; btnColor.Click += btnChangeColor_Click; stackPanel.Children.Add(btnColor); // Add button to stackPanel used to change text font size: Button btnSize = new Button(); btnSize.Margin = new Thickness(5); btnSize.Width = 200; btnSize.Content = "Change Text Color"; btnSize.Click += btnChangeSize_Click; stackPanel.Children.Add(btnSize); } private void OnTextChanged(object sender, TextChangedEventArgs e) { textBlock.Text = textBox.Text; } private void btnChangeColor_Click(object sender, RoutedEventArgs e) { if (textBlock.Foreground == Brushes.Black) textBlock.Foreground = Brushes.Red; else textBlock.Foreground = Brushes.Black; } private void btnChangeSize_Click(object sender, RoutedEventArgs e) { if (textBlock.FontSize == 11) textBlock.FontSize = 24; else

CHAPTER 1 ■ OVERVIEW OF WPF PROGRAMMING
9
textBlock.FontSize = 11; } } }
This code listing will reproduce the same results as shown in Figure 1-1. You can see that the CodeOnly class is similar to a form class in a traditional Windows Forms
application. It derives from the base Window class and adds private member variables for TextBlock and TextBox. Pay close attention to how controls are added to their parents and how event handlers are attached.
XAML-Only Example In the previous sections, you learned how to create the same WPF application using the XAML plus code and the code-only techniques. The standard approach for developing WPF applications is to use both XAML and a code-behind file. Namely, you use XAML to lay out your UI, and then you use code to implement event handlers. For applications with a dynamic UI, you may want to go with the code-only method.
However, for simple applications, it is also possible to use an XAML-only file without writing any C# code. This is called a loose XAML file. At first glance, a loose XAML file appears useless — after all, what’s the point of a UI with no code to drive it? However, XAML provides several features that allow you to perform certain functions without using code-behind files. For example, you can develop an XAML-only application including features such as animation, event trigger, and data binding.
Here we’ll create a loose XAML application that mimics the FirstWPFProgram example. Even though it can’t reproduce perfectly the results shown in Figure 1-1, the XAML-only application still generates a much more impressive result than static HTML would.
Add a new WPF Window to the WPFOverview project and name it XAMLOnly. Here is the markup for this example:
<Window x:Class="WPFOverview.XAMLOnly" xmlns="http://schemas.microsoft.com/winfx/2006/xaml/presentation" xmlns:x="http://schemas.microsoft.com/winfx/2006/xaml" Title="Window1" Height="300" Width="300"> <Grid> <StackPanel> <TextBlock Name="textBlock" Margin="5" TextAlignment="Center" Height="30" Text="{Binding ElementName=textBox,Path=Text}"/> <TextBox Name="textBox" Margin="5" Width="200" TextAlignment="Center" Text="Hello, WPF!"/> <Button Margin="5" Width="200" Content="Change Text Color"> <Button.Triggers> <EventTrigger RoutedEvent="Button.Click"> <BeginStoryboard> <Storyboard> <ColorAnimation Storyboard.TargetName="textBlock" Storyboard.TargetProperty= "(TextBlock.Foreground).(SolidColorBrush.Color)" From="Black" To="Red" Duration="0:0:1"/> </Storyboard> </BeginStoryboard>

CHAPTER 1 ■ OVERVIEW OF WPF PROGRAMMING
10
</EventTrigger> </Button.Triggers> </Button> <Button Margin="5" Width="200" Content="Change Text Size"> <Button.Triggers> <EventTrigger RoutedEvent="Button.Click"> <BeginStoryboard> <Storyboard> <DoubleAnimation Storyboard.TargetName="textBlock" Storyboard.TargetProperty="FontSize" From="11" To="24" Duration="0:0:0.2"/> </Storyboard> </BeginStoryboard> </EventTrigger> </Button.Triggers> </Button> </StackPanel> </Grid> </Window>
This XAML file first binds the Text property of the TextBlock to the Text property of the TextBox. This data binding allows you to change the text of the TextBlock by typing text in the TextBox field. Then two buttons are created, which function to change text color and font size. This can be done by using the buttons’ event triggers, which start a color animation or a double animation, depending on which button is clicked.
Even though this application lacks a code-behind file, the buttons can still function. Of course, this XAML-only example cannot replicate the previous example involving a code-behind file. The reason is that although the event triggers in XAML files can start an animation, they cannot involve if-statements, for-loops, methods, and any other computation algorithm.

C H A P T E R 2
■ ■ ■
11
2D Transformations
In the previous chapter, you learned about basic WPF programming using both XAML and code-behind files. To create graphics and charts in real-world WPF applications, you need to understand transformation operations on graphics objects.
In a graphics application, operations can be performed in different coordinate systems. Moving from one coordinate space to another requires the use of transformation matrices. In this chapter, we review the mathematic basis of vectors, matrices, and transformations in 2D space. Here, I’ll acknowledge the importance of matrices and transforms in chart and graphics applications by presenting you with a more formal exposition of their properties. We concern ourselves with linear transformations among different coordinate systems. Such transforms include simple scaling, reflection, translation, and rotations. You’ll learn how to perform matrix operations and graphics object transformations in WPF. More complicated transformations in 3D will be covered in Chapter 12.
Basics of Matrices and Transformations Vectors and matrices play an important role in the transformation process. WPF uses a row-major definition for both vectors and matrices. Thus, in WPF a vector is a row array and a matrix is a multidimensional array. This section explains the basics of 2D matrices and 2D transformations. By changing the coordinates of a graphics object in the world coordinate system, such as zooming or panning, you can easily move the graphics object to another region of the screen. However, if your graphic contains more than one object, you may want to move one of the objects without affecting the others. In this case, you can’t use simple zooming and panning to move the object because doing so would move the other objects as well.
Instead, you can apply a transformation to the object you want to move. Here we’ll discuss transformations that scale, rotate, and translate an object.
Vectors and Points In a row-major representation, a vector is a row array that represents a displacement in a 2D space. A point, on the other hand, is defined by its X and Y coordinates at a fixed position, as shown in Figure 2-1.

CHAPTER 2 ■ 2D TRANSFORMATIONS
12
Figure 2-1. Points and vectors.
The difference between a vector and a point is that a point represents a fixed position, whereas a vector represents a direction and a magnitude. Thus, the end points (x1, y1) and (x2, y2) of a line segment are points, but their difference, V12, is a vector that represents the direction and length of that line segment. In WPF, the following code snippet is a valid statement:
Vector v12 = new Point(x2, y2) – new Point(x1, y1);
Mathematically, you should keep in mind that V12 = V2 – V1, where V2 and V1 are vectors from the origin to the point (x1, y1) and the point (x2, y2), respectively.
In WPF, you can apply a transform matrix directly to either a vector or a point.
Scaling To scale or stretch an object in the X direction, you simply multiply the X coordinates of each of the object’s points by a scaling factor sx. Similarly, you can also scale an object in the Y direction. The scaling process can be described by the following equation:
(2.1)
For example, a scaling matrix that shrinks X and Y uniformly by a factor of 2 as well as a matrix that halves in the Y direction and increases by three-halves in the X direction are, respectively,
These two scaling matrix operations have very different effects on objects, as shown in Figure 2-2.

CHAPTER 2 ■ 2D TRANSFORMATIONS
13
Figure 2-2. Uniform scaling by half in the x and y directions (top) and nonuniform scaling in the X and Y
directions (bottom).
Reflection By reflecting an object across the X and Y axes, you can create a mirror image of the object. Reflecting an object across an axis is equivalent to scaling it with a negative scaling factor. The transform matrices across either of the coordinate axes can be written in the following forms:
As you might expect, a matrix with -1 in both elements of the diagonal is a reflection that is simply a rotation by 180 degrees.
Rotation Suppose you want to rotate an object by an angle θ counterclockwise. First, suppose you have a point (x1, y1) that you want to rotate by an angle θ to get to the point (x2, y2), as shown in Figure 2-3.

CHAPTER 2 ■ 2D TRANSFORMATIONS
14
Figure 2-3. Rotation from point (x1, y1) to (x2, y2).
The distance from the point to the origin is assumed to be r. We then have the following relations:
The point (x2, y2) is the same point rotated by an additional angle of θ. Since this point also has a distance r from the origin, its coordinates are given by
Substituting the components of x1 = r cos α and y1 = r sin α into the preceding equations gives
In matrix form, the equivalent rotation transformation that takes point (x1, y1) to (x2, y2) is given by the following rotation matrix:
(2.2)
Translation To translate an object, you simply add an offset to the original X and Y coordinates of the points that make up the object:

CHAPTER 2 ■ 2D TRANSFORMATIONS
15
(2.3)
Although translations look simple, they can’t be expressed in terms of a transform matrix. It would be feasible to keep track of scales, reflections, and rotations as matrices while keeping track of translations separately. However, doing so would involve fairly painful bookkeeping, particularly in an application that includes many different transformations. Instead, you can use a technique that moves the computation into a higher dimension. This technique allows you to treat each different transformation in a uniform or homogeneous way. This approach, called homogeneous coordinates, has become standard in almost every graphics program. In the following section, I’ll introduce homogeneous coordinates, which allow you to manipulate all of these transformations with matrices.
Homogeneous Coordinates We expect that all transformations in 2D space, including scaling, reflection, rotation, and translation, can be treated equally if points are expressed in homogeneous coordinates. Homogeneous coordinates were first introduced in geometry and have been applied subsequently to graphics representation.
In homogeneous coordinates, you add a third coordinate to a point. Instead of being represented by a pair of (X, Y) numbers, each point is represented by a triple (X, Y, W). If the W coordinate is nonzero, you can divide through by it; (X, Y, W) represents the same point as (X/W, Y/W, 1). When W is nonzero, you normally perform this division, and the numbers X/W and Y/W are usually called the point coordinates in the homogeneous coordinate system. The points where W = 0 are called points at infinity.
Since vectors and points in 2D space are now three-element row arrays, transform matrices, which multiply a vector to produce another vector, should be 3 by 3.
Translation in Homogeneous Coordinates In homogeneous coordinates, a translation can be expressed in the form
(2.4)
This transform can be expressed differently as
(2.5)
Here P and P1 represent point (x, y) and point (x1, y1), respectively, and T(dx, dy) is the following translation matrix:
(2.6)

CHAPTER 2 ■ 2D TRANSFORMATIONS
16
What happens if a point P is translated by T(dx1, dy1) to P1 and then translated by T(dx2, dy2) to P2? The result, as you might expect, is a net translation of T(dx1 + dx2, dy1+ dy2). This can be confirmed by the following definitions:
From the foregoing equations we have
The matrix product T(dx1, dy1) T(dx2, dy2) is
(2.7)
The net translation is indeed T(dx1 + dx2, dy1 + dy2).
Scaling in Homogeneous Coordinates Similarly, the scaling Equation (2.1) can be represented in matrix form in homogeneous coordinates as
It can also be expressed in the following form:
(2.8)
Just as successive translations are additive, we expect that successive scaling should be multiplicative. Given
(2.9)
(2.10)
and substituting Equation (2.9) into Equation (2.10) yields
The matrix product in the preceding equation is

CHAPTER 2 ■ 2D TRANSFORMATIONS
17
Thus, scaling is indeed multiplicative. Reflection is a special case of scaling with a scaling factor of -1. You can represent a reflection in the
same way as scaling.
Rotation in Homogeneous Coordinates A rotation in homogeneous coordinates can be represented as
(2.11)
We can also write Equation (2.11) as
where R(θ) is the rotation matrix in homogeneous coordinates. You may expect that two successive rotations should be additive. Given
(2.12)
(2.13)
and substituting Equation (2.12) into Equation (2.13) yields
The matrix product R(θ1) R(θ2) is

CHAPTER 2 ■ 2D TRANSFORMATIONS
18
Thus, rotations are indeed additive.
Combining Transforms It is common for graphics applications to apply more than one transform to a graphics object. For example, you might want to apply first a scaling transform S and then a rotation transform R. You can combine the fundamental S, T, and R matrices to produce desired general transform results. The basic purpose of combining transforms is to gain efficiency by applying a single composed transform to a point, rather than applying a series of transforms, one after another.
Consider the rotation of an object about an arbitrary point P1. Since you only know how to rotate about the origin, you need to convert the original problem into several separate problems. Thus, to rotate about P1, you need to perform a sequence of several fundamental transformations:
• Translate it so that the point is at the origin.
• Rotate it to the desired angle.
• Translate so that the point at the origin returns back to P1.
This sequence is illustrated in Figure 2-4, in which a rectangle is rotated about P1 (x1, y1). The first translation is by (-x1, -y1), whereas the later translation is by the inverse (x1, y1). The result is quite different than that of applying just the rotation. The net transformation is

CHAPTER 2 ■ 2D TRANSFORMATIONS
19
Figure 2-4. Rotation of a rectangle about a point P1.
Vectors and Matrices in WPF WPF implements a Vector and a Matrix structure in homogeneous coordinates in 2D space. It uses a convention of premultiplying matrices by row vectors. A point or a vector in homogeneous coordinates is defined using three double values (X, Y, 1). In WPF, these coordinates can also be expressed in terms of two doubles (X, Y), since the third double is always equal to 1.
Vector Structure A vector in WPF is defined using a structure. A structure is similar in nature to a class. Both a class and a structure can contain data members and function members. One major difference between a structure and a class is that a structure is a value type and therefore is stored in the stack. A class, on the other hand, is a reference type that stores a reference to a dynamically allocated object. Usually, structures have a performance advantage over classes because structures are allocated in the stack and are immediately deallocated when out of scope. Note that a structure can’t inherit from another class or structure; that is, a structure can’t be a base class, due to its implicitly sealed nature. Structures are not permitted to have a constructor without a parameter. Many simple math functions, including vectors and matrices, are defined in WPF using structures because of the performance advantage.

CHAPTER 2 ■ 2D TRANSFORMATIONS
20
A Vector object is a row array with three elements in homogeneous coordinates. Since the last element is always equal to 1, only the first two elements need to be specified. For instance:
Vector v = new Vector(10, 20);
Note that a vector and a point in WPF are two different objects. The following statement is invalid in WPF:
Vector v = new Point(10,20);
However, you can define a Vector using Points, or vice versa, in the following manner:
Vector v1 = new Point(10, 20) - new Point(20, 30); Vector v2 = (Vector)new Point(10, 20); Point pt1 = (Point)new Vector(10, 20);
A Vector has four public properties:
• Length – Gets the length of the vector.
• LengthSquared – Gets the square of the length of the vector.
• X – Gets or sets the X component of the vector.
• Y – Gets or sets the Y component of the vector.
In addition, there are methods associated with vectors that allow you to perform various mathematical operations on them. The following are some frequently used methods:
• Add – Adds a vector to a point or another vector.
• Subtract – Subtracts one vector from another vector.
• Multiply – Multiplies a vector by a specified double, matrix, or vector and returns the result as a vector.
• Divide – Divides a vector by a scalar and returns a vector.
• CrossProduct – Calculates the cross product of two vectors.
• AngleBetween – Retrieves the angle, expressed in degrees, between two vectors.
• Normalize – Normalizes the vector.
For example:
Vector v1 = new Vector(20, 10); Vector v2 = new Vector(10, 20); double cross = Vector.CrossProduct(v1, v2); double angle = Vector.AngleBetween(v1, v2); v1.Normalize(); double length2 = v1.LengthSquared;
This generates the magnitude of the cross product cross = 300 with a direction along the Z axis, which can easily be confirmed by the formula
The angle = 36.87 degrees. This can be confirmed by the following formula, which calculates the angle between the two vectors:
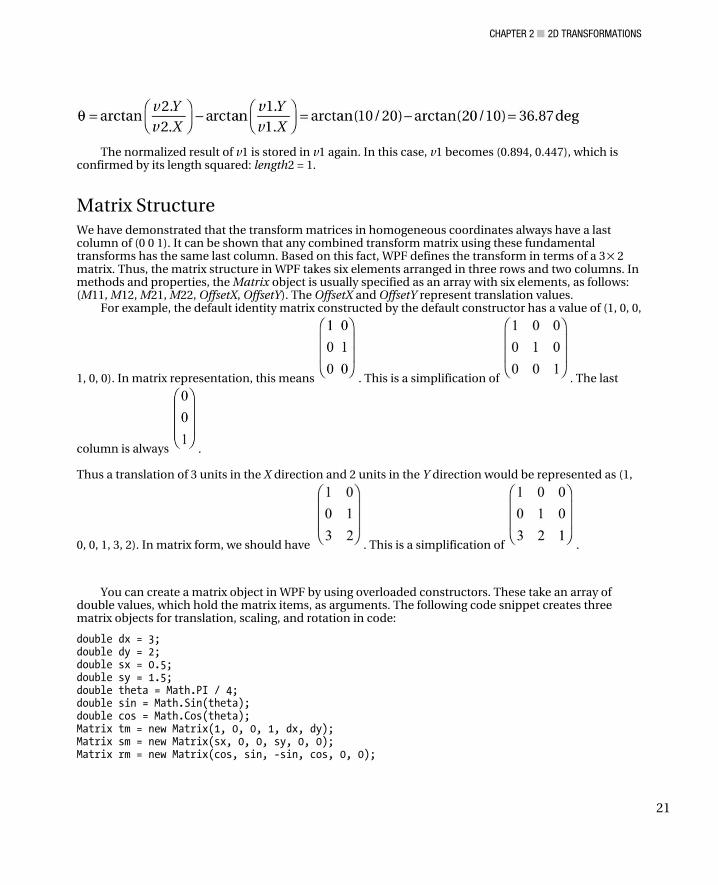
CHAPTER 2 ■ 2D TRANSFORMATIONS
21
The normalized result of v1 is stored in v1 again. In this case, v1 becomes (0.894, 0.447), which is confirmed by its length squared: length2 = 1.
Matrix Structure We have demonstrated that the transform matrices in homogeneous coordinates always have a last column of (0 0 1). It can be shown that any combined transform matrix using these fundamental transforms has the same last column. Based on this fact, WPF defines the transform in terms of a 3 2 matrix. Thus, the matrix structure in WPF takes six elements arranged in three rows and two columns. In methods and properties, the Matrix object is usually specified as an array with six elements, as follows: (M11, M12, M21, M22, OffsetX, OffsetY). The OffsetX and OffsetY represent translation values.
For example, the default identity matrix constructed by the default constructor has a value of (1, 0, 0,
1, 0, 0). In matrix representation, this means . This is a simplification of . The last
column is always .
Thus a translation of 3 units in the X direction and 2 units in the Y direction would be represented as (1,
0, 0, 1, 3, 2). In matrix form, we should have . This is a simplification of .
You can create a matrix object in WPF by using overloaded constructors. These take an array of double values, which hold the matrix items, as arguments. The following code snippet creates three matrix objects for translation, scaling, and rotation in code:
double dx = 3; double dy = 2; double sx = 0.5; double sy = 1.5; double theta = Math.PI / 4; double sin = Math.Sin(theta); double cos = Math.Cos(theta); Matrix tm = new Matrix(1, 0, 0, 1, dx, dy); Matrix sm = new Matrix(sx, 0, 0, sy, 0, 0); Matrix rm = new Matrix(cos, sin, -sin, cos, 0, 0);

CHAPTER 2 ■ 2D TRANSFORMATIONS
22
The matrix tm is a translation matrix that moves an object by 3 units in the X direction and by 2 units in the Y direction. The scaling matrix sm scales an object by a factor of 0.5 in the X direction and by a factor of 1.5 in the Y direction. The final matrix rm is a rotation matrix that rotates an object 45 degrees about the origin.
In addition to the properties of these six matrix elements, there are four other public properties associated with matrices:
• Determinant – Gets the determinant of the Matrix structure.
• HasInverse – Gets a value that indicates whether the Matrix structure is invertible.
• Identity – Gets an identity matrix.
• IsIdentity – Gets a value that indicates whether the Matrix structure is an identity matrix.
There are many public methods associated with the Matrix structure that allow you to perform various matrix operations.
Matrix Operations The Matrix structure in WPF provides methods for performing rotation, scaling, and translation. It also implements several methods for performing matrix operations. For example, you can use the Invert method to take the inverse of an invertible matrix. This method takes no parameters. The multiply method multiplies two matrices and returns the result in a new matrix. The following are some frequently used methods for matrix operations:
• Scale – Appends the specified scale vector to the Matrix structure.
• ScaleAt – Scales the matrix by the specified amount about the specified point.
• Translate – Appends a translation of the specified offsets to the Matrix structure.
• Rotate – Applies a rotation of the specified angle about the origin to the Matrix structure.
• RotateAt – Rotates the matrix about a specified point.
• Skew – Appends a skew of the specified angles in the X and Y directions to the Matrix structure.
• Invert – Inverts the Matrix structure.
• Multiply – Multiplies a Matrix structure by another Matrix structure.
• Transform – Transforms the specified point, array of points, vector, or array of vectors by the Matrix structure.
There are also corresponding Prepend methods associated with Scale, Translation, Rotation, and Skew. The default method is Append. Both Append and Prepend determine the matrix order. Append specifies that the new operation is applied after the preceding operation; Prepend specifies that the new operation is applied before the preceding operation.
Let’s consider an example demonstrating matrix operations in WPF. Start with a new WPF Windows application project, and name it Transformation2D. Add a new WPF Window called MatrixOperations to the project. Here is the XAML file for this example:
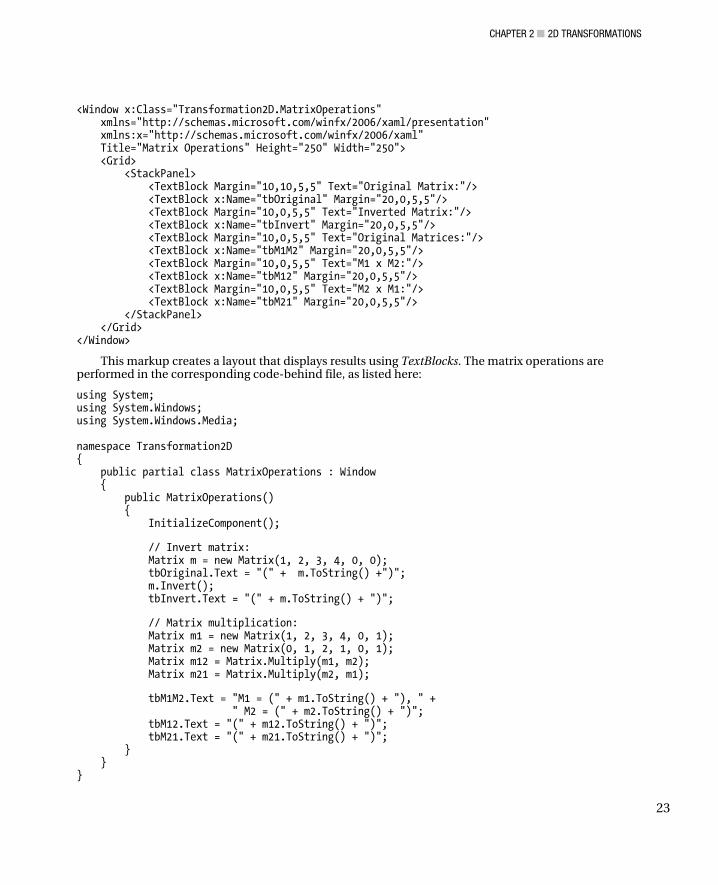
CHAPTER 2 ■ 2D TRANSFORMATIONS
23
<Window x:Class="Transformation2D.MatrixOperations" xmlns="http://schemas.microsoft.com/winfx/2006/xaml/presentation" xmlns:x="http://schemas.microsoft.com/winfx/2006/xaml" Title="Matrix Operations" Height="250" Width="250"> <Grid> <StackPanel> <TextBlock Margin="10,10,5,5" Text="Original Matrix:"/> <TextBlock x:Name="tbOriginal" Margin="20,0,5,5"/> <TextBlock Margin="10,0,5,5" Text="Inverted Matrix:"/> <TextBlock x:Name="tbInvert" Margin="20,0,5,5"/> <TextBlock Margin="10,0,5,5" Text="Original Matrices:"/> <TextBlock x:Name="tbM1M2" Margin="20,0,5,5"/> <TextBlock Margin="10,0,5,5" Text="M1 x M2:"/> <TextBlock x:Name="tbM12" Margin="20,0,5,5"/> <TextBlock Margin="10,0,5,5" Text="M2 x M1:"/> <TextBlock x:Name="tbM21" Margin="20,0,5,5"/> </StackPanel> </Grid> </Window>
This markup creates a layout that displays results using TextBlocks. The matrix operations are performed in the corresponding code-behind file, as listed here:
using System; using System.Windows; using System.Windows.Media; namespace Transformation2D { public partial class MatrixOperations : Window { public MatrixOperations() { InitializeComponent(); // Invert matrix: Matrix m = new Matrix(1, 2, 3, 4, 0, 0); tbOriginal.Text = "(" + m.ToString() +")"; m.Invert(); tbInvert.Text = "(" + m.ToString() + ")"; // Matrix multiplication: Matrix m1 = new Matrix(1, 2, 3, 4, 0, 1); Matrix m2 = new Matrix(0, 1, 2, 1, 0, 1); Matrix m12 = Matrix.Multiply(m1, m2); Matrix m21 = Matrix.Multiply(m2, m1); tbM1M2.Text = "M1 = (" + m1.ToString() + "), " + " M2 = (" + m2.ToString() + ")"; tbM12.Text = "(" + m12.ToString() + ")"; tbM21.Text = "(" + m21.ToString() + ")"; } } }

CHAPTER 2 ■ 2D TRANSFORMATIONS
24
This code-behind file performs matrix inversion and multiplications. In particular, it shows how the results of the matrix multiplication depend on the order of the matrix operations. Executing this example generates the output shown in Figure 2-5.
Figure 2-5. Results of matric operations in WPF.
First, let’s examine the matrix invert method, which inverts a matrix (1, 2, 3, 4, 0, 0). The Matrix.Invert method gives the result (-2, 1, 1.5, -0.5, 0, 0). This can easily be confirmed by multiplying the matrix (1, 2, 3, 4, 0, 0) by (-2, 1, 1.5, -0.5, 0, 0), which should be equal to an identity matrix (1, 0, 0, 1, 0, 0). In fact:
This is indeed an identity matrix, as expected. Next, let’s consider matrix multiplication. In the code, you create two matrices m1 = (1, 2, 3, 4, 0, 1)
and m2 = (0, 1, 2, 1, 0, 1). You first multiply m1 by m2 and return the result in m12; then you multiply m2 by m1 and store the result in m21. Note that the result is stored in m1 if the matrix m1 is multiplied by m2. You can see from Figure 2-5 that M12 = (4, 3, 8, 7, 2, 2). In fact:
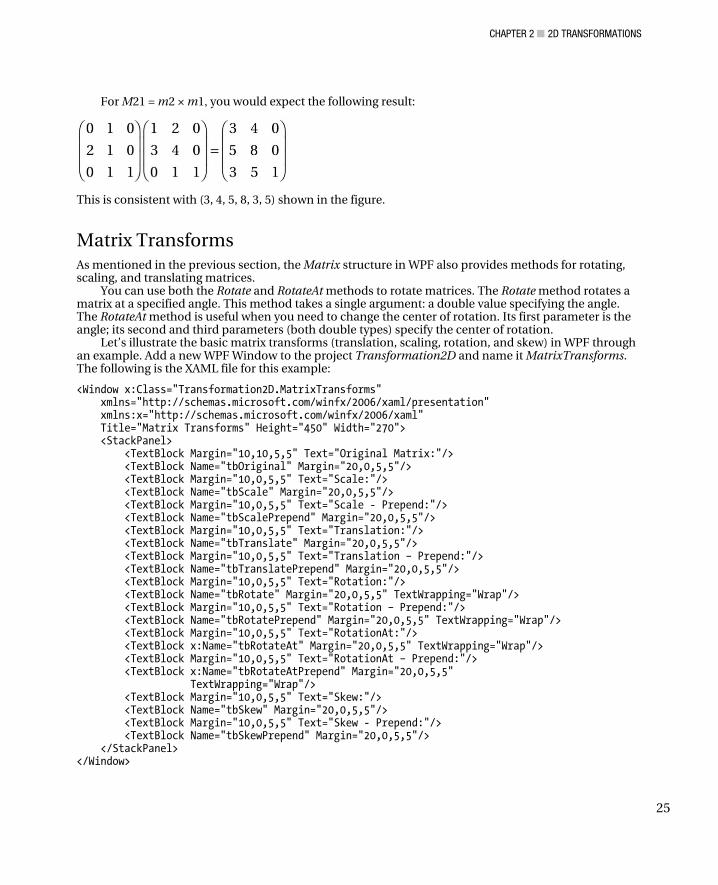
CHAPTER 2 ■ 2D TRANSFORMATIONS
25
For M21 = m2 × m1, you would expect the following result:
This is consistent with (3, 4, 5, 8, 3, 5) shown in the figure.
Matrix Transforms As mentioned in the previous section, the Matrix structure in WPF also provides methods for rotating, scaling, and translating matrices.
You can use both the Rotate and RotateAt methods to rotate matrices. The Rotate method rotates a matrix at a specified angle. This method takes a single argument: a double value specifying the angle. The RotateAt method is useful when you need to change the center of rotation. Its first parameter is the angle; its second and third parameters (both double types) specify the center of rotation.
Let’s illustrate the basic matrix transforms (translation, scaling, rotation, and skew) in WPF through an example. Add a new WPF Window to the project Transformation2D and name it MatrixTransforms. The following is the XAML file for this example:
<Window x:Class="Transformation2D.MatrixTransforms" xmlns="http://schemas.microsoft.com/winfx/2006/xaml/presentation" xmlns:x="http://schemas.microsoft.com/winfx/2006/xaml" Title="Matrix Transforms" Height="450" Width="270"> <StackPanel> <TextBlock Margin="10,10,5,5" Text="Original Matrix:"/> <TextBlock Name="tbOriginal" Margin="20,0,5,5"/> <TextBlock Margin="10,0,5,5" Text="Scale:"/> <TextBlock Name="tbScale" Margin="20,0,5,5"/> <TextBlock Margin="10,0,5,5" Text="Scale - Prepend:"/> <TextBlock Name="tbScalePrepend" Margin="20,0,5,5"/> <TextBlock Margin="10,0,5,5" Text="Translation:"/> <TextBlock Name="tbTranslate" Margin="20,0,5,5"/> <TextBlock Margin="10,0,5,5" Text="Translation – Prepend:"/> <TextBlock Name="tbTranslatePrepend" Margin="20,0,5,5"/> <TextBlock Margin="10,0,5,5" Text="Rotation:"/> <TextBlock Name="tbRotate" Margin="20,0,5,5" TextWrapping="Wrap"/> <TextBlock Margin="10,0,5,5" Text="Rotation – Prepend:"/> <TextBlock Name="tbRotatePrepend" Margin="20,0,5,5" TextWrapping="Wrap"/> <TextBlock Margin="10,0,5,5" Text="RotationAt:"/> <TextBlock x:Name="tbRotateAt" Margin="20,0,5,5" TextWrapping="Wrap"/> <TextBlock Margin="10,0,5,5" Text="RotationAt – Prepend:"/> <TextBlock x:Name="tbRotateAtPrepend" Margin="20,0,5,5" TextWrapping="Wrap"/> <TextBlock Margin="10,0,5,5" Text="Skew:"/> <TextBlock Name="tbSkew" Margin="20,0,5,5"/> <TextBlock Margin="10,0,5,5" Text="Skew - Prepend:"/> <TextBlock Name="tbSkewPrepend" Margin="20,0,5,5"/> </StackPanel> </Window>

CHAPTER 2 ■ 2D TRANSFORMATIONS
26
This markup creates the layout for displaying results using TextBlocks, which are embedded into a StackPanel control. The corresponding code-behind file is given by the following code:
using System; using System.Windows; using System.Windows.Media; namespace Transformation2D { public partial class MatrixTransforms : Window { public MatrixTransform() { InitializeComponent(); // Original matrix: Matrix m = new Matrix(1, 2, 3, 4, 0, 1); tbOriginal.Text = "(" + m.ToString() + ")"; //Scale: m.Scale(1, 0.5); tbScale.Text = "(" + m.ToString() + ")"; // Scale - Prepend: m = new Matrix(1, 2, 3, 4, 0, 1); m.ScalePrepend(1, 0.5); tbScalePrepend.Text = "(" + m.ToString() + ")"; //Translation: m = new Matrix(1, 2, 3, 4, 0, 1); m.Translate(1, 0.5); tbTranslate.Text = "(" + m.ToString() + ")"; // Translation - Prepend: m = new Matrix(1, 2, 3, 4, 0, 1); m.TranslatePrepend(1, 0.5); tbTranslatePrepend.Text = "(" + m.ToString() + ")"; //Rotation: m = new Matrix(1, 2, 3, 4, 0, 1); m.Rotate(45); tbRotate.Text = "(" + MatrixRound(m).ToString() + ")"; // Rotation - Prepend: m = new Matrix(1, 2, 3, 4, 0, 1); m.RotatePrepend(45); tbRotatePrepend.Text = "(" + MatrixRound(m).ToString() + ")"; //Rotation at (x = 1, y = 2): m = new Matrix(1, 2, 3, 4, 0, 1); m.RotateAt(45, 1, 2); tbRotateAt.Text = "(" + MatrixRound(m).ToString() + ")";

CHAPTER 2 ■ 2D TRANSFORMATIONS
27
// Rotation at (x = 1, y = 2) - Prepend: m = new Matrix(1, 2, 3, 4, 0, 1); m.RotateAtPrepend(45, 1, 2); tbRotateAtPrepend.Text = "(" + MatrixRound(m).ToString() + ")"; // Skew: m = new Matrix(1, 2, 3, 4, 0, 1); m.Skew(45, 30); tbSkew.Text = "(" + MatrixRound(m).ToString() + ")"; // Skew - Prepend: m = new Matrix(1, 2, 3, 4, 0, 1); m.SkewPrepend(45, 30); tbSkewPrepend.Text = "(" + MatrixRound(m).ToString() + ")"; } private Matrix MatrixRound(Matrix m) { m.M11 = Math.Round(m.M11, 3); m.M12 = Math.Round(m.M12, 3); m.M21 = Math.Round(m.M21, 3); m.M22 = Math.Round(m.M22, 3); m.OffsetX = Math.Round(m.OffsetX, 3); m.OffsetY = Math.Round(m.OffsetY, 3); return m; } } }
Building and running this application generates the output shown in Figure 2-6.

CHAPTER 2 ■ 2D TRANSFORMATIONS
28
Figure 2-6. The results of matrix transformations.
The original matrix, m = (1, 2, 3, 4, 0, 1), is operated on by various transforms. First, let’s examine the scale transform, which sets a scaling factor of 1 in the X direction and 0.5 in the Y direction. For the Apppend scaling (the default setting), we have

CHAPTER 2 ■ 2D TRANSFORMATIONS
29
This gives the same result (1, 1, 3, 2, 0, 0.5) shown in Figure 2-6. On the other hand, for the Prepend scaling, we have
This confirms the result (1, 2, 1.5, 2, 0, 1) shown in Figure 2-6. We then translate the matrix m one unit in the X direction and one-half unit in the Y direction. For
the Append (the default setting) translation, we have
This is consistent with the result (1, 2, 3, 4, 1, 1.5) shown in Figure 2-6. For the Prepend translation, we perform the following transformation:
This confirms the result (1, 2, 3, 4, 2.5, 5) shown in Figure 2-6. For the rotation transformation, the original m matrix is rotated by 45 degrees. In the case of the
Append rotation, we have
Note that in the foregoing calculation, we used the fact that cos(π/4) = sin(π/4) = 0.707. This gives the same result (-0.707, 2.121, -0.707, 4.95, -0.707, 0.707) as that given in Figure 2-6.
For the Prepend rotation, we have
This result is the same as (2.828, 4.243, 1.414, 1.414, 0, 1) shown in Figure 2-6. The RotateAt method is designed for cases in which you need to change the center of rotation. In
fact, the Rotate method is a special case of RotateAt, with the rotation center at (0, 0). In this example, the matrix m is rotated by 45 degrees at the point (1, 2). As discussed previously in this chapter, the rotation of an object about an arbitrary point P1 must be performed according to the following procedures:

CHAPTER 2 ■ 2D TRANSFORMATIONS
30
• Translate P1 to the origin.
• Rotate it to the desired angle.
• Translate so that the point at the origin returns to P1.
Considering the matrix transformations in WPF, the rotation matrix at point (1, 2) should be expressed in the following form:
Thus, the Append rotation of Matrix m by 45 degrees at Point(1, 2) becomes
This gives the same result of (-0.707, 2.121, -0.707, 4.949, 1, 0.586) shown in Figure 2-6. The minor difference is due to decimal rounding.
Similarly, the Prepend rotation of Matrix m by 45 degrees at Point(1, 2) should give
Again, the result is the same as the one shown in Figure 2-6. Finally, we’ll examine the Skew method, which creates a shearing transform. This method takes two
double arguments, AngleX and AngleY, which represent, respectively, the horizontal and vertical skew factors. The skew transformation in homogeneous coordinates can be expressed in the form
where tan(AngleX) and tan(AngleY) are the skew transform factors in the X and Y directions, respectively. Take a look at the Skew transform in this example. The skew angles are AngleX = 45 degrees and AngleY = 30 degrees. In this case, the Skew matrix is given by
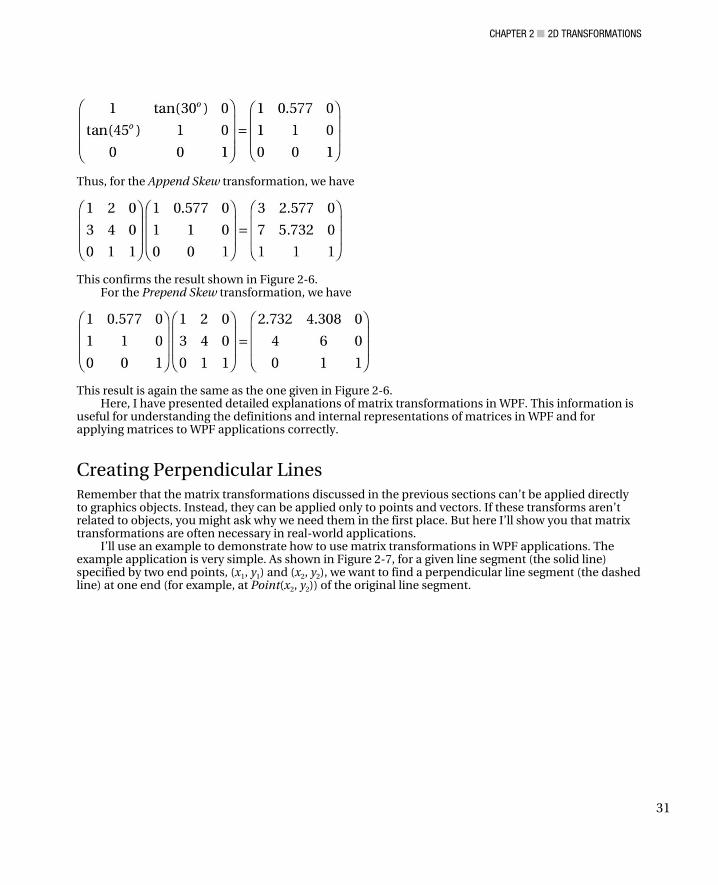
CHAPTER 2 ■ 2D TRANSFORMATIONS
31
Thus, for the Append Skew transformation, we have
This confirms the result shown in Figure 2-6. For the Prepend Skew transformation, we have
This result is again the same as the one given in Figure 2-6. Here, I have presented detailed explanations of matrix transformations in WPF. This information is
useful for understanding the definitions and internal representations of matrices in WPF and for applying matrices to WPF applications correctly.
Creating Perpendicular Lines Remember that the matrix transformations discussed in the previous sections can’t be applied directly to graphics objects. Instead, they can be applied only to points and vectors. If these transforms aren’t related to objects, you might ask why we need them in the first place. But here I’ll show you that matrix transformations are often necessary in real-world applications.
I’ll use an example to demonstrate how to use matrix transformations in WPF applications. The example application is very simple. As shown in Figure 2-7, for a given line segment (the solid line) specified by two end points, (x1, y1) and (x2, y2), we want to find a perpendicular line segment (the dashed line) at one end (for example, at Point(x2, y2)) of the original line segment.
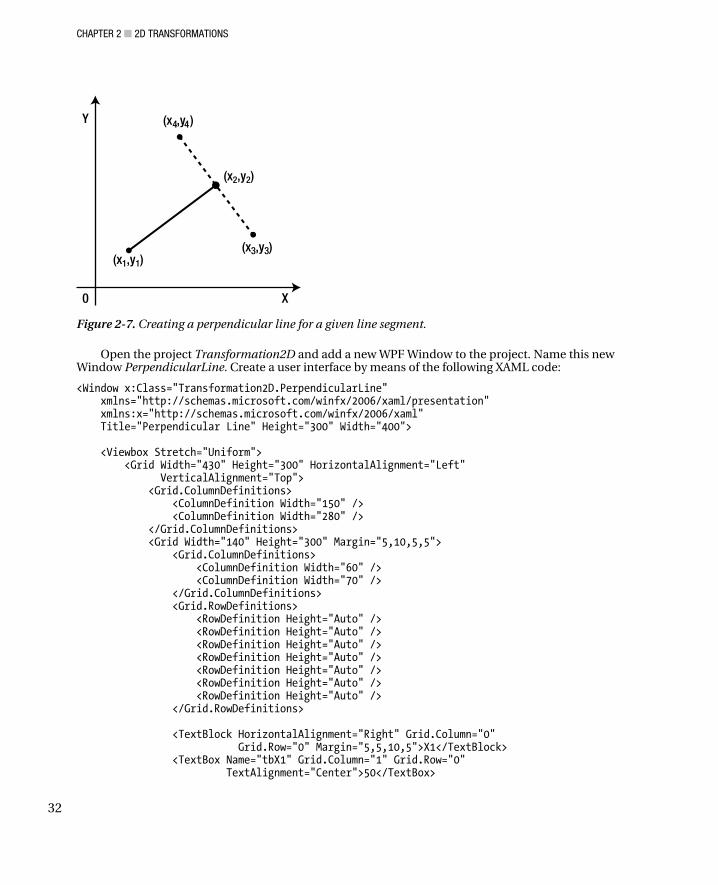
CHAPTER 2 ■ 2D TRANSFORMATIONS
32
Figure 2-7. Creating a perpendicular line for a given line segment.
Open the project Transformation2D and add a new WPF Window to the project. Name this new Window PerpendicularLine. Create a user interface by means of the following XAML code:
<Window x:Class="Transformation2D.PerpendicularLine" xmlns="http://schemas.microsoft.com/winfx/2006/xaml/presentation" xmlns:x="http://schemas.microsoft.com/winfx/2006/xaml" Title="Perpendicular Line" Height="300" Width="400"> <Viewbox Stretch="Uniform"> <Grid Width="430" Height="300" HorizontalAlignment="Left" VerticalAlignment="Top"> <Grid.ColumnDefinitions> <ColumnDefinition Width="150" /> <ColumnDefinition Width="280" /> </Grid.ColumnDefinitions> <Grid Width="140" Height="300" Margin="5,10,5,5"> <Grid.ColumnDefinitions> <ColumnDefinition Width="60" /> <ColumnDefinition Width="70" /> </Grid.ColumnDefinitions> <Grid.RowDefinitions> <RowDefinition Height="Auto" /> <RowDefinition Height="Auto" /> <RowDefinition Height="Auto" /> <RowDefinition Height="Auto" /> <RowDefinition Height="Auto" /> <RowDefinition Height="Auto" /> <RowDefinition Height="Auto" /> </Grid.RowDefinitions> <TextBlock HorizontalAlignment="Right" Grid.Column="0" Grid.Row="0" Margin="5,5,10,5">X1</TextBlock> <TextBox Name="tbX1" Grid.Column="1" Grid.Row="0" TextAlignment="Center">50</TextBox>

CHAPTER 2 ■ 2D TRANSFORMATIONS
33
<TextBlock HorizontalAlignment="Right" Grid.Column="0" Grid.Row="1" Margin="5,5,10,5">Y1</TextBlock> <TextBox Name="tbY1" Grid.Column="1" Grid.Row="1" TextAlignment="Center">200</TextBox> <TextBlock HorizontalAlignment="Right" Grid.Column="0" Grid.Row="2" Margin="5,5,10,5">X2</TextBlock> <TextBox Name="tbX2" Grid.Column="1" Grid.Row="2" TextAlignment="Center">150</TextBox> <TextBlock HorizontalAlignment="Right" Grid.Column="0" Grid.Row="3" Margin="5,5,10,5">Y2</TextBlock> <TextBox Name="tbY2" Grid.Column="1" Grid.Row="3" TextAlignment="Center">100</TextBox> <TextBlock HorizontalAlignment="Right" Grid.Column="0" Grid.Row="4" Margin="5,5,10,5">Length</TextBlock> <TextBox Name="tbLength" Grid.Column="1" Grid.Row="4" TextAlignment="Center">100</TextBox> <Button Click="BtnApply_Click" Margin="15,20,15,5" Grid.Row="5" Height="25" Grid.ColumnSpan="2" Grid.Column="0">Apply</Button> <Button Click="BtnClose_Click" Margin="15,0,15,5" Grid.Row="6" Height="25" Grid.ColumnSpan="2" Grid.Column="0">Close</Button> </Grid> <Canvas Name="canvas1" Grid.Column="1" Margin="10" ClipToBounds="True" Width="270" Height="280"> <TextBlock Name="tbPoint1" Canvas.Top="10">Point1</TextBlock> <TextBlock Name="tbPoint2" Canvas.Top="25">Point2</TextBlock> <TextBlock Name="tbPoint3" Canvas.Top="40">Point3</TextBlock> <TextBlock Name="tbPoint4" Canvas.Top="55">Point4</TextBlock> </Canvas> </Grid> </Viewbox> </Window>
This XAML code creates a user interface that allows you to specify the end points of the line and the length of the perpendicular line segment. The corresponding code-behind file of this example is as follows:
using System; using System.Windows; using System.Windows.Controls; using System.Windows.Media; using System.Windows.Shapes; namespace Transformation2D { public partial class PerpendicularLine : Window { private Line line1; private Line line2; public PerpendicularLine() { InitializeComponent();

CHAPTER 2 ■ 2D TRANSFORMATIONS
34
Rectangle rect = new Rectangle(); rect.Stroke = Brushes.Black; rect.Width = canvas1.Width; rect.Height = canvas1.Height; canvas1.Children.Add(rect); line1 = new Line(); line2 = new Line(); AddLines(); } private void AddLines() { Point pt1 = new Point(); Point pt2 = new Point(); pt1.X = Convert.ToDouble(tbX1.Text); pt1.Y = Convert.ToDouble(tbY1.Text); pt2.X = Convert.ToDouble(tbX2.Text); pt2.Y = Convert.ToDouble(tbY2.Text); double length = 0.5 * Convert.ToDouble(tbLength.Text); line1 = new Line(); line1.X1 = pt1.X; line1.Y1 = pt1.Y; line1.X2 = pt2.X; line1.Y2 = pt2.Y; line1.Stroke = Brushes.Gray; line1.StrokeThickness = 4; canvas1.Children.Add(line1); Canvas.SetLeft(tbPoint1, pt1.X); Canvas.SetTop(tbPoint1, pt1.Y); Canvas.SetLeft(tbPoint2, pt2.X); Canvas.SetTop(tbPoint2, pt2.Y); tbPoint1.Text = "Pt1(" + pt1.ToString() + ")"; tbPoint2.Text = "Pt2(" + pt2.ToString() + ")"; Vector v1 = pt1 - pt2; Matrix m1 = new Matrix(); Point pt3 = new Point(); Point pt4 = new Point(); m1.Rotate(-90); v1.Normalize(); v1 *= length; line2 = new Line(); line2.Stroke = Brushes.Gray; line2.StrokeThickness = 4; line2.StrokeDashArray = DoubleCollection.Parse("3, 1"); pt3 = pt2 + v1 * m1; m1 = new Matrix(); m1.Rotate(90); pt4 = pt2 + v1 * m1; line2.X1 = pt3.X; line2.Y1 = pt3.Y;

CHAPTER 2 ■ 2D TRANSFORMATIONS
35
line2.X2 = pt4.X; line2.Y2 = pt4.Y; canvas1.Children.Add(line2); Canvas.SetLeft(tbPoint3, pt3.X); Canvas.SetTop(tbPoint3, pt3.Y); Canvas.SetLeft(tbPoint4, pt4.X); Canvas.SetTop(tbPoint4, pt4.Y); pt3.X = Math.Round(pt3.X, 0); pt3.Y = Math.Round(pt3.Y, 0); pt4.X = Math.Round(pt4.X, 0); pt4.Y = Math.Round(pt4.Y, 0); tbPoint3.Text = "Pt3(" + pt3.ToString() + ")"; tbPoint4.Text = "Pt4(" + pt4.ToString() + ")"; } public void BtnApply_Click(object sender, EventArgs e) { if (line1 != null) canvas1.Children.Remove(line1); if (line2 != null) canvas1.Children.Remove(line2); AddLines(); } public void BtnClose_Click(object sender, EventArgs e) { this.Close(); } } }
Here, we first create a Line segment (line1) using two end points specified by the user and then create a vector using these two end points:
Vector v1 = pt1 - pt2;
This gives the direction of line1. The perpendicular line you want to create will have a length specified by the user. We want the vector to have the same length as the perpendicular line (line2), so we use the following statements:
v1.Normalize(); v1 *= length;
This vector is first normalized to a unit vector and then multiplied by the length of the perpendicular line. Now the vector has the proper length and direction along Point(x2, y2) to Point(x1, y1). If we rotate this vector by 90 or -90 degrees at Point(x2, y2), we’ll obtain a perpendicular line. We can achieve this via the following code snippet:
Matrix m1 = new Matrix(); m1.Rotate(-90); pt3 = pt2 + v1 * m1; m1 = new Matrix(); m1.Rotate(90); pt4 = pt2 + v1 * m1;

CHAPTER 2 ■ 2D TRANSFORMATIONS
36
Here a rotation matrix m1 is used to rotate the vector by 90 or -90 degrees to find two end points that define the perpendicular line.
Executing this project produces the results shown in Figure 2-8. The user interface allows the user to specify arbitrary points and length, and the program automatically draws the perpendicular line on the screen.
If you change the rotation angle and make a few modifications to the program, you can easily use it to draw a line with an arrowhead.
Figure 2-8. A perpendicular line in WPF.
Object Transformations in WPF In the previous sections, we discussed the Vector and Matrix structures as well as their operations in WPF. The Matrix structure can be applied to a Point or a Vector object. However, if you want to apply 2D transforms to objects or coordinate systems, you need to use the Transform classes. In WPF, there are five derived classes that can be used to perform specific transforms on objects:
• ScaleTransform – Scales an object in both the X and Y directions. The ScaleX property specifies how much you stretch or shrink an object along the X direction, and the ScaleY property specifies how much to stretch or shrink an object along the Y direction. Scale operations are centered at the point specified by the CenterX and CenterY properties.
• TranslateTransform – Defines a translation along the X and Y directions. You specify the amount by which the object is translated using the X and Y properties.

CHAPTER 2 ■ 2D TRANSFORMATIONS
37
• RotateTransform – Rotates an object in 2D space by specifying an angle using the Angle property and a center point specified by the CenterX and CenterY properties.
• SkewTransform – Defines a 2D skew that stretches the coordinate space in a nonuniform manner. Use the CenterX and CenterY properties to specify the center point of the transform. Use the AngleX and AngleY properties to specify the skew angle along the X and Y directions.
• MatrixTransform – Creates an affine matrix transform to manipulate an object in 2D space using a custom transform not provided by other Transform classes. You can multiply affine transform matrices to form any number of linear transforms; for example, you can rotate or skew an object and then translate it to a new location.
The structure of the TransformMatrix is the same as that of the Matrix structure in WPF. In the homogeneous coordinate system, the TransformMatrix always has a last column of (0, 0, 1). Based on this fact, WPF defines the TransformMatrix in terms of a 3 × 2 matrix. This means the TransformMatrix classes in WPF take six elements arranged in three rows and two columns. In methods and properties, the transform matrix is usually specified as an array with six members as follows: (M11, M12, M21, M22, OffsetX, OffsetY). OffsetX and OffsetY represent translation values.
By manipulating matrix values directly using the MatrixTransform class, you can rotate, scale, skew, and move an object. For example, if you change the value in the first column of the third row (the OffsetX value) to 100, you can use it to move an object 100 units along the X axis. If you change the value in the second column of the second row to 3, you can use it to stretch an object to three times its current height. If you change both values, you move the object 100 units along the X axis and stretch its height by a factor of 3. Since WPF only supports affine transforms in 2D, the values in the third column are always (0, 0, 1).
Although WPF allows you to manipulate matrix values in the MatrixTransform class directly, it also provides several Transform classes that enable you to transform an object without knowing how the underlying matrix structure is configured. For example, the ScaleTransform class enables you to scale an object by setting its ScaleX and ScaleY properties instead of manipulating a transform matrix. Likewise, the RotateTransfrom class enables you to rotate an object simply by setting its Angle property. WPF will use the underlying structure of the TransformMatrix to perform the corresponding operation on the object. For instance, when you specify a RotateTransform with an angle of 45 degrees, the corresponding underlying TransformMatrix takes the following form:
One way to transform an object is to declare the appropriate Transform type and to apply it to the transform property of the object. Different types of objects have different types of transform properties. The following table lists several commonly used WPF types and their transform properties.

CHAPTER 2 ■ 2D TRANSFORMATIONS
38
Type Transform Properties
FrameworkElement RenderTransform, LayoutTransform
UIElement RenderTransform
Geometry Transform
TextEffect Transform
Brush Transform, RelativeTransform
ContainerVisual Transform
DrawingGroup Transform
When you transform an object, you don’t just transform the object itself; you transform the coordinate space in which that object exists. By default, a transform is centered at the origin of the target object’s coordinate system: (0, 0). You can change the transform center by specifying the CenterX and CenterY properties of the transform matrix. The only exception is the TranslateTransform, which has no center properties to set, because the translation effect is the same regardless of where it is centered.
In the following few sections, you will apply various transforms to a Rectangle shape, a type of FrameworkElement that derives from the UIElement class.
MatrixTransform Class You can create a custom transform using the MatrixTransform class. And you can apply the custom transform to any FrameworkElement or UIElement object, including graphics shapes, user controls, and panels.
Here I’ll use an example to show you how to perform transforms on a Rectangle shape using the MatrixTransform class. Open the Transformation2D project, and add a new WPF Window named ObjectMatrixTransforms. This application will allow the user to enter matrix elements for the transform matrix and interactively view the transformed Rectangle shape on the screen. Here is the XAML file for this example:
<Window x:Class="Transformation2D.ObjectMatrixTransforms" xmlns="http://schemas.microsoft.com/winfx/2006/xaml/presentation" xmlns:x="http://schemas.microsoft.com/winfx/2006/xaml" Title="Object Matrix Transforms" Height="300" Width="400"> <Viewbox Stretch="Uniform"> <Grid Width="430" Height="300" HorizontalAlignment="Left" VerticalAlignment="Top"> <Grid.ColumnDefinitions> <ColumnDefinition Width="150"/> <ColumnDefinition Width="280"/> </Grid.ColumnDefinitions> <Grid Width="140" Height="300" Margin="5,10,5,5">

CHAPTER 2 ■ 2D TRANSFORMATIONS
39
<Grid.ColumnDefinitions> <ColumnDefinition Width="60"/> <ColumnDefinition Width="70"/> </Grid.ColumnDefinitions> <Grid.RowDefinitions> <RowDefinition Height="Auto"/> <RowDefinition Height="Auto"/> <RowDefinition Height="Auto"/> <RowDefinition Height="Auto"/> <RowDefinition Height="Auto"/> <RowDefinition Height="Auto"/> <RowDefinition Height="Auto"/> <RowDefinition Height="Auto"/> </Grid.RowDefinitions> <TextBlock HorizontalAlignment="Right" Grid.Column="0" Grid.Row="0" Margin="5,5,10,5">M11</TextBlock> <TextBox Name="tbM11" Grid.Column="1" Grid.Row="0" TextAlignment="Center">1</TextBox> <TextBlock HorizontalAlignment="Right" Grid.Column="0" Grid.Row="1" Margin="5,5,10,5">M12</TextBlock> <TextBox Name="tbM12" Grid.Column="1" Grid.Row="1" TextAlignment="Center">0</TextBox> <TextBlock HorizontalAlignment="Right" Grid.Column="0" Grid.Row="2" Margin="5,5,10,5">M21</TextBlock> <TextBox Name="tbM21" Grid.Column="1" Grid.Row="2" TextAlignment="Center">0</TextBox> <TextBlock HorizontalAlignment="Right" Grid.Column="0" Grid.Row="3" Margin="5,5,10,5">M22</TextBlock> <TextBox Name="tbM22" Grid.Column="1" Grid.Row="3" TextAlignment="Center">1</TextBox> <TextBlock HorizontalAlignment="Right" Grid.Column="0" Grid.Row="4" Margin="5,5,10,5"> OffsetX</TextBlock> <TextBox Name="tbOffsetX" Grid.Column="1" Grid.Row="4" TextAlignment="Center">0</TextBox> <TextBlock HorizontalAlignment="Right" Grid.Column="0" Grid.Row="5" Margin="5,5,10,5">OffsetY</TextBlock> <TextBox Name="tbOffsetY" Grid.Column="1" Grid.Row="5" TextAlignment="Center">0</TextBox> <Button Click="BtnApply_Click" Margin="15,20,15,5" Grid.Row="6" Height="25" Grid.ColumnSpan="2" Column="0">Apply</Button> <Button Click="BtnClose_Click" Margin="15,0,15,5" Grid.Row="7" Height="25" Grid.ColumnSpan="2" Grid.Column="0">Close</Button> </Grid> <Border Margin="10" Grid.Column="1" BorderBrush="Black" BorderThickness="1" HorizontalAlignment="Left" Background="{StaticResource MyGrayGridBrush}"> <Canvas Name="canvas1" Grid.Column="1" ClipToBounds="True"

CHAPTER 2 ■ 2D TRANSFORMATIONS
40
Width="270" Height="280"> <TextBlock Canvas.Top="53" Canvas.Left="90"> Original shape</TextBlock> <Rectangle Canvas.Top="70" Canvas.Left="100" Width="50" Height="70" Stroke="Black" StrokeThickness="2" StrokeDashArray="3,1"/> <Rectangle Name="rect" Canvas.Top="70" Canvas.Left="100" Width="50" Height="70" Fill="LightCoral" Opacity="0.5" Stroke="Black" StrokeThickness="2"> <Rectangle.RenderTransform> <MatrixTransform x:Name="matrixTransform"/> </Rectangle.RenderTransform> </Rectangle> </Canvas> </Border> </Grid> </Viewbox> </Window>
This markup creates a user interface that contains TextBoxes, Buttons, and a Canvas, which allows the user to interactively manipulate the elements of the TransformMatrix and to display the transformed Rectangle shape on the screen. In order to monitor the transformed shape precisely, we also add gridlines to the Canvas (canvas1). These gridlines, called MyGrayGridBrush, are defined in the Application.Resource of the App.xaml file, as listed here:
<Application x:Class="Transformation2D.App" xmlns="http://schemas.microsoft.com/winfx/2006/xaml/presentation" xmlns:x="http://schemas.microsoft.com/winfx/2006/xaml" StartupUri="StartMenu.xaml"> <Application.Resources> <DrawingBrush x:Key="MyGrayGridBrush" Viewport="0,0,10,10" ViewportUnits="Absolute" TileMode="Tile"> <DrawingBrush.Drawing> <DrawingGroup> <DrawingGroup.Children> <GeometryDrawing Brush="White"> <GeometryDrawing.Geometry> <RectangleGeometry Rect="0,0,1,1" /> </GeometryDrawing.Geometry> </GeometryDrawing> <GeometryDrawing Geometry="M0,0 L1,0 1,0.1, 0,0.1Z" Brush="#EEEEEE" /> <GeometryDrawing Geometry="M0,0 L0,1 0.1,1, 0.1,0Z" Brush="#EEEEEE" /> </DrawingGroup.Children> </DrawingGroup> </DrawingBrush.Drawing> </DrawingBrush> </Application.Resources> </Application>
This resource is available at the application level.

CHAPTER 2 ■ 2D TRANSFORMATIONS
41
The transform on the rectangle is specified with the following XAML snippet:
<Rectangle.RenderTransform> <MatrixTransform x:Name="matrixTransform"/> </Rectangle.RenderTransform>
In this snippet, you can see that to apply transforms to a FrameworkElement, you need to create a Transform matrix and apply it to one of the two properties that the FrameworkElement class provides:
• LayoutTransform – A transform that is applied before the layout pass. After the transform is applied, the layout system processes the transformed size and position of the element.
• RenderTransform – A transform that modifies the appearance of the element but is applied after the layout pass is completed. By using the RenderTransform property instead of the LayoutTransform, you can gain performance benefits.
You may ask which property to use. Because of the performance benefits that it provides, use the RenderTransform property whenever possible, especially when you involve animated Transform objects. Use the LayoutTransform property when you are scaling, rotating, or skewing and you need the parent of the element to adjust to the transformed size of the element. Note that when they are used with the LayoutTransform property, TranslateTransform objects appear to have no effect on elements. This is because the layout system returns the translated element to its original position as part of its processing.
This example uses the RenderTransform property of the rectangle. The following is the corresponding C# code responsible for the event handlers:
using System; using System.Windows; using System.Windows.Controls; using System.Windows.Media; using System.Windows.Shapes; namespace Transformation2D { public partial class ObjectMatrixTransforms : Window { public ObjectMatrixTransforms() { InitializeComponent(); } public void BtnApply_Click(object sender, EventArgs e) { Matrix m = new Matrix(); m.M11 = Double.Parse(tbM11.Text); m.M12 = Double.Parse(tbM12.Text); m.M21 = Double.Parse(tbM21.Text); m.M22 = Double.Parse(tbM22.Text); m.OffsetX = Double.Parse(tbOffsetX.Text); m.OffsetY = Double.Parse(tbOffsetY.Text); matrixTransform.Matrix = m; } public void BtnClose_Click(object sender, EventArgs e) {

CHAPTER 2 ■ 2D TRANSFORMATIONS
42
this.Close(); } } }
The main part of this code-behind file is the Apply button’s click event handler. We create a new Matrix instance m and specify its elements using the text content of the corresponding TextBoxes. The matrix m is then passed to the transform matrix matrixTransform, which is defined in the XAML file.
Building and running this project produces the output shown in Figure 2-9. In the left pane, you can change all six elements of a custom transform matrix by entering values of the double type in the TextBoxes. The entered values take effect after you click the Apply button. The original location of the Rectangle is obtained by an identity matrix (1, 0, 0, 1, 0, 0) in homogeneous coordinates. The results shown in the figure are obtained by moving the rectangle –50 units in the X direction and 100 units in the Y direction.
Figure 2-9. Transform on a rectangle using the MatrixTransform class.
By changing the other elements, you can obtain a variety of transforms, including translation, scale, rotation, and skew.
ScaleTransform Class In the previous section, we discussed how to perform transforms on UIElement or FrameworkElement objects by manipulating transform matrix values directly. However, WPF also provides several Transform classes that allow you to transform an object without knowing how the underlying matrix structure is configured. For example, the ScaleTransform class enables you to scale an object by setting its ScaleX and ScaleY properties instead of manipulating a transform matrix directly.

CHAPTER 2 ■ 2D TRANSFORMATIONS
43
Let’s look at an example. Open the Transformation2D project, add a WPF Window, and name it ScaleTransforms. In this example, you create two Canvas panels. The left Canvas is used to animate a scale transform on a rectangle shape; the right Canvas is used for an interactive transform that allows you to change the ScaleX and ScaleY properties on the screen. The animation gives you the real sense of how the scaling transformation works. The following is the XAML file for this example:
<Window x:Class="Transformation2D.ScaleTransforms" xmlns="http://schemas.microsoft.com/winfx/2006/xaml/presentation" xmlns:x="http://schemas.microsoft.com/winfx/2006/xaml" Title="Scale Transforms" Height="330" Width="480"> <Viewbox Stretch="Uniform"> <Grid Width="525" Height="330" HorizontalAlignment="Left" VerticalAlignment="Top" ShowGridLines="True"> <Grid.ColumnDefinitions> <ColumnDefinition Width="260" /> <ColumnDefinition Width="260" /> </Grid.ColumnDefinitions> <StackPanel Grid.Column="0"> <TextBlock HorizontalAlignment="Center" Margin="10,10,10,0" TextWrapping="Wrap" FontSize="14" FontWeight="Bold" Text="Scaling Animation"/> <TextBlock Margin="10,10,10,0" TextWrapping="Wrap" Text="The scaling parameters ScaleX and ScaleY are animated from 0 to 4."/> <Border Margin="10" BorderBrush="Black" BorderThickness="1" Background="{StaticResource MyGrayGridBrush}" HorizontalAlignment="Left"> <Canvas ClipToBounds="True" Width="240" Height="250"> <Rectangle Canvas.Left="100" Canvas.Top="80" Width="50" Height="70" Fill="LightCoral" Opacity="0.5" Stroke="Black" StrokeThickness="2"> <Rectangle.RenderTransform> <ScaleTransform x:Name="rectScale" CenterX="25" CenterY="35" /> </Rectangle.RenderTransform> </Rectangle> <!-- Animate the rectangle: --> <Canvas.Triggers> <EventTrigger RoutedEvent="Canvas.Loaded"> <BeginStoryboard> <Storyboard RepeatBehavior="Forever" AutoReverse="True"> <DoubleAnimation Storyboard.TargetName="rectScale" Storyboard.TargetProperty="ScaleX" From="0" To="4" Duration="0:0:5"/> <DoubleAnimation Storyboard.TargetName="rectScale" Storyboard.TargetProperty="ScaleY" From="0" To="4" Duration="0:0:5"/> </Storyboard>

CHAPTER 2 ■ 2D TRANSFORMATIONS
44
</BeginStoryboard> </EventTrigger> </Canvas.Triggers> </Canvas> </Border> </StackPanel> <StackPanel Grid.Column="1"> <TextBlock HorizontalAlignment="Center" Margin="10,10,10,10" TextWrapping="Wrap" FontSize="14" FontWeight="Bold" Text="Interactive Scaling"/> <Grid Width="260" Height="26" HorizontalAlignment="Left" VerticalAlignment="Top"> <Grid.ColumnDefinitions> <ColumnDefinition Width="70" /> <ColumnDefinition Width="50" /> <ColumnDefinition Width="70" /> <ColumnDefinition Width="50" /> </Grid.ColumnDefinitions> <TextBlock Margin="2,2,10,2" TextAlignment="Right" Text="ScaleX"/> <TextBox Name="tbScaleX" Width="50" Height="20" Grid.Column="1" TextAlignment="Center" Text="1"/> <TextBlock Margin="2,2,10,2" Grid.Column="2" TextAlignment="Right" Text="ScaleY"/> <TextBox Name="tbScaleY" Width="50" Height="20" Grid.Column="3" TextAlignment="Center" Text="1"/> </Grid> <Border Margin="10" BorderBrush="Black" BorderThickness="1" Background="{StaticResource MyGrayGridBrush}" HorizontalAlignment="Left"> <Canvas ClipToBounds="True" Width="240" Height="250"> <TextBlock Canvas.Left="90" Canvas.Top="63" Text="Original shape"/> <Rectangle Canvas.Top="80" Canvas.Left="100" Width="50" Height="70" Stroke="Black" StrokeThickness="1" StrokeDashArray="3,1"/> <Rectangle Canvas.Top="80" Canvas.Left="100" Width="50" Height="70" Fill="LightCoral" Opacity="0.5" Stroke="Black" StrokeThickness="2"> <!-- Set interactive scale: --> <Rectangle.RenderTransform> <ScaleTransform ScaleX="{Binding ElementName=tbScaleX,Path=Text}" ScaleY="{Binding ElementName=tbScaleY,Path=Text}" CenterX="25" CenterY="35"/> </Rectangle.RenderTransform> </Rectangle> </Canvas> </Border> </StackPanel>

CHAPTER 2 ■ 2D TRANSFORMATIONS
45
</Grid> </Viewbox> </Window>
This XAML file creates a complete WPF application that includes not only a layout and user interface, but also the animation and interactive scale transform on the rectangle shape.
The animation for the rectangle object is started by varying its ScaleX and ScaleY dependency properties from 0 to 4.
For the interactive scale transform on the rectangle on the right pane, the ScaleX and ScaleY properties of the transform are bound to the Text properties of the corresponding TextBoxes, which can be specified by the user’s input. This allows you to interactively examine the scaling transform directly on the screen. Figure 2-10 shows a snapshot of this example.
Figure 2-10. Scale Transformation on rectangles.
TranslateTransform Class The TranslateTransform class enables you to move an object by setting its X and Y properties. This transform has no center properties to set because the translation effect is the same regardless of where it is centered.
Let’s consider an example of a translation on a Rectangle object with the same layout as that used in the previous example. Add a WPF Window to the project Transformation2D and call it TranslateTransforms. The XAML file is similar to the previous ScaleTransformations example, except for the RenderTransform property of the rectangle. Here is the XAML file for this example:
<Window x:Class="Transformation2D.TranslateTransforms"

CHAPTER 2 ■ 2D TRANSFORMATIONS
46
xmlns="http://schemas.microsoft.com/winfx/2006/xaml/presentation" xmlns:x="http://schemas.microsoft.com/winfx/2006/xaml" Title="Translation Transforms" Height="330" Width="480"> <Viewbox Stretch="Uniform"> <Grid Width="525" Height="330" HorizontalAlignment="Left" VerticalAlignment="Top" ShowGridLines="True"> <Grid.ColumnDefinitions> <ColumnDefinition Width="260" /> <ColumnDefinition Width="260" /> </Grid.ColumnDefinitions> <StackPanel Grid.Column="0"> <TextBlock HorizontalAlignment="Center" Margin="10,10,10,0" TextWrapping="Wrap" FontSize="14" FontWeight="Bold" Text="Translation Animation"/> <TextBlock Margin="10,10,10,0" TextWrapping="Wrap" Text="The translation properties X and Y are animated from -90 to 90."/> <Border Margin="10" BorderBrush="Black" BorderThickness="1" Background="{StaticResource MyGrayGridBrush}" HorizontalAlignment="Left"> <Canvas ClipToBounds="True" Width="240" Height="250"> <Rectangle Name="rect" Canvas.Left="100" Canvas.Top="80" Width="50" Height="70" Fill="LightCoral" Opacity="0.5" Stroke="Black" StrokeThickness="2"> <Rectangle.RenderTransform> <TranslateTransform x:Name="translate"/> </Rectangle.RenderTransform> </Rectangle> <!-- Animate the rectangle: --> <Canvas.Triggers> <EventTrigger RoutedEvent="Canvas.Loaded"> <BeginStoryboard> <Storyboard RepeatBehavior="Forever" AutoReverse="True"> <DoubleAnimation Storyboard.TargetName="translate" Storyboard.TargetProperty="X" From="-90" To="90" Duration="0:0:5"/> <DoubleAnimation Storyboard.TargetName="translate" Storyboard.TargetProperty="Y" From="-90" To="90" Duration="0:0:5"/> </Storyboard> </BeginStoryboard> </EventTrigger> </Canvas.Triggers> </Canvas> </Border> </StackPanel>

CHAPTER 2 ■ 2D TRANSFORMATIONS
47
<StackPanel Grid.Column="1"> <TextBlock HorizontalAlignment="Center" Margin="10,10,10,10" TextWrapping="Wrap" FontSize="14" FontWeight="Bold" Text="Interactive Translation"/> <Grid Width="260" Height="26" HorizontalAlignment="Left" VerticalAlignment="Top"> <Grid.ColumnDefinitions> <ColumnDefinition Width="70" /> <ColumnDefinition Width="50" /> <ColumnDefinition Width="70" /> <ColumnDefinition Width="50" /> </Grid.ColumnDefinitions> <TextBlock Margin="2,2,10,2" TextAlignment="Right" Text="X"/> <TextBox Name="tbX" Width="50" Height="20" Grid.Column="1" TextAlignment="Center" Text="0"/> <TextBlock Margin="2,2,10,2" Grid.Column="2" TextAlignment="Right" Text="Y"/> <TextBox Name="tbY" Width="50" Height="20" Grid.Column="3" TextAlignment="Center" Text="0"/> </Grid> <Border Margin="10" BorderBrush="Black" BorderThickness="1" Background="{StaticResource MyGrayGridBrush}" HorizontalAlignment="Left"> <Canvas ClipToBounds="True" Width="240" Height="250"> <TextBlock Canvas.Left="90" Canvas.Top="63" Text="Original shape"/> <Rectangle Canvas.Top="80" Canvas.Left="100" Width="50" Height="70" Stroke="Black" StrokeThickness="1" StrokeDashArray="3,1"/> <Rectangle Name="rect1" Canvas.Top="80" Canvas.Left="100" Width="50" Height="70" Fill="LightCoral" Opacity="0.5" Stroke="Black" StrokeThickness="2"> <!-- Set interactive translation: --> <Rectangle.RenderTransform> <TranslateTransform X="{Binding ElementName=tbX,Path=Text}" Y="{Binding ElementName=tbY,Path=Text}"/> </Rectangle.RenderTransform> </Rectangle> </Canvas> </Border> </StackPanel> </Grid> </Viewbox> </Window>
You can see that the animation is performed using a storyboard that animates the X and Y properties of the translation. For the interactive translation of the rectangle on the right pane, the following XAML snippet defines its RenderTransform property:
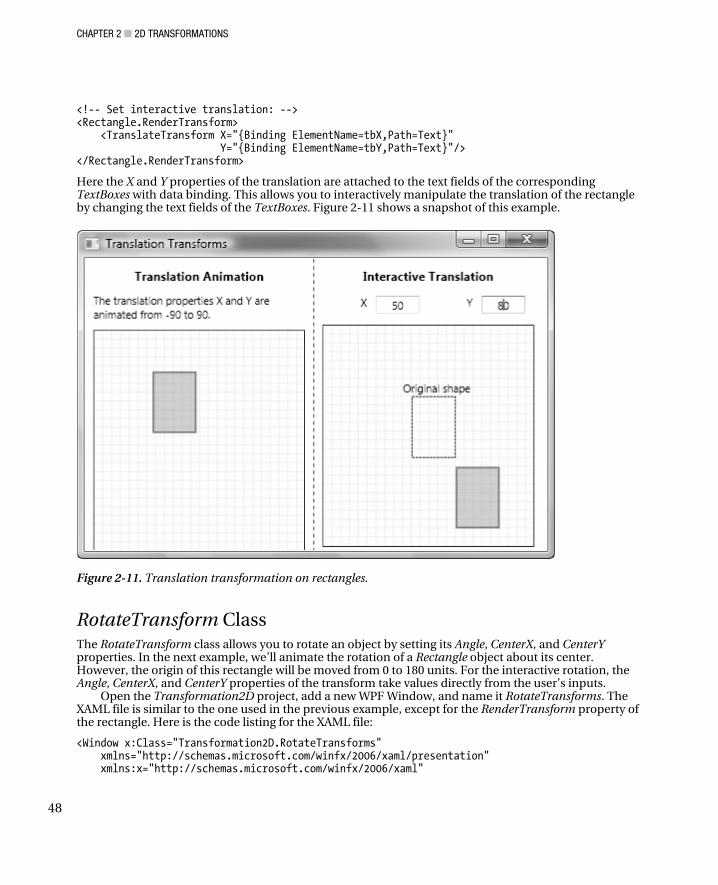
CHAPTER 2 ■ 2D TRANSFORMATIONS
48
<!-- Set interactive translation: --> <Rectangle.RenderTransform> <TranslateTransform X="{Binding ElementName=tbX,Path=Text}" Y="{Binding ElementName=tbY,Path=Text}"/> </Rectangle.RenderTransform>
Here the X and Y properties of the translation are attached to the text fields of the corresponding TextBoxes with data binding. This allows you to interactively manipulate the translation of the rectangle by changing the text fields of the TextBoxes. Figure 2-11 shows a snapshot of this example.
Figure 2-11. Translation transformation on rectangles.
RotateTransform Class The RotateTransform class allows you to rotate an object by setting its Angle, CenterX, and CenterY properties. In the next example, we’ll animate the rotation of a Rectangle object about its center. However, the origin of this rectangle will be moved from 0 to 180 units. For the interactive rotation, the Angle, CenterX, and CenterY properties of the transform take values directly from the user’s inputs.
Open the Transformation2D project, add a new WPF Window, and name it RotateTransforms. The XAML file is similar to the one used in the previous example, except for the RenderTransform property of the rectangle. Here is the code listing for the XAML file:
<Window x:Class="Transformation2D.RotateTransforms" xmlns="http://schemas.microsoft.com/winfx/2006/xaml/presentation" xmlns:x="http://schemas.microsoft.com/winfx/2006/xaml"

CHAPTER 2 ■ 2D TRANSFORMATIONS
49
Title="Rotation Transforms" Height="350" Width="480"> <Viewbox Stretch="Uniform"> <Grid Width="525" Height="340" HorizontalAlignment="Left" VerticalAlignment="Top" ShowGridLines="True"> <Grid.ColumnDefinitions> <ColumnDefinition Width="260" /> <ColumnDefinition Width="260" /> </Grid.ColumnDefinitions> <StackPanel Grid.Column="0"> <TextBlock HorizontalAlignment="Center" Margin="10,10,10,0" TextWrapping="Wrap" FontSize="14" FontWeight="Bold" Text="Rotation Animation"/> <TextBlock Margin="10,10,10,0" TextWrapping="Wrap" Text="The rotation angle is animated from 0 to 360, and the center property is animated from (-20,-50) to (120,90)."/> <Border Margin="10" BorderBrush="Black" BorderThickness="1" Background="{StaticResource MyGrayGridBrush}" HorizontalAlignment="Left"> <Canvas ClipToBounds="True" Width="240" Height="250"> <Rectangle Name="rect" Canvas.Left="100" Canvas.Top="80" Width="50" Height="70" Fill="LightCoral" Opacity="0.5" Stroke="Black" StrokeThickness="2"> <Rectangle.RenderTransform> <RotateTransform x:Name="rotate"/> </Rectangle.RenderTransform> </Rectangle> <!-- Animate the rectangle: --> <Canvas.Triggers> <EventTrigger RoutedEvent="Canvas.Loaded"> <BeginStoryboard> <Storyboard RepeatBehavior="Forever"> <DoubleAnimation Storyboard.TargetName="rotate" Storyboard.TargetProperty="Angle" From="0" To="360" Duration="0:0:5"/> <DoubleAnimation Storyboard.TargetName="rotate" Storyboard.TargetProperty="CenterX" From="-20" To="120" Duration="0:0:5"/> <DoubleAnimation Storyboard.TargetName="rotate" Storyboard.TargetProperty="CenterY" From="-50" To="90" Duration="0:0:5"/> </Storyboard> </BeginStoryboard> </EventTrigger> </Canvas.Triggers> </Canvas> </Border>

CHAPTER 2 ■ 2D TRANSFORMATIONS
50
</StackPanel> <StackPanel Grid.Column="1"> <TextBlock HorizontalAlignment="Center" Margin="10,10,10,10" TextWrapping="Wrap" FontSize="14" FontWeight="Bold" Text="Interactive Translation"/> <Grid Width="260" Height="26" HorizontalAlignment="Left" VerticalAlignment="Top" Margin="0 0 0 15"> <Grid.ColumnDefinitions> <ColumnDefinition Width="55" /> <ColumnDefinition Width="30" /> <ColumnDefinition Width="55" /> <ColumnDefinition Width="30" /> <ColumnDefinition Width="55" /> <ColumnDefinition Width="30" /> </Grid.ColumnDefinitions> <TextBlock Margin="2,2,10,2" TextAlignment="Right" Text="CenterX"/> <TextBox Name="tbCenterX" Width="30" Height="20" Grid.Column="1" TextAlignment="Center" Text="0"/> <TextBlock Margin="2,2,10,2" Grid.Column="2" TextAlignment="Right" Text="CenterY"/> <TextBox Name="tbCenterY" Width="30" Height="20" Grid.Column="3" TextAlignment="Center" Text="0"/> <TextBlock Margin="2,2,10,2" Grid.Column="4" TextAlignment="Right" Text="Angle"/> <TextBox Name="tbAngle" Width="30" Height="20" Grid.Column="5" TextAlignment="Center" Text="0"/> </Grid> <Border Margin="10" BorderBrush="Black" BorderThickness="1" Background="{StaticResource MyGrayGridBrush}" HorizontalAlignment="Left"> <Canvas ClipToBounds="True" Width="240" Height="250"> <TextBlock Canvas.Left="90" Canvas.Top="63" Text="Original shape"/> <Rectangle Canvas.Top="80" Canvas.Left="100" Width="50" Height="70" Stroke="Black" StrokeThickness="1" StrokeDashArray="3,1"/> <Rectangle Name="rect1" Canvas.Top="80" Canvas.Left="100" Width="50" Height="70" Fill="LightCoral" Opacity="0.5" Stroke="Black" StrokeThickness="2"> <!-- Set interactive rotation: --> <Rectangle.RenderTransform> <RotateTransform CenterX="{Binding ElementName=tbCenterX,Path=Text}" CenterY="{Binding ElementName=tbCenterY,Path=Text}" Angle="{Binding ElementName=tbAngle,Path=Text}"/> </Rectangle.RenderTransform> </Rectangle> </Canvas> </Border>

CHAPTER 2 ■ 2D TRANSFORMATIONS
51
</StackPanel> </Grid> </Viewbox> </Window>
You can see that the animation is performed using a storyboard that animates the CenterX, CenterY, and Angle properties of the rotation transform. For the interactive rotation transform on the rectangle in the right pane, the following XAML snippet defines its RenderTransform property:
<!-- Set interactive rotation: --> <Rectangle.RenderTransform> <RotateTransform CenterX="{Binding ElementName=tbCenterX,Path=Text}" CenterY="{Binding ElementName=tbCenterY,Path=Text}" Angle="{Binding ElementName=tbAngle,Path=Text}"/> </Rectangle.RenderTransform>
Here the Angle, CenterX, and CenterY properties of the rotation transform are attached to the text fields of the corresponding TextBoxes with data binding. This allows you to interactively manipulate the rotation transform on the rectangle by changing the text fields of the TextBoxes.
Figure 2-12 shows the result of running this application.
Figure 2-12. Rotation transform on rectangles.
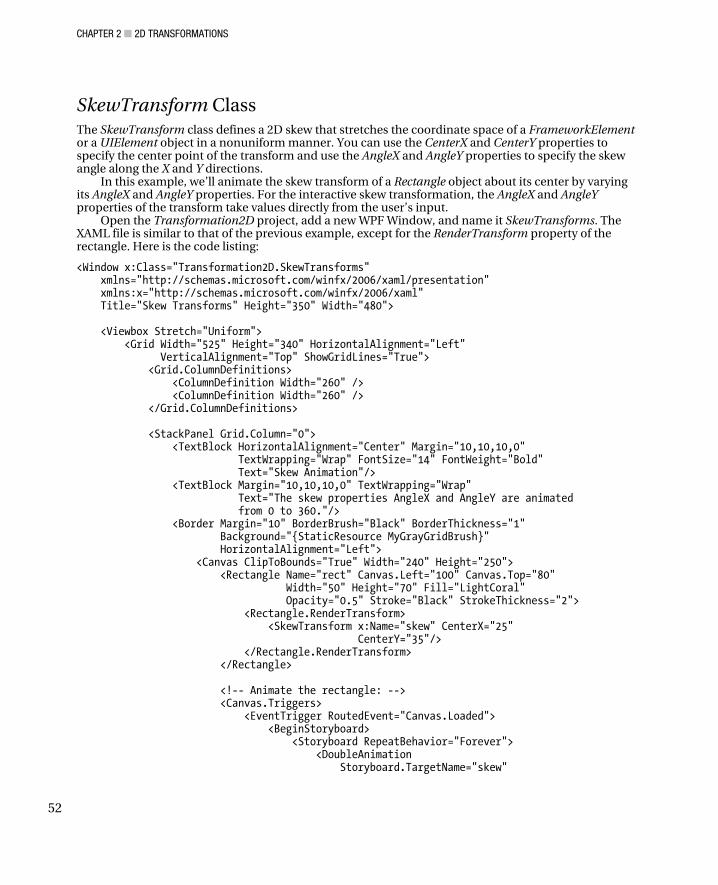
CHAPTER 2 ■ 2D TRANSFORMATIONS
52
SkewTransform Class The SkewTransform class defines a 2D skew that stretches the coordinate space of a FrameworkElement or a UIElement object in a nonuniform manner. You can use the CenterX and CenterY properties to specify the center point of the transform and use the AngleX and AngleY properties to specify the skew angle along the X and Y directions.
In this example, we’ll animate the skew transform of a Rectangle object about its center by varying its AngleX and AngleY properties. For the interactive skew transformation, the AngleX and AngleY properties of the transform take values directly from the user’s input.
Open the Transformation2D project, add a new WPF Window, and name it SkewTransforms. The XAML file is similar to that of the previous example, except for the RenderTransform property of the rectangle. Here is the code listing:
<Window x:Class="Transformation2D.SkewTransforms" xmlns="http://schemas.microsoft.com/winfx/2006/xaml/presentation" xmlns:x="http://schemas.microsoft.com/winfx/2006/xaml" Title="Skew Transforms" Height="350" Width="480"> <Viewbox Stretch="Uniform"> <Grid Width="525" Height="340" HorizontalAlignment="Left" VerticalAlignment="Top" ShowGridLines="True"> <Grid.ColumnDefinitions> <ColumnDefinition Width="260" /> <ColumnDefinition Width="260" /> </Grid.ColumnDefinitions> <StackPanel Grid.Column="0"> <TextBlock HorizontalAlignment="Center" Margin="10,10,10,0" TextWrapping="Wrap" FontSize="14" FontWeight="Bold" Text="Skew Animation"/> <TextBlock Margin="10,10,10,0" TextWrapping="Wrap" Text="The skew properties AngleX and AngleY are animated from 0 to 360."/> <Border Margin="10" BorderBrush="Black" BorderThickness="1" Background="{StaticResource MyGrayGridBrush}" HorizontalAlignment="Left"> <Canvas ClipToBounds="True" Width="240" Height="250"> <Rectangle Name="rect" Canvas.Left="100" Canvas.Top="80" Width="50" Height="70" Fill="LightCoral" Opacity="0.5" Stroke="Black" StrokeThickness="2"> <Rectangle.RenderTransform> <SkewTransform x:Name="skew" CenterX="25" CenterY="35"/> </Rectangle.RenderTransform> </Rectangle> <!-- Animate the rectangle: --> <Canvas.Triggers> <EventTrigger RoutedEvent="Canvas.Loaded"> <BeginStoryboard> <Storyboard RepeatBehavior="Forever"> <DoubleAnimation Storyboard.TargetName="skew"

CHAPTER 2 ■ 2D TRANSFORMATIONS
53
Storyboard.TargetProperty="AngleX" From="0" To="360" Duration="0:0:10"/> <DoubleAnimation Storyboard.TargetName="skew" Storyboard.TargetProperty="AngleY" From="0" To="360" Duration="0:0:10"/> </Storyboard> </BeginStoryboard> </EventTrigger> </Canvas.Triggers> </Canvas> </Border> </StackPanel> <StackPanel Grid.Column="1"> <TextBlock HorizontalAlignment="Center" Margin="10,10,10,10" TextWrapping="Wrap" FontSize="14" FontWeight="Bold" Text="Interactive Translation"/> <Grid Width="260" Height="26" HorizontalAlignment="Left" VerticalAlignment="Top"> <Grid.ColumnDefinitions> <ColumnDefinition Width="70" /> <ColumnDefinition Width="50" /> <ColumnDefinition Width="60" /> <ColumnDefinition Width="50" /> </Grid.ColumnDefinitions> <TextBlock Margin="2,2,10,2" TextAlignment="Right" Text="AngleX"/> <TextBox Name="tbAngleX" Width="50" Height="20" Grid.Column="1" TextAlignment="Center" Text="0"/> <TextBlock Margin="2,2,10,2" Grid.Column="2" TextAlignment="Right" Text="AngleY"/> <TextBox Name="tbAngleY" Width="50" Height="20" Grid.Column="3" TextAlignment="Center" Text="0"/> </Grid> <Border Margin="10" BorderBrush="Black" BorderThickness="1" Background="{StaticResource MyGrayGridBrush}" HorizontalAlignment="Left"> <Canvas ClipToBounds="True" Width="240" Height="250"> <TextBlock Canvas.Left="90" Canvas.Top="63" Text="Original shape"/> <Rectangle Canvas.Top="80" Canvas.Left="100" Width="50" Height="70" Stroke="Black" StrokeThickness="1" StrokeDashArray="3,1"/> <Rectangle Name="rect1" Canvas.Top="80" Canvas.Left="100" Width="50" Height="70" Fill="LightCoral" Opacity="0.5" Stroke="Black" StrokeThickness="2"> <!-- Set interactive skew: --> <Rectangle.RenderTransform> <SkewTransform CenterX="25" CenterY="35"

CHAPTER 2 ■ 2D TRANSFORMATIONS
54
AngleX="{Binding ElementName=tbAngleX,Path=Text}" AngleY="{Binding ElementName=tbAngleY,Path=Text}"/> </Rectangle.RenderTransform> </Rectangle> </Canvas> </Border> </StackPanel> </Grid> </Viewbox> </Window>
Here, the animation is performed using a storyboard that animates the AngleX and AngleY
properties of the skew transform. For the interactive skew transform on the rectangle in the right pane, the following XAML snippet defines its RenderTransform property:
<!-- Set interactive skew: --> <Rectangle.RenderTransform> <SkewTransform CenterX="25" CenterY="35" AngleX="{Binding ElementName=tbAngleX,Path=Text}" AngleY="{Binding ElementName=tbAngleY,Path=Text}"/> </Rectangle.RenderTransform>
Here the AngleX and AngleY properties of the skew transform are attached to the text fields of the corresponding TextBoxes with data binding. This allows you to interactively manipulate the skew transform on the rectangle by changing the text fields of the TextBoxes.
Figure 2-13 shows a snapshot of this example.
Figure 2-13. Skew tranformation on rectangles.

CHAPTER 2 ■ 2D TRANSFORMATIONS
55
Composite Transforms You can apply the TransformGroup class, which allows you to combine any of the preceding transforms, to any UIElement or FrameworkElement object. In other words, you can apply to a graphics object a composite transform that consists of any number of transforms. The TransformGroup class derived from the Transform base class represents a combining transform that contains a collection of Transforms.
You can represent various transforms using a simple C# code snippet. For example, to scale a rectangle two times in the X direction and three times in the Y direction, you can use a ScaleTransform object:
Rectangle.RenderTransformation = new ScaleTransformation(2, 3);
To move the rectangle 100 units in the X direction and –100 units in the Y direction, you can simply write:
Rectangle.RenderTransform = new TranslateTransform(100, - 100);
To rotate the rectangle 45 degrees, you can create a new RotateTransform object and set the angle to 45:
Rectangle.RenderTransform = new RotateTransform(45);
To skew an element 30 degrees in the X direction and 45 degrees in the Y direction, you can use a SkewTransform:
Rectangle.RenderTransform = new SkewTransform(30, 45);
Finally, if you want to apply all of these transforms to this rectangle, you can use a TransformGroup:
TransformGroup tg = new TransformGroup(); tg.Children.Add(ScaleTransform(2, 3)); tg.Children.Add(TranslateTransform(100, -100)); tg.Children.Add(RotateTransform(45)); tg.Children.Add(SkewTransform(30, 45)); Rectangle.RenderTransform = tg;
Let’s consider an example that illustrates how to use the TransformGroup class in a WPF application. In this example, you’ll use a composite transform that contains a scale transform and a rotation transform. You’ll apply this composite transform to a rectangle object (a square in this case) about its center. You’ll animate the dependency properties of both the scale and rotation transformations.
Open the Transformation2D project, add a new WPF Window, and name it CombineTransforms. Here, we’ll only consider the animation of the combined transform. The following is the XAML file for this example:
<Window x:Class="Transformation2D.CombineTransforms" xmlns="http://schemas.microsoft.com/winfx/2006/xaml/presentation" xmlns:x="http://schemas.microsoft.com/winfx/2006/xaml" Title="Combining Transforms" Height="330" Width="300"> <Viewbox Stretch="Uniform"> <StackPanel> <TextBlock HorizontalAlignment="Center" Margin="10,10,10,0" TextWrapping="Wrap" FontSize="14" FontWeight="Bold" Text="Animation of Combining Transform"/> <Border Margin="10" BorderBrush="Black" BorderThickness="1" Background="{StaticResource MyGrayGridBrush}"

CHAPTER 2 ■ 2D TRANSFORMATIONS
56
HorizontalAlignment="Left"> <Canvas ClipToBounds="True" Width="340" Height="320"> <Ellipse Canvas.Left="165" Canvas.Top="145" Width="10" Height="10" Fill="Red"/> <Rectangle Canvas.Left="120" Canvas.Top="100" Width="100" Height="100" Fill="LightCoral" Opacity="0.5" Stroke="Black" StrokeThickness="2"> <Rectangle.RenderTransform> <TransformGroup> <ScaleTransform x:Name="scale" CenterX="50" CenterY="50" /> <RotateTransform x:Name="rotate" CenterX="50" CenterY="50"/> </TransformGroup> </Rectangle.RenderTransform> </Rectangle> <!-- Animate the shape: --> <Canvas.Triggers> <EventTrigger RoutedEvent="Canvas.Loaded"> <BeginStoryboard> <Storyboard RepeatBehavior="Forever" AutoReverse="True"> <DoubleAnimation Storyboard.TargetName="scale" Storyboard.TargetProperty="ScaleX" From="0" To="3" Duration="0:0:5"/> <DoubleAnimation Storyboard.TargetName="scale" Storyboard.TargetProperty="ScaleY" From="0" To="3" Duration="0:0:5"/> <DoubleAnimation Storyboard.TargetName="rotate" Storyboard.TargetProperty="Angle" From="0" To="360" Duration="0:0:5"/> </Storyboard> </BeginStoryboard> </EventTrigger> </Canvas.Triggers> </Canvas> </Border> </StackPanel> </Viewbox> </Window>
Here, we specify the rectangle’s RenderTransform property using a TransformGroup. Within this TransformGroup, we define two transforms: a ScaleTransform named “scale” and a RotateTransform named “rotate.” Both transforms are animated using a StoryBoard. Within the StoryBoard, we first animate the ScaleX and ScaleY dependency properties of the ScaleTransform. Then we perform the rotation animation on the rectangle by animating the Angle property from 0 to 360 degrees.
This example produces the results shown in Figure 2-14.
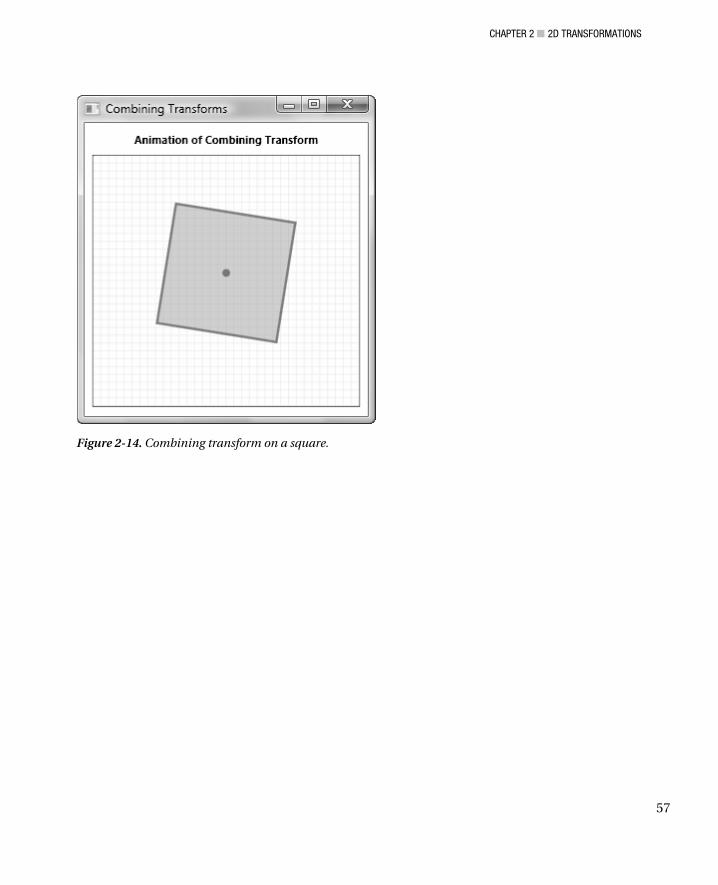
CHAPTER 2 ■ 2D TRANSFORMATIONS
57
Figure 2-14. Combining transform on a square.

CHAPTER 2 ■ 2D TRANSFORMATIONS
58

C H A P T E R 3
■ ■ ■
59
WPF Graphics Basics in 2D
As mentioned in Chapter 1, WPF provides a unified graphics platform that allows you to easily create a variety of user interfaces and graphics objects in your applications. In the previous chapter, we discussed various transformation operations on graphics objects in WPF. This chapter begins by describing graphics coordinate systems used in WPF and shows you several different coordinate systems you can use to make graphics programming easier. Then I’ll show you how to create basic 2D shapes in WPF applications using WPF’s built-in Shape class and your own custom shapes.
2D Coordinate Systems in WPF When you create graphic object in WPF, you must determine where the graphics object or drawing will be displayed. To do this, you need to understand how WPF measures coordinates of the graphics object. Each point on a WPF window or page has an X and a Y coordinate. In the following sections, we’ll discuss various coordinate systems and their relationships.
Default Coordinates For 2D graphics, the WPF coordinate system places the origin in the upper-left corner of the rendering area. In the 2D space, the positive X axis points to the right, and the positive Y axis points downward, as shown in Figure 3-1.
Figure 3-1. Default coordinate system in WPF

CHAPTER 3 ■ WPF GRAPHICS BASICS IN 2D
60
All coordinates and sizes in the default WPF system are measured in units of 96 dots per inch (DPI), called device-independent pixels. In this system, you can create adaptive layouts to deal with different resolutions, which make sure your controls and graphics objects stretch accordingly when the window is stretched.
You can define the rendering area in WPF using layout elements that derive from the Panel class, such as Canvas, DockPanel, Grid, StackPanel, VirtualizingStatckPanel, and WrapPanel. However, it is also possible to use a custom layout component for the rendering area by overriding the default behavior of any of these layout elements.
Let’s look at an example and see how this can be achieved. Start up Microsoft Visual Studio 2008, create a new WPF Windows project, and name it GraphicsBasics. Add a new WPF Window to the project and name it LineInDefaultSystem. Add a Canvas element to the application. The Canvas control is particularly useful when you need to place graphics and other drawing elements at absolute positions. What’s interesting is that Canvas elements can be nested. This means you can prepare part of a drawing in a canvas and then insert that entire drawing as a single element into another canvas. You can also apply various transformations, such as scaling and rotation, directly to the canvas.
Now you can draw a line from Point (0, 0) to Point (100, 100) on the canvas, using the default units of device-independent pixels, with the following XAML file:
<Window x:Class="GraphicsBasics.LineInDefaultSystem" xmlns="http://schemas.microsoft.com/winfx/2006/xaml/presentation" xmlns:x="http://schemas.microsoft.com/winfx/2006/xaml" Title="Line in Default System" Height="300" Width="300"> <Canvas Height="300" Width="300"> <Line X1="0" Y1="0" X2="100" Y2="100" Stroke="Black" StrokeThickness="2" /> </Canvas> </Window>
Figure 3-2 shows the results of running this example.
Figure 3-2. Drawing a line from (0, 0) to (100, 100) on a canvas

CHAPTER 3 ■ WPF GRAPHICS BASICS IN 2D
61
It is also possible to use other units to create graphics objects. WPF provides four different units of measure:
• px: is the default device-independent unit (1/96 inch per unit).
• in: is inches; 1in = 96 px.
• cm: is centimeters; 1cm = (96/2.54) px.
• pt: is points; 1pt = (96/72) px.
You can create graphics objects and UIs using either one of the units of measure just listed or mixed units. For example, the coordinates for the starting and ending points of the line can be specified in pixels (px), centimeters (cm), inches (in), or points (pt). If you omit the unit (such as in the StrokeThickness attribute), the default device-independent pixels will be used.
Replacing the code inside the canvas of the previous example with the following piece of XAML code generates the output shown in Figure 3-3:
<Canvas Height="300" Width="300"> <Line X1="0.5in" Y1="2.0cm" X2="150" Y2="80pt" Stroke="Blue" StrokeThickness="0.1cm"/> </Canvas>
Figure 3-3. Drawing a line on a canvas using different units of measure
Also note the decimal values in the preceding XAML code. All coordinates in WPF are double precision values. This allows you to create device-independent applications easily by using real-world units; the WPF rendering engine will make sure that everything is rendered in the correct size, regardless of whether you are drawing to the screen or the printer.

CHAPTER 3 ■ WPF GRAPHICS BASICS IN 2D
62
Custom Coordinates In addition to the default WPF coordinate system discussed in the previous section, a WPF
application can define its own coordinate system. For example, 2D charting applications usually use a coordinate system in which the Y axis points from bottom to top, as illustrated in Figure 3-4.
Figure 3-4. A custom coordinate system
This system can easily be created in WPF by performing corresponding transformations directly to the canvas, as discussed in the previous chapter. Let’s consider an example.
Add a new WPF Window to the project GraphicsBasics and name it LineInCustomSystem. Here is the XAML file for this example:
<Window x:Class=" GraphicsBasics.LineInCustomSystem" xmlns="http://schemas.microsoft.com/winfx/2006/xaml/presentation" xmlns:x="http://schemas.microsoft.com/winfx/2006/xaml" Title="Line in Custom System" Height="240" Width="220"> <Border BorderBrush="Black" BorderThickness="1" Height="200" Width="200"> <Canvas Height="200" Width="200"> <Canvas.RenderTransform> <TransformGroup> <ScaleTransform ScaleY="-1" /> <TranslateTransform Y="200" /> </TransformGroup> </Canvas.RenderTransform> <Line X1="0" Y1="0" X2="100" Y2="100" Stroke="Black" StrokeThickness="2" /> </Canvas> </Border> </Window>
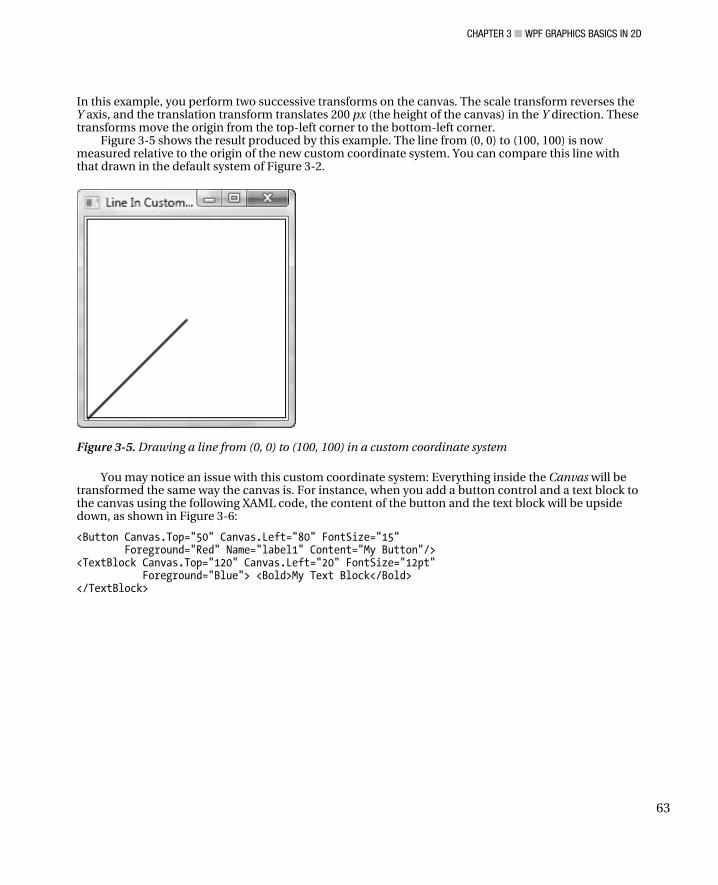
CHAPTER 3 ■ WPF GRAPHICS BASICS IN 2D
63
In this example, you perform two successive transforms on the canvas. The scale transform reverses the Y axis, and the translation transform translates 200 px (the height of the canvas) in the Y direction. These transforms move the origin from the top-left corner to the bottom-left corner.
Figure 3-5 shows the result produced by this example. The line from (0, 0) to (100, 100) is now measured relative to the origin of the new custom coordinate system. You can compare this line with that drawn in the default system of Figure 3-2.
Figure 3-5. Drawing a line from (0, 0) to (100, 100) in a custom coordinate system
You may notice an issue with this custom coordinate system: Everything inside the Canvas will be transformed the same way the canvas is. For instance, when you add a button control and a text block to the canvas using the following XAML code, the content of the button and the text block will be upside down, as shown in Figure 3-6:
<Button Canvas.Top="50" Canvas.Left="80" FontSize="15" Foreground="Red" Name="label1" Content="My Button"/> <TextBlock Canvas.Top="120" Canvas.Left="20" FontSize="12pt" Foreground="Blue"> <Bold>My Text Block</Bold> </TextBlock>
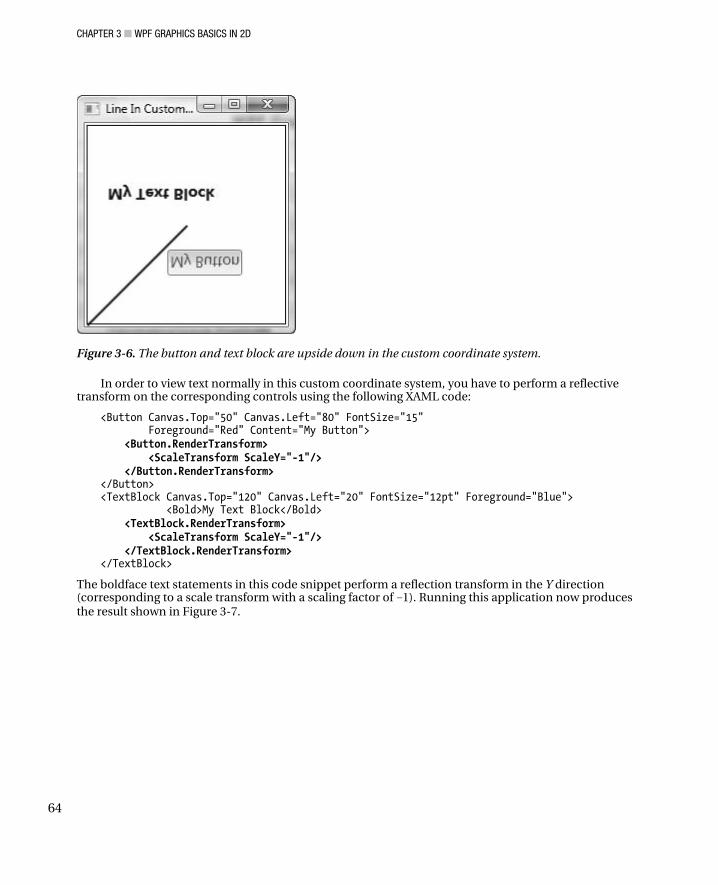
CHAPTER 3 ■ WPF GRAPHICS BASICS IN 2D
64
Figure 3-6. The button and text block are upside down in the custom coordinate system.
In order to view text normally in this custom coordinate system, you have to perform a reflective transform on the corresponding controls using the following XAML code:
<Button Canvas.Top="50" Canvas.Left="80" FontSize="15" Foreground="Red" Content="My Button"> <Button.RenderTransform> <ScaleTransform ScaleY="-1"/> </Button.RenderTransform> </Button> <TextBlock Canvas.Top="120" Canvas.Left="20" FontSize="12pt" Foreground="Blue"> <Bold>My Text Block</Bold> <TextBlock.RenderTransform> <ScaleTransform ScaleY="-1"/> </TextBlock.RenderTransform> </TextBlock>
The boldface text statements in this code snippet perform a reflection transform in the Y direction (corresponding to a scale transform with a scaling factor of -1). Running this application now produces the result shown in Figure 3-7.

CHAPTER 3 ■ WPF GRAPHICS BASICS IN 2D
65
Figure 3-7. The button and text block in the custom coordinate system after reflection
You can change the apparent size and location of the graphics objects and user controls on a screen using this custom coordinate system, through a process called Zooming or Panning. You can achieve Zooming and Panning via scaling and translation transforms.
Add a new WPF Window to the project GraphicsBasics and call it ScaleInCustomSystem. Add a StackPanel element to the application, add a Slider control and a Border control to the content of the StackPanel, and add a canvas to the Border control. Finally, create a line and a rectangle object on the canvas control. Here is the XAML file for this example:
<Window x:Class=" GraphicsBasics.ScaleInCustomSystem" xmlns="http://schemas.microsoft.com/winfx/2006/xaml/presentation" xmlns:x="http://schemas.microsoft.com/winfx/2006/xaml" Title="Scale In Custom System" Height="310" Width="260"> <StackPanel Height="280" Width="250"> <Border BorderBrush="Black" BorderThickness="1" Height="200" Width="200" Margin="20"> <Canvas Height="200" Width="200"> <Canvas.RenderTransform> <TransformGroup> <ScaleTransform ScaleY="-1" /> <TranslateTransform Y="200" /> </TransformGroup> </Canvas.RenderTransform> <Line X1="0" Y1="0" X2="80" Y2="80" Stroke="Black" StrokeThickness="2"> <Line.RenderTransform> <ScaleTransform ScaleX="{Binding ElementName=slider,Path=Value}" ScaleY="{Binding ElementName=slider,Path=Value}"/> </Line.RenderTransform> </Line>

CHAPTER 3 ■ WPF GRAPHICS BASICS IN 2D
66
<Rectangle Canvas.Top="100" Canvas.Left="30" Width="80" Height="40" Stroke="DarkRed" StrokeThickness="3"> <Rectangle.RenderTransform> <ScaleTransform ScaleX="{Binding ElementName=slider,Path=Value}" ScaleY="{Binding ElementName=slider,Path=Value}"/> </Rectangle.RenderTransform> </Rectangle> </Canvas> </Border> <Slider Name="slider" Minimum="0" Maximum="3" Value="1" TickPlacement="BottomRight" TickFrequency="0.2" IsSnapToTickEnabled="True"/> </StackPanel> </Window>
Here, you bind the scaling factors ScaleX and ScaleY of the line and rectangle to the value of the slider. The value of the slider varies from 0 to 3, meaning that the scaling factor for both the line and the rectangle changes in a range of [0, 3]. When the user moves the slider with the mouse, the dimension of the line and the rectangle will change accordingly.
Figure 3-8 shows the results of running this example. You can zoom in or zoom out by moving the slider with your mouse. When you increase the scaling factor, however, you might obtain unexpected results, such as those shown in the figure. Namely, the graphics objects are extended outside of the canvas1 control.
Figure 3-8. Scaling the line and rectangle objects

CHAPTER 3 ■ WPF GRAPHICS BASICS IN 2D
67
This can easily be fixed by specifying the ClipToBounds property of the canvas to true:
<Canvas Height="200" Width="200" ClipToBounds="True">
This will produce the results shown in Figure 3-9. You can clearly see the difference between Figure 3-8 and Figure 3-9.
Figure 3-9. Drawing line and rectangle objects inside of the canvas control
There are still issues associated with this custom coordinate system. First, the scaling affects not only the shape of the graphics objects but also the StrokeThickness, which may be undesirable for some applications. For example, for charting applications, we want only the shape of the graphics or the line length to vary with the scaling factor, not the StrokeThickness itself.
Another issue is the unit of the measure used in the coordinate system, in which the default units are utilized. In real-world applications, real-world units are usually involved. For example, it is impossible to draw a line with a length of 100 miles on the screen in the current coordinate system. In the following section, we’ll develop a new custom coordinate system that can be used in 2D chart applications.
Custom Coordinates for 2D Charts The custom coordinate system used in 2D chart applications must satisfy the following conditions: It must be independent of the unit of the real-world graphics objects, and its Y axis must point from bottom to top, as it does in most chart applications. This custom coordinate system is illustrated in Figure 3-10.

CHAPTER 3 ■ WPF GRAPHICS BASICS IN 2D
68
Figure 3-10. Custom coordinate system for 2D chart applications
The real-world X-Y coordinate system is defined within a rendering area. You can create such a coordinate system using a custom panel control by overriding its MeasureOverride and ArrangeOverride methods. Each method returns the size data needed to position and render child elements. This is a standard method for creating custom coordinate systems. Instead of creating a custom panel control, here we’ll construct this coordinate system using a different approach, based on direct coding.
Add a new WPF Window to the project GraphicsBasics and name it Chart2DSystem. The following is the XAML file for this example:
<Window x:Class="GraphicsBasics.Chart2DSystem" xmlns="http://schemas.microsoft.com/winfx/2006/xaml/presentation" xmlns:x="http://schemas.microsoft.com/winfx/2006/xaml" Title="Chart2D Coordinate System" Height="420" Width="360"> <Viewbox Stretch="Uniform"> <StackPanel Height="420" Width="360" Margin="0,10,0,10"> <Border BorderBrush="Gray" BorderThickness="1"> <Canvas x:Name="chartCanvas" ClipToBounds="True" Width="300" Height="250" Margin="30,30,30,30"/> </Border> <Grid Width="340" Height="100" HorizontalAlignment="Left" VerticalAlignment="Top" Margin="0,10,0,0"> <Grid.ColumnDefinitions> <ColumnDefinition Width="60*" /> <ColumnDefinition Width="110*" /> <ColumnDefinition Width="60*"/> <ColumnDefinition Width="110*" /> </Grid.ColumnDefinitions> <Grid.RowDefinitions> <RowDefinition Height="Auto" />

CHAPTER 3 ■ WPF GRAPHICS BASICS IN 2D
69
<RowDefinition Height="Auto" /> <RowDefinition Height="Auto" /> </Grid.RowDefinitions> <TextBlock Grid.Column="0" Grid.Row="0" Margin="20,5,10,5">XMin</TextBlock> <TextBox Name="tbXMin" Grid.Column="1" Grid.Row="0" TextAlignment="Center">0</TextBox> <TextBlock Grid.Column="2" Grid.Row="0" Margin="20,5,10,5">XMax</TextBlock> <TextBox Name="tbXMax" Grid.Column="3" Grid.Row="0" TextAlignment="Center">10</TextBox> <TextBlock Grid.Column="0" Grid.Row="1" Margin="20,5,10,5">YMin</TextBlock> <TextBox Name="tbYMin" Grid.Column="1" Grid.Row="1" TextAlignment="Center" >0</TextBox> <TextBlock Grid.Column="2" Grid.Row="1" Margin="20,5,10,5">YMax</TextBlock> <TextBox Name="tbYMax" Grid.Column="3" Grid.Row="1" TextAlignment="Center">10</TextBox> <Button Click="btnApply_Click" Margin="40,20,20,0" Height="25" Grid.ColumnSpan="2" Grid.Column="0" Grid.Row="2">Apply </Button> <Button Click="btnClose_Click" Margin="40,20,20,0" Height="25" Grid.ColumnSpan="2" Grid.Column="2" Grid.Row="2" >Close </Button> </Grid> </StackPanel> </Viewbox> </Window>
This XAML file places a Viewbox control as the topmost element and sets its Stretch property to UniForm, which will preserve the aspect ratio of the child elements when the window gets resized. Otherwise, the Stretch property can be set to Fill, which disregards the aspect ratio. A great advantage of the Viewbox object is that everything inside of it is scalable.
The graphics objects or drawings will be created on a Canvas control, called chartCanvas. The Border element as the parent of the chartCanvas serves as the border of the rendering area. The other UI elements will be used to control the appearance of the graphics.
Here is the corresponding C# code-behind file:
using System; using System.Collections.Generic; using System.Windows; using System.Windows.Controls; using System.Windows.Media; using System.Windows.Shapes; namespace GraphicsBasics { public partial class Chart2DSystem : Window { private double xMin = 0.0;

CHAPTER 3 ■ WPF GRAPHICS BASICS IN 2D
70
private double xMax = 10.0; private double yMin = 0.0; private double yMax = 10.0; private Line line1; private Polyline polyline1; public Chart2DSystem() { InitializeComponent(); AddGraphics(); } private void AddGraphics() { line1 = new Line(); line1.X1 = XNormalize(2.0); line1.Y1 = YNormalize(4.0); line1.X2 = XNormalize(8.0); line1.Y2 = YNormalize(10.0); line1.Stroke = Brushes.Blue; line1.StrokeThickness = 2; chartCanvas.Children.Add(line1); polyline1 = new Polyline(); polyline1.Points.Add(new Point(XNormalize(8), YNormalize(8))); polyline1.Points.Add(new Point(XNormalize(6), YNormalize(6))); polyline1.Points.Add(new Point(XNormalize(6), YNormalize(4))); polyline1.Points.Add(new Point(XNormalize(4), YNormalize(4))); polyline1.Points.Add(new Point(XNormalize(4), YNormalize(6))); polyline1.Points.Add(new Point(XNormalize(6), YNormalize(6))); polyline1.Stroke = Brushes.Red; polyline1.StrokeThickness = 5; chartCanvas.Children.Add(polyline1); } private double XNormalize(double x) { double result = (x - xMin) * chartCanvas.Width / (xMax - xMin); return result; } private double YNormalize(double y) { double result = chartCanvas.Height - (y - yMin)* chartCanvas.Height / (yMax - yMin); return result; } private void btnClose_Click(object sender, EventArgs e) { this.Close(); }
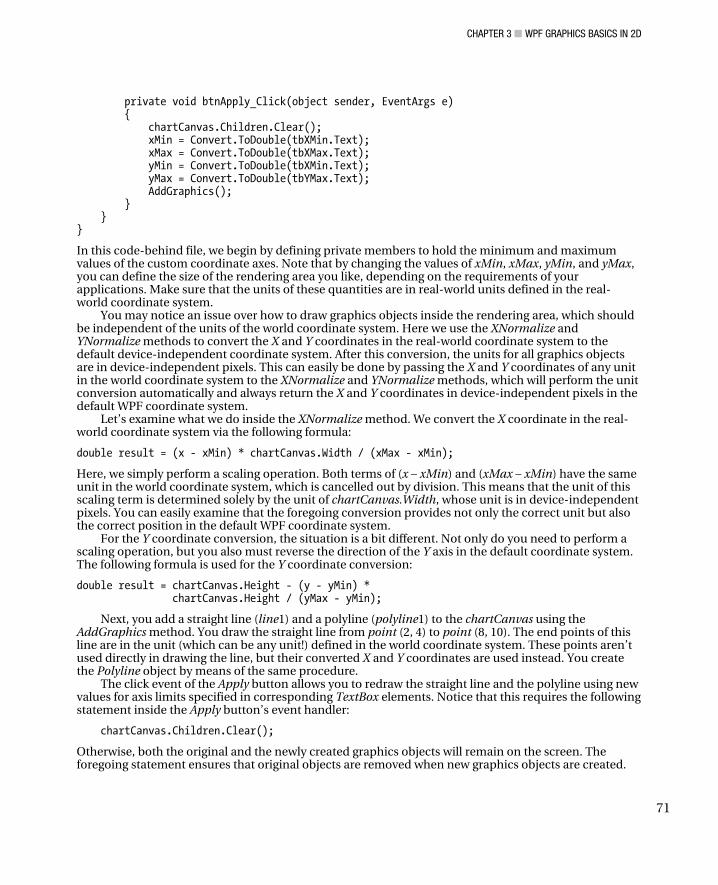
CHAPTER 3 ■ WPF GRAPHICS BASICS IN 2D
71
private void btnApply_Click(object sender, EventArgs e) { chartCanvas.Children.Clear(); xMin = Convert.ToDouble(tbXMin.Text); xMax = Convert.ToDouble(tbXMax.Text); yMin = Convert.ToDouble(tbXMin.Text); yMax = Convert.ToDouble(tbYMax.Text); AddGraphics(); } } }
In this code-behind file, we begin by defining private members to hold the minimum and maximum values of the custom coordinate axes. Note that by changing the values of xMin, xMax, yMin, and yMax, you can define the size of the rendering area you like, depending on the requirements of your applications. Make sure that the units of these quantities are in real-world units defined in the real-world coordinate system.
You may notice an issue over how to draw graphics objects inside the rendering area, which should be independent of the units of the world coordinate system. Here we use the XNormalize and YNormalize methods to convert the X and Y coordinates in the real-world coordinate system to the default device-independent coordinate system. After this conversion, the units for all graphics objects are in device-independent pixels. This can easily be done by passing the X and Y coordinates of any unit in the world coordinate system to the XNormalize and YNormalize methods, which will perform the unit conversion automatically and always return the X and Y coordinates in device-independent pixels in the default WPF coordinate system.
Let’s examine what we do inside the XNormalize method. We convert the X coordinate in the real-world coordinate system via the following formula:
double result = (x - xMin) * chartCanvas.Width / (xMax - xMin);
Here, we simply perform a scaling operation. Both terms of (x – xMin) and (xMax – xMin) have the same unit in the world coordinate system, which is cancelled out by division. This means that the unit of this scaling term is determined solely by the unit of chartCanvas.Width, whose unit is in device-independent pixels. You can easily examine that the foregoing conversion provides not only the correct unit but also the correct position in the default WPF coordinate system.
For the Y coordinate conversion, the situation is a bit different. Not only do you need to perform a scaling operation, but you also must reverse the direction of the Y axis in the default coordinate system. The following formula is used for the Y coordinate conversion:
double result = chartCanvas.Height - (y - yMin) * chartCanvas.Height / (yMax - yMin);
Next, you add a straight line (line1) and a polyline (polyline1) to the chartCanvas using the AddGraphics method. You draw the straight line from point (2, 4) to point (8, 10). The end points of this line are in the unit (which can be any unit!) defined in the world coordinate system. These points aren’t used directly in drawing the line, but their converted X and Y coordinates are used instead. You create the Polyline object by means of the same procedure.
The click event of the Apply button allows you to redraw the straight line and the polyline using new values for axis limits specified in corresponding TextBox elements. Notice that this requires the following statement inside the Apply button’s event handler:
chartCanvas.Children.Clear();
Otherwise, both the original and the newly created graphics objects will remain on the screen. The foregoing statement ensures that original objects are removed when new graphics objects are created.

CHAPTER 3 ■ WPF GRAPHICS BASICS IN 2D
72
Figure 3-11 shows the result of running this example. From this window, you can change the appearance of the graphics objects by changing the values of xMin, XMax, Ymin, and yMax and then clicking the Apply button.
Figure 3-11. Drawing a line and a polyline in the custom coordinate system
2D Viewport A graphics object can be considered to be defined in its own coordinate system, which is some abstract place with boundaries. For example, suppose you want to create a simple X-Y chart that plots Y values from 50 to 100 over an X-data range from 0 to 10. You can work in a coordinate system space with 0 ≤ X ≤ 10 and 50 ≤ Y ≤ 100. This space is called the world coordinate system.
In practice, you usually aren’t interested in the entire graphic, but only a portion of it. Thus, you can define the portion of interest as a specific area in the world coordinate system. This area of interest is called the “Window.” In order to draw graphics objects on the screen, you need to map this “Window” to the default WPF coordinate system. We call this mapped “Window” in the default coordinate system a 2D viewport. The concept of the window and viewport in 2D space is illustrated in Figure 3-12.
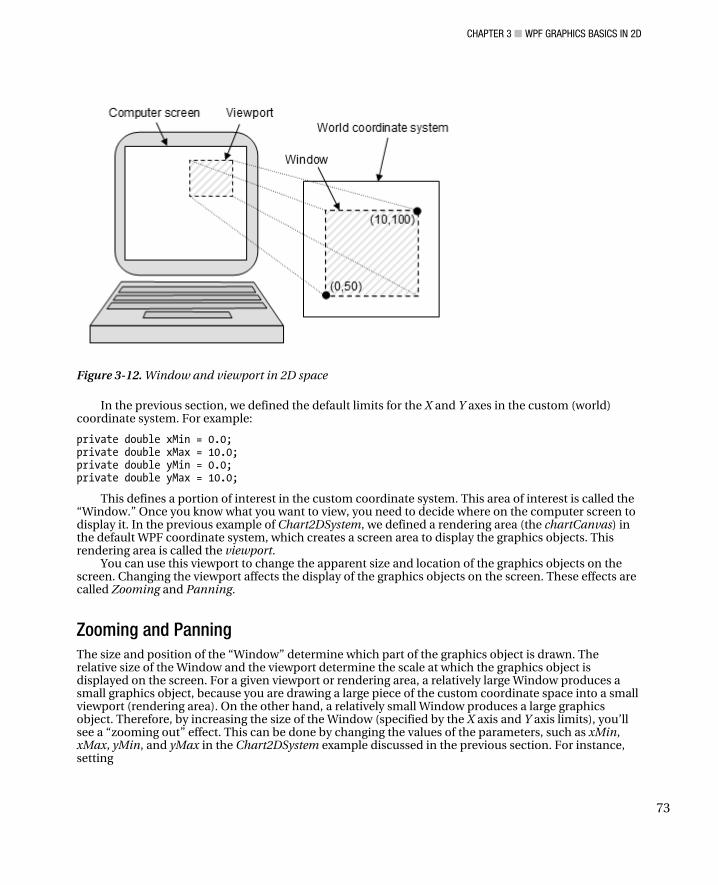
CHAPTER 3 ■ WPF GRAPHICS BASICS IN 2D
73
Figure 3-12. Window and viewport in 2D space
In the previous section, we defined the default limits for the X and Y axes in the custom (world) coordinate system. For example:
private double xMin = 0.0; private double xMax = 10.0; private double yMin = 0.0; private double yMax = 10.0;
This defines a portion of interest in the custom coordinate system. This area of interest is called the “Window.” Once you know what you want to view, you need to decide where on the computer screen to display it. In the previous example of Chart2DSystem, we defined a rendering area (the chartCanvas) in the default WPF coordinate system, which creates a screen area to display the graphics objects. This rendering area is called the viewport.
You can use this viewport to change the apparent size and location of the graphics objects on the screen. Changing the viewport affects the display of the graphics objects on the screen. These effects are called Zooming and Panning.
Zooming and Panning The size and position of the “Window” determine which part of the graphics object is drawn. The relative size of the Window and the viewport determine the scale at which the graphics object is displayed on the screen. For a given viewport or rendering area, a relatively large Window produces a small graphics object, because you are drawing a large piece of the custom coordinate space into a small viewport (rendering area). On the other hand, a relatively small Window produces a large graphics object. Therefore, by increasing the size of the Window (specified by the X axis and Y axis limits), you’ll see a “zooming out” effect. This can be done by changing the values of the parameters, such as xMin, xMax, yMin, and yMax in the Chart2DSystem example discussed in the previous section. For instance, setting

CHAPTER 3 ■ WPF GRAPHICS BASICS IN 2D
74
xMin = -10; xMax = 20; yMin = 0; yMax = 20;
and clicking the Apply button will generate the results shown in Figure 3-13.
Figure 3-13. Changing both the size and the location of the graphics objects by increasing the size of the
window, resulting in a “zoom out” effect
On the other hand, if you decrease the Window size, the objects will appear larger on the screen; you would then have a “zoom in” effect. Change the parameters of your axis limits to the following:
xMin = 2; xMax = 7; yMin = 2; yMax = 7;
You will get the result shown in Figure 3-14 when you click the Apply button.

CHAPTER 3 ■ WPF GRAPHICS BASICS IN 2D
75
Figure 3-14. Changing both the size and the location of the graphics objects by decreasing the size of the
window, resulting in a “zoom in” effect
Panning is defined as the moving of all graphics objects in the scene by shifting the Window. In a panning process, the Window size is kept unchanged. For example, you can move the Window to the left by changing the following parameters:
xMin = -3; xMax = 7; yMin = 0; yMax = 10;
This is equivalent to moving graphics objects toward the right side of the rendering area. Please note that when you increase or decrease the size of graphics objects by zooming in or
zooming out, the stroke thickness remains unchanged. This differs from performing a scaling operation directly to the chartCanvas, because in a scaling operation both the shape and stroke thickness change correspondingly with the scaling factor. In 2D chart applications, you usually want to change the size of only the graphics and to keep the stroke thickness unchanged.

CHAPTER 3 ■ WPF GRAPHICS BASICS IN 2D
76
Resizable Canvas In the previous example, we used a Viewbox control as the topmost element. This way, every object inside the Viewbox element will scale when the application window is resized. This scalable behavior affects all sizable properties of the elements inside the Viewbox, including, for example, label font and stroke thickness of the graphics shapes and lines. However, this behavior may not be suitable for real-world chart applications, because chart applications usually require graphics and line themselves to be scalable, but not label fonts and stroke thicknesses. To achieve this, here we’ll implement a resizable Canvas to replace the Viewbox used in the previous example.
As mentioned previously, the Canvas element allows you to place graphics objects at absolute positions. An issue associated with the default WPF Canvas element is that unlike the Grid control, the size of the Canvas is usually fixed when the application window is resized. For chart applications, we want to have a resizable Canvas element. We want this element to adjust its size automatically with the application window’s actual size. At the same time, we want the resizable Canvas to allow us to place graphics objects at absolute positions.
We can easily create such a resizable canvas by combining a Grid with a Canvas control. Here, I’ll use an example to show you how to create this resizable canvas in WPF. Add a new WPF Window to the project GraphicsBasics and name it ResizableCanvas. The following is the XAML file for this example:
<Window x:Class="GraphicsBasics.ResizableCanvas" xmlns="http://schemas.microsoft.com/winfx/2006/xaml/presentation" xmlns:x="http://schemas.microsoft.com/winfx/2006/xaml" Title="ResizableCanvas" Height="420" Width="360"> <Grid> <Grid.RowDefinitions> <RowDefinition Height="*"/> <RowDefinition Height="120"/> </Grid.RowDefinitions> <Grid x:Name="chartGrid" SizeChanged="chartGrid_SizeChanged"> <Border x:Name="chartBorder" BorderBrush="Gray" BorderThickness="1" Margin="10"> <Canvas x:Name="chartCanvas" ClipToBounds="True"/> </Border> </Grid> <StackPanel Grid.Row="1" Margin="0,10,0,0"> <Grid HorizontalAlignment="Center" VerticalAlignment="Top"> <Grid.ColumnDefinitions> <ColumnDefinition Width="60*" /> <ColumnDefinition Width="110*" /> <ColumnDefinition Width="60*"/> <ColumnDefinition Width="110*" /> </Grid.ColumnDefinitions> <Grid.RowDefinitions> <RowDefinition Height="Auto" /> <RowDefinition Height="Auto" /> <RowDefinition Height="Auto" /> </Grid.RowDefinitions> <TextBlock Grid.Column="0" Grid.Row="0" Margin="25,5,10,5">XMin</TextBlock> <TextBox Name="tbXMin" Grid.Column="1" Grid.Row="0"
CHAPTER 3 ■ WPF GRAPHICS BASICS IN 2D
77
TextAlignment="Center">0</TextBox> <TextBlock Grid.Column="2" Grid.Row="0" Margin="25,5,10,5">XMax</TextBlock> <TextBox Name="tbXMax" Grid.Column="3" Grid.Row="0" TextAlignment="Center">10</TextBox> <TextBlock Grid.Column="0" Grid.Row="1" Margin="25,5,10,5">YMin</TextBlock> <TextBox Name="tbYMin" Grid.Column="1" Grid.Row="1" TextAlignment="Center" >0</TextBox> <TextBlock Grid.Column="2" Grid.Row="1" Margin="25,5,10,5">YMax</TextBlock> <TextBox Name="tbYMax" Grid.Column="3" Grid.Row="1" TextAlignment="Center">10</TextBox> <Button Click="btnApply_Click" Margin="40,20,20,0" Height="25" Grid.ColumnSpan="2" Grid.Column="0" Grid.Row="2">Apply </Button> <Button Click="btnClose_Click" Margin="40,20,20,0" Height="25" Grid.ColumnSpan="2" Grid.Column="2" Grid.Row="2" >Close </Button> </Grid> </StackPanel> </Grid> </Window>
This XAML file is basically similar to that used in the previous example, except for the addition of a Grid element called chartGrid, which is attached to a SizeChanged event. The chartGrid contains a child Canvas control named chartCanvas. Note that we don’t specify the size of the chartCanvas; instead, we’ll determine its size according to the chartGrid’s actual size in the code-behind file.
Here is the code-behind file for this example:
using System; using System.Collections.Generic; using System.Windows; using System.Windows.Controls; using System.Windows.Media; using System.Windows.Shapes; namespace GraphicsBasics { /// <summary> /// Interaction logic for ResizableCanvas.xaml /// </summary> public partial class ResizableCanvas : Window { private double xMin = 0.0; private double xMax = 10.0; private double yMin = 0.0; private double yMax = 10.0; private Line line1; private Polyline polyline1; public ResizableCanvas()

CHAPTER 3 ■ WPF GRAPHICS BASICS IN 2D
78
{ InitializeComponent(); } private void AddGraphics() { chartCanvas.Children.Clear(); xMin = Convert.ToDouble(tbXMin.Text); xMax = Convert.ToDouble(tbXMax.Text); yMin = Convert.ToDouble(tbXMin.Text); yMax = Convert.ToDouble(tbYMax.Text); line1 = new Line(); line1.X1 = XNormalize(2.0); line1.Y1 = YNormalize(4.0); line1.X2 = XNormalize(8.0); line1.Y2 = YNormalize(10.0); line1.Stroke = Brushes.Blue; line1.StrokeThickness = 2; chartCanvas.Children.Add(line1); polyline1 = new Polyline(); polyline1.Points.Add(new Point(XNormalize(8), YNormalize(8))); polyline1.Points.Add(new Point(XNormalize(6), YNormalize(6))); polyline1.Points.Add(new Point(XNormalize(6), YNormalize(4))); polyline1.Points.Add(new Point(XNormalize(4), YNormalize(4))); polyline1.Points.Add(new Point(XNormalize(4), YNormalize(6))); polyline1.Points.Add(new Point(XNormalize(6), YNormalize(6))); polyline1.Stroke = Brushes.Red; polyline1.StrokeThickness = 5; chartCanvas.Children.Add(polyline1); } private double XNormalize(double x) { double result = (x - xMin) * chartCanvas.Width / (xMax - xMin); return result; } private double YNormalize(double y) { double result = chartCanvas.Height - (y - yMin) * chartCanvas.Height / (yMax - yMin); return result; } private void btnClose_Click(object sender, EventArgs e) { this.Close(); } private void btnApply_Click(object sender, EventArgs e) {

CHAPTER 3 ■ WPF GRAPHICS BASICS IN 2D
79
AddGraphics(); } private void chartGrid_SizeChanged(object sender, SizeChangedEventArgs e) { chartCanvas.Width = chartGrid.ActualWidth - chartBorder.Margin.Left - chartBorder.Margin.Right - chartBorder.BorderThickness.Left - chartBorder.BorderThickness.Right; chartCanvas.Height = chartGrid.ActualHeight - chartBorder.Margin.Top - chartBorder.Margin.Bottom - chartBorder.BorderThickness.Top - chartBorder.BorderThickness.Bottom; AddGraphics(); } } }
Pay special attention to what happens inside the chartGrid_SizeChanged event handler, where we relate the Width and Height properties of the chartCanvas to the ActualWidth and ActualHeight properties of the chartGrid. This way, the chatCanvas will adjust its size automatically when the application window is resized. Furthermore, we put the AddGraphics method inside this event handler to ensure that the coordinates of the graphics elements on the chartCanvas are recalculated when the application window is resized.
Figure 3-15 shows the result of running this example, which is basically similar to the previous example. However, only the graphics elements, Line and Polyline in this example, change size when you resize the application window. The label fonts and stroke thickness remain unchanged.

CHAPTER 3 ■ WPF GRAPHICS BASICS IN 2D
80
Figure 3-15. Drawing a line and a polyline in the resizable Canvas
Basic 2D Graphics Shapes in WPF The simplest way to create 2D graphics objects in a WPF application is to use the Shape class, which represents a number of ready-to-use graphics shape objects. Available shape objects in WPF include Line, Polyline, Path, Rectangle, and Ellipse. These shapes are drawing primitives, which can be combined to generate more complex graphics. In the following sections, we’ll consider these basic WPF shapes.
Lines You can use the Line class in WPF to create straight lines between two end points. The X1 and Y1 properties specify the start point; the X2 and Y2 properties represent the end point. The following XAML code snippet creates a blue line from point (30, 30) to point (180, 30):
<Line X1="30" Y1="30" X2 ="180" Y2="30" Stroke="Blue" StrokeThickness="2"/>
This code snippet produces a solid line. However, lines can have many different styles. For example, you can draw a dashed line with line caps, as shown in Figure 3-16. This means that a line is made up of three parts: the line body, the starting cap, and the ending cap.

CHAPTER 3 ■ WPF GRAPHICS BASICS IN 2D
81
Figure 3-16. A line with starting cap, ending cap, and dash style
The starting and ending caps can be specified by the StrokeStartLineCap and StrokeEndLineCap properties, respectively. Both properties get or set a PenLineCap enumeration value that describes the shape at the ends of the line. Available values in the PenLineCap enumeration include Flat, Round, Square, and Triangle. Unfortunately, the size of the line cap is the same as the StrokeThickness of the line. Thus, these caps aren’t very useful in practical applications. If you want to create a line with an end anchor or an arrowhead, you’ll need to create a custom shape, which is discussed later in this chapter.
The dash style of a line is specified by the StrokeDashArray property that gets or sets a collection of double variables, which specify the pattern of dashes and gaps of the line. Let’s consider an example that shows how to create lines with different dash styles. Add a new WPF Window to the project GraphicsBasics and name it LineDashStyles. Here is the XAML for this example:
<Window x:Class="GraphicsBasics.LineDashStyles" xmlns="http://schemas.microsoft.com/winfx/2006/xaml/presentation" xmlns:x="http://schemas.microsoft.com/winfx/2006/xaml" Title="Line Dash Styles" Height="150" Width="350"> <Grid Margin="0,10,0,0"> <Grid.RowDefinitions> <RowDefinition/> <RowDefinition/> <RowDefinition/> </Grid.RowDefinitions> <Grid.ColumnDefinitions> <ColumnDefinition/> <ColumnDefinition/> </Grid.ColumnDefinitions> <Line X1="0" Y1="5" X2 ="150" Y2="5" Margin="5" Grid.Column="0" Grid.Row="0" Stroke="Blue" StrokeThickness="2" StrokeDashArray="5,3"/> <TextBlock Grid.Column="1" Grid.Row="0" Text="StrokeDashArray = '5,3'" /> <Line X1="0" Y1="5" X2 ="150" Y2="5" Margin="5" Grid.Column="0" Grid.Row="1" Stroke="Blue" StrokeThickness="2" StrokeDashArray="5,1,3,2" StrokeStartLineCap="Round" StrokeEndLineCap="Triangle"/> <TextBlock Grid.Column="1" Grid.Row="1" Text="StrokeDashArray = '5,1,3,2'" /> <Line X1="0" Y1="5" X2 ="150" Y2="5" Margin="5" Grid.Column="0" Grid.Row="2" Stroke="Blue" StrokeThickness="2" StrokeDashArray="5,1,3"/> <TextBlock Grid.Column="1" Grid.Row="2" Text="StrokeDashArray = '5,1,3'" /> </Grid> </Window>
This code creates three dashed lines, each with a different dash style, which are shown in Figure 3-17.
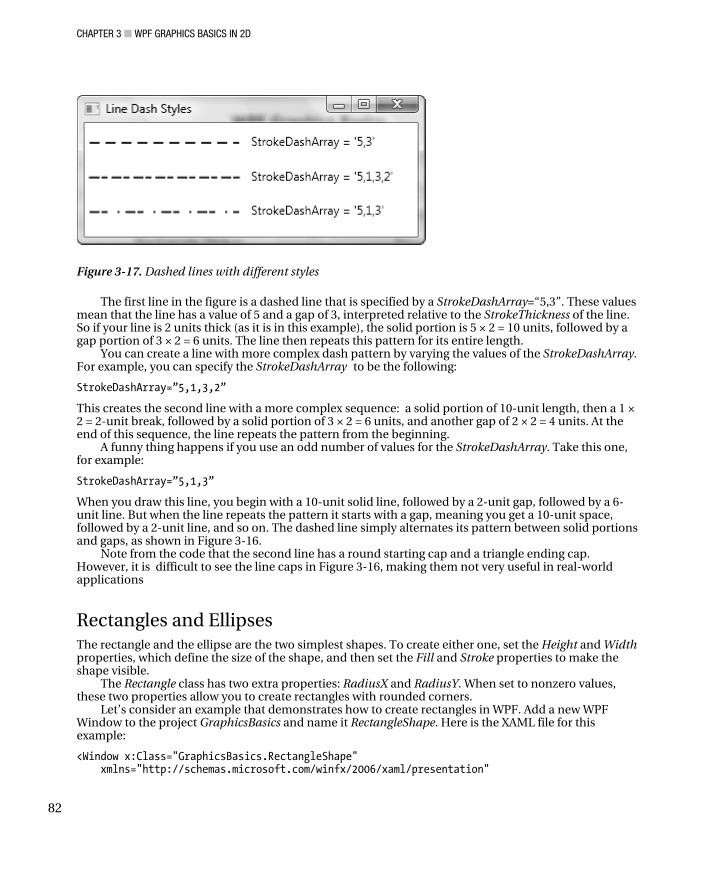
CHAPTER 3 ■ WPF GRAPHICS BASICS IN 2D
82
Figure 3-17. Dashed lines with different styles
The first line in the figure is a dashed line that is specified by a StrokeDashArray=“5,3”. These values mean that the line has a value of 5 and a gap of 3, interpreted relative to the StrokeThickness of the line. So if your line is 2 units thick (as it is in this example), the solid portion is 5 × 2 = 10 units, followed by a gap portion of 3 × 2 = 6 units. The line then repeats this pattern for its entire length.
You can create a line with more complex dash pattern by varying the values of the StrokeDashArray. For example, you can specify the StrokeDashArray to be the following:
StrokeDashArray=”5,1,3,2”
This creates the second line with a more complex sequence: a solid portion of 10-unit length, then a 1 × 2 = 2-unit break, followed by a solid portion of 3 × 2 = 6 units, and another gap of 2 × 2 = 4 units. At the end of this sequence, the line repeats the pattern from the beginning.
A funny thing happens if you use an odd number of values for the StrokeDashArray. Take this one, for example:
StrokeDashArray=”5,1,3”
When you draw this line, you begin with a 10-unit solid line, followed by a 2-unit gap, followed by a 6-unit line. But when the line repeats the pattern it starts with a gap, meaning you get a 10-unit space, followed by a 2-unit line, and so on. The dashed line simply alternates its pattern between solid portions and gaps, as shown in Figure 3-16.
Note from the code that the second line has a round starting cap and a triangle ending cap. However, it is difficult to see the line caps in Figure 3-16, making them not very useful in real-world applications
Rectangles and Ellipses The rectangle and the ellipse are the two simplest shapes. To create either one, set the Height and Width properties, which define the size of the shape, and then set the Fill and Stroke properties to make the shape visible.
The Rectangle class has two extra properties: RadiusX and RadiusY. When set to nonzero values, these two properties allow you to create rectangles with rounded corners.
Let’s consider an example that demonstrates how to create rectangles in WPF. Add a new WPF Window to the project GraphicsBasics and name it RectangleShape. Here is the XAML file for this example:
<Window x:Class="GraphicsBasics.RectangleShape" xmlns="http://schemas.microsoft.com/winfx/2006/xaml/presentation"

CHAPTER 3 ■ WPF GRAPHICS BASICS IN 2D
83
xmlns:x="http://schemas.microsoft.com/winfx/2006/xaml" Title="Rectangles" Height="340" Width="200"> <Grid> <StackPanel> <TextBlock Text="RadiusX = 0, RadiusY = 0:" Margin="10 10 10 5"/> <Rectangle Width="150" Height="70" Fill="LightGray" Stroke="Black"/> <TextBlock Text="RadiusX = 20, RadiusY = 10:" Margin="10 10 10 5"/> <Rectangle Width="150" Height="70" RadiusX="20" RadiusY="10" Fill="LightGray" Stroke="Black"/> <TextBlock Text="RadiusX = 75, RadiusY = 35:" Margin="10 10 10 5"/> <Rectangle Width="150" Height="70" RadiusX="75" RadiusY="35" Fill="LightGray" Stroke="Black"/> </StackPanel> </Grid> </Window>
Figure 3-18 shows the results of running this example. You can easily create rectangles with rounded corners by specifying RadiusX and RadiusY properties to nonzero values. You can even create an ellipse by setting RadiusX and RadiusY to large values (larger than the half of the respective side length).
Figure 3-18. Rectangles in WPF
You can create ellipses with properties similar to those used in creating rectangles. You can also create a circle by setting RadiusX = RadiusY.

CHAPTER 3 ■ WPF GRAPHICS BASICS IN 2D
84
Add a new WPF Window to the project GraphicsBasics and name it EllipseShape. Here is the XAML file for this example:
<Window x:Class=" GraphicsBasics.EllipseShape" xmlns="http://schemas.microsoft.com/winfx/2006/xaml/presentation" xmlns:x="http://schemas.microsoft.com/winfx/2006/xaml" Title="Ellipses" Height="280" Width="200"> <Grid> <StackPanel> <TextBlock Text="Ellipse:" Margin="10 10 10 5"/> <Ellipse Width="150" Height="70" Fill="LightGray" Stroke="Black"/> <TextBlock Text="Circle:" Margin="10 10 10 5"/> <Ellipse Width="100" Height="100" Fill="LightGray" Stroke="Black"/> </StackPanel> </Grid> </Window>
This example produces the results shown in Figure 3-19.
Figure 3-19. Ellipses in WPF
Both the rectangle and the ellipse have the ability to resize themselves to fill the available space. If the Height and Width properties aren’t specified, the shape is sized based on its container. The sizing behavior of a shape depends on the value of its stretch property. The default value is set to Fill, which stretches a shape to fill its container if an explicit size is not specified.
Let’s consider another example, one that illustrates placing and sizing rectangles and ellipses in Grid cells. Add a new WPF Window to the project GraphicsBasics and name it PlaceShapes. Here is the markup for this example:
<Window x:Class="GraphicsBasics.PlaceShapes" xmlns="http://schemas.microsoft.com/winfx/2006/xaml/presentation"

CHAPTER 3 ■ WPF GRAPHICS BASICS IN 2D
85
xmlns:x="http://schemas.microsoft.com/winfx/2006/xaml" Title="Place Shapes" Height="300" Width="360"> <Grid ShowGridLines="True"> <Grid.RowDefinitions> <RowDefinition Height="Auto"/> <RowDefinition/> <RowDefinition/> </Grid.RowDefinitions> <Grid.ColumnDefinitions> <ColumnDefinition Width="Auto"/> <ColumnDefinition/> <ColumnDefinition/> <ColumnDefinition/> </Grid.ColumnDefinitions> <TextBlock Grid.Column="0" Grid.Row="1" Text="Rectagle" Margin="5"/> <TextBlock Grid.Column="0" Grid.Row="2" Text="Ellipse" Margin="5"/> <TextBlock Grid.Column="1" Grid.Row="0" Text="Fill" TextAlignment="Center" Margin="5"/> <TextBlock Grid.Column="2" Grid.Row="0" Text="Uniform" TextAlignment="Center" Margin="5"/> <TextBlock Grid.Column="3" Grid.Row="0" Text="UniformToFill" TextAlignment="Center" Margin="5"/> <Rectangle Grid.Column="1" Grid.Row="1" Fill="LightGray" Stroke="Black" Stretch="Fill" Margin="5"/> <Rectangle Grid.Column="2" Grid.Row="1" Fill="LightGray" Stroke="Black" Stretch="Uniform" Margin="5"/> <Rectangle Grid.Column="3" Grid.Row="1" Fill="LightGray" Stroke="Black" Stretch="UniformToFill" Margin="5"/> <Ellipse Grid.Column="1" Grid.Row="2" Fill="LightGray" Stroke="Black" Stretch="Fill" Margin="5"/> <Ellipse Grid.Column="2" Grid.Row="2" Fill="LightGray" Stroke="Black" Stretch="Uniform" Margin="5"/> <Ellipse Grid.Column="3" Grid.Row="2" Fill="LightGray" Stroke="Black" Stretch="UniformToFill" Margin="5"/> </Grid> </Window>
In this example, you create three rectangles and three ellipses, each with different Stretch property. Figure 3-20 shows the result of running this application. You can see how the different Stretch properties affect the appearances of shapes.
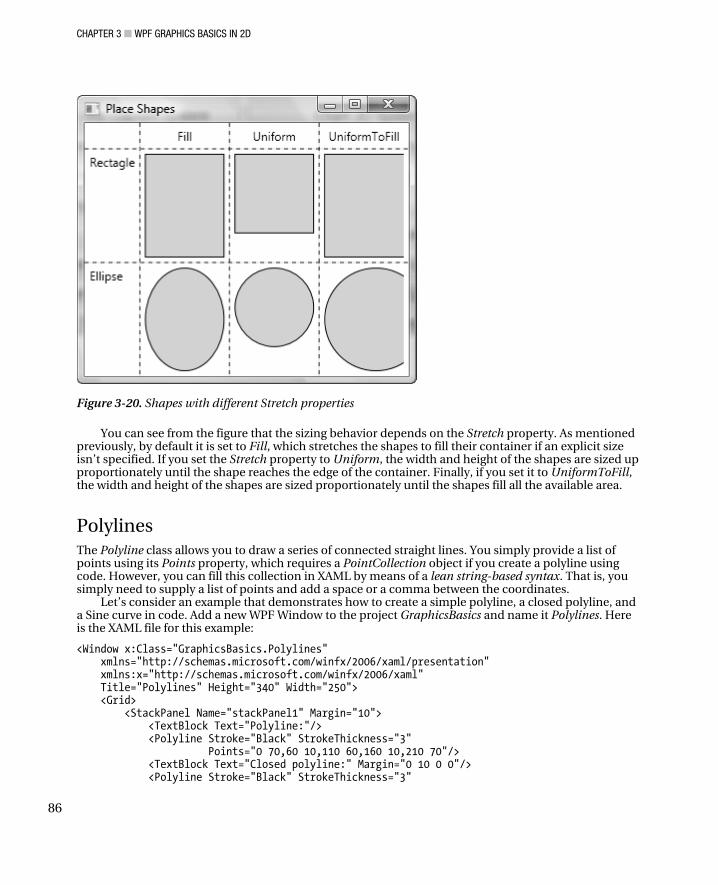
CHAPTER 3 ■ WPF GRAPHICS BASICS IN 2D
86
Figure 3-20. Shapes with different Stretch properties
You can see from the figure that the sizing behavior depends on the Stretch property. As mentioned previously, by default it is set to Fill, which stretches the shapes to fill their container if an explicit size isn’t specified. If you set the Stretch property to Uniform, the width and height of the shapes are sized up proportionately until the shape reaches the edge of the container. Finally, if you set it to UniformToFill, the width and height of the shapes are sized proportionately until the shapes fill all the available area.
Polylines The Polyline class allows you to draw a series of connected straight lines. You simply provide a list of points using its Points property, which requires a PointCollection object if you create a polyline using code. However, you can fill this collection in XAML by means of a lean string-based syntax. That is, you simply need to supply a list of points and add a space or a comma between the coordinates.
Let’s consider an example that demonstrates how to create a simple polyline, a closed polyline, and a Sine curve in code. Add a new WPF Window to the project GraphicsBasics and name it Polylines. Here is the XAML file for this example:
<Window x:Class="GraphicsBasics.Polylines" xmlns="http://schemas.microsoft.com/winfx/2006/xaml/presentation" xmlns:x="http://schemas.microsoft.com/winfx/2006/xaml" Title="Polylines" Height="340" Width="250"> <Grid> <StackPanel Name="stackPanel1" Margin="10"> <TextBlock Text="Polyline:"/> <Polyline Stroke="Black" StrokeThickness="3" Points="0 70,60 10,110 60,160 10,210 70"/> <TextBlock Text="Closed polyline:" Margin="0 10 0 0"/> <Polyline Stroke="Black" StrokeThickness="3"

CHAPTER 3 ■ WPF GRAPHICS BASICS IN 2D
87
Points="0 70,60 10,110 60,160 10,210 70, 0 70"/> <TextBlock Text="Sine curve:" Margin="0 10 0 0"/> <Polyline Name="polyline1" Stroke="Red" StrokeThickness="2"/> </StackPanel> </Grid> </Window>
Here you create two polylines directly in the XAML file. You also define another polyline, called polyline1, which needs to be created in code. Here is the code-behind file used to generate the Sine curve:
using System; using System.Windows; using System.Windows.Media; using System.Windows.Shapes; namespace GraphicsBasics { public partial class Polylines : Window { public Polylines() { InitializeComponent(); for (int i = 0; i < 70; i++) { double x = i * Math.PI; double y = 40 + 30 * Math.Sin(x/10); polyline1.Points.Add(new Point(x, y)); } } } }
Here, you simply add points to polyline1’s Points collection using a Sine function with a for-loop. Running this application produces the results shown in Figure 3-21.
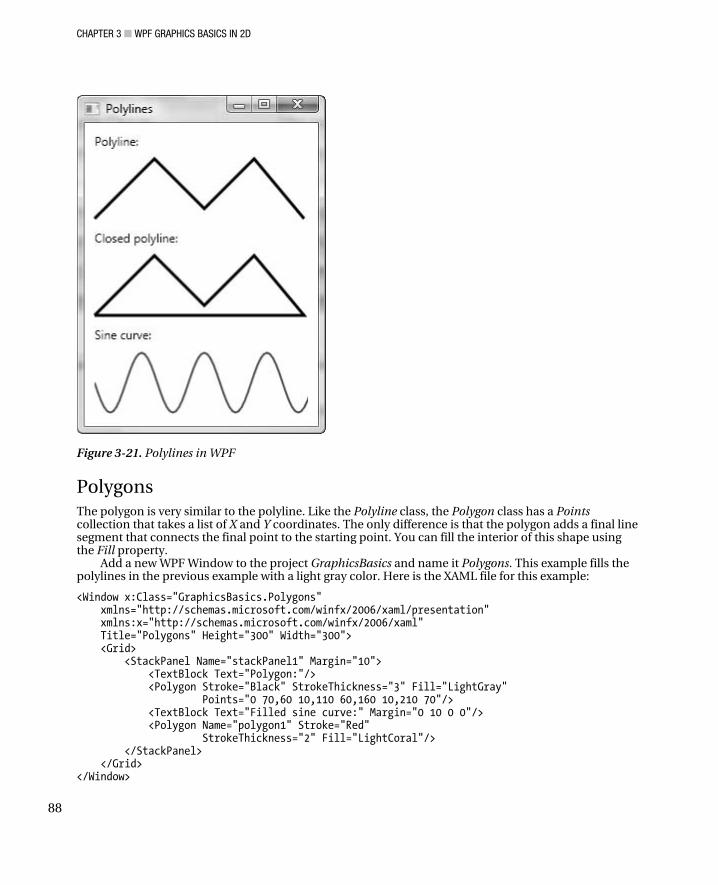
CHAPTER 3 ■ WPF GRAPHICS BASICS IN 2D
88
Figure 3-21. Polylines in WPF
Polygons The polygon is very similar to the polyline. Like the Polyline class, the Polygon class has a Points collection that takes a list of X and Y coordinates. The only difference is that the polygon adds a final line segment that connects the final point to the starting point. You can fill the interior of this shape using the Fill property.
Add a new WPF Window to the project GraphicsBasics and name it Polygons. This example fills the polylines in the previous example with a light gray color. Here is the XAML file for this example:
<Window x:Class="GraphicsBasics.Polygons" xmlns="http://schemas.microsoft.com/winfx/2006/xaml/presentation" xmlns:x="http://schemas.microsoft.com/winfx/2006/xaml" Title="Polygons" Height="300" Width="300"> <Grid> <StackPanel Name="stackPanel1" Margin="10"> <TextBlock Text="Polygon:"/> <Polygon Stroke="Black" StrokeThickness="3" Fill="LightGray" Points="0 70,60 10,110 60,160 10,210 70"/> <TextBlock Text="Filled sine curve:" Margin="0 10 0 0"/> <Polygon Name="polygon1" Stroke="Red" StrokeThickness="2" Fill="LightCoral"/> </StackPanel> </Grid> </Window>

CHAPTER 3 ■ WPF GRAPHICS BASICS IN 2D
89
The polygon1 is created using a Sine function in the code-behind file:
using System; using System.Windows; using System.Windows.Media; using System.Windows.Shapes; namespace GraphicsBasics { public partial class Polygons : Window { public Polygons() { InitializeComponent(); for (int i = 0; i < 71; i++) { double x = i * Math.PI; double y = 40 + 30 * Math.Sin(x / 10); polygon1.Points.Add(new Point(x, y)); } } } }
Running this application produces the results shown in Figure 3-22.
Figure 3-22. Polygons in WPF
In a simple shape whose lines never cross, it is easy to fill the interior. Sometimes, however, you’ll have a more complex polygon in which it isn’t necessarily obvious which portions should be filled and which portions should not.

CHAPTER 3 ■ WPF GRAPHICS BASICS IN 2D
90
Let’s consider another example, one that shows a line crossing more than one other line, leaving an irregular region at the center that may or may not be filled. Add a new WPF Window to the project GraphicsBasics and name it PolygonFillRule. Here is the XAML file for this example:
<Window x:Class=" GraphicsBasics.PolygonFillRule" xmlns="http://schemas.microsoft.com/winfx/2006/xaml/presentation" xmlns:x="http://schemas.microsoft.com/winfx/2006/xaml" Title="PolygonFillRule" Height="600" Width="300"> <Grid> <StackPanel Margin="10"> <TextBlock Text="FillRule = EvenOdd:" Margin="0 0 0 5"/> <Polygon Stroke="Black" Fill="LightGray" FillRule="EvenOdd" Points="0 0,0 150,100 150,100 50,50 50,50 100,150 100,150 0"/> <TextBlock Text="FillRule = NonZero:" Margin="0 10 0 5"/> <Polygon Stroke="Black" Fill="LightGray" FillRule="Nonzero" Points="0 0,0 150,100 150,100 50,50 50,50 100,150 100,150 0"/> <TextBlock Text="FillRule = NonZero:" Margin="0 10 0 5"/> <Polygon Stroke="Black" Fill="LightGray" FillRule="Nonzero" Points="0 0,0 150,100 150,100 100,50 100,50 50, 100 50,100 100,150 100,150 0"/> </StackPanel> </Grid> </Window>
Here, you use the FillRule property to control the filled regions. Every polygon has a FillRule property that allows you to choose between two different methods for filling in regions, EvenOdd (the default value) and NonZero. In the EvenOdd case, in order to determine which region will be filled, WPF counts the number of lines that must be crossed to reach the outside of the shape. If this number is odd, the region is filled; if it is even, the region is left empty, as shown in Figure 3-23.
Figure 3-23. Determining filled regions when FillRule is set to EvenOdd

CHAPTER 3 ■ WPF GRAPHICS BASICS IN 2D
91
When FillRule is set to NonZero, determining which region will be filled becomes trickier. In this case, WPF follows the same line-counting process as EvenOdd but takes into account the line direction. If the number of lines going in one direction is equal to the number of lines going in the opposite direction, the region isn’t filled; if the difference between these two counts isn’t zero, the region is filled. Figure 3-24 shows the results of running this example.
Figure 3-24. Determining filled regions when FillRule is set to NonZero
The difference between the two shapes in the figure is that the order of points in the Points collection is different, leading to different line directions. This means that in the NonZero case, whether a region is filled or not depends on how you draw the shape, not on what the shape itself looks like. Figure 3-24 clearly demonstrates this conclusion.
Paths and Geometries In previous sections, you learned how to create simple 2D graphics using shapes that derive from the Shape class, including Line, Rectangle, Ellipse, and Polygon. However, we haven’t considered a more powerful Shape-derived class, the Path class. The Path class has the ability to draw curves and complex shapes, which are described using Geometry objects. To use a Path element, you create a Geometry object, which is used to set the Path’s Data property. You can’t draw a Geometry object directly on your screen because it is an abstract class. Instead, you need to use one of the following seven derived classes:
• LineGeometry – Represents the geometry of a straight line.
• RectangleGeometry – Represents the geometry of a 2D rectangle.
• EllipseGeometry – Represents the geometry of an ellipse.
• GeometryGroup – Represents a composite geometry, which can be added to a single path.

CHAPTER 3 ■ WPF GRAPHICS BASICS IN 2D
92
• CombinedGeometry – Represents a 2D geometry shape defined by the combination of two Geometry objects.
• PathGeometry – Represents a complex geometry shape that may be composed of arcs, curves, ellipses, lines, and rectangles.
• StreamGeometry – Defines a geometric shape described using StreamGeometryContext. This geometry is a read-only lightweight alternative to PathGeometry; it doesn’t support data binding, animation, or modification.
The LineGeometry, RectangleGeometry, and EllipseGeometry classes describe relatively simple geometry shapes. To create more complex shapes or curves, you need to use a PathGeometry object.
There is a critical difference between the Shape class and the Geometry class. The Geometry class inherits from the Freezable class, whereas the Shape class inherits from FrameworkElement. Because Shape objects are elements, they can render themselves and participate in the layout system, but Geometry objects can’t.
Although Shape objects are more readily usable than Geometry objects, Geometry objects are more versatile. Whereas a Shape object is used to render 2D graphics, a Geometry object can be used to define the geometric region for 2D graphics, define a region for clipping, or define a region for hit testing, for example. Geometry objects can’t render themselves, and they must be drawn by another element, such as a Drawing or Path element. The attributes common to shapes, such as the Fill, Stroke, and StrokeThickness properties, are attached to the Path or Drawing, which can be used to draw Geometry objects.
You can see from the foregoing discussion that the Geometry object defines a shape, whereas a Path object allows you to draw the Geometry shape on your screen. In the following sections, I’ll show you how to create shapes using the objects derived from the Geometry class.
Line, Rectangle, and Ellipse Geometries The LineGeometry, RectangleGeometry, and EllipseGeometry classes correspond directly to the Line, Rectangle, and Ellipse shapes used previously. For example, you can convert the following XAML snippet, which uses the Line element
<Line X1="30" Y1="30" X2 ="180" Y2="30" Stroke="Blue" StrokeThickness="2"/>
into the following markup, which uses the Path element and LineGeometry:
<Path Stroke="Blue" StrokeThickness="2"> <Path.Data> <LineGeometry StartPoint="30 30" EndPoint="180 30"/> </Path.Data> </Path>
The only difference is that the Line shape takes X1, Y1, X2, and Y2 values, whereas the LineGeometry object takes StartPoint and EndPoint.
Similarly, you can convert the code snippet
<Rectangle Fill="Gray" Stroke="Blue" StrokeThickness="2" Width="10" Height="20"/>
into this RectangleGeometry:
<Path Fill="Gray" Stroke="Blue" StrokeThickness="2"> <Path.Data> <RectangleGeometry Rect="0,0,10,20"/> </Path.Data> </Path>
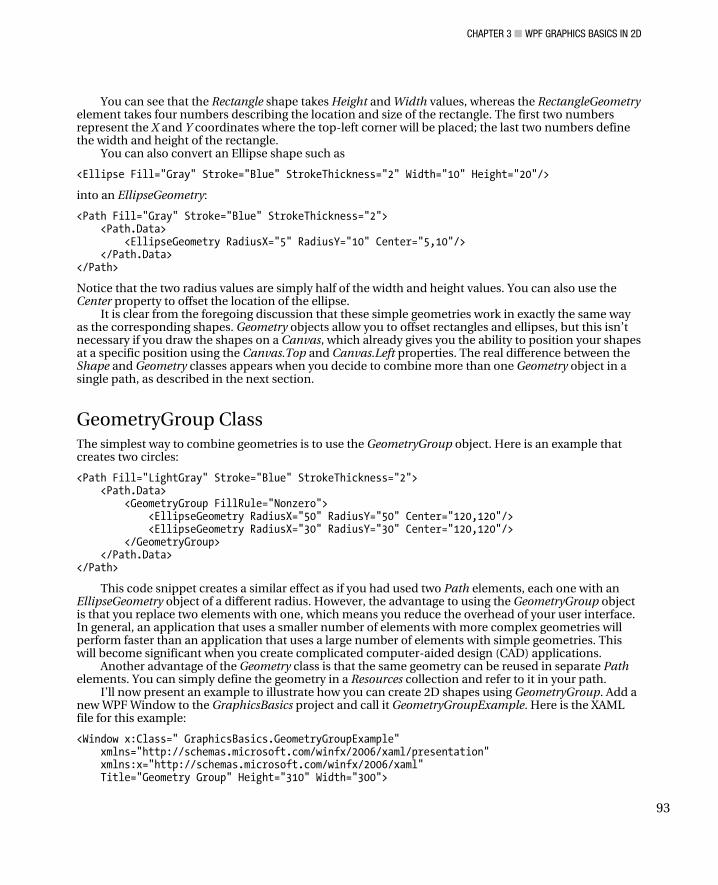
CHAPTER 3 ■ WPF GRAPHICS BASICS IN 2D
93
You can see that the Rectangle shape takes Height and Width values, whereas the RectangleGeometry element takes four numbers describing the location and size of the rectangle. The first two numbers represent the X and Y coordinates where the top-left corner will be placed; the last two numbers define the width and height of the rectangle.
You can also convert an Ellipse shape such as
<Ellipse Fill="Gray" Stroke="Blue" StrokeThickness="2" Width="10" Height="20"/>
into an EllipseGeometry:
<Path Fill="Gray" Stroke="Blue" StrokeThickness="2"> <Path.Data> <EllipseGeometry RadiusX="5" RadiusY="10" Center="5,10"/> </Path.Data> </Path>
Notice that the two radius values are simply half of the width and height values. You can also use the Center property to offset the location of the ellipse.
It is clear from the foregoing discussion that these simple geometries work in exactly the same way as the corresponding shapes. Geometry objects allow you to offset rectangles and ellipses, but this isn’t necessary if you draw the shapes on a Canvas, which already gives you the ability to position your shapes at a specific position using the Canvas.Top and Canvas.Left properties. The real difference between the Shape and Geometry classes appears when you decide to combine more than one Geometry object in a single path, as described in the next section.
GeometryGroup Class The simplest way to combine geometries is to use the GeometryGroup object. Here is an example that creates two circles:
<Path Fill="LightGray" Stroke="Blue" StrokeThickness="2"> <Path.Data> <GeometryGroup FillRule="Nonzero"> <EllipseGeometry RadiusX="50" RadiusY="50" Center="120,120"/> <EllipseGeometry RadiusX="30" RadiusY="30" Center="120,120"/> </GeometryGroup> </Path.Data> </Path>
This code snippet creates a similar effect as if you had used two Path elements, each one with an EllipseGeometry object of a different radius. However, the advantage to using the GeometryGroup object is that you replace two elements with one, which means you reduce the overhead of your user interface. In general, an application that uses a smaller number of elements with more complex geometries will perform faster than an application that uses a large number of elements with simple geometries. This will become significant when you create complicated computer-aided design (CAD) applications.
Another advantage of the Geometry class is that the same geometry can be reused in separate Path elements. You can simply define the geometry in a Resources collection and refer to it in your path.
I’ll now present an example to illustrate how you can create 2D shapes using GeometryGroup. Add a new WPF Window to the GraphicsBasics project and call it GeometryGroupExample. Here is the XAML file for this example:
<Window x:Class=" GraphicsBasics.GeometryGroupExample" xmlns="http://schemas.microsoft.com/winfx/2006/xaml/presentation" xmlns:x="http://schemas.microsoft.com/winfx/2006/xaml" Title="Geometry Group" Height="310" Width="300">

CHAPTER 3 ■ WPF GRAPHICS BASICS IN 2D
94
<Window.Resources> <GeometryGroup x:Key="GeometryNonzero" FillRule="Nonzero"> <EllipseGeometry RadiusX="50" RadiusY="50" Center="65,60"/> <EllipseGeometry RadiusX="30" RadiusY="30" Center="65,60"/> </GeometryGroup> <GeometryGroup x:Key="GeometryEvenOdd" FillRule="EvenOdd"> <EllipseGeometry RadiusX="50" RadiusY="50" Center="65,60"/> <EllipseGeometry RadiusX="30" RadiusY="30" Center="65,60"/> </GeometryGroup> </Window.Resources> <Border Margin="5" BorderBrush="Black" BorderThickness="1" Background="{StaticResource MyGrayGridBrush}"> <Canvas Height="310" Width="300"> <Grid ShowGridLines="True" Height="265"> <Grid.ColumnDefinitions> <ColumnDefinition Width="140"/> <ColumnDefinition Width="140"/> </Grid.ColumnDefinitions> <StackPanel Margin="5" Grid.Column="0"> <TextBlock Text="FillRule = Nonzero" Margin="15,5,5,5"/> <Path Fill="LightBlue" Stroke="Blue" StrokeThickness="2" Data="{StaticResource GeometryNonzero}"/> <Path Fill="LightCoral" Stroke="Red" StrokeThickness="2" Canvas.Left="150" Data="{StaticResource GeometryNonzero}"/> </StackPanel> <StackPanel Margin="5" Grid.Column="1"> <TextBlock Text="FillRule = EvenOdd" Margin="15,5,5,5"/> <Path Fill="LightBlue" Stroke="Blue" StrokeThickness="2" Data="{StaticResource GeometryEvenOdd}"/> <Path Fill="LightCoral" Stroke="Red" StrokeThickness="2" Canvas.Left="150" Data="{StaticResource GeometryEvenOdd}"/> </StackPanel> </Grid> </Canvas> </Border> </Window>
In the Resources, we define two GeometryGroup objects: GeometryNonzero and GeometryEvenOdd. Each includes two circles with different radii but the same center. The main difference lies in their FillRule properties: one is set to Nonzero and the other to EvenOdd. Like the Polygon shape, the GeometryGroup also has a FillRule property that specifies which shapes will be filled. You can then use these Resources to create multiple shapes at different locations on a Canvas with different Fill colors and Strokes.
This markup generates the results shown in Figure 3-25. The two solid circles are created at each of two different locations. The left images show results when the FillRule of the GeometryGroup is set to Nonzero. Two solid circles with the same center location are created. If you change the FillRule property
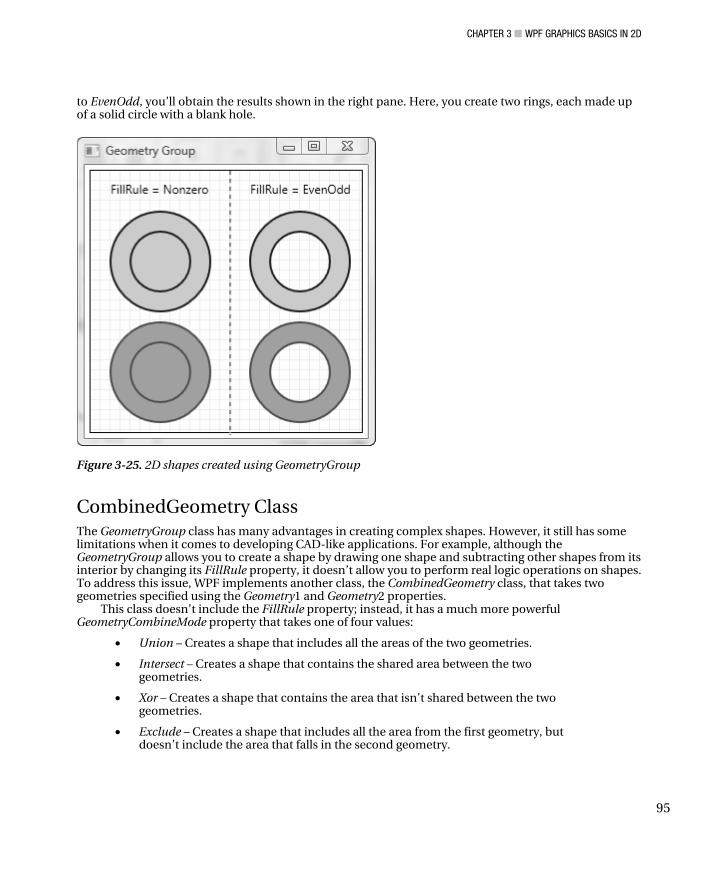
CHAPTER 3 ■ WPF GRAPHICS BASICS IN 2D
95
to EvenOdd, you’ll obtain the results shown in the right pane. Here, you create two rings, each made up of a solid circle with a blank hole.
Figure 3-25. 2D shapes created using GeometryGroup
CombinedGeometry Class The GeometryGroup class has many advantages in creating complex shapes. However, it still has some limitations when it comes to developing CAD-like applications. For example, although the GeometryGroup allows you to create a shape by drawing one shape and subtracting other shapes from its interior by changing its FillRule property, it doesn’t allow you to perform real logic operations on shapes. To address this issue, WPF implements another class, the CombinedGeometry class, that takes two geometries specified using the Geometry1 and Geometry2 properties.
This class doesn’t include the FillRule property; instead, it has a much more powerful GeometryCombineMode property that takes one of four values:
• Union – Creates a shape that includes all the areas of the two geometries.
• Intersect – Creates a shape that contains the shared area between the two geometries.
• Xor – Creates a shape that contains the area that isn’t shared between the two geometries.
• Exclude – Creates a shape that includes all the area from the first geometry, but doesn’t include the area that falls in the second geometry.

CHAPTER 3 ■ WPF GRAPHICS BASICS IN 2D
96
Note that CombinedGeometry combines only the Area specified by two geometries, so geometries that don’t have area, such as LineGeometry, disappear when combined.
Let’s consider an example that demonstrates how you can combine two circles into one shape using CombinedGeometry. Add a new WPF Window to the project GraphicsBasics and name it CombinedGeometryExample. Here is the XAML file for this example:
<Window x:Class=" GraphicsBasics.CombinedGeometryExample" xmlns="http://schemas.microsoft.com/winfx/2006/xaml/presentation" xmlns:x="http://schemas.microsoft.com/winfx/2006/xaml" Title="Combined Geometry" Height="340" Width="300"> <Border Margin="5" BorderBrush="Black" BorderThickness="1" Background="{StaticResource MyGrayGridBrush}"> <Canvas Width="300" Height="340" Margin="5"> <Grid> <Grid.ColumnDefinitions> <ColumnDefinition /> <ColumnDefinition /> </Grid.ColumnDefinitions> <StackPanel Grid.Column="0" Margin="5 0 0 10"> <TextBlock FontSize="12pt" Text="Union" Margin="40,5,5,10"/> <Path Fill ="LightBlue" Stroke="Blue"> <Path.Data> <CombinedGeometry GeometryCombineMode="Union"> <CombinedGeometry.Geometry1> <EllipseGeometry Center="50,50" RadiusX="50" RadiusY="50"/> </CombinedGeometry.Geometry1> <CombinedGeometry.Geometry2> <EllipseGeometry Center="80,50" RadiusX="50" RadiusY="50"/> </CombinedGeometry.Geometry2> </CombinedGeometry> </Path.Data> </Path> <TextBlock FontSize="12pt" Text="Xor" Margin="45,15,5,10"/> <Path Fill ="LightBlue" Stroke="Blue"> <Path.Data> <CombinedGeometry GeometryCombineMode="Xor"> <CombinedGeometry.Geometry1> <EllipseGeometry Center="50,50" RadiusX="50" RadiusY="50"/> </CombinedGeometry.Geometry1> <CombinedGeometry.Geometry2> <EllipseGeometry Center="80,50" RadiusX="50" RadiusY="50"/> </CombinedGeometry.Geometry2> </CombinedGeometry> </Path.Data> </Path> </StackPanel>

CHAPTER 3 ■ WPF GRAPHICS BASICS IN 2D
97
<StackPanel Grid.Column="1" Margin="20 0 0 0"> <TextBlock FontSize="12pt" Text="Intersect" Margin="30,5,5,10"/> <Path Fill ="LightBlue" Stroke="Blue" Margin="5,0,0,0"> <Path.Data> <CombinedGeometry GeometryCombineMode="Intersect"> <CombinedGeometry.Geometry1> <EllipseGeometry Center="50,50" RadiusX="50" RadiusY="50"/> </CombinedGeometry.Geometry1> <CombinedGeometry.Geometry2> <EllipseGeometry Center="80,50" RadiusX="50" RadiusY="50"/> </CombinedGeometry.Geometry2> </CombinedGeometry> </Path.Data> </Path> <TextBlock FontSize="12pt" Text="Exclude" Margin="35,15,5,10"/> <Path Fill ="LightBlue" Stroke="Blue" Margin="10,0,0,0"> <Path.Data> <CombinedGeometry GeometryCombineMode="Exclude"> <CombinedGeometry.Geometry1> <EllipseGeometry Center="50,50" RadiusX="50" RadiusY="50"/> </CombinedGeometry.Geometry1> <CombinedGeometry.Geometry2> <EllipseGeometry Center="80,50" RadiusX="50" RadiusY="50"/> </CombinedGeometry.Geometry2> </CombinedGeometry> </Path.Data> </Path> </StackPanel> </Grid> </Canvas> </Border> </Window>
Figure 3-26 shows the results of running this example. You can clearly see how the CombinedGeometryMode property affects the combined area. Although the CombinedGeometry object takes only two geometries, you can actually combine any number of shapes by using CombinedGeometry objects successively.

CHAPTER 3 ■ WPF GRAPHICS BASICS IN 2D
98
Figure 3-26. 2D shapes created using CombinedGeometry
PathGeometry Class The PathGeometry class is more powerful than the derived geometry classes discussed previously. With it you can create any of the shapes that the other geometries can and much more. A PathGeometry object is built out of one or more PathFigure objects. Each PathFigure object is a continuous set of connected lines and curves that can be closed or open. The PathFigure object is closed if the end point of the last line in the object connects to the starting point of the first line.
The PathFigure class has four key properties:
• StartPoint – A point that indicates where the line or figure begins.
• Segments – A collection of PathSegment objects that are used to draw the figure.
• IsClosed – If true, WPF adds a straight line connecting the starting and end points.
• IsFilled – If true, the area inside the figure is filled using the Path.Fill property.
Note that the PathFigure is a shape that is drawn using an unbroken line consisting of a number of segments. There are several types of segments, all of which derive from the PathSegment class. You can use different types of segments freely to build your figure. These are the segment classes in WPF:
• LineSegment – Creates a straight line between two points.
• ArcSegment – Creates an elliptical arc between two points.

CHAPTER 3 ■ WPF GRAPHICS BASICS IN 2D
99
• PolyLineSegment – Creates a series of straight lines.
• BezierSegment – Creates a Bezier curve between two points.
• QuadraticBezierSegment – Creates a Bezier curve that has one point instead of two.
• PolyBezierSegment – Creates a series of Bezier curves.
• PolyQuadraticBezierSegment – Creates a series of simpler quadratic Bezier curves.
The Line, Arc, and PolyLine segments may be more familiar to you than the Bezier-related segments. However, Bezier lines are one of the most important mathematical representations of curves and surfaces used in computer graphics and CAD applications. Bezier curves are polynomial curves based on a complicated mathematical representation. Fortunately, no mathematical knowledge is required in order to use the Bezier curves in WPF.
Lines and Polylines It is easy to create a simple line using the LineSegment and PathGeometry classes. For example, the following XAML snippet begins at (10, 10), draws a straight line to (150, 150), and then draws a line from (150, 150) to (150, 200):
<Path Stroke="Black"> <Path.Data> <PathGeometry> <PathFigure StartPoint="10,10"> <LineSegment Point="150,150"/> <LineSegment Point="150,200"/> </PathFigure> </PathGeometry> </Path.Data> </Path>
The PolyLineSegment creates a series of straight lines. You can get the same effect using multiple LineSegment objects, but a single PolyLineSegment is simpler. The following code creates a polyline:
<Path Stroke="Blue"> <Path.Data> <PathGeometry> <PathFigure StartPoint="100,120"> <PolyLineSegment Points="200,120,200,220,100,170"/> </PathFigure> </PathGeometry> </Path.Data> </Path>
Note that the number of PathFigure objects in a PathGeometry element is unlimited. This means that you can create several separate open or closed figures that are all considered part of the same path.
Arcs An ArcSegment object is defined by its start and end points; its X and Y radii specified by the Size property; its X axis rotation factor, a value indicating whether the arc should be greater than 180 degrees;

CHAPTER 3 ■ WPF GRAPHICS BASICS IN 2D
100
and a value describing the direction in which the arc is drawn. Like the LineSegment, the ArcSegment class doesn’t contain a property for the starting point of the arc; it only defines the destination point of the arc it represents. The beginning point of the arc is the current point of the PathFigure to which the ArcSegment is added.
The following markup creates an ellipse shape using two ArcSegment objects:
<Path Stroke="Blue"> <Path.Data> <PathGeometry> <PathFigure StartPoint="100,50"> <ArcSegment Point="200,50" Size="50,30" SweepDirection="Counterclockwise"/> </PathFigure> <PathFigure StartPoint="100,50"> <ArcSegment Point="200,50" Size="50,30" SweepDirection="Clockwise"/> </PathFigure> </PathGeometry> </Path.Data> </Path>
The complete markup file for Lines, PolyLines, and Arcs is given in the LineCurveExample.xaml file in the project GraphicsBasics.
Bezier Curves It is also easy to create a Bezier curve using the BezierSegment object. Note that a Bezier curve is defined by four points: a start point, an end point, and two control points. The BezierSegment class doesn’t contain a property for the starting point of the curve; it only defines the end point. The beginning point of the curve is the current point of the PathFigure to which the BezierSegment is added.
The two control points of a cubic Bezier curve behave like magnets, attracting portions of what would otherwise be a straight line toward themselves and producing a curve. The first control point affects the beginning portion of the curve; the second control point affects the ending portion of the curve. The curve doesn’t necessarily pass through either of the control points; each control point moves its portion of the line toward itself, not through itself.
The following example shows a Bezier curve whose two control points are animated. The X coordinate of the first control point and the Y coordinate of the second control point vary in the range [50, 250]. You can clearly see how the Bezier curve changes shape when the control points are animated.
Add a new WPF Window to the project GraphicsBasics and name it AnimateBezierCurve. Here is the markup for this example:
<Window x:Class="GraphicsBasics.AnimateBezierCurve" xmlns="http://schemas.microsoft.com/winfx/2006/xaml/presentation" xmlns:x="http://schemas.microsoft.com/winfx/2006/xaml" Title="Bezier Curve" Height="300" Width="300"> <Viewbox Stretch="Fill"> <Border Margin="5" BorderBrush="Black" BorderThickness="1" Background="{StaticResource MyGrayGridBrush}" HorizontalAlignment="Left"> <Canvas x:Name="canvas1" Width="300" Height="270"> <Path Stroke="Black" StrokeThickness="5"> <Path.Data>
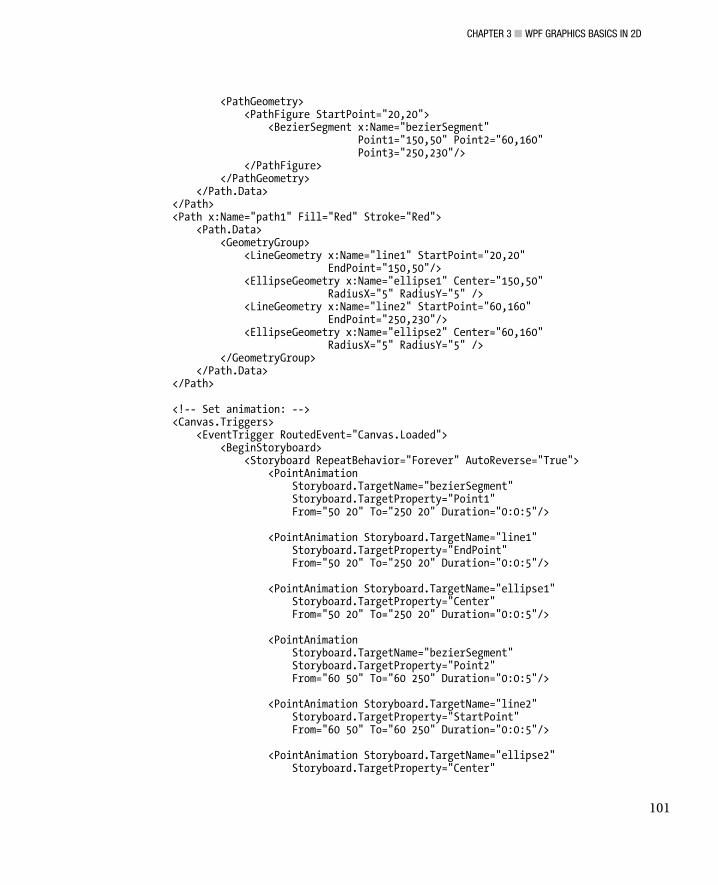
CHAPTER 3 ■ WPF GRAPHICS BASICS IN 2D
101
<PathGeometry> <PathFigure StartPoint="20,20"> <BezierSegment x:Name="bezierSegment" Point1="150,50" Point2="60,160" Point3="250,230"/> </PathFigure> </PathGeometry> </Path.Data> </Path> <Path x:Name="path1" Fill="Red" Stroke="Red"> <Path.Data> <GeometryGroup> <LineGeometry x:Name="line1" StartPoint="20,20" EndPoint="150,50"/> <EllipseGeometry x:Name="ellipse1" Center="150,50" RadiusX="5" RadiusY="5" /> <LineGeometry x:Name="line2" StartPoint="60,160" EndPoint="250,230"/> <EllipseGeometry x:Name="ellipse2" Center="60,160" RadiusX="5" RadiusY="5" /> </GeometryGroup> </Path.Data> </Path> <!-- Set animation: --> <Canvas.Triggers> <EventTrigger RoutedEvent="Canvas.Loaded"> <BeginStoryboard> <Storyboard RepeatBehavior="Forever" AutoReverse="True"> <PointAnimation Storyboard.TargetName="bezierSegment" Storyboard.TargetProperty="Point1" From="50 20" To="250 20" Duration="0:0:5"/> <PointAnimation Storyboard.TargetName="line1" Storyboard.TargetProperty="EndPoint" From="50 20" To="250 20" Duration="0:0:5"/> <PointAnimation Storyboard.TargetName="ellipse1" Storyboard.TargetProperty="Center" From="50 20" To="250 20" Duration="0:0:5"/> <PointAnimation Storyboard.TargetName="bezierSegment" Storyboard.TargetProperty="Point2" From="60 50" To="60 250" Duration="0:0:5"/> <PointAnimation Storyboard.TargetName="line2" Storyboard.TargetProperty="StartPoint" From="60 50" To="60 250" Duration="0:0:5"/> <PointAnimation Storyboard.TargetName="ellipse2" Storyboard.TargetProperty="Center"

CHAPTER 3 ■ WPF GRAPHICS BASICS IN 2D
102
From="60 50" To="60 250" Duration="0:0:5"/> </Storyboard> </BeginStoryboard> </EventTrigger> </Canvas.Triggers> </Canvas> </Border> </Viewbox> </Window>
This XAML file creates a Bezier curve using BezierSegment. The two control points, Point1 and Point2, of the Bezier curve are marked specifically by two ellipse shapes. At the same time, two line segments are created to guide your eye during the animation. The first line segment connects the starting point and Point1; the second segment connects the end point and Point2.
The animation is performed within a Storyboard element using PointAnimation. Here, you animate not only the control points of the Bezier curve but also the red dots (ellipses) and the guide lines.
This example produces the result shown in Figure 3-27, where you can see how the Bezier curve changes when the control points move.
Figure 3-27. A Bezier curve in WPF
Geometry and Mini-Language StreamGeometry is a light-weight alternative to the PathGeometry class for creating complex geometric shapes. You can use StreamGeometry when you need to describe a complex geometry but don’t want the overhead of supporting data binding, animation, and modification. WPF supports a powerful mini-language that you can use to describe geometric paths.

CHAPTER 3 ■ WPF GRAPHICS BASICS IN 2D
103
There are two classes in WPF that provide the mini-language for describing geometric paths: StreamGeometry and PathFigureCollection. You need to use the StreamGeometry mini-language when you set a property of the Geometry type, such as the Data property of a Path element. On the other hand, you use the PathFigureCollection mini-language when you set the Figures property of a PathGeometry.
To understand the mini-language, you need to realize that it is simply a long string holding a series of commands. These commands are used by WPF to create corresponding geometries. Each command is a single letter followed by numeric information separated by spaces or commas.
For example, in the earlier section, you created a polyline with a PathGeometry using the following XAML snippet:
<Path Stroke="Blue"> <Path.Data> <PathGeometry> <PathFigure StartPoint="100,120"> <PolyLineSegment Points="200,120,200,220,100,170"/> </PathFigure> </PathGeometry> </Path.Data> </Path>
You can use the StreamGeometry mini-language to duplicate this polyline:
<Path Stroke="Blue" Data="M 100 120 L 200 120 L 200 220 L 100 170"/>
This path uses a sequence of four commands. The first command, M, creates the PathFigure and sets the starting point to (100, 120). The following three commands (L) create line segments.
When you create a StreamGeometry object using the StreamGeometry mini-language, you can’t modify the geometry later on in your code. If this isn’t acceptable, you can create a PathGeometry using the PathFigureCollection mini-language. The following example uses attribute syntax to create a PathFigure collection for a PathGeometry:
<Path Stroke="Blue"> <Path.Data> <PathGeometry Figures="M 100 120 L 200 120 L 200 220 L 100 170"/> </Path.Data> </Path>
As you can see from the preceding examples, the two mini-languages are very similar. It is always possible to use PathGeometry in any situation where you could use StreamGeometry; so which one should you use? Use StreamGeometry when you don’t need to modify the path after creating it; use PathGeometry if you do need to modify the path in your code.
It is easy to use the mini-language to create complex geometry shapes. The mini-language involves a fairly small set of commands, which are listed for your reference in Table 3-1.

CHAPTER 3 ■ WPF GRAPHICS BASICS IN 2D
104
Table 3-1. Commands for the Geometry Mini-Language
Name Command Description
Fill rule F0 or F1 Specifies geometry’s FillRule property. F0 for EvenOdd, F1 for NonZero. This command must appear at beginning of the string.
Move M startPt or m startPt Creates a new PathFigure and sets its start point. This command must be used before any other commands except for F0 or F1.
Line L endPt or l endPt Creates a LineSegment from the current point to the specified end point.
Horizontal line H x or h x Creates a horizontal line between the current point and the specified X-coordinate.
Vertical line V y or v y Creates a vertical line between the current point and the specified Y-coordinate.
Cubic Bezier curve C pt1, pt2, endPt or c pt1, pt2, endPt
Creates a cubic Bezier curve between the current point and the specified end point by using the two specified control points (pt1 and pt2).
Quadratic Bezier curve Q pt, endPt or q pt, endPt
Creates a quadratic Bezier curve between the current point and the specified end point using the specified control point (pt).
Smooth cubic Bezier curve S pt2, endPt or s pt2, endPt
Creates a cubic Bezier curve between the current point and specified end point. The first control point is assumed to be the reflection of the second control point of the previous command relative to the current point.
Smooth Quadratic Bezier curve
T pt, endPt or t pt, endPt
Creates a quadratic Bezier curve between the current point and the specified end point. The control point is assumed to be the reflection of the control point of the previous command relative to the current point.
Elliptical Arc A size, angle, isLargeArc, Direction, endPt or a size, angle, …
Creates an elliptical arc between the current point and the specified end point. You specify the size of the ellipse, the rotation angle, and Boolean flags that set the IsLargeArc and SweepDirection properties.
Close Z, z Ends the current figure and creates a line that connects the current point to the starting point of the figure. You don’t need to use this command if you don’t want to close the path.
Point X, Y or x, y Describe the X and Y coordinates of a point.
Special values Infinity or -Infinity or NaN
Instead of a standard numerical value, you can use these special values, which are case-sensitive.
The commands with uppercase letters use absolute coordinates; the commands with lowercase letters evaluate parameters relative to the previous point.

CHAPTER 3 ■ WPF GRAPHICS BASICS IN 2D
105
Hit Testing When you create interactive 2D drawing applications in WPF, you can deal directly with the user’s interaction with the graphics objects using mouse event handlers. However, WPF provides powerful hit-testing for graphics objects through the static VisualTreeHelper.HitTest method. When you develop interactive 2D drawing applications, you can perform tasks such as dragging, moving, dropping, and deleting shapes more efficiently using the HitTest method. In particular, when you design a complex application that contains overlapped visuals, the HitTest method allow you to retrieve all the visuals (not just the topmost visual) at a specified point, even the visuals obscured underneath other visuals. You can also find all the visuals that fall within a given geometry.
In order to use this advanced hit-testing feature, you need to create a callback. The VisualTreeHelper will then walk through your visuals from top to bottom. Whenever it finds a match, it calls the callback with the details. You can then choose to stop the search or to continue until no more visuals remain.
The following example shows how to use this advanced hit-testing feature. Add a new WPF Window to the project GraphicsBasics and name it HitTestExample. In this example, you’ll create several rectangle shapes on a Canvas, some of which overlap each other. The program will tell you how many rectangles are hit when the user clicks a point on the rectangles. Here is the XAML file for this example:
<Window x:Class="GraphicsBasics.HitTestExample" xmlns="http://schemas.microsoft.com/winfx/2006/xaml/presentation" xmlns:x="http://schemas.microsoft.com/winfx/2006/xaml" Title="Chapter04" Height="300" Width="300"> <Canvas x:Name="canvas1" MouseLeftButtonDown="OnMouseLeftButtonDown"> <Rectangle Canvas.Left="20" Canvas.Top="20" Width="100" Height="60" Stroke="Black" Fill="LightBlue" Opacity="0.7"/> <Rectangle Canvas.Left="70" Canvas.Top="50" Width="100" Height="60" Stroke="Black" Fill="LightBlue" Opacity="0.7"/> <Rectangle Canvas.Left="150" Canvas.Top="80" Width="100" Height="60" Stroke="Black" Fill="LightBlue" Opacity="0.7"/> <Rectangle Canvas.Left="20" Canvas.Top="100" Width="50" Height="50" Stroke="Black" Fill="LightBlue" Opacity="0.7"/> <Rectangle Canvas.Left="40" Canvas.Top="60" Width="50" Height="50" Stroke="Black" Fill="LightBlue" Opacity="0.7"/> <Rectangle Canvas.Left="30" Canvas.Top="130" Width="50" Height="50" Stroke="Black" Fill="LightBlue" Opacity="0.7"/> </Canvas> </Window>
This XAML file adds six rectangles to the Canvas. The hit-testing is performed in code:
using System; using System.Collections.Generic; using System.Windows; using System.Windows.Controls; using System.Windows.Input; using System.Windows.Media; using System.Windows.Shapes; namespace GraphicsBasics { public partial class HitTestExample : Window {

CHAPTER 3 ■ WPF GRAPHICS BASICS IN 2D
106
private List<Rectangle> hitList = new List<Rectangle>(); private EllipseGeometry hitArea = new EllipseGeometry(); public HitTestExample() { InitializeComponent(); Initialize(); } private void Initialize() { foreach (Rectangle rect in canvas1.Children) { rect.Fill = Brushes.LightBlue; } } private void OnMouseLeftButtonDown( object sender, MouseButtonEventArgs e) { // Initialization: Initialize(); // Get mouse click point: Point pt = e.GetPosition(canvas1); // Define hit-testing area: hitArea = new EllipseGeometry(pt, 1.0, 1.0); hitList.Clear(); // Call HitTest method: VisualTreeHelper.HitTest(canvas1, null, new HitTestResultCallback(HitTestCallback), new GeometryHitTestParameters(hitArea)); if (hitList.Count > 0) { foreach (Rectangle rect in hitList) { // Change rectangle fill color if it is hit: rect.Fill = Brushes.LightCoral; } MessageBox.Show("You hit " + hitList.Count.ToString() + "rectangles."); } } public HitTestResultBehavior HitTestCallback( HitTestResult result) { // Retrieve the results of the hit test. IntersectionDetail intersectionDetail = ((GeometryHitTestResult)result).IntersectionDetail;
CHAPTER 3 ■ WPF GRAPHICS BASICS IN 2D
107
switch (intersectionDetail) { case IntersectionDetail.FullyContains: // Add the hit test result to the list: hitList.Add((Rectangle)result.VisualHit); return HitTestResultBehavior.Continue; case IntersectionDetail.Intersects: // Set the behavior to return visuals at all z-order levels: return HitTestResultBehavior.Continue; case IntersectionDetail.FullyInside: // Set the behavior to return visuals at all z-order levels: return HitTestResultBehavior.Continue; default: return HitTestResultBehavior.Stop; } } } }
In this code-behind file, you expand the hit-test area using an EllipseGeometry. When the user clicks on the Canvas, the program starts the hit-testing process by calling the HitTestCallback method. If it hits any rectangle, that rectangle will be added to the hitList. When the process is finished, the program gives a collection in the hitList with all of the rectangles it found.
Note that the HitTestCallback method implements the hit-testing behavior. Usually, the HitTestResult object provides just a single property (VisualHit), but you can cast it to one of two derived types, depending on the type of hit-test you’re performing.
If you’re hit-testing a point, you can cast HitTestResult to PointHitTestResult, which provides a PointHit property that returns the original point you used to perform the hit-test. If you are hit-testing a Geometry object (or shape), as you are in this example, you can cast HitTestResult to GeometryHitTestResult and get access to the IntersectionDetail property. This property tells you whether your geometry (hitArea) completely wraps your rectangle (FullyInside), overlaps it (Intersect), or is fully inside of it (FullyContains). In this example, you implement all these options in the HitTestCallback. You can choose any of these options, depending on the requirements of your application. In this example, hits are counted only if the geometry (hitArea) is completely inside the rectangle (FullyContains). Finally, at the end of the callback, you can return one of two values from the HitTestResultBehavior enumeration: Either continue looking for hits, or stop the hit-testing process.
Figure 3-28 shows results of running this example.

CHAPTER 3 ■ WPF GRAPHICS BASICS IN 2D
108
Figure 3-28. Hit-testing in WPF.
Custom Shapes Sometimes, you may find that the simple shapes defined in WPF aren’t enough for advanced graphics applications. In these cases, you can create custom shapes that derive from the Shape class. The custom shapes you create in this way inherit all of the properties and methods of the Shape class and become FrameworkElement objects. Therefore, you can use them in your applications just like standard WPF shapes such as Line, Rectangle, Ellipse, and Polygon.
In this section, I’ll show you how to create some commonly used custom shapes, including a Star, ArrowLine, and USFlag. By following the procedure presented here, you can easily develop your own custom-shape library.
Star Class Creating a custom shape is relatively easy. You simply need to inherit the custom shape that you want to create from the abstract Shape class and provide an override for the getter of the DefiningGeometry property. This returns the Geometry object, which defines the geometry of your shape.
CHAPTER 3 ■ WPF GRAPHICS BASICS IN 2D
109
Let’s consider an example that shows how to create a custom Star shape. Open the project GraphicsBasics and add a new class, called Star, to the project. I first list the code and then explain how it works.
using System; using System.Windows; using System.Windows.Media; using System.Windows.Shapes; namespace GraphicsBasics { public class Star : Shape { protected PathGeometry pg; PathFigure pf; PolyLineSegment pls; public Star() { pg = new PathGeometry(); pf = new PathFigure(); pls = new PolyLineSegment(); pg.Figures.Add(pf); } // Specify the center of the star public static readonly DependencyProperty CenterProperty = DependencyProperty.Register("Center", typeof(Point), typeof(Star), new FrameworkPropertyMetadata(new Point(20.0, 20.0), FrameworkPropertyMetadataOptions.AffectsMeasure)); public Point Center { set { SetValue(CenterProperty, value); } get { return (Point)GetValue(CenterProperty); } } // Specify the size of the star: public static readonly DependencyProperty SizeRProperty = DependencyProperty.Register("SizeR", typeof(double), typeof(Star), new FrameworkPropertyMetadata(10.0, FrameworkPropertyMetadataOptions.AffectsMeasure)); public double SizeR { set { SetValue(SizeRProperty, value); } get { return (double)GetValue(SizeRProperty); } } protected override Geometry DefiningGeometry { get { double r = SizeR;

CHAPTER 3 ■ WPF GRAPHICS BASICS IN 2D
110
double x = Center.X; double y = Center.Y; double sn36 = Math.Sin(36.0 * Math.PI / 180.0); double sn72 = Math.Sin(72.0 * Math.PI / 180.0); double cs36 = Math.Cos(36.0 * Math.PI / 180.0); double cs72 = Math.Cos(72.0 * Math.PI / 180.0); pf.StartPoint = new Point(x, y - r); pls.Points.Add(new Point(x + r * sn36, y + r * cs36)); pls.Points.Add(new Point(x - r * sn72, y - r * cs72)); pls.Points.Add(new Point(x + r * sn72, y - r * cs72)); pls.Points.Add(new Point(x - r * sn36, y + r * cs36)); pls.Points.Add(new Point(x, y - r)); pf.Segments.Add(pls); pf.IsClosed = true; pg.FillRule = FillRule.Nonzero; return pg; } } } }
In order to draw a Star shape, you need to have a reference to two parameters. One is the Center (a Point object) of the Star; the other is the size of the Star, named SizeR (a double object). However, you need to add two dependency properties in the preceding code for these two parameters. You may notice that these two properties are passed into the DependencyProperty.Register method. This registration process is necessary in order to expose these properties to the user.
Next, you override the getter of the DefiningGeometry property. Here the Star shape is created using the PolyLineSegment object. First, you need to define the coordinates of the Star. As illustrated in Figure 3-29, we assume that the center coordinates of the star are at (x, y) and that r is the radius of the circle around the star shape. In this notation, r is the same as SizeR. The angle α is equal to 72 degrees and β is equal to 36 degrees. From this figure, you can easily determine the coordinates of points 0 to 4, as shown in Table 3-2.

CHAPTER 3 ■ WPF GRAPHICS BASICS IN 2D
111
Figure 3-29. Coordinates of the Star shape
Table 3-2. Coordinates of the Star
Point X Coordinate Y Coordinate
0 x y – r
1 x + r * sin y + r * cos
2 x – r * sin y – r * cos
3 x + r * sin y – r * cos
4 x – r * sin y + r * cos
Note that the NonZero fill rule is used here. As discussed previously in this chapter, with Nonzero, WPF follows the same line-counting process as the default EvenOdd fill rule, but it takes into account the direction that each line flows. If the number of lines going in one direction is equal to the number going in the opposite direction, the region is not filled. Otherwise, the region will be filled. You can see from Figure 3-29 that the pentagon at the center will be filled because the difference between these two counts is not zero. If you had set the fill rule to EvenOdd, the pentagon at the center would not be filled because you must cross two lines to get out of the pentagon.

CHAPTER 3 ■ WPF GRAPHICS BASICS IN 2D
112
Using this information and the Star class, you can easily create a custom Star shape (see the U.S. flag example in the upcoming section “Testing Custom Shapes”).
ArrowLine Class As mentioned previously in this chapter, you can specify the end caps of a line shape through its StrokeStartLineCap and StrokeEndLineCap properties. However, the size of these caps is always the same as the StrokeThickness. Thus, it is impossible to create a line with an arrowhead using these properties.
Instead, you can create an arrowhead line using a custom shape class. In this class, in addition to the standard line properties, such as X1, Y1, X2, and Y2, you need to add four more dependency properties that are used to control the arrowhead: ArrowheadSizeX, ArrowheadSizeY, ArrowheadEnd, and IsArrowheadClosed. The ArrowheadSizeX and ArrowheadSizeY properties are used to specify the size of the arrowhead, as defined in Figure 3-30. The ArrowheadEnd property allows you to select whether the arrowhead should be at the start point, the end point, both ends, or neither end of the line. The IsArrowheadClosed property lets you set the arrowhead type as open or closed, as illustrated in Figure 3-30.
Figure 3-30. Arrowheads to be used in the ArrowLine class
Open the project GraphicsBasics and add a class named ArrowLine to the project. This class also inherits from the Shape class. Here is the C# code for this class:
using System; using System.Windows; using System.Windows.Media; using System.Windows.Shapes;

CHAPTER 3 ■ WPF GRAPHICS BASICS IN 2D
113
namespace GraphicsBasics { public class ArrowLine : Shape { protected PathGeometry pg; protected PathFigure pf; protected PolyLineSegment pls; PathFigure pfStartArrow; PolyLineSegment plsStartArrow; PathFigure pfEndArrow; PolyLineSegment plsEndArrow; public ArrowLine() { pg = new PathGeometry(); pf = new PathFigure(); pls = new PolyLineSegment(); pf.Segments.Add(pls); pfStartArrow = new PathFigure(); plsStartArrow = new PolyLineSegment(); pfStartArrow.Segments.Add(plsStartArrow); pfEndArrow = new PathFigure(); plsEndArrow = new PolyLineSegment(); pfEndArrow.Segments.Add(plsEndArrow); } // Specify the X1 dependency property: public static readonly DependencyProperty X1Property = DependencyProperty.Register("X1", typeof(double), typeof(ArrowLine), new FrameworkPropertyMetadata(0.0, FrameworkPropertyMetadataOptions.AffectsMeasure)); public double X1 { set { SetValue(X1Property, value); } get { return (double)GetValue(X1Property); } } // Specify the Y1 dependency property: public static readonly DependencyProperty Y1Property = DependencyProperty.Register("Y1", typeof(double), typeof(ArrowLine), new FrameworkPropertyMetadata(0.0, FrameworkPropertyMetadataOptions.AffectsMeasure)); public double Y1 { set { SetValue(Y1Property, value); } get { return (double)GetValue(Y1Property); } } // Specify the X2 dependency property:

CHAPTER 3 ■ WPF GRAPHICS BASICS IN 2D
114
public static readonly DependencyProperty X2Property = DependencyProperty.Register("X2", typeof(double), typeof(ArrowLine), new FrameworkPropertyMetadata(0.0, FrameworkPropertyMetadataOptions.AffectsMeasure)); public double X2 { set { SetValue(X2Property, value); } get { return (double)GetValue(X2Property); } } // Specify the Y2 dependency property: public static readonly DependencyProperty Y2Property = DependencyProperty.Register("Y2", typeof(double), typeof(ArrowLine), new FrameworkPropertyMetadata(0.0, FrameworkPropertyMetadataOptions.AffectsMeasure)); public double Y2 { set { SetValue(Y2Property, value); } get { return (double)GetValue(Y2Property); } } // Specify the arrowhead size in the x direction: public static readonly DependencyProperty ArrowheadSizeXProperty = DependencyProperty.Register("ArrowheadSizeX", typeof(double), typeof(ArrowLine), new FrameworkPropertyMetadata(10.0, FrameworkPropertyMetadataOptions.AffectsMeasure)); public double ArrowheadSizeX { set { SetValue(ArrowheadSizeXProperty, value); } get { return (double)GetValue(ArrowheadSizeXProperty); } } // Specify the arrowhead size in the y direction: public static readonly DependencyProperty ArrowheadSizeYProperty = DependencyProperty.Register("ArrowheadSizeY", typeof(double), typeof(ArrowLine), new FrameworkPropertyMetadata(10.0, FrameworkPropertyMetadataOptions.AffectsMeasure)); public double ArrowheadSizeY { set { SetValue(ArrowheadSizeYProperty, value); } get { return (double)GetValue(ArrowheadSizeYProperty); } } // Specify arrowhead ends: public static readonly DependencyProperty ArrowheadEndProperty =

CHAPTER 3 ■ WPF GRAPHICS BASICS IN 2D
115
DependencyProperty.Register("ArrowheadEnd", typeof(ArrowheadEndEnum), typeof(ArrowLine), new FrameworkPropertyMetadata(ArrowheadEndEnum.End, FrameworkPropertyMetadataOptions.AffectsMeasure)); public ArrowheadEndEnum ArrowheadEnd { set { SetValue(ArrowheadEndProperty, value); } get { return (ArrowheadEndEnum)GetValue(ArrowheadEndProperty);} } // Specify IsArrowheadClosed property public static readonly DependencyProperty IsArrowheadClosedProperty = DependencyProperty.Register("IsArrowheadClosed", typeof(bool), typeof(ArrowLine), new FrameworkPropertyMetadata(false, FrameworkPropertyMetadataOptions.AffectsMeasure)); public bool IsArrowheadClosed { set { SetValue(IsArrowheadClosedProperty, value); } get { return (bool)GetValue(IsArrowheadClosedProperty); } } protected override Geometry DefiningGeometry { get { pg.Figures.Clear(); pf.StartPoint = new Point(X1, Y1); pls.Points.Clear(); pls.Points.Add(new Point(X2, Y2)); pg.Figures.Add(pf); if (pls.Points.Count > 0) { Point pt1 = new Point(); Point pt2 = new Point(); if ((ArrowheadEnd & ArrowheadEndEnum.Start) == ArrowheadEndEnum.Start) { pt1 = pf.StartPoint; pt2 = pls.Points[0]; pg.Figures.Add(CreateArrowhead(pfStartArrow, pt2, pt1)); } if ((ArrowheadEnd & ArrowheadEndEnum.End) == ArrowheadEndEnum.End) {

CHAPTER 3 ■ WPF GRAPHICS BASICS IN 2D
116
pt1 = pls.Points.Count == 1 ? pf.StartPoint : pls.Points[pls.Points.Count - 2]; pt2 = pls.Points[pls.Points.Count - 1]; pg.Figures.Add(CreateArrowhead(pfEndArrow, pt1, pt2)); } } return pg; } } PathFigure CreateArrowhead(PathFigure pathFigure, Point pt1, Point pt2) { Point pt = new Point(); Vector v = new Vector(); Matrix m = ArrowheadTransform(pt1, pt2); PolyLineSegment pls1 = pathFigure.Segments[0] as PolyLineSegment; pls1.Points.Clear(); if (!IsArrowheadClosed) { v = new Point(0, 0) – new Point(ArrowheadSizeX / 2, ArrowheadSizeY); pt = pt2 + v * m; pathFigure.StartPoint = pt; pls1.Points.Add(pt2); v = new Point(0, 0) – new Point(-ArrowheadSizeX / 2, ArrowheadSizeY); pt = pt2 + v * m; pls1.Points.Add(pt); } else if (IsArrowheadClosed) { v = new Point(0, 0) – new Point(ArrowheadSizeX / 2, 0); pt = pt2 + v * m; pathFigure.StartPoint = pt; v = new Point(0, 0) – new Point(0, -ArrowheadSizeY); pt = pt2 + v * m; pls1.Points.Add(pt); v = new Point(0, 0) – new Point(-ArrowheadSizeX / 2, 0); pt = pt2 + v * m; pls1.Points.Add(pt); } pathFigure.IsClosed = IsArrowheadClosed; return pathFigure; } private Matrix ArrowheadTransform(Point pt1, Point pt2) { Matrix m = new Matrix(); double theta = 180 * (Math.Atan((pt2.X - pt1.X) / (pt2.Y - pt1.Y))) / Math.PI; double dx = pt2.X - pt1.X; double dy = pt2.Y - pt1.Y;

CHAPTER 3 ■ WPF GRAPHICS BASICS IN 2D
117
if (dx >= 0 && dy >= 0) theta = -theta; else if (dx < 0 && dy >= 0) theta = -theta; else if (dx < 0 && dy < 0) theta = 180 - theta; else if (dx >= 0 && dy < 0) theta = 180 - theta; m.Rotate(theta); return m; } } public enum ArrowheadEndEnum { None = 0, Start = 1, End = 2, Both = 3 } }
In this class, you add eight dependency properties and pass them to the DependencyProperty.Register method. This registration process is necessary in order to expose these properties to the user.
Next, you override the getter of the DefiningGeometry property. The arrowhead line is created using PolyLineSegment. The arrowhead is first created in the absolute coordinate system and then placed at the starting or end point of the line using matrix transforms.
Following the procedures presented here, you can create more custom shapes and build you own custom-2D-shape library.
Testing Custom Shapes The custom shapes Star and ArrowLine created in the preceding sections can be used the same way as the standard shapes in WPF and in both XAML and code-behind files. In order to use custom shapes in XAML files, you need to add the project in which the custom shape classes reside to the xmlns namespace. This way, the markup code can find the location of your custom classes. In our case, you need to add the following line:
xmlns:local="clr-namespace:GraphicsBasics"
Let’s consider an example in which you first create a U.S. flag in code using the custom Star shape, then create a Star and two arrowhead lines in the XAML file, and finally perform various transforms and animations to the star and arrowhead lines.
Add a new WPF Window to the project GraphicsBasics and name it CustomShape. Here is the markup for this example:
<Window x:Class="GraphicsBasics.CustomShape" xmlns="http://schemas.microsoft.com/winfx/2006/xaml/presentation" xmlns:x="http://schemas.microsoft.com/winfx/2006/xaml" xmlns:local="clr-namespace:GraphicsBasics" Title="Custom Shapes" Height="400" Width="300">
CHAPTER 3 ■ WPF GRAPHICS BASICS IN 2D
118
<Viewbox Stretch="Uniform"> <Border Margin="5" BorderBrush="Black" BorderThickness="1" Background="LightCyan" HorizontalAlignment="Left"> <Canvas x:Name="canvas1" Width="300" Height="375" ClipToBounds="True"> <local:Star x:Name="star1" Canvas.Top="190" Canvas.Left ="50" Fill="Red" Stroke="Blue" SizeR="30" Center="0,20"> <local:Star.RenderTransform> <TransformGroup> <ScaleTransform x:Name="starScale" CenterX="0" CenterY="20" /> <TranslateTransform x:Name="starTranslate"/> </TransformGroup> </local:Star.RenderTransform> </local:Star> <local:ArrowLine x:Name="arrowLine1" Canvas.Top="280" X1="50" Y1="20" X2="100" Y2="20" Stroke="Blue" Fill="Red" IsArrowheadClosed="True" ArrowheadEnd="Both"> <local:ArrowLine.RenderTransform> <ScaleTransform x:Name="line1Scale"/> </local:ArrowLine.RenderTransform> </local:ArrowLine> <local:ArrowLine x:Name="arrowLine2" Canvas.Top="250" X1="150" Y1="20" X2="230" Y2="20" Stroke="Blue" StrokeThickness="3"> <local:ArrowLine.RenderTransform> <RotateTransform x:Name="line2Rotate" CenterX="150" CenterY="20"/> </local:ArrowLine.RenderTransform> </local:ArrowLine> </Canvas> </Border> </Viewbox> </Window>
Here is the corresponding code-behind file:
using System; using System.Windows; using System.Windows.Controls; using System.Windows.Media; using System.Windows.Media.Animation; using System.Windows.Shapes; namespace GraphicsBasics { public partial class CustomShape : Window { public CustomShape() { InitializeComponent(); AddUSFlag(10, 10, 280); StartAnimation(); }

CHAPTER 3 ■ WPF GRAPHICS BASICS IN 2D
119
private void AddUSFlag(double x0, double y0, double width) { SolidColorBrush whiteBrush = new SolidColorBrush(Colors.White); SolidColorBrush blueBrush = new SolidColorBrush(Colors.DarkBlue); SolidColorBrush redBrush = new SolidColorBrush(Colors.Red); Rectangle rect = new Rectangle(); double height = 10 * width / 19; //Draw white rectangle background: rect.Fill = whiteBrush; rect.Width = width; rect.Height = height; Canvas.SetLeft(rect, x0); Canvas.SetTop(rect, y0); canvas1.Children.Add(rect); // Draw seven red stripes: for (int i = 0; i < 7; i++) { rect = new Rectangle(); rect.Fill = redBrush; rect.Width = width; rect.Height = height / 13; Canvas.SetLeft(rect, x0); Canvas.SetTop(rect, y0 + 2 * i * height / 13); canvas1.Children.Add(rect); } // Draw blue box: rect = new Rectangle(); rect.Fill = blueBrush; rect.Width = 2 * width / 5; rect.Height = 7 * height / 13; Canvas.SetLeft(rect, x0); Canvas.SetTop(rect, y0); canvas1.Children.Add(rect); // Draw fifty stars: double offset = rect.Width / 40; double dx = (rect.Width - 2 * offset) / 11; double dy = (rect.Height - 2 * offset) / 9; for (int j = 0; j < 9; j++) { double y = y0 + offset + j * dy + dy / 2; for (int i = 0; i < 11; i++) { double x = x0 + offset + i * dx + dx / 2; if ((i + j) % 2 == 0) { Star star = new Star(); star.Fill = whiteBrush; star.SizeR = width / 55;

CHAPTER 3 ■ WPF GRAPHICS BASICS IN 2D
120
star.Center = new Point(x, y); canvas1.Children.Add(star); } } } } private void StartAnimation() { // Animating the star: AnimationTimeline at = new DoubleAnimation(0.1, 1.2, new Duration(new TimeSpan(0, 0, 5))); at.RepeatBehavior = RepeatBehavior.Forever; at.AutoReverse = true; starScale.BeginAnimation(ScaleTransform.ScaleXProperty, at); starScale.BeginAnimation(ScaleTransform.ScaleYProperty, at); at = new DoubleAnimation(0, 200, new Duration(new TimeSpan(0, 0, 3))); at.RepeatBehavior = RepeatBehavior.Forever; at.AutoReverse = true; starTranslate.BeginAnimation(TranslateTransform.XProperty, at); // Animating arrowline1: at = new DoubleAnimation(0, 2.5, new Duration(new TimeSpan(0, 0, 4))); at.RepeatBehavior = RepeatBehavior.Forever; at.AutoReverse = true; line1Scale.BeginAnimation(ScaleTransform.ScaleXProperty, at); line1Scale.BeginAnimation(ScaleTransform.ScaleYProperty, at); // Animating arrowline2: at = new DoubleAnimation(0, 50, new Duration(new TimeSpan(0, 0, 5))); at.RepeatBehavior = RepeatBehavior.Forever; at.AutoReverse = true; arrowLine2.BeginAnimation(ArrowLine.ArrowheadSizeXProperty, at); arrowLine2.BeginAnimation(ArrowLine.ArrowheadSizeYProperty, at); at = new DoubleAnimation(0, 360, new Duration(new TimeSpan(0, 0, 5))); at.RepeatBehavior = RepeatBehavior.Forever; line2Rotate.BeginAnimation(RotateTransform.AngleProperty, at); } } }
In the foregoing code, the AddUSFlag method creates a U.S. flag. You can specify the location and width of the flag. Inside this method, the 50 stars on the U.S. flag are drawn using the custom Star class. Next, you perform the animations for a star and arrow lines using various transforms. Note here that the animation is implemented in code instead of the Storyboard approach in XAML, which was used in earlier sections of this chapter.
Running this example produces the output shown in Figure 3-31.

CHAPTER 3 ■ WPF GRAPHICS BASICS IN 2D
121
Figure 3-31. Graphics objects created using custom-shape classes

CHAPTER 3 ■ WPF GRAPHICS BASICS IN 2D
122
C H A P T E R 4
■ ■ ■
123
Colors and Brushes
Almost everything visible on your computer screen is somehow related to colors and brushes. For example, you use a brush with a specified color to paint the background of a button, the foreground of text, and the fill of a shape. We have used colors and brushes throughout this book, but so far we have done most of the work with the simple SolidColorBrush object. In fact, you can use colors and brushes to paint user interface and graphics objects with anything from simple solid colors to complex sets of patterns and images. This chapter covers the color system and some of the brushes defined in WPF. It also discusses custom colormap brushes and color shading, which will be useful in 3D surface chart applications. Some more advanced brushes, such as Image and Visual brushes, and brush transformations are beyond the scope of this book.
Colors In WPF, a color is specified as a Color structure from the System.Windows.Media namespace. This Color structure describes a color in terms of alpha (A), red (R), green (G), and blue (B) channels. WPF uses two color systems, sRGB and ScRGB. You can specify a color using either system.
sRGB is a standard RGB color space created cooperatively by HP and Microsoft for use in monitors, printers, and the Internet. It is designed to match typical home and office viewing conditions. sRGB has found wide applications. Software, LCD displays, digital cameras, printers, and scanners all follow the sRGB standard. For this reason, you can assume that any 8-bit image file or device interface falls in the sRGB color space.
ScRGB system is the latest color space developed by Microsoft. This system offers 64-bit encoding with 16 bits per channel, which allows you to specify over 65,000 steps for each color instead of the 256 steps available with sRGB’s 8 bits per channel.
Unlike sRGB, ScRGB allows negative values and values above 1.0, which significantly improves color processing. In manipulating color information based on sRGB, most applications have to cut off anything below 0 (black) and anything above 1 (white), resulting in the discarding of some of the color information.
Microsoft’s goal for ScRGB is to give it the ease of use and simplicity of sRGB. This means that it should require little or no extra work to take advantage of it. However, there is a trade-off involved: ScRGB will make more demands on performance and bandwidth, which makes it unacceptable for low-end systems. Since no ScRGB devices are available yet, it isn’t clear how the system will translate into real-world applications.
WPF allows you to specify a color using both sRGB and ScRGB. Several ways to create color are available in WPF, including:

CHAPTER 4 ■ COLORS AND BRUSHES
124
• An ARGB color value. You specify each value as an integer in the range [0, 255].
• A ScRGB value. The current version of the ScRGB system in WPF has a value range of [0, 1].
• A predefined color name. You choose the correspondingly named property from the System.Windows.Media.Colors class. The Colors class has 141 predefined color names.
In addition, you may find the ColorConverter class useful. This class allows you to convert a color from a string, or vice versa.
System Colors In WPF, as mentioned previously, a color is represented by a 32-bit structure made of four components: A, R, G, and B, referred to as sRGB. Color can also be represented by a 64-bit structure made up of four components: ScA, ScR, ScG, ScB, referred to as ScRGB. In the sRGB system, the components’ values range from 0 to 255; in the ScRGB system, this range becomes [0, 1] in the current WPF implementation. The alpha component of the color represents transparency, which determines how much a color is blended with the background. An alpha value of zero represents a fully transparent color; a value of 255 in sRGB or 1 in ScRGB represents a fully opaque color.
The following code snippet shows several ways to specify a color:
Color color = new Color(); //Create a color from a RGB value: color = Color.FromRgb(255, 0, 0); // Create a color from an ARGB value: color = Color.FromArgb(100, 255, 0, 0); // Create a color from a ScRGB value: color = Color.FromScRgb(0.5f, 1.0f, 0.0f, 0.0f); // Create a color using predefined color names: color = Colors.Red; // Create a color using ColorConverter: color = (Color)ColorConverter.ConvertFromString("#FFFF0000");
Pay attention to the ScRGB value. It requires a Float value rather than a Double value. You can also use a few methods on any Color structure to retrieve color information. For example, you can use a predefined color name from the Colors class to obtain corresponding color information, including sRGB and ScRGB values.
Let’s look at an example that puts all of these techniques to work. Start with a new WPF Windows project and name it ColorsAndBrushes. Add a StartMenu Window as you did in the projects presented in the previous chapters. Then add a new WPF Window called SystemColors to the project.
This example allows you to select a color from a ListBox loaded with all of the predefined color names in the Colors class. When you type the Opacity in a TextBox and select an item from the ListBox, the Fill color of a rectangle is changed accordingly.
Here is the markup for this example:
<Window x:Class="ColorsAndBrushes.SystemColors" xmlns="http://schemas.microsoft.com/winfx/2006/xaml/presentation" xmlns:x="http://schemas.microsoft.com/winfx/2006/xaml" Title="System Colors" Height="350" Width="350"> <Grid> <Grid.ColumnDefinitions>

CHAPTER 4 ■ COLORS AND BRUSHES
125
<ColumnDefinition Width="145"/> <ColumnDefinition Width="145"/> </Grid.ColumnDefinitions> <StackPanel Grid.Column="0" Margin="5"> <TextBlock Text ="Select Color" Margin="5,5,5,0"/> <ListBox x:Name="listBox1" SelectionChanged="listBox1SelectionChanged" Height="100" Margin="5"/> <TextBlock Text="Show selected color:" Margin="5,5,5,0"/> <Rectangle x:Name="rect1" Stroke="Blue" Fill="AliceBlue" Height="100" Width="122" Margin="5"/> </StackPanel> <StackPanel Grid.Column="1" Margin="5"> <TextBlock Text="Opacity:" Margin="5,5,5,0"/> <TextBox Name="textBox" HorizontalAlignment="Left" TextAlignment="Center" Text="1" Width="50" Margin ="5,5,5,8"/> <Separator></Separator> <TextBlock FontWeight="Bold" Text="sRGB Information:" Margin="5,5,5,2"/> <TextBlock Name="tbAlpha" Text="Alpha =" Margin="5,0,5,2"/> <TextBlock Name="tbRed" Text="Red =" Margin="5,0,5,2"/> <TextBlock Name="tbGreen" Text="Green =" Margin="5,0,5,2"/> <TextBlock Name="tbBlue" Text="Blue =" Margin="5,0,5,2"/> <TextBlock Name="tbRGB" Text="ARGB Hex =" Margin="5,0,5,5"/> <Separator/> <TextBlock FontWeight="Bold" Text="ScRGB Information:" Margin="5,5,5,2"/> <TextBlock Name="tbScA" Text="ScA =" Margin="5,0,5,2"/> <TextBlock Name="tbScR" Text="ScR =" Margin="5,0,5,2"/> <TextBlock Name="tbScG" Text="ScG =" Margin="5,0,5,2" /> <TextBlock Name="tbScB" Text="ScB =" Margin="5,0,5,2"/> </StackPanel> </Grid> </Window>
Here is the corresponding code-behind file for this example:
using System; using System.Windows; using System.Windows.Controls; using System.Windows.Input; using System.Windows.Media; using System.Windows.Shapes; using System.Reflection; using System.Collections.Generic; namespace ColorsAndBrushes { public partial class SystemColors : System.Windows.Window { private Color color; SolidColorBrush colorBrush = new SolidColorBrush(); public SystemColors() {

CHAPTER 4 ■ COLORS AND BRUSHES
126
InitializeComponent(); Type colorsType = typeof(Colors); foreach (PropertyInfo property in colorsType.GetProperties()) { listBox1.Items.Add(property.Name); color = Colors.AliceBlue; listBox1.SelectedIndex = 0; ColorInfo(); } } private void listBox1SelectionChanged(object sender, EventArgs e) { string colorString = listBox1.SelectedItem.ToString(); color = (Color)ColorConverter.ConvertFromString(colorString); float opacity = Convert.ToSingle(textBox.Text); if (opacity > 1) opacity = 1.0f; else if (opacity < 0) opacity = 0.0f; color.ScA = opacity; ColorInfo(); } private void ColorInfo() { rect1.Fill = new SolidColorBrush(color); // sRGB color info : tbAlpha.Text = "Alpha = " + color.A.ToString(); tbRed.Text = "Red = " + color.R.ToString(); tbGreen.Text = "Green = " + color.G.ToString(); tbBlue.Text = "Blue = " + color.B.ToString(); string rgbHex = string.Format("{0:X2}{1:X2}{2:X2}{3:X2}", color.A, color.R, color.G,color.B); tbRGB.Text = "ARGB = #" + rgbHex; // ScRGB color info: tbScA.Text = "ScA = " + color.ScA.ToString(); tbScR.Text = "ScR = " + color.ScR.ToString(); tbScG.Text = "ScG = " + color.ScG.ToString(); tbScB.Text = "ScB = " + color.ScB.ToString(); } } }
To put all of the predefined color names from the Colors class into the ListBox, you use the following foreach loop:
Type colorsType = typeof(Colors); foreach (PropertyInfo property in colorsType.GetProperties()) { listBox1.Items.Add(property.Name); …… }

CHAPTER 4 ■ COLORS AND BRUSHES
127
You also need a using System.Reflection statement to make this loop work. You simply retrieve the PropertyInfo of the Colors class and place its name into the ListBox. Now change the Opacity (within the range of 0 to 1) in the TextBox and select the item from the ListBox. The rectangle’s fill color will change correspondingly, and the color information will also display on your screen. Note that if you change the opacity after selecting a color from the list box, you have to click the color again in the list box in order to update the opacity. Figure 4-1 shows the result of running this example.
Figure 4-1. Color information in WPF
Color Picker You might have noticed that unlike GDI+ and Window Forms, WPF unfortunately lacks a few standard common dialogs. For example, WPF doesn’t implement a ColorDialog. If you want to have a color picker-like functionality, you need to create a custom ColorDialog control by yourself.
Fortunately, the WPF team did create several sample custom dialogs, including a ColorPickerDialog. I don’t want to reinvent the wheel, so instead I’ll show you how to use this ColorPickerDialog in your own WPF applications.
The ColorPickerDialog control is packed in a ColorPicker.dll. You can download this package from the following link:
http://blogs.msdn.com/wpfsdk/archive/2006/10/26/Uncommon-Dialogs--Font-Chooser-and-Color-Picker-Dialogs.aspx
If you want to use this control in a WPF application, you can simply add the DLL file to the References for your project. You also need to add a using statement such as this:
using Microsoft.Samples.CustomControls;

CHAPTER 4 ■ COLORS AND BRUSHES
128
Then you can create an instance of the color dialog:
ColorPickerDialog cPicker = new ColorPickerDialog();
Here, I’ll present an example that shows you how to use this color dialog in a simple 2D drawing application. In this application, you can draw Rectangle and Ellipse shapes with your mouse. You can then change the fill color of a selected shape using the ColorPickerDialog.
Open the project ColorsAndBrushes and add a new WPF Window called ColorPicker to the project. Here is the markup for this example:
<Window x:Class="ColorsAndBrushes.ColorPicker" xmlns="http://schemas.microsoft.com/winfx/2006/xaml/presentation" xmlns:x="http://schemas.microsoft.com/winfx/2006/xaml" Title="Color Picker" Height="300" Width="300"> <DockPanel> <ToolBarTray DockPanel.Dock="Left" Orientation="Vertical" IsLocked="True"> <ToolBar Padding="2"> <RadioButton x:Name="rbRectangle" IsChecked="True" ToolTip="Add Rectangle" Margin="3"> <Rectangle Width="20" Height="12" Stroke="Blue" Fill="LightBlue"/> </RadioButton> <RadioButton x:Name="rbEllipse" IsChecked="False" ToolTip="Add Ellipse" Margin="3"> <Ellipse Width="22" Height="15" Stroke="Blue" Fill="LightBlue"/> </RadioButton> <RadioButton x:Name="rbSelect" IsChecked="False" ToolTip="Select" Margin="3"> <Path Stroke="Blue" Fill="LightBlue" Width="20" Height="20"> <Path.Data> <PathGeometry Figures="M5,15 L 10,0 15,15 12,15 12,20 8,20 8,15Z"> <PathGeometry.Transform> <RotateTransform CenterX="10" CenterY="10" Angle="45"/> </PathGeometry.Transform> </PathGeometry> </Path.Data> </Path> </RadioButton> <RadioButton x:Name="rbDelete" IsChecked="False" ToolTip="Delete Shape" Margin="3"> <Path Stroke="Blue" Fill="LightBlue" Width="20" Height="20"> <Path.Data> <CombinedGeometry> <CombinedGeometry.Geometry1> <PathGeometry Figures="M0,0 L 15,20 15,15 20,15Z"/> </CombinedGeometry.Geometry1> <CombinedGeometry.Geometry2> <PathGeometry Figures="M20,0 L 0,15 5,15 5,20Z"/>

CHAPTER 4 ■ COLORS AND BRUSHES
129
</CombinedGeometry.Geometry2> </CombinedGeometry> </Path.Data> </Path> </RadioButton> <Separator Margin="0,10,0,10"></Separator> <TextBlock Margin="10,3,0,0">Fill</TextBlock> <Button Click="btnFill_Click" Background="Transparent"> <Rectangle x:Name="rectFill" Width="20" Height="20" Stroke="Black" Fill="LightBlue"/> </Button> </ToolBar> </ToolBarTray> <Border BorderThickness="2" BorderBrush="LightBlue" Margin="5"> <Canvas Name="canvas1" Background="Transparent" MouseLeftButtonDown="OnMouseLeftButtonDown" MouseMove="OnMouseMove" MouseLeftButtonUp="OnMouseLeftButtonUp"> </Canvas> </Border> </DockPanel> </Window>
The foregoing XAML file creates a user interface and layout for this example. Here is the corresponding code-behind file:
using System; using System.Windows; using System.Windows.Controls; using System.Windows.Input; using System.Windows.Media; using System.Windows.Shapes; using Microsoft.Samples.CustomControls; namespace ColorsAndBrushes { public partial class ColorPicker : System.Windows.Window { private Rectangle rubberBand; private Point startPoint; private Point currentPoint; private Path selectedShape; private double selectedStrokeThickness = 5; private double originalStrokeThickness = 1; private SolidColorBrush strokeBrush = new SolidColorBrush(Colors.Blue); private SolidColorBrush fillBrush = new SolidColorBrush(Colors.LightBlue); public ColorPicker() { InitializeComponent(); }
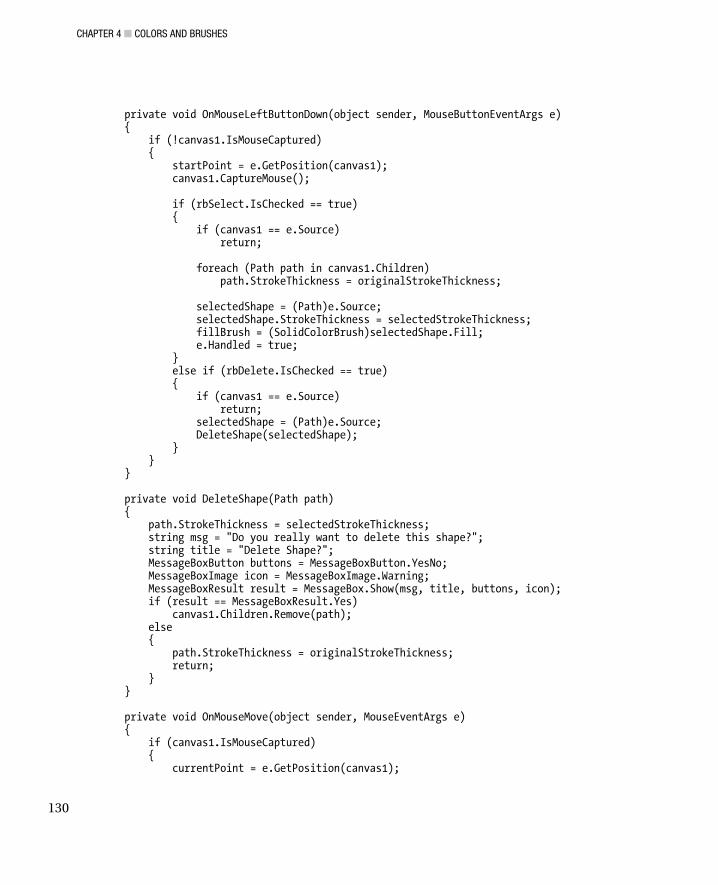
CHAPTER 4 ■ COLORS AND BRUSHES
130
private void OnMouseLeftButtonDown(object sender, MouseButtonEventArgs e) { if (!canvas1.IsMouseCaptured) { startPoint = e.GetPosition(canvas1); canvas1.CaptureMouse(); if (rbSelect.IsChecked == true) { if (canvas1 == e.Source) return; foreach (Path path in canvas1.Children) path.StrokeThickness = originalStrokeThickness; selectedShape = (Path)e.Source; selectedShape.StrokeThickness = selectedStrokeThickness; fillBrush = (SolidColorBrush)selectedShape.Fill; e.Handled = true; } else if (rbDelete.IsChecked == true) { if (canvas1 == e.Source) return; selectedShape = (Path)e.Source; DeleteShape(selectedShape); } } } private void DeleteShape(Path path) { path.StrokeThickness = selectedStrokeThickness; string msg = "Do you really want to delete this shape?"; string title = "Delete Shape?"; MessageBoxButton buttons = MessageBoxButton.YesNo; MessageBoxImage icon = MessageBoxImage.Warning; MessageBoxResult result = MessageBox.Show(msg, title, buttons, icon); if (result == MessageBoxResult.Yes) canvas1.Children.Remove(path); else { path.StrokeThickness = originalStrokeThickness; return; } } private void OnMouseMove(object sender, MouseEventArgs e) { if (canvas1.IsMouseCaptured) { currentPoint = e.GetPosition(canvas1);

CHAPTER 4 ■ COLORS AND BRUSHES
131
if (rubberBand == null) { rubberBand = new Rectangle(); rubberBand.Stroke = Brushes.LightCoral; rubberBand.StrokeDashArray = new DoubleCollection(new double[] { 4, 2 }); if (rbRectangle.IsChecked == true || rbEllipse.IsChecked == true) { canvas1.Children.Add(rubberBand); } } double width = Math.Abs(startPoint.X - currentPoint.X); double height = Math.Abs(startPoint.Y - currentPoint.Y); double left = Math.Min(startPoint.X, currentPoint.X); double top = Math.Min(startPoint.Y, currentPoint.Y); rubberBand.Width = width; rubberBand.Height = height; Canvas.SetLeft(rubberBand, left); Canvas.SetTop(rubberBand, top); } } private void OnMouseLeftButtonUp(object sender, MouseButtonEventArgs e) { if (rbRectangle.IsChecked == true) AddShape(startPoint, currentPoint, "rectangle"); else if (rbEllipse.IsChecked == true) AddShape(startPoint, currentPoint, "ellipse"); if (rubberBand != null) { canvas1.Children.Remove(rubberBand); rubberBand = null; canvas1.ReleaseMouseCapture(); } } private void AddShape(Point pt1, Point pt2, string s) { Path path = new Path(); path.Fill = fillBrush; path.Stroke = strokeBrush; path.StrokeThickness = originalStrokeThickness; if (s == "rectangle") { RectangleGeometry geometry = new RectangleGeometry(); double width = Math.Abs(pt1.X - pt2.X); double height = Math.Abs(pt1.Y - pt2.Y); double left = Math.Min(pt1.X, pt2.X); double top = Math.Min(pt1.Y, pt2.Y); geometry.Rect = new Rect(left, top, width, height); path.Data = geometry;

CHAPTER 4 ■ COLORS AND BRUSHES
132
} else if (s == "ellipse") { EllipseGeometry geometry = new EllipseGeometry(); double width = Math.Abs(pt1.X - pt2.X); double height = Math.Abs(pt1.Y - pt2.Y); double left = Math.Min(pt1.X, pt2.X); double top = Math.Min(pt1.Y, pt2.Y); geometry.Center = new Point(left + width / 2, top + height / 2); geometry.RadiusX = width / 2; geometry.RadiusY = height / 2; path.Data = geometry; } canvas1.Children.Add(path); } private void btnFill_Click(object sender, RoutedEventArgs e) { ColorPickerDialog cPicker = new ColorPickerDialog(); cPicker.StartingColor = fillBrush.Color; cPicker.Owner = this; rectFill.Fill = fillBrush; bool? dialogResult = cPicker.ShowDialog(); if (dialogResult != null && (bool)dialogResult == true) { if (selectedShape != null) { if (selectedShape.StrokeThickness == selectedStrokeThickness) { selectedShape.Fill = new SolidColorBrush(cPicker.SelectedColor); selectedShape.StrokeThickness = originalStrokeThickness; } } fillBrush = new SolidColorBrush(cPicker.SelectedColor); rectFill.Fill = fillBrush; } } } }
This application allows you to add Rectangle and Ellipse shapes and lets you change the color of a selected shape using the ColorPickerDialog control. The btnFill_Click handler is responsible for the color changes made using the color picker control. Figure 4-2 shows a snapshot of this example.

CHAPTER 4 ■ COLORS AND BRUSHES
133
Figure 4-2. Change the fill color of a selected shape using the ColorPickerDialog
In this application, you draw shapes by selecting the Add Rectangle or Add Ellipse button. You can then change a shape’s fill color by clicking the Select button and then clicking on a shape, which will highlight the selected shape and increase its StrokeThickness (see Figure 4-2, in which the ellipse shape is selected). Then select the Fill button (the square beneath the word Fill), which brings up the ColorPickerDialog, as shown in Figure 4-3.
Figure 4-3. The color picker dialog, from which you can specify whatever color you like

CHAPTER 4 ■ COLORS AND BRUSHES
134
To use this color picker, you select a color by clicking the left color pane with your mouse and changing the R, G, and B components using the slider. The dialog also allows you to change the opacity of the color. You can preview the selected color in the Selected Color view window. If you’re satisfied with the selected color, click the OK button. The fill color of the selected shape will be changed.
The ColorPicker.dll file is located in the ColorsAndBrushes project’s /bin/Debug directory. You can use it in your application by adding it to the References for your project.
Brushes Brushes aren’t new to you. You have used brushes throughout this book, but so far you have done most of your work with the simple SolidColorBrush object. However, WPF provides a variety of brushes you can use to create graphically rich applications. A brush is much more than a means of applying color to pixels; it also allows you to paint with color, gradients, images, drawings, etc. A gradient brush lets you create glass effects or the illusion of depth. Painting with an ImageBrush object provides a means to stretch, tile, or fill an area with a specified bitmap. A VisualBrush allows you to fill an area with a visual from another part of the application’s visual tree. You can use this brush to create the illusion of reflection or magnification in your user interfaces.
In WPF, a brush paints an area with its output. Different brushes have different types of output:
• SolidColorBrush – Paints an area with a solid color. The color’s opacity can be changed.
• LinearGradientBrush – Paints an area with a linear gradient fill, that is a gradually shaded fill that changes from one color to another.
• RadialGradientBrush – Paints an area with a radial gradient fill, which is similar to a linear gradient except that the fill radiates out in a circular pattern from a center point.
• ImageBrush – Paints an area with an image that can be stretched, scaled, or tiled.
• DrawingBrush – Paints an area with a Drawing object. This object can be a shape or a bitmap.
• VisualBrush – Paints an area with a Visual object. A VisualBrush enables you to project content from one portion of your application to another area. It is useful for creating reflection effects and magnifying portions of the screen.
From this list, you can see that a brush can indeed provide output other than simple solid colors. By using the different brushes available in WPF, you can create interesting effects such as gradient, reflection, and lighting effects, among others.
In the following sections, you will explore some of these brushes, including SolidColorBrush, LinearGradientBrush, RadialGradientBrush, and DrawingBrush, and learn how to use them in your WPF applications.
SolidColorBrush The most common brush, and the simplest to use, is the SolidColorBrush. This brush simply paints an area with a solid color. Please note that a brush is different from a color. A brush is an object that tells the system to paint specific pixels with a specified output defined by the brush. A SolidColorBrush paints a color in a specific area of your screen. The output of a SolidColorBrush is the color.

CHAPTER 4 ■ COLORS AND BRUSHES
135
A SolidColorBrush can be defined by simply providing a value for its Color property. As mentioned previously, there are several ways to specify a color, including declaring sRGB or ScRGB values, using hexadecimal strings, using the predefined color names in the Colors class, and even using the ColorPickerDialog discussed in the preceding section. You can also specify the opacity of a SolidColorBrush.
As with the Colors class for colors, WPF provides some handy classes for brushes. The Brushes class, for example, exposes a set of predefined brushes based on solid colors. This provides a shortcut you can use for creating common solid color brushes.
Let’s consider an example, SolidColorBrushExample, in which you define a SolidColorBrush using different methods. Here, you create the interface and layout using XAML, while you fill the color of the Rectangle shapes using C# code. Of course, you can obtain the same results using either XAML or C# code only. The following is the XAML file for this example:
<Window x:Class="ColorsAndBrushes.SolidColorBrushExample" xmlns="http://schemas.microsoft.com/winfx/2006/xaml/presentation" xmlns:x="http://schemas.microsoft.com/winfx/2006/xaml" Title="Solid Color Brushes" Height="450" Width="300"> <Canvas Margin="5"> <StackPanel> <TextBlock Margin="0,0,0,5">Predefined Brush in the Brushes class:</TextBlock> <Rectangle x:Name="rect1" Width="100" Height="30" Stroke="Blue"/> <TextBlock Margin="0,10,0,5">From predefined color name in the Colors class:</TextBlock> <Rectangle x:Name="rect2" Width="100" Height="30" Stroke="Blue"/> <TextBlock Margin="0,10,0,5">From sRGB value in the Color structure:</TextBlock> <Rectangle x:Name="rect3" Width="100" Height="30" Stroke="Blue"/> <TextBlock Margin="0,10,0,5">From ScRGB value in the Color structure:</TextBlock> <Rectangle x:Name="rect4" Width="100" Height="30" Stroke="Blue"/> <TextBlock Margin="0,10,0,5">From Hex string using ColorConverter:</TextBlock> <Rectangle x:Name="rect5" Width="100" Height="30" Stroke="Blue"/> <TextBlock Margin="0,10,0,5">From ColorPickerDialog:</TextBlock> <Rectangle x:Name="rect6" Width="100" Height="30" Stroke="Blue" Fill="LightBlue"/> <Button Click="ChangeColor_Click" Width="100" Height="25" Content="Change Color" Margin="10"/> </StackPanel> </Canvas> </Window>
Here is the corresponding code-behind file for this example:
using System; using System.Windows; using System.Windows.Controls; using System.Windows.Input; using System.Windows.Media; using System.Windows.Shapes; using Microsoft.Samples.CustomControls;

CHAPTER 4 ■ COLORS AND BRUSHES
136
namespace ColorsAndBrushes { public partial class SolidColorBrushExample : System.Windows.Window { public SolidColorBrushes() { InitializeComponent(); SolidColorBrush brush = new SolidColorBrush(); // Predefined brush in Brushes Class: brush = Brushes.Red; rect1.Fill = brush; // From predefined color name in the Colors class: brush = new SolidColorBrush(Colors.Green); rect2.Fill = brush; // From sRGB values in the Color strutcure: brush = new SolidColorBrush(Color.FromArgb(100, 0, 0, 255)); rect3.Fill = brush; // From ScRGB values in the Color structure: brush = new SolidColorBrush(Color.FromScRgb(0.5f, 0.7f, 0.0f, 0.5f)); rect4.Fill = brush; // From a Hex string using ColorConverter: brush = new SolidColorBrush((Color)ColorConverter.ConvertFromString("#CBFFFFAA")); rect5.Fill = brush; } // From ColorPickerDialog: private void ChangeColor_Click(object sender, RoutedEventArgs e) { ColorPickerDialog cPicker = new ColorPickerDialog(); cPicker.StartingColor = Colors.LightBlue; cPicker.Owner = this; bool? dialogResult = cPicker.ShowDialog(); if (dialogResult != null && (bool)dialogResult == true) { rect6.Fill = new SolidColorBrush(cPicker.SelectedColor); } } } }
In this example, you create six Rectangle shapes and specify their Fill properties using a different SolidColorBrush for each of them. In particular, for rect6, you use the ColorPickerDialog to specify the color of the brush. You need to click the Change Color button to bring up the Color Picker window, from which you can select any color you like.
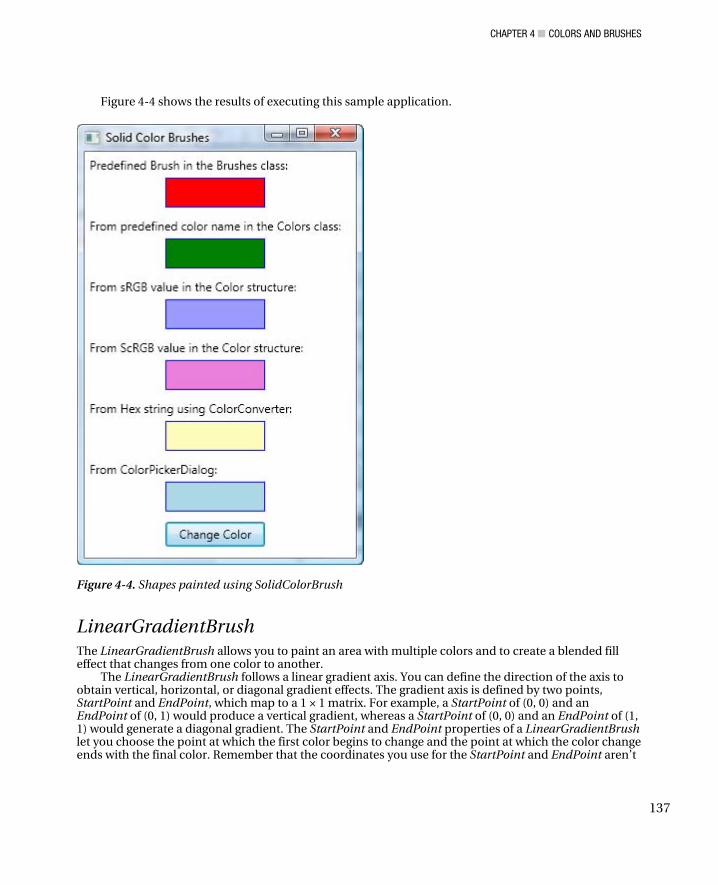
CHAPTER 4 ■ COLORS AND BRUSHES
137
Figure 4-4 shows the results of executing this sample application.
Figure 4-4. Shapes painted using SolidColorBrush
LinearGradientBrush The LinearGradientBrush allows you to paint an area with multiple colors and to create a blended fill effect that changes from one color to another.
The LinearGradientBrush follows a linear gradient axis. You can define the direction of the axis to obtain vertical, horizontal, or diagonal gradient effects. The gradient axis is defined by two points, StartPoint and EndPoint, which map to a 1 × 1 matrix. For example, a StartPoint of (0, 0) and an EndPoint of (0, 1) would produce a vertical gradient, whereas a StartPoint of (0, 0) and an EndPoint of (1, 1) would generate a diagonal gradient. The StartPoint and EndPoint properties of a LinearGradientBrush let you choose the point at which the first color begins to change and the point at which the color change ends with the final color. Remember that the coordinates you use for the StartPoint and EndPoint aren’t

CHAPTER 4 ■ COLORS AND BRUSHES
138
real coordinates. Instead, the LinearGradientBrush assigns the point (0, 0) to the top-left corner and (1, 1) to the bottom-right corner of the area you want to fill, no matter how high and wide it actually is.
Along the axis you specify a series of GradientStop objects, which are points on the axis at which you want the colors to blend and transition to other colors. You can define as many GradientStop objects as you need. A GradientStop object has two properties of interest, Color and Offset. The Offset property defines a distance, ranging from 0 to 1, from the start point of the axis at which the color specified in the Color property should begin.
Now let’s look at an example that uses the LinearGradientBrush. Add a new WPF Window, called LinearGradientBrushExample, to the project ColorsAndBrushes. Here is the markup for this example:
<Window x:Class="ColorsAndBrushes.LinearGradientBrushExample" xmlns="http://schemas.microsoft.com/winfx/2006/xaml/presentation" xmlns:x="http://schemas.microsoft.com/winfx/2006/xaml" Title="Linear Gradient Brushes" Height="400" Width="350"> <Grid> <Grid.ColumnDefinitions> <ColumnDefinition/> <ColumnDefinition/> </Grid.ColumnDefinitions> <Grid.RowDefinitions> <RowDefinition Height="Auto"/> <RowDefinition Height="Auto"/> <RowDefinition Height="Auto"/> </Grid.RowDefinitions> <StackPanel Grid.Column="0" Grid.Row="0"> <TextBlock Margin="5" Text="Vertical linear gradient:"/> <Rectangle Width="100" Height="75" Stroke="Blue"> <Rectangle.Fill> <LinearGradientBrush StartPoint="0,0" EndPoint="1,0"> <GradientStop Color="Blue" Offset="0"/> <GradientStop Color="Yellow" Offset="1"/> </LinearGradientBrush> </Rectangle.Fill> </Rectangle> </StackPanel> <StackPanel Grid.Column="1" Grid.Row="0"> <TextBlock Margin="5" Text="Horizontal linear gradient:"/> <Rectangle Width="100" Height="75" Stroke="Blue"> <Rectangle.Fill> <LinearGradientBrush StartPoint="0,0" EndPoint="0,1"> <GradientStop Color="Red" Offset="0"/> <GradientStop Color="White" Offset="1"/> </LinearGradientBrush> </Rectangle.Fill> </Rectangle> </StackPanel> <StackPanel Grid.Column="0" Grid.Row="1"> <TextBlock Margin="5,10,5,0" Text="Diagonal linear gradient"/> <TextBlock Margin="5,0,5,5" Text="- with 1 Offset for White"/> <Rectangle Width="100" Height="75" Stroke="Blue"> <Rectangle.Fill>

CHAPTER 4 ■ COLORS AND BRUSHES
139
<LinearGradientBrush StartPoint="0,0" EndPoint="1,1"> <GradientStop Color="Green" Offset="0"/> <GradientStop Color="White" Offset="1"/> </LinearGradientBrush> </Rectangle.Fill> </Rectangle> </StackPanel> <StackPanel Grid.Column="1" Grid.Row="1"> <TextBlock Margin="5,10,5,0" Text="Diagonal linear gradient"/> <TextBlock Margin="5,0,5,5" Text="- with 0.5 Offset for White"/> <Rectangle Width="100" Height="75" Stroke="Blue"> <Rectangle.Fill> <LinearGradientBrush StartPoint="0,0" EndPoint="1,1"> <GradientStop Color="Green" Offset="0"/> <GradientStop Color="White" Offset="0.5"/> </LinearGradientBrush> </Rectangle.Fill> </Rectangle> </StackPanel> <StackPanel Grid.Column="0" Grid.Row="2"> <TextBlock Margin="5,10,5,0" Text="Vertical linear gradient"/> <TextBlock Margin="5,0,5,5" Text="- multiple colors"/> <Rectangle Width="100" Height="75" Stroke="Blue"> <Rectangle.Fill> <LinearGradientBrush StartPoint="0,0" EndPoint="1,0"> <GradientStop Color="Red" Offset="0.3"/> <GradientStop Color="Yellow" Offset="0.5"/> <GradientStop Color="Blue" Offset="0.8"/> </LinearGradientBrush> </Rectangle.Fill> </Rectangle> </StackPanel> <StackPanel Grid.Column="1" Grid.Row="2"> <TextBlock Margin="5,10,5,0" Text="Diagonal linear gradient"/> <TextBlock Margin="5,0,5,5" Text="- multiple colors"/> <Rectangle Width="100" Height="75" Stroke="Blue"> <Rectangle.Fill> <LinearGradientBrush StartPoint="0,0" EndPoint="1,1"> <GradientStop Color="Red" Offset="0.2"/> <GradientStop Color="Yellow" Offset="0.3"/> <GradientStop Color="Coral" Offset="0.4"/> <GradientStop Color="Blue" Offset="0.5"/> <GradientStop Color="White" Offset="0.6"/> <GradientStop Color="Green" Offset="0.7"/> <GradientStop Color="Purple" Offset="0.8"/> </LinearGradientBrush> </Rectangle.Fill> </Rectangle> </StackPanel> </Grid> </Window>

CHAPTER 4 ■ COLORS AND BRUSHES
140
Figure 4-5 illustrates the results of this example.
Figure 4-5. Rectangles filled with different linear gradients
The first rectangle is filled by a LinearGradientBrush with a blue and yellow gradient along a vertical axis. The second rectangle is filled by a horizontal gradient brush with red and white colors. Now look at rect3 and rect4. Both rectangles are filled by a diagonal gradient brush with green and white colors. The GradientStop for the green color has an offset of 0, which means that the green color is placed at the very beginning of the gradient. The GradientStop for the white has an offset of 1 for rect3, which places the white color at the end. For rect4, however, the GradientStop offset of the white color is set to 0.5, resulting in the much quicker color blend from green (in the top-left corner) to white in the middle (the point between the two corners). It can be seen from Figure 4-5 that the right side of rect4 is almost completely white. The last two rectangles, rect5 and rect6, are filled by a multicolor GradientBrush, the first along a vertical gradient axis and the second along a diagonal gradient axis.
The LinearGradientBrush example presented here is intended to demonstrate the use of the brush’s basic features in WPF applications. In real-world applications, you may need to create a custom colormap in order to achieve specific visual effects. I’ll show you how to create custom colormap brushes later in this chapter.

CHAPTER 4 ■ COLORS AND BRUSHES
141
RadialGradientBrush The RadialGradientBrush works in a similar way to the LinearGradientBrush. Like the LinearGradientBrush, it takes a sequence of colors with different offsets, but blends the colors in a radial pattern. A radial gradient is defined as a circle. The axis of RadialGradientBrush starts from the origin, which is specified by its GradientOrigin, and runs to the outer edge of the circle.
You can set the edge of the gradient circle using three properties: Center, RadiusX, and RadiusY. By default, the Center property is set at (0.5, 0.5), which places the center of the circle in the middle of the fill region and in the same position as the gradient origin.
Let’s take a look at an example to see how the RadialGradientBrush works. Add a new WPF Window to the project ColorsAndBrushes and name it RadialGradientBrushExample. Here is the XAML file for this example:
<Window x:Class="ColorsAndBrushes.RadialGradientBrushExample" xmlns="http://schemas.microsoft.com/winfx/2006/xaml/presentation" xmlns:x="http://schemas.microsoft.com/winfx/2006/xaml" Title="Radial Gradient Brushes" Height="330" Width="380"> <Canvas> <Grid> <Grid.ColumnDefinitions> <ColumnDefinition/> <ColumnDefinition/> <ColumnDefinition/> </Grid.ColumnDefinitions> <Grid.RowDefinitions> <RowDefinition/> <RowDefinition/> </Grid.RowDefinitions> <StackPanel Grid.Column="0" Grid.Row="0" Margin="5"> <TextBlock Text="ellipse1" Margin="35,5,5,5"/> <Ellipse x:Name="ellipse1" Stroke="Blue" Width="100" Height="100" Margin="5"> <Ellipse.Fill> <RadialGradientBrush GradientOrigin="0.5,0.5" Center="0.5,0.5" RadiusX="1" RadiusY="1"> <GradientStop Color="Red" Offset="0" /> <GradientStop Color="Yellow" Offset="0.3" /> <GradientStop Color="Green" Offset="0.6" /> </RadialGradientBrush> </Ellipse.Fill> </Ellipse> </StackPanel> <StackPanel Grid.Column="1" Grid.Row="0" Margin="5"> <TextBlock Text="ellipse2" Margin="35,5,5,5"/> <Ellipse x:Name="ellipse2" Stroke="Blue" Width="100" Height="100" Margin="5"> <Ellipse.Fill> <RadialGradientBrush GradientOrigin="0.5,0.5" Center="0,0" RadiusX="1" RadiusY="1"> <GradientStop Color="Red" Offset="0" />

CHAPTER 4 ■ COLORS AND BRUSHES
142
<GradientStop Color="Yellow" Offset="0.3" /> <GradientStop Color="Green" Offset="0.6" /> </RadialGradientBrush> </Ellipse.Fill> </Ellipse> </StackPanel> <StackPanel Grid.Column="2" Grid.Row="0" Margin="5"> <TextBlock Text="ellipse3" Margin="35,5,5,5"/> <Ellipse x:Name="ellipse3" Stroke="Blue" Width="100" Height="100" Margin="5"> <Ellipse.Fill> <RadialGradientBrush GradientOrigin="0.5,0.5" Center="0.5,0.5" RadiusX="0.5" RadiusY="0.5"> <GradientStop Color="Red" Offset="0" /> <GradientStop Color="Yellow" Offset="0.3" /> <GradientStop Color="Green" Offset="0.6" /> </RadialGradientBrush> </Ellipse.Fill> </Ellipse> </StackPanel> <StackPanel Grid.Column="0" Grid.Row="1" Margin="5"> <TextBlock Text="ellipse4" Margin="35,5,5,5"/> <Ellipse x:Name="ellipse4" Stroke="Blue" Width="100" Height="100" Margin="5"> <Ellipse.Fill> <RadialGradientBrush GradientOrigin="0.5,0.5" Center="0,0" RadiusX="0.5" RadiusY="0.5"> <GradientStop Color="Red" Offset="0" /> <GradientStop Color="Yellow" Offset="0.3" /> <GradientStop Color="Green" Offset="0.6" /> </RadialGradientBrush> </Ellipse.Fill> </Ellipse> </StackPanel> <StackPanel Grid.Column="1" Grid.Row="1" Margin="5"> <TextBlock Text="ellipse5" Margin="35,5,5,5"/> <Ellipse x:Name="ellipse5" Stroke="Blue" Width="100" Height="100" Margin="5"> <Ellipse.Fill> <RadialGradientBrush GradientOrigin="0.5,0.5" Center="0.5,0.5" RadiusX="1" RadiusY="0.5"> <GradientStop Color="Red" Offset="0" /> <GradientStop Color="Yellow" Offset="0.3" /> <GradientStop Color="Green" Offset="0.6" /> </RadialGradientBrush> </Ellipse.Fill> </Ellipse> </StackPanel>

CHAPTER 4 ■ COLORS AND BRUSHES
143
<StackPanel Grid.Column="2" Grid.Row="1" Margin="5"> <TextBlock Text="ellipse6" Margin="35,5,5,5"/> <Ellipse x:Name="ellipse6" Stroke="Blue" Width="100" Height="100" Margin="5"> <Ellipse.Fill> <RadialGradientBrush GradientOrigin="0.5,0.5" Center="0.5,0.5" RadiusX="0.5" RadiusY="1"> <GradientStop Color="Red" Offset="0" /> <GradientStop Color="Yellow" Offset="0.3" /> <GradientStop Color="Green" Offset="0.6" /> </RadialGradientBrush> </Ellipse.Fill> </Ellipse> </StackPanel> </Grid> </Canvas> </Window>
This XAML file creates six circles using the Ellipse shape class. The first two circles are filled using a RadialGradientBrush with RadiusX = 1 and RadiusY = 1. The difference is that the brush for the first circle has a Center at (0.5, 0.5), which is the same as its GradientOrigin of (0.5, 0.5), whereas the brush for the second circle has a Center at (0, 0), which does not line up with its GradientOrigin of (0.5, 0.5). ellipse3 and ellipse4 have Fill properties similar to the first two shapes, but they have smaller RadiusX and RadiusY values. The final two circles have RadiusX and RadiusY properties that are not identical, which turns the gradient into an ellipse instead of a circle.
Figure 4-6 illustrates the results of running this example.
Figure 4-6. Shapes filled using RadialGradientBrush objects

CHAPTER 4 ■ COLORS AND BRUSHES
144
DrawingBrush DrawingBrush fills an area using a Drawing object. It can paint shapes, text, images, and video. The Drawing class represents a 2D drawing and is the base class for other drawing objects, including GeometryDrawing, GlyphRunDrawing, ImageDrawing, and VideoDrawing. The GeometryDrawing class allows you to define and render shapes using a specified Fill and Stroke. The GlyphRunDrawing class provides text operations.
The GeometryDrawing class adds the stroke and fill details that determine the way the geometry should be painted. There is another class that derives from Drawing class, the DrawingGroup, that allows you to group multiple Drawing objects together to create a single complex Drawing object.
The following example applies a DrawingBrush and DrawingGroup in order to draw gridlines for the background of a Grid control. Add a new WPF Window to the project ColorsAndBrushes and name it DrawingBrushes. Here is the XAML file for this example:
<Window x:Class="ColorsAndBrushes.DrawingBrushes" xmlns="http://schemas.microsoft.com/winfx/2006/xaml/presentation" xmlns:x="http://schemas.microsoft.com/winfx/2006/xaml" Title="Drawing Brushes - Gridline" Height="300" Width="300"> <Grid> <Grid.Background> <DrawingBrush Viewport="0,0,50,50" ViewportUnits="Absolute" TileMode="Tile"> <DrawingBrush.Drawing> <DrawingGroup> <DrawingGroup.Children> <GeometryDrawing Geometry="M0,0 L50,0"> <GeometryDrawing.Pen> <Pen Thickness="2" Brush="LightGreen"/> </GeometryDrawing.Pen> </GeometryDrawing> <GeometryDrawing Geometry="M0,10 L50,10"> <GeometryDrawing.Pen> <Pen Thickness="1" Brush="LightGreen"/> </GeometryDrawing.Pen> </GeometryDrawing> <GeometryDrawing Geometry="M0,20 L50,20"> <GeometryDrawing.Pen> <Pen Thickness="1" Brush="LightGreen"/> </GeometryDrawing.Pen> </GeometryDrawing> <GeometryDrawing Geometry="M0,30 L50,30"> <GeometryDrawing.Pen> <Pen Thickness="1" Brush="LightGreen"/> </GeometryDrawing.Pen> </GeometryDrawing> <GeometryDrawing Geometry="M0,40 L50,40"> <GeometryDrawing.Pen> <Pen Thickness="1" Brush="LightGreen"/> </GeometryDrawing.Pen> </GeometryDrawing>

CHAPTER 4 ■ COLORS AND BRUSHES
145
<GeometryDrawing Geometry="M0,0 L0,50"> <GeometryDrawing.Pen> <Pen Thickness="2" Brush="LightGreen"/> </GeometryDrawing.Pen> </GeometryDrawing> <GeometryDrawing Geometry="M10,0 L10,50"> <GeometryDrawing.Pen> <Pen Thickness="1" Brush="LightGreen"/> </GeometryDrawing.Pen> </GeometryDrawing> <GeometryDrawing Geometry="M20,0 L20,50"> <GeometryDrawing.Pen> <Pen Thickness="1" Brush="LightGreen"/> </GeometryDrawing.Pen> </GeometryDrawing> <GeometryDrawing Geometry="M30,0 L30,50"> <GeometryDrawing.Pen> <Pen Thickness="1" Brush="LightGreen"/> </GeometryDrawing.Pen> </GeometryDrawing> <GeometryDrawing Geometry="M40,0 L40,50"> <GeometryDrawing.Pen> <Pen Thickness="1" Brush="LightGreen"/> </GeometryDrawing.Pen> </GeometryDrawing> </DrawingGroup.Children> </DrawingGroup> </DrawingBrush.Drawing> </DrawingBrush> </Grid.Background> </Grid> </Window>
This example uses DrawingBrush to define the background of a Grid control. The Viewport and TileMode properties of DrawingBrush are specified so that the drawing repeats. Furthermore, the ViewportUnits are set to Absolute to make sure that the size of the gridlines doesn’t change when the Grid control is resized. Then the Drawing objects are created for the DrawingBrush using a DrawingGroup object. Next, we create five horizontal and five vertical line segments using GeometryDrawing with the Pen object. Notice that the topmost and leftmost line segments use a thick pen, which provides us with a better view of the gridlines. The Drawing element created using DrawingGroup is illustrated in Figure 4-7.

CHAPTER 4 ■ COLORS AND BRUSHES
146
Figure 4-7. Drawing Element (left) used to create gridlines (right)
If you repeat this Drawing element in both the X and Y directions by specifying the TileMode property of DrawingBrush, you’ll create gridlines that fill the entire Grid control, as shown in Figure 4.7.
Figure 4-8 shows the results of running this example.
Figure 4-8. Gridlines created using DrawingBrush objects
Remember that since the drawing-derived classes aren’t elements, they can’t be placed directly in your user interface. Instead, in order to display a drawing object, you need to paint it using DrawingBrush, as illustrated in the preceding example. The DrawingBrush allows you to wrap a drawing with a brush, and you can use it to paint any surface. There are several other ways you can display

CHAPTER 4 ■ COLORS AND BRUSHES
147
Drawing objects, including the DrawingImage and DrawingVisual classes. The DrawingImage class allows you to host a drawing inside an Image element; the DrawingVisual class lets you place a drawing in a lower-level visual object.
DrawingBrush is very flexible and powerful. It allows you to paint many low-level objects from the WPF framework. These objects don’t derive from the UIElement or FrameworkElement, so they don’t participate in the layout system, which makes them conveniently lightweight.
Custom Colormap and Shading Although WPF implements a variety of brushes that allow you to paint graphics objects with a wide range of visual effects, you may sometimes need to create your own custom brushes to meet the requirements of your specific applications, such as 3D surface charts. In this section, I’ll show you how to create brushes with custom colormaps and how to achieve a special shading effect with a bilinear interpolation.
Custom Colormap Brushes WPF includes a ColorMap class in the System.Windows.Media.Imaging namespace. This class defines a map between the existing colors and the new colors to which they are converted. When the map is applied, any pixel of the old color is converted into the new color. This class is useful for image processing applications.
However, in some charting applications, you may need custom colormaps to achieve specific visual effects, such as in pie and 3D surface charts. These colormaps are simply tables or lists of colors that are organized in some desired fashion, which cannot be created using the ColorMap class. The shape, surface, and image objects can be associated with a custom colormap. You can easily create a custom colormap brush using an m × 4 colormap matrix. Each row of this matrix represents an ARGB value. The row index can represent the Y data of a 2D chart or the height (the Z data) of a 3D surface graph. For a given colormap matrix with m rows, the color data values can be linearly scaled to the colormap.
For example, if you want to use the colormap to represent the Y coordinates of a 2D graphics object, you can use the Ymin and Ymax values to transform the Y data values linearly into indices, where each index identifies an ARGB row (i.e., a color) in the colormap matrix. The mathematical transformation of the color index values is described by the following formula:
(4.1)
Here y is the individual value of Y data and m is the length of the colormap matrix. This allows you to use the entire range of colors in the colormap over the plotted data. For 3D surface charts, replace the Y data with the Z data.
In some existing CAD and software development tools, many commonly used colormaps have already been defined. Here, I’ll show you how to create these colormaps in WPF applications. These colormaps will be used extensively in 3D chart applications in later chapters of this book.
Add a new class to the project ColorsAndBrushes and name it ColormapBrush. The following is the code listing for this class:

CHAPTER 4 ■ COLORS AND BRUSHES
148
using System; using System.Collections.Generic; using System.Windows; using System.Windows.Media; using System.Windows.Controls; namespace ColorsAndBrushes { public class ColormapBrush { private int colormapLength = 64; private byte alphaValue = 255; private double ymin = 0; private double ymax = 10; private int ydivisions = 10; private ColormapBrushEnum colormapBrushType = ColormapBrushEnum.Jet; public ColormapBrushEnum ColormapBrushType { get { return colormapBrushType; } set { colormapBrushType = value; } } public int ColormapLength { get { return colormapLength; } set { colormapLength = value; } } public byte AlphaValue { get { return alphaValue; } set { alphaValue = value; } } public double Ymin { get { return ymin; } set { ymin = value; } } public double Ymax { get { return ymax; } set { ymax = value; } } public int Ydivisions { get { return ydivisions; } set { ydivisions = value; } }

CHAPTER 4 ■ COLORS AND BRUSHES
149
public SolidColorBrush[] ColormapBrushes() { byte[,] cmap = new byte[ColormapLength, 4]; double[] array = new double[ColormapLength]; switch (ColormapBrushType) { case ColormapBrushEnum.Spring: for (int i = 0; i < ColormapLength; i++) { array[i] = 1.0 * i / (ColormapLength - 1); cmap[i, 0] = AlphaValue; cmap[i, 1] = 255; cmap[i, 2] = (byte)(255 * array[i]); cmap[i, 3] = (byte)(255 - cmap[i, 2]); } break; case ColormapBrushEnum.Summer: for (int i = 0; i < ColormapLength; i++) { array[i] = 1.0 * i / (ColormapLength - 1); cmap[i, 0] = AlphaValue; cmap[i, 1] = (byte)(255 * array[i]); cmap[i, 2] = (byte)(255 * 0.5 * (1 + array[i])); cmap[i, 3] = (byte)(255 * 0.4); } break; case ColormapBrushEnum.Autumn: for (int i = 0; i < ColormapLength; i++) { array[i] = 1.0 * i / (ColormapLength - 1); cmap[i, 0] = AlphaValue; cmap[i, 1] = 255; cmap[i, 2] = (byte)(255 * array[i]); cmap[i, 3] = 0; } break; case ColormapBrushEnum.Winter: for (int i = 0; i < ColormapLength; i++) { array[i] = 1.0 * i / (ColormapLength - 1); cmap[i, 0] = AlphaValue; cmap[i, 1] = 0; cmap[i, 2] = (byte)(255 * array[i]); cmap[i, 3] = (byte)(255 * (1.0 - 0.5 * array[i])); } break; case ColormapBrushEnum.Gray: for (int i = 0; i < ColormapLength; i++)

CHAPTER 4 ■ COLORS AND BRUSHES
150
{ array[i] = 1.0 * i / (ColormapLength - 1); cmap[i, 0] = AlphaValue; cmap[i, 1] = (byte)(255 * array[i]); cmap[i, 2] = (byte)(255 * array[i]); cmap[i, 3] = (byte)(255 * array[i]); } break; case ColormapBrushEnum.Jet: int n = (int)Math.Ceiling(ColormapLength / 4.0); double[,] cMatrix = new double[ColormapLength, 3]; int nMod = 0; double[] array1 = new double[3 * n - 1]; int[] red = new int[array1.Length]; int[] green = new int[array1.Length]; int[] blue = new int[array1.Length]; if (ColormapLength % 4 == 1) nMod = 1; for (int i = 0; i < array1.Length; i++) { if (i < n) array1[i] = (i + 1.0) / n; else if (i >= n && i < 2 * n - 1) array1[i] = 1.0; else if (i >= 2 * n - 1) array1[i] = (3.0 * n - 1.0 - i) / n; green[i] = (int)Math.Ceiling(n / 2.0) - nMod + i; red[i] = green[i] + n; blue[i] = green[i] - n; } int nb = 0; for (int i = 0; i < blue.Length; i++) { if (blue[i] > 0) nb++; } for (int i = 0; i < ColormapLength; i++) { for (int j = 0; j < red.Length; j++) { if (i == red[j] && red[j] < ColormapLength) cMatrix[i, 0] = array1[i - red[0]]; } for (int j = 0; j < green.Length; j++) { if (i == green[j] && green[j] < ColormapLength) cMatrix[i, 1] = array1[i - green[0]]; }

CHAPTER 4 ■ COLORS AND BRUSHES
151
for (int j = 0; j < blue.Length; j++) { if (i == blue[j] && blue[j] >= 0) cMatrix[i, 2] = array1[array1.Length - 1 - nb + i]; } } for (int i = 0; i < ColormapLength; i++) { cmap[i, 0] = AlphaValue; for (int j = 0; j < 3; j++) cmap[i, j + 1] = (byte)(cMatrix[i, j] * 255); } break; case ColormapBrushEnum.Hot: int n1 = (int)3 * ColormapLength / 8; double[] red1 = new double[ColormapLength]; double[] green1 = new double[ColormapLength]; double[] blue1 = new double[ColormapLength]; for (int i = 0; i < ColormapLength; i++) { if (i < n1) red1[i] = 1.0 * (i + 1.0) / n1; else red1[i] = 1.0; if (i < n1) green1[i] = 0.0; else if (i >= n1 && i < 2 * n1) green1[i] = 1.0 * (i + 1 - n1) / n1; else green1[i] = 1.0; if (i < 2 * n1) blue1[i] = 0.0; else blue1[i] = 1.0 * (i + 1 - 2 * n1) / (ColormapLength - 2 * n1); cmap[i, 0] = AlphaValue; cmap[i, 1] = (byte)(255 * red1[i]); cmap[i, 2] = (byte)(255 * green1[i]); cmap[i, 3] = (byte)(255 * blue1[i]); } break; case ColormapBrushEnum.Cool: for (int i = 0; i < ColormapLength; i++) { array[i] = 1.0 * i / (ColormapLength - 1); cmap[i, 0] = AlphaValue; cmap[i, 1] = (byte)(255 * array[i]); cmap[i, 2] = (byte)(255 * (1 - array[i])); cmap[i, 3] = 255;

CHAPTER 4 ■ COLORS AND BRUSHES
152
} break; } return SetBrush(cmap); } public enum ColormapBrushEnum { Spring = 0, Summer = 1, Autumn = 2, Winter = 3, Gray = 4, Jet = 5, Hot = 6, Cool = 7 } private SolidColorBrush[] SetBrush(byte[,] cmap) { SolidColorBrush[] brushes = new SolidColorBrush[Ydivisions]; double dy = (Ymax - Ymin) / (Ydivisions - 1); for (int i = 0; i < Ydivisions; i++) { int colorIndex = (int)((ColormapLength - 1) * i * dy / (Ymax - Ymin)); brushes[i] = new SolidColorBrush(Color.FromArgb( cmap[colorIndex, 0], cmap[colorIndex, 1], cmap[colorIndex, 2], cmap[colorIndex, 3])); } return brushes; } public SolidColorBrush GetBrush(double y) { SolidColorBrush brush = new SolidColorBrush(); double dy = (Ymax - Ymin) / (Ydivisions - 1); for (int i = 0; i < ColormapBrushes().Length; i++) { double y1 = Ymin + i * dy; if (y >= y1 && y < y1 + dy) brush = ColormapBrushes()[i]; } return brush; } } }
CHAPTER 4 ■ COLORS AND BRUSHES
153
This class defines a ColormapBrush object, which is actually a SolidColorBrush array. Each SolidColorBrush element in the array represents a different color specified by the corresponding elements of an m × 4 colormap matrix and is associated with a Y data value according to Equation (4.1), which is implemented in the SetBrushes method. Thus, a ColormapBrush allows you to use the entire range of colors in the colormap matrix over the plotted data. For 3D surface charts, replace the Y data with the Z data.
This class contains several public properties, including the ColormapLength, AlphaValue, Y data range, and number of Y data points. The ColormapLength property specifies how many individual colors a ColormapBrush object contains, and the AlphaValue property represents the color opacity.
The ColormapBrushEnum in the class allows you to select one of eight predefined ColormapBrush objects by their names: Spring, Summer, Autumn, Winter, Gray, Jet, Hot, and Cool. These names are commonly used in graphics and chart applications.
This class also implements a GetBrush method, which returns a SolidColorBrush element in the ColormapBrush object for a given Y data value. This method is especially useful in chart and graphics shading applications.
Testing Colormap Brushes Here, I’ll show you how to use the ColormapBrush class in your applications. Add a new WPF Window to the project ColorsAndBrushes and name it CustomColormapBrushes. Here is the XAML file for this example:
<Window x:Class="ColorsAndBrushes.CustomColormapBrushes" xmlns="http://schemas.microsoft.com/winfx/2006/xaml/presentation" xmlns:x="http://schemas.microsoft.com/winfx/2006/xaml" Title="Custom Colormap Brushes" Width="365" Height="300"> <Grid Margin="0" x:Name ="chartGrid" ClipToBounds="False" Background="Transparent" SizeChanged="chartGrid_SizeChanged"> <Canvas Margin="10" Name="chartCanvas" ClipToBounds="False" Background="#66CCCCCC"/> </Grid> </Window>
This XAML creates a resizable canvas element. The ColormapBrush objects used to fill the rectangles will be implemented in the following code-behind file:
using System; using System.Windows; using System.Windows.Controls; using System.Windows.Media; using System.Windows.Media.Imaging; using System.Windows.Shapes; namespace ColorsAndBrushes { public partial class CustomColormapBrushes : Window { public CustomColormapBrushes() { InitializeComponent(); }
CHAPTER 4 ■ COLORS AND BRUSHES
154
private void chartGrid_SizeChanged(object sender, SizeChangedEventArgs e) { chartCanvas.Width = chartGrid.ActualWidth -20 ; chartCanvas.Height = chartGrid.ActualHeight - 20; chartCanvas.Children.Clear(); AddColormap(); } private void AddColormap() { DrawColorbar(ColormapBrush.ColormapBrushEnum.Spring, 0); DrawColorbar(ColormapBrush.ColormapBrushEnum.Summer, 1); DrawColorbar(ColormapBrush.ColormapBrushEnum.Autumn, 2); DrawColorbar(ColormapBrush.ColormapBrushEnum.Winter, 3); DrawColorbar(ColormapBrush.ColormapBrushEnum.Gray, 4); DrawColorbar(ColormapBrush.ColormapBrushEnum.Jet, 5); DrawColorbar(ColormapBrush.ColormapBrushEnum.Hot, 6); DrawColorbar(ColormapBrush.ColormapBrushEnum.Cool, 7); } private void DrawColorbar(ColormapBrush.ColormapBrushEnum brushType, double offset) { double width = 30.0; double height = 20.0; ColormapBrush cb = new ColormapBrush(); cb.Ydivisions = 10; cb.ColormapBrushType = brushType; SolidColorBrush[] brush = cb.ColormapBrushes(); Rectangle rect; for (int i = 0; i < 10; i++) { rect = new Rectangle(); rect.Width = width; rect.Height = height; Canvas.SetTop(rect, 10 + i * 23); Canvas.SetLeft(rect, 10 + 40 * offset); rect.Fill = brush[i]; chartCanvas.Children.Add(rect); } } } }
Inside the DrawColorbar method, we divide each color bar into 10 rectangles. Each rectangle is filled with a SolidColorBrush element that belongs to a specified ColormapBrush object. In this example we use the default values for the ColormapLength, AlphaValue, and Y data range properties.
The AddColormap method creates eight different color bars, each painted with a different ColormapBrush object.

CHAPTER 4 ■ COLORS AND BRUSHES
155
Running this example produces the output displayed in Figure 4-9.
Figure 4-9. Color map created using custom ColormapBrush objects
Color Shading In the previous sections, we drew color bars by associating each Y data value with a SolidColorBrush element of the ColormapBrush object. In some graphics applications, you may want to map the color of a surface object directly according to a given set of color data. Consider a situation involving a ColormapBrush object with the name Jet, as defined in the ColormapBrush class.
Suppose we have a 3 × 3 color data matrix
In this case, the maximum and minimum of the color data are 4 and –3, respectively. Using Equation (4.1), we can easily determine the color map numbers to be
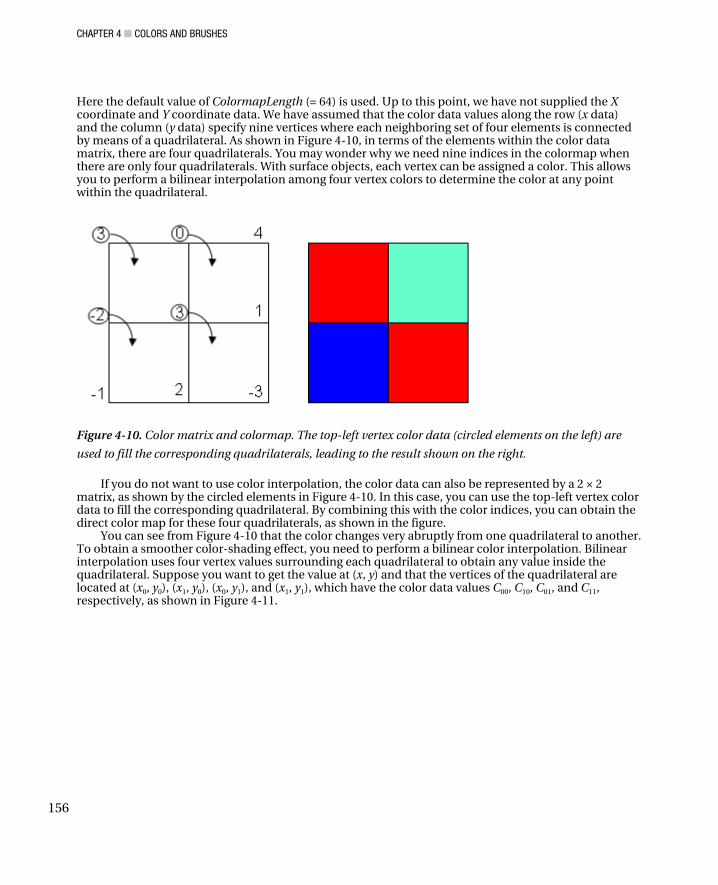
CHAPTER 4 ■ COLORS AND BRUSHES
156
Here the default value of ColormapLength (= 64) is used. Up to this point, we have not supplied the X coordinate and Y coordinate data. We have assumed that the color data values along the row (x data) and the column (y data) specify nine vertices where each neighboring set of four elements is connected by means of a quadrilateral. As shown in Figure 4-10, in terms of the elements within the color data matrix, there are four quadrilaterals. You may wonder why we need nine indices in the colormap when there are only four quadrilaterals. With surface objects, each vertex can be assigned a color. This allows you to perform a bilinear interpolation among four vertex colors to determine the color at any point within the quadrilateral.
Figure 4-10. Color matrix and colormap. The top-left vertex color data (circled elements on the left) are
used to fill the corresponding quadrilaterals, leading to the result shown on the right.
If you do not want to use color interpolation, the color data can also be represented by a 2 × 2 matrix, as shown by the circled elements in Figure 4-10. In this case, you can use the top-left vertex color data to fill the corresponding quadrilateral. By combining this with the color indices, you can obtain the direct color map for these four quadrilaterals, as shown in the figure.
You can see from Figure 4-10 that the color changes very abruptly from one quadrilateral to another. To obtain a smoother color-shading effect, you need to perform a bilinear color interpolation. Bilinear interpolation uses four vertex values surrounding each quadrilateral to obtain any value inside the quadrilateral. Suppose you want to get the value at (x, y) and that the vertices of the quadrilateral are located at (x0, y0), (x1, y0), (x0, y1), and (x1, y1), which have the color data values C00, C10, C01, and C11, respectively, as shown in Figure 4-11.

CHAPTER 4 ■ COLORS AND BRUSHES
157
Figure 4-11. Coordinates used for bilinear interpolation
Linear interpolation on the top row of neighbors, between (x0, y0) and (x1, y0), estimates the value C0 at (x, y0) as
(4.2)
Likewise, linear interpolation on the bottom row of neighbors, between (x0, y1) and (x1, y1), estimates the value C1 at (x, y1) as
(4.3)
Finally, linear interpolation between C0 and C1 estimates the value C at (x, y) as
(4.4)
By substituting the expressions for C0 in Equation (4.2) and C1 in Equation (4.3) into Equation (4.4), we obtain
(4.5)
You can see that the equation for C is a polynomial involving powers of x and y no greater than 1, with four coefficients: C = a1+ a2*x + a3*y + a4*x*y. Because these four coefficients are determined by four values (C00, C01, C10, and C11), they are usually uniquely determined by the data. This immediately implies
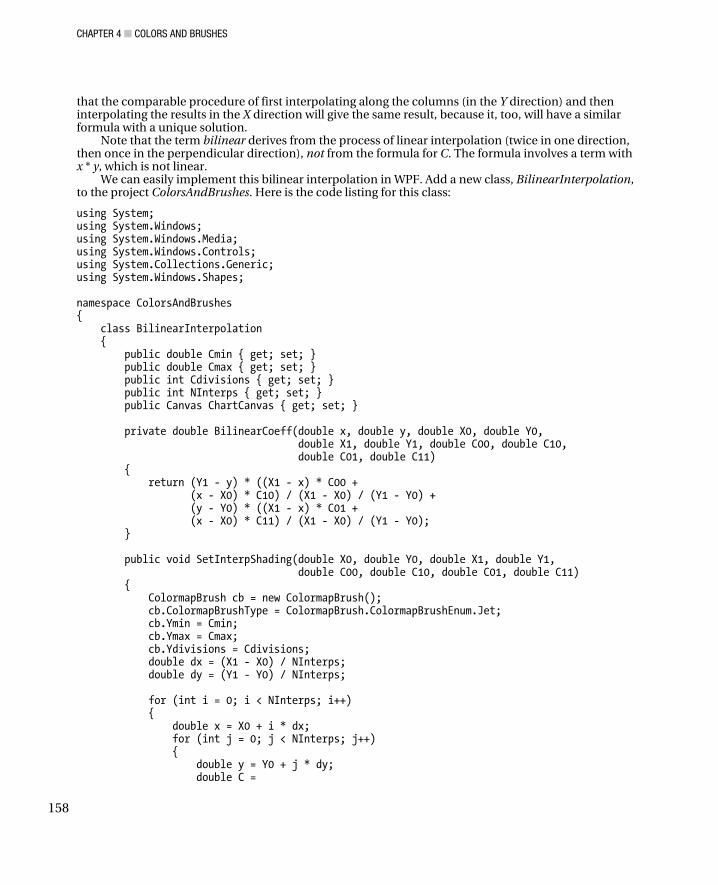
CHAPTER 4 ■ COLORS AND BRUSHES
158
that the comparable procedure of first interpolating along the columns (in the Y direction) and then interpolating the results in the X direction will give the same result, because it, too, will have a similar formula with a unique solution.
Note that the term bilinear derives from the process of linear interpolation (twice in one direction, then once in the perpendicular direction), not from the formula for C. The formula involves a term with x * y, which is not linear.
We can easily implement this bilinear interpolation in WPF. Add a new class, BilinearInterpolation, to the project ColorsAndBrushes. Here is the code listing for this class:
using System; using System.Windows; using System.Windows.Media; using System.Windows.Controls; using System.Collections.Generic; using System.Windows.Shapes; namespace ColorsAndBrushes { class BilinearInterpolation { public double Cmin { get; set; } public double Cmax { get; set; } public int Cdivisions { get; set; } public int NInterps { get; set; } public Canvas ChartCanvas { get; set; } private double BilinearCoeff(double x, double y, double X0, double Y0, double X1, double Y1, double C00, double C10, double C01, double C11) { return (Y1 - y) * ((X1 - x) * C00 + (x - X0) * C10) / (X1 - X0) / (Y1 - Y0) + (y - Y0) * ((X1 - x) * C01 + (x - X0) * C11) / (X1 - X0) / (Y1 - Y0); } public void SetInterpShading(double X0, double Y0, double X1, double Y1, double C00, double C10, double C01, double C11) { ColormapBrush cb = new ColormapBrush(); cb.ColormapBrushType = ColormapBrush.ColormapBrushEnum.Jet; cb.Ymin = Cmin; cb.Ymax = Cmax; cb.Ydivisions = Cdivisions; double dx = (X1 - X0) / NInterps; double dy = (Y1 - Y0) / NInterps; for (int i = 0; i < NInterps; i++) { double x = X0 + i * dx; for (int j = 0; j < NInterps; j++) { double y = Y0 + j * dy; double C =

CHAPTER 4 ■ COLORS AND BRUSHES
159
BilinearCoeff(x, y, X0, Y0, X1, Y1, C00, C10, C01, C11); Polygon plg = new Polygon(); plg.Points.Add(new Point(x, y)); plg.Points.Add(new Point(x, y + dy)); plg.Points.Add(new Point(x + dx, y + dy)); plg.Points.Add(new Point(x + dx, y)); plg.Fill = cb.GetBrush(C); ChartCanvas.Children.Add(plg); } } } public void SetOriginalShading(double C, double X0, double Y0, double X1, double Y1) { ColormapBrush cb = new ColormapBrush(); cb.ColormapBrushType = ColormapBrush.ColormapBrushEnum.Jet; Polygon plg = new Polygon(); cb.Ymin = Cmin; cb.Ymax = Cmax; cb.Ydivisions = Cdivisions; double dx = X1 - X0; double dy = Y1 - Y0; plg.Points.Add(new Point(X0, Y0)); plg.Points.Add(new Point(X0, Y0 + dy)); plg.Points.Add(new Point(X0 + dx, Y0 + dy)); plg.Points.Add(new Point(X0 + dx, Y0)); plg.Fill = cb.GetBrush(C); ChartCanvas.Children.Add(plg); } } }
This class first defines several public properties using the new C# automatic property feature. The properties Cmin, Cmax, and Cdivisions are equivalent to the properties Ymin, Ymax, and Ydivisions defined in the ColormapBrush class. The property NInterps represents how many interpolation points you’ll need in each direction, and the ChartCanvas property provides a host canvas in which you can draw the quadrilateral with interpolated color shading.
The BilinearCoeff method calculates the color data value at a given point (x, y) in the quadrilateral. The SetInterpShading method allows you to create color shading for a quadrilateral using bilinear interpolation, and the SetOriginalShading method can be used to create color shading without interpolation.
Testing Color Shading Here, I’ll show you how to create color shading using the BilinearInterpolation class implemented in the previous section. Add a new WPF Window to the project ColorsAndBrushes and name it CustomColorShading. Here is the XAML file for this example:
<Window x:Class="ColorsAndBrushes.CustomColorShading" xmlns="http://schemas.microsoft.com/winfx/2006/xaml/presentation" xmlns:x="http://schemas.microsoft.com/winfx/2006/xaml" Title="CustomColorShading" Height="180" Width="300">

CHAPTER 4 ■ COLORS AND BRUSHES
160
<Canvas x:Name="chartCanvas" Width="290" Height="140" Background="Transparent"/> </Window>
This markup is very simple and includes only a Canvas element. Here is the code-behind file for this example:
using System; using System.Windows; using System.Windows.Controls; using System.Windows.Media; using System.Windows.Media.Imaging; using System.Windows.Shapes; namespace ColorsAndBrushes { public partial class CustomColorShading : Window { public CustomColorShading() { InitializeComponent(); AddShading(); } public void AddShading() { chartCanvas.Children.Clear(); double width = chartCanvas.Width / 2 - 20; double height = chartCanvas.Height - 20; BilinearInterpolation bi = new BilinearInterpolation(); bi.Cdivisions = 32; bi.NInterps = 30; bi.Cmin = -3; bi.Cmax = 4; bi.ChartCanvas = chartCanvas; // Original color map: double x0 = 10; double y0 = 10; bi.SetOriginalShading(3, x0, y0, x0+width/2, y0+height/2); x0 = 10 + width / 2; bi.SetOriginalShading(0, x0, y0, x0+width/2, y0+height/2); x0 = 10; y0 = 10 + height / 2; bi.SetOriginalShading(-2, x0, y0, x0 + width / 2, y0 + height / 2); x0 = 10 + width / 2; y0 = 10 + height / 2; bi.SetOriginalShading(3, x0, y0, x0 + width / 2, y0 + height / 2); // Bilinear interpolation:

CHAPTER 4 ■ COLORS AND BRUSHES
161
x0 = 20 + width; y0 = 10; bi.SetInterpShading(x0, y0, x0 + width / 2, y0 + height / 2, 3, 0, -2, 3); x0 = x0 + width / 2; bi.SetInterpShading(x0, y0, x0 + width / 2, y0 + height / 2, 0, 4, 3, 1); x0 = 20 + width; y0 = 10 + height / 2; bi.SetInterpShading(x0, y0, x0 + width / 2, y0 + height / 2, -2, 3, -1, 2); x0 = x0 + width / 2; y0 = 10 + height / 2; bi.SetInterpShading(x0, y0, x0 + width / 2, y0 + height / 2, 3, 1, 2, -3); } } }
In this example, we want to create color shading using the color data listed in Figure 4-10. For comparison, we will first create an example of color shading without bilinear interpolation, in which each quadrilateral is filled with a SolidColorBrush corresponding to the color data value at the top-left corner. We will then create an example of interpolated color shading using the BilinearInterpolation class.
Running this example generates the result shown in Figure 4-12. Notice that for very fine color shading (large NInterps), the program runs very slowly. Thus, you have a trade-off between color shading quality and performance speed. The bilinearly interpolated colormap has found wide applications in image processing and 3D surface chart applications.
Figure 4-12. Direct colormap (left) and interpolated colormap (right)

CHAPTER 4 ■ COLORS AND BRUSHES
162

C H A P T E R 5
■ ■ ■
163
2D Line charts
In the previous chapters, we discussed graphics basics, matrix transformations in 2D space, and color and brush systems in WPF. This chapter will show you how to apply the knowledge and approaches from previous chapters to create real-world chart applications. We’ll discuss the common charting elements and how to implement them in a simple 2D X-Y line plot.
Simple Line Charts The most basic and useful type of chart you can create with WPF is a simple 2D line chart of numerical data. WPF provides a set of commands and methods you can use to create these charts. Even the most elementary 2D chart consists of several basic elements, including lines, symbols, axes, tick marks, labels, a title, and a legend. The following list quickly overviews the most basic chart elements without getting into detail. These elements will often be referred to in this chapter.
• Axes – a graphics object that defines a region of the chart in which the chart is drawn.
• Line – a graphics object that represents the data you have plotted.
• Text – a graphics object comprising a string of characters.
• Title – the text string object located directly above an axis object.
• Label – the text string object associated with the axis object (X or Y axis).
• Legend – the text string array object that represents the color and values of the lines.
The X-Y line chart uses two values to represent each data point. This type of chart is very useful for describing relationships between data and is often involved in the statistical analysis of data, with wide applications in the scientific, mathematics, engineering, and finance communities as well as in daily life.
Creating Simple Line Charts It is easy to create a 2D X-Y line chart in WPF. Let’s use an example to illustrate the procedure. Start with a new WPF Windows project and name it LineCharts. Add a new WPF Window to the project and name it SimpleLineChart. We’ll create the user interface and layout using XAML and perform the computations and generate the data in code. The XAML file for this example is very simple:

CHAPTER 5 ■ 2D LINE CHARTS
164
<Window x:Class="LineCharts.SimpleLineChart" xmlns="http://schemas.microsoft.com/winfx/2006/xaml/presentation" xmlns:x="http://schemas.microsoft.com/winfx/2006/xaml" Title="Simple Line Chart" Height="300" Width="300"> <Grid Margin="0" x:Name ="chartGrid" ClipToBounds="True" Background="Transparent" SizeChanged="chartGrid_SizeChanged"> <Border HorizontalAlignment="Center" VerticalAlignment="Center" BorderBrush="Gray" BorderThickness="1" Background="White" Margin="0"> <Canvas Margin="0" x:Name ="chartCanvas" ClipToBounds="True" Background="Transparent"/> </Border> </Grid> </Window>
Here we implement a resizable Canvas element, chartCanvas, on which we want to create the simple line chart. Here is the corresponding code-behind file, which creates the line chart, for this example:
using System; using System.Collections.Generic; using System.Windows; using System.Windows.Controls; using System.Windows.Input; using System.Windows.Media; using System.Windows.Shapes; namespace LineCharts { public partial class SimpleLineChart : System.Windows.Window { private double xmin = 0; private double xmax = 6.5; private double ymin = -1.1; private double ymax = 1.1; private Polyline pl; public SimpleLineChart() { InitializeComponent(); } private void AddChart() { // Draw sine curve: pl = new Polyline(); pl.Stroke = Brushes.Black; for (int i = 0; i < 70; i++) { double x = i/5.0; double y = Math.Sin(x); pl.Points.Add(NormalizePoint(new Point(x, y))); } chartCanvas.Children.Add(pl);
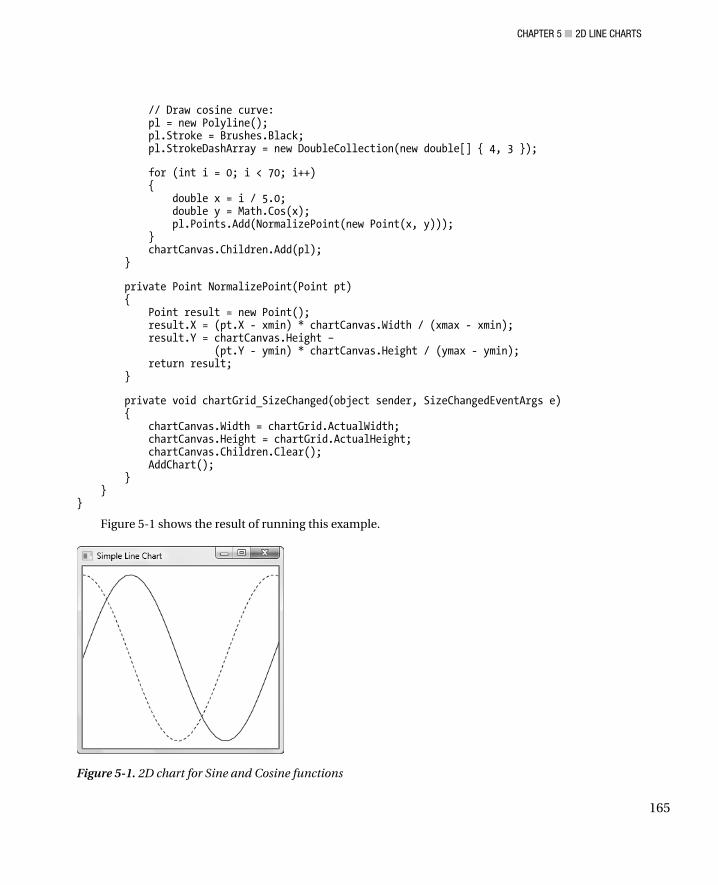
CHAPTER 5 ■ 2D LINE CHARTS
165
// Draw cosine curve: pl = new Polyline(); pl.Stroke = Brushes.Black; pl.StrokeDashArray = new DoubleCollection(new double[] { 4, 3 }); for (int i = 0; i < 70; i++) { double x = i / 5.0; double y = Math.Cos(x); pl.Points.Add(NormalizePoint(new Point(x, y))); } chartCanvas.Children.Add(pl); } private Point NormalizePoint(Point pt) { Point result = new Point(); result.X = (pt.X - xmin) * chartCanvas.Width / (xmax - xmin); result.Y = chartCanvas.Height – (pt.Y - ymin) * chartCanvas.Height / (ymax - ymin); return result; } private void chartGrid_SizeChanged(object sender, SizeChangedEventArgs e) { chartCanvas.Width = chartGrid.ActualWidth; chartCanvas.Height = chartGrid.ActualHeight; chartCanvas.Children.Clear(); AddChart(); } } }
Figure 5-1 shows the result of running this example.
Figure 5-1. 2D chart for Sine and Cosine functions
CHAPTER 5 ■ 2D LINE CHARTS
166
How It Works Note that the axis limits xmin, xmax, ymin, and ymax are defined in the real-world coordinate system. The sine and cosine functions are represented using Polyline objects that are added to the chartCanvas’s children collection.
A key step in creating this line chart is to transform the original data points in the world coordinate system into points in the units of device-independent pixels using the NormalizePoint method. The NormalizePoint method converts points of any unit in the world coordinate system into points with a unit of device-independent pixel in the device coordinate system.
Another point I’d like to make here is that we defined the chart area as a resizable Canvas control, chartCanvas, which occupies the entire area of the application window. In some cases, you may want the chart to occupy only a portion of the application window; in other situations, you may want to move the chart to a particular position in the window. This can be achieved by redefining the Width and Height properties of the chartCanvas without touching the rest of the code. For example, replace the following code in the preceding example:
chartCanvas.Width = chartGrid.ActualWidth; chartCanvas.Height = chartGrid.ActualHeight;
with the following code snippet:
chartCanvas.Width = chartGrid.ActualWidth / 2; chartCanvas.Height = chartGrid.ActualHeight / 2;
In this case, the chart area is reduced compared to the application window. In addition, if you combine the resizable canvas with another Grid control, you can also place your chart anywhere you like.
Line Charts with Data Collection The preceding example demonstrated how easy it is to create a simple 2D line chart in WPF, but it didn’t pay much attention to the program structure. In order for the chart program to be more object-oriented and to extend easily to add new features, you need to define three new classes: ChartStyle, DataCollection, and DataSeries. The ChartStyle class defines all chart layout–related information. The DataCollection class holds the DataSeries objects, each of which represents one curve on the chart. The DataSeries class holds the chart data and line styles, including the line color, thickness, dash style, etc.
Chart Style Now add a public class, ChartStyle, to the project LineCharts. The following is the code listing for this class:
using System; using System.Windows.Controls; using System.Windows; namespace LineCharts { public class ChartStyle { private Canvas chartCanvas; private double xmin = 0; private double xmax = 10;

CHAPTER 5 ■ 2D LINE CHARTS
167
private double ymin = 0; private double ymax = 10; public Canvas ChartCanvas { get { return chartCanvas; } set { chartCanvas = value; } } public double Xmin { get { return xmin; } set { xmin = value; } } public double Xmax { get { return xmax; } set { xmax = value; } } public double Ymin { get { return ymin; } set { ymin = value; } } public double Ymax { get { return ymax; } set { ymax = value; } } public Point NormalizePoint(Point pt) { if (ChartCanvas.Width.ToString() == "NaN") ChartCanvas.Width = 270; if (ChartCanvas.Height.ToString() == "NaN") ChartCanvas.Height = 250; Point result = new Point(); result.X = (pt.X - Xmin) * ChartCanvas.Width / (Xmax - Xmin); result.Y = ChartCanvas.Height – (pt.Y - Ymin) * ChartCanvas.Height / (Ymax - Ymin); return result; } } }
In this class, we first define a public property ChartCanvas, which is needed to specify the chart area. In addition, the NormalizePoint method requires the Width and Height of this ChartCanvas to obtain the point conversion from the real-world coordinate system to device-independent pixels. We then create member fields and corresponding public properties for the axis limits. You can override the default values of these properties according to your application requirements.

CHAPTER 5 ■ 2D LINE CHARTS
168
Data Series Now add the DataSeries class to the current project. The following is the code listing for this class:
using System; using System.Windows; using System.Windows.Media; using System.Windows.Shapes; namespace LineCharts { public class DataSeries { private Polyline lineSeries = new Polyline(); private Brush lineColor; private double lineThickness = 1; private LinePatternEnum linePattern; private string seriesName = "Default Name"; private Symbols symbols; public DataSeries() { LineColor = Brushes.Black; symbols = new Symbols(); } /*public Symbols Symbols { get { return symbols; } set { symbols = value; } }*/ public Brush LineColor { get { return lineColor; } set { lineColor = value; } } public Polyline LineSeries { get { return lineSeries; } set { lineSeries = value; } } public double LineThickness { get { return lineThickness; } set { lineThickness = value; } } public LinePatternEnum LinePattern { get { return linePattern; }

CHAPTER 5 ■ 2D LINE CHARTS
169
set { linePattern = value; } } public string SeriesName { get { return seriesName; } set { seriesName = value; } } public void AddLinePattern() { LineSeries.Stroke = LineColor; LineSeries.StrokeThickness = LineThickness; switch (LinePattern) { case LinePatternEnum.Dash: LineSeries.StrokeDashArray = new DoubleCollection(new double[2] { 4, 3 }); break; case LinePatternEnum.Dot: LineSeries.StrokeDashArray = new DoubleCollection(new double[2] { 1, 2 }); break; case LinePatternEnum.DashDot: LineSeries.StrokeDashArray = new DoubleCollection(new double[4] { 4, 2, 1, 2 }); break; case LinePatternEnum.None: LineSeries.Stroke = Brushes.Transparent; break; } } public enum LinePatternEnum { Solid = 1, Dash = 2, Dot = 3, DashDot = 4, None = 5 } } }
This class creates a Polyline object for a given DataSeries. It then defines the line style for the line object, including the line color, thickness, line pattern, and series name. The SeriesName property will be used in creating the legend for the chart. The line pattern is defined by a public enumeration called LinePatternEnum, in which five line patterns are defined, including Solid (default), Dash, Dot, DashDot, and None. The None enumeration member means there will be no line drawn on the chart canvas.
You create the line pattern via the AddLinePattern method. There is no need to create the solid line pattern because it is the default setting of the Polyline object. You create the dashed or dotted line patterns using the StrokeDashArray property of the Polyline. You define the invisible line (corresponding to the None type of line pattern) by setting the stroke’s color to transparent.

CHAPTER 5 ■ 2D LINE CHARTS
170
Data Collection Finally, we need to add another public class, DataCollection, to the current project. The following is the code listing for this class:
using System; using System.Collections.Generic; using System.Windows.Controls; using System.Windows.Media; using System.Windows.Shapes; namespace LineCharts { public class DataCollection { private List<DataSeries> dataList; public DataCollection() { dataList = new List<DataSeries>(); } public List<DataSeries> DataList { get { return dataList; } set { dataList = value; } } public void AddLines(ChartStyle cs) { int j = 0; foreach (DataSeries ds in DataList) { if (ds.SeriesName == "Default Name") { ds.SeriesName = "DataSeries" + j.ToString(); } ds.AddLinePattern(); for (int i = 0; i < ds.LineSeries.Points.Count; i++) { ds.LineSeries.Points[i] = cs.NormalizePoint(ds.LineSeries.Points[i]); } cs.ChartCanvas.Children.Add(ds.LineSeries); j++; } } } }

CHAPTER 5 ■ 2D LINE CHARTS
171
This class holds the DataSeries objects. We begin with a member field DataSeries list and its corresponding public property, DataList. The DataList property holds the DataSeries. We then implement an AddLines method, which draws lines using the DataSeries objects in the DataCollection class. For each DataSeries, a line is added to the chart canvas using the specified line style for that DataSeries. Notice how all data points from the world coordinate system are transformed to the device coordinate system using the NormalizePoint method defined in the ChartStyle class.
Creating Line Charts Now you can create line charts using the ChartStyle, DataCollection, and DataSeries classes. Again I’ll present an example to illustrate how to create a line chart using these classes. Let’s add a new WPF Window, named LineChartExample, to the project LineCharts. The layout of this example is created via the following XAML file:
<Window x:Class="LineCharts.LineChartExample" xmlns="http://schemas.microsoft.com/winfx/2006/xaml/presentation" xmlns:x="http://schemas.microsoft.com/winfx/2006/xaml" Title="Line Chart Example" Height="300" Width="300"> <Grid x:Name ="chartGrid" ClipToBounds="False" Background="Transparent" SizeChanged="chartGrid_SizeChanged" > <Border HorizontalAlignment="Center" VerticalAlignment="Center" BorderBrush="Gray" BorderThickness="1" Background="White" Margin="10" > <Canvas Margin="0" x:Name ="chartCanvas" ClipToBounds="True" Background="Transparent"/> </Border> </Grid> </Window>
This markup defines a resizable Canvas named chartCanvas, which you will use to hold the line chart. Here is the corresponding code-behind file for this example:
using System; using System.Windows; using System.Collections.Generic; using System.Windows.Controls; using System.Windows.Media; using System.Windows.Media.Imaging; using System.Windows.Shapes; namespace LineCharts { public partial class LineChartExample : Window { private ChartStyle cs; private DataCollection dc; private DataSeries ds; public LineChartExample() { InitializeComponent(); }

CHAPTER 5 ■ 2D LINE CHARTS
172
private void AddChart() { cs = new ChartStyle(); cs.ChartCanvas = chartCanvas; dc = new DataCollection(); cs.Xmin = 0; cs.Xmax = 7; cs.Ymin = -1.1; cs.Ymax = 1.1; // Draw Sine curve: ds = new DataSeries(); ds.LineColor = Brushes.Blue; ds.LineThickness = 2; for (int i = 0; i < 50; i++) { double x = i / 5.0; double y = Math.Sin(x); ds.LineSeries.Points.Add(new Point(x, y)); } dc.DataList.Add(ds); // Draw cosine curve: ds = new DataSeries(); ds.LineColor = Brushes.Red; ds.LinePattern = DataSeries.LinePatternEnum.DashDot; ds.LineThickness = 2; for (int i = 0; i < 50; i++) { double x = i / 5.0; double y = Math.Cos(x); ds.LineSeries.Points.Add(new Point(x, y)); } dc.DataList.Add(ds); dc.AddLines(cs); } private void chartGrid_SizeChanged(object sender, SizeChangedEventArgs e) { chartCanvas.Width = chartGrid.ActualWidth - 20; chartCanvas.Height = chartGrid.ActualHeight - 20; chartCanvas.Children.Clear(); AddChart(); } } }
In this code-behind file, you begin by defining instances for the ChartStyle, DataCollection, and DataSeries classes. Inside the AddChart method, you override the axis limit properties that were originally defined in the ChartStyle class to meet the requirements of your current application.

CHAPTER 5 ■ 2D LINE CHARTS
173
Pay attention to how the DataSeries objects are added to the DataCollection class:
// Draw Sine curve: ds = new DataSeries(); ds.LineColor = Brushes.Blue; ds.LineThickness = 2; for (int i = 0; i < 50; i++) { double x = i / 5.0; double y = Math.Sin(x); ds.LineSeries.Points.Add(new Point(x, y)); } dc.DataList.Add(ds);
Here you first create a new DataSeries object and define its line style, including the line color and thickness. Notice here that you didn’t specify the line pattern, so the default line pattern, Solid, is used. You then add the data points to the ds.LineSeries object’s point collection. Finally, you add the data series “ds” to the DataCollection using the dc.DataList.Add method. This way, you can add any number of DataSeries objects to the DataCollection. Finally, the AddLines method in the DataCollection class draws curves on the chart for all the DataSeries objects contained in the DataCollection.
Figure 5-2 shows the results of running this example.
Figure 5-2. Chart for sine and cosine functions created using the DataCollection class

CHAPTER 5 ■ 2D LINE CHARTS
174
Gridlines and Labels In the previous sections, only the lines for the sine and cosine functions were drawn on the chart. In this section, you will add more features to the 2D line chart, including gridlines, a title, tick marks, and labels for axes.
Chart Style with Gridlines Here, we’ll implement the gridlines and labels in a new class, ChartStyleGridlines. This new class can derive from the original ChartStyle class used in previous sections. Here is the code listing for this class:
using System; using System.Windows.Controls; using System.Windows; using System.Windows.Media; using System.Windows.Shapes; namespace LineCharts { public class ChartStyleGridlines : ChartStyle { private string title; private string xLabel; private string yLabel; private Canvas textCanvas; private bool isXGrid = true; private bool isYGrid = true; private Brush gridlineColor = Brushes.LightGray; private double xTick = 1; private double yTick = 0.5; private GridlinePatternEnum gridlinePattern; private double leftOffset = 20; private double bottomOffset = 15; private double rightOffset = 10; private Line gridline = new Line(); public ChartStyleGridlines() { title = "Title"; xLabel = "X Axis"; yLabel = "Y Axis"; } public string Title { get { return title; } set { title = value; } } public string XLabel { get { return xLabel; }

CHAPTER 5 ■ 2D LINE CHARTS
175
set { xLabel = value; } } public string YLabel { get { return yLabel; } set { yLabel = value; } } public GridlinePatternEnum GridlinePattern { get { return gridlinePattern; } set { gridlinePattern = value; } } public double XTick { get { return xTick; } set { xTick = value; } } public double YTick { get { return yTick; } set { yTick = value; } } public Brush GridlineColor { get { return gridlineColor; } set { gridlineColor = value; } } public Canvas TextCanvas { get { return textCanvas; } set { textCanvas = value; } } public bool IsXGrid { get { return isXGrid; } set { isXGrid = value; } } public bool IsYGrid { get { return isYGrid; } set { isYGrid = value; } } public void AddChartStyle(TextBlock tbTitle, TextBlock tbXLabel, TextBlock tbYLabel)

CHAPTER 5 ■ 2D LINE CHARTS
176
{ Point pt = new Point(); Line tick = new Line(); double offset = 0; double dx, dy; TextBlock tb = new TextBlock(); // determine right offset: tb.Text = Xmax.ToString(); tb.Measure(new Size(Double.PositiveInfinity, Double.PositiveInfinity)); Size size = tb.DesiredSize; rightOffset = size.Width / 2 + 2; // Determine left offset: for (dy = Ymin; dy <= Ymax; dy += YTick) { pt = NormalizePoint(new Point(Xmin, dy)); tb = new TextBlock(); tb.Text = dy.ToString(); tb.TextAlignment = TextAlignment.Right; tb.Measure(new Size(Double.PositiveInfinity, Double.PositiveInfinity)); size = tb.DesiredSize; if (offset < size.Width) offset = size.Width; } leftOffset = offset + 5; Canvas.SetLeft(ChartCanvas, leftOffset); Canvas.SetBottom(ChartCanvas, bottomOffset); ChartCanvas.Width = Math.Abs(TextCanvas.Width – leftOffset – rightOffset); ChartCanvas.Height = Math.Abs(TextCanvas.Height – bottomOffset - size.Height / 2); Rectangle chartRect = new Rectangle(); chartRect.Stroke = Brushes.Black; chartRect.Width = ChartCanvas.Width; chartRect.Height = ChartCanvas.Height; ChartCanvas.Children.Add(chartRect); // Create vertical gridlines: if (IsYGrid == true) { for (dx = Xmin + XTick; dx < Xmax; dx += XTick) { gridline = new Line(); AddLinePattern(); gridline.X1 = NormalizePoint(new Point(dx, Ymin)).X; gridline.Y1 = NormalizePoint(new Point(dx, Ymin)).Y; gridline.X2 = NormalizePoint(new Point(dx, Ymax)).X; gridline.Y2 = NormalizePoint(new Point(dx, Ymax)).Y; ChartCanvas.Children.Add(gridline); }

CHAPTER 5 ■ 2D LINE CHARTS
177
} // Create horizontal gridlines: if (IsXGrid == true) { for (dy = Ymin + YTick; dy < Ymax; dy += YTick) { gridline = new Line(); AddLinePattern(); gridline.X1 = NormalizePoint(new Point(Xmin, dy)).X; gridline.Y1 = NormalizePoint(new Point(Xmin, dy)).Y; gridline.X2 = NormalizePoint(new Point(Xmax, dy)).X; gridline.Y2 = NormalizePoint(new Point(Xmax, dy)).Y; ChartCanvas.Children.Add(gridline); } } // Create x-axis tick marks: for (dx = Xmin; dx <= Xmax; dx += xTick) { pt = NormalizePoint(new Point(dx, Ymin)); tick = new Line(); tick.Stroke = Brushes.Black; tick.X1 = pt.X; tick.Y1 = pt.Y; tick.X2 = pt.X; tick.Y2 = pt.Y - 5; ChartCanvas.Children.Add(tick); tb = new TextBlock(); tb.Text = dx.ToString(); tb.Measure(new Size(Double.PositiveInfinity, Double.PositiveInfinity)); size = tb.DesiredSize; TextCanvas.Children.Add(tb); Canvas.SetLeft(tb, leftOffset + pt.X - size.Width / 2); Canvas.SetTop(tb, pt.Y + 2 + size.Height / 2); } // Create y-axis tick marks: for (dy = Ymin; dy <= Ymax; dy += YTick) { pt = NormalizePoint(new Point(Xmin, dy)); tick = new Line(); tick.Stroke = Brushes.Black; tick.X1 = pt.X; tick.Y1 = pt.Y; tick.X2 = pt.X + 5; tick.Y2 = pt.Y; ChartCanvas.Children.Add(tick); tb = new TextBlock(); tb.Text = dy.ToString();

CHAPTER 5 ■ 2D LINE CHARTS
178
tb.Measure(new Size(Double.PositiveInfinity, Double.PositiveInfinity)); size = tb.DesiredSize; TextCanvas.Children.Add(tb); Canvas.SetRight(tb, ChartCanvas.Width + 10); Canvas.SetTop(tb, pt.Y); } // Add title and labels: tbTitle.Text = Title; tbXLabel.Text = XLabel; tbYLabel.Text = YLabel; tbXLabel.Margin = new Thickness(leftOffset + 2, 2, 2, 2); tbTitle.Margin = new Thickness(leftOffset + 2, 2, 2, 2); } public void AddLinePattern() { gridline.Stroke = GridlineColor; gridline.StrokeThickness = 1; switch (GridlinePattern) { case GridlinePatternEnum.Dash: gridline.StrokeDashArray = new DoubleCollection(new double[2] { 4, 3 }); break; case GridlinePatternEnum.Dot: gridline.StrokeDashArray = new DoubleCollection(new double[2] { 1, 2 }); break; case GridlinePatternEnum.DashDot: gridline.StrokeDashArray = new DoubleCollection(new double[4] { 4, 2, 1, 2 }); break; } } public enum GridlinePatternEnum { Solid = 1, Dash = 2, Dot = 3, DashDot = 4 } } }
In this class, we add more member fields and corresponding properties, which you use to manipulate the chart’s layout and appearance. You can easily understand the meaning of each field and property from its name. Notice that we add another Canvas property, TextCanvas, which you use to hold the tick mark labels, while the ChartCanvas in the original ChartStyle class holds the chart itself.

CHAPTER 5 ■ 2D LINE CHARTS
179
In addition, we add the following member fields to define the gridlines for your chart:
private bool isXGrid = true; private bool isYGrid = true; private Brush gridlineColor = Brushes.LightGray; private GridlinePatternEnum gridlinePattern;
These fields and their corresponding properties provide a great deal of flexibility in customizing the appearance of the gridlines. The GridlinePattern property allows you to choose various line dash styles, including solid, dash, dot, and dash-dot. You can change the gridlines’ color using the GridlineColor property. In addition, we define two bool properties, IsXGrid and IsYGrid, which allow you to turn horizontal or vertical gridlines on or off.
We then define member fields and corresponding properties for the X and Y labels, title, and tick marks so that we can change them to our liking. If you like, you can easily add more member fields to control the appearance of your charts; for example, you can change the font and text color of the labels and title.
The AddChartStyle method seems quite complicated in this class; however, it is actually reasonably easy to follow. First, we define the size of the ChartCanvas by considering the suitable offset relative to the TextCanvas. Next, we draw gridlines with a specified color and line pattern. Please note that all of the end points of the gridlines have been transformed from the world coordinate system to device-independent pixels using the NormalizePoint method.
We then draw the tick marks for the X and Y axes of the chart. For each tick mark, we find the points in the device coordinate system at which the tick mark joins the axes and draw a black line, 5 pixels long, from this point toward the inside of the ChartCanvas.
The title and labels for the X and Y axes are attached to the corresponding TextBlock names in code. We can also create data bindings that bind the Title, XLabel, and YLabel properties to the corresponding TextBlock directly in the XAML file.
Creating a Chart with Gridlines Here, we’ll create the chart layout using XAML and put the title and the labels for the X and Y axes into different cells of a Grid control. Add a new WPF Window to the project LineCharts and name it LineChartWithGridlines. The following is the XAML file for this example:
<Window x:Class="LineCharts.LineChartWithGridlines" xmlns="http://schemas.microsoft.com/winfx/2006/xaml/presentation" xmlns:x="http://schemas.microsoft.com/winfx/2006/xaml" Title="Line Chart with Gridlines and Labels" Height="400" Width="400"> <Grid Name="grid1" Margin="10"> <Grid.ColumnDefinitions> <ColumnDefinition Width="Auto"/> <ColumnDefinition Name="column1" Width="*"/> </Grid.ColumnDefinitions> <Grid.RowDefinitions> <RowDefinition Height="Auto"/> <RowDefinition Name="row1" Height="*"/> <RowDefinition Height="Auto"/> </Grid.RowDefinitions> <TextBlock Margin="2" x:Name="tbTitle" Grid.Column="1" Grid.Row="0" RenderTransformOrigin="0.5,0.5" FontSize="14" FontWeight="Bold" HorizontalAlignment="Stretch" VerticalAlignment="Stretch" TextAlignment="Center" Text="Title"/>

CHAPTER 5 ■ 2D LINE CHARTS
180
<TextBlock Margin="2" x:Name="tbXLabel" Grid.Column="1" Grid.Row="2" RenderTransformOrigin="0.5,0.5" TextAlignment="Center" Text="X Axis"/> <TextBlock Margin="2" Name="tbYLabel" Grid.Column="0" Grid.Row="1" RenderTransformOrigin="0.5,0.5" TextAlignment="Center" Text="Y Axis"> <TextBlock.LayoutTransform> <RotateTransform Angle="-90"/> </TextBlock.LayoutTransform> </TextBlock> <Grid Margin="0,0,0,0" x:Name ="chartGrid" Grid.Column="1" Grid.Row="1" ClipToBounds="False" Background="Transparent" SizeChanged="chartGrid_SizeChanged" > </Grid> <Canvas Margin="2" Name="textCanvas" Grid.Column="1" Grid.Row="1" ClipToBounds="True"> <Canvas Name="chartCanvas" ClipToBounds="True"/> </Canvas> </Grid> </Window>
Here, we create two canvas controls, textCanvas and chartCanvas. The textCanvas becomes a resizable Canvas control when its size combines with the SizeChanged property of the Grid control named chartGrid. We use the textCanvas control, as a parent of the chartCanvas, to hold the tick mark labels; the chartCanvas control will hold the chart itself. We can also use the DataCollection and DataSeries classes from the previous example. We use the ChartStyleGridlines class, inherited from the ChartStyle class, to create gridlines, labels, and tick marks.
Open the code-behind file of LineChartWithGridlines and add the following code to it:
using System; using System.Windows; using System.Windows.Controls; using System.Windows.Media; using System.Windows.Shapes; namespace LineCharts { public partial class LineChartWithGridlines : Window { private ChartStyleGridlines cs; private DataCollection dc; private DataSeries ds; public LineChartWithGridlines() { InitializeComponent(); } private void AddChart() { cs = new ChartStyleGridlines(); dc = new DataCollection();
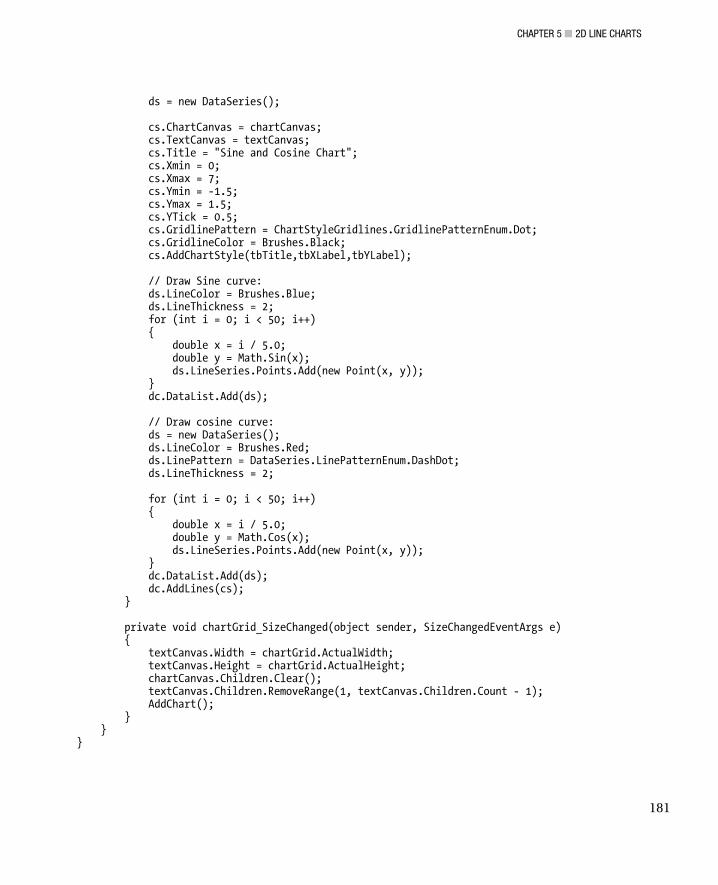
CHAPTER 5 ■ 2D LINE CHARTS
181
ds = new DataSeries(); cs.ChartCanvas = chartCanvas; cs.TextCanvas = textCanvas; cs.Title = "Sine and Cosine Chart"; cs.Xmin = 0; cs.Xmax = 7; cs.Ymin = -1.5; cs.Ymax = 1.5; cs.YTick = 0.5; cs.GridlinePattern = ChartStyleGridlines.GridlinePatternEnum.Dot; cs.GridlineColor = Brushes.Black; cs.AddChartStyle(tbTitle,tbXLabel,tbYLabel); // Draw Sine curve: ds.LineColor = Brushes.Blue; ds.LineThickness = 2; for (int i = 0; i < 50; i++) { double x = i / 5.0; double y = Math.Sin(x); ds.LineSeries.Points.Add(new Point(x, y)); } dc.DataList.Add(ds); // Draw cosine curve: ds = new DataSeries(); ds.LineColor = Brushes.Red; ds.LinePattern = DataSeries.LinePatternEnum.DashDot; ds.LineThickness = 2; for (int i = 0; i < 50; i++) { double x = i / 5.0; double y = Math.Cos(x); ds.LineSeries.Points.Add(new Point(x, y)); } dc.DataList.Add(ds); dc.AddLines(cs); } private void chartGrid_SizeChanged(object sender, SizeChangedEventArgs e) { textCanvas.Width = chartGrid.ActualWidth; textCanvas.Height = chartGrid.ActualHeight; chartCanvas.Children.Clear(); textCanvas.Children.RemoveRange(1, textCanvas.Children.Count - 1); AddChart(); } } }

CHAPTER 5 ■ 2D LINE CHARTS
182
This code is similar to the code used in the previous example, except that we now specify the gridlines’ properties. Here we set the TextCanvas and ChartCanvas properties of the ChartStyleGridlines object using the textCanvas and chartCanvas defined in XAML:
cs.ChartCanvas = chartCanvas; cs.TextCanvas = textCanvas;
We also pass the text blocks tbTitle, tbXLabel, and tbYLabel to the AddChartStyle method using the following code snippet:
cs.AddChartStyle(tbTitle,tbXLabel,tbYLabel);
Pay attention to the chartGrid_SizeChanged event handler:
private void chartGrid_SizeChanged(object sender, SizeChangedEventArgs e) { textCanvas.Width = chartGrid.ActualWidth; textCanvas.Height = chartGrid.ActualHeight; chartCanvas.Children.Clear(); textCanvas.Children.RemoveRange(1, textCanvas.Children.Count - 1); AddChart(); }
Here we make the textCanvas into a resizable Canvas control by specifying its Width and Height properties using the chartGrid’s ActualWidth and ActualHeight properties. In order to redraw the chart when the application window is resized, we need to remove all of the children elements of the textCanvas but the chartCanvas element, which is achieved by means of the bolded code statement in the foregoing event handler.
The rest of the code is similar to the code used in the previous example. Figure 5-3 illustrates the results of running this application. You can see that the chart has a title, labels, gridlines, and tick marks. Obviously, there is still no chart legend. I’ll show you how to add a legend in the next section.
CHAPTER 5 ■ 2D LINE CHARTS
183
Figure 5-3. Sine and Cosine chart with gridlines and labels
Legends For a 2D line chart with multiple curves, you may want to use a legend to identify each curve plotted on your chart. The legend will show a sample of the curve type, marker symbol, color, and text label you specify.
Legend Class Add a new Legend class to the project LineCharts. The following is its code listing:
using System; using System.Windows.Controls; using System.Windows; using System.Windows.Media; using System.Windows.Shapes;

CHAPTER 5 ■ 2D LINE CHARTS
184
namespace LineCharts { public class Legend { private bool isLegend; private bool isBorder; private Canvas legendCanvas; private LegendPositionEnum legendPosition; public Legend() { isLegend = false; isBorder = true; legendPosition = LegendPositionEnum.NorthEast; } public LegendPositionEnum LegendPosition { get { return legendPosition; } set { legendPosition = value; } } public Canvas LegendCanvas { get { return legendCanvas; } set { legendCanvas = value; } } public bool IsLegend { get { return isLegend; } set { isLegend = value; } } public bool IsBorder { get { return isBorder; } set { isBorder = value; } } public enum LegendPositionEnum { North, NorthWest, West, SouthWest, South, SouthEast, East, NorthEast }

CHAPTER 5 ■ 2D LINE CHARTS
185
public void AddLegend(Canvas canvas, DataCollection dc) { TextBlock tb = new TextBlock(); if (dc.DataList.Count < 1 || !IsLegend) return; int n = 0; string[] legendLabels = new string[dc.DataList.Count]; foreach (DataSeries ds in dc.DataList) { legendLabels[n] = ds.SeriesName; n++; } double legendWidth = 0; Size size = new Size(0, 0); for (int i = 0; i < legendLabels.Length; i++) { tb = new TextBlock(); tb.Text = legendLabels[i]; tb.Measure(new Size(Double.PositiveInfinity, Double.PositiveInfinity)); size = tb.DesiredSize; if (legendWidth < size.Width) legendWidth = size.Width; } legendWidth += 50; legendCanvas.Width = legendWidth + 5; double legendHeight = 17 * dc.DataList.Count; double sx = 6; double sy = 0; double textHeight = size.Height; double lineLength = 34; Rectangle legendRect = new Rectangle(); legendRect.Stroke = Brushes.Black; legendRect.Fill = Brushes.White; legendRect.Width = legendWidth; legendRect.Height = legendHeight; if (IsLegend && IsBorder) LegendCanvas.Children.Add(legendRect); Canvas.SetZIndex(LegendCanvas, 10); n = 1; foreach (DataSeries ds in dc.DataList) { double xSymbol = sx + lineLength / 2; double xText = 2 * sx + lineLength; double yText = n * sy + (2 * n - 1) * textHeight / 2; Line line = new Line(); AddLinePattern(line, ds); line.X1 = sx; line.Y1 = yText;

CHAPTER 5 ■ 2D LINE CHARTS
186
line.X2 = sx + lineLength; line.Y2 = yText; LegendCanvas.Children.Add(line); ds.Symbols.AddSymbol(legendCanvas, new Point(0.5 * (line.X2 - line.X1 + ds.Symbols.SymbolSize) + 1, line.Y1)); tb = new TextBlock(); tb.Text = ds.SeriesName; LegendCanvas.Children.Add(tb); Canvas.SetTop(tb, yText - size.Height / 2); Canvas.SetLeft(tb, xText); n++; } legendCanvas.Width = legendRect.Width; legendCanvas.Height = legendRect.Height; double offSet = 7.0; switch (LegendPosition) { case LegendPositionEnum.East: Canvas.SetRight(legendCanvas, offSet); Canvas.SetTop(legendCanvas, canvas.Height / 2 - legendRect.Height / 2); break; case LegendPositionEnum.NorthEast: Canvas.SetTop(legendCanvas, offSet); Canvas.SetRight(legendCanvas, offSet); break; case LegendPositionEnum.North: Canvas.SetTop(legendCanvas, offSet); Canvas.SetLeft(legendCanvas, canvas.Width / 2 - legendRect.Width / 2); break; case LegendPositionEnum.NorthWest: Canvas.SetTop(legendCanvas, offSet); Canvas.SetLeft(legendCanvas, offSet); break; case LegendPositionEnum.West: Canvas.SetTop(legendCanvas, canvas.Height / 2 - legendRect.Height / 2); Canvas.SetLeft(legendCanvas, offSet); break; case LegendPositionEnum.SouthWest: Canvas.SetBottom(legendCanvas, offSet); Canvas.SetLeft(legendCanvas, offSet); break; case LegendPositionEnum.South: Canvas.SetBottom(legendCanvas, offSet); Canvas.SetLeft(legendCanvas, canvas.Width / 2 - legendRect.Width / 2); break; case LegendPositionEnum.SouthEast: Canvas.SetBottom(legendCanvas, offSet);

CHAPTER 5 ■ 2D LINE CHARTS
187
Canvas.SetRight(legendCanvas, offSet); break; } } private void AddLinePattern(Line line, DataSeries ds) { line.Stroke = ds.LineColor; line.StrokeThickness = ds.LineThickness; switch (ds.LinePattern) { case DataSeries.LinePatternEnum.Dash: line.StrokeDashArray = new DoubleCollection(new double[2] { 4, 3 }); break; case DataSeries.LinePatternEnum.Dot: line.StrokeDashArray = new DoubleCollection(new double[2] { 1, 2 }); break; case DataSeries.LinePatternEnum.DashDot: line.StrokeDashArray = new DoubleCollection(new double[4] { 4, 2, 1, 2 }); break; case DataSeries.LinePatternEnum.None: line.Stroke = Brushes.Transparent; break; } } } }
At first glance, this class looks quite complicated. However, if you read through it carefully, you’ll actually find it quite easy to follow what is happening. It begins with the following member fields, which describe the legend behavior:
private bool isLegend; private bool isBorder; private Canvas legendCanvas; private LegendPositionEnum legendPosition;
The isLegend allows you to turn the legend on or off. The default setting for this field is false. Therefore, you’ll need to change this default value to true if you want to display the legend on your chart. The isBorder field allows you to add a border to the legend. You use the legendCanvas to hold the legend and the LegendPosition to control the location of the legend in your chart. You can add more member fields if you want more control over the legend. For example, you can add corresponding field members and properties for changing the legend’s text color, font, background color, etc. Here, I simply want to show you the basic steps of creating a legend, without adding these extra features.
Note that the Legend class uses the DataSeries class that contains the Symbols, which we will implement in the next section.
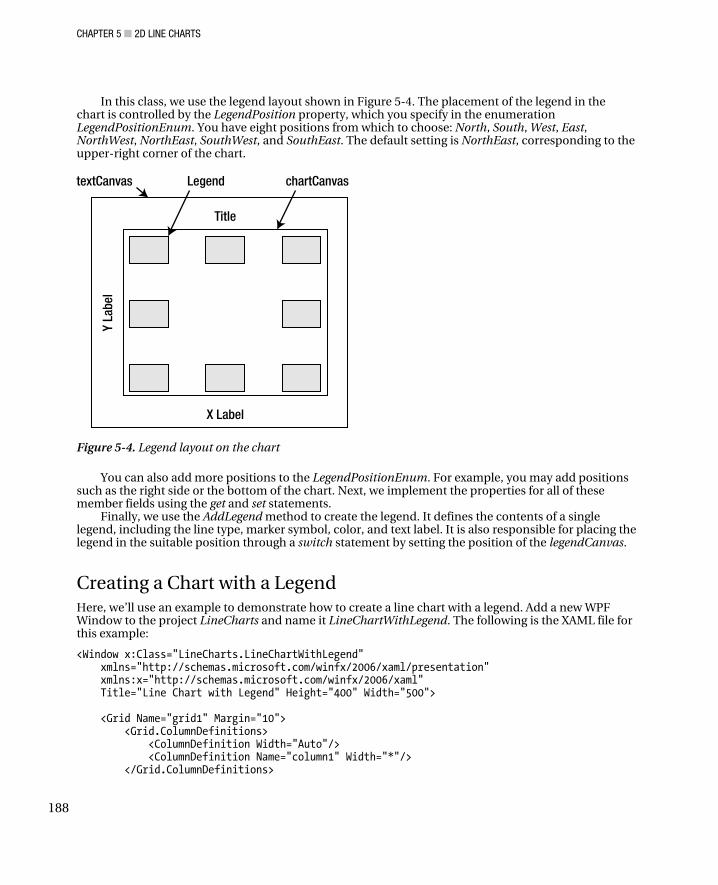
CHAPTER 5 ■ 2D LINE CHARTS
188
In this class, we use the legend layout shown in Figure 5-4. The placement of the legend in the chart is controlled by the LegendPosition property, which you specify in the enumeration LegendPositionEnum. You have eight positions from which to choose: North, South, West, East, NorthWest, NorthEast, SouthWest, and SouthEast. The default setting is NorthEast, corresponding to the upper-right corner of the chart.
Figure 5-4. Legend layout on the chart
You can also add more positions to the LegendPositionEnum. For example, you may add positions such as the right side or the bottom of the chart. Next, we implement the properties for all of these member fields using the get and set statements.
Finally, we use the AddLegend method to create the legend. It defines the contents of a single legend, including the line type, marker symbol, color, and text label. It is also responsible for placing the legend in the suitable position through a switch statement by setting the position of the legendCanvas.
Creating a Chart with a Legend Here, we’ll use an example to demonstrate how to create a line chart with a legend. Add a new WPF Window to the project LineCharts and name it LineChartWithLegend. The following is the XAML file for this example:
<Window x:Class="LineCharts.LineChartWithLegend" xmlns="http://schemas.microsoft.com/winfx/2006/xaml/presentation" xmlns:x="http://schemas.microsoft.com/winfx/2006/xaml" Title="Line Chart with Legend" Height="400" Width="500"> <Grid Name="grid1" Margin="10"> <Grid.ColumnDefinitions> <ColumnDefinition Width="Auto"/> <ColumnDefinition Name="column1" Width="*"/> </Grid.ColumnDefinitions>
CHAPTER 5 ■ 2D LINE CHARTS
189
<Grid.RowDefinitions> <RowDefinition Height="Auto"/> <RowDefinition Name="row1" Height="*"/> <RowDefinition Height="Auto"/> </Grid.RowDefinitions> <TextBlock Margin="2" x:Name="tbTitle" Grid.Column="1" Grid.Row="0" RenderTransformOrigin="0.5,0.5" FontSize="14" FontWeight="Bold" HorizontalAlignment="Stretch" VerticalAlignment="Stretch" TextAlignment="Center" Text="Title"/> <TextBlock Margin="2" x:Name="tbXLabel" Grid.Column="1" Grid.Row="2" RenderTransformOrigin="0.5,0.5" TextAlignment="Center" Text="X Axis"/> <TextBlock Margin="2" Name="tbYLabel" Grid.Column="0" Grid.Row="1" RenderTransformOrigin="0.5,0.5" TextAlignment="Center" Text="Y Axis"> <TextBlock.LayoutTransform> <RotateTransform Angle="-90"/> </TextBlock.LayoutTransform> </TextBlock> <Grid Margin="0" x:Name ="chartGrid" Grid.Column="1" Grid.Row="1" ClipToBounds="True" Background="Transparent" SizeChanged="chartGrid_SizeChanged" /> <Canvas Margin="2" Name="textCanvas" ClipToBounds="True" Grid.Column="1" Grid.Row="1"> <Canvas Name="chartCanvas" ClipToBounds="True"> <Canvas Name="legendCanvas" Background="Transparent" /> </Canvas> </Canvas> </Grid> </Window>
This markup is basically similar to that used in the previous example. Here we create two canvas controls, textCanvas and chartCanvas. The textCanvas becomes a resizable Canvas control when its size combines with the SizeChanged property of the Grid control, named chartGrid. The textCanvas control, as a parent of the chartCanvas, will hold the tick mark labels, and the chartCanvas control will hold the chart itself.
Open the code-behind file of the LineChartWithLegend and add the following code to it:
using System; using System.Windows; using System.Windows.Controls; using System.Windows.Media; using System.Windows.Shapes; namespace LineCharts { public partial class LineChartWithLegend : Window { private ChartStyleGridlines cs; private Legend lg;

CHAPTER 5 ■ 2D LINE CHARTS
190
private DataCollection dc; private DataSeries ds; public LineChartWithLegend() { InitializeComponent(); AddChart(); } private void AddChart() { cs = new ChartStyleGridlines(); lg = new Legend(); dc = new DataCollection(); ds = new DataSeries(); cs.ChartCanvas = chartCanvas; cs.TextCanvas = textCanvas; cs.Title = "Sine and Cosine Chart"; cs.Xmin = 0; cs.Xmax = 7; cs.Ymin = -1.5; cs.Ymax = 1.5; cs.YTick = 0.5; cs.GridlinePattern = ChartStyleGridlines.GridlinePatternEnum.Dot; cs.GridlineColor = Brushes.Black; cs.AddChartStyle(tbTitle, tbXLabel, tbYLabel); // Draw Sine curve: ds.LineColor = Brushes.Blue; ds.LineThickness = 1; ds.SeriesName = "Sine"; for (int i = 0; i < 70; i++) { double x = i / 5.0; double y = Math.Sin(x); ds.LineSeries.Points.Add(new Point(x, y)); } dc.DataList.Add(ds); // Draw cosine curve: ds = new DataSeries(); ds.LineColor = Brushes.Red; ds.SeriesName = "Cosine"; ds.LinePattern = DataSeries.LinePatternEnum.DashDot; ds.LineThickness = 2; for (int i = 0; i < 70; i++) { double x = i / 5.0; double y = Math.Cos(x); ds.LineSeries.Points.Add(new Point(x, y)); } dc.DataList.Add(ds);

CHAPTER 5 ■ 2D LINE CHARTS
191
// Draw sine^2 curve: ds = new DataSeries(); ds.LineColor = Brushes.DarkGreen; ds.SeriesName = "Sine^2"; ds.LinePattern = DataSeries.LinePatternEnum.Dot; ds.LineThickness = 2; for (int i = 0; i < 70; i++) { double x = i / 5.0; double y = Math.Sin(x) * Math.Sin(x); ds.LineSeries.Points.Add(new Point(x, y)); } dc.DataList.Add(ds); dc.AddLines(cs); lg.LegendCanvas = legendCanvas; lg.IsLegend = true; lg.IsBorder = true; lg.LegendPosition = Legend.LegendPositionEnum.NorthWest; lg.AddLegend(cs.ChartCanvas, dc); } private void chartGrid_SizeChanged(object sender, SizeChangedEventArgs e) { textCanvas.Width = chartGrid.ActualWidth; textCanvas.Height = chartGrid.ActualHeight; legendCanvas.Children.Clear(); chartCanvas.Children.RemoveRange(1, chartCanvas.Children.Count - 1); textCanvas.Children.RemoveRange(1, textCanvas.Children.Count - 1); AddChart(); } } }
This code-behind file also looks similar to that of the previous example. The bolded code is specifically required in order to add the legend. Here, you add one more curve to the chart for demonstration purposes. Notice that you need to specify the SeriesName property for each DataSeries because the legend uses the SeriesName as the legend labels. Otherwise, the legend will use the default SeriesName (DataSeries0, DataSeries1, DataSeries2, etc.) as the legend labels.
In order to have the legend appear on your chart, you need to call the AddLegend method. First, add a new member field to this class:
private Legend lg = new Legend();
Then set the Legend’s IsLegend property to true. Please note that you must place the AddLegend method after the AddLines method of the DataCollection object because the legend needs to know how many curves are on your chart.
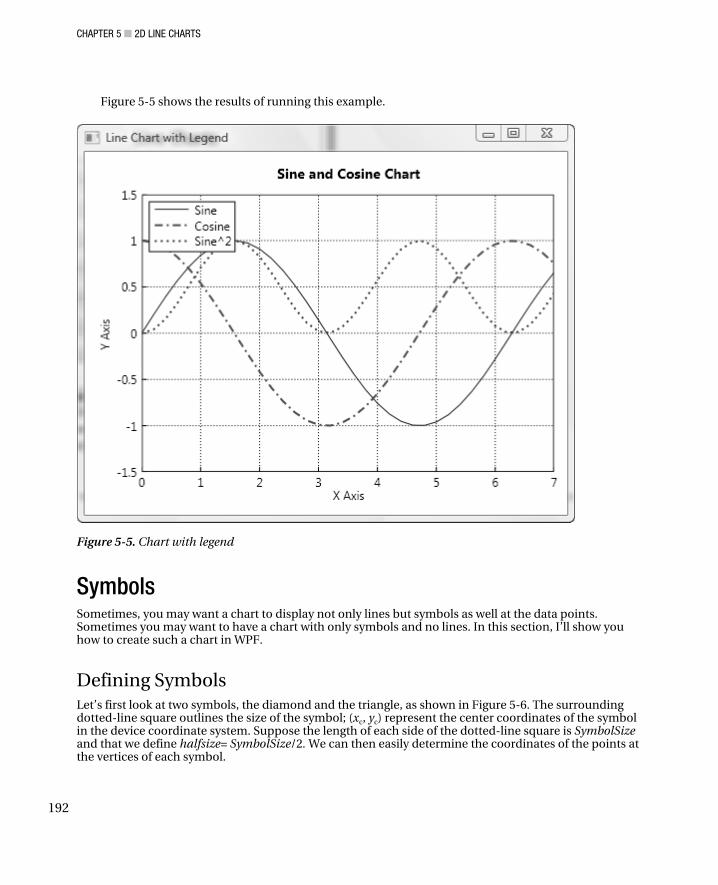
CHAPTER 5 ■ 2D LINE CHARTS
192
Figure 5-5 shows the results of running this example.
Figure 5-5. Chart with legend
Symbols Sometimes, you may want a chart to display not only lines but symbols as well at the data points. Sometimes you may want to have a chart with only symbols and no lines. In this section, I’ll show you how to create such a chart in WPF.
Defining Symbols Let’s first look at two symbols, the diamond and the triangle, as shown in Figure 5-6. The surrounding dotted-line square outlines the size of the symbol; (xc, yc) represent the center coordinates of the symbol in the device coordinate system. Suppose the length of each side of the dotted-line square is SymbolSize and that we define halfsize= SymbolSize/2. We can then easily determine the coordinates of the points at the vertices of each symbol.
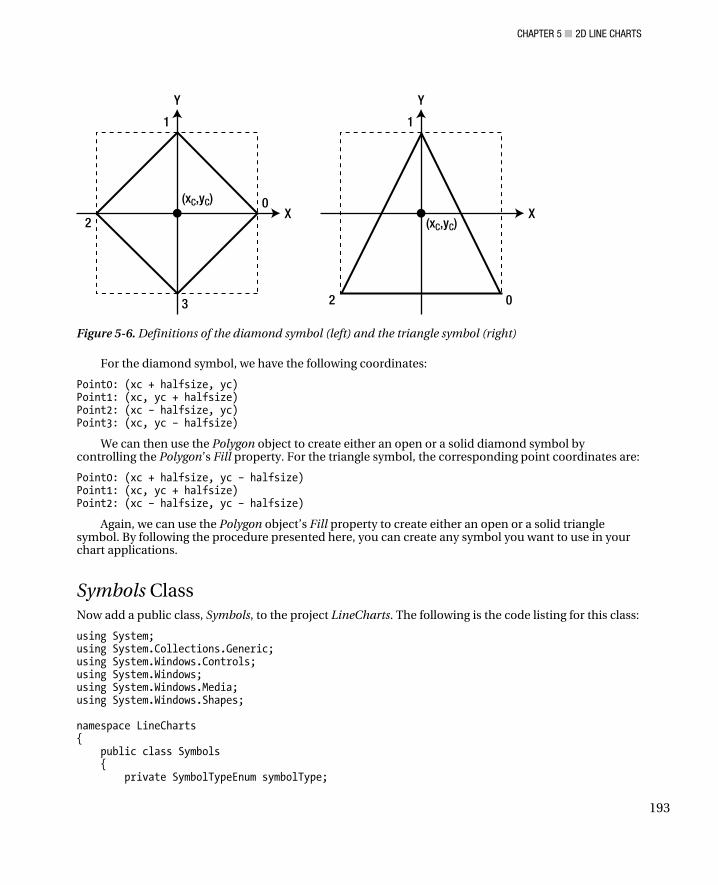
CHAPTER 5 ■ 2D LINE CHARTS
193
Figure 5-6. Definitions of the diamond symbol (left) and the triangle symbol (right)
For the diamond symbol, we have the following coordinates:
Point0: (xc + halfsize, yc) Point1: (xc, yc + halfsize) Point2: (xc – halfsize, yc) Point3: (xc, yc – halfsize)
We can then use the Polygon object to create either an open or a solid diamond symbol by controlling the Polygon’s Fill property. For the triangle symbol, the corresponding point coordinates are:
Point0: (xc + halfsize, yc – halfsize) Point1: (xc, yc + halfsize) Point2: (xc – halfsize, yc – halfsize)
Again, we can use the Polygon object’s Fill property to create either an open or a solid triangle symbol. By following the procedure presented here, you can create any symbol you want to use in your chart applications.
Symbols Class Now add a public class, Symbols, to the project LineCharts. The following is the code listing for this class:
using System; using System.Collections.Generic; using System.Windows.Controls; using System.Windows; using System.Windows.Media; using System.Windows.Shapes; namespace LineCharts { public class Symbols { private SymbolTypeEnum symbolType;

CHAPTER 5 ■ 2D LINE CHARTS
194
private double symbolSize; private Brush borderColor; private Brush fillColor; private double borderThickness; public Symbols() { symbolType = SymbolTypeEnum.None; symbolSize = 8.0; borderColor = Brushes.Black; fillColor = Brushes.Black; borderThickness = 1.0; } public double BorderThickness { get { return borderThickness; } set { borderThickness = value; } } public Brush BorderColor { get { return borderColor; } set { borderColor = value; } } public Brush FillColor { get { return fillColor; } set { fillColor = value; } } public double SymbolSize { get { return symbolSize; } set { symbolSize = value; } } public SymbolTypeEnum SymbolType { get { return symbolType; } set { symbolType = value; } } public enum SymbolTypeEnum { Box = 0, Circle = 1, Cross = 2, Diamond = 3, Dot = 4, InvertedTriangle = 5,

CHAPTER 5 ■ 2D LINE CHARTS
195
None = 6, OpenDiamond = 7, OpenInvertedTriangle = 8, OpenTriangle = 9, Square = 10, Star = 11, Triangle = 12, Plus = 13 } public void AddSymbol(Canvas canvas, Point pt) { Polygon plg = new Polygon(); plg.Stroke = BorderColor; plg.StrokeThickness = BorderThickness; Ellipse ellipse = new Ellipse(); ellipse.Stroke = BorderColor; ellipse.StrokeThickness = BorderThickness; Line line = new Line(); double halfSize = 0.5 * SymbolSize; Canvas.SetZIndex(plg, 5); Canvas.SetZIndex(ellipse, 5); switch (SymbolType) { case SymbolTypeEnum.Square: plg.Fill = Brushes.White; plg.Points.Add(new Point(pt.X - halfSize, pt.Y - halfSize)); plg.Points.Add(new Point(pt.X + halfSize, pt.Y - halfSize)); plg.Points.Add(new Point(pt.X + halfSize, pt.Y + halfSize)); plg.Points.Add(new Point(pt.X - halfSize, pt.Y + halfSize)); canvas.Children.Add(plg); break; case SymbolTypeEnum.OpenDiamond: plg.Fill = Brushes.White; plg.Points.Add(new Point(pt.X - halfSize, pt.Y)); plg.Points.Add(new Point(pt.X, pt.Y - halfSize)); plg.Points.Add(new Point(pt.X + halfSize, pt.Y)); plg.Points.Add(new Point(pt.X, pt.Y + halfSize)); canvas.Children.Add(plg); break; case SymbolTypeEnum.Circle: ellipse.Fill = Brushes.White; ellipse.Width = SymbolSize; ellipse.Height = SymbolSize; Canvas.SetLeft(ellipse, pt.X - halfSize); Canvas.SetTop(ellipse, pt.Y - halfSize); canvas.Children.Add(ellipse); break; case SymbolTypeEnum.OpenTriangle: plg.Fill = Brushes.White; plg.Points.Add(new Point(pt.X - halfSize, pt.Y + halfSize));
CHAPTER 5 ■ 2D LINE CHARTS
196
plg.Points.Add(new Point(pt.X, pt.Y - halfSize)); plg.Points.Add(new Point(pt.X + halfSize, pt.Y + halfSize)); canvas.Children.Add(plg); break; case SymbolTypeEnum.None: break; case SymbolTypeEnum.Cross: line = new Line(); Canvas.SetZIndex(line, 5); line.Stroke = BorderColor; line.StrokeThickness = BorderThickness; line.X1 = pt.X - halfSize; line.Y1 = pt.Y + halfSize; line.X2 = pt.X + halfSize; line.Y2 = pt.Y - halfSize; canvas.Children.Add(line); line = new Line(); Canvas.SetZIndex(line, 5); line.Stroke = BorderColor; line.StrokeThickness = BorderThickness; line.X1 = pt.X - halfSize; line.Y1 = pt.Y - halfSize; line.X2 = pt.X + halfSize; line.Y2 = pt.Y + halfSize; canvas.Children.Add(line); Canvas.SetZIndex(line, 5); break; case SymbolTypeEnum.Star: line = new Line(); Canvas.SetZIndex(line, 5); line.Stroke = BorderColor; line.StrokeThickness = BorderThickness; line.X1 = pt.X - halfSize; line.Y1 = pt.Y + halfSize; line.X2 = pt.X + halfSize; line.Y2 = pt.Y - halfSize; canvas.Children.Add(line); line = new Line(); Canvas.SetZIndex(line, 5); line.Stroke = BorderColor; line.StrokeThickness = BorderThickness; line.X1 = pt.X - halfSize; line.Y1 = pt.Y - halfSize; line.X2 = pt.X + halfSize; line.Y2 = pt.Y + halfSize; canvas.Children.Add(line); line = new Line(); Canvas.SetZIndex(line, 5); line.Stroke = BorderColor; line.StrokeThickness = BorderThickness; line.X1 = pt.X - halfSize; line.Y1 = pt.Y; line.X2 = pt.X + halfSize;

CHAPTER 5 ■ 2D LINE CHARTS
197
line.Y2 = pt.Y; canvas.Children.Add(line); line = new Line(); Canvas.SetZIndex(line, 5); line.Stroke = BorderColor; line.StrokeThickness = BorderThickness; line.X1 = pt.X; line.Y1 = pt.Y - halfSize; line.X2 = pt.X; line.Y2 = pt.Y + halfSize; canvas.Children.Add(line); break; case SymbolTypeEnum.OpenInvertedTriangle: plg.Fill = Brushes.White; plg.Points.Add(new Point(pt.X, pt.Y + halfSize)); plg.Points.Add(new Point(pt.X - halfSize, pt.Y - halfSize)); plg.Points.Add(new Point(pt.X + halfSize, pt.Y - halfSize)); canvas.Children.Add(plg); break; case SymbolTypeEnum.Plus: line = new Line(); Canvas.SetZIndex(line, 5); line.Stroke = BorderColor; line.StrokeThickness = BorderThickness; line.X1 = pt.X - halfSize; line.Y1 = pt.Y; line.X2 = pt.X + halfSize; line.Y2 = pt.Y; canvas.Children.Add(line); line = new Line(); Canvas.SetZIndex(line, 5); line.Stroke = BorderColor; line.StrokeThickness = BorderThickness; line.X1 = pt.X; line.Y1 = pt.Y - halfSize; line.X2 = pt.X; line.Y2 = pt.Y + halfSize; canvas.Children.Add(line); break; case SymbolTypeEnum.Dot: ellipse.Fill = FillColor; ellipse.Width = SymbolSize; ellipse.Height = SymbolSize; Canvas.SetLeft(ellipse, pt.X - halfSize); Canvas.SetTop(ellipse, pt.Y - halfSize); canvas.Children.Add(ellipse); break; case SymbolTypeEnum.Box: plg.Fill = FillColor; plg.Points.Add(new Point(pt.X - halfSize, pt.Y - halfSize)); plg.Points.Add(new Point(pt.X + halfSize, pt.Y - halfSize)); plg.Points.Add(new Point(pt.X + halfSize, pt.Y + halfSize)); plg.Points.Add(new Point(pt.X - halfSize, pt.Y + halfSize));

CHAPTER 5 ■ 2D LINE CHARTS
198
canvas.Children.Add(plg); break; case SymbolTypeEnum.Diamond: plg.Fill = FillColor; plg.Points.Add(new Point(pt.X - halfSize, pt.Y)); plg.Points.Add(new Point(pt.X, pt.Y - halfSize)); plg.Points.Add(new Point(pt.X + halfSize, pt.Y)); plg.Points.Add(new Point(pt.X, pt.Y + halfSize)); canvas.Children.Add(plg); break; case SymbolTypeEnum.InvertedTriangle: plg.Fill = FillColor; plg.Points.Add(new Point(pt.X, pt.Y + halfSize)); plg.Points.Add(new Point(pt.X - halfSize, pt.Y - halfSize)); plg.Points.Add(new Point(pt.X + halfSize, pt.Y - halfSize)); canvas.Children.Add(plg); break; case SymbolTypeEnum.Triangle: plg.Fill = FillColor; plg.Points.Add(new Point(pt.X - halfSize, pt.Y + halfSize)); plg.Points.Add(new Point(pt.X, pt.Y - halfSize)); plg.Points.Add(new Point(pt.X + halfSize, pt.Y + halfSize)); canvas.Children.Add(plg); break; } } } }
In this class, we define five private fields and their corresponding public properties. You can select the type of symbol from the SymbolTypeEnum enumeration using the SymbolType property. The SymbolTypeEnum contains 13 different symbols as well as a None type, which means that no symbols will be drawn on your chart. This type is the default value, which means you must choose a symbol type other than None if you want to draw symbols on your chart applications. You can easily add your own symbols to this enumeration as you like.
The BorderColor property allows you to specify the border color of a symbol. For the Star, Plus, and open symbols, the BorderColor property is the only property you need to define. The default color for this property is black. The FillColor property, with a default color of white, is defined for solid symbols, such as the diamond, triangle, box, and dot. This means that it is possible for a solid symbol to have a border of a different color than its fill by specifying different colors for the BorderColor and FillColor properties.
The BorderThickess property allows you to specify the border line thickness for a symbol. The default value of this property is 1 pixel. The SymbolSize property, which has a default value of 8 pixels, controls the symbol size,
There is a public method in this class called AddSymbol, which takes Canvas and Point objects as input. The Canvas object should be the ChartCanvas you defined in the ChartStyle class, and the Point object represents the center location of the symbol. Note that you must define this input Point in the device coordinate system. Namely, a Point in the world coordinate system must undergo a transformation from the world system to the device system using the NormalizePoint method implemented in the ChartStyle class.
Notice that the symbols must be associated with a DataSeries because each DataSeries can have different symbols. Thus, we need to add the Symbols object to the DataSeries class. Open the DataSeries class and add the following private field and corresponding public property to it:

CHAPTER 5 ■ 2D LINE CHARTS
199
using System; using System.Windows; using System.Windows.Media; using System.Windows.Shapes; namespace LineCharts { public class DataSeries { private Polyline lineSeries = new Polyline(); private Brush lineColor; private double lineThickness = 1; private LinePatternEnum linePattern; private string seriesName = "Default Name"; private Symbols symbols; public DataSeries() { LineColor = Brushes.Black; symbols = new Symbols(); } public Symbols Symbols { get { return symbols; } set { symbols = value; } } …… } }
In order to add the symbols to your chart, you will also need to add the corresponding code snippet to the AddLines method in the DataCollection class:
using System; using System.Collections.Generic; using System.Windows.Controls; using System.Windows.Media; using System.Windows.Shapes; namespace LineCharts { public class DataCollection { …… public void AddLines(ChartStyle cs) { int j = 0; foreach (DataSeries ds in DataList) { if (ds.SeriesName == "Default Name") { ds.SeriesName = "DataSeries" + j.ToString(); }

CHAPTER 5 ■ 2D LINE CHARTS
200
ds.AddLinePattern(); for (int i = 0; i < ds.LineSeries.Points.Count; i++) { ds.LineSeries.Points[i] = cs.NormalizePoint(ds.LineSeries.Points[i]); ds.Symbols.AddSymbol(cs.ChartCanvas, ds.LineSeries.Points[i]); } cs.ChartCanvas.Children.Add(ds.LineSeries); j++; } } } }
Creating a Chart with Symbols Here, we’ll use an example to demonstrate how to create a line chart with symbols. Add a new WPF Window to the project LineCharts and name it LineChartWithSymbols. The XAML file for this example is the same as that in the previous example. Here is the code-behind file:
using System; using System.Collections.Generic; using System.Windows; using System.Windows.Controls; using System.Windows.Media; using System.Windows.Media.Imaging; using System.Windows.Shapes; namespace LineCharts { public partial class LineChartWithSymbols : Window { private ChartStyleGridlines cs; private Legend lg; private DataCollection dc; private DataSeries ds; public LineChartWithSymbols() { InitializeComponent(); AddChart(); } private void AddChart() { cs = new ChartStyleGridlines(); lg = new Legend(); dc = new DataCollection(); ds = new DataSeries(); cs.ChartCanvas = chartCanvas; cs.TextCanvas = textCanvas;
CHAPTER 5 ■ 2D LINE CHARTS
201
cs.Title = "Sine and Cosine Chart"; cs.Xmin = 0; cs.Xmax = 7; cs.Ymin = -1.5; cs.Ymax = 1.5; cs.YTick = 0.5; cs.GridlinePattern = ChartStyleGridlines.GridlinePatternEnum.Dot; cs.GridlineColor = Brushes.Black; cs.AddChartStyle(tbTitle, tbXLabel, tbYLabel); // Draw Sine curve: ds = new DataSeries(); ds.Symbols.BorderColor = Brushes.Blue; ds.Symbols.SymbolType = Symbols.SymbolTypeEnum.OpenDiamond; ds.LineColor = Brushes.Blue; //ds.LineThickness = 1; ds.SeriesName = "Sine"; for (int i = 0; i < 70; i++) { double x = i / 5.0; double y = Math.Sin(x); ds.LineSeries.Points.Add(new Point(x, y)); } dc.DataList.Add(ds); // Draw cosine curve: ds = new DataSeries(); ds.Symbols.BorderColor = Brushes.Red; ds.Symbols.SymbolType = Symbols.SymbolTypeEnum.Dot; ds.Symbols.FillColor = Brushes.Red; ds.LineColor = Brushes.Red; ds.SeriesName = "Cosine"; ds.LinePattern = DataSeries.LinePatternEnum.DashDot; //ds.LineThickness = 2; for (int i = 0; i < 70; i++) { double x = i / 5.0; double y = Math.Cos(x); ds.LineSeries.Points.Add(new Point(x, y)); } dc.DataList.Add(ds); // Draw sine^2 curve: ds = new DataSeries(); ds.Symbols.BorderColor = Brushes.DarkGreen; ds.Symbols.SymbolType = Symbols.SymbolTypeEnum.OpenTriangle; ds.LineColor = Brushes.DarkGreen; ds.SeriesName = "Sine^2"; ds.LinePattern = DataSeries.LinePatternEnum.Dot; //ds.LineThickness = 2; for (int i = 0; i < 70; i++) { double x = i / 5.0;
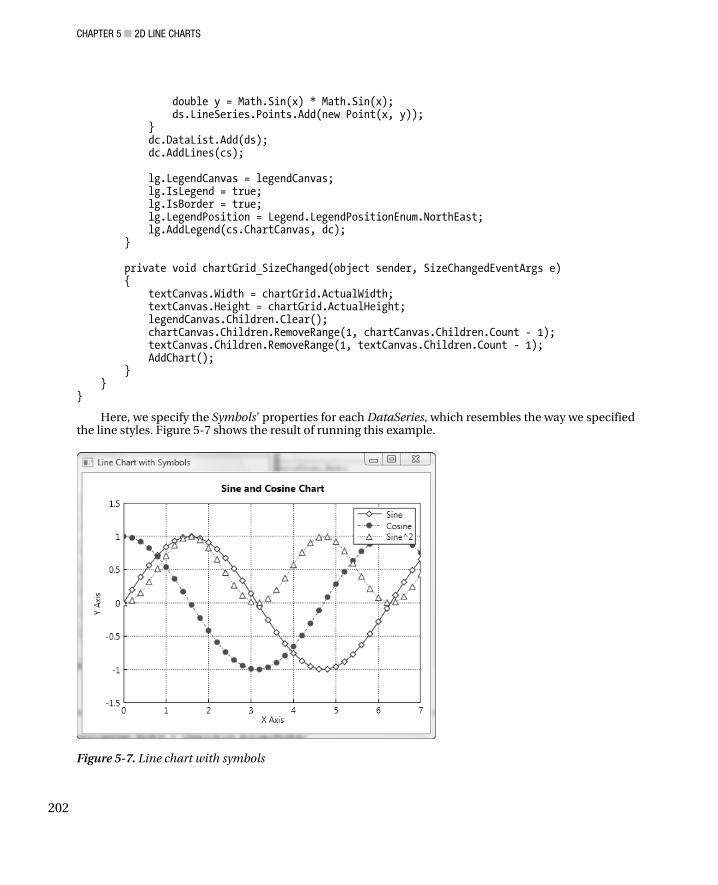
CHAPTER 5 ■ 2D LINE CHARTS
202
double y = Math.Sin(x) * Math.Sin(x); ds.LineSeries.Points.Add(new Point(x, y)); } dc.DataList.Add(ds); dc.AddLines(cs); lg.LegendCanvas = legendCanvas; lg.IsLegend = true; lg.IsBorder = true; lg.LegendPosition = Legend.LegendPositionEnum.NorthEast; lg.AddLegend(cs.ChartCanvas, dc); } private void chartGrid_SizeChanged(object sender, SizeChangedEventArgs e) { textCanvas.Width = chartGrid.ActualWidth; textCanvas.Height = chartGrid.ActualHeight; legendCanvas.Children.Clear(); chartCanvas.Children.RemoveRange(1, chartCanvas.Children.Count - 1); textCanvas.Children.RemoveRange(1, textCanvas.Children.Count - 1); AddChart(); } } }
Here, we specify the Symbols’ properties for each DataSeries, which resembles the way we specified the line styles. Figure 5-7 shows the result of running this example.
Figure 5-7. Line chart with symbols

CHAPTER 5 ■ 2D LINE CHARTS
203
Line Charts with Two Y Axes In the previous sections, we implemented a powerful 2D line chart program. There was no restriction in this program on the number of lines or curves you could add to a single chart. In this section, we’ll add another feature, an additional Y axis, to the 2D line chart.
Why We Need Two Y Axes In some instances, you may have multiple data sets you would like to display on the same chart. However, the Y axis data values for each data set are not within the same range. Let’s say you implement the following code for the AddData method in the code-behind file for the example LineChartWithLegend:
private void AddChart1() { cs = new ChartStyleGridlines(); lg = new Legend(); dc = new DataCollection(); ds = new DataSeries(); cs.ChartCanvas = chartCanvas; cs.TextCanvas = textCanvas; cs.Title = "x*cos(x) & 100+20*x"; cs.Xmin = 0; cs.Xmax = 30; cs.Ymin = -100; cs.Ymax = 700; cs.XTick = 5; cs.YTick = 100; cs.XLabel = "X"; cs.YLabel = "Y"; cs.GridlinePattern = ChartStyleGridlines.GridlinePatternEnum.Dot; cs.GridlineColor = Brushes.Black; cs.AddChartStyle(tbTitle, tbXLabel, tbYLabel); // Draw x*cos(x) curve: ds.LineColor = Brushes.Blue; ds.LineThickness = 1; ds.SeriesName = "x*cos(x)"; for (int i = 0; i < 20; i++) { double x = 1.0 * i; double y = x * Math.Cos(x); ds.LineSeries.Points.Add(new Point(x, y)); } dc.DataList.Add(ds); // Draw 100+20*x curve: ds = new DataSeries(); ds.LineColor = Brushes.Red; ds.SeriesName = "100+20*x"; ds.LinePattern = DataSeries.LinePatternEnum.Dash;
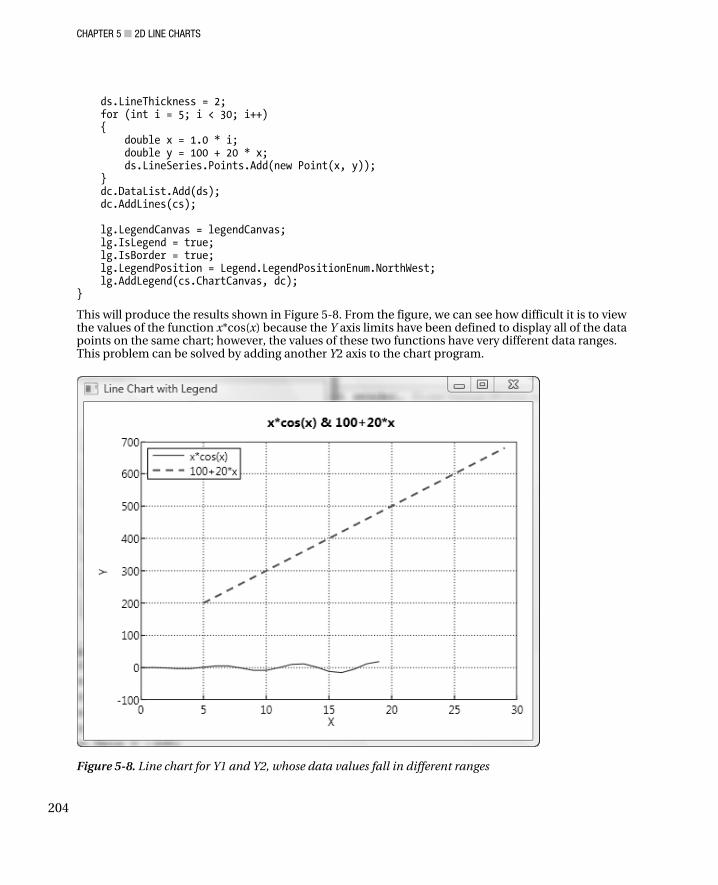
CHAPTER 5 ■ 2D LINE CHARTS
204
ds.LineThickness = 2; for (int i = 5; i < 30; i++) { double x = 1.0 * i; double y = 100 + 20 * x; ds.LineSeries.Points.Add(new Point(x, y)); } dc.DataList.Add(ds); dc.AddLines(cs); lg.LegendCanvas = legendCanvas; lg.IsLegend = true; lg.IsBorder = true; lg.LegendPosition = Legend.LegendPositionEnum.NorthWest; lg.AddLegend(cs.ChartCanvas, dc); }
This will produce the results shown in Figure 5-8. From the figure, we can see how difficult it is to view the values of the function x*cos(x) because the Y axis limits have been defined to display all of the data points on the same chart; however, the values of these two functions have very different data ranges. This problem can be solved by adding another Y2 axis to the chart program.
Figure 5-8. Line chart for Y1 and Y2, whose data values fall in different ranges

CHAPTER 5 ■ 2D LINE CHARTS
205
Chart Style with Two Y Axes In order to add the Y2 axis to a chart, you need to modify the original ChartStyle class. Add a new class, ChartStyle2Y, to the project LineCharts. This new class is inherited from the ChartStyle class:
using System; using System.Windows.Controls; using System.Windows; namespace LineCharts { public class ChartStyle2Y : ChartStyle { private double y2min = 0; private double y2max = 10; private double y2Tick = 2; public double Y2min { get { return y2min; } set { y2min = value; } } public double Y2max { get { return y2max; } set { y2max = value; } } public double Y2Tick { get { return y2Tick; } set { y2Tick = value; } } public Point NormalizePoint2Y(Point pt) { if (ChartCanvas.Width.ToString() == "NaN") ChartCanvas.Width = 270; if (ChartCanvas.Height.ToString() == "NaN") ChartCanvas.Height = 250; Point result = new Point(); result.X = (pt.X - Xmin) * ChartCanvas.Width / (Xmax - Xmin); result.Y = ChartCanvas.Height – (pt.Y - Y2min) * ChartCanvas.Height / (Y2max - Y2min); return result; } } }
In this class, you simply define fields and properties for the Y2 axis limits and add a method NormalizePoint2Y to convert the Y2 data points from the world coordinate system to the device-independent pixel system, just as you did for the Y data points using the NormalizePoint method.
CHAPTER 5 ■ 2D LINE CHARTS
206
For a chart that uses the Y2 axis, you may also want to add additional gridlines, labels, and tick marks. You can achieve this by adding a new class, named ChartStyleGridlines2Y, to the current project. This class, inherited from ChartStyle2Y, is quite similar to the ChartStyleGridlines class, except it contains an additional Y2 axis. Here, I’ll list the code for this new class for your reference:
using System; using System.Windows.Controls; using System.Windows; using System.Windows.Media; using System.Windows.Shapes; namespace LineCharts { class ChartStyleGridlines2Y : ChartStyle2Y { private string title; private string xLabel; private string yLabel; private string y2Label; private Canvas textCanvas; private bool isXGrid = true; private bool isYGrid = true; private Brush gridlineColor = Brushes.LightGray; private double xTick = 1; private double yTick = 0.5; private GridlinePatternEnum gridlinePattern; private double leftOffset = 20; private double bottomOffset = 15; private double rightOffset = 10; private Line gridline = new Line(); public ChartStyleGridlines2Y() { title = "Title"; xLabel = "X Axis"; yLabel = "Y Axis"; y2Label = "Y2 Axis"; } public string Title { get { return title; } set { title = value; } } public string XLabel { get { return xLabel; } set { xLabel = value; } } public string YLabel {
CHAPTER 5 ■ 2D LINE CHARTS
207
get { return yLabel; } set { yLabel = value; } } public string Y2Label { get { return y2Label; } set { y2Label = value; } } public GridlinePatternEnum GridlinePattern { get { return gridlinePattern; } set { gridlinePattern = value; } } public double XTick { get { return xTick; } set { xTick = value; } } public double YTick { get { return yTick; } set { yTick = value; } } public Brush GridlineColor { get { return gridlineColor; } set { gridlineColor = value; } } public Canvas TextCanvas { get { return textCanvas; } set { textCanvas = value; } } public bool IsXGrid { get { return isXGrid; } set { isXGrid = value; } } public bool IsYGrid { get { return isYGrid; } set { isYGrid = value; } }

CHAPTER 5 ■ 2D LINE CHARTS
208
public void AddChartStyle(TextBlock tbTitle, TextBlock tbXLabel, TextBlock tbYLabel, TextBlock tbY2Label) { Point pt = new Point(); Line tick = new Line(); double offset = 0; double dx, dy; TextBlock tb = new TextBlock(); Size size = new Size(); // Determine right offset: for (dy = Y2min; dy <= Y2max; dy += Y2Tick) { pt = NormalizePoint2Y(new Point(Xmax, dy)); tb = new TextBlock(); tb.Text = dy.ToString(); tb.TextAlignment = TextAlignment.Left; tb.Measure(new Size(Double.PositiveInfinity, Double.PositiveInfinity)); size = tb.DesiredSize; if (offset < size.Width) offset = size.Width; } rightOffset = offset + 10; // Determine left offset: for (dy = Ymin; dy <= Ymax; dy += YTick) { pt = NormalizePoint(new Point(Xmin, dy)); tb = new TextBlock(); tb.Text = dy.ToString(); tb.TextAlignment = TextAlignment.Right; tb.Measure(new Size(Double.PositiveInfinity, Double.PositiveInfinity)); size = tb.DesiredSize; if (offset < size.Width) offset = size.Width; } leftOffset = offset + 5; Canvas.SetLeft(ChartCanvas, leftOffset); Canvas.SetBottom(ChartCanvas, bottomOffset); ChartCanvas.Width = TextCanvas.Width - leftOffset - rightOffset; ChartCanvas.Height = TextCanvas.Height - bottomOffset - size.Height / 2; Rectangle chartRect = new Rectangle(); chartRect.Stroke = Brushes.Black; chartRect.Width = ChartCanvas.Width; chartRect.Height = ChartCanvas.Height; ChartCanvas.Children.Add(chartRect); // Create vertical gridlines: if (IsYGrid == true) {

CHAPTER 5 ■ 2D LINE CHARTS
209
for (dx = Xmin + XTick; dx < Xmax; dx += XTick) { gridline = new Line(); AddLinePattern(); gridline.X1 = NormalizePoint(new Point(dx, Ymin)).X; gridline.Y1 = NormalizePoint(new Point(dx, Ymin)).Y; gridline.X2 = NormalizePoint(new Point(dx, Ymax)).X; gridline.Y2 = NormalizePoint(new Point(dx, Ymax)).Y; ChartCanvas.Children.Add(gridline); } } // Create horizontal gridlines: if (IsXGrid == true) { for (dy = Ymin + YTick; dy < Ymax; dy += YTick) { gridline = new Line(); AddLinePattern(); gridline.X1 = NormalizePoint(new Point(Xmin, dy)).X; gridline.Y1 = NormalizePoint(new Point(Xmin, dy)).Y; gridline.X2 = NormalizePoint(new Point(Xmax, dy)).X; gridline.Y2 = NormalizePoint(new Point(Xmax, dy)).Y; ChartCanvas.Children.Add(gridline); } } // Create x-axis tick marks: for (dx = Xmin; dx <= Xmax; dx += xTick) { pt = NormalizePoint(new Point(dx, Ymin)); tick = new Line(); tick.Stroke = Brushes.Black; tick.X1 = pt.X; tick.Y1 = pt.Y; tick.X2 = pt.X; tick.Y2 = pt.Y - 5; ChartCanvas.Children.Add(tick); tb = new TextBlock(); tb.Text = dx.ToString(); tb.Measure(new Size(Double.PositiveInfinity, Double.PositiveInfinity)); size = tb.DesiredSize; TextCanvas.Children.Add(tb); Canvas.SetLeft(tb, leftOffset + pt.X - size.Width / 2); Canvas.SetTop(tb, pt.Y + 2 + size.Height / 2); } // Create y-axis tick marks: for (dy = Ymin; dy <= Ymax; dy += YTick) { pt = NormalizePoint(new Point(Xmin, dy));

CHAPTER 5 ■ 2D LINE CHARTS
210
tick = new Line(); tick.Stroke = Brushes.Black; tick.X1 = pt.X; tick.Y1 = pt.Y; tick.X2 = pt.X + 5; tick.Y2 = pt.Y; ChartCanvas.Children.Add(tick); tb = new TextBlock(); tb.Text = dy.ToString(); tb.Measure(new Size(Double.PositiveInfinity, Double.PositiveInfinity)); size = tb.DesiredSize; TextCanvas.Children.Add(tb); Canvas.SetRight(tb, ChartCanvas.Width + 35); Canvas.SetTop(tb, pt.Y - 1); } // Create y2-axis tick marks: for (dy = Y2min; dy <= Y2max; dy += Y2Tick) { pt = NormalizePoint2Y(new Point(Xmax, dy)); tick = new Line(); tick.Stroke = Brushes.Black; tick.X1 = pt.X; tick.Y1 = pt.Y; tick.X2 = pt.X - 5; tick.Y2 = pt.Y; ChartCanvas.Children.Add(tick); tb = new TextBlock(); tb.Text = dy.ToString(); tb.Measure(new Size(Double.PositiveInfinity, Double.PositiveInfinity)); size = tb.DesiredSize; TextCanvas.Children.Add(tb); Canvas.SetLeft(tb, ChartCanvas.Width + 30); Canvas.SetTop(tb, pt.Y - 1); } // Add title and labels: tbTitle.Text = Title; tbXLabel.Text = XLabel; tbYLabel.Text = YLabel; tbY2Label.Text = Y2Label;

CHAPTER 5 ■ 2D LINE CHARTS
211
tbXLabel.Margin = new Thickness(leftOffset - rightOffset + 2, 2, 2, 2); tbTitle.Margin = new Thickness(leftOffset - rightOffset + 2, 2, 2, 2); } public void AddLinePattern() { gridline.Stroke = GridlineColor; gridline.StrokeThickness = 1; switch (GridlinePattern) { case GridlinePatternEnum.Dash: gridline.StrokeDashArray = new DoubleCollection(new double[2] { 4, 3 }); break; case GridlinePatternEnum.Dot: gridline.StrokeDashArray = new DoubleCollection(new double[2] { 1, 2 }); break; case GridlinePatternEnum.DashDot: gridline.StrokeDashArray = new DoubleCollection(new double[4] { 4, 2, 1, 2 }); break; } } public enum GridlinePatternEnum { Solid = 1, Dash = 2, Dot = 3, DashDot = 4 } } }
In the foregoing code, the changes made to include the Y2 axis have been highlighted.
DataSeries and DataCollection with Two Y Axes We also need to make modifications to both the DataSeries and DataCollection classes. Add a new class, DataSeries2Y, to the current project. This class derives from the original DataSeries class. We only need to add one member field and corresponding property to this class:
using System; using System.Windows; using System.Windows.Media; using System.Windows.Shapes;
CHAPTER 5 ■ 2D LINE CHARTS
212
namespace LineCharts { public class DataSeries2Y : DataSeries { private bool isY2Data = false; public bool IsY2Data { get { return isY2Data; } set { isY2Data = value; } } } }
The IsY2Data property allows you to associate a DataSeries2Y object with either the Y axis or the Y2 axis. If it is false, the DataSeries2Y is associated with the original Y axis. On the other hand, the DataSeries2Y is associated with the Y2 axis if this property is set to true.
You also need to make corresponding changes to the DataCollection class. Add a new class, DataCollection2Y, to the current project. Here is its code listing:
using System; using System.Collections.Generic; using System.Windows.Controls; using System.Windows.Media; using System.Windows.Shapes; namespace LineCharts { public class DataCollection2Y : DataCollection { public void AddLines2Y(ChartStyle2Y cs) { int j = 0; foreach (DataSeries2Y ds in DataList) { if (ds.SeriesName == "Default Name") { ds.SeriesName = "DataSeries" + j.ToString(); } ds.AddLinePattern(); for (int i = 0; i < ds.LineSeries.Points.Count; i++) { if (ds.IsY2Data) ds.LineSeries.Points[i] = cs.NormalizePoint2Y(ds.LineSeries.Points[i]); else ds.LineSeries.Points[i] = cs.NormalizePoint(ds.LineSeries.Points[i]); ds.Symbols.AddSymbol(cs.ChartCanvas, ds.LineSeries.Points[i]); } cs.ChartCanvas.Children.Add(ds.LineSeries); j++; }
CHAPTER 5 ■ 2D LINE CHARTS
213
} } }
This class, inherited from the DataCollection class, contains only one method, AddLines2Y, which allows you to create a line chart with two Y axes.
Creating a Chart with Two Y Axes Here, I’ll use an example to demonstrate how to create a line chart with two Y axes. Add a new WPF Window to the project LineCharts and name it LineChartWith2YAxes. Here is the XAML file for this example:
<Window x:Class="LineCharts.LineChartWith2YAxes" xmlns="http://schemas.microsoft.com/winfx/2006/xaml/presentation" xmlns:x="http://schemas.microsoft.com/winfx/2006/xaml" Title="LineChartWithTwoYAxes" Height="400" Width="500"> <Grid Name="grid1" Margin="10"> <Grid.ColumnDefinitions> <ColumnDefinition Width="auto"/> <ColumnDefinition Name="column1" Width="*"/> <ColumnDefinition Width="auto"/> </Grid.ColumnDefinitions> <Grid.RowDefinitions> <RowDefinition Height="auto"/> <RowDefinition Name="row1" Height="*"/> <RowDefinition Height="auto"/> </Grid.RowDefinitions> <TextBlock Margin="2" x:Name="tbTitle" Grid.Column="1" Grid.Row="0" RenderTransformOrigin="0.5,0.5" FontSize="14" FontWeight="Bold" HorizontalAlignment="Stretch" VerticalAlignment="Stretch" TextAlignment="Center" Text="Title"/> <TextBlock Margin="5" x:Name="tbXLabel" Grid.Column="1" Grid.Row="2" RenderTransformOrigin="0.5,0.5" TextAlignment="Center" Text="X Axis"/> <TextBlock Margin="5" Name="tbYLabel" Grid.Column="0" Grid.Row="1" RenderTransformOrigin="0.5,0.5" TextAlignment="Center" Text="Y Axis"> <TextBlock.LayoutTransform> <RotateTransform Angle="-90"/> </TextBlock.LayoutTransform> </TextBlock> <TextBlock Margin="5" Name="tbY2Label" Grid.Column="2" Grid.Row="1" RenderTransformOrigin="0.5,0.5" TextAlignment="Center" Text="Y2 Axis"> <TextBlock.LayoutTransform> <RotateTransform Angle="-90"/> </TextBlock.LayoutTransform> </TextBlock>

CHAPTER 5 ■ 2D LINE CHARTS
214
<Grid Margin="0" x:Name ="chartGrid" Grid.Column="1" Grid.Row="1" ClipToBounds="True" Background="Transparent" SizeChanged="chartGrid_SizeChanged" /> <Canvas Margin="2" Name="textCanvas" ClipToBounds="True" Grid.Column="1" Grid.Row="1"> <Canvas Name="chartCanvas" ClipToBounds="True"> <Canvas Name="legendCanvas" Background="Transparent" /> </Canvas> </Canvas> </Grid> </Window>
This XAML code is similar to that used in the previous example, except for the addition of the Y2 label. Here is the code-behind file for this example:
using System; using System.Collections.Generic; using System.Windows; using System.Windows.Controls; using System.Windows.Media; using System.Windows.Shapes; namespace LineCharts { public partial class LineChartWith2YAxes : Window { private ChartStyleGridlines2Y cs; private Legend lg; private DataCollection2Y dc; private DataSeries2Y ds; public LineChartWith2YAxes() { InitializeComponent(); AddChart(); } private void AddChart() { cs = new ChartStyleGridlines2Y(); lg = new Legend(); dc = new DataCollection2Y(); ds = new DataSeries2Y(); cs.ChartCanvas = chartCanvas; cs.TextCanvas = textCanvas; cs.Title = "Sine and Cosine Chart"; cs.Xmin = 0; cs.Xmax = 30; cs.Ymin = -20; cs.Ymax = 20; cs.YTick = 5;

CHAPTER 5 ■ 2D LINE CHARTS
215
cs.XTick = 5; cs.Y2min = 100; cs.Y2max = 700; cs.Y2Tick = 100; cs.XLabel = "X Axis"; cs.YLabel = "Y Axis"; cs.Y2Label = "Y2 Axis"; cs.Title = "line Chart with Y2 Axis"; cs.GridlinePattern = ChartStyleGridlines2Y.GridlinePatternEnum.Dot; cs.GridlineColor = Brushes.Transparent; cs.AddChartStyle(tbTitle, tbXLabel, tbYLabel, tbY2Label); // Draw Y curve: ds = new DataSeries2Y(); ds.Symbols.BorderColor = Brushes.Blue; ds.Symbols.SymbolType = Symbols.SymbolTypeEnum.OpenDiamond; ds.LineColor = Brushes.Blue; ds.SeriesName = "x * cos (x)"; for (int i = 0; i < 20; i++) { double x = 1.0 * i; double y = x*Math.Cos(x); ds.LineSeries.Points.Add(new Point(x, y)); } dc.DataList.Add(ds); // Draw Y2 curve: ds = new DataSeries2Y(); ds.IsY2Data = true; ds.Symbols.BorderColor = Brushes.Red; ds.Symbols.SymbolType = Symbols.SymbolTypeEnum.Dot; ds.Symbols.FillColor = Brushes.Red; ds.LineColor = Brushes.Red; ds.SeriesName = "100 + 20 * x"; ds.LinePattern = DataSeries.LinePatternEnum.DashDot; for (int i = 5; i < 30; i++) { double x = 1.0 * i; double y = 100.0 + 20.0 * x; ds.LineSeries.Points.Add(new Point(x, y)); } dc.DataList.Add(ds); dc.AddLines2Y(cs); lg.LegendCanvas = legendCanvas; lg.IsLegend = true; lg.IsBorder = true; lg.LegendPosition = Legend.LegendPositionEnum.NorthWest; lg.AddLegend(cs.ChartCanvas, dc); } private void chartGrid_SizeChanged(object sender, SizeChangedEventArgs e) {
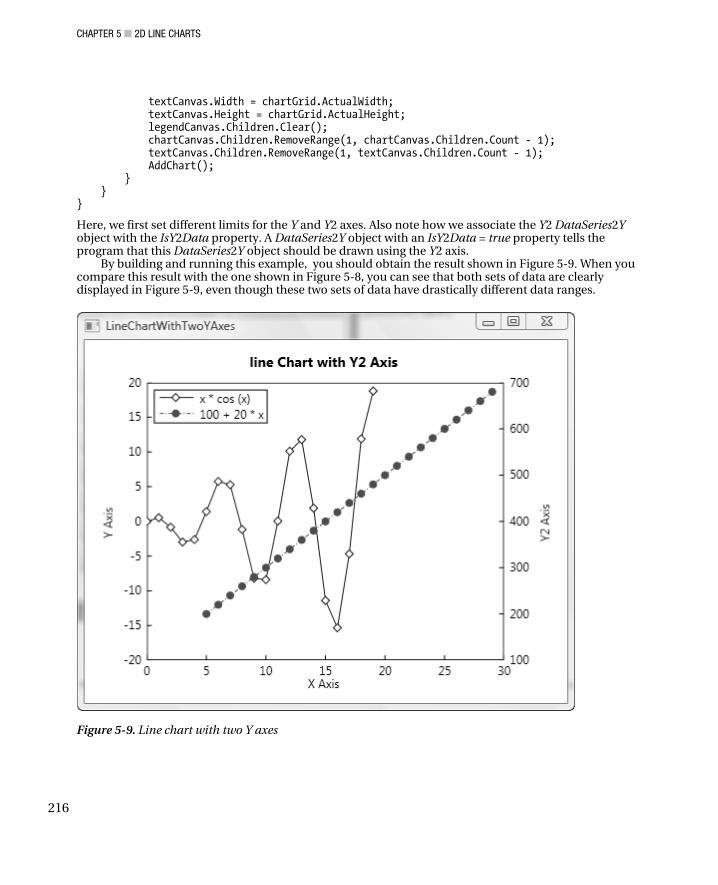
CHAPTER 5 ■ 2D LINE CHARTS
216
textCanvas.Width = chartGrid.ActualWidth; textCanvas.Height = chartGrid.ActualHeight; legendCanvas.Children.Clear(); chartCanvas.Children.RemoveRange(1, chartCanvas.Children.Count - 1); textCanvas.Children.RemoveRange(1, textCanvas.Children.Count - 1); AddChart(); } } }
Here, we first set different limits for the Y and Y2 axes. Also note how we associate the Y2 DataSeries2Y object with the IsY2Data property. A DataSeries2Y object with an IsY2Data = true property tells the program that this DataSeries2Y object should be drawn using the Y2 axis.
By building and running this example, you should obtain the result shown in Figure 5-9. When you compare this result with the one shown in Figure 5-8, you can see that both sets of data are clearly displayed in Figure 5-9, even though these two sets of data have drastically different data ranges.
Figure 5-9. Line chart with two Y axes

C H A P T E R 6
■ ■ ■
217
Specialized 2D Charts
In the previous chapter, we discussed 2D line charts, which you can use to visualize data in real-world WPF applications. In this chapter, I’ll show you how to create certain special or application-specific charts in WPF. These charts are typically found in commercial charting packages or spreadsheet applications. I’ll discuss a variety of special charts that display statistical distributions of data or discrete data, including bar, stair-step, stem, error bar, and area charts. You’ll also learn how to create charts in other coordinate systems, such as pie and polar charts.
Bar Charts The bar chart is useful for comparing classes or groups of data. In a bar chart, a class or group can contain a single category of data, or it can be broken down further into multiple categories for a greater depth of analysis. A bar chart is often used in exploratory data analysis to illustrate the major features of the distribution of the data in a convenient form. It displays the data using a number of rectangles of the same width, each of which represents a particular category. The length (and hence area) of each rectangle is proportional to the number of cases in the category it represents, for example, age group or religious affiliation.
DataSeries for Bar Charts You can use the same ChartStyle class implemented in the previous chapter to create bar charts. However, you’ll need to modify the DataSeries and DataCollection classes in order to create bar charts.
Let’s start with a new WPF Window application project and name it Specialized2DCharts. Add to the current project the following files from the project LineCharts in Chapter 5: ChartStyle.cs, ChartStyleGridlines.cs, DataSeries.cs, DataCollection.cs, and Symbols.cs. Also add to the project the file ColormapBrush.cs from the project ColorsAndBrushes in Chapter 4. Change all of these classes’ namespaces to Specialized2DCharts.
Now we want to implement a new DataSeries class for bar charts. Add a new class, DataSeriesBar, to the current project. This class is inherited from the original DataSeries class:
using System; using System.Windows; using System.Windows.Media; using System.Windows.Shapes;

CHAPTER 6 ■ SPECIALIZED 2D CHARTS
218
namespace Specialized2DCharts { public class DataSeriesBar : DataSeries { private Brush fillColor = Brushes.Black; private Brush borderColor = Brushes.Black; private double borderThickness = 1.0; private double barWidth = 0.8; public Brush FillColor { get { return fillColor; } set { fillColor = value; } } public Brush BorderColor { get { return borderColor; } set { borderColor = value; } } public double BorderThickness { get { return borderThickness; } set { borderThickness = value; } } public double BarWidth { get { return barWidth; } set { barWidth = value; } } } }
This class is very simple. We define several member fields and their corresponding properties, which will allow you to specify the bar width, fill color, and border style.
DataCollection for Bar Charts The DataCollection class for bar charts is more complicated than that for line charts, because this class will be responsible for creating several different types of bar charts. Add a new class, DataCollectionBar, to the current project. Here is the code listing for this class:
using System; using System.Collections.Generic; using System.Windows; using System.Windows.Controls; using System.Windows.Media; using System.Windows.Shapes; namespace Specialized2DCharts {

CHAPTER 6 ■ SPECIALIZED 2D CHARTS
219
public class DataCollectionBar : DataCollection { private BarTypeEnum barType = BarTypeEnum.Vertical; public BarTypeEnum BarType { get { return barType; } set { barType = value; } } public enum BarTypeEnum { Vertical = 0, Horizontal = 1, VerticalStack = 2, HorizontalStack = 3, VerticalOverlay = 4, HorizontalOverlay = 5 } public void AddBars(ChartStyleGridlines csg) { int nSeries = DataList.Count; double width; switch (BarType) { case BarTypeEnum.Vertical: if (nSeries == 1) { foreach (DataSeriesBar ds in DataList) { width = csg.XTick * ds.BarWidth; for (int i = 0; i < ds.LineSeries.Points.Count; i++) { DrawVerticalBar(ds.LineSeries.Points[i], csg, ds, width, 0); } } } else { int j = 0; foreach (DataSeriesBar ds in DataList) { for (int i = 0; i < ds.LineSeries.Points.Count; i++) { DrawVerticalBar1(ds.LineSeries.Points[i], csg, ds, nSeries, j); } j++; } }

CHAPTER 6 ■ SPECIALIZED 2D CHARTS
220
break; case BarTypeEnum.VerticalOverlay: if (nSeries > 1) { int j = 0; foreach (DataSeriesBar ds in DataList) { width = csg.XTick * ds.BarWidth; width = width / Math.Pow(2, j); for (int i = 0; i < ds.LineSeries.Points.Count; i++) { DrawVerticalBar(ds.LineSeries.Points[i], csg, ds, width, 0); } j++; } } break; case BarTypeEnum.VerticalStack: if (nSeries > 1) { List<Point> temp = new List<Point>(); double[] tempy = new double[DataList[0].LineSeries.Points.Count]; foreach (DataSeriesBar ds in DataList) { width = csg.XTick * ds.BarWidth; for (int i = 0; i < ds.LineSeries.Points.Count; i++) { if (temp.Count > 0) { tempy[i] += temp[i].Y; } DrawVerticalBar(ds.LineSeries.Points[i], csg, ds, width, tempy[i]); } temp.Clear(); temp.AddRange(ds.LineSeries.Points); } } break; case BarTypeEnum.Horizontal: if (nSeries == 1) { foreach (DataSeriesBar ds in DataList) { width = csg.YTick * ds.BarWidth; for (int i = 0; i < ds.LineSeries.Points.Count; i++)
CHAPTER 6 ■ SPECIALIZED 2D CHARTS
221
{ DrawHorizontalBar(ds.LineSeries.Points[i], csg, ds, width, 0); } } } else { int j = 0; foreach (DataSeriesBar ds in DataList) { for (int i = 0; i < ds.LineSeries.Points.Count; i++) { DrawHorizontalBar1(ds.LineSeries.Points[i], csg, ds, nSeries, j); } j++; } } break; case BarTypeEnum.HorizontalOverlay: if (nSeries > 1) { int j = 0; foreach (DataSeriesBar ds in DataList) { width = csg.YTick * ds.BarWidth; width = width / Math.Pow(2, j); for (int i = 0; i < ds.LineSeries.Points.Count; i++) { DrawHorizontalBar(ds.LineSeries.Points[i], csg, ds, width, 0); } j++; } } break; case BarTypeEnum.HorizontalStack: if (nSeries > 1) { List<Point> temp = new List<Point>(); double[] tempy = new double[DataList[0].LineSeries.Points.Count]; foreach (DataSeriesBar ds in DataList) { width = csg.YTick * ds.BarWidth; for (int i = 0; i < ds.LineSeries.Points.Count; i++) { if (temp.Count > 0)

CHAPTER 6 ■ SPECIALIZED 2D CHARTS
222
{ tempy[i] += temp[i].X; } DrawHorizontalBar(ds.LineSeries.Points[i], csg, ds, width, tempy[i]); } temp.Clear(); temp.AddRange(ds.LineSeries.Points); } } break; } } private void DrawVerticalBar(Point pt, ChartStyleGridlines csg, DataSeriesBar ds, double width, double y) { Polygon plg = new Polygon(); plg.Fill = ds.FillColor; plg.Stroke = ds.BorderColor; plg.StrokeThickness = ds.BorderThickness; double x = pt.X - 0.5 * csg.XTick; plg.Points.Add(csg.NormalizePoint(new Point(x - width / 2, y))); plg.Points.Add(csg.NormalizePoint(new Point(x + width / 2, y))); plg.Points.Add(csg.NormalizePoint(new Point(x + width / 2, y + pt.Y))); plg.Points.Add(csg.NormalizePoint(new Point(x - width / 2, y + pt.Y))); csg.ChartCanvas.Children.Add(plg); } private void DrawVerticalBar1(Point pt, ChartStyleGridlines csg, DataSeriesBar ds, int nSeries, int n) { Polygon plg = new Polygon(); plg.Fill = ds.FillColor; plg.Stroke = ds.BorderColor; plg.StrokeThickness = ds.BorderThickness; double width = 0.7 * csg.XTick; double w1 = width / nSeries; double w = ds.BarWidth * w1; double space = (w1 - w) / 2; double x = pt.X - 0.5 * csg.XTick; plg.Points.Add(csg.NormalizePoint( new Point(x - width / 2 + space + n * w1, 0))); plg.Points.Add(csg.NormalizePoint( new Point(x - width / 2 + space + n * w1 + w, 0))); plg.Points.Add(csg.NormalizePoint( new Point(x - width / 2 + space + n * w1 + w, pt.Y))); plg.Points.Add(csg.NormalizePoint( new Point(x - width / 2 + space + n * w1, pt.Y))); csg.ChartCanvas.Children.Add(plg);

CHAPTER 6 ■ SPECIALIZED 2D CHARTS
223
} private void DrawHorizontalBar(Point pt, ChartStyleGridlines csg, DataSeriesBar ds, double width, double x) { Polygon plg = new Polygon(); plg.Fill = ds.FillColor; plg.Stroke = ds.BorderColor; plg.StrokeThickness = ds.BorderThickness; double y = pt.Y - 0.5 * csg.YTick; plg.Points.Add(csg.NormalizePoint(new Point(x, y - width / 2))); plg.Points.Add(csg.NormalizePoint(new Point(x, y + width / 2))); plg.Points.Add(csg.NormalizePoint(new Point(x + pt.X, y + width / 2))); plg.Points.Add(csg.NormalizePoint(new Point(x + pt.X, y - width / 2))); csg.ChartCanvas.Children.Add(plg); } private void DrawHorizontalBar1(Point pt, ChartStyleGridlines csg, DataSeriesBar ds, int nSeries, int n) { Polygon plg = new Polygon(); plg.Fill = ds.FillColor; plg.Stroke = ds.BorderColor; plg.StrokeThickness = ds.BorderThickness; double width = 0.7 * csg.YTick; double w1 = width / nSeries; double w = ds.BarWidth * w1; double space = (w1 - w) / 2; double y = pt.Y - 0.5 * csg.YTick; plg.Points.Add(csg.NormalizePoint( new Point(0, y - width / 2 + space + n * w1))); plg.Points.Add(csg.NormalizePoint( new Point(0, y - width / 2 + space + n * w1 + w))); plg.Points.Add(csg.NormalizePoint( new Point(pt.X, y - width / 2 + space + n * w1 + w))); plg.Points.Add(csg.NormalizePoint( new Point(pt.X, y - width / 2 + space + n * w1))); csg.ChartCanvas.Children.Add(plg); } } }
This class is inherited from the original DataCollection class. Here, we first create a private field member named barType and its corresponding public property. Six types of bar charts are defined in the BarTypeEnum: vertical, horizontal, vertical stack, horizontal stack, vertical overlay, and horizontal overlay bar charts.
The main portion of this class is the AddBars method, within which we implement these six types of bar charts. The bar is defined by the point coordinates of its four corners; it is then created using a Polygon object. You can specify the fill color, border color, and border thickness for each bar set through the DataSeriesBar object. Notice that the original ChartStyleGridlines class is used for the bar chart style.
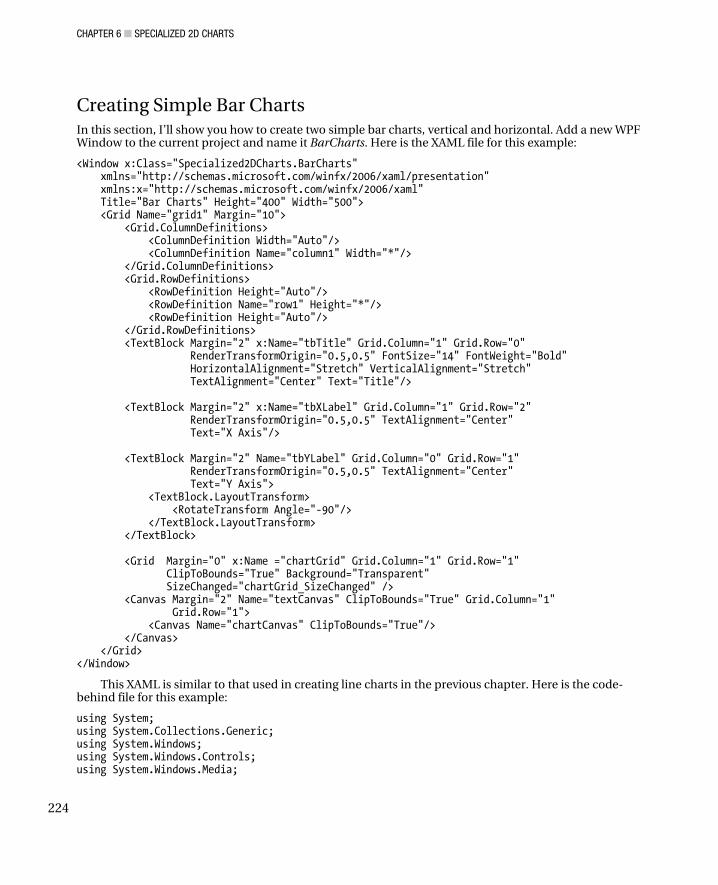
CHAPTER 6 ■ SPECIALIZED 2D CHARTS
224
Creating Simple Bar Charts In this section, I’ll show you how to create two simple bar charts, vertical and horizontal. Add a new WPF Window to the current project and name it BarCharts. Here is the XAML file for this example:
<Window x:Class="Specialized2DCharts.BarCharts" xmlns="http://schemas.microsoft.com/winfx/2006/xaml/presentation" xmlns:x="http://schemas.microsoft.com/winfx/2006/xaml" Title="Bar Charts" Height="400" Width="500"> <Grid Name="grid1" Margin="10"> <Grid.ColumnDefinitions> <ColumnDefinition Width="Auto"/> <ColumnDefinition Name="column1" Width="*"/> </Grid.ColumnDefinitions> <Grid.RowDefinitions> <RowDefinition Height="Auto"/> <RowDefinition Name="row1" Height="*"/> <RowDefinition Height="Auto"/> </Grid.RowDefinitions> <TextBlock Margin="2" x:Name="tbTitle" Grid.Column="1" Grid.Row="0" RenderTransformOrigin="0.5,0.5" FontSize="14" FontWeight="Bold" HorizontalAlignment="Stretch" VerticalAlignment="Stretch" TextAlignment="Center" Text="Title"/> <TextBlock Margin="2" x:Name="tbXLabel" Grid.Column="1" Grid.Row="2" RenderTransformOrigin="0.5,0.5" TextAlignment="Center" Text="X Axis"/> <TextBlock Margin="2" Name="tbYLabel" Grid.Column="0" Grid.Row="1" RenderTransformOrigin="0.5,0.5" TextAlignment="Center" Text="Y Axis"> <TextBlock.LayoutTransform> <RotateTransform Angle="-90"/> </TextBlock.LayoutTransform> </TextBlock> <Grid Margin="0" x:Name ="chartGrid" Grid.Column="1" Grid.Row="1" ClipToBounds="True" Background="Transparent" SizeChanged="chartGrid_SizeChanged" /> <Canvas Margin="2" Name="textCanvas" ClipToBounds="True" Grid.Column="1" Grid.Row="1"> <Canvas Name="chartCanvas" ClipToBounds="True"/> </Canvas> </Grid> </Window>
This XAML is similar to that used in creating line charts in the previous chapter. Here is the code-behind file for this example:
using System; using System.Collections.Generic; using System.Windows; using System.Windows.Controls; using System.Windows.Media;

CHAPTER 6 ■ SPECIALIZED 2D CHARTS
225
using System.Windows.Media.Imaging; using System.Windows.Shapes; namespace Specialized2DCharts { public partial class BarCharts : Window { private ChartStyleGridlines cs; private DataCollectionBar dc; private DataSeriesBar ds; public BarCharts() { InitializeComponent(); } private void chartGrid_SizeChanged(object sender, SizeChangedEventArgs e) { textCanvas.Width = chartGrid.ActualWidth; textCanvas.Height = chartGrid.ActualHeight; chartCanvas.Children.Clear(); textCanvas.Children.RemoveRange(1, textCanvas.Children.Count - 1); AddVerticalBarChart(); //AddVerticalGroupBarChart(); //AddHorizontalBarChart(); //AddHorizontalGroupBarChart(); } private void AddVerticalBarChart() { cs = new ChartStyleGridlines(); dc = new DataCollectionBar(); ds = new DataSeriesBar(); dc.BarType = DataCollectionBar.BarTypeEnum.Vertical; cs.ChartCanvas = chartCanvas; cs.TextCanvas = textCanvas; cs.Title = "Bar Chart"; cs.Xmin = 0; cs.Xmax = 5; cs.Ymin = 0; cs.Ymax = 10; cs.XTick = 1; cs.YTick = 2; cs.GridlinePattern = ChartStyleGridlines.GridlinePatternEnum.Dot; cs.GridlineColor = Brushes.Black; cs.AddChartStyle(tbTitle, tbXLabel, tbYLabel); // Draw the bar chart: dc.DataList.Clear(); ds = new DataSeriesBar(); ds.BorderColor = Brushes.Red;

CHAPTER 6 ■ SPECIALIZED 2D CHARTS
226
ds.FillColor = Brushes.Green; ds.BarWidth = 0.6; for (int i = 0; i < 5; i++) { double x = i + 1.0; double y = 2.0 * x; ds.LineSeries.Points.Add(new Point(x, y)); } dc.DataList.Add(ds); dc.AddBars(cs); } } }
Inside the AddVerticalBarChart method, we set the BarType property to Vertical (this is also the default value). The other parameters defined in this method are standard properties for all charts. We then associate bar style properties with the data series. Here, we set bar width to 0.6 (the default value is 0.8). This value must be in the range of [0, 1].
Running this example generates the result shown in Figure 6-1.
Figure 6-1. Vertical bar chart
In some cases, some of your points may be missing data. You can create a bar chart by assigning a zero value for the Y value at the missing data point. For example: You have a set of data: X = [1, 2, 3, 4, 5] and Y = [2, 0, 3, 8, 10]. You can replace this code snippet in the preceding method:
for (int i = 0; i < 5; i++) {

CHAPTER 6 ■ SPECIALIZED 2D CHARTS
227
double x = i + 1.0; double y = 2.0 * x; ds.LineSeries.Points.Add(new Point(x, y)); }
with the following code:
double[] x = new double[] { 1, 2, 3, 4, 5 }; double[] y = new double[] { 2, 0, 3, 8, 10 }; for (int i = 0; i < x.Length; i++) { ds.LineSeries.Points.Add(new Point(x[i], y[i])); }
This data set will create the result shown in Figure 6-2.
Figure 6-2. Vertical bar chart with a missing data point at x = 2
You can also create a horizontal bar chart just as easily by replacing the AddVerticalBarChart method with the following AddHorizontalBarChart method:
private void AddHorizontalBarChart() { cs = new ChartStyleGridlines(); dc = new DataCollectionBar(); ds = new DataSeriesBar(); dc.BarType = DataCollectionBar.BarTypeEnum.Horizontal; cs.ChartCanvas = chartCanvas; cs.TextCanvas = textCanvas;

CHAPTER 6 ■ SPECIALIZED 2D CHARTS
228
cs.Title = "Bar Chart"; cs.Xmin = 0; cs.Xmax = 10; cs.Ymin = 0; cs.Ymax = 5; cs.XTick = 2; cs.YTick = 1; cs.GridlinePattern = ChartStyleGridlines.GridlinePatternEnum.Dot; cs.GridlineColor = Brushes.Black; cs.AddChartStyle(tbTitle, tbXLabel, tbYLabel); // Draw the bar chart: dc.DataList.Clear(); ds = new DataSeriesBar(); ds.BorderColor = Brushes.Red; ds.FillColor = Brushes.Green; ds.BarWidth = 0.6; for (int i = 0; i < 5; i++) { double x = i + 1.0; double y = 2.0 * x; ds.LineSeries.Points.Add(new Point(y, x)); } dc.DataList.Add(ds); dc.AddBars(cs); }
Note that I have already implemented the code for creating a variety of the bar charts inside the chartGrid_SizeChanged event handler. In order to obtain a desirable bar chart, you just need to uncomment and comment out the appropriate lines of code. Here, we specify the BarType as Horizontal and switch the X and Y axis limits. Build and run the project. You should obtain the horizontal bar chart shown in Figure 6-3.
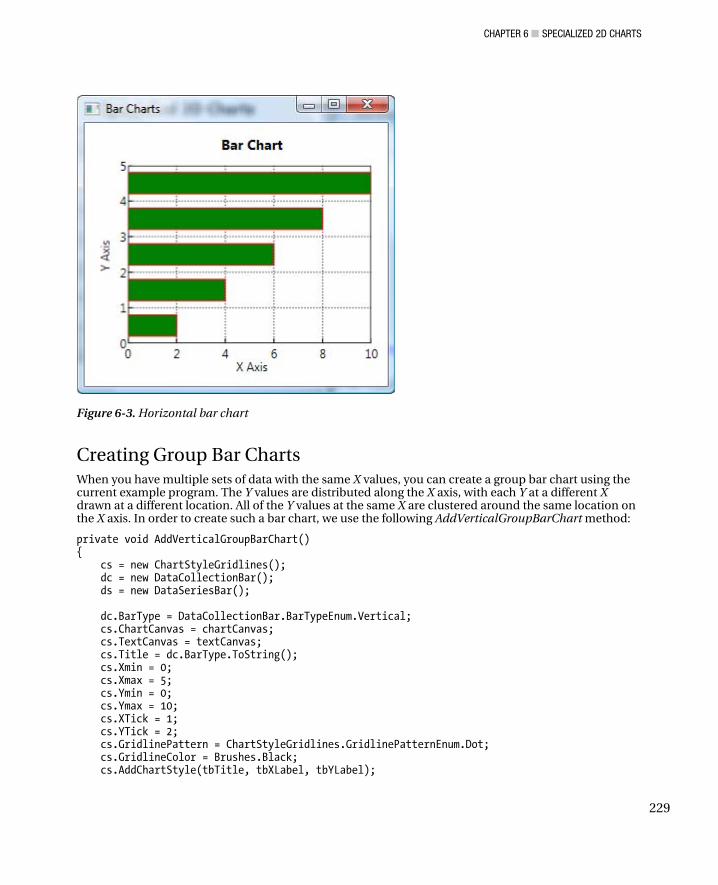
CHAPTER 6 ■ SPECIALIZED 2D CHARTS
229
Figure 6-3. Horizontal bar chart
Creating Group Bar Charts When you have multiple sets of data with the same X values, you can create a group bar chart using the current example program. The Y values are distributed along the X axis, with each Y at a different X drawn at a different location. All of the Y values at the same X are clustered around the same location on the X axis. In order to create such a bar chart, we use the following AddVerticalGroupBarChart method:
private void AddVerticalGroupBarChart() { cs = new ChartStyleGridlines(); dc = new DataCollectionBar(); ds = new DataSeriesBar(); dc.BarType = DataCollectionBar.BarTypeEnum.Vertical; cs.ChartCanvas = chartCanvas; cs.TextCanvas = textCanvas; cs.Title = dc.BarType.ToString(); cs.Xmin = 0; cs.Xmax = 5; cs.Ymin = 0; cs.Ymax = 10; cs.XTick = 1; cs.YTick = 2; cs.GridlinePattern = ChartStyleGridlines.GridlinePatternEnum.Dot; cs.GridlineColor = Brushes.Black; cs.AddChartStyle(tbTitle, tbXLabel, tbYLabel);

CHAPTER 6 ■ SPECIALIZED 2D CHARTS
230
// Add the first bar series: dc.DataList.Clear(); ds = new DataSeriesBar(); ds.BorderColor = Brushes.Red; ds.FillColor = Brushes.Green; ds.BarWidth = 0.9; for (int i = 0; i < 5; i++) { double x = i + 1.0; double y = 2.0 * x; ds.LineSeries.Points.Add(new Point(x, y)); } dc.DataList.Add(ds); // Add the second bar series: ds = new DataSeriesBar(); ds.BorderColor = Brushes.Red; ds.FillColor = Brushes.Yellow; ds.BarWidth = 0.9; for (int i = 0; i < 5; i++) { double x = i + 1.0; double y = 1.5 * x; ds.LineSeries.Points.Add(new Point(x, y)); } dc.DataList.Add(ds); // Add the third bar series: ds = new DataSeriesBar(); ds.BorderColor = Brushes.Red; ds.FillColor = Brushes.Blue; ds.BarWidth = 0.9; for (int i = 0; i < 5; i++) { double x = i + 1.0; double y = 1.0 * x; ds.LineSeries.Points.Add(new Point(x, y)); } dc.DataList.Add(ds); dc.AddBars(cs); }
We add three sets of data series to the method, all with the same set of X values. The bar width is set to 0.9. The fill colors are green, yellow, and blue, respectively; the border color is red for all of the bars. Note that the bar type is still set to Vertical. The program will automatically create a grouped vertical bar chart if more than one set of data is provided. These data sets produce the results shown in Figure 6-4.

CHAPTER 6 ■ SPECIALIZED 2D CHARTS
231
Figure 6-4. Grouped vertical bar chart
Similarly, you can easily create a grouped horizontal bar chart using the following AddHorizontalGroupBarChart method:
private void AddHorizontalGroupBarChart() { cs = new ChartStyleGridlines(); dc = new DataCollectionBar(); ds = new DataSeriesBar(); dc.BarType = DataCollectionBar.BarTypeEnum.Horizontal; cs.ChartCanvas = chartCanvas; cs.TextCanvas = textCanvas; cs.Title = dc.BarType.ToString(); cs.Xmin = 0; cs.Xmax = 10; cs.Ymin = 0; cs.Ymax = 5; cs.XTick = 5; cs.YTick = 1; cs.GridlinePattern = ChartStyleGridlines.GridlinePatternEnum.Dot; cs.GridlineColor = Brushes.Black; cs.AddChartStyle(tbTitle, tbXLabel, tbYLabel); // Add the first bar series: dc.DataList.Clear(); ds = new DataSeriesBar(); ds.BorderColor = Brushes.Red;

CHAPTER 6 ■ SPECIALIZED 2D CHARTS
232
ds.FillColor = Brushes.Green; ds.BarWidth = 0.8; for (int i = 0; i < 5; i++) { double x = i + 1.0; double y = 2.0 * x; ds.LineSeries.Points.Add(new Point(y, x)); } dc.DataList.Add(ds); // Add the second bar series: ds = new DataSeriesBar(); ds.BorderColor = Brushes.Red; ds.FillColor = Brushes.Yellow; ds.BarWidth = 0.8; for (int i = 0; i < 5; i++) { double x = i + 1.0; double y = 1.5 * x; ds.LineSeries.Points.Add(new Point(y, x)); } dc.DataList.Add(ds); // Add the third bar series: ds = new DataSeriesBar(); ds.BorderColor = Brushes.Red; ds.FillColor = Brushes.Blue; ds.BarWidth = 0.8; for (int i = 0; i < 5; i++) { double x = i + 1.0; double y = 1.0 * x; ds.LineSeries.Points.Add(new Point(y, x)); } dc.DataList.Add(ds); dc.AddBars(cs); }
This produces the results of Figure 6-5.
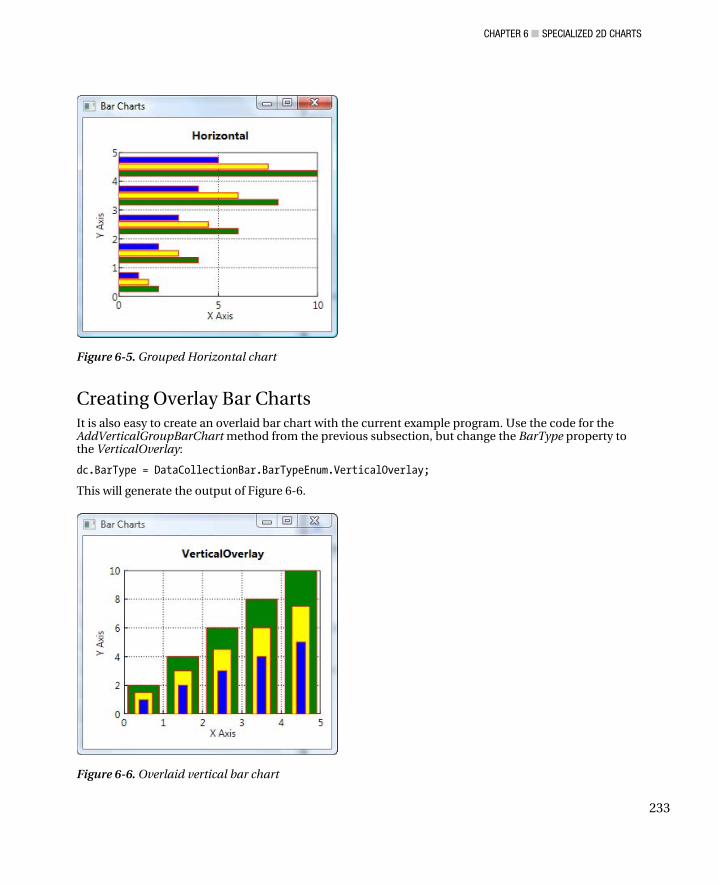
CHAPTER 6 ■ SPECIALIZED 2D CHARTS
233
Figure 6-5. Grouped Horizontal chart
Creating Overlay Bar Charts It is also easy to create an overlaid bar chart with the current example program. Use the code for the AddVerticalGroupBarChart method from the previous subsection, but change the BarType property to the VerticalOverlay:
dc.BarType = DataCollectionBar.BarTypeEnum.VerticalOverlay;
This will generate the output of Figure 6-6.
Figure 6-6. Overlaid vertical bar chart

CHAPTER 6 ■ SPECIALIZED 2D CHARTS
234
Similarly, you can create an overlaid horizontal bar chart using the same code of the AddHorizontalGroupBarChart method, but with the following BarType:
dc.BarType = DataCollectionBar.BarTypeEnum.HorizontalOverlay;
This will produce the result shown in Figure 6-7.
Figure 6-7. Overlaid horizontal bar chart
Creating Stacked Bar Charts Bar charts can show how different Y values at the same X point contribute to the sum of all of the Y values at the point. These types of bar charts are referred to as stacked bar charts.
Stacked bar graphs display one bar per X value. The bars are divided into several fragments according to the number of Y values. For vertical stacked bar charts, the height of each bar equals the sum of all of the Y values at a given X value. Each fragment is equal to the value of its respective Y value.
You can create stacked bar charts with the current example program. Use the same code for the AddVerticalGroupBarChart method as in the previous subsection, but change the BarType property to the following:
dc.BarType = DataCollectionBar.BarTypeEnum.VerticalStack; cs.Ymax = 25; cs.YTick = 5;
This will generate the stacked vertical bar chart shown in Figure 6-8.

CHAPTER 6 ■ SPECIALIZED 2D CHARTS
235
Figure 6-8. Stacked vertical bar chart
Similarly, you can create a stacked horizontal bar chart using the same code of the AddHorizontalGroupBarChart method, with the following changes:
dc.BarType = DataCollectionBar.BarTypeEnum.HorizontalStack; cs.Xmax = 25; cs.XTick = 5;
This will produce the result shown in Figure 6-9.
Figure 6-9. Stacked horizontal bar chart
CHAPTER 6 ■ SPECIALIZED 2D CHARTS
236
Stair-Step Charts In this section, I’ll show you how to create a stair-step chart. Instead of creating lines that directly connect your data, you can choose to have your data plotted in a way that emphasizes the discrete nature of the data. Namely, stair-step charts draw horizontal lines at the level specified by the Y data. This level will be held constant over the period between the values specified by the X data values. Stair-step charts are similar to bar charts except for the fact that the vertical lines are not dropped all the way down to the zero-value point on the Y axis. This type of plot is useful for drawing time-history plots of digitally sampled data systems.
DataSeries for Stair-Step Charts You can use the same ChartStyle class implemented in the previous chapter to create stair-step charts. However, you’ll need to modify the DataSeries and DataCollection classes in order to create these charts.
Add a new class to the project Specialized2DCharts and name it DataSeriesStairstep. Here is the code listing for this new class:
using System; using System.Windows; using System.Windows.Media; using System.Windows.Shapes; namespace Specialized2DCharts { public class DataSeriesStairstep : DataSeries { private Polyline stairstepLineSeries = new Polyline(); private Brush stairstepLineColor; private double stairstepLineThickness = 1; private StairstepLinePatternEnum stairstepLinePattern; public Brush StairstepLineColor { get { return stairstepLineColor; } set { stairstepLineColor = value; } } public Polyline StairstepLineSeries { get { return stairstepLineSeries; } set { stairstepLineSeries = value; } } public double StairstepLineThickness { get { return stairstepLineThickness; } set { stairstepLineThickness = value; } } public StairstepLinePatternEnum StairstepLinePattern { get { return stairstepLinePattern; }

CHAPTER 6 ■ SPECIALIZED 2D CHARTS
237
set { stairstepLinePattern = value; } } public void AddStairstepLinePattern() { StairstepLineSeries.Stroke = StairstepLineColor; StairstepLineSeries.StrokeThickness = StairstepLineThickness; switch (StairstepLinePattern) { case StairstepLinePatternEnum.Dash: StairstepLineSeries.StrokeDashArray = new DoubleCollection(new double[2] { 4, 3 }); break; case StairstepLinePatternEnum.Dot: StairstepLineSeries.StrokeDashArray = new DoubleCollection(new double[2] { 1, 2 }); break; case StairstepLinePatternEnum.DashDot: StairstepLineSeries.StrokeDashArray = new DoubleCollection(new double[4] { 4, 2, 1, 2 }); break; case StairstepLinePatternEnum.None: StairstepLineSeries.Stroke = Brushes.Transparent; break; } } public enum StairstepLinePatternEnum { Solid = 1, Dash = 2, Dot = 3, DashDot = 4, None = 5 } } }
The class is inherited from the DataSeries class. It defines the style for the Polyline object, which is used to create the stair-step curve. This class is very similar to the original DataSeries class used for creating line charts.
DataCollection for Stair-Step Charts Add a new class, DataCollectionStairstep, to the current project. Here is the code listing for this class:
using System; using System.Collections.Generic; using System.Windows; using System.Windows.Controls; using System.Windows.Media; using System.Windows.Shapes;

CHAPTER 6 ■ SPECIALIZED 2D CHARTS
238
namespace Specialized2DCharts { public class DataCollectionStairstep : DataCollection { public void AddStairstep(ChartStyleGridlines csg) { foreach (DataSeriesStairstep ds in DataList) { List<Point> ptList = new List<Point>(); Point[] pts = new Point[2]; ds.AddStairstepLinePattern(); // Create Stairstep data: for (int i = 0; i < ds.LineSeries.Points.Count - 1; i++) { pts[0] = ds.LineSeries.Points[i]; pts[1] = ds.LineSeries.Points[i + 1]; ptList.Add(pts[0]); ptList.Add(new Point(pts[1].X, pts[0].Y)); } ptList.Add(new Point(pts[1].X, pts[0].Y)); // Draw stairstep line: for (int i = 0; i < ptList.Count; i++) { ds.StairstepLineSeries.Points.Add( csg.NormalizePoint(ptList[i])); } csg.ChartCanvas.Children.Add(ds.StairstepLineSeries); } } } }
This class simply implements an AddStairstep method. Note how we create the stair-step data — for two adjacent points, we regenerate two points with the same Y values, which provide the stair-step levels.
Creating Stair-Step Charts In this section, I’ll show you how to create stair-step charts using the DataSeriesStairstep and DataCollectionStairstep classes implemented in the previous sections. Add a new WPF Window to the current project and name it StairstepCharts. The XAML file for this example is the same as that used in the BarCharts example. Here I list only the code-behind file for this example:
using System; using System.Windows; using System.Windows.Controls; using System.Windows.Media; using System.Windows.Shapes; namespace Specialized2DCharts

CHAPTER 6 ■ SPECIALIZED 2D CHARTS
239
{ public partial class StairstepCharts : Window { private ChartStyleGridlines cs; private DataCollectionStairstep dc; private DataSeriesStairstep ds; public StairstepCharts() { InitializeComponent(); } private void chartGrid_SizeChanged(object sender, SizeChangedEventArgs e) { textCanvas.Width = chartGrid.ActualWidth; textCanvas.Height = chartGrid.ActualHeight; chartCanvas.Children.Clear(); textCanvas.Children.RemoveRange(1, textCanvas.Children.Count - 1); AddChart(); } private void AddChart() { cs = new ChartStyleGridlines(); dc = new DataCollectionStairstep(); ds = new DataSeriesStairstep(); cs.ChartCanvas = chartCanvas; cs.TextCanvas = textCanvas; cs.Title = "Stair Step Chart"; cs.Xmin = 0; cs.Xmax = 8; cs.Ymin = -1.5; cs.Ymax = 1.5; cs.XTick = 1; cs.YTick = 0.5; cs.GridlinePattern = ChartStyleGridlines.GridlinePatternEnum.Dot; cs.GridlineColor = Brushes.Black; cs.AddChartStyle(tbTitle, tbXLabel, tbYLabel); // Draw the stair step chart: dc.DataList.Clear(); ds = new DataSeriesStairstep(); ds.StairstepLineColor = Brushes.Red; for (int i = 0; i < 50; i++) { ds.LineSeries.Points.Add(new Point(0.4 * i, Math.Sin(0.4 * i))); } dc.DataList.Add(ds); dc.AddStairstep(cs); } } }
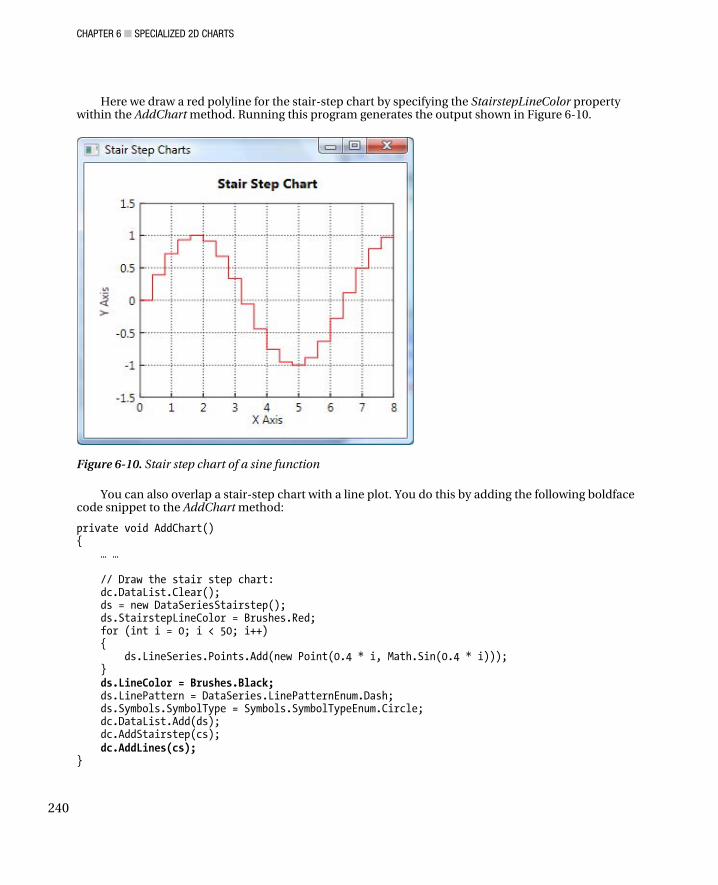
CHAPTER 6 ■ SPECIALIZED 2D CHARTS
240
Here we draw a red polyline for the stair-step chart by specifying the StairstepLineColor property within the AddChart method. Running this program generates the output shown in Figure 6-10.
Figure 6-10. Stair step chart of a sine function
You can also overlap a stair-step chart with a line plot. You do this by adding the following boldface code snippet to the AddChart method:
private void AddChart() { … … // Draw the stair step chart: dc.DataList.Clear(); ds = new DataSeriesStairstep(); ds.StairstepLineColor = Brushes.Red; for (int i = 0; i < 50; i++) { ds.LineSeries.Points.Add(new Point(0.4 * i, Math.Sin(0.4 * i))); } ds.LineColor = Brushes.Black; ds.LinePattern = DataSeries.LinePatternEnum.Dash; ds.Symbols.SymbolType = Symbols.SymbolTypeEnum.Circle; dc.DataList.Add(ds); dc.AddStairstep(cs); dc.AddLines(cs); }

CHAPTER 6 ■ SPECIALIZED 2D CHARTS
241
Here we specify both stair-step and line chart styles. We also add symbols to the line chart. Rebuilding this project yields the results shown in Figure 6-11.
Figure 6-11. Stair-step chart and line chart of a sine function
Stem Charts Stem charts provide another way to visualize discrete data sequences, such as digitally sampled time-series data. In this type of chart, vertical lines terminate with a marker symbol at each data value. In 2D stem charts, these stem lines extend from the X axis.
Creating stem charts is much easier because we can use the original ChartStyle and DataSeries classes. The only class that needs to be modified is the DataCollection class.
DataCollection for Stem Charts Add a new class, DataCollectionStem, to the current project. This class derives from the original DataCollection class. Here is its code listing:
using System; using System.Windows; using System.Windows.Media; using System.Windows.Shapes;

CHAPTER 6 ■ SPECIALIZED 2D CHARTS
242
namespace Specialized2DCharts { class DataCollectionStem : DataCollection { public void AddStems(ChartStyleGridlines csg) { foreach (DataSeries ds in DataList) { Point[] pts = new Point[2]; for (int i = 0; i < ds.LineSeries.Points.Count; i++) { pts[0] = csg.NormalizePoint(new Point(ds.LineSeries.Points[i].X, 0)); pts[1] = csg.NormalizePoint(ds.LineSeries.Points[i]); Line line = new Line(); line.Stroke = ds.LineColor; line.StrokeThickness = ds.LineThickness; line.X1 = pts[0].X; line.Y1 = pts[0].Y; line.X2 = pts[1].X; line.Y2 = pts[1].Y; csg.ChartCanvas.Children.Add(line); ds.Symbols.AddSymbol(csg.ChartCanvas, csg.NormalizePoint(ds.LineSeries.Points[i])); } } } } }
This class looks quite simple, implementing only an AddStem method. Note that at a given point (x, y), we draw a straight line from (x, 0) to (x, y), which defines the stem line at the point (x, y). You specify the stem line style, such as the LineColor and the LineThickness, using the line style defined in the original DataSeries class; you define the symbols at the data values of the stem line using the original Symbols class.
Creating Stem Charts In this section, I’ll show you how to create stem charts using the DataCollectionStem class implemented in the previous section. Add a new WPF Window to the current project and name it StemCharts. The XAML file for this example is the same as that used in the bar chart example. Here I only list the code-behind file for this example:
using System; using System.Windows; using System.Windows.Media; using System.Windows.Shapes; namespace Specialized2DCharts { public partial class StemCharts : Window {

CHAPTER 6 ■ SPECIALIZED 2D CHARTS
243
private ChartStyleGridlines cs; private DataCollectionStem dc; private DataSeries ds; public StemCharts() { InitializeComponent(); } private void chartGrid_SizeChanged(object sender, SizeChangedEventArgs e) { textCanvas.Width = chartGrid.ActualWidth; textCanvas.Height = chartGrid.ActualHeight; chartCanvas.Children.Clear(); textCanvas.Children.RemoveRange(1, textCanvas.Children.Count - 1); AddChart(); } private void AddChart() { cs = new ChartStyleGridlines(); dc = new DataCollectionStem(); ds = new DataSeries(); cs.ChartCanvas = chartCanvas; cs.TextCanvas = textCanvas; cs.Title = "Stem Chart"; cs.Xmin = 0; cs.Xmax = 8; cs.Ymin = -1.5; cs.Ymax = 1.5; cs.XTick = 1; cs.YTick = 0.5; cs.GridlinePattern = ChartStyleGridlines.GridlinePatternEnum.Dot; cs.GridlineColor = Brushes.Black; cs.AddChartStyle(tbTitle, tbXLabel, tbYLabel); // Draw the stair step chart: dc.DataList.Clear(); ds = new DataSeries(); for (int i = 0; i < 50; i++) { ds.LineSeries.Points.Add(new Point(0.4 * i, Math.Sin(0.4 * i))); } ds.LineColor = Brushes.Red; ds.Symbols.SymbolType = Symbols.SymbolTypeEnum.Diamond; ds.Symbols.FillColor = Brushes.Yellow; ds.Symbols.BorderColor = Brushes.DarkGreen; dc.DataList.Add(ds); dc.AddStems(cs); }

CHAPTER 6 ■ SPECIALIZED 2D CHARTS
244
} }
This example produces the result shown in Figure 6-12. The current program has the ability to create a stem chart that terminates with any of the symbols defined in the Symbols class. In addition, these terminating symbols can be filled or unfilled.
Figure 6-12. Stem chart of a sine function
Error Bar Charts Error bars show the confidence level of data or the deviation along a curve. Error bar charts plot the Y data and draw an error bar at each Y data value. The error bar is the distance of the error function above and below the curve so that each bar is symmetric around the curve.
DataSeries for Error Bars You can use the same ChartStyle class implemented in the previous chapter to create error bar charts. However, you’ll need to modify the DataSeries and DataCollection classes.
Add a new class to the project Specialized2DCharts and name it DataSeriesErrorbar. Here is the code listing for this new class:
using System; using System.Windows;

CHAPTER 6 ■ SPECIALIZED 2D CHARTS
245
using System.Windows.Media; using System.Windows.Shapes; namespace Specialized2DCharts { public class DataSeriesErrorbar : DataSeries { private Polyline errorLineSeries = new Polyline(); private Brush errorLineColor; private double errorLineThickness = 1; private ErrorLinePatternEnum errorLinePattern; public Brush ErrorLineColor { get { return errorLineColor; } set { errorLineColor = value; } } public Polyline ErrorLineSeries { get { return errorLineSeries; } set { errorLineSeries = value; } } public double ErrorLineThickness { get { return errorLineThickness; } set { errorLineThickness = value; } } public ErrorLinePatternEnum ErrorLinePattern { get { return errorLinePattern; } set { errorLinePattern = value; } } public void AddErrorLinePattern() { ErrorLineSeries.Stroke = ErrorLineColor; ErrorLineSeries.StrokeThickness = ErrorLineThickness; switch (ErrorLinePattern) { case ErrorLinePatternEnum.Dash: ErrorLineSeries.StrokeDashArray = new DoubleCollection(new double[2] { 4, 3 }); break; case ErrorLinePatternEnum.Dot: ErrorLineSeries.StrokeDashArray = new DoubleCollection(new double[2] { 1, 2 }); break; case ErrorLinePatternEnum.DashDot: ErrorLineSeries.StrokeDashArray =

CHAPTER 6 ■ SPECIALIZED 2D CHARTS
246
new DoubleCollection(new double[4] { 4, 2, 1, 2 }); break; case ErrorLinePatternEnum.None: ErrorLineSeries.Stroke = Brushes.Transparent; break; } } public enum ErrorLinePatternEnum { Solid = 1, Dash = 2, Dot = 3, DashDot = 4, None = 5 } } }
The class is inherited from the DataSeries class. It defines the line style for error bars. This means you can specify the line styles for the original line curve and the error bars independently. This class is very similar to the original DataSeries class for line charts. Note also that the ErrorLineSeries’s PointCollection property holds the data of the error bars. In order to create an error bar chart, you need to provide two independent data sets, one for the original line curve and another for the error bars.
DataCollection for Error Bars Add a new class, DataCollectionErrorbar, to the current project. Here is the code listing for this class:
using System; using System.Windows; using System.Collections.Generic; using System.Windows.Media; using System.Windows.Shapes; namespace Specialized2DCharts { public class DataCollectionErrorbar : DataCollection { private List<DataSeriesErrorbar> errorList; public DataCollectionErrorbar() { errorList = new List<DataSeriesErrorbar>(); } public List<DataSeriesErrorbar> ErrorList { get { return errorList; } set { errorList = value; } } public void AddErrorbars(ChartStyleGridlines csg)

CHAPTER 6 ■ SPECIALIZED 2D CHARTS
247
{ foreach (DataSeriesErrorbar ds in DataList) { double barLength = (csg.NormalizePoint(ds.LineSeries.Points[1]).X - csg.NormalizePoint(ds.LineSeries.Points[0]).X) / 3; for (int i = 0; i < ds.ErrorLineSeries.Points.Count; i++) { Point ep = ds.ErrorLineSeries.Points[i]; Point dp = ds.LineSeries.Points[i]; Point[] pts = new Point[2]; pts[0] = csg.NormalizePoint(new Point(dp.X, dp.Y - ep.Y / 2)); pts[1] = csg.NormalizePoint(new Point(dp.X, dp.Y + ep.Y / 2)); Line line = new Line(); line.Stroke = ds.ErrorLineColor; line.StrokeThickness = ds.ErrorLineThickness; ds.AddErrorLinePattern(); line.X1 = pts[0].X; line.Y1 = pts[0].Y; line.X2 = pts[1].X; line.Y2 = pts[1].Y; csg.ChartCanvas.Children.Add(line); line = new Line(); line.Stroke = ds.ErrorLineColor; line.StrokeThickness = ds.ErrorLineThickness; ds.AddErrorLinePattern(); line.X1 = pts[0].X - barLength / 2; line.Y1 = pts[0].Y; line.X2 = pts[0].X + barLength / 2; line.Y2 = pts[0].Y; csg.ChartCanvas.Children.Add(line); line = new Line(); line.Stroke = ds.ErrorLineColor; line.StrokeThickness = ds.ErrorLineThickness; ds.AddErrorLinePattern(); line.X1 = pts[1].X - barLength / 2; line.Y1 = pts[1].Y; line.X2 = pts[1].X + barLength / 2; line.Y2 = pts[1].Y; csg.ChartCanvas.Children.Add(line); } } } } }
The AddErrorbars method in this class allows you to draw error bars. You must create the original line curve using the AddLines method in the original DataCollection class.

CHAPTER 6 ■ SPECIALIZED 2D CHARTS
248
Creating Error Bar Charts In this section, I’ll show you how to create error bar charts using the DataSeriesErrorbar and DataCollectionErrorbar classes implemented in the previous sections. Add a new WPF Window to the current project and name it ErrorBars. The XAML file for this example is the same as that used in the bar chart example. Here I list only the code-behind file for this example:
using System; using System.Windows; using System.Windows.Media; using System.Windows.Shapes; namespace Specialized2DCharts { public partial class ErrorBars : Window { private ChartStyleGridlines cs; private DataCollectionErrorbar dc; private DataSeriesErrorbar ds; public ErrorBars() { InitializeComponent(); } private void chartGrid_SizeChanged(object sender, SizeChangedEventArgs e) { textCanvas.Width = chartGrid.ActualWidth; textCanvas.Height = chartGrid.ActualHeight; chartCanvas.Children.Clear(); textCanvas.Children.RemoveRange(1, textCanvas.Children.Count - 1); AddChart(); } private void AddChart() { cs = new ChartStyleGridlines(); dc = new DataCollectionErrorbar(); ds = new DataSeriesErrorbar(); cs.ChartCanvas = chartCanvas; cs.TextCanvas = textCanvas; cs.Title = "Error Bar Chart"; cs.Xmin = 0; cs.Xmax = 12; cs.Ymin = -1; cs.Ymax = 6; cs.XTick = 2; cs.YTick = 1; cs.GridlinePattern = ChartStyleGridlines.GridlinePatternEnum.Dot; cs.GridlineColor = Brushes.Black; cs.AddChartStyle(tbTitle, tbXLabel, tbYLabel);

CHAPTER 6 ■ SPECIALIZED 2D CHARTS
249
dc.DataList.Clear(); dc.ErrorList.Clear(); ds = new DataSeriesErrorbar(); ds.LineColor = Brushes.Blue; ds.Symbols.SymbolType = Symbols.SymbolTypeEnum.Circle; ds.Symbols.BorderColor = Brushes.DarkGreen; ds.ErrorLineColor = Brushes.Red; for (int i = 2; i < 22; i++) { ds.LineSeries.Points.Add( new Point(0.5 * i, 10.0 * Math.Exp(-0.5 * i))); ds.ErrorLineSeries.Points.Add(new Point(0.5 * i, 3.0 / (0.5 * i))); } dc.DataList.Add(ds); dc.AddErrorbars(cs); dc.AddLines(cs); } } }
Inside the AddChart method, we assume that the error function is proportional to 1/x. However, you can specify any error function you like, such as the standard deviation.
Run the application by pressing F5. You should obtain the results shown in Figure 6-13. The current program allows you to specify the style of the data line and the error bars separately.
Figure 6-13. Error bar chart
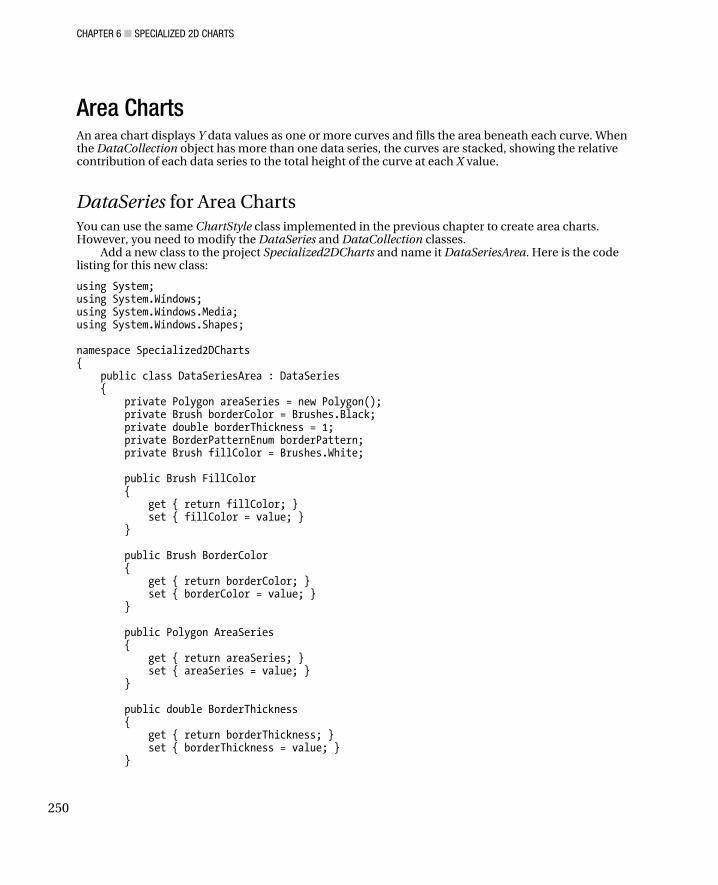
CHAPTER 6 ■ SPECIALIZED 2D CHARTS
250
Area Charts An area chart displays Y data values as one or more curves and fills the area beneath each curve. When the DataCollection object has more than one data series, the curves are stacked, showing the relative contribution of each data series to the total height of the curve at each X value.
DataSeries for Area Charts You can use the same ChartStyle class implemented in the previous chapter to create area charts. However, you need to modify the DataSeries and DataCollection classes.
Add a new class to the project Specialized2DCharts and name it DataSeriesArea. Here is the code listing for this new class:
using System; using System.Windows; using System.Windows.Media; using System.Windows.Shapes; namespace Specialized2DCharts { public class DataSeriesArea : DataSeries { private Polygon areaSeries = new Polygon(); private Brush borderColor = Brushes.Black; private double borderThickness = 1; private BorderPatternEnum borderPattern; private Brush fillColor = Brushes.White; public Brush FillColor { get { return fillColor; } set { fillColor = value; } } public Brush BorderColor { get { return borderColor; } set { borderColor = value; } } public Polygon AreaSeries { get { return areaSeries; } set { areaSeries = value; } } public double BorderThickness { get { return borderThickness; } set { borderThickness = value; } }

CHAPTER 6 ■ SPECIALIZED 2D CHARTS
251
public BorderPatternEnum BorderPattern { get { return borderPattern; } set { borderPattern = value; } } public void AddBorderPattern() { AreaSeries.Stroke = BorderColor; AreaSeries.StrokeThickness = BorderThickness; AreaSeries.Fill = FillColor; switch (BorderPattern) { case BorderPatternEnum.Dash: AreaSeries.StrokeDashArray = new DoubleCollection(new double[2] { 4, 3 }); break; case BorderPatternEnum.Dot: AreaSeries.StrokeDashArray = new DoubleCollection(new double[2] { 1, 2 }); break; case BorderPatternEnum.DashDot: AreaSeries.StrokeDashArray = new DoubleCollection(new double[4] { 4, 2, 1, 2 }); break; case BorderPatternEnum.None: AreaSeries.Stroke = Brushes.Transparent; break; } } public enum BorderPatternEnum { Solid = 1, Dash = 2, Dot = 3, DashDot = 4, None = 5 } } }
This class is inherited from the DataSeries class. It defines the style for area charts, including the Border style and the Fill property.
DataCollection for Area Charts Add a new class, DataCollectionArea, to the current project. Here is the code listing for this class:
using System; using System.Windows; using System.Collections.Generic;

CHAPTER 6 ■ SPECIALIZED 2D CHARTS
252
using System.Windows.Media; using System.Windows.Shapes; namespace Specialized2DCharts { class DataCollectionArea : DataCollection { private double areaAxis = 0; private List<DataSeriesArea> areaList; public DataCollectionArea() { areaList = new List<DataSeriesArea>(); } public List<DataSeriesArea> AreaList { get { return areaList; } set { areaList = value; } } public double AreaAxis { get { return areaAxis; } set { areaAxis = value; } } public void AddAreas(ChartStyleGridlines csg) { int nSeries = AreaList.Count; int nPoints = AreaList[0].AreaSeries.Points.Count; double[] ySum = new double[nPoints]; Point[] pts = new Point[2 * nPoints]; Point[] pt0 = new Point[nPoints]; Point[] pt1 = new Point[nPoints]; for (int i = 0; i < nPoints; i++) ySum[i] = AreaAxis; foreach (DataSeriesArea area in AreaList) { area.AddBorderPattern(); for (int i = 0; i < nPoints; i++) { pt0[i] = new Point(area.AreaSeries.Points[i].X, ySum[i]); ySum[i] += area.AreaSeries.Points[i].Y; pt1[i] = new Point(area.AreaSeries.Points[i].X, ySum[i]); pts[i] = csg.NormalizePoint(pt0[i]); pts[2 * nPoints - 1 - i] = csg.NormalizePoint(pt1[i]); } area.AreaSeries.Points.Clear(); for (int i = 0; i < pts.GetLength(0); i++) area.AreaSeries.Points.Add(pts[i]);
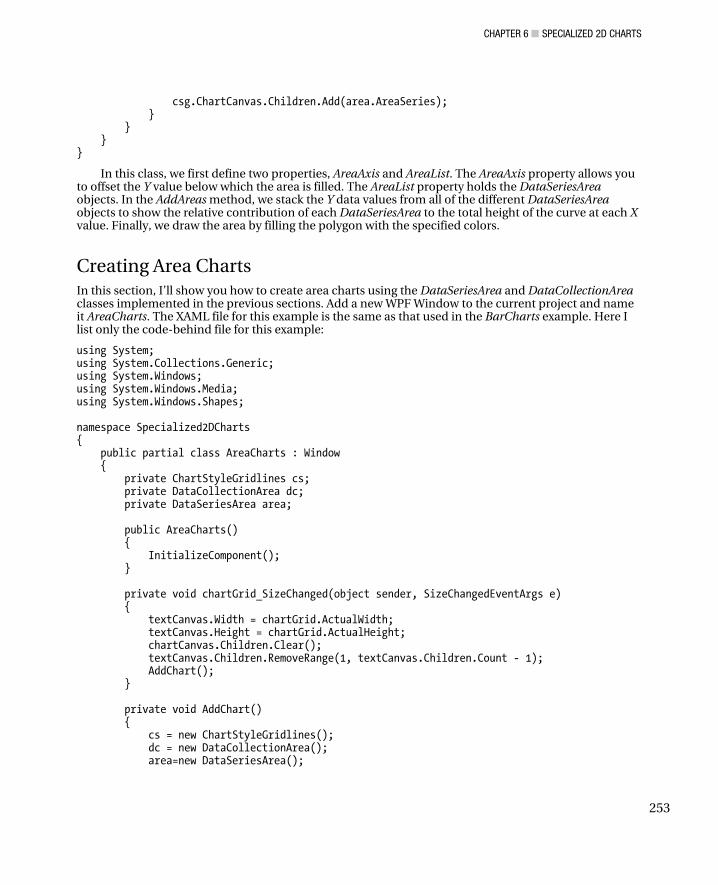
CHAPTER 6 ■ SPECIALIZED 2D CHARTS
253
csg.ChartCanvas.Children.Add(area.AreaSeries); } } } }
In this class, we first define two properties, AreaAxis and AreaList. The AreaAxis property allows you to offset the Y value below which the area is filled. The AreaList property holds the DataSeriesArea objects. In the AddAreas method, we stack the Y data values from all of the different DataSeriesArea objects to show the relative contribution of each DataSeriesArea to the total height of the curve at each X value. Finally, we draw the area by filling the polygon with the specified colors.
Creating Area Charts In this section, I’ll show you how to create area charts using the DataSeriesArea and DataCollectionArea classes implemented in the previous sections. Add a new WPF Window to the current project and name it AreaCharts. The XAML file for this example is the same as that used in the BarCharts example. Here I list only the code-behind file for this example:
using System; using System.Collections.Generic; using System.Windows; using System.Windows.Media; using System.Windows.Shapes; namespace Specialized2DCharts { public partial class AreaCharts : Window { private ChartStyleGridlines cs; private DataCollectionArea dc; private DataSeriesArea area; public AreaCharts() { InitializeComponent(); } private void chartGrid_SizeChanged(object sender, SizeChangedEventArgs e) { textCanvas.Width = chartGrid.ActualWidth; textCanvas.Height = chartGrid.ActualHeight; chartCanvas.Children.Clear(); textCanvas.Children.RemoveRange(1, textCanvas.Children.Count - 1); AddChart(); } private void AddChart() { cs = new ChartStyleGridlines(); dc = new DataCollectionArea(); area=new DataSeriesArea();

CHAPTER 6 ■ SPECIALIZED 2D CHARTS
254
cs.ChartCanvas = chartCanvas; cs.TextCanvas = textCanvas; cs.Title = "Area Chart"; cs.Xmin = 0; cs.Xmax = 10; cs.Ymin = 0; cs.Ymax = 10; cs.XTick = 2; cs.YTick = 2; cs.GridlinePattern = ChartStyleGridlines.GridlinePatternEnum.Dot; cs.GridlineColor = Brushes.Black; cs.AddChartStyle(tbTitle, tbXLabel, tbYLabel); dc.AreaList.Clear(); // Add sine data: area = new DataSeriesArea(); area.BorderColor = Brushes.Black; area.FillColor = Brushes.LightPink; for (int i = 0; i < 41; i++) { area.AreaSeries.Points.Add( new Point(0.25 * i, 2.0 + Math.Sin(0.25 * i))); } dc.AreaList.Add(area); // Add cosine data: area = new DataSeriesArea(); area.BorderColor = Brushes.Black; area.FillColor = Brushes.LightBlue; for (int i = 0; i < 41; i++) { area.AreaSeries.Points.Add( new Point(0.25 * i, 2.0 + Math.Cos(0.25 * i))); } dc.AreaList.Add(area); // Add another sine data: area = new DataSeriesArea(); area.BorderColor = Brushes.Black; area.FillColor = Brushes.LightGreen; for (int i = 0; i < 41; i++) { area.AreaSeries.Points.Add( new Point(0.25 * i, 3.0 + Math.Sin(0.25 * i))); } dc.AreaList.Add(area); dc.AddAreas(cs); } } }
Within the AddChart method, we add three sets of DataSeriesArea objects to the project. Running this application produces the result shown in Figure 6-14.

CHAPTER 6 ■ SPECIALIZED 2D CHARTS
255
Figure 6-14. Area chart
Polar Charts So far we have discussed various chart applications that make use of the Cartesian coordinate system. Now we’ll plot data in polar coordinates (r, theta). Most polar charts, including commercial software packages, plot only positive r values; i.e., they plot absolute r values whether r is positive or negative. Here I’ll show you how to create more generalized polar charts in WPF, in which r can have negative values. These polar charts will also allow you to specify the r range [rMin, rMax] and to draw multiple curves on a single polar chart.
Chart Style for Polar Charts Unlike the charts created previously, where we used the original chart style class for line charts, we need to implement a new chart style class for polar charts. Add a new class to the current project and name it ChartStylePolar. Here is its code listing:
using System; using System.Windows.Controls; using System.Windows; using System.Windows.Media; using System.Windows.Shapes;

CHAPTER 6 ■ SPECIALIZED 2D CHARTS
256
namespace Specialized2DCharts { public class ChartStylePolar { private double angleStep = 30; private AngleDirectionEnum angleDirection = AngleDirectionEnum.CounterClockWise; private double rmin = 0; private double rmax = 1; private int nTicks = 4; private Brush lineColor = Brushes.Black; private double lineThickness = 1; private LinePatternEnum linePattern = LinePatternEnum.Dash; public Canvas ChartCanvas { get; set; } public LinePatternEnum LinePattern { get { return linePattern; } set { linePattern = value; } } public double LineThickness { get { return lineThickness; } set { lineThickness = value; } } public Brush LineColor { get { return lineColor; } set { lineColor = value; } } public int NTicks { get { return nTicks; } set { nTicks = value; } } public double Rmax { get { return rmax; } set { rmax = value; } } public double Rmin { get { return rmin; } set { rmin = value; } } public AngleDirectionEnum AngleDirection

CHAPTER 6 ■ SPECIALIZED 2D CHARTS
257
{ get { return angleDirection; } set { angleDirection = value; } } public double AngleStep { get { return angleStep; } set { angleStep = value; } } public enum AngleDirectionEnum { CounterClockWise = 0, ClockWise = 1 } public DoubleCollection SetLinePattern() { DoubleCollection collection = new DoubleCollection(); switch (LinePattern) { case LinePatternEnum.Dash: collection = new DoubleCollection(new double[2] { 4, 3 }); break; case LinePatternEnum.Dot: collection = new DoubleCollection(new double[2] { 1, 2 }); break; case LinePatternEnum.DashDot: collection = new DoubleCollection(new double[4] { 4, 2, 1, 2 }); break; } return collection; } public double RNormalize(double r) { double result = new double(); if (r < Rmin || r > Rmax) result = double.NaN; double width = Math.Min(ChartCanvas.Width, ChartCanvas.Height); result = (r - Rmin) * width / 2 / (Rmax - Rmin); return result; } public enum LinePatternEnum { Solid = 1, Dash = 2, Dot = 3, DashDot = 4 }

CHAPTER 6 ■ SPECIALIZED 2D CHARTS
258
public void SetPolarAxes() { double xc = ChartCanvas.Width / 2; double yc = ChartCanvas.Height / 2; // Draw circles: double dr = RNormalize(Rmax / NTicks) - RNormalize(Rmin / NTicks); for (int i = 0; i < NTicks; i++) { Ellipse circle = CircleLine(); Canvas.SetLeft(circle, xc - (i + 1) * dr); Canvas.SetTop(circle, yc - (i + 1) * dr); circle.Width = 2.0 * (i + 1) * dr; circle.Height = 2.0 * (i + 1) * dr; ChartCanvas.Children.Add(circle); } //Draw radius lines: for (int i = 0; i < (int)360 / AngleStep; i++) { Line line = RadiusLine(); line.X1 = RNormalize(Rmax) * Math.Cos(i * AngleStep * Math.PI / 180) + xc; line.Y1 = RNormalize(Rmax) * Math.Sin(i * AngleStep * Math.PI / 180) + yc; line.X2 = xc; line.Y2 = yc; ChartCanvas.Children.Add(line); } // Add radius labels: for (int i = 1; i <= NTicks; i++) { double rlabel = Rmin + i * (Rmax - Rmin) / NTicks; TextBlock tb = new TextBlock(); tb.Text = rlabel.ToString(); Canvas.SetLeft(tb, xc + 3); Canvas.SetTop(tb, yc - i * dr + 2); ChartCanvas.Children.Add(tb); } // Add angle Labels: double anglelabel = 0; for (int i = 0; i < (int)360 / AngleStep; i++) { if (AngleDirection == AngleDirectionEnum.ClockWise) anglelabel = i * AngleStep; else if (AngleDirection == AngleDirectionEnum.CounterClockWise) { anglelabel = 360 - i * AngleStep; if (i == 0) anglelabel = 0; }

CHAPTER 6 ■ SPECIALIZED 2D CHARTS
259
TextBlock tb = new TextBlock(); tb.Text = anglelabel.ToString(); tb.TextAlignment = TextAlignment.Center; tb.Measure(new Size(Double.PositiveInfinity, Double.PositiveInfinity)); Size size = tb.DesiredSize; double x = (RNormalize(Rmax) + 1.5 * size.Width / 2) * Math.Cos(i * AngleStep * Math.PI / 180) + xc; double y = (RNormalize(Rmax) + 1.5 * size.Width / 2) * Math.Sin(i * AngleStep * Math.PI / 180) + yc; Canvas.SetLeft(tb, x - size.Width / 2); Canvas.SetTop(tb, y - 1.2 * size.Height / 2); ChartCanvas.Children.Add(tb); } } private Ellipse CircleLine() { Ellipse ellipse = new Ellipse(); ellipse.Stroke = LineColor; ellipse.StrokeThickness = LineThickness; ellipse.StrokeDashArray = SetLinePattern(); ellipse.Fill = Brushes.Transparent; return ellipse; } private Line RadiusLine() { Line line = new Line(); line.Stroke = LineColor; line.StrokeThickness = LineThickness; line.StrokeDashArray = SetLinePattern(); return line; } } }
In this class, the AngleStep property controls the number of r gridlines, and the AngleDirection property allows you to draw the polar chart in a counterclockwise (default) or clockwise manner. The other field members and their corresponding properties allow you to specify the r range and the gridline color, dash style, thickness, etc. In particular, you can specify the line styles of the r and theta gridlines separately to achieve a better visual effect.
The SetPolarAxes method in this class draws the r and theta gridlines as well as the r and theta labels. Pay special attention to the RNormalize method, which transforms the r value in the world coordinate system to an r value in the device coordinate system. A point in the polar coordinate system is represented by Point(r, theta). The theta has the same unit, degrees, in both the world and device coordinate systems, so we need to perform the transformation on r only.
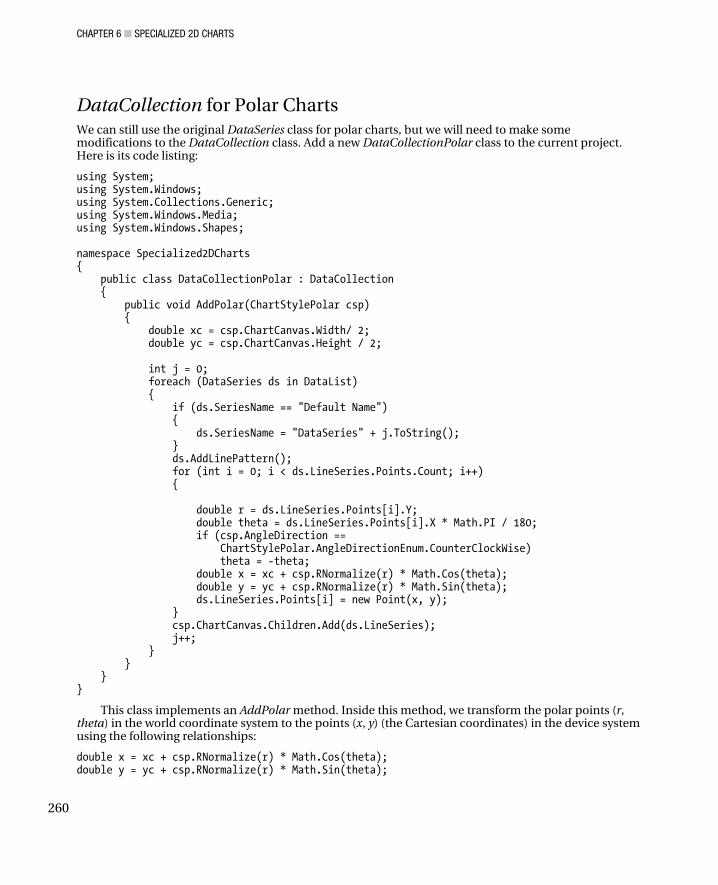
CHAPTER 6 ■ SPECIALIZED 2D CHARTS
260
DataCollection for Polar Charts We can still use the original DataSeries class for polar charts, but we will need to make some modifications to the DataCollection class. Add a new DataCollectionPolar class to the current project. Here is its code listing:
using System; using System.Windows; using System.Collections.Generic; using System.Windows.Media; using System.Windows.Shapes; namespace Specialized2DCharts { public class DataCollectionPolar : DataCollection { public void AddPolar(ChartStylePolar csp) { double xc = csp.ChartCanvas.Width/ 2; double yc = csp.ChartCanvas.Height / 2; int j = 0; foreach (DataSeries ds in DataList) { if (ds.SeriesName == "Default Name") { ds.SeriesName = "DataSeries" + j.ToString(); } ds.AddLinePattern(); for (int i = 0; i < ds.LineSeries.Points.Count; i++) { double r = ds.LineSeries.Points[i].Y; double theta = ds.LineSeries.Points[i].X * Math.PI / 180; if (csp.AngleDirection == ChartStylePolar.AngleDirectionEnum.CounterClockWise) theta = -theta; double x = xc + csp.RNormalize(r) * Math.Cos(theta); double y = yc + csp.RNormalize(r) * Math.Sin(theta); ds.LineSeries.Points[i] = new Point(x, y); } csp.ChartCanvas.Children.Add(ds.LineSeries); j++; } } } }
This class implements an AddPolar method. Inside this method, we transform the polar points (r, theta) in the world coordinate system to the points (x, y) (the Cartesian coordinates) in the device system using the following relationships:
double x = xc + csp.RNormalize(r) * Math.Cos(theta); double y = yc + csp.RNormalize(r) * Math.Sin(theta);

CHAPTER 6 ■ SPECIALIZED 2D CHARTS
261
These equations indicate that the origin is located at (xc, yc) and that the RNormalize method transforms the polar points (r, theta) from the world to the device coordinate system. In this method, the polar chart direction is controlled by setting the angle variable theta to be positive (clockwise) or negative (counterclockwise).
Creating Polar Charts In this section, I’ll show you how to create polar charts using the ChartStylePolar and DataCollectionPolar classes implemented in the previous sections. Add a new WPF Window to the current project and name it PolarCharts. Here is the XAML file for this example:
<Window x:Class="Specialized2DCharts.PolarCharts" xmlns="http://schemas.microsoft.com/winfx/2006/xaml/presentation" xmlns:x="http://schemas.microsoft.com/winfx/2006/xaml" Title="Polar Charts" Height="330" Width="350"> <Grid Name="grid1" Margin="10"> <Grid.ColumnDefinitions> <ColumnDefinition Width="30"/> <ColumnDefinition Width="*"/> <ColumnDefinition Width="30"/> </Grid.ColumnDefinitions> <Grid.RowDefinitions> <RowDefinition Height="30"/> <RowDefinition Height="*"/> <RowDefinition Height="30"/> </Grid.RowDefinitions> <Grid Margin="0" x:Name ="chartGrid" Grid.Column="1" Grid.Row="1" ClipToBounds="False" Background="Transparent" SizeChanged="chartGrid_SizeChanged" /> <Canvas Margin="2" Name="chartCanvas" ClipToBounds="False" Grid.Column="1" Grid.Row="1"/> </Grid> </Window>
This XAML creates a resizable canvas. Here is the corresponding code-behind file for this example:
using System; using System.Windows; using System.Windows.Media; using System.Windows.Shapes; namespace Specialized2DCharts { public partial class PolarCharts : Window { private ChartStylePolar cs; private DataCollectionPolar dc; private DataSeries ds; public PolarCharts() { InitializeComponent(); }

CHAPTER 6 ■ SPECIALIZED 2D CHARTS
262
private void chartGrid_SizeChanged(object sender, SizeChangedEventArgs e) { double width = chartGrid.ActualWidth; double height = chartGrid.ActualHeight; double side = width; if (width > height) side = height; chartCanvas.Width = side; chartCanvas.Height = side; chartCanvas.Children.Clear(); AddChart(); } private void AddChart() { cs = new ChartStylePolar(); dc = new DataCollectionPolar(); cs.ChartCanvas = chartCanvas; cs.Rmax = 0.5; cs.Rmin = 0; cs.NTicks = 4; cs.AngleStep = 30; cs.AngleDirection = ChartStylePolar.AngleDirectionEnum.CounterClockWise; cs.LinePattern = ChartStylePolar.LinePatternEnum.Dot; cs.LineColor = Brushes.Black; cs.SetPolarAxes(); dc.DataList.Clear(); ds = new DataSeries(); ds.LineColor = Brushes.Red; for (int i = 0; i < 360; i++) { double theta = 1.0 * i; double r = Math.Abs(Math.Cos(2.0 * theta * Math.PI / 180) * Math.Sin(2.0 * theta * Math.PI / 180)); ds.LineSeries.Points.Add(new Point(theta, r)); } dc.DataList.Add(ds); dc.AddPolar(cs); } } }
This application generates the output shown in Figure 6-15.
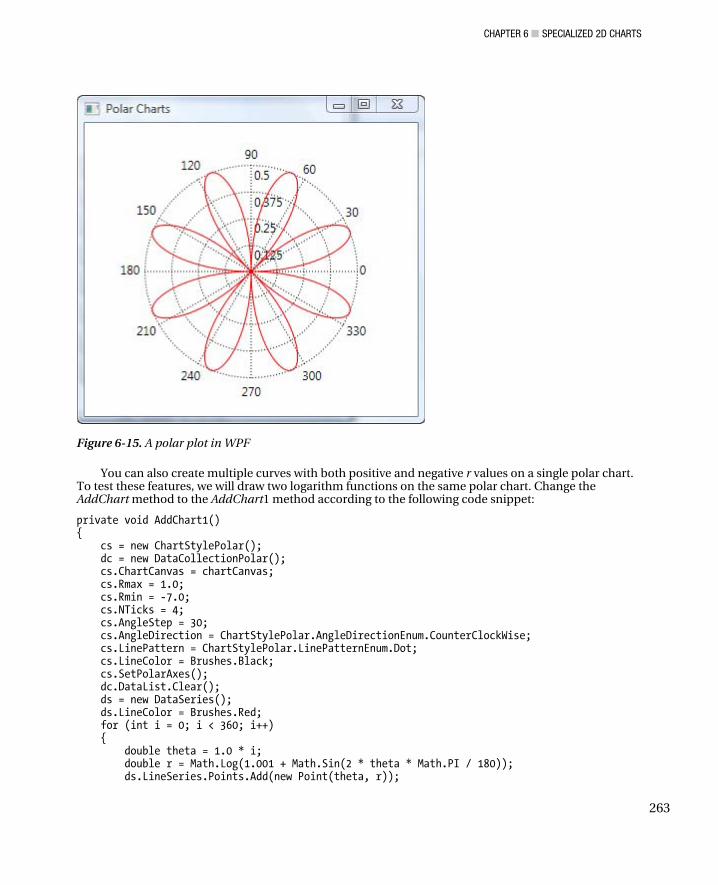
CHAPTER 6 ■ SPECIALIZED 2D CHARTS
263
Figure 6-15. A polar plot in WPF
You can also create multiple curves with both positive and negative r values on a single polar chart. To test these features, we will draw two logarithm functions on the same polar chart. Change the AddChart method to the AddChart1 method according to the following code snippet:
private void AddChart1() { cs = new ChartStylePolar(); dc = new DataCollectionPolar(); cs.ChartCanvas = chartCanvas; cs.Rmax = 1.0; cs.Rmin = -7.0; cs.NTicks = 4; cs.AngleStep = 30; cs.AngleDirection = ChartStylePolar.AngleDirectionEnum.CounterClockWise; cs.LinePattern = ChartStylePolar.LinePatternEnum.Dot; cs.LineColor = Brushes.Black; cs.SetPolarAxes(); dc.DataList.Clear(); ds = new DataSeries(); ds.LineColor = Brushes.Red; for (int i = 0; i < 360; i++) { double theta = 1.0 * i; double r = Math.Log(1.001 + Math.Sin(2 * theta * Math.PI / 180)); ds.LineSeries.Points.Add(new Point(theta, r));

CHAPTER 6 ■ SPECIALIZED 2D CHARTS
264
} dc.DataList.Add(ds); ds = new DataSeries(); ds.LineColor = Brushes.Blue; for (int i = 0; i < 360; i++) { double theta = 1.0 * i; double r = Math.Log(1.001 + Math.Cos(2 * theta * Math.PI / 180)); ds.LineSeries.Points.Add(new Point(theta, r)); } dc.DataList.Add(ds); dc.AddPolar(cs); }
By running this project, you should obtain the results shown in Figure 6-16.
Figure 6-16. A polar plot with negative r value

CHAPTER 6 ■ SPECIALIZED 2D CHARTS
265
Pie Charts Creating a pie chart in WPF is quite simple, since there is an ArcSegment class available. The ArcSegment object is defined by its start and end points; its X and Y radii specified by the Size property; its X-axis rotation factor, a value indicating whether the arc should be greater than 180 degrees; and a value describing the direction in which the arc is drawn. You can use the ArcSegment to build the PathFigure, which in turn you use to build the PathGeometry. Finally, you can create a pie chart using the Path object with a specified Fill property.
Pie Chart Style For a pie chart, we cannot use the ChartStyle or ChartStyleGridlines classes. We’ll have to create a new pie chart style. Add a new class to the current project and name it PieStyle. Here is the code listing for this class:
using System; using System.Windows; using System.Windows.Controls; using System.Windows.Media; using System.Windows.Shapes; using System.Collections.Generic; namespace Specialized2DCharts { public class PieStyle { private List<double> dataList = new List<double>(); private List<string> labelList = new List<string>(); private List<int> explodeList = new List<int>(); private ColormapBrush colormapBrushes = new ColormapBrush(); private Brush borderColor = Brushes.Black; private double borderThickness = 1.0; public List<double> DataList { get { return dataList; } set { dataList = value; } } public List<string> LabelList { get { return labelList; } set { labelList = value; } } public List<int> ExplodeList { get { return explodeList; } set { explodeList = value; } }

CHAPTER 6 ■ SPECIALIZED 2D CHARTS
266
public ColormapBrush ColormapBrushes { get { return colormapBrushes; } set { colormapBrushes = value; } } public Brush BorderColor { get { return borderColor; } set { borderColor = value; } } public double BorderThickness { get { return borderThickness; } set { borderThickness = value; } } public void AddPie(Canvas canvas) { int nData = DataList.Count; colormapBrushes.Ydivisions = nData; if (ExplodeList.Count == 0) { for (int i = 0; i < nData; i++) ExplodeList.Add(0); } double sum = 0.0; for (int i = 0; i < nData; i++) { sum += DataList[i]; } double startAngle = 0; double sweepAngle = 0; for (int i = 0; i < nData; i++) { Brush brush = ColormapBrushes.ColormapBrushes()[i]; int explode = ExplodeList[i]; if (sum < 1) { startAngle += sweepAngle; sweepAngle = 2 * Math.PI * DataList[i]; } else if (sum >= 1) { startAngle += sweepAngle; sweepAngle = 2 * Math.PI * DataList[i] / sum; }
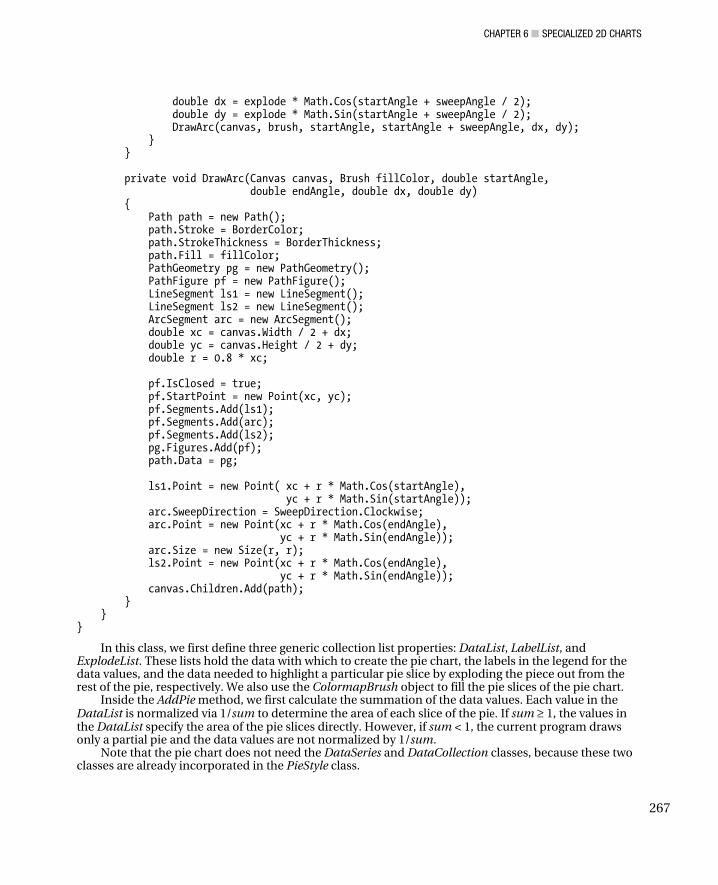
CHAPTER 6 ■ SPECIALIZED 2D CHARTS
267
double dx = explode * Math.Cos(startAngle + sweepAngle / 2); double dy = explode * Math.Sin(startAngle + sweepAngle / 2); DrawArc(canvas, brush, startAngle, startAngle + sweepAngle, dx, dy); } } private void DrawArc(Canvas canvas, Brush fillColor, double startAngle, double endAngle, double dx, double dy) { Path path = new Path(); path.Stroke = BorderColor; path.StrokeThickness = BorderThickness; path.Fill = fillColor; PathGeometry pg = new PathGeometry(); PathFigure pf = new PathFigure(); LineSegment ls1 = new LineSegment(); LineSegment ls2 = new LineSegment(); ArcSegment arc = new ArcSegment(); double xc = canvas.Width / 2 + dx; double yc = canvas.Height / 2 + dy; double r = 0.8 * xc; pf.IsClosed = true; pf.StartPoint = new Point(xc, yc); pf.Segments.Add(ls1); pf.Segments.Add(arc); pf.Segments.Add(ls2); pg.Figures.Add(pf); path.Data = pg; ls1.Point = new Point( xc + r * Math.Cos(startAngle), yc + r * Math.Sin(startAngle)); arc.SweepDirection = SweepDirection.Clockwise; arc.Point = new Point(xc + r * Math.Cos(endAngle), yc + r * Math.Sin(endAngle)); arc.Size = new Size(r, r); ls2.Point = new Point(xc + r * Math.Cos(endAngle), yc + r * Math.Sin(endAngle)); canvas.Children.Add(path); } } }
In this class, we first define three generic collection list properties: DataList, LabelList, and ExplodeList. These lists hold the data with which to create the pie chart, the labels in the legend for the data values, and the data needed to highlight a particular pie slice by exploding the piece out from the rest of the pie, respectively. We also use the ColormapBrush object to fill the pie slices of the pie chart.
Inside the AddPie method, we first calculate the summation of the data values. Each value in the DataList is normalized via 1/sum to determine the area of each slice of the pie. If sum ≥ 1, the values in the DataList specify the area of the pie slices directly. However, if sum < 1, the current program draws only a partial pie and the data values are not normalized by 1/sum.
Note that the pie chart does not need the DataSeries and DataCollection classes, because these two classes are already incorporated in the PieStyle class.

CHAPTER 6 ■ SPECIALIZED 2D CHARTS
268
Legend for Pie Charts The Legend class used in pie charts is slightly different than that used in line charts. For
completeness, I’ll present here the code listing for the modified Legend class. Add a new class to the current project and name it PieLegend. Here is the code for this class:
using System; using System.Windows; using System.Windows.Controls; using System.Windows.Media; using System.Windows.Shapes; using System.Collections.Generic; namespace Specialized2DCharts { public class PieLegend { private bool isLegendVisible = false; public bool IsLegendVisible { get { return isLegendVisible; } set { isLegendVisible = value; } } public void AddLegend(Canvas canvas, PieStyle ps) { TextBlock tb = new TextBlock(); if (ps.DataList.Count < 1 || !IsLegendVisible) return; double legendWidth = 0; Size size = new Size(0, 0); for (int i = 0; i < ps.LabelList.Count; i++) { tb = new TextBlock(); tb.Text = ps.LabelList[i]; tb.Measure(new Size(Double.PositiveInfinity, Double.PositiveInfinity)); size = tb.DesiredSize; if (legendWidth < size.Width) legendWidth = size.Width; } legendWidth += 20; canvas.Width = legendWidth + 5; double legendHeight = 17 * ps.DataList.Count; double sx = 6; double sy = 0; double textHeight = size.Height; double lineLength = 34; Rectangle legendRect = new Rectangle(); legendRect.Stroke = Brushes.Black;

CHAPTER 6 ■ SPECIALIZED 2D CHARTS
269
legendRect.Fill = Brushes.White; legendRect.Width = legendWidth + 18; legendRect.Height = legendHeight; if (IsLegendVisible) canvas.Children.Add(legendRect); Rectangle rect; int n = 1; foreach (double data in ps.DataList) { double xText = 2 * sx + lineLength; double yText = n * sy + (2 * n - 1) * textHeight / 2; rect = new Rectangle(); rect.Stroke = ps.BorderColor; rect.StrokeThickness = ps.BorderThickness; rect.Fill = ps.ColormapBrushes.ColormapBrushes()[n - 1]; rect.Width = 10; rect.Height = 10; Canvas.SetLeft(rect, sx + lineLength / 2 - 15); Canvas.SetTop(rect, yText - 2); canvas.Children.Add(rect); tb = new TextBlock(); tb.Text = ps.LabelList[n - 1]; canvas.Children.Add(tb); Canvas.SetTop(tb, yText - size.Height / 2 + 2); Canvas.SetLeft(tb, xText - 15); n++; } canvas.Width = legendRect.Width; canvas.Height = legendRect.Height; } } }
Here the legend is always located on the right side of the pie chart.
Creating Pie Charts In this section, I’ll show you how to create pie charts using the PieStyle and PieLegend classes implemented in the previous sections. Add a new WPF Window to the current project and name it PieCharts. Here is the XAML file for this example:
<Window x:Class="Specialized2DCharts.PieCharts" xmlns="http://schemas.microsoft.com/winfx/2006/xaml/presentation" xmlns:x="http://schemas.microsoft.com/winfx/2006/xaml" Title="Pie Charts" Height="400" Width="500"> <Grid Name="grid1" Margin="10"> <Grid.ColumnDefinitions> <ColumnDefinition Width="30"/> <ColumnDefinition Width="*"/>

CHAPTER 6 ■ SPECIALIZED 2D CHARTS
270
<ColumnDefinition Width="auto"/> <ColumnDefinition Width="30"/> </Grid.ColumnDefinitions> <Grid.RowDefinitions> <RowDefinition Height="30"/> <RowDefinition Height="*"/> <RowDefinition Height="30"/> </Grid.RowDefinitions> <Grid Margin="0" x:Name ="chartGrid" Grid.Column="1" Grid.Row="1" ClipToBounds="False" Background="Transparent" SizeChanged="chartGrid_SizeChanged" /> <Canvas Margin="2" Name="chartCanvas" ClipToBounds="False" Grid.Column="1" Grid.Row="1"/> <Canvas Margin="2" Name="legendCanvas" Grid.Column="2" Grid.Row="1"/> </Grid> </Window>
Here we create two Canvas elements, the chartCanvas and legendCanvas, which are used to host the pie chart and the legend, respectively. Here is the code-behind file for this example:
using System; using System.Windows; using System.Windows.Media; using System.Windows.Shapes; namespace Specialized2DCharts { public partial class PieCharts : Window { private PieStyle ps; private PieLegend pl; public PieCharts() { InitializeComponent(); } private void chartGrid_SizeChanged(object sender, SizeChangedEventArgs e) { double width = chartGrid.ActualWidth; double height = chartGrid.ActualHeight; double side = width; if (width > height) side = height; chartCanvas.Width = side; chartCanvas.Height = side; chartCanvas.Children.Clear(); legendCanvas.Children.Clear(); AddChart(); } private void AddChart() {

CHAPTER 6 ■ SPECIALIZED 2D CHARTS
271
ps = new PieStyle(); pl = new PieLegend(); double[] data = new double[] { 30, 35, 15, 10, 8 }; string[] labels = new string[] { "Soc. Sec. Tax", "Income Tax", "Borrowing", "Corp. Tax", "Misc." }; for (int i = 0; i < data.Length; i++) { ps.DataList.Add(data[i]); ps.LabelList.Add(labels[i]); } ps.ColormapBrushes.ColormapBrushType = ColormapBrush.ColormapBrushEnum.Summer; ps.AddPie(chartCanvas); pl.IsLegendVisible = true; pl.AddLegend(legendCanvas, ps); } } }
Pay special attention to the AddChart method, which shows you how to add data values to the DataList, how to create labels for each data value, and how to specify the colormap for each pie slice.
Build and run this application by pressing F5. You should obtain the output shown in Figure 6-17.
Figure 6-17. A pie chart of revenue data
The current project also gives you the option of highlighting particular pie slices by exploding the pieces out from the rest of the pie. To do this, you simply need to specify the ExplodeList property. For example, if you want to highlight the pie slices for the Social Security Tax and Corp. Tax data, you can use the following AddChart method:

CHAPTER 6 ■ SPECIALIZED 2D CHARTS
272
private void AddChart() { ps = new PieStyle(); pl = new PieLegend(); double[] data = new double[] { 30, 35, 15, 10, 8 }; int[] explode = new int[] { 20, 0, 0, 20, 0 }; string[] labels = new string[] { "Soc. Sec. Tax", "Income Tax", "Borrowing", "Corp. Tax", "Misc." }; for (int i = 0; i < data.Length; i++) { ps.DataList.Add(data[i]); ps.ExplodeList.Add(explode[i]); ps.LabelList.Add(labels[i]); } ps.ColormapBrushes.ColormapBrushType = ColormapBrush.ColormapBrushEnum.Summer; ps.AddPie(chartCanvas); pl.IsLegendVisible = true; pl.AddLegend(legendCanvas, ps); }
Here we specify that the first and fourth elements in the ExplodeList should be exploded out 20 pixels (the default value is always zero) from the center of the pie chart, since the Social Security Tax and the Corp. Tax are the first and fourth elements in the DataList. This produces the results shown in Figure 6-18.
Figure 6-18. A pie chart with exploded pieces

CHAPTER 6 ■ SPECIALIZED 2D CHARTS
273
Note also that the program draws a partial pie if the summation of the data values is less than 1. To demonstrate this effect, replace the AddChart method with the following code snippet:
private void AddChart() { ps = new PieStyle(); pl = new PieLegend(); double[] data = new double[] { 0.3, 0.1, 0.25 }; string[] labels = new string[] { "0.3 – 30%", "0.1 – 10%", “0.25 – 25%”}; for (int i = 0; i < data.Length; i++) { ps.DataList.Add(data[i]); ps.LabelList.Add(labels[i]); } ps.ColormapBrushes.ColormapBrushType = ColormapBrush.ColormapBrushEnum.Summer; ps.AddPie(chartCanvas); pl.IsLegendVisible = true; pl.AddLegend(legendCanvas, ps); }
You can see that the summation of the data values is 0.65, which is less than 1. This will generate a partial pie chart, as shown in Figure 6-19.
Figure 6-19. A partial pie chart

CHAPTER 6 ■ SPECIALIZED 2D CHARTS
274

C H A P T E R 7
■ ■ ■
275
Stock Charts
Stock charts and technical analysis play an important role in stock market research and analysis. Technical analysis, unlike fundamental analysis, usually ignores the actual nature of the company, market, currency, or commodity. It is based solely on stock charts, namely, the price and volume information. Stock charts usually show high, low, open, close, and volume data of a security. These charts allow you to plot the change of a stock price over time, analyze the history of stock price changes, and predict the future price of a stock based on prior price history.
In this chapter, I’ll show you how to create a variety of stock charts in WPF, including the standard Hi-Lo Open-Close stock charts, Candlestick stock charts, and moving averages. In addition, I’ll also discuss how to embed Yahoo stock charts into your own WPF applications.
Static Stock Charts In this section, we’ll implement various static stock charts.
Text File Reader In order to import stock data (assuming ASCII text file format) into your WPF applications, you need to have a text file reader. Start with a new WPF project and name it StockCharts. Add the DataSeries class from the LineCharts project in Chapter 5 to the current project, and change its namespace to StockCharts. In addition, we need to comment out the code segments related to the Symbols object from this class since we don’t need the Symbols object in the current project. Add a new class named ChartStyle to the project. Most of this class is a copy from both the ChartStyle and ChartStyleGridlines classes in the LineCharts project, by means of a simple cut-and-paste method, except several new methods are added. I’ll not present the complete code listing here, only the new methods added to the class:
public double TimeSpanToDouble(TimeSpan ts) { DateTime dt = DateTime.Parse("1 Jan"); double d1 = BitConverter.ToDouble(BitConverter.GetBytes(dt.Ticks), 0); dt += ts; double d2 = BitConverter.ToDouble(BitConverter.GetBytes(dt.Ticks), 0); return d2 - d1; } public double DateToDouble(string date)
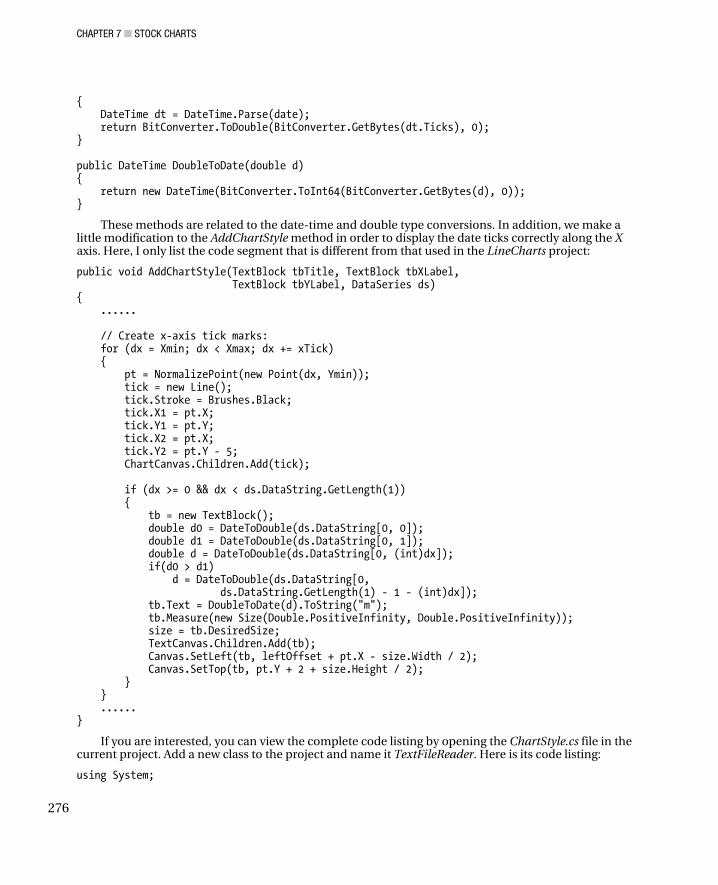
CHAPTER 7 ■ STOCK CHARTS
276
{ DateTime dt = DateTime.Parse(date); return BitConverter.ToDouble(BitConverter.GetBytes(dt.Ticks), 0); } public DateTime DoubleToDate(double d) { return new DateTime(BitConverter.ToInt64(BitConverter.GetBytes(d), 0)); }
These methods are related to the date-time and double type conversions. In addition, we make a little modification to the AddChartStyle method in order to display the date ticks correctly along the X axis. Here, I only list the code segment that is different from that used in the LineCharts project:
public void AddChartStyle(TextBlock tbTitle, TextBlock tbXLabel, TextBlock tbYLabel, DataSeries ds) { ...... // Create x-axis tick marks: for (dx = Xmin; dx < Xmax; dx += xTick) { pt = NormalizePoint(new Point(dx, Ymin)); tick = new Line(); tick.Stroke = Brushes.Black; tick.X1 = pt.X; tick.Y1 = pt.Y; tick.X2 = pt.X; tick.Y2 = pt.Y - 5; ChartCanvas.Children.Add(tick); if (dx >= 0 && dx < ds.DataString.GetLength(1)) { tb = new TextBlock(); double d0 = DateToDouble(ds.DataString[0, 0]); double d1 = DateToDouble(ds.DataString[0, 1]); double d = DateToDouble(ds.DataString[0, (int)dx]); if(d0 > d1) d = DateToDouble(ds.DataString[0, ds.DataString.GetLength(1) - 1 - (int)dx]); tb.Text = DoubleToDate(d).ToString("m"); tb.Measure(new Size(Double.PositiveInfinity, Double.PositiveInfinity)); size = tb.DesiredSize; TextCanvas.Children.Add(tb); Canvas.SetLeft(tb, leftOffset + pt.X - size.Width / 2); Canvas.SetTop(tb, pt.Y + 2 + size.Height / 2); } } ...... }
If you are interested, you can view the complete code listing by opening the ChartStyle.cs file in the current project. Add a new class to the project and name it TextFileReader. Here is its code listing:
using System;

CHAPTER 7 ■ STOCK CHARTS
277
using System.Collections.Generic; using System.Windows; using System.IO; using System.Data; using Microsoft.Win32; namespace StockCharts { public class TextFileReader { public string[,] LoadFile() { OpenFileDialog ofd = new OpenFileDialog(); if (ofd.ShowDialog() == true) { string filePath = ofd.FileName; List<string> sc = new List<string>(); FileStream fs = new FileStream(filePath, FileMode.Open, FileAccess.ReadWrite); StreamReader sr = new StreamReader(fs); // Read file into a string collection: int noBytesRead = 0; string oneLine; while ((oneLine = sr.ReadLine()) != null) { noBytesRead += oneLine.Length; sc.Add(oneLine); } sr.Close(); // Extract the stock data from the file: string[] sa = new string[sc.Count]; sc.CopyTo(sa, 0); char[] splitter = { ' ', ',', ':', '\t' }; string[] sa1 = sa[0].Split(splitter); string[,] result = new string[sa1.Length, sc.Count]; for (int i = 0; i < sc.Count; i++) { sa1 = sa[i].Split(splitter); for (int j = 0; j < sa1.Length; j++) result[j, i] = sa1[j]; } return result; } else return null; } } }

CHAPTER 7 ■ STOCK CHARTS
278
In this class, the public method LoadFile returns a 2D string array. The stock text file should be formatted the same way as shown in Figure 7-1. The figure presents the stock price data for GE from 4-7-2006 to 5-5-2006, which is stored in a tab-delimited text file, GE.txt.
Figure 7-1. GE stock data
In this file, the first column is the date, and the second to fifth columns represent the open, high, low, and close prices of the stock, respectively. Please note that there is no header row in this text file. If you want the stock data file to have a header row or a different format, you must change the TextFileReader class correspondingly to take care of the file format change.
DataSeries and DataCollection for Stock Charts You’ll need to make some modifications to the DataSeries and DataCollection classes. Open the DataSeries.cs file and add the following one-line code snippet:
public string[,] DataString { get; set; }
This public property specifies where to store the stock data. The rest of the code of the DataSeries class remains the same as that used in the LineCharts project.
We’ll need to add a new DataCollection class to the current project. Here is its code listing:
using System; using System.Windows; using System.Collections.Generic; using System.Windows.Media; using System.Windows.Shapes; namespace StockCharts { public class DataCollection
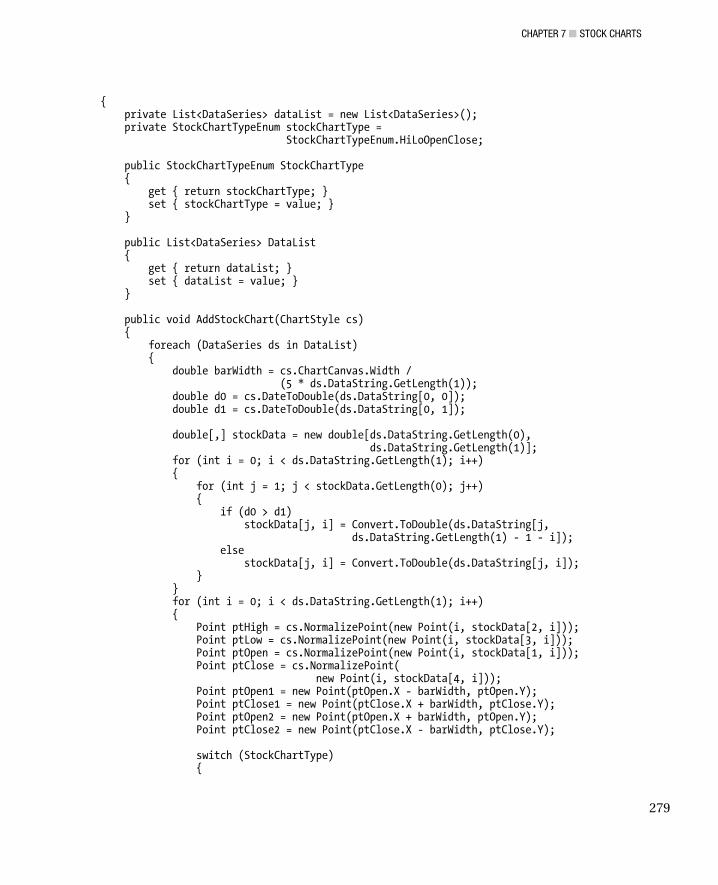
CHAPTER 7 ■ STOCK CHARTS
279
{ private List<DataSeries> dataList = new List<DataSeries>(); private StockChartTypeEnum stockChartType = StockChartTypeEnum.HiLoOpenClose; public StockChartTypeEnum StockChartType { get { return stockChartType; } set { stockChartType = value; } } public List<DataSeries> DataList { get { return dataList; } set { dataList = value; } } public void AddStockChart(ChartStyle cs) { foreach (DataSeries ds in DataList) { double barWidth = cs.ChartCanvas.Width / (5 * ds.DataString.GetLength(1)); double d0 = cs.DateToDouble(ds.DataString[0, 0]); double d1 = cs.DateToDouble(ds.DataString[0, 1]); double[,] stockData = new double[ds.DataString.GetLength(0), ds.DataString.GetLength(1)]; for (int i = 0; i < ds.DataString.GetLength(1); i++) { for (int j = 1; j < stockData.GetLength(0); j++) { if (d0 > d1) stockData[j, i] = Convert.ToDouble(ds.DataString[j, ds.DataString.GetLength(1) - 1 - i]); else stockData[j, i] = Convert.ToDouble(ds.DataString[j, i]); } } for (int i = 0; i < ds.DataString.GetLength(1); i++) { Point ptHigh = cs.NormalizePoint(new Point(i, stockData[2, i])); Point ptLow = cs.NormalizePoint(new Point(i, stockData[3, i])); Point ptOpen = cs.NormalizePoint(new Point(i, stockData[1, i])); Point ptClose = cs.NormalizePoint( new Point(i, stockData[4, i])); Point ptOpen1 = new Point(ptOpen.X - barWidth, ptOpen.Y); Point ptClose1 = new Point(ptClose.X + barWidth, ptClose.Y); Point ptOpen2 = new Point(ptOpen.X + barWidth, ptOpen.Y); Point ptClose2 = new Point(ptClose.X - barWidth, ptClose.Y); switch (StockChartType) {

CHAPTER 7 ■ STOCK CHARTS
280
case StockChartTypeEnum.Line: // Draw Line stock chart: if (i > 0) { Point pt1 = cs.NormalizePoint( new Point(i - 1, stockData[4, i - 1])); Point pt2 = cs.NormalizePoint( new Point(i, stockData[4, i])); DrawLine(cs.ChartCanvas, pt1, pt2, ds.LineColor, ds.LineThickness); } break; // Draw Hi-Lo stock chart: case StockChartTypeEnum.HiLo: DrawLine(cs.ChartCanvas, ptLow, ptHigh, ds.LineColor, ds.LineThickness); break; // Draw Hi-Lo-Open-Close stock chart: case StockChartTypeEnum.HiLoOpenClose: DrawLine(cs.ChartCanvas, ptLow, ptHigh, ds.LineColor, ds.LineThickness); DrawLine(cs.ChartCanvas, ptOpen, ptOpen1, ds.LineColor, ds.LineThickness); DrawLine(cs.ChartCanvas, ptClose, ptClose1, ds.LineColor, ds.LineThickness); break; // Draw candle stock chart: case StockChartTypeEnum.Candle: DrawLine(cs.ChartCanvas, ptLow, ptHigh, ds.LineColor, ds.LineThickness); Polygon plg = new Polygon(); plg.Stroke = ds.LineColor; plg.StrokeThickness = ds.LineThickness; Brush fillColor = ds.FillColor; if (stockData[1, i] < stockData[4, i]) fillColor = Brushes.White; plg.Fill = fillColor; plg.Points.Add(ptOpen1); plg.Points.Add(ptOpen2); plg.Points.Add(ptClose1); plg.Points.Add(ptClose2); cs.ChartCanvas.Children.Add(plg); break; } } } } private void DrawLine(Canvas canvas, Point pt1, Point pt2, Brush lineColor, double lineThickness) { Line line = new Line(); line.Stroke = lineColor; line.StrokeThickness = lineThickness;
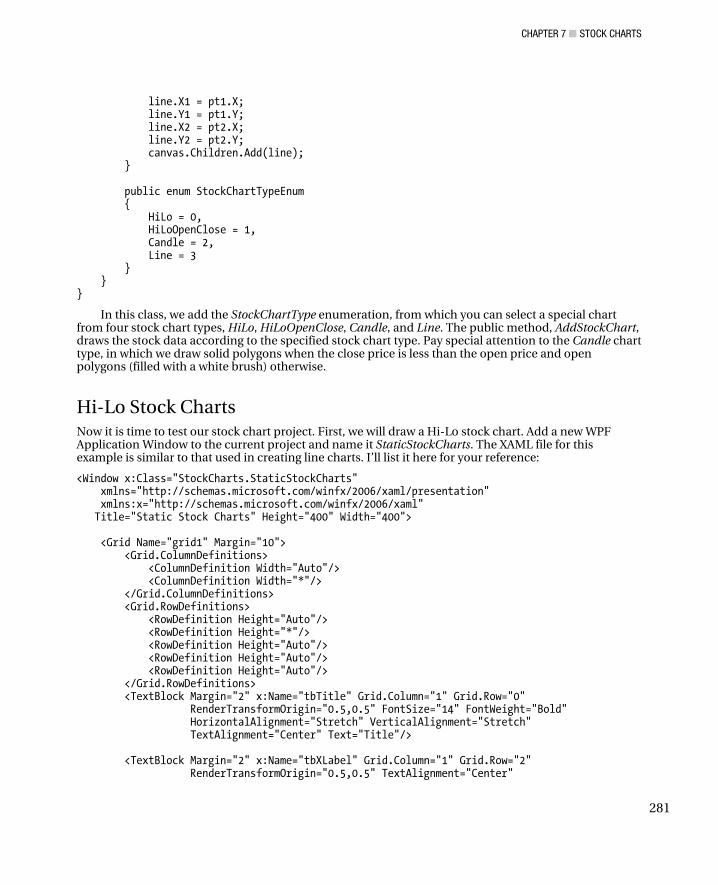
CHAPTER 7 ■ STOCK CHARTS
281
line.X1 = pt1.X; line.Y1 = pt1.Y; line.X2 = pt2.X; line.Y2 = pt2.Y; canvas.Children.Add(line); } public enum StockChartTypeEnum { HiLo = 0, HiLoOpenClose = 1, Candle = 2, Line = 3 } } }
In this class, we add the StockChartType enumeration, from which you can select a special chart from four stock chart types, HiLo, HiLoOpenClose, Candle, and Line. The public method, AddStockChart, draws the stock data according to the specified stock chart type. Pay special attention to the Candle chart type, in which we draw solid polygons when the close price is less than the open price and open polygons (filled with a white brush) otherwise.
Hi-Lo Stock Charts Now it is time to test our stock chart project. First, we will draw a Hi-Lo stock chart. Add a new WPF Application Window to the current project and name it StaticStockCharts. The XAML file for this example is similar to that used in creating line charts. I’ll list it here for your reference:
<Window x:Class="StockCharts.StaticStockCharts" xmlns="http://schemas.microsoft.com/winfx/2006/xaml/presentation" xmlns:x="http://schemas.microsoft.com/winfx/2006/xaml" Title="Static Stock Charts" Height="400" Width="400"> <Grid Name="grid1" Margin="10"> <Grid.ColumnDefinitions> <ColumnDefinition Width="Auto"/> <ColumnDefinition Width="*"/> </Grid.ColumnDefinitions> <Grid.RowDefinitions> <RowDefinition Height="Auto"/> <RowDefinition Height="*"/> <RowDefinition Height="Auto"/> <RowDefinition Height="Auto"/> <RowDefinition Height="Auto"/> </Grid.RowDefinitions> <TextBlock Margin="2" x:Name="tbTitle" Grid.Column="1" Grid.Row="0" RenderTransformOrigin="0.5,0.5" FontSize="14" FontWeight="Bold" HorizontalAlignment="Stretch" VerticalAlignment="Stretch" TextAlignment="Center" Text="Title"/> <TextBlock Margin="2" x:Name="tbXLabel" Grid.Column="1" Grid.Row="2" RenderTransformOrigin="0.5,0.5" TextAlignment="Center"
CHAPTER 7 ■ STOCK CHARTS
282
Text="X Axis"/> <StackPanel Grid.Column="1" Grid.Row="4" Orientation="Horizontal" HorizontalAlignment="Center"> <Button Click="LoadFile_Click" Width="120" Height="25" Content="Load Stock File" Margin="5"/> <Button Click="Close_Click" Width="120" Height="25" Content="Close" Margin="15,5,5,5"/> </StackPanel> <StackPanel Grid.Column="1" Grid.Row="3" Orientation="Horizontal" HorizontalAlignment="Center"> <TextBlock Text="Ymin" Margin="0,5,5,5"/> <TextBox x:Name="txYmin" Text="32" Width="50" TextAlignment="Center" Margin="5"/> <TextBlock Text="Ymax" Margin="10,5,5,5"/> <TextBox x:Name="txYmax" Text="36" Width="50" TextAlignment="Center" Margin="5"/> <TextBlock Text="YTick" Margin="10,5,5,5"/> <TextBox x:Name="txYTick" Text="1" Width="50" TextAlignment="Center" Margin="5"/> </StackPanel> <TextBlock Margin="2" Name="tbYLabel" Grid.Column="0" Grid.Row="1" RenderTransformOrigin="0.5,0.5" TextAlignment="Center" Text="Y Axis"> <TextBlock.LayoutTransform> <RotateTransform Angle="-90"/> </TextBlock.LayoutTransform> </TextBlock> <Grid Margin="0,0,0,0" x:Name ="chartGrid" Grid.Column="1" Grid.Row="1" ClipToBounds="False" Background="Transparent" SizeChanged="chartGrid_SizeChanged" > </Grid> <Canvas Margin="2" Name="textCanvas" Grid.Column="1" Grid.Row="1" ClipToBounds="True"> <Canvas Name="chartCanvas" ClipToBounds="True"/> </Canvas> </Grid> </Window>
In addition to the textCanvas and chartCanvas, we add some text boxes and two button controls. The text boxes allow you to specify the stock variation range. One button loads stock data from an OpenFileDialog; the other closes the application window.
Here is the code-behind file for this example:
using System; using System.IO; using System.Collections.Generic; using System.Windows; using System.Windows.Media; using System.Windows.Shapes; namespace StockCharts {

CHAPTER 7 ■ STOCK CHARTS
283
public partial class StaticStockCharts : Window { private ChartStyle cs; private DataCollection dc; private DataSeries ds; private TextFileReader tfr; public StaticStockCharts() { InitializeComponent(); dc = new DataCollection(); tfr = new TextFileReader(); cs = new ChartStyle(); } private void chartGrid_SizeChanged(object sender, SizeChangedEventArgs e) { textCanvas.Width = chartGrid.ActualWidth; textCanvas.Height = chartGrid.ActualHeight; chartCanvas.Children.Clear(); textCanvas.Children.RemoveRange(1, textCanvas.Children.Count - 1); AddChart(); } private void LoadFile_Click(object sender, RoutedEventArgs e) { dc.DataList.Clear(); ds = new DataSeries(); ds.DataString = tfr.LoadFile(); ds.LineColor = Brushes.DarkBlue; ds.FillColor = Brushes.DarkBlue; dc.DataList.Add(ds); AddChart(); } private void AddChart() { if (dc.DataList.Count > 0) { cs = new ChartStyle(); cs.ChartCanvas = chartCanvas; cs.TextCanvas = textCanvas; cs.Xmin = -1; cs.Xmax = ds.DataString.GetLength(1); cs.XTick = 3; cs.Ymin = double.Parse(txYmin.Text); cs.Ymax = double.Parse(txYmax.Text); cs.YTick = double.Parse(txYTick.Text); cs.Title = "Stock Chart"; cs.AddChartStyle(tbTitle, tbXLabel, tbYLabel, ds); dc.StockChartType = DataCollection.StockChartTypeEnum.HiLo; dc.AddStockChart(cs);

CHAPTER 7 ■ STOCK CHARTS
284
} } private void Close_Click(object sender, RoutedEventArgs e) { this.Close(); } } }
Here, in addition to the standard definitions for a chart application, we add the following line of code:
dc.StockChartType = DataCollection.StockChartTypeEnum.HiLo;
This specifies the stock chart type to be a Hi-Lo plot. Inside the AddChart method, we also create a new instance of the TextFileReader and call its public
method LoadFile to bring up the OpenFileDialog window, which allows you to select the stock data file:
ds.DataString = tfr.LoadFile();
In this example, we add two text files, GE.txt and IBM.txt, to the Application directory for this project. If you stored your stock data file in a different directory, you need to go to that directory to import the stock data.
Running this project by pressing F5 will first bring up the OpenFileDialog window, as shown in Figure 7-2. Select the GE.txt file and click Open. This produces the result shown in Figure 7-3. You can click the Load File button to import the other set of stock data and display it on the chart.
Figure 7-2. OpenFileDialog window used to import the stock data

CHAPTER 7 ■ STOCK CHARTS
285
Figure 7-3. A Hi-Lo stock chart
Hi-Lo Open-Close Stock Charts You can create a Hi-Lo Open-Close stock chart by replacing the StockChartType with the following line of code:
dc.StockChartType = DataCollection.StockChartTypeEnum.HiLoOpenClose;
This generates the output shown in Figure 7-4.

CHAPTER 7 ■ STOCK CHARTS
286
Figure 7-4. A Hi-Lo-Open-Close stock chart
Candlestick Stock Charts You can also obtain a candlestick stock chart by replacing the StockChartType with the following code snippet:
dc.StockChartType = DataCollection.StockChartTypeEnum.Candle;
Running this application produces the result shown in Figure 7-5.

CHAPTER 7 ■ STOCK CHARTS
287
Figure 7-5. A candlestick stock chart
Moving Averages Moving averages are often used in analyzing time series data. They are widely applied in finance, especially in technical analysis. They can also be used as a generic smoothing operation, in which case the data need not be a time series.
A moving-average series can be calculated for any time series. In finance it is most often applied to stock prices, returns, or trading volumes. Moving averages are used to smooth out short-term fluctuations, thus highlighting longer-term trends or cycles. The threshold between short-term and long-term depends on the application, and the parameters of the moving average are set accordingly.
A moving average smooths data by replacing each data point with the average of the neighboring data points defined within the time span. This process is equivalent to low-pass filters used in digital signal processing.
Simple Moving Averages In this section, we first discuss the simple moving average. A simple moving average (SMA) is the mean value of the previous n data points. For example, a 5-day simple moving average of opening price is the mean of the previous 5 days’ opening prices. If those prices are p0, p–1, p-2, p-3, p-4, then the moving average is described by

CHAPTER 7 ■ STOCK CHARTS
288
In general, for an n-day moving average, we have
When calculating successive values, a new value comes into the sum and an old value drops out, meaning a full summation each time is unnecessary:
In technical analysis, there are various common values for n, such as 10 days, 40 days, and 100 days. The period selected depends on the kind of movement you are concentrating on, such as short, intermediate, or long term. In any case, moving-average levels are interpreted as support in a rising market or as resistance in a falling market.
In all cases, a moving average lags behind the latest data point, simply due to the nature of its smoothing. An SMA can lag to an undesirable extent and can be disproportionately influenced by old data points’ dropping out of the average. We can address this issue by giving extra weight to more recent data points, as done in weighted and exponential moving averages, which will be discussed in following sections.
One characteristic of the SMA is that if the data have a periodic fluctuation, then applying an SMA over that period will eliminate that variation.
Implementation Using the algorithm developed in the previous section, we can implement a simple moving average in WPF. First, we need to modify the DataSeries class. Add a new class to the current project and name it DataSeriesMA. Here is the code for this class:
using System; using System.Windows; using System.Windows.Media; using System.Windows.Shapes; namespace StockCharts { public class DataSeriesMA : DataSeries { private int nDays = 5; public int NDays { get { return nDays; } set { nDays = value; } } // Simple Moving Average: private Polyline smaLineSeries = new Polyline(); private Brush smaLineColor = Brushes.Black;
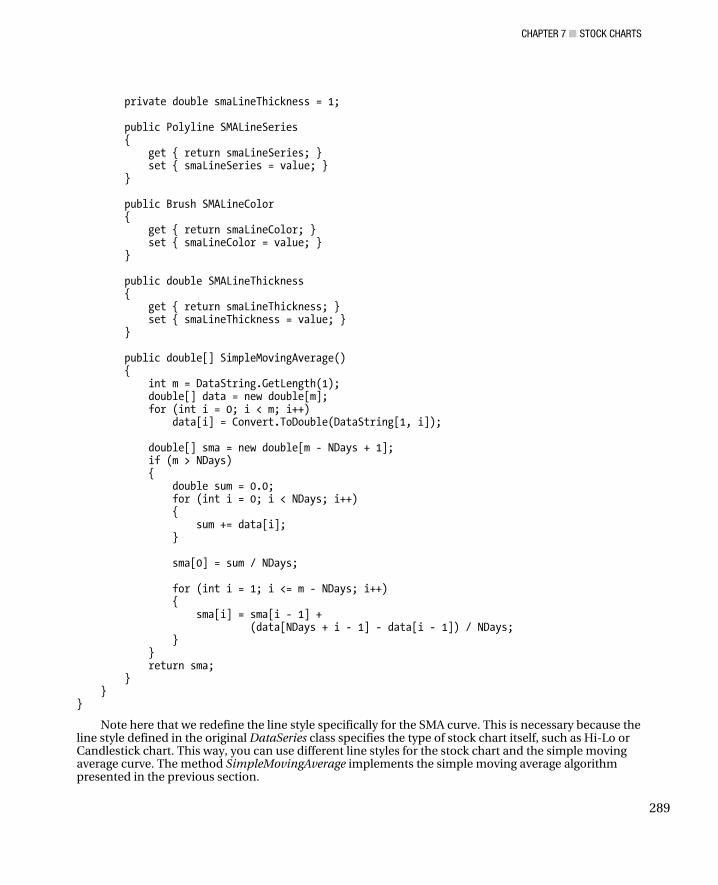
CHAPTER 7 ■ STOCK CHARTS
289
private double smaLineThickness = 1; public Polyline SMALineSeries { get { return smaLineSeries; } set { smaLineSeries = value; } } public Brush SMALineColor { get { return smaLineColor; } set { smaLineColor = value; } } public double SMALineThickness { get { return smaLineThickness; } set { smaLineThickness = value; } } public double[] SimpleMovingAverage() { int m = DataString.GetLength(1); double[] data = new double[m]; for (int i = 0; i < m; i++) data[i] = Convert.ToDouble(DataString[1, i]); double[] sma = new double[m - NDays + 1]; if (m > NDays) { double sum = 0.0; for (int i = 0; i < NDays; i++) { sum += data[i]; } sma[0] = sum / NDays; for (int i = 1; i <= m - NDays; i++) { sma[i] = sma[i - 1] + (data[NDays + i - 1] - data[i - 1]) / NDays; } } return sma; } } }
Note here that we redefine the line style specifically for the SMA curve. This is necessary because the line style defined in the original DataSeries class specifies the type of stock chart itself, such as Hi-Lo or Candlestick chart. This way, you can use different line styles for the stock chart and the simple moving average curve. The method SimpleMovingAverage implements the simple moving average algorithm presented in the previous section.

CHAPTER 7 ■ STOCK CHARTS
290
You’ll also need to modify the DataCollection class. Add a new class to the current project and name it DataCollectionMA. Here is its code listing:
using System; using System.Windows; using System.Collections.Generic; using System.Windows.Controls; using System.Windows.Media; using System.Windows.Shapes; namespace StockCharts { public class DataCollectionMA : DataCollection { public void AddSimpleMovingAverage(ChartStyle cs) { foreach (DataSeriesMA ds in DataList) { ds.SMALineSeries.Stroke = ds.SMALineColor; ds.SMALineSeries.StrokeThickness = ds.SMALineThickness; double[] data = ds.SimpleMovingAverage(); ds.SMALineSeries.Points.Clear(); for (int i = 0; i < data.Length; i++) { ds.SMALineSeries.Points.Add(cs.NormalizePoint( new Point(i + ds.NDays - 1, data[i]))); } cs.ChartCanvas.Children.Add(ds.SMALineSeries); } } } }
This class contains only one method, AddSimpleMovingAverage, which is used to create the SMA curve.
Creating SMA Curves Here, we’ll examine the simple moving average algorithm implemented in the previous section. Add a new WPF Window to the current project and name it MovingAverage. The XAML file is the same as that used in the previous example. Here is the C# code-behind file for this example:
using System; using System.IO; using System.Windows; using System.Windows.Media; namespace StockCharts { public partial class MovingAverage : Window { private ChartStyle cs; private DataCollectionMA dc;
CHAPTER 7 ■ STOCK CHARTS
291
private DataSeriesMA ds; private TextFileReader tfr; public MovingAverage() { InitializeComponent(); dc = new DataCollectionMA(); tfr = new TextFileReader(); cs = new ChartStyle(); } private void chartGrid_SizeChanged(object sender, SizeChangedEventArgs e) { textCanvas.Width = chartGrid.ActualWidth; textCanvas.Height = chartGrid.ActualHeight; chartCanvas.Children.Clear(); textCanvas.Children.RemoveRange(1, textCanvas.Children.Count - 1); AddChart(); } private void LoadFile_Click(object sender, RoutedEventArgs e) { dc.DataList.Clear(); ds = new DataSeriesMA(); ds.DataString = tfr.LoadFile(); ds.NDays = 5; ds.LineColor = Brushes.Black; ds.SMALineColor = Brushes.Red; dc.DataList.Add(ds); AddChart(); } private void AddChart() { if (dc.DataList.Count > 0) { cs = new ChartStyle(); cs.ChartCanvas = chartCanvas; cs.TextCanvas = textCanvas; cs.Xmin = -1; cs.Xmax = ds.DataString.GetLength(1); cs.XTick = 3; cs.Ymin = double.Parse(txYmin.Text); cs.Ymax = double.Parse(txYmax.Text); cs.YTick = double.Parse(txYTick.Text); cs.Title = "Stock Chart"; cs.AddChartStyle(tbTitle, tbXLabel, tbYLabel, ds); dc.StockChartType = DataCollection.StockChartTypeEnum.Candle; dc.AddStockChart(cs); dc.AddSimpleMovingAverage(cs); dc.AddWeightedMovingAverage(cs); dc.AddExponentialMovingAverage(cs); }

CHAPTER 7 ■ STOCK CHARTS
292
} private void Close_Click(object sender, RoutedEventArgs e) { this.Close(); } } }
You can see that you can specify the line styles for the stock chart (Candlestick in this case) and the SMA curve independently, from the following code snippet:
ds.LineColor = Brushes.Black; ds.SMALineColor = Brushes.Red;
The rest of the code is standard for any chart application. Running this example will create the output shown in Figure 7-6, where the IBM stock data are displayed. Note that there is no simple moving average data for the first four days, since there are not enough data to make the calculations until the fifth day.
Figure 7-6. A stock chart with five-day simple moving average
CHAPTER 7 ■ STOCK CHARTS
293
For comparison, we plot both the stock data and the five-day simple moving average in Figure 7-6. In practice, longer time periods are typically used for simple moving averages.
Weighted Moving Averages A weighted average is any average that has multiplying factors to give different weights to different data points. In technical analysis, a weighted moving average (WMA) specifically means weights that decrease arithmetically. In an n-day WMA, the latest day has weight n, the second latest n − 1, etc., down to zero:
Note, when calculating the WMA across successive values, that the difference between the
numerators of WMA+1 and WMA is If we denote ,
then we have
Implementation Using the algorithm developed in the previous section, we can implement the weighted moving average in WPF. First, add the following code to the DataSeriesMA class:
// Weighted Moving Average: private Polyline wmaLineSeries = new Polyline(); private Brush wmaLineColor = Brushes.Black; private double wmaLineThickness = 1; public Polyline WMALineSeries { get { return wmaLineSeries; } set { wmaLineSeries = value; } } public Brush WMALineColor { get { return wmaLineColor; } set { wmaLineColor = value; } } public double WMALineThickness { get { return wmaLineThickness; } set { wmaLineThickness = value; }
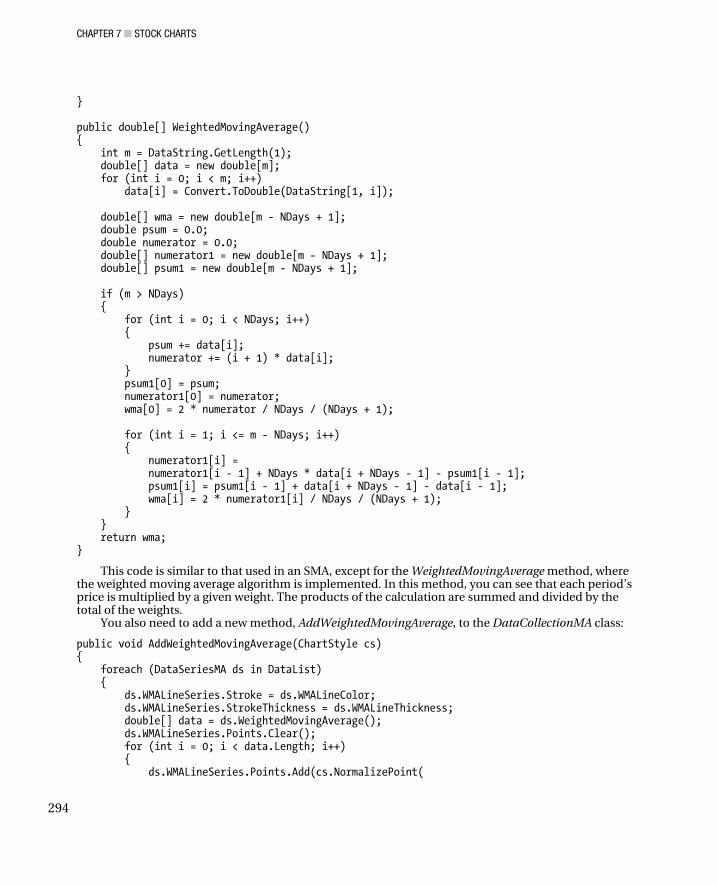
CHAPTER 7 ■ STOCK CHARTS
294
} public double[] WeightedMovingAverage() { int m = DataString.GetLength(1); double[] data = new double[m]; for (int i = 0; i < m; i++) data[i] = Convert.ToDouble(DataString[1, i]); double[] wma = new double[m - NDays + 1]; double psum = 0.0; double numerator = 0.0; double[] numerator1 = new double[m - NDays + 1]; double[] psum1 = new double[m - NDays + 1]; if (m > NDays) { for (int i = 0; i < NDays; i++) { psum += data[i]; numerator += (i + 1) * data[i]; } psum1[0] = psum; numerator1[0] = numerator; wma[0] = 2 * numerator / NDays / (NDays + 1); for (int i = 1; i <= m - NDays; i++) { numerator1[i] = numerator1[i - 1] + NDays * data[i + NDays - 1] - psum1[i - 1]; psum1[i] = psum1[i - 1] + data[i + NDays - 1] - data[i - 1]; wma[i] = 2 * numerator1[i] / NDays / (NDays + 1); } } return wma; }
This code is similar to that used in an SMA, except for the WeightedMovingAverage method, where the weighted moving average algorithm is implemented. In this method, you can see that each period’s price is multiplied by a given weight. The products of the calculation are summed and divided by the total of the weights.
You also need to add a new method, AddWeightedMovingAverage, to the DataCollectionMA class:
public void AddWeightedMovingAverage(ChartStyle cs) { foreach (DataSeriesMA ds in DataList) { ds.WMALineSeries.Stroke = ds.WMALineColor; ds.WMALineSeries.StrokeThickness = ds.WMALineThickness; double[] data = ds.WeightedMovingAverage(); ds.WMALineSeries.Points.Clear(); for (int i = 0; i < data.Length; i++) { ds.WMALineSeries.Points.Add(cs.NormalizePoint(

CHAPTER 7 ■ STOCK CHARTS
295
new Point(i + ds.NDays - 1, data[i]))); } cs.ChartCanvas.Children.Add(ds.WMALineSeries); } }
Creating WMA Curves Creating a weighted moving average curve is very simple. Open the MovingAverage.xaml.cs file and add the following bolded code snippet to the LoadFile_Click and AddChart method:
private void LoadFile_Click(object sender, RoutedEventArgs e) { dc.DataList.Clear(); ds = new DataSeriesMA(); ds.DataString = tfr.LoadFile(); ds.NDays = 5; ds.LineColor = Brushes.Black; ds.SMALineColor = Brushes.Red; ds.WMALineColor = Brushes.DarkGreen; dc.DataList.Add(ds); AddChart(); } private void AddChart() { if (dc.DataList.Count > 0) { cs = new ChartStyle(); cs.ChartCanvas = chartCanvas; cs.TextCanvas = textCanvas; cs.Xmin = -1; cs.Xmax = ds.DataString.GetLength(1); cs.XTick = 3; cs.Ymin = double.Parse(txYmin.Text); cs.Ymax = double.Parse(txYmax.Text); cs.YTick = double.Parse(txYTick.Text); cs.Title = "Stock Chart"; cs.AddChartStyle(tbTitle, tbXLabel, tbYLabel, ds); dc.StockChartType = DataCollection.StockChartTypeEnum.Candle; dc.AddStockChart(cs); dc.AddSimpleMovingAverage(cs); dc.AddWeightedMovingAverage(cs); } }
Running this application again produces the results shown in Figure 7-7, where IMB stock data are displayed. Note that there is no weighted moving average data for the first four days, since there are not enough data to make the calculations until the fifth day.

CHAPTER 7 ■ STOCK CHARTS
296
Figure 7-7. A stock chart with five-day simple (red) and weighted (green) moving averages
For comparison, we also plot the stock data and simple moving averages in the figure. You can see that the weighted moving average is closer to the original stock data than the simple moving average is.
Exponential Moving Averages One drawback of both the simple and weighted moving averages is that they include data for only the number of periods the moving average covers. For example, a five-day simple or weighted moving average uses only five days’ worth of data. Data prior to those five days are not included in the calculation of the moving average.
In some situations, however, the prior data are an important reflection of prices and should be included in the moving-average calculation. You can achieve this by using an exponential moving average (EMA).
An EMA uses weight factors that decrease exponentially. The weight for each older data point decreases exponentially, giving much more importance to recent observations while not discarding older observations entirely.
The degree of weight decrease is expressed as a constant smoothing factor α, which is a number between 0 and 1. α may be expressed as a percentage, so a smoothing factor of 10% is equivalent to

CHAPTER 7 ■ STOCK CHARTS
297
α = 0.1. Alternatively, α may be expressed in terms of n time periods, where α = 2/(n+1). For example, n = 19 is equivalent to α = 0.1.
The observation at a time period t is designated Yt, and the value of the EMA at any time period t is designated St. S1 is undefined. S2 may be initialized in a number of different ways, most commonly by setting S2 to Y1, though other techniques exist, such as setting S2 to an average of the first four or five observations. The prominence of the S2 initialization’s effect on the resultant moving average depends on α: Smaller α values make the choice of S2 relatively more important than larger α values, since a higher discounts older observations faster.
The formula for calculating the EMA at time periods t ≥ 2 is
This formula can also be expressed in technical analysis terms as follows, showing how the EMA steps toward the latest data point:
where p0 is the current price. Expanding out EMAyesterday each time results in the following power series, showing how the weighting factor on each data point p1, p2, etc., decreases exponentially:
Theoretically, this is an infinite sum, but because 1-α is less than 1, the terms become smaller and smaller and can be ignored once they are small enough.
The n periods in an n-day EMA only specify the α factor. n is not a stopping point for the calculation in the way it is in an SMA or WMA. The first n data points in an EMA represent about 86% of the total weight in the calculation. As an approximation, we set α ≈ 2/(n + 1).
Implementation Using the algorithm developed in the previous section, we can implement the exponential moving average in WPF. First, add the following code to the DataSeriesMA class:
// Exponential Moving Average: private Polyline emaLineSeries = new Polyline(); private Brush emaLineColor = Brushes.Black; private double emaLineThickness = 1; public Polyline EMALineSeries { get { return emaLineSeries; } set { emaLineSeries = value; } } public Brush EMALineColor { get { return emaLineColor; } set { emaLineColor = value; } }

CHAPTER 7 ■ STOCK CHARTS
298
public double EMALineThickness { get { return emaLineThickness; } set { emaLineThickness = value; } } public double[] ExponentialMovingAverage() { int m = DataString.GetLength(1); double[] data = new double[m]; for (int i = 0; i < m; i++) data[i] = Convert.ToDouble(DataString[1, i]); double[] ema = new double[m - NDays + 1]; double psum = 0.0; double alpha = 2.0 / NDays; if (m > NDays) { for (int i = 0; i < NDays; i++) { psum += data[i]; } ema[0] = psum / NDays + alpha * (data[NDays - 1] - psum / NDays); for (int i = 1; i <= m - NDays; i++) { ema[i] = ema[i - 1] + alpha * (data[i + NDays - 1] - ema[i - 1]); } } return ema; }
In this method, before calculating the exponential moving average, we must have an initial moving-average number. To start, here we use an n-day simple moving average for the previous day’s exponential moving average. Each day we make the following calculation: We subtract the previous day’s exponential moving average from the current day’s price. We then multiply that difference by the exponential factor α to arrive at a number that we add to the previous day’s exponential moving average, resulting in the current day’s exponential moving average.
You also need to add a method, AddExponentialMovingAverage, to the DataCollectionMA class:
public void AddExponentialMovingAverage(ChartStyle cs) { foreach (DataSeriesMA ds in DataList) { ds.EMALineSeries.Stroke = ds.EMALineColor; ds.EMALineSeries.StrokeThickness = ds.EMALineThickness; double[] data = ds.ExponentialMovingAverage(); ds.EMALineSeries.Points.Clear(); for (int i = 0; i < data.Length; i++) { ds.EMALineSeries.Points.Add(cs.NormalizePoint( new Point(i + ds.NDays - 1, data[i]))); }
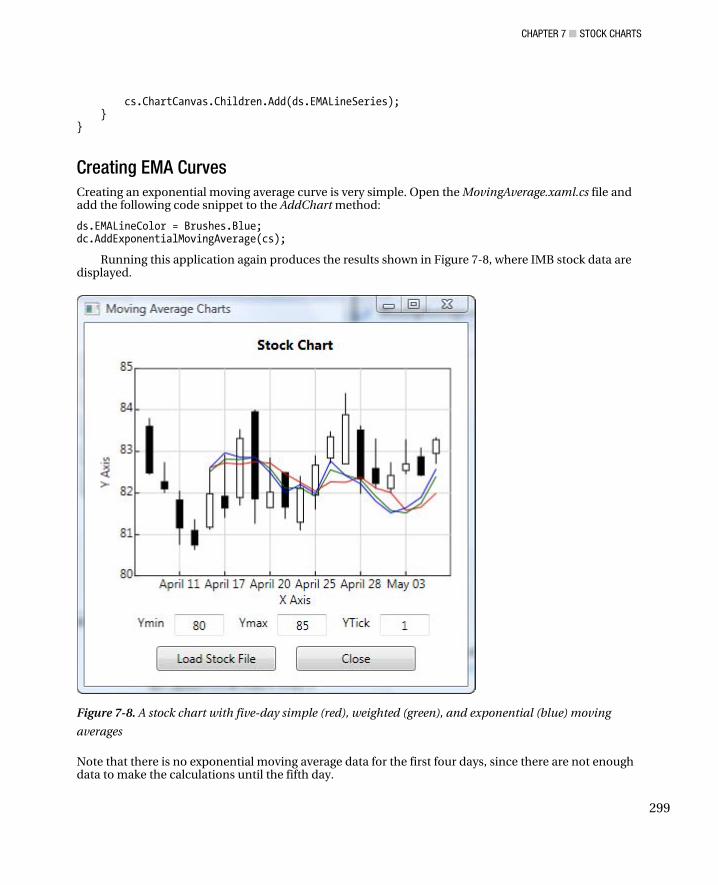
CHAPTER 7 ■ STOCK CHARTS
299
cs.ChartCanvas.Children.Add(ds.EMALineSeries); } }
Creating EMA Curves Creating an exponential moving average curve is very simple. Open the MovingAverage.xaml.cs file and add the following code snippet to the AddChart method:
ds.EMALineColor = Brushes.Blue; dc.AddExponentialMovingAverage(cs);
Running this application again produces the results shown in Figure 7-8, where IMB stock data are displayed.
Figure 7-8. A stock chart with five-day simple (red), weighted (green), and exponential (blue) moving
averages
Note that there is no exponential moving average data for the first four days, since there are not enough data to make the calculations until the fifth day.

CHAPTER 7 ■ STOCK CHARTS
300
For comparison, we plot the stock data, the five-day exponential, weighted, and simple moving averages together in Figure 7-8.
Using Yahoo Stock Charts in WPF Nowadays, you can download real-time or time-delayed stock data from the Internet. For example, Yahoo Finance provides 15-minute-delayed stock price history data and stock charts. You can download these data from Yahoo, store them in your database, and process the data for your own applications.
In this section, I’ll show you how to embed Yahoo stock charts directly into your WPF applications.
Connecting to Yahoo Stock Charts In order to download Yahoo stock charts, you need to implement a program to establish an Internet connection to the Yahoo web site. Add a new class to the StockCharts project and name it YahooStock. Here is the code:
using System; using System.ComponentModel; using System.Windows.Threading; using System.Net; using System.Windows; namespace StockCharts { public class YahooStock { private static string chartURI = @"http://ichart.yahoo.com/z?z=m&a=vm"; private string symbol = "IBM"; private string chartType = "l"; private string logScale = "off"; private string movingAverage = "m50"; private string stockPeriod = "6m"; private int updateIntervalInSeconds = 12; public int UpdateIntervalInSeconds { get { return updateIntervalInSeconds; } set { updateIntervalInSeconds = value; } } public string ChartURI { get { return chartURI + "&s=" + this.Symbol + "&q=" + this.ChartType + "&l=" + this.LogScale + "&p=" + this.MovingAverage + "&t=" + this.StockPeriod; } } public string Symbol
CHAPTER 7 ■ STOCK CHARTS
301
{ get { return symbol; } set { symbol = value; } } public string StockPeriod { get { return stockPeriod; } set { stockPeriod = value; } } public string MovingAverage { get { return movingAverage; } set { movingAverage = value; } } public string ChartType { get { return chartType; } set { chartType = value; } } public string LogScale { get { return logScale; } set { logScale = value; } } public bool CheckInternetConnection() { try { System.Net.Sockets.TcpClient clnt = new System.Net.Sockets.TcpClient("www.microsoft.com", 80); clnt.Close(); return true; } catch (Exception) { return false; } } } }
This class provides properties and methods that allow you to establish an Internet connection to the Yahoo stock chart web site. You can select different stock symbols and format for the stock chart. Here, we only specify a few commonly used parameters, including symbol, chart type, log scale, moving average, and stock period. You can have more control over the stock chart by including more parameters. You can check the available parameters on Yahoo’s web site.

CHAPTER 7 ■ STOCK CHARTS
302
Creating Yahoo Stock Charts in WPF You can easily insert Yahoo stock charts into your WPF applications using the YahooStock class developed in the previous section. Add a new WPF Window to the current project and name it YahooStockChart. Here is the XAML file for this example:
<Window x:Class="StockCharts.YahooStockChart" xmlns="http://schemas.microsoft.com/winfx/2006/xaml/presentation" xmlns:x="http://schemas.microsoft.com/winfx/2006/xaml" Title="Yahoo Stock Charts" Height="400" Width="558"> <StackPanel> <Image x:Name="chartImage" Width="512" Height="288" Margin="10"/> <StackPanel Orientation="Horizontal" HorizontalAlignment="Center"> <TextBox Name="txStockSymbol" Text="IBM" Width="75" Height="25" TextAlignment="Center"/> <Button Click="Update_Click" Width="100" Height="25" Content="Update" Margin="10"/> <Button Click="Close_Click" Width="100" Height="25" Content="Close" Margin="10"/> </StackPanel> </StackPanel> </Window>
Here, we add an Image element to the application, which will host the Yahoo stock chart. The TextBox object, txStockSymbol, allows the user to enter the stock symbol and update the stock chart by clicking the Update button. Here is the corresponding code-behind file for this example:
using System; using System.Windows; using System.Windows.Input; using System.Windows.Media; using System.Windows.Media.Imaging; namespace StockCharts { public partial class YahooStockChart : Window { YahooStock ys; public YahooStockChart() { InitializeComponent(); ys = new YahooStock(); ys.StockPeriod = "1d"; ys.ChartType = "c"; ys.Symbol = txStockSymbol.Text; chartImage.Source = new BitmapImage(new Uri(ys.ChartURI)); } private void Close_Click(object sender, RoutedEventArgs e) { this.Close(); }
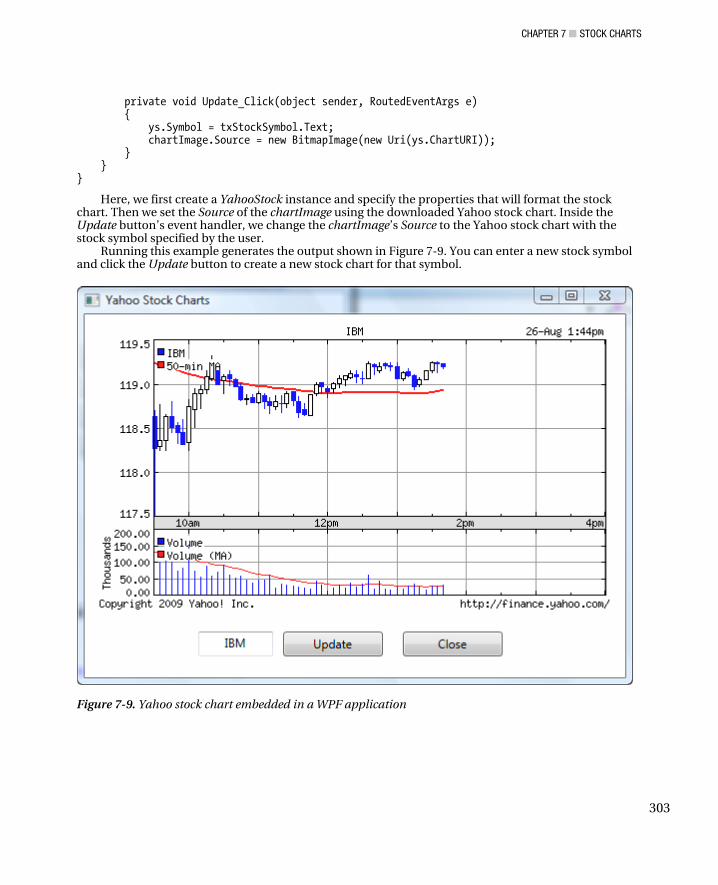
CHAPTER 7 ■ STOCK CHARTS
303
private void Update_Click(object sender, RoutedEventArgs e) { ys.Symbol = txStockSymbol.Text; chartImage.Source = new BitmapImage(new Uri(ys.ChartURI)); } } }
Here, we first create a YahooStock instance and specify the properties that will format the stock chart. Then we set the Source of the chartImage using the downloaded Yahoo stock chart. Inside the Update button’s event handler, we change the chartImage’s Source to the Yahoo stock chart with the stock symbol specified by the user.
Running this example generates the output shown in Figure 7-9. You can enter a new stock symbol and click the Update button to create a new stock chart for that symbol.
Figure 7-9. Yahoo stock chart embedded in a WPF application

CHAPTER 7 ■ STOCK CHARTS
304
C H A P T E R 8
■ ■ ■
305
Interactive 2D Charts
All of the 2D charts discussed in the previous chapters are static in nature, meaning that they do not allow the user to interact directly with them by, for example, mouse-clicking and dragging. In this chapter, I’ll discuss interactive 2D charts, which allow the user to interact with them using a mouse to zoom, pan, and retrieve data from the chart.
Automatic Tick Placement The 2D charts we have discussed so far have one common feature — the user must specify the axis limits and the placement of ticks before these charts are created. The advantage of this manual method for setting the axis limits and positioning the ticks is that you have absolute control over the placement of ticks as well as the tick marks. You can place the ticks arbitrarily over the entire scale of the axis.
However, in interactive chart applications, we require the ticks and tick mark labels to be positioned automatically when the user interacts with the chart using a mouse.
Optimal Tick Spacing When the user sets the axis limits interactively by mouse-dragging, we need to determine the optimal space for the tick placements. This optimal spacing depends on several factors, such as your computer screen size, application window size, and axis limits. In this section, I’ll show you how to implement an optimal tick-spacing method.
Start with a new WPF project and name it Interactive2DChart. Add to the current project two classes from the LineCharts project, DataSeries and DataCollection, change their namespaces to Interactive2DChart, and comment out the code segment related to the Symbols object. Add another class, ChartStyle, from the previous StockCharts project and change its namespace to Interactive2DChart. Add a new method, OptimalSpacing, to the ChartStyle class:
public double OptimalSpacing(double original) { double[] da = { 1.0, 2.0, 5.0 }; double multiplier = Math.Pow(10, Math.Floor(Math.Log(original) / Math.Log(10))); double dmin = 100 * multiplier; double spacing = 0.0; double mn = 100; foreach (double d in da) {

CHAPTER 8 ■ INTERACTIVE 2D CHARTS
306
double delta = Math.Abs(original - d * multiplier); if (delta < dmin) { dmin = delta; spacing = d * multiplier; } if (d < mn) { mn = d; } } if (Math.Abs(original - 10 * mn * multiplier) < Math.Abs(original - spacing)) spacing = 10 * mn * multiplier; return spacing; }
You don’t need to understand the mathematics behind this method in order to use it in your WPF chart applications. Just remember that for a given original spacing input, this method returns an optimal spacing, which can be used for automatic tick placement. Note that the original spacing must be in the unit of device-independent pixels.
Next, we need to modify the AddChartStyle method in the ChartStyle class:
public void AddChartStyle(TextBlock tbTitle, TextBlock tbXLabel, TextBlock tbYLabel) { Point pt = new Point(); Line tick = new Line(); double offset = 0; double dx, dy; TextBlock tb = new TextBlock(); double optimalXSpacing = 100; double optimalYSpacing = 80; // determine right offset: tb.Text = Math.Round(Xmax, 0).ToString(); tb.Measure(new Size(Double.PositiveInfinity, Double.PositiveInfinity)); Size size = tb.DesiredSize; rightOffset = size.Width / 2 + 2; // Determine left offset: double xScale = 0.0, yScale = 0.0; double xSpacing = 0.0, ySpacing = 0.0; double xTick = 0.0, yTick = 0.0; int xStart = 0, xEnd = 1; int yStart = 0, yEnd = 1; double offset0 = 30; while (Math.Abs(offset - offset0) > 1) { if (Xmin != Xmax) xScale = (TextCanvas.Width - offset0 - rightOffset - 5) / (Xmax - Xmin); if (Ymin != Ymax) yScale = TextCanvas.Height / (Ymax - Ymin);
CHAPTER 8 ■ INTERACTIVE 2D CHARTS
307
xSpacing = optimalXSpacing / xScale; xTick = OptimalSpacing(xSpacing); ySpacing = optimalYSpacing / yScale; yTick = OptimalSpacing(ySpacing); xStart = (int)Math.Ceiling(Xmin / xTick); xEnd = (int)Math.Floor(Xmax / xTick); yStart = (int)Math.Ceiling(Ymin / yTick); yEnd = (int)Math.Floor(Ymax / yTick); for (int i = yStart; i <= yEnd; i++) { dy = i * yTick; pt = NormalizePoint(new Point(Xmin, dy)); tb = new TextBlock(); tb.Text = dy.ToString(); tb.TextAlignment = TextAlignment.Right; tb.Measure(new Size(Double.PositiveInfinity, Double.PositiveInfinity)); size = tb.DesiredSize; if (offset < size.Width) offset = size.Width; } if (offset0 > offset) offset0 -= 0.5; else if (offset0 < offset) offset0 += 0.5; } leftOffset = offset + 5; Canvas.SetLeft(ChartCanvas, leftOffset); Canvas.SetBottom(ChartCanvas, bottomOffset); ChartCanvas.Width = TextCanvas.Width - leftOffset - rightOffset; ChartCanvas.Height = TextCanvas.Height - bottomOffset - size.Height / 2; Rectangle chartRect = new Rectangle(); chartRect.Stroke = Brushes.Black; chartRect.Width = ChartCanvas.Width; chartRect.Height = ChartCanvas.Height; ChartCanvas.Children.Add(chartRect); if (Xmin != Xmax) xScale = ChartCanvas.Width / (Xmax - Xmin); if (Ymin != Ymax) yScale = ChartCanvas.Height / (Ymax - Ymin); xSpacing = optimalXSpacing / xScale; xTick = OptimalSpacing(xSpacing); ySpacing = optimalYSpacing / yScale; yTick = OptimalSpacing(ySpacing); xStart = (int)Math.Ceiling(Xmin / xTick); xEnd = (int)Math.Floor(Xmax / xTick); yStart = (int)Math.Ceiling(Ymin / yTick); yEnd = (int)Math.Floor(Ymax / yTick); // Create vertical gridlines and x tick marks:
CHAPTER 8 ■ INTERACTIVE 2D CHARTS
308
if (IsYGrid == true) { for (int i = xStart; i <= xEnd; i++) { gridline = new Line(); AddLinePattern(); dx = i * xTick; gridline.X1 = NormalizePoint(new Point(dx, Ymin)).X; gridline.Y1 = NormalizePoint(new Point(dx, Ymin)).Y; gridline.X2 = NormalizePoint(new Point(dx, Ymax)).X; gridline.Y2 = NormalizePoint(new Point(dx, Ymax)).Y; ChartCanvas.Children.Add(gridline); pt = NormalizePoint(new Point(dx, Ymin)); tick = new Line(); tick.Stroke = Brushes.Black; tick.X1 = pt.X; tick.Y1 = pt.Y; tick.X2 = pt.X; tick.Y2 = pt.Y - 5; ChartCanvas.Children.Add(tick); tb = new TextBlock(); tb.Text = dx.ToString(); tb.Measure(new Size(Double.PositiveInfinity, Double.PositiveInfinity)); size = tb.DesiredSize; TextCanvas.Children.Add(tb); Canvas.SetLeft(tb, leftOffset + pt.X - size.Width / 2); Canvas.SetTop(tb, pt.Y + 2 + size.Height / 2); } } // Create horizontal gridlines and y tick marks: if (IsXGrid == true) { for (int i = yStart; i <= yEnd; i++) { gridline = new Line(); AddLinePattern(); dy = i * yTick; gridline.X1 = NormalizePoint(new Point(Xmin, dy)).X; gridline.Y1 = NormalizePoint(new Point(Xmin, dy)).Y; gridline.X2 = NormalizePoint(new Point(Xmax, dy)).X; gridline.Y2 = NormalizePoint(new Point(Xmax, dy)).Y; ChartCanvas.Children.Add(gridline); pt = NormalizePoint(new Point(Xmin, dy)); tick = new Line(); tick.Stroke = Brushes.Black; tick.X1 = pt.X; tick.Y1 = pt.Y; tick.X2 = pt.X + 5; tick.Y2 = pt.Y;
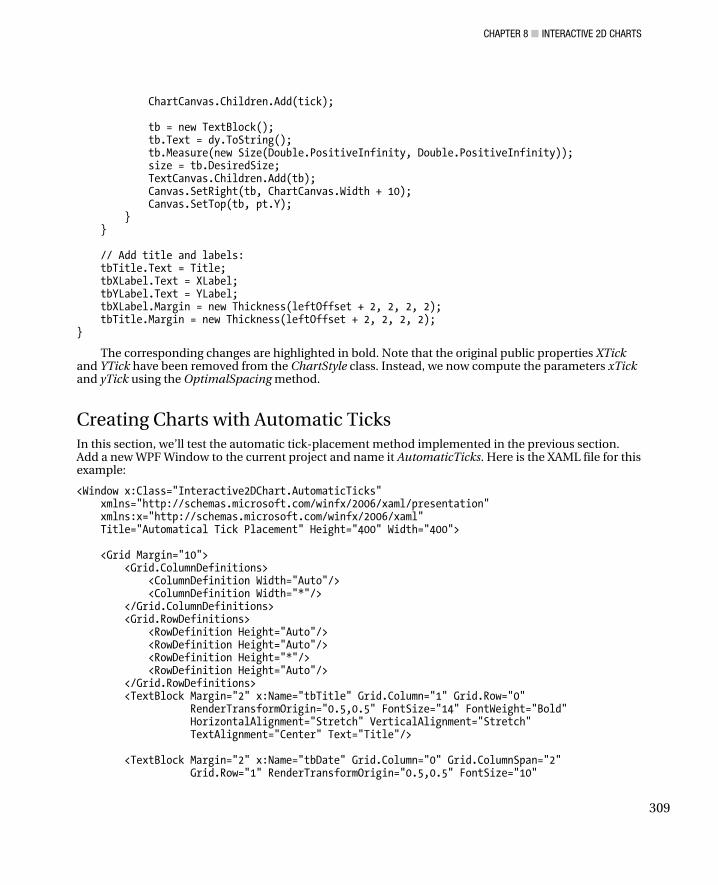
CHAPTER 8 ■ INTERACTIVE 2D CHARTS
309
ChartCanvas.Children.Add(tick); tb = new TextBlock(); tb.Text = dy.ToString(); tb.Measure(new Size(Double.PositiveInfinity, Double.PositiveInfinity)); size = tb.DesiredSize; TextCanvas.Children.Add(tb); Canvas.SetRight(tb, ChartCanvas.Width + 10); Canvas.SetTop(tb, pt.Y); } } // Add title and labels: tbTitle.Text = Title; tbXLabel.Text = XLabel; tbYLabel.Text = YLabel; tbXLabel.Margin = new Thickness(leftOffset + 2, 2, 2, 2); tbTitle.Margin = new Thickness(leftOffset + 2, 2, 2, 2); }
The corresponding changes are highlighted in bold. Note that the original public properties XTick and YTick have been removed from the ChartStyle class. Instead, we now compute the parameters xTick and yTick using the OptimalSpacing method.
Creating Charts with Automatic Ticks In this section, we’ll test the automatic tick-placement method implemented in the previous section. Add a new WPF Window to the current project and name it AutomaticTicks. Here is the XAML file for this example:
<Window x:Class="Interactive2DChart.AutomaticTicks" xmlns="http://schemas.microsoft.com/winfx/2006/xaml/presentation" xmlns:x="http://schemas.microsoft.com/winfx/2006/xaml" Title="Automatical Tick Placement" Height="400" Width="400"> <Grid Margin="10"> <Grid.ColumnDefinitions> <ColumnDefinition Width="Auto"/> <ColumnDefinition Width="*"/> </Grid.ColumnDefinitions> <Grid.RowDefinitions> <RowDefinition Height="Auto"/> <RowDefinition Height="Auto"/> <RowDefinition Height="*"/> <RowDefinition Height="Auto"/> </Grid.RowDefinitions> <TextBlock Margin="2" x:Name="tbTitle" Grid.Column="1" Grid.Row="0" RenderTransformOrigin="0.5,0.5" FontSize="14" FontWeight="Bold" HorizontalAlignment="Stretch" VerticalAlignment="Stretch" TextAlignment="Center" Text="Title"/> <TextBlock Margin="2" x:Name="tbDate" Grid.Column="0" Grid.ColumnSpan="2" Grid.Row="1" RenderTransformOrigin="0.5,0.5" FontSize="10"

CHAPTER 8 ■ INTERACTIVE 2D CHARTS
310
Foreground="Blue" HorizontalAlignment="Stretch" VerticalAlignment="Stretch" TextAlignment="Left" Text="Now"/> <TextBlock Margin="2" x:Name="tbResults" Grid.Column="1" Grid.Row="1" RenderTransformOrigin="0.5,0.5" FontSize="10" Foreground="Blue" HorizontalAlignment="Stretch" VerticalAlignment="Stretch" TextAlignment="Right" Text="Results"/> <TextBlock Margin="2" x:Name="tbXLabel" Grid.Column="1" Grid.Row="3" RenderTransformOrigin="0.5,0.5" TextAlignment="Center" Text="X Axis"/> <TextBlock Margin="2" Name="tbYLabel" Grid.Column="0" Grid.Row="2" RenderTransformOrigin="0.5,0.5" TextAlignment="Center" Text="Y Axis"> <TextBlock.LayoutTransform> <RotateTransform Angle="-90"/> </TextBlock.LayoutTransform> </TextBlock> <Grid Margin="0,0,0,0" x:Name ="chartGrid" Grid.Column="1" Grid.Row="2" ClipToBounds="False" Background="Transparent" SizeChanged="chartGrid_SizeChanged" > </Grid> <Canvas Margin="2" Name="textCanvas" Grid.Column="1" Grid.Row="2" ClipToBounds="True"> <Canvas Name="chartCanvas" ClipToBounds="True"/> </Canvas> </Grid> </Window>
This XAML file is similar to that used in examples from the previous chapters except that we add two additional text blocks, one to display the current time and the other to display the data point value. Here is the corresponding code-behind file for this example:
using System; using System.Windows; using System.Windows.Media; namespace Interactive2DChart { public partial class AutomaticTicks : Window { private ChartStyle cs; private DataCollection dc; private DataSeries ds; public AutomaticTicks() { InitializeComponent(); } private void AddChart() {

CHAPTER 8 ■ INTERACTIVE 2D CHARTS
311
cs = new ChartStyle(); dc = new DataCollection(); ds = new DataSeries(); cs.ChartCanvas = chartCanvas; cs.TextCanvas = textCanvas; cs.Title = "Sine and Cosine Chart"; cs.Xmin = 0; cs.Xmax = 7; cs.Ymin = -1.1; cs.Ymax = 1.1; cs.GridlinePattern = ChartStyle.GridlinePatternEnum.Dot; cs.GridlineColor = Brushes.Black; cs.AddChartStyle(tbTitle, tbXLabel, tbYLabel); // Draw Sine-like curve: ds.LineColor = Brushes.Blue; ds.LineThickness = 2; double dx = (cs.Xmax - cs.Xmin) / 100; for (double x = cs.Xmin; x <= cs.Xmax + dx; x += dx) { double y = Math.Exp(-0.3 * Math.Abs(x)) * Math.Sin(x); ds.LineSeries.Points.Add(new Point(x, y)); } dc.DataList.Add(ds); // Draw Cosine-like curve: ds = new DataSeries(); ds.LineColor = Brushes.Red; ds.LinePattern = DataSeries.LinePatternEnum.DashDot; ds.LineThickness = 2; for (double x = cs.Xmin; x <= cs.Xmax + dx; x += dx) { double y = Math.Exp(-0.3 * Math.Abs(x)) * Math.Cos(x); ds.LineSeries.Points.Add(new Point(x, y)); } dc.DataList.Add(ds); dc.AddLines(cs); } private void chartGrid_SizeChanged(object sender, SizeChangedEventArgs e) { tbDate.Text = DateTime.Now.ToShortDateString(); textCanvas.Width = chartGrid.ActualWidth; textCanvas.Height = chartGrid.ActualHeight; chartCanvas.Children.Clear(); textCanvas.Children.RemoveRange(1, textCanvas.Children.Count - 1); AddChart(); } } }

CHAPTER 8 ■ INTERACTIVE 2D CHARTS
312
Again, this code-behind file is similar to that used in previous examples, except you no longer need to specify the tick-related properties.
Running this example by pressing F5 produces the results shown in Figure 8-1. You can see that the chart has ticks and tick labels on both the X and Y axes, whose locations are determined by the OptimalSpacing method.
Figure 8-1. 2D chart with automatic tick placement
The real magic of the program occurs when you resize the chart window — the number of ticks and tick labels will increase or decrease depending on the application window’s actual size. Figure 8-2 shows the resized chart. You can see that this enlarged 2D chart has more ticks and tick labels in both the X and Y axes and that all of these ticks and tick labels are placed automatically.
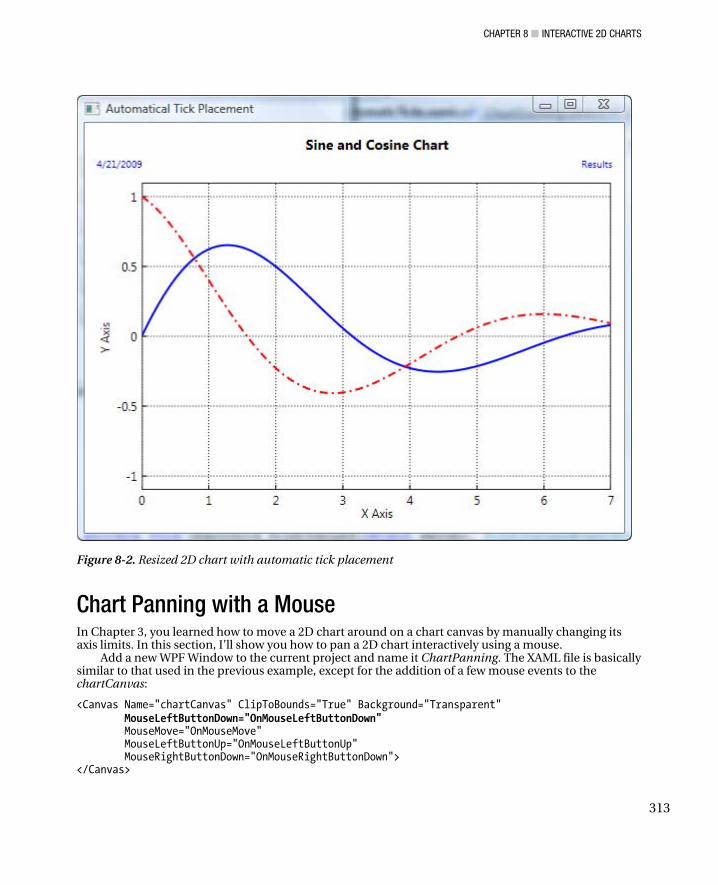
CHAPTER 8 ■ INTERACTIVE 2D CHARTS
313
Figure 8-2. Resized 2D chart with automatic tick placement
Chart Panning with a Mouse In Chapter 3, you learned how to move a 2D chart around on a chart canvas by manually changing its axis limits. In this section, I’ll show you how to pan a 2D chart interactively using a mouse.
Add a new WPF Window to the current project and name it ChartPanning. The XAML file is basically similar to that used in the previous example, except for the addition of a few mouse events to the chartCanvas:
<Canvas Name="chartCanvas" ClipToBounds="True" Background="Transparent" MouseLeftButtonDown="OnMouseLeftButtonDown" MouseMove="OnMouseMove" MouseLeftButtonUp="OnMouseLeftButtonUp" MouseRightButtonDown="OnMouseRightButtonDown"> </Canvas>

CHAPTER 8 ■ INTERACTIVE 2D CHARTS
314
The code-behind file of this example is listed below:
using System; using System.Windows; using System.Windows.Input; using System.Windows.Media; namespace Interactive2DChart { public partial class ChartPanning : Window { private Point startPoint = new Point(); private Point endPoint = new Point(); private ChartStyle cs; private DataCollection dc; private DataSeries ds; private double xmin0 = 0; private double xmax0 = 7; private double ymin0 = -1.5; private double ymax0 = 1.5; public ChartPanning() { InitializeComponent(); cs = new ChartStyle(); cs.Xmin = xmin0; cs.Xmax = xmax0; cs.Ymin = ymin0; cs.Ymax = ymax0; } private void AddChart(double xmin, double xmax, double ymin, double ymax) { dc = new DataCollection(); ds = new DataSeries(); cs = new ChartStyle(); cs.ChartCanvas = chartCanvas; cs.TextCanvas = textCanvas; cs.Title = "My 2D Chart"; cs.Xmin = xmin; cs.Xmax = xmax; cs.Ymin = ymin; cs.Ymax = ymax; cs.GridlinePattern = ChartStyle.GridlinePatternEnum.Dot; cs.GridlineColor = Brushes.Black; cs.AddChartStyle(tbTitle, tbXLabel, tbYLabel); // Draw Sine-like curve: ds.LineColor = Brushes.Blue; ds.LineThickness = 2; double dx = (cs.Xmax - cs.Xmin) / 100; for (double x = cs.Xmin; x <= cs.Xmax + dx; x += dx)

CHAPTER 8 ■ INTERACTIVE 2D CHARTS
315
{ double y = Math.Exp(-0.3 * Math.Abs(x)) * Math.Sin(x); ds.LineSeries.Points.Add(new Point(x, y)); } dc.DataList.Add(ds); // Draw Cosine-like curve: ds = new DataSeries(); ds.LineColor = Brushes.Red; ds.LinePattern = DataSeries.LinePatternEnum.DashDot; ds.LineThickness = 2; for (double x = cs.Xmin; x <= cs.Xmax + dx; x += dx) { double y = Math.Exp(-0.3 * Math.Abs(x)) * Math.Cos(x); ds.LineSeries.Points.Add(new Point(x, y)); } dc.DataList.Add(ds); dc.AddLines(cs); } private void chartGrid_SizeChanged(object sender, SizeChangedEventArgs e) { tbDate.Text = DateTime.Now.ToShortDateString(); textCanvas.Width = chartGrid.ActualWidth; textCanvas.Height = chartGrid.ActualHeight; chartCanvas.Children.Clear(); textCanvas.Children.RemoveRange(1, textCanvas.Children.Count - 1); AddChart(cs.Xmin, cs.Xmax, cs.Ymin, cs.Ymax); } private void OnMouseLeftButtonDown(object sender, MouseButtonEventArgs e) { if (!chartCanvas.IsMouseCaptured) { startPoint = e.GetPosition(chartCanvas); chartCanvas.CaptureMouse(); } } private void OnMouseMove(object sender, MouseEventArgs e) { if (chartCanvas.IsMouseCaptured) { endPoint = e.GetPosition(chartCanvas); TranslateTransform tt = new TranslateTransform(); tt.X = endPoint.X - startPoint.X; tt.Y = endPoint.Y - startPoint.Y; for (int i = 0; i < dc.DataList.Count; i++) { dc.DataList[i].LineSeries.RenderTransform = tt; } }

CHAPTER 8 ■ INTERACTIVE 2D CHARTS
316
} private void OnMouseLeftButtonUp(object sender, MouseButtonEventArgs e) { double dx = 0; double dy = 0; double x0 = 0; double x1 = 1; double y0 = 0; double y1 = 1; endPoint = e.GetPosition(chartCanvas); dx = (cs.Xmax - cs.Xmin) * (endPoint.X - startPoint.X) / chartCanvas.Width; dy = (cs.Ymax - cs.Ymin) * (endPoint.Y - startPoint.Y) / chartCanvas.Height; x0 = cs.Xmin + dx; x1 = cs.Xmax + dx; y0 = cs.Ymin + dy; y1 = cs.Ymax + dy; chartCanvas.Children.Clear(); textCanvas.Children.RemoveRange(1, textCanvas.Children.Count - 1); AddChart(x0, x1, y0, y1); chartCanvas.ReleaseMouseCapture(); chartCanvas.Cursor = Cursors.Arrow; } private void OnMouseRightButtonDown(object sender, MouseButtonEventArgs e) { chartCanvas.Children.Clear(); textCanvas.Children.RemoveRange(1, textCanvas.Children.Count - 1); AddChart(xmin0, xmax0, ymin0, ymax0); } } }
This example involves several mouse click events that allow the user to interact with the chart. These mouse events perform various operations, including LeftMouseButtonUp, LeftMouseButtonDown, RightMouseButtonDown, and MouseMove. The mouse button events provide a MouseButtonEventArgs object. The MouseButtonEventArgs class derives from the MouseEventArgs base class. When you run the program and bring up the chart on your screen, you can click anywhere within the chart area to fire the mouse button events. First, you obtain the position at which the left mouse button is clicked on the chartCanvas control. You then set the mouse’s capture state. Usually, when an object receives a mouse button down event, it will receive a corresponding mouse button up event shortly thereafter. However, in this example, you need to hold down the mouse and move it around within the chart area in order to pan the chart. Next, you want to have a notification of the mouse button up event. To do so, you need to capture the mouse by calling the CaptureMouse method and passing to the chartCanvas.
Inside the MouseMove event handler, OnMouseMove, you convert the mouse movement into a translation transform, which is attached to the line series’ RenderTransform property. This way, you can pan the curves within the chart area by moving your mouse. When you release the left mouse button, the LeftMouseButtonUp event is fired. Within the OnLeftMouseButtonUp event handler, you redefine the axis limits by taking into account the translation due to the mouse movement, and the chart is redrawn
CHAPTER 8 ■ INTERACTIVE 2D CHARTS
317
using these new axis limits. Finally, the RightMouseButtonDown event allows you to return the chart to its original axis limits.
In this example, we use four mouse events. There are more mouse events in WPF you can use to develop interactive chart and graphics applications. For example, mouse events can allow you to react when the mouse pointer moves over an element. These events include MouseEnter and MouseLeave, which provide information about a MouseEventArgs object for your program. The MouseEventArgs object includes properties that show you the state of the mouse button. If you need more information about mouse events, you can refer to Microsoft online help or tutorial books on the topic.
Running this example generates the result shown in Figure 8-3.
Figure 8-3. Pan a 2D chart using your mouse.
Chart Zooming with a Mouse In Chapter 3, you learned how to zoom in on a 2D chart on a chart canvas by manually changing its axis limits. In this section, I’ll show you how to zoom in or out of a 2D chart interactively using a mouse.
Add a new WPF Window to the current project and name it ChartZooming. The XAML is the same as that used in the previous panning example. Here is the code-behind file for this example:

CHAPTER 8 ■ INTERACTIVE 2D CHARTS
318
using System; using System.Windows; using System.Windows.Input; using System.Windows.Media; using System.Windows.Shapes; using System.Windows.Controls; namespace Interactive2DChart { public partial class ChartZooming : Window { private Point startPoint = new Point(); private Point endPoint = new Point(); private Shape rubberBand = null; private ChartStyle cs; private DataCollection dc; private DataSeries ds; private double xmin0 = 0; private double xmax0 = 7; private double ymin0 = -1.5; private double ymax0 = 1.5; public ChartZooming() { InitializeComponent(); cs = new ChartStyle(); cs.Xmin = xmin0; cs.Xmax = xmax0; cs.Ymin = ymin0; cs.Ymax = ymax0; } private void AddChart(double xmin, double xmax, double ymin, double ymax) { dc = new DataCollection(); ds = new DataSeries(); cs = new ChartStyle(); cs.ChartCanvas = chartCanvas; cs.TextCanvas = textCanvas; cs.Title = "Sine and Cosine Chart"; cs.Xmin = xmin; cs.Xmax = xmax; cs.Ymin = ymin; cs.Ymax = ymax; cs.GridlinePattern = ChartStyle.GridlinePatternEnum.Dot; cs.GridlineColor = Brushes.Black; cs.AddChartStyle(tbTitle, tbXLabel, tbYLabel); // Draw Sine-like curve: ds.LineColor = Brushes.Blue; ds.LineThickness = 2; double dx = (cs.Xmax - cs.Xmin) / 100;

CHAPTER 8 ■ INTERACTIVE 2D CHARTS
319
for (double x = cs.Xmin; x <= cs.Xmax + dx; x += dx) { double y = Math.Exp(-0.3 * Math.Abs(x)) * Math.Sin(x); ds.LineSeries.Points.Add(new Point(x, y)); } dc.DataList.Add(ds); // Draw Cosine-like curve: ds = new DataSeries(); ds.LineColor = Brushes.Red; ds.LinePattern = DataSeries.LinePatternEnum.DashDot; ds.LineThickness = 2; for (double x = cs.Xmin; x <= cs.Xmax + dx; x += dx) { double y = Math.Exp(-0.3 * Math.Abs(x)) * Math.Cos(x); ds.LineSeries.Points.Add(new Point(x, y)); } dc.DataList.Add(ds); dc.AddLines(cs); } private void chartGrid_SizeChanged(object sender, SizeChangedEventArgs e) { tbDate.Text = DateTime.Now.ToShortDateString(); textCanvas.Width = chartGrid.ActualWidth; textCanvas.Height = chartGrid.ActualHeight; chartCanvas.Children.Clear(); textCanvas.Children.RemoveRange(1, textCanvas.Children.Count - 1); AddChart(cs.Xmin, cs.Xmax, cs.Ymin, cs.Ymax); } private void OnMouseLeftButtonDown(object sender, MouseButtonEventArgs e) { if (!chartCanvas.IsMouseCaptured) { startPoint = e.GetPosition(chartCanvas); chartCanvas.CaptureMouse(); } } private void OnMouseMove(object sender, MouseEventArgs e) { if (chartCanvas.IsMouseCaptured) { endPoint = e.GetPosition(chartCanvas); if (rubberBand == null) { rubberBand = new Rectangle(); rubberBand.Stroke = Brushes.Red; chartCanvas.Children.Add(rubberBand); }
CHAPTER 8 ■ INTERACTIVE 2D CHARTS
320
rubberBand.Width = Math.Abs(startPoint.X - endPoint.X); rubberBand.Height = Math.Abs(startPoint.Y - endPoint.Y); double left = Math.Min(startPoint.X, endPoint.X); double top = Math.Min(startPoint.Y, endPoint.Y); Canvas.SetLeft(rubberBand, left); Canvas.SetTop(rubberBand, top); } } private void OnMouseLeftButtonUp(object sender, MouseButtonEventArgs e) { double x0 = 0; double x1 = 1; double y0 = 0; double y1 = 1; endPoint = e.GetPosition(chartCanvas); if (endPoint.X > startPoint.X) { x0 = cs.Xmin + (cs.Xmax - cs.Xmin) * startPoint.X / chartCanvas.Width; x1 = cs.Xmin + (cs.Xmax - cs.Xmin) * endPoint.X / chartCanvas.Width; } else if (endPoint.X < startPoint.X) { x1 = cs.Xmin + (cs.Xmax - cs.Xmin) * startPoint.X / chartCanvas.Width; x0 = cs.Xmin + (cs.Xmax - cs.Xmin) * endPoint.X / chartCanvas.Width; } if (endPoint.Y < startPoint.Y) { y0 = cs.Ymin + (cs.Ymax - cs.Ymin) * (chartCanvas.Height – startPoint.Y) / chartCanvas.Height; y1 = cs.Ymin + (cs.Ymax - cs.Ymin) * (chartCanvas.Height – endPoint.Y) / chartCanvas.Height; } else if (endPoint.Y > startPoint.Y) { y1 = cs.Ymin + (cs.Ymax - cs.Ymin) * (chartCanvas.Height – startPoint.Y) / chartCanvas.Height; y0 = cs.Ymin + (cs.Ymax - cs.Ymin) * (chartCanvas.Height – endPoint.Y) / chartCanvas.Height; } chartCanvas.Children.Clear(); textCanvas.Children.RemoveRange(1, textCanvas.Children.Count - 1); AddChart(x0, x1, y0, y1); if (rubberBand != null) {

CHAPTER 8 ■ INTERACTIVE 2D CHARTS
321
rubberBand = null; chartCanvas.ReleaseMouseCapture(); } } private void OnMouseRightButtonDown(object sender, MouseButtonEventArgs e) { chartCanvas.Children.Clear(); textCanvas.Children.RemoveRange(1, textCanvas.Children.Count - 1); AddChart(xmin0, xmax0, ymin0, ymax0); } } }
The foregoing code involves four mouse events, which are the same as those used in the previous example. In this case, the mouse event handlers are used to create a zoom area in the chart with the mouse. In particular, the MouseMove event creates a rubber band, a common feature in graphics applications. The rubber band provides an outline following the mouse cursor of the area to be zoomed in on, so you can visualize exactly which portion of the chart will be zoomed in on your screen. The OnRightMouseButtonDown event handler allows you to return to the original, unzoomed chart.
This example creates the output shown in Figures 8-4 and 8-5.

CHAPTER 8 ■ INTERACTIVE 2D CHARTS
322
Figure 8-4. Creating a rubber band on a 2D chart using mouse
Figure 8-5. The rubber band area in Figure 8-4 occupies the entire application window (zoom-in effect).
You can zoom in to the chart by following these steps. Press your left mouse button, and hold it down, drag the mouse to create a red zoom rectangle (a rubber band). Release the left mouse button, and the chart will be redrawn within the zooming area defined by the rubber band. Press your right mouse button to restore the original unzoomed chart generated using the original axis limits.
Chart Zooming with a Mouse Wheel In the previous section, I showed you how to zoom in on a 2D chart using mouse button events. You can also use the MouseWheel event to zoom in and out, a method more commonly used in interactive applications. In this section, I’ll show you how to zoom a 2D chart interactively using the MouseWheel event.
Add a new WPF Window to the current project and name it MouseWheelZooming. The XAML file is basically similar to that used in the previous example, except for this change in the mouse events attached to the chartCanvas:

CHAPTER 8 ■ INTERACTIVE 2D CHARTS
323
<Canvas Name="chartCanvas" ClipToBounds="True" Background="Transparent" MouseWheel="OnMouseWheel" MouseRightButtonDown="OnMouseRightButtonDown"/>
Here, we create two mouse events, MouseRightButtonDown (which restores the original chart) and MouseWheel (which zooms in the chart). Here is the corresponding code-behind file for this example:
using System; using System.Windows; using System.Windows.Controls; using System.Windows.Input; using System.Windows.Media; using System.Windows.Shapes; namespace Interactive2DChart { public partial class MouseWheelZooming : Window { private ChartStyle cs; private DataCollection dc; private DataSeries ds; private double xmin0 = 0; private double xmax0 = 7; private double ymin0 = -1.5; private double ymax0 = 1.5; private double xIncrement = 5; private double yIncrement = 0; public MouseWheelZooming() { InitializeComponent(); cs = new ChartStyle(); cs.Xmin = xmin0; cs.Xmax = xmax0; cs.Ymin = ymin0; cs.Ymax = ymax0; } private void AddChart(double xmin, double xmax, double ymin, double ymax) { dc = new DataCollection(); ds = new DataSeries(); cs = new ChartStyle(); cs.ChartCanvas = chartCanvas; cs.TextCanvas = textCanvas; cs.Title = "Sine and Cosine Chart"; cs.Xmin = xmin; cs.Xmax = xmax; cs.Ymin = ymin; cs.Ymax = ymax; cs.GridlinePattern = ChartStyle.GridlinePatternEnum.Dot; cs.GridlineColor = Brushes.Black;

CHAPTER 8 ■ INTERACTIVE 2D CHARTS
324
cs.AddChartStyle(tbTitle, tbXLabel, tbYLabel); // Draw Sine-like curve: ds.LineColor = Brushes.Blue; ds.LineThickness = 2; double dx = (cs.Xmax - cs.Xmin) / 100; for (double x = cs.Xmin; x <= cs.Xmax + dx; x += dx) { double y = Math.Exp(-0.3 * Math.Abs(x)) * Math.Sin(x); ds.LineSeries.Points.Add(new Point(x, y)); } dc.DataList.Add(ds); // Draw Cosine-like curve: ds = new DataSeries(); ds.LineColor = Brushes.Red; ds.LinePattern = DataSeries.LinePatternEnum.DashDot; ds.LineThickness = 2; for (double x = cs.Xmin; x <= cs.Xmax + dx; x += dx) { double y = Math.Exp(-0.3 * Math.Abs(x)) * Math.Cos(x); ds.LineSeries.Points.Add(new Point(x, y)); } dc.DataList.Add(ds); dc.AddLines(cs); } private void chartGrid_SizeChanged(object sender, SizeChangedEventArgs e) { tbDate.Text = DateTime.Now.ToShortDateString(); textCanvas.Width = chartGrid.ActualWidth; textCanvas.Height = chartGrid.ActualHeight; chartCanvas.Children.Clear(); textCanvas.Children.RemoveRange(1, textCanvas.Children.Count - 1); AddChart(cs.Xmin, cs.Xmax, cs.Ymin, cs.Ymax); } private void OnMouseRightButtonDown(object sender, MouseButtonEventArgs e) { chartCanvas.Children.Clear(); textCanvas.Children.RemoveRange(1, textCanvas.Children.Count - 1); AddChart(xmin0, xmax0, ymin0, ymax0); } private void OnMouseWheel(object sender, MouseWheelEventArgs e) { double dx = (e.Delta > 0) ? xIncrement : -xIncrement; double dy = (e.Delta > 0) ? yIncrement : -yIncrement; double x0 = cs.Xmin + (cs.Xmax - cs.Xmin) * dx / chartCanvas.Width; double x1 = cs.Xmax - (cs.Xmax - cs.Xmin) * dx / chartCanvas.Width; double y0 = cs.Ymin + (cs.Ymax - cs.Ymin) * dy / chartCanvas.Height;
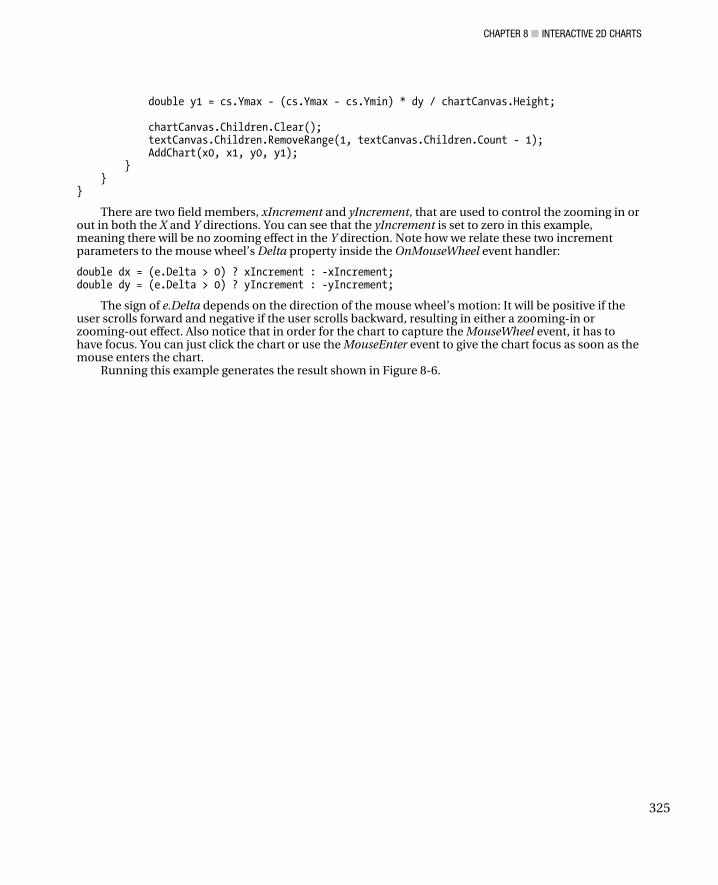
CHAPTER 8 ■ INTERACTIVE 2D CHARTS
325
double y1 = cs.Ymax - (cs.Ymax - cs.Ymin) * dy / chartCanvas.Height; chartCanvas.Children.Clear(); textCanvas.Children.RemoveRange(1, textCanvas.Children.Count - 1); AddChart(x0, x1, y0, y1); } } }
There are two field members, xIncrement and yIncrement, that are used to control the zooming in or out in both the X and Y directions. You can see that the yIncrement is set to zero in this example, meaning there will be no zooming effect in the Y direction. Note how we relate these two increment parameters to the mouse wheel’s Delta property inside the OnMouseWheel event handler:
double dx = (e.Delta > 0) ? xIncrement : -xIncrement; double dy = (e.Delta > 0) ? yIncrement : -yIncrement;
The sign of e.Delta depends on the direction of the mouse wheel’s motion: It will be positive if the user scrolls forward and negative if the user scrolls backward, resulting in either a zooming-in or zooming-out effect. Also notice that in order for the chart to capture the MouseWheel event, it has to have focus. You can just click the chart or use the MouseEnter event to give the chart focus as soon as the mouse enters the chart.
Running this example generates the result shown in Figure 8-6.
CHAPTER 8 ■ INTERACTIVE 2D CHARTS
326
Figure 8-6. Zooming a 2D chart using mouse wheel
Retrieving Chart Data In some situations, you may want to retrieve data values directly from a chart. You can do this interactively using mouse events. Here, I’ll show you how to retrieve data from a 2D chart and display the result directly on the screen.
Add a new WPF Window to the current project and name it RetrieveChartData. The XAML file for this example is similar to that used in the previous example, except for the addition of a StackPanel object and these three mouse events attached to the chartCanvas:
<StackPanel Name="resultPanel" Orientation="Horizontal" Grid.Column="1" Grid.Row="1" HorizontalAlignment="Right"></StackPanel> <Canvas Name="chartCanvas" ClipToBounds="True" Background="Transparent" MouseLeftButtonDown="OnMouseLeftButtonDown" MouseMove="OnMouseMove" MouseLeftButtonUp="OnMouseLeftButtonUp"/>
Here is the corresponding code-behind file:

CHAPTER 8 ■ INTERACTIVE 2D CHARTS
327
using System; using System.Windows; using System.Collections.Generic; using System.Windows.Controls; using System.Windows.Input; using System.Windows.Media; using System.Windows.Media.Imaging; using System.Windows.Shapes; namespace Interactive2DChart { public partial class RetrieveChartData : Window { private Point startPoint = new Point(); private Point endPoint = new Point(); private ChartStyle cs; private DataCollection dc; private DataSeries ds; private double xmin0 = 0; private double xmax0 = 7; private double ymin0 = -1.5; private double ymax0 = 1.5; private List<Ellipse> circles = new List<Ellipse>(); private List<Ellipse> labelCircles = new List<Ellipse>(); private List<TextBlock> labelResults = new List<TextBlock>(); private TextBlock xCoordinate = new TextBlock(); public RetrieveChartData() { InitializeComponent(); cs = new ChartStyle(); cs.Xmin = xmin0; cs.Xmax = xmax0; cs.Ymin = ymin0; cs.Ymax = ymax0; } private void AddChart(double xmin, double xmax, double ymin, double ymax) { dc = new DataCollection(); ds = new DataSeries(); cs = new ChartStyle(); cs.ChartCanvas = chartCanvas; cs.TextCanvas = textCanvas; cs.Title = "Sine and Cosine Chart"; cs.Xmin = xmin; cs.Xmax = xmax; cs.Ymin = ymin; cs.Ymax = ymax; cs.GridlinePattern = ChartStyle.GridlinePatternEnum.Dot; cs.GridlineColor = Brushes.Black; cs.AddChartStyle(tbTitle, tbXLabel, tbYLabel);

CHAPTER 8 ■ INTERACTIVE 2D CHARTS
328
// Draw Sine-like curve: ds.LineColor = Brushes.Blue; ds.LineThickness = 2; double dx = (cs.Xmax - cs.Xmin) / 100; for (double x = cs.Xmin; x <= cs.Xmax + dx; x += dx) { double y = Math.Exp(-0.3 * Math.Abs(x)) * Math.Sin(x); ds.LineSeries.Points.Add(new Point(x, y)); } dc.DataList.Add(ds); Ellipse circle = new Ellipse(); circle.Width = 8; circle.Height = 8; circle.Margin = new Thickness(2); circle.Fill = ds.LineColor; labelCircles.Add(circle); TextBlock tb = new TextBlock(); tb.Text = "Y0 Value"; tb.FontSize = 10; tb.Margin = new Thickness(2); labelResults.Add(tb); circle = new Ellipse(); circle.Width = 8; circle.Height = 8; circle.Fill = ds.LineColor; circle.Visibility = Visibility.Hidden; circles.Add(circle); // Draw Cosine-like curve: ds = new DataSeries(); ds.LineColor = Brushes.Red; ds.LinePattern = DataSeries.LinePatternEnum.DashDot; ds.LineThickness = 2; for (double x = cs.Xmin; x <= cs.Xmax + dx; x += dx) { double y = Math.Exp(-0.3 * Math.Abs(x)) * Math.Cos(x); ds.LineSeries.Points.Add(new Point(x, y)); } dc.DataList.Add(ds); dc.AddLines(cs); circle = new Ellipse(); circle.Width = 8; circle.Height = 8; circle.Margin = new Thickness(2, 2, 2, 2); circle.Fill = ds.LineColor; labelCircles.Add(circle); tb = new TextBlock(); tb.Text = "Y1 Value"; tb.FontSize = 10; tb.Margin = new Thickness(2);

CHAPTER 8 ■ INTERACTIVE 2D CHARTS
329
labelResults.Add(tb); circle = new Ellipse(); circle.Width = 8; circle.Height = 8; circle.Fill = ds.LineColor; circle.Visibility = Visibility.Hidden; circles.Add(circle); xCoordinate.Text = "X Value"; xCoordinate.FontSize = 10; xCoordinate.Margin = new Thickness(2); resultPanel.Children.Add(xCoordinate); for (int i = 0; i < dc.DataList.Count; i++) { chartCanvas.Children.Add(circles[i]); Canvas.SetTop(circles[i], 0); Canvas.SetLeft(circles[i], 0); resultPanel.Children.Add(labelCircles[i]); resultPanel.Children.Add(labelResults[i]); } } private void chartGrid_SizeChanged(object sender, SizeChangedEventArgs e) { tbDate.Text = DateTime.Now.ToShortDateString(); resultPanel.Children.Clear(); textCanvas.Width = chartGrid.ActualWidth; textCanvas.Height = chartGrid.ActualHeight; chartCanvas.Children.Clear(); textCanvas.Children.RemoveRange(1, textCanvas.Children.Count - 1); AddChart(cs.Xmin, cs.Xmax, cs.Ymin, cs.Ymax); } private void OnMouseLeftButtonDown(object sender, MouseButtonEventArgs e) { if (!chartCanvas.IsMouseCaptured) { startPoint = e.GetPosition(chartCanvas); chartCanvas.Cursor = Cursors.Cross; chartCanvas.CaptureMouse(); for (int i = 0; i < dc.DataList.Count; i++) { double x = startPoint.X; double y = GetInterpolatedYValue(dc.DataList[i], x); Canvas.SetLeft(circles[i], x - circles[i].Width / 2); Canvas.SetTop(circles[i], y - circles[i].Height / 2); } } } private void OnMouseMove(object sender, MouseEventArgs e)

CHAPTER 8 ■ INTERACTIVE 2D CHARTS
330
{ if (chartCanvas.IsMouseCaptured) { endPoint = e.GetPosition(chartCanvas); if (Math.Abs(endPoint.X - startPoint.X) > SystemParameters.MinimumHorizontalDragDistance && Math.Abs(endPoint.Y - startPoint.Y) > SystemParameters.MinimumVerticalDragDistance) { double x, y; for (int i = 0; i < dc.DataList.Count; i++) { TranslateTransform tt = new TranslateTransform(); tt.X = endPoint.X - startPoint.X; tt.Y = GetInterpolatedYValue(dc.DataList[i], endPoint.X) – GetInterpolatedYValue(dc.DataList[i], startPoint.X); circles[i].RenderTransform = tt; circles[i].Visibility = Visibility.Visible; x = endPoint.X; x = cs.Xmin + x * (cs.Xmax - cs.Xmin) / chartCanvas.Width; y = GetInterpolatedYValue(dc.DataList[i], endPoint.X); y = cs.Ymin + (chartCanvas.Height - y) * (cs.Ymax - cs.Ymin) / chartCanvas.Height; xCoordinate.Text = Math.Round(x, 4).ToString(); labelResults[i].Text = Math.Round(y, 4).ToString(); } } } } private void OnMouseLeftButtonUp(object sender, MouseButtonEventArgs e) { chartCanvas.ReleaseMouseCapture(); chartCanvas.Cursor = Cursors.Arrow; xCoordinate.Text = "X Value"; for (int i = 0; i < dc.DataList.Count; i++ ) { circles[i].Visibility = Visibility.Hidden; labelResults[i].Text = "Y" + i.ToString() + " Value"; } } private double GetInterpolatedYValue(DataSeries data, double x) { double result = double.NaN; for (int i = 1; i < data.LineSeries.Points.Count; i++) { double x1 = data.LineSeries.Points[i - 1].X; double x2 = data.LineSeries.Points[i].X; if (x >= x1 && x < x2) { double y1 = data.LineSeries.Points[i - 1].Y;

CHAPTER 8 ■ INTERACTIVE 2D CHARTS
331
double y2 = data.LineSeries.Points[i].Y; result = y1 + (y2 - y1) * (x - x1) / (x2 - x1); } } return result; } } }
In the foregoing code list, we define two sets of ellipse lists: one for marking the data points associated with your mouse’s movement and the other for the legend displaying the results on your screen. You specify the fill color for each of these ellipses using the line color of the corresponding line series. Note how we create these two sets of ellipse lists for each line series inside the AddChart method:
circle = new Ellipse(); circle.Width = 8; circle.Height = 8; circle.Margin = new Thickness(2, 2, 2, 2); circle.Fill = ds.LineColor; labelCircles.Add(circle); … … circle = new Ellipse(); circle.Width = 8; circle.Height = 8; circle.Fill = ds.LineColor; circle.Visibility = Visibility.Hidden; circles.Add(circle);
The first set of ellipse lists, named labelCircles, displays results, and the other set, circles, marks the data points. Note also that we initially set the Visibility property for all of the ellipses in the circles list to Hidden, meaning that by default these ellipse objects are invisible on your computer screen. You can trigger this property to Visible or Hidden using different mouse events.
When you press the left mouse button, you obtain a position (startPoint), set the mouse’s Capture state, and change chartCanvas’ Cursor property to Cross. You then try to retrieve the Y data values for each curve on the chart from the startPoint’s X coordinate. Notice that you cannot obtain the Y data from the curve directly because there may be no Y data available in the original data sets used to create the curves at the startPoint at which you initially clicked your mouse. In order to retrieve the Y data in this situation, you must generate corresponding Y data values at the position of the mouse pointer using interpolation. In this example, we implement a linear interpolation algorithm inside the GetInterpolatedYValue method, which allows you to extract Y data values from each curve series at any X coordinate where your mouse pointer may be.
The MouseMove event performs the data-retrieving task. When you hold down the left mouse button and start to move your mouse, the MouseMove event fires. First, for each curve series, you create a translation transform using the mouse movement, and then you attach the transform to the RenderTransform property of the corresponding ellipse in the circles collection. At the same time, you change the ellipse’s Visibility property to Visible:
circles[i].RenderTransform = tt; circles[i].Visibility = Visibility.Visible;
This way, the ellipse objects will move following the corresponding curve series with your mouse. Next, the retrieved data points will be displayed in the legend field on your screen.
Finally, the MouseLeftButtonUp event finishes the data-retrieving process and restores the program to its original state, including releasing the mouse’s Capture state, changing the mouse’s cursor to arrow, and setting the ellipses’ Visibility to Hidden.

CHAPTER 8 ■ INTERACTIVE 2D CHARTS
332
Running this example generates the result shown in Figure 8-7.
Figure 8-7. Retrieving data from a 2D chart using a mouse
In this chapter, I presented several commonly used techniques for creating interactive WPF applications and discussed them separately, for simplicity. In practice, you may need to combine all of these techniques to create a complex interactive application.

C H A P T E R 9
■ ■ ■
333
2D Chart Controls
In the previous chapters, we implemented the source code for all of the classes in our graphics and chart programs directly. For simple applications, this approach works well. However, if you want to reuse the same code in multiple WPF applications, this method becomes ineffective. The .NET Framework and WPF provide a powerful means, the user control, that solves this problem.
Custom user controls in WPF are just like the simple buttons or text boxes already provided in .NET and WPF. Typically, the controls you design are to be used in multiple windows or to modularize your code. These custom controls can reduce the amount of code you have to type as well as make it easier for you to change the implementation of your program. There is no reason to duplicate code in your applications, because this leaves a lot of room for bugs. Therefore, it is good programming practice to create functionalities specific to the user control in the control’s source code, which can reduce code duplication and modularize your code.
Custom user controls are a key theme in WPF and .NET development. They can greatly enhance your programming style by improving encapsulation, simplifying the programming model, and making the user interface more pluggable. Of course, custom controls can also have other benefits, such as giving you the ability to transform a generic window into a state-of-the-art modern interface.
In this chapter, you’ll learn how to put the line charts and specialized 2D charts we developed in Chapters 5 and 6 into custom user controls and how to use such controls in your WPF applications. You’ll also learn how to make chart controls into first-class WPF citizens and make them available in XAML. This means that you’ll need to define dependency properties and routed events for the chart controls in order to get support for essential WPF services, such as data binding, styles, and animation.
Line Chart Control A UserControl in WPF is a content control that can be configured using a design-time surface. Although a user control is basically similar to an ordinary content control, it is typically used when you want to reuse quickly an unchanging block of user interface in more than one application.
Creating a basic chart control based on the line charts developed in Chapter 5 is easy. For simplicity’s sake, we will build a line chart control without the second Y axis (adding a second Y axis to this control is trivial). The layout of the control is the same as that shown in Figure 5-7. The development model for the chart user control is very similar to the model used for application development in WPF.
Now, start with a new WPF project. Instead of a WPF Windows application, you need to select a new WPF User Control Library from templates and name it LineChartControl. When you do this, Microsoft Visual Studio creates an XAML markup file and a corresponding custom class to hold your initialization and event-handling code. This is the same as when you create a new WPF Window or Page application — the only difference is that the top-level container is the UserControl class. This will generate a default user control named UserControl1. Rename it LineChartControlLib by right-clicking on the UserControl1.xaml in the solution explorer and selecting Rename. You need also to change the name

CHAPTER 9 ■ 2D CHART CONTROLS
334
UserControl1 to LineChartControlLib in both the XAML and the code-behind file for the control. Add to the current project the following classes from the LineCharts project presented in Chapter 5: ChartStyle, ChartStyleGridlines, DataSeries, DataCollection, Legend, and Symbols. When we convert the Windows application to a user control, we’ll try not to change or modify these classes from the original LineCharts project.
Here is the XAML file for the control:
<UserControl x:Class="LineChartControl.LineChartControlLib" xmlns="http://schemas.microsoft.com/winfx/2006/xaml/presentation" xmlns:x="http://schemas.microsoft.com/winfx/2006/xaml" Width="400" Height="300"> <Grid Name="grid1" Margin="10"> <Grid.ColumnDefinitions> <ColumnDefinition Width="Auto"/> <ColumnDefinition Width="*"/> </Grid.ColumnDefinitions> <Grid.RowDefinitions> <RowDefinition Height="Auto"/> <RowDefinition Height="*"/> <RowDefinition Height="Auto"/> </Grid.RowDefinitions> <TextBlock Margin="2" x:Name="tbTitle" Grid.Column="1" Grid.Row="0" RenderTransformOrigin="0.5,0.5" FontSize="14" FontWeight="Bold" HorizontalAlignment="Stretch" VerticalAlignment="Stretch" TextAlignment="Center" Text="{Binding Path=Title}"/> <TextBlock Margin="2" x:Name="tbXLabel" Grid.Column="1" Grid.Row="2" RenderTransformOrigin="0.5,0.5" TextAlignment="Center" Text="{Binding Path=XLabel}"/> <TextBlock Margin="2" Name="tbYLabel" Grid.Column="0" Grid.Row="1" RenderTransformOrigin="0.5,0.5" TextAlignment="Center" Text="{Binding Path=YLabel}"> <TextBlock.LayoutTransform> <RotateTransform Angle="-90"/> </TextBlock.LayoutTransform> </TextBlock> <Grid Margin="0" x:Name ="chartGrid" Grid.Column="1" Grid.Row="1" ClipToBounds="True" Background="Transparent" SizeChanged="chartGrid_SizeChanged" /> <Canvas Margin="2" Name="textCanvas" ClipToBounds="True" Grid.Column="1" Grid.Row="1"> <Canvas Name="chartCanvas" ClipToBounds="True"> <Canvas Name="legendCanvas" Background="Transparent" /> </Canvas> </Canvas> </Grid> </UserControl>
This markup is basically the same as that used in creating a WPF Windows application for line charts, except the text boxes for Title, XLabel, and YLabel are now bound to corresponding dependency properties, which are to be defined in the code-behind file. Data binding in WPF provides a way of extracting information from a source object and using it to set a property in a target object. The simplest data binding scenario occurs when the source object is a WPF element and the source property is a dependency property, because dependency properties have a built-in support for change notification. As a result, changing the value of the dependency property in the source object updates the bound

CHAPTER 9 ■ 2D CHART CONTROLS
335
property in the target object immediately. That is exactly what you want — and it happens without requiring you to build any additional infrastructure, such as an INotifyPropertyChanged interface.
Defining Dependency Properties Next, you need to design the public interface that the line chart control exposes to the outside world. In other words, it is time to create the properties, methods, and events that the control consumer (the application that uses the control) will rely on to interact with your chart control.
You may want to expose to the outside world most of the properties in the ChartStyleGridlines class in the previous example, such as axis limits, title, and labels; at the same time, we’ll keep the classes from the original LineCharts project unchanged. In order to support WPF features such as data binding, styles, and animation, the control properties are almost always dependency properties.
The first step in creating a dependency property is to define a static field for it, adding the word Property to the end of the property name. Add the following dependency properties to the code-behind file:
using System; using System.Collections.Generic; using System.Windows; using System.Windows.Controls; using System.Windows.Media; using System.Windows.Shapes; using LineCharts; namespace LineChartControl { public partial class LineChartControlLib : UserControl { private ChartStyleGridlines cs; private DataCollection dc; private DataSeries ds; private Legend lg; public LineChartControlLib() { InitializeComponent(); this.cs = new ChartStyleGridlines(); this.dc = new DataCollection(); this.ds = new DataSeries(); this.lg = new Legend(); cs.TextCanvas = textCanvas; cs.ChartCanvas = chartCanvas; lg.LegendCanvas = legendCanvas; } private void chartGrid_SizeChanged(object sender, SizeChangedEventArgs e) { textCanvas.Width = chartGrid.ActualWidth; textCanvas.Height = chartGrid.ActualHeight; legendCanvas.Children.Clear(); chartCanvas.Children.RemoveRange(1, chartCanvas.Children.Count - 1); textCanvas.Children.RemoveRange(1, textCanvas.Children.Count - 1);

CHAPTER 9 ■ 2D CHART CONTROLS
336
AddChart(); } private void AddChart() { cs.AddChartStyle(tbTitle, tbXLabel, tbYLabel); if (dc.DataList.Count != 0) { dc.AddLines(cs); Legend.AddLegend(chartCanvas, dc); } } public ChartStyleGridlines ChartStyle { get { return cs; } set { cs = value; } } public DataCollection DataCollection { get { return dc; } set { dc = value; } } public DataSeries DataSeries { get { return ds; } set { ds = value; } } public Legend Legend { get { return lg; } set { lg = value; } } public static DependencyProperty XminProperty = DependencyProperty.Register("Xmin", typeof(double), typeof(LineChartControlLib), new FrameworkPropertyMetadata(0.0, new PropertyChangedCallback(OnPropertyChanged))); public double Xmin { get { return (double)GetValue(XminProperty); } set { SetValue(XminProperty, value); cs.Xmin = value; } }

CHAPTER 9 ■ 2D CHART CONTROLS
337
public static DependencyProperty XmaxProperty = DependencyProperty.Register("Xmax", typeof(double), typeof(LineChartControlLib), new FrameworkPropertyMetadata(10.0, new PropertyChangedCallback(OnPropertyChanged))); public double Xmax { get { return (double)GetValue(XmaxProperty); } set { SetValue(XmaxProperty, value); cs.Xmax = value; } } public static DependencyProperty YminProperty = DependencyProperty.Register("Ymin", typeof(double), typeof(LineChartControlLib), new FrameworkPropertyMetadata(0.0, new PropertyChangedCallback(OnPropertyChanged))); public double Ymin { get { return (double)GetValue(YminProperty); } set { SetValue(YminProperty, value); cs.Ymin = value; } } public static DependencyProperty YmaxProperty = DependencyProperty.Register("Ymax", typeof(double), typeof(LineChartControlLib), new FrameworkPropertyMetadata(10.0, new PropertyChangedCallback(OnPropertyChanged))); public double Ymax { get { return (double)GetValue(YmaxProperty); } set { SetValue(YmaxProperty, value); cs.Ymax = value; } } public static DependencyProperty XTickProperty = DependencyProperty.Register("XTick", typeof(double), typeof(LineChartControlLib), new FrameworkPropertyMetadata(2.0, new PropertyChangedCallback(OnPropertyChanged)));
CHAPTER 9 ■ 2D CHART CONTROLS
338
public double XTick { get { return (double)GetValue(XTickProperty); } set { SetValue(XTickProperty, value); cs.XTick = value; } } public static DependencyProperty YTickProperty = DependencyProperty.Register("YTick", typeof(double), typeof(LineChartControlLib), new FrameworkPropertyMetadata(2.0, new PropertyChangedCallback(OnPropertyChanged))); public double YTick { get { return (double)GetValue(YTickProperty); } set { SetValue(YTickProperty, value); cs.YTick = value; } } public static DependencyProperty XLabelProperty = DependencyProperty.Register("XLabel", typeof(string), typeof(LineChartControlLib), new FrameworkPropertyMetadata("X Axis", new PropertyChangedCallback(OnPropertyChanged))); public string XLabel { get { return (string)GetValue(XLabelProperty); } set { SetValue(XLabelProperty, value); cs.XLabel = value; } } public static DependencyProperty YLabelProperty = DependencyProperty.Register("YLabel", typeof(string), typeof(LineChartControlLib), new FrameworkPropertyMetadata("Y Axis", new PropertyChangedCallback(OnPropertyChanged))); public string YLabel { get { return (string)GetValue(YLabelProperty); } set

CHAPTER 9 ■ 2D CHART CONTROLS
339
{ SetValue(YLabelProperty, value); cs.YLabel = value; } } public static DependencyProperty TitleProperty = DependencyProperty.Register("Title", typeof(string), typeof(LineChartControlLib), new FrameworkPropertyMetadata("Title", new PropertyChangedCallback(OnPropertyChanged))); public string Title { get { return (string)GetValue(TitleProperty); } set { SetValue(TitleProperty, value); cs.Title = value; } } public static DependencyProperty IsXGridProperty = DependencyProperty.Register("IsXGrid", typeof(bool), typeof(LineChartControlLib), new FrameworkPropertyMetadata(true, new PropertyChangedCallback(OnPropertyChanged))); public bool IsXGrid { get { return (bool)GetValue(IsXGridProperty); } set { SetValue(IsXGridProperty, value); cs.IsXGrid = value; } } public static DependencyProperty IsYGridProperty = DependencyProperty.Register("IsYGrid", typeof(bool), typeof(LineChartControlLib), new FrameworkPropertyMetadata(true, new PropertyChangedCallback(OnPropertyChanged))); public bool IsYGrid { get { return (bool)GetValue(IsYGridProperty); } set { SetValue(IsYGridProperty, value); cs.IsYGrid = value; } }

CHAPTER 9 ■ 2D CHART CONTROLS
340
public static DependencyProperty GridlineColorProperty = DependencyProperty.Register("GridlineColor", typeof(Brush), typeof(LineChartControlLib), new FrameworkPropertyMetadata(Brushes.Gray, new PropertyChangedCallback(OnPropertyChanged))); public Brush GridlineColor { get { return (Brush)GetValue(GridlineColorProperty); } set { SetValue(GridlineColorProperty, value); cs.GridlineColor = value; } } public static DependencyProperty GridlinePatternProperty = DependencyProperty.Register("GridlinePattern", typeof(ChartStyleGridlines.GridlinePatternEnum), typeof(LineChartControlLib), new FrameworkPropertyMetadata( ChartStyleGridlines.GridlinePatternEnum.Solid, new PropertyChangedCallback(OnPropertyChanged))); public ChartStyleGridlines.GridlinePatternEnum GridlinePattern { get { return (ChartStyleGridlines.GridlinePatternEnum) GetValue(GridlinePatternProperty); } set { SetValue(GridlinePatternProperty, value); cs.GridlinePattern = value; } } public static DependencyProperty IsLegendProperty = DependencyProperty.Register("IsLegend", typeof(bool), typeof(LineChartControlLib), new FrameworkPropertyMetadata(false, new PropertyChangedCallback(OnPropertyChanged))); public bool IsLegend { get { return (bool)GetValue(IsLegendProperty); } set { SetValue(IsLegendProperty, value); lg.IsLegend = value; } } public static DependencyProperty LegendPositionProperty =

CHAPTER 9 ■ 2D CHART CONTROLS
341
DependencyProperty.Register("LegendPosition", typeof(Legend.LegendPositionEnum), typeof(LineChartControlLib), new FrameworkPropertyMetadata(Legend.LegendPositionEnum.NorthEast, new PropertyChangedCallback(OnPropertyChanged))); public Legend.LegendPositionEnum LegendPosition { get { return (Legend.LegendPositionEnum) GetValue(LegendPositionProperty); } set { SetValue(LegendPositionProperty, value); lg.LegendPosition = value; } } private static void OnPropertyChanged(DependencyObject sender, DependencyPropertyChangedEventArgs e) { LineChartControlLib lcc = sender as LineChartControlLib; if (e.Property == XminProperty) lcc.Xmin = (double)e.NewValue; else if (e.Property == XmaxProperty) lcc.Xmax = (double)e.NewValue; else if (e.Property == YminProperty) lcc.Ymin = (double)e.NewValue; else if (e.Property == YmaxProperty) lcc.Ymax = (double)e.NewValue; else if (e.Property == XTickProperty) lcc.XTick = (double)e.NewValue; else if (e.Property == YTickProperty) lcc.YTick = (double)e.NewValue; else if (e.Property == GridlinePatternProperty) lcc.GridlinePattern = (ChartStyleGridlines.GridlinePatternEnum)e.NewValue; else if (e.Property== GridlineColorProperty) lcc.GridlineColor = (Brush)e.NewValue; else if (e.Property == TitleProperty) lcc.Title = (string)e.NewValue; else if (e.Property == XLabelProperty) lcc.XLabel = (string)e.NewValue; else if (e.Property == YLabelProperty) lcc.YLabel = (string)e.NewValue; else if (e.Property == IsXGridProperty) lcc.IsXGrid = (bool)e.NewValue; else if (e.Property == IsYGridProperty) lcc.IsYGrid = (bool)e.NewValue; else if (e.Property == IsLegendProperty) lcc.IsLegend = (bool)e.NewValue; else if(e.Property== LegendPositionProperty) lcc.LegendPosition = (Legend.LegendPositionEnum)e.NewValue; }

CHAPTER 9 ■ 2D CHART CONTROLS
342
} }
At the beginning of this code-behind file, we add a using statement:
using LineCharts;
This allows you to access all of the files in the LineCharts project without changing the original namespaces of these files to the current project’s namespace.
We then define several conventional public properties for the ChartStyleGridlines, DataSeries, DataCollection, and Legend objects, which will allow you to access the public properties and methods of these objects programmatically when you use the user control in your applications.
Next, we convert most of public properties of the ChartStyleGridlines and Legend classes into dependency properties. For example, we use the following code snippet to define the dependency property for the Xmin property of the ChartStyleGridlines class:
public static DependencyProperty XminProperty = DependencyProperty.Register("Xmin", typeof(double), typeof(LineChartControlLib), new FrameworkPropertyMetadata(0.0, new PropertyChangedCallback(OnPropertyChanged))); public double Xmin { get { return (double)GetValue(XminProperty); } set { SetValue(XminProperty, value); cs.Xmin = value; } }
Here, we first define the dependency property of Xmin, and then we add standard property wrappers that make the properties easier to access and usable in XAML. The property wrappers should not contain any logic, because properties may be set and retrieved directly using the SetValue and GetValue methods of the base DependencyObject class. For example, the property synchronization logic in this control is implemented using a callback method that fires when the property changes through the property wrapper or a direct SetValue call.
Note that in the setter we relate the Xmin property in the ChartStyleGridlines class directly to the value of the dependency property XminProperty. This way, whenever the XminProperty in the LineChartControlLib class is changed, the property Xmin in the ChartStyleGridlines class will change correspondingly. We convert all of the other properties into the dependency properties in a similar manner.
The property change callback is responsible for keeping the property values consistent with the corresponding dependency properties. Whenever the property values are changed, the corresponding dependency properties are adjusted accordingly. There are several types of property change callbacks, including callbacks for changes in string, double, bool, and line patterns. Make sure you cast each property correctly when you call the OnPropertyChanged callback method.
You can add more dependency properties to the line chart control following the procedure presented earlier if you want to expose more properties from other classes, such as properties from the DataSeries and DataCollection classes.

CHAPTER 9 ■ 2D CHART CONTROLS
343
Using the Line Chart Control Now that the 2D line chart control has been completed, you can easily use it in your WPF applications. To use the control in another WPF window, you need to begin by mapping the .NET namespace and assembly to an XML namespace, as shown here:
xmlns:local="clr-namespace:LineChartControl;assembly=LineChartControl"
If your control is located in the same assembly as your application, you only need to map the namesapce:
xmlns:local="clr-namespace:LineChartControl"
Using the XML namespace and the user control class name, you can add the user control exactly as you would add any other type of object to the XAML file. You can also set its properties and attach event handlers directly in the control tag, as shown here:
<local:LineChartControlLib x:Name="myLineChart" Xmin="0" Xmax="7" Ymin="-1.5" Ymax="1.5" Width="350" Height="300" Background="LightBlue" Title=" My Chart" GridlinePattern="DashDot"/>
Notice how you specify the GridlinePattern property — you simply choose from the Solid, Dash, Dot, or DashDot properties defined in the GridlinePatternEnum of the chart style class. This is much simpler than using code, in which case you would need to type the full path in order to define the gridlines’ line pattern, as shown here:
myLineChart.GridlinePattern = ChartStyleLineChartControl.GridlinePatternEnum.DashDot;
You can also specify other properties standard to WPF elements for the chart control, such as Width, Height, Canvas.Left, Canvas.Top, and Background. These standard properties allow you to position the control, set the size of the control, or set the background color of the control.
Creating a Simple Line Chart Here, you’ll learn how to use the line chart control to create simple sine and cosine function graphs. Open the LineChartControl project in Visual Studio 2008. Click on the File menu and select Add | New project… Select WPF Application from templates and name it LineChartControlTest. Now right-click Reference and select Add References… in the new project to bring up the “Add References” window. Click the Projects tab in this window and highlight the LineChartControl, as shown in Figure 9-1.

CHAPTER 9 ■ 2D CHART CONTROLS
344
Figure 9-1. “Add References” Window
Click OK to add the LineChartControl to the current project. This way, you can use the control in your WPF application just like the default elements. Now, in the Solution Explorer, right-click the new project and select Set as StartUp Project.
Add a new WPF Window to the LineChartControlTest project and name it LineChart. The layout of the example is very simple; you can create it using the following XAML:
<Window x:Class="LineChartControlTest.LineChart" xmlns="http://schemas.microsoft.com/winfx/2006/xaml/presentation" xmlns:x="http://schemas.microsoft.com/winfx/2006/xaml" xmlns:local="clr-namespace:LineChartControl;assembly=LineChartControl" Title="Window1" Height="350" Width="400"> <Grid x:Name="rootGrid" SizeChanged="rootGrid_SizeChanged"> <local:LineChartControlLib x:Name="myLineChart" Xmin="0" Xmax="7" XTick="1" Ymin="-1.5" Ymax="1.5" YTick="0.5" Title="Sine and Cosine Chart" GridlinePattern="Dash"/> </Grid> </Window>
Here, you simply create a line chart control called myLineChart exactly as you would create any other type of WPF element. The following is the corresponding code-behind file for this example:
using System; using System.Windows; using System.Windows.Media; namespace LineChartControlTest { public partial class LineChart : Window {

CHAPTER 9 ■ 2D CHART CONTROLS
345
public LineChart() { InitializeComponent(); } private void rootGrid_SizeChanged(object sender, SizeChangedEventArgs e) { myLineChart.Width = rootGrid.ActualWidth; myLineChart.Height = rootGrid.ActualHeight; AddData(); } private void AddData() { myLineChart.DataCollection.DataList.Clear(); // Draw Sine curve: LineCharts.DataSeries ds = new LineCharts.DataSeries(); ds.LineColor = Brushes.Blue; ds.LineThickness = 1; ds.SeriesName = "Sine"; ds.Symbols.SymbolType = LineCharts.Symbols.SymbolTypeEnum.Circle; ds.Symbols.BorderColor = ds.LineColor; for (int i = 0; i < 70; i++) { double x = i / 5.0; double y = Math.Sin(x); ds.LineSeries.Points.Add(new Point(x, y)); } myLineChart.DataCollection.DataList.Add(ds); // Draw cosine curve: ds = new LineCharts.DataSeries(); ds.LineColor = Brushes.Red; ds.SeriesName = "Cosine"; ds.Symbols.SymbolType = LineCharts.Symbols.SymbolTypeEnum.OpenDiamond; ds.Symbols.BorderColor = ds.LineColor; ds.LinePattern = LineCharts.DataSeries.LinePatternEnum.DashDot; ds.LineThickness = 2; for (int i = 0; i < 70; i++) { double x = i / 5.0; double y = Math.Cos(x); ds.LineSeries.Points.Add(new Point(x, y)); } myLineChart.DataCollection.DataList.Add(ds); myLineChart.IsLegend = true; myLineChart.LegendPosition = LineCharts.Legend.LegendPositionEnum.NorthEast; } } }

CHAPTER 9 ■ 2D CHART CONTROLS
346
Just as you did when you created line charts in Chapter 5, you need first to create the data series and then to add them to the chart control’s DataCollection. It is good programming practice to specify all chart style–related properties in XAML and to create the data series in code. Of course, if you like you can use the code-only approach to create a chart using the line chart control.
Running this example generates the result shown in Figure 9-2.
Figure 9-2. Line chart created using the line chart control
Creating Multiple Line Charts Using the line chart control, you can easily create multiple charts in a single WPF Window. Let’s add a new WPF Window to the project LineChartControlTest and name it MultipleLineCharts. Create a 2 2 Grid control and add a line chart control to each of the four cells of the Grid, which can be done using the following XAML file:
<Window x:Class="LineChartControlTest.MultipleLineCharts" xmlns="http://schemas.microsoft.com/winfx/2006/xaml/presentation" xmlns:x="http://schemas.microsoft.com/winfx/2006/xaml" xmlns:local="clr-namespace:LineChartControl;assembly=LineChartControl" Title="Multiple Charts" Height="500" Width="500"> <Grid Margin="10"> <Grid.ColumnDefinitions> <ColumnDefinition/> <ColumnDefinition/>

CHAPTER 9 ■ 2D CHART CONTROLS
347
</Grid.ColumnDefinitions> <Grid.RowDefinitions> <RowDefinition/> <RowDefinition/> </Grid.RowDefinitions> <Grid x:Name="grid1" SizeChanged="grid1_SizeChanged" Grid.Column="0" Grid.Row="0"> <local:LineChartControlLib x:Name="myLineChart1" Xmin="0" Xmax="7" XTick="1" Ymin="-1.5" Ymax="2" YTick="0.5" Title="Chart One" GridlinePattern="Dash" GridlineColor="LightPink" /> </Grid> <Grid x:Name="grid2" SizeChanged="grid2_SizeChanged" Grid.Column="1" Grid.Row="0"> <local:LineChartControlLib x:Name="myLineChart2" Xmin="0" Xmax="7" XTick="1" Ymin="-1.5" Ymax="2" YTick="0.5" Title="Chart Two" GridlinePattern="Solid" GridlineColor="LightPink" /> </Grid> <Grid x:Name="grid3" SizeChanged="grid3_SizeChanged" Grid.Column="0" Grid.Row="1"> <local:LineChartControlLib x:Name="myLineChart3" Xmin="0" Xmax="7" XTick="1" Ymin="-1.5" Ymax="2" YTick="0.5" Title="Chart Three" GridlinePattern="Dash" GridlineColor="LightBlue" /> </Grid> <Grid x:Name="grid4" SizeChanged="grid4_SizeChanged" Grid.Column="1" Grid.Row="1"> <local:LineChartControlLib x:Name="myLineChart4" Xmin="0" Xmax="7" XTick="1" Ymin="-1.5" Ymax="2" YTick="0.5" Title="Chart Four" GridlinePattern="Solid" GridlineColor="LightBlue" /> </Grid> </Grid> </Window>
Here, you create four line chart controls: chart1, chart2, chart3, and chart4. For simplicity, in this example you plot the same sine and cosine functions on each chart. But you set a different gridline property for each chart. In practice, you can plot different math functions on each chart according to your application’s requirements. Here is the corresponding code-behind file, which creates the curves on each chart:
using System; using System.Windows; using System.Windows.Media; namespace LineChartControlTest { public partial class MultipleLineCharts : Window {

CHAPTER 9 ■ 2D CHART CONTROLS
348
public MultipleLineCharts() { InitializeComponent(); } private void AddData(LineChartControl.LineChartControlLib myLineChart) { LineCharts.DataSeries ds = new LineCharts.DataSeries(); myLineChart.DataCollection.DataList.Clear(); // Draw Sine curve: ds.LineColor = Brushes.Blue; ds.LineThickness = 1; ds.SeriesName = "Sine"; ds.Symbols.SymbolType = LineCharts.Symbols.SymbolTypeEnum.Circle; ds.Symbols.BorderColor = ds.LineColor; ds.Symbols.SymbolSize = 6; for (int i = 0; i < 15; i++) { double x = i / 2.0; double y = Math.Sin(x); ds.LineSeries.Points.Add(new Point(x, y)); } myLineChart.DataCollection.DataList.Add(ds); // Draw cosine curve: ds = new LineCharts.DataSeries(); ds.LineColor = Brushes.Red; ds.SeriesName = "Cosine"; ds.Symbols.SymbolType = LineCharts.Symbols.SymbolTypeEnum.OpenDiamond; ds.Symbols.BorderColor = ds.LineColor; ds.Symbols.SymbolSize = 6; for (int i = 0; i < 15; i++) { double x = i / 2.0; double y = Math.Cos(x); ds.LineSeries.Points.Add(new Point(x, y)); } myLineChart.DataCollection.DataList.Add(ds); myLineChart.IsLegend = true; myLineChart.LegendPosition = LineCharts.Legend.LegendPositionEnum.NorthEast; } private void grid1_SizeChanged(object sender, SizeChangedEventArgs e) { myLineChart1.Width = grid1.ActualWidth; myLineChart1.Height = grid1.ActualHeight; AddData(myLineChart1); } private void grid2_SizeChanged(object sender, SizeChangedEventArgs e)
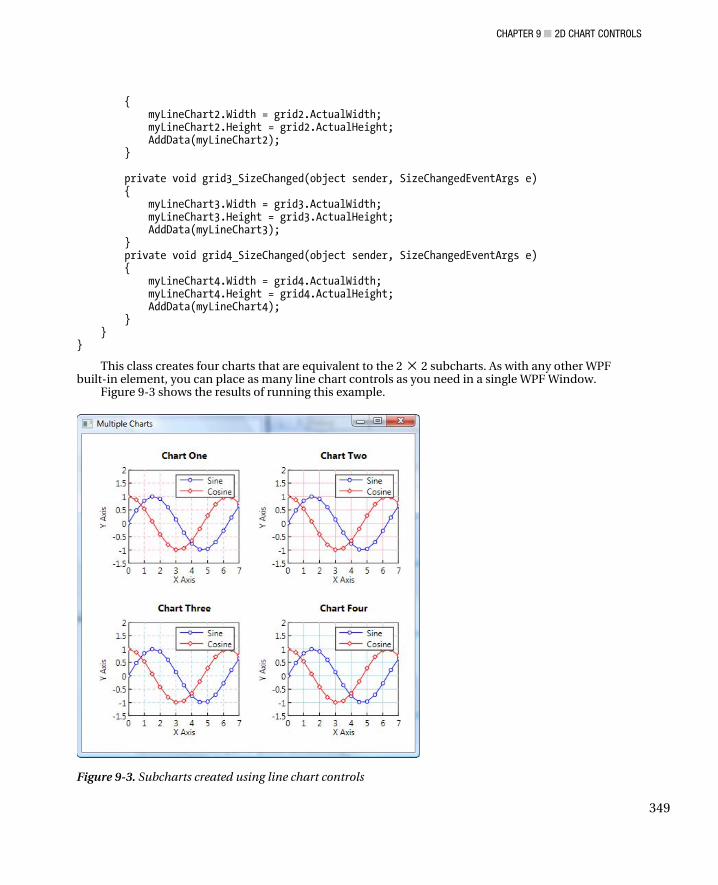
CHAPTER 9 ■ 2D CHART CONTROLS
349
{ myLineChart2.Width = grid2.ActualWidth; myLineChart2.Height = grid2.ActualHeight; AddData(myLineChart2); } private void grid3_SizeChanged(object sender, SizeChangedEventArgs e) { myLineChart3.Width = grid3.ActualWidth; myLineChart3.Height = grid3.ActualHeight; AddData(myLineChart3); } private void grid4_SizeChanged(object sender, SizeChangedEventArgs e) { myLineChart4.Width = grid4.ActualWidth; myLineChart4.Height = grid4.ActualHeight; AddData(myLineChart4); } } }
This class creates four charts that are equivalent to the 2 2 subcharts. As with any other WPF built-in element, you can place as many line chart controls as you need in a single WPF Window.
Figure 9-3 shows the results of running this example.
Figure 9-3. Subcharts created using line chart controls

CHAPTER 9 ■ 2D CHART CONTROLS
350
Specialized 2D Chart Control In previous sections, I showed you how to create a simple line chart control and how to use the line chart control in your WPF applications. Following a similar procedure, you can also easily convert the specialized 2D charts presented in Chapter 6 into a user control.
There is some difference between the line chart control and the specialized 2D control. The line chart control uses a single XAML layout file, whereas the XAML layouts for the specialized 2D chart control must be different for different types of charts. Therefore, we need to create a different user control for each type of specialized 2D chart.
Here, we’ll use a simplified approach to create specialized chart controls. Namely, we’ll not define dependency properties; instead, we’ll simply introduce the minimum number of conventional public properties. This means you must create specialized 2D charts programmatically in code when you use specialized chart controls in your WPF applications. The purpose of doing this is simply to show you how easy it is to convert WPF Windows applications for specialized 2D charts into user controls. If you really want to expose properties to the outside world in XAML, you can always follow the procedure for creating the line chart controls presented earlier in this chapter to define corresponding dependency properties.
Bar Chart Control In this section, I’ll show you how to create a bar chart control. Start with a new WPF project. Instead of a WPF Windows application, you need to select a new WPF User Control Library from templates and name it Specialized2DChartControl.
Implementation Add a new WPF User Control to the Specialized2DChartControl project and name it BarControl. Add to the current project the following classes from the Specialized2DCharts project presented in Chapter 6: ChartStyle, ChartStyleGridlines, DataSeries, DataCollection, Symbols, DataSeriesBar, and DataCollectionBar. When we convert the Windows application into a user control, we’ll try not to change or modify these classes from the original project.
Here is the XAML file for the bar control:
<UserControl x:Class="Specialized2DChartControl.BarControl" xmlns="http://schemas.microsoft.com/winfx/2006/xaml/presentation" xmlns:x="http://schemas.microsoft.com/winfx/2006/xaml" Height="400" Width="500"> <Grid Name="grid1" Margin="10"> <Grid.ColumnDefinitions> <ColumnDefinition Width="Auto"/> <ColumnDefinition Name="column1" Width="*"/> </Grid.ColumnDefinitions> <Grid.RowDefinitions> <RowDefinition Height="Auto"/> <RowDefinition Name="row1" Height="*"/> <RowDefinition Height="Auto"/> </Grid.RowDefinitions> <TextBlock Margin="2" x:Name="tbTitle" Grid.Column="1" Grid.Row="0" RenderTransformOrigin="0.5,0.5" FontSize="14" FontWeight="Bold" HorizontalAlignment="Stretch" VerticalAlignment="Stretch" TextAlignment="Center" Text="Title"/>

CHAPTER 9 ■ 2D CHART CONTROLS
351
<TextBlock Margin="2" x:Name="tbXLabel" Grid.Column="1" Grid.Row="2" RenderTransformOrigin="0.5,0.5" TextAlignment="Center" Text="X Axis"/> <TextBlock Margin="2" Name="tbYLabel" Grid.Column="0" Grid.Row="1" RenderTransformOrigin="0.5,0.5" TextAlignment="Center" Text="Y Axis"> <TextBlock.LayoutTransform> <RotateTransform Angle="-90"/> </TextBlock.LayoutTransform> </TextBlock> <Grid Margin="0" x:Name ="chartGrid" Grid.Column="1" Grid.Row="1" ClipToBounds="True" Background="Transparent" SizeChanged="chartGrid_SizeChanged" /> <Canvas Margin="2" Name="textCanvas" ClipToBounds="True" Grid.Column="1" Grid.Row="1"> <Canvas Name="chartCanvas" ClipToBounds="True"> <Canvas Name="legendCanvas" Background="Transparent" /> </Canvas> </Canvas> </Grid> </UserControl>
This markup is basically the same as that used to create WPF Windows applications for bar charts. Next, we need to design the public interface that the bar chart control exposes to the outside world.
Here, we only define the necessary public properties in the control. Add the following code to the code-behind file:
using System; using System.Windows; using System.Windows.Controls; using System.Windows.Media; using Specialized2DCharts; namespace Specialized2DChartControl { public partial class BarControl : UserControl { private ChartStyleGridlines cs; private DataCollectionBar dc; private DataSeriesBar ds; public BarControl() { InitializeComponent(); this.cs = new ChartStyleGridlines(); this.dc = new DataCollectionBar(); this.ds = new DataSeriesBar(); cs.ChartCanvas = chartCanvas; cs.TextCanvas = textCanvas; } private void chartGrid_SizeChanged(object sender, SizeChangedEventArgs e) { textCanvas.Width = chartGrid.ActualWidth;
CHAPTER 9 ■ 2D CHART CONTROLS
352
textCanvas.Height = chartGrid.ActualHeight; legendCanvas.Children.Clear(); chartCanvas.Children.RemoveRange(1, chartCanvas.Children.Count - 1); textCanvas.Children.RemoveRange(1, textCanvas.Children.Count - 1); AddChart(); } private void AddChart() { cs.AddChartStyle(tbTitle, tbXLabel, tbYLabel); if (dc.DataList.Count != 0) dc.AddBars(cs); } public ChartStyleGridlines ChartStyle { get { return cs; } set { cs = value; } } public DataCollectionBar DataCollection { get { return dc; } set { dc = value; } } public DataSeriesBar DataSeries { get { return ds; } set { ds = value; } } } }
Note that a using statement is added at the beginning of the code:
using Specialized2DCharts;
This allows you to access all of the public classes in the Specialized2DCharts project. You can see that we define only three public properties, which are related directly to the ChartStyleGridlines, DataSeriesBar, and DataCollectionBar objects. These three properties set up an interface between the user control and the original corresponding classes and allow you to access the public properties and methods inside these classes.
Creating Bar Charts Here, I’ll show you how to use the bar chart control to create simple bar charts. Open the Specialized2DChartControl solution in Visual Studio 2008. Click on the File menu and select Add | New project… Select WPF Application from templates and name it Specialized2DChartControlTest. Now right-click Reference and select Add References… in the Specialized2DChartControlTest project to bring up “Add References.” Click the Projects tab in this “Add Reference” window and highlight the Specialized2DChartControl. Click OK to add the Specialize2DChartControl to the current project. This

CHAPTER 9 ■ 2D CHART CONTROLS
353
way, you can use the control in your WPF applications the same way as a default element. Now right-click the new project and select Set as StartUp Project.
Add a new WPF Window to the Specialized2DChartControlTest project and name it BarCharts. The layout for the example is very simple; you create it using the following XAML:
<Window x:Class="Specialized2DChartControlTest.BarCharts" xmlns="http://schemas.microsoft.com/winfx/2006/xaml/presentation" xmlns:x="http://schemas.microsoft.com/winfx/2006/xaml" xmlns:local="clr-namespace:Specialized2DChartControl; assembly=Specialized2DChartControl" Title="Bar Charts" Height="350" Width="400"> <Grid x:Name="rootGrid" SizeChanged="rootGrid_SizeChanged"> <local:BarControl x:Name="myBarChart"/> </Grid> </Window>
And the corresponding code-behind file is given below:
using System; using System.Collections.Generic; using System.Windows; using System.Windows.Controls; using System.Windows.Media; using System.Windows.Shapes; namespace Specialized2DChartControlTest { public partial class BarCharts : Window { public BarCharts() { InitializeComponent(); } private void rootGrid_SizeChanged(object sender, SizeChangedEventArgs e) { myBarChart.Height = rootGrid.ActualHeight; myBarChart.Width = rootGrid.ActualWidth; AddHorizontalGroupBarChart(); } private void AddHorizontalGroupBarChart() { myBarChart.DataCollection.DataList.Clear(); Specialized2DCharts.DataSeriesBar ds; myBarChart.DataCollection.BarType = Specialized2DCharts.DataCollectionBar.BarTypeEnum.HorizontalStack; myBarChart.ChartStyle.Title = myBarChart.DataCollection.BarType.ToString(); myBarChart.ChartStyle.Xmin = 0; myBarChart.ChartStyle.Xmax = 25; myBarChart.ChartStyle.Ymin = 0; myBarChart.ChartStyle.Ymax = 5; myBarChart.ChartStyle.XTick = 5;

CHAPTER 9 ■ 2D CHART CONTROLS
354
myBarChart.ChartStyle.YTick = 1; myBarChart.ChartStyle.GridlinePattern = Specialized2DCharts.ChartStyleGridlines.GridlinePatternEnum.Dot; myBarChart.ChartStyle.GridlineColor = Brushes.Black; // Add the first bar series: ds = new Specialized2DCharts.DataSeriesBar(); ds.BorderColor = Brushes.Red; ds.FillColor = Brushes.Green; ds.BarWidth = 0.8; for (int i = 0; i < 5; i++) { double x = i + 1.0; double y = 2.0 * x; ds.LineSeries.Points.Add(new Point(y, x)); } myBarChart.DataCollection.DataList.Add(ds); // Add the second bar series: ds = new Specialized2DCharts.DataSeriesBar(); ds.BorderColor = Brushes.Red; ds.FillColor = Brushes.Yellow; ds.BarWidth = 0.8; for (int i = 0; i < 5; i++) { double x = i + 1.0; double y = 1.5 * x; ds.LineSeries.Points.Add(new Point(y, x)); } myBarChart.DataCollection.DataList.Add(ds); // Add the third bar series: ds = new Specialized2DCharts.DataSeriesBar(); ds.BorderColor = Brushes.Red; ds.FillColor = Brushes.Blue; ds.BarWidth = 0.8; for (int i = 0; i < 5; i++) { double x = i + 1.0; double y = 1.0 * x; ds.LineSeries.Points.Add(new Point(y, x)); } myBarChart.DataCollection.DataList.Add(ds); myBarChart.DataCollection.AddBars(myBarChart.ChartStyle); } } }
This code is very similar to that used in Chapter 6 to create bar charts in code directly. In this example, I demonstrate how to create a horizontal group bar chart. You can modify the preceding code to create various bar charts presented previously in Chapter 6.

CHAPTER 9 ■ 2D CHART CONTROLS
355
Running this example generates the same result as that shown in Figure 6-9.
Creating Multiple Bar Charts Using the bar chart control, you can easily create multiple bar charts in a single WPF window. Add a new WPF Window to the project Specialized2DChartControlTest and name it MultiplebarCharts. Create a 2 2 Grid control and add a line chart control to each of the four cells of the Grid, which can be done using the following XAML file:
<Window x:Class="Specialized2DChartControlTest.MultipleBarCharts" xmlns="http://schemas.microsoft.com/winfx/2006/xaml/presentation" xmlns:x="http://schemas.microsoft.com/winfx/2006/xaml" xmlns:local="clr-namespace:Specialized2DChartControl; assembly=Specialized2DChartControl" Title="MultipleBarCharts" Height="500" Width="500"> <Grid> <Grid.RowDefinitions> <RowDefinition/> <RowDefinition/> </Grid.RowDefinitions> <Grid.ColumnDefinitions> <ColumnDefinition/> <ColumnDefinition/> </Grid.ColumnDefinitions> <Grid x:Name="grid1" SizeChanged="grid1_SizeChanged" Grid.Column="0" Grid.Row="0"> <local:BarControl x:Name="bar1"/> </Grid> <Grid x:Name="grid2" SizeChanged="grid2_SizeChanged" Grid.Column="1" Grid.Row="0"> <local:BarControl x:Name="bar2"/> </Grid> <Grid x:Name="grid3" SizeChanged="grid3_SizeChanged" Grid.Column="0" Grid.Row="1"> <local:BarControl x:Name="bar3"/> </Grid> <Grid x:Name="grid4" SizeChanged="grid4_SizeChanged" Grid.Column="1" Grid.Row="1"> <local:BarControl x:Name="bar4"/> </Grid> </Grid> </Window>
Here, you create four bar chart controls: bar1, bar2, bar3, and bar4. Here is the corresponding code-behind file that draws the bars on each chart:
using System; using System.Collections.Generic; using System.Windows; using System.Windows.Controls; using System.Windows.Media; using System.Windows.Shapes;

CHAPTER 9 ■ 2D CHART CONTROLS
356
namespace Specialized2DChartControlTest { public partial class MultipleBarCharts : Window { public MultipleBarCharts() { InitializeComponent(); } private void grid1_SizeChanged(object sender, SizeChangedEventArgs e) { bar1.Height = grid1.ActualHeight; bar1.Width = grid1.ActualWidth; AddVerticalBarData(bar1); } private void grid2_SizeChanged(object sender, SizeChangedEventArgs e) { bar2.Height = grid2.ActualHeight; bar2.Width = grid2.ActualWidth; AddHorizontalBarChart(bar2); } private void grid3_SizeChanged(object sender, SizeChangedEventArgs e) { bar3.Height = grid3.ActualHeight; bar3.Width = grid3.ActualWidth; AddVerticalGroupBarData(bar3); } private void grid4_SizeChanged(object sender, SizeChangedEventArgs e) { bar4.Height = grid4.ActualHeight; bar4.Width = grid4.ActualWidth; AddHorizontalGroupBarChart(bar4); } private void AddVerticalBarData( Specialized2DChartControl.BarControl myBarChart) { myBarChart.DataCollection.DataList.Clear(); Specialized2DCharts.DataSeriesBar ds = new Specialized2DCharts.DataSeriesBar(); myBarChart.DataCollection.BarType = Specialized2DCharts.DataCollectionBar.BarTypeEnum.Vertical; myBarChart.ChartStyle.Title = "1st Bar Chart"; myBarChart.ChartStyle.Xmin = 0; myBarChart.ChartStyle.Xmax = 5; myBarChart.ChartStyle.Ymin = 0; myBarChart.ChartStyle.Ymax = 10; myBarChart.ChartStyle.XTick = 1; myBarChart.ChartStyle.YTick = 2;

CHAPTER 9 ■ 2D CHART CONTROLS
357
myBarChart.ChartStyle.GridlinePattern = Specialized2DCharts.ChartStyleGridlines.GridlinePatternEnum.Dot; myBarChart.ChartStyle.GridlineColor = Brushes.Black; // Draw the bar chart: ds.BorderColor = Brushes.Red; ds.FillColor = Brushes.Green; ds.BarWidth = 0.6; for (int i = 0; i < 5; i++) { double x = i + 1.0; double y = 2.0 * x; ds.LineSeries.Points.Add(new Point(x, y)); } myBarChart.DataCollection.DataList.Add(ds); myBarChart.DataCollection.AddBars(myBarChart.ChartStyle); } private void AddVerticalGroupBarData( Specialized2DChartControl.BarControl myBarChart) { myBarChart.DataCollection.DataList.Clear(); Specialized2DCharts.DataSeriesBar ds = new Specialized2DCharts.DataSeriesBar(); myBarChart.DataCollection.BarType = Specialized2DCharts.DataCollectionBar.BarTypeEnum.Vertical; myBarChart.ChartStyle.Title = "3rd Bar Chart"; myBarChart.ChartStyle.Xmin = 0; myBarChart.ChartStyle.Xmax = 5; myBarChart.ChartStyle.Ymin = 0; myBarChart.ChartStyle.Ymax = 10; myBarChart.ChartStyle.XTick = 1; myBarChart.ChartStyle.YTick = 2; myBarChart.ChartStyle.GridlinePattern = Specialized2DCharts.ChartStyleGridlines.GridlinePatternEnum.Dot; myBarChart.ChartStyle.GridlineColor = Brushes.Black; // Add the first bar series: ds = new Specialized2DCharts.DataSeriesBar(); ds.BorderColor = Brushes.Red; ds.FillColor = Brushes.Green; ds.BarWidth = 0.9; for (int i = 0; i < 5; i++) { double x = i + 1.0; double y = 2.0 * x; ds.LineSeries.Points.Add(new Point(x, y)); } myBarChart.DataCollection.DataList.Add(ds); // Add the second bar series:
CHAPTER 9 ■ 2D CHART CONTROLS
358
ds = new Specialized2DCharts.DataSeriesBar(); ds.BorderColor = Brushes.Red; ds.FillColor = Brushes.Yellow; ds.BarWidth = 0.9; for (int i = 0; i < 5; i++) { double x = i + 1.0; double y = 1.5 * x; ds.LineSeries.Points.Add(new Point(x, y)); } myBarChart.DataCollection.DataList.Add(ds); // Add the third bar series: ds = new Specialized2DCharts.DataSeriesBar(); ds.BorderColor = Brushes.Red; ds.FillColor = Brushes.Blue; ds.BarWidth = 0.9; for (int i = 0; i < 5; i++) { double x = i + 1.0; double y = 1.0 * x; ds.LineSeries.Points.Add(new Point(x, y)); } myBarChart.DataCollection.DataList.Add(ds); myBarChart.DataCollection.AddBars(myBarChart.ChartStyle); } private void AddHorizontalBarChart( Specialized2DChartControl.BarControl myBarChart) { myBarChart.DataCollection.DataList.Clear(); Specialized2DCharts.DataSeriesBar ds = new Specialized2DCharts.DataSeriesBar(); myBarChart.DataCollection.BarType = Specialized2DCharts.DataCollectionBar.BarTypeEnum.Horizontal; myBarChart.ChartStyle.Title = "2nd Bar Chart"; myBarChart.ChartStyle.Xmin = 0; myBarChart.ChartStyle.Xmax = 10; myBarChart.ChartStyle.Ymin = 0; myBarChart.ChartStyle.Ymax = 5; myBarChart.ChartStyle.XTick = 2; myBarChart.ChartStyle.YTick = 1; myBarChart.ChartStyle.GridlinePattern = Specialized2DCharts.ChartStyleGridlines.GridlinePatternEnum.Dot; myBarChart.ChartStyle.GridlineColor = Brushes.Black; // Draw the bar chart: ds = new Specialized2DCharts.DataSeriesBar(); ds.BorderColor = Brushes.Red; ds.FillColor = Brushes.Green; ds.BarWidth = 0.6;

CHAPTER 9 ■ 2D CHART CONTROLS
359
for (int i = 0; i < 5; i++) { double x = i + 1.0; double y = 2.0 * x; ds.LineSeries.Points.Add(new Point(y, x)); } myBarChart.DataCollection.DataList.Add(ds); myBarChart.DataCollection.AddBars(myBarChart.ChartStyle); } private void AddHorizontalGroupBarChart( Specialized2DChartControl.BarControl myBarChart) { myBarChart.DataCollection.DataList.Clear(); Specialized2DCharts.DataSeriesBar ds = new Specialized2DCharts.DataSeriesBar(); myBarChart.DataCollection.BarType = Specialized2DCharts.DataCollectionBar.BarTypeEnum.HorizontalStack; myBarChart.ChartStyle.Title = "4th Bar Chart"; myBarChart.ChartStyle.Xmin = 0; myBarChart.ChartStyle.Xmax = 25; myBarChart.ChartStyle.Ymin = 0; myBarChart.ChartStyle.Ymax = 5; myBarChart.ChartStyle.XTick = 5; myBarChart.ChartStyle.YTick = 1; myBarChart.ChartStyle.GridlinePattern = Specialized2DCharts.ChartStyleGridlines.GridlinePatternEnum.Dot; myBarChart.ChartStyle.GridlineColor = Brushes.Black; // Add the first bar series: ds = new Specialized2DCharts.DataSeriesBar(); ds.BorderColor = Brushes.Red; ds.FillColor = Brushes.Green; ds.BarWidth = 0.8; for (int i = 0; i < 5; i++) { double x = i + 1.0; double y = 2.0 * x; ds.LineSeries.Points.Add(new Point(y, x)); } myBarChart.DataCollection.DataList.Add(ds); // Add the second bar series: ds = new Specialized2DCharts.DataSeriesBar(); ds.BorderColor = Brushes.Red; ds.FillColor = Brushes.Yellow; ds.BarWidth = 0.8; for (int i = 0; i < 5; i++) {
CHAPTER 9 ■ 2D CHART CONTROLS
360
double x = i + 1.0; double y = 1.5 * x; ds.LineSeries.Points.Add(new Point(y, x)); } myBarChart.DataCollection.DataList.Add(ds); // Add the third bar series: ds = new Specialized2DCharts.DataSeriesBar(); ds.BorderColor = Brushes.Red; ds.FillColor = Brushes.Blue; ds.BarWidth = 0.8; for (int i = 0; i < 5; i++) { double x = i + 1.0; double y = 1.0 * x; ds.LineSeries.Points.Add(new Point(y, x)); } myBarChart.DataCollection.DataList.Add(ds); myBarChart.DataCollection.AddBars(myBarChart.ChartStyle); } } }
This example creates four different bar charts that are equivalent to the 2 2 subcharts. As with any other WPF built-in element, you can place as many bar chart controls as you need in a single WPF Window.
Figure 9-4 shows the results of running this example.

CHAPTER 9 ■ 2D CHART CONTROLS
361
Figure 9-4. Subcharts created using the bar chart controls
Stair-Step Chart Control In this section, you’ll learn how to create a stair-step chart control.
Implementation Add a new WPF User Control to the Specialized2DChartControl project and name it StairstepControl. Add to the current project the following classes from the Specialized2DCharts project presented in Chapter 6: DataSeriesStairstep and DataCollectionStairstep. When we convert the Windows application into a user control, we’ll try not to change or modify these classes from the original project.
Here is the XAML file for the stair-step control:
<UserControl x:Class="Specialized2DChartControl.StairstepControl" xmlns="http://schemas.microsoft.com/winfx/2006/xaml/presentation" xmlns:x="http://schemas.microsoft.com/winfx/2006/xaml" Height="400" Width="500"> <Grid Name="grid1" Margin="10"> <Grid.ColumnDefinitions> <ColumnDefinition Width="Auto"/> <ColumnDefinition Name="column1" Width="*"/> </Grid.ColumnDefinitions> <Grid.RowDefinitions>

CHAPTER 9 ■ 2D CHART CONTROLS
362
<RowDefinition Height="Auto"/> <RowDefinition Name="row1" Height="*"/> <RowDefinition Height="Auto"/> </Grid.RowDefinitions> <TextBlock Margin="2" x:Name="tbTitle" Grid.Column="1" Grid.Row="0" RenderTransformOrigin="0.5,0.5" FontSize="14" FontWeight="Bold" HorizontalAlignment="Stretch" VerticalAlignment="Stretch" TextAlignment="Center" Text="Title"/> <TextBlock Margin="2" x:Name="tbXLabel" Grid.Column="1" Grid.Row="2" RenderTransformOrigin="0.5,0.5" TextAlignment="Center" Text="X Axis"/> <TextBlock Margin="2" Name="tbYLabel" Grid.Column="0" Grid.Row="1" RenderTransformOrigin="0.5,0.5" TextAlignment="Center" Text="Y Axis"> <TextBlock.LayoutTransform> <RotateTransform Angle="-90"/> </TextBlock.LayoutTransform> </TextBlock> <Grid Margin="0" x:Name ="chartGrid" Grid.Column="1" Grid.Row="1" ClipToBounds="True" Background="Transparent" SizeChanged="chartGrid_SizeChanged" /> <Canvas Margin="2" Name="textCanvas" ClipToBounds="True" Grid.Column="1" Grid.Row="1"> <Canvas Name="chartCanvas" ClipToBounds="True"> <Canvas Name="legendCanvas" Background="Transparent" /> </Canvas> </Canvas> </Grid> </UserControl>
This XAML file is basically the same as that used in creating the WPF Window Application for stair step charts presented in Chapter 6.
Next, we need to design the public interface that the stair step chart control exposes to the outside world. Here, we only define necessary public properties in the control. Add the following code to the code-behind file:
using System; using System.Collections.Generic; using System.Windows; using System.Windows.Controls; using System.Windows.Media; using Specialized2DCharts; namespace Specialized2DChartControl { public partial class StairstepControl : UserControl { private ChartStyleGridlines cs; private DataCollectionStairstep dc; private DataSeriesStairstep ds; public StairstepControl() { InitializeComponent();

CHAPTER 9 ■ 2D CHART CONTROLS
363
cs = new ChartStyleGridlines(); dc = new DataCollectionStairstep(); ds = new DataSeriesStairstep(); cs.TextCanvas = textCanvas; cs.ChartCanvas = chartCanvas; } private void chartGrid_SizeChanged(object sender, SizeChangedEventArgs e) { textCanvas.Width = chartGrid.ActualWidth; textCanvas.Height = chartGrid.ActualHeight; legendCanvas.Children.Clear(); chartCanvas.Children.RemoveRange(1, chartCanvas.Children.Count - 1); textCanvas.Children.RemoveRange(1, textCanvas.Children.Count - 1); AddChart(); } private void AddChart() { cs.AddChartStyle(tbTitle, tbXLabel, tbYLabel); if (dc.DataList.Count != 0) { dc.AddStairstep(cs); dc.AddLines(cs); } } public ChartStyleGridlines ChartStyle { get { return cs; } set { cs = value; } } public DataCollectionStairstep DataCollection { get { return dc; } set { dc = value; } } public DataSeriesStairstep DataSeries { get { return ds; } set { ds = value; } } } }
As we did for the previous bar chart control, here we define only three public properties, which are related directly to the ChartStyleGridlines, DataSeriesStairstep, and DataCollectionStairstep objects. These three properties set up an interface between the user control and the original corresponding classes and allow you to access the public properties and methods inside these classes.

CHAPTER 9 ■ 2D CHART CONTROLS
364
Creating Stair-Step Charts Here, I’ll show you how to use the stair-step chart control to create stair-step charts. Open the Specialized2DChartControl project. Add a new WPF Window to the Specialized2DChartControlTest project and name it StairstepChart. The layout of the example is very simple; you create it using the following XAML:
<Window x:Class="Specialized2DChartControlTest.StairstepChart" xmlns="http://schemas.microsoft.com/winfx/2006/xaml/presentation" xmlns:x="http://schemas.microsoft.com/winfx/2006/xaml" xmlns:local="clr-namespace:Specialized2DChartControl; assembly=Specialized2DChartControl" Title="StairstepChart" Height="350" Width="400"> <Grid x:Name="rootGrid" SizeChanged="rootGrid_SizeChanged"> <local:StairstepControl x:Name="myStairstepChart"/> </Grid> </Window>
And the corresponding code-behind file is given below:
using System; using System.Windows; using System.Windows.Controls; using System.Windows.Media; namespace Specialized2DChartControlTest { public partial class StairstepChart : Window { public StairstepChart() { InitializeComponent(); } private void rootGrid_SizeChanged(object sender, SizeChangedEventArgs e) { myStairstepChart.Height = rootGrid.Height; myStairstepChart.Width = rootGrid.Width; AddData(); } private void AddData() { myStairstepChart.DataCollection.DataList.Clear(); myStairstepChart.ChartStyle.Title = "Stair Step Chart"; Specialized2DCharts.DataSeriesStairstep ds = new Specialized2DCharts.DataSeriesStairstep(); myStairstepChart.ChartStyle.Xmin = 0; myStairstepChart.ChartStyle.Xmax = 8; myStairstepChart.ChartStyle.Ymin = -1.5; myStairstepChart.ChartStyle.Ymax = 1.5; myStairstepChart.ChartStyle.XTick = 1; myStairstepChart.ChartStyle.YTick = 0.5; myStairstepChart.ChartStyle.GridlinePattern =
CHAPTER 9 ■ 2D CHART CONTROLS
365
Specialized2DCharts.ChartStyleGridlines.GridlinePatternEnum.Dot; myStairstepChart.ChartStyle.GridlineColor = Brushes.Black; // Draw the stair step chart: ds.StairstepLineColor = Brushes.Red; for (int i = 0; i < 50; i++) { ds.LineSeries.Points.Add(new Point(0.4 * i, Math.Sin(0.4 * i))); } ds.LineColor = Brushes.Black; ds.LinePattern = Specialized2DCharts.DataSeries.LinePatternEnum.Dash; ds.Symbols.SymbolType = Specialized2DCharts.Symbols.SymbolTypeEnum.Circle; myStairstepChart.DataCollection.DataList.Add(ds); } } }
This code is very similar to that used in Chapter 6 to create stair step charts in code directly. Running this example produces the same result as that shown in Figure 6-11.
Stem Chart Control In this section, you’ll learn how to create a stem chart control.
Implementation Add a new WPF User Control to the Specialized2DChartControl project and name it StemControl. Add to the current project the DataCollectionStem class from the Specialized2DCharts project presented in Chapter 6. When we convert the Windows application into a user control, we’ll try not to change or modify these classes from the original project.
Here is the XAML file for the stem control:
<UserControl x:Class="Specialized2DChartControl.StemControl" xmlns="http://schemas.microsoft.com/winfx/2006/xaml/presentation" xmlns:x="http://schemas.microsoft.com/winfx/2006/xaml" Height="400" Width="500"> <Grid Name="grid1" Margin="10"> <Grid.ColumnDefinitions> <ColumnDefinition Width="Auto"/> <ColumnDefinition Name="column1" Width="*"/> </Grid.ColumnDefinitions> <Grid.RowDefinitions> <RowDefinition Height="Auto"/> <RowDefinition Name="row1" Height="*"/> <RowDefinition Height="Auto"/> </Grid.RowDefinitions> <TextBlock Margin="2" x:Name="tbTitle" Grid.Column="1" Grid.Row="0" RenderTransformOrigin="0.5,0.5" FontSize="14" FontWeight="Bold" HorizontalAlignment="Stretch" VerticalAlignment="Stretch" TextAlignment="Center" Text="Title"/> <TextBlock Margin="2" x:Name="tbXLabel" Grid.Column="1" Grid.Row="2"

CHAPTER 9 ■ 2D CHART CONTROLS
366
RenderTransformOrigin="0.5,0.5" TextAlignment="Center" Text="X Axis"/> <TextBlock Margin="2" Name="tbYLabel" Grid.Column="0" Grid.Row="1" RenderTransformOrigin="0.5,0.5" TextAlignment="Center" Text="Y Axis"> <TextBlock.LayoutTransform> <RotateTransform Angle="-90"/> </TextBlock.LayoutTransform> </TextBlock> <Grid Margin="0" x:Name ="chartGrid" Grid.Column="1" Grid.Row="1" ClipToBounds="True" Background="Transparent" SizeChanged="chartGrid_SizeChanged" /> <Canvas Margin="2" Name="textCanvas" ClipToBounds="True" Grid.Column="1" Grid.Row="1"> <Canvas Name="chartCanvas" ClipToBounds="True"> <Canvas Name="legendCanvas" Background="Transparent"/> </Canvas> </Canvas> </Grid> </UserControl>
This markup is basically the same as that used in creating a WPF Windows application for stem charts. Next, we need to design the public interface that the bar chart control exposes to the outside world.
Here, we only define necessary public properties in the control. Add the following code to the code-behind file:
using System; using System.Windows; using System.Windows.Controls; using System.Windows.Media; using Specialized2DCharts; namespace Specialized2DChartControl { public partial class StemControl : UserControl { private ChartStyleGridlines cs; private DataCollectionStem dc; private DataSeries ds; public StemControl() { InitializeComponent(); cs = new ChartStyleGridlines(); dc = new DataCollectionStem(); ds = new DataSeries(); cs.TextCanvas = textCanvas; cs.ChartCanvas = chartCanvas; } private void chartGrid_SizeChanged(object sender, SizeChangedEventArgs e) { textCanvas.Width = chartGrid.ActualWidth; textCanvas.Height = chartGrid.ActualHeight;

CHAPTER 9 ■ 2D CHART CONTROLS
367
legendCanvas.Children.Clear(); chartCanvas.Children.RemoveRange(1, chartCanvas.Children.Count - 1); textCanvas.Children.RemoveRange(1, textCanvas.Children.Count - 1); AddChart(); } private void AddChart() { cs.AddChartStyle(tbTitle, tbXLabel, tbYLabel); if (dc.DataList.Count != 0) { dc.AddStems(cs); } } public ChartStyleGridlines ChartStyle { get { return cs; } set { cs = value; } } public DataCollectionStem DataCollection { get { return dc; } set { dc = value; } } public DataSeries DataSeries { get { return ds; } set { ds = value; } } } }
Here, as before, we define only three public properties, which are related directly to the ChartStyleGridlines, DataSeriesStem, and DataCollectionStem objects. These three properties set up an interface between the user control and the original corresponding classes and allow you to access the public properties and methods inside these classes.
Creating Stem Charts Here, I’ll show you how to use the stem chart control to create stem charts. Open the Specialized2DChartControl project. Add a new WPF Window to the Specialized2DChartControlTest project and name it StemChart. The layout of the example is very simple; you create it using the following XAML:
<Window x:Class="Specialized2DChartControlTest.StemChart" xmlns="http://schemas.microsoft.com/winfx/2006/xaml/presentation" xmlns:x="http://schemas.microsoft.com/winfx/2006/xaml" xmlns:local="clr-namespace:Specialized2DChartControl; assembly=Specialized2DChartControl" Title="StemChart" Height="350" Width="400">

CHAPTER 9 ■ 2D CHART CONTROLS
368
<Grid x:Name="rootGrid" SizeChanged="rootGrid_SizeChanged"> <local:StemControl x:Name="myStemChart"/> </Grid> </Window>
Here is the corresponding code-behind file:
using System; using System.Collections.Generic; using System.Windows; using System.Windows.Controls; using System.Windows.Media; namespace Specialized2DChartControlTest { public partial class StemChart : Window { public StemChart() { InitializeComponent(); } private void rootGrid_SizeChanged(object sender, SizeChangedEventArgs e) { myStemChart.Height = rootGrid.Height; myStemChart.Width = rootGrid.Width; AddData(); } private void AddData() { myStemChart.DataCollection.DataList.Clear(); Specialized2DCharts.DataSeries ds = new Specialized2DCharts.DataSeries(); myStemChart.ChartStyle.Title = "Stem Chart"; myStemChart.ChartStyle.Xmin = 0; myStemChart.ChartStyle.Xmax = 8; myStemChart.ChartStyle.Ymin = -1.5; myStemChart.ChartStyle.Ymax = 1.5; myStemChart.ChartStyle.XTick = 1; myStemChart.ChartStyle.YTick = 0.5; myStemChart.ChartStyle.GridlinePattern = Specialized2DCharts.ChartStyleGridlines.GridlinePatternEnum.Dot; myStemChart.ChartStyle.GridlineColor = Brushes.Black; // Draw the stair step chart: for (int i = 0; i < 50; i++) { ds.LineSeries.Points.Add(new Point(0.4 * i, Math.Sin(0.4 * i))); } ds.LineColor = Brushes.Red; ds.Symbols.SymbolType = Specialized2DCharts.Symbols.SymbolTypeEnum.Diamond;

CHAPTER 9 ■ 2D CHART CONTROLS
369
ds.Symbols.FillColor = Brushes.Yellow; ds.Symbols.BorderColor = Brushes.DarkGreen; myStemChart.DataCollection.DataList.Add(ds); } } }
This code is very similar to that used in Chapter 6 to create stem charts in code directly. Running this example produces the same output as that shown in Figure 6-12.
Error Bar Control In this section, you’ll learn how to create an error bar chart control.
Implementation Add a new WPF User Control to the Specialized2DChartControl project and name it ErrorbarsControl. Add to the current project the DataSeriesErrorbar and DataCollectionErrorbar classes from the Specialized2DCharts project presented in Chapter 6. When we convert the Windows application into a user control, we’ll try not to change or modify these classes from the original project.
Here is the XAML file for the stem control:
<UserControl x:Class="Specialized2DChartControl.ErrorbarsControl" xmlns="http://schemas.microsoft.com/winfx/2006/xaml/presentation" xmlns:x="http://schemas.microsoft.com/winfx/2006/xaml" Height="400" Width="500"> <Grid Name="grid1" Margin="10"> <Grid.ColumnDefinitions> <ColumnDefinition Width="Auto"/> <ColumnDefinition Name="column1" Width="*"/> </Grid.ColumnDefinitions> <Grid.RowDefinitions> <RowDefinition Height="Auto"/> <RowDefinition Name="row1" Height="*"/> <RowDefinition Height="Auto"/> </Grid.RowDefinitions> <TextBlock Margin="2" x:Name="tbTitle" Grid.Column="1" Grid.Row="0" RenderTransformOrigin="0.5,0.5" FontSize="14" FontWeight="Bold" HorizontalAlignment="Stretch" VerticalAlignment="Stretch" TextAlignment="Center" Text="Title"/> <TextBlock Margin="2" x:Name="tbXLabel" Grid.Column="1" Grid.Row="2" RenderTransformOrigin="0.5,0.5" TextAlignment="Center" Text="X Axis"/> <TextBlock Margin="2" Name="tbYLabel" Grid.Column="0" Grid.Row="1" RenderTransformOrigin="0.5,0.5" TextAlignment="Center" Text="Y Axis"> <TextBlock.LayoutTransform> <RotateTransform Angle="-90"/> </TextBlock.LayoutTransform> </TextBlock> <Grid Margin="0" x:Name ="chartGrid" Grid.Column="1" Grid.Row="1" ClipToBounds="True" Background="Transparent"

CHAPTER 9 ■ 2D CHART CONTROLS
370
SizeChanged="chartGrid_SizeChanged" /> <Canvas Margin="2" Name="textCanvas" ClipToBounds="True" Grid.Column="1" Grid.Row="1"> <Canvas Name="chartCanvas" ClipToBounds="True"/> </Canvas> </Grid> </UserControl>
This XAML file is basically the same as that used in creating the WPF Window Application for error bar charts presented in Chapter 6.
Next, we need to design the public interface that the error bar chart control exposes to the outside world. Here, we only define necessary public properties in the control. Add the following code to the code-behind file:
using System; using System.Windows; using System.Windows.Controls; using System.Windows.Media; using Specialized2DCharts; namespace Specialized2DChartControl { public partial class ErrorbarsControl : UserControl { private ChartStyleGridlines cs; private DataCollectionErrorbar dc; private DataSeriesErrorbar ds; public ErrorbarsControl() { InitializeComponent(); cs = new ChartStyleGridlines(); dc = new DataCollectionErrorbar(); ds = new DataSeriesErrorbar(); cs.TextCanvas = textCanvas; cs.ChartCanvas = chartCanvas; } private void chartGrid_SizeChanged(object sender, SizeChangedEventArgs e) { textCanvas.Width = chartGrid.ActualWidth; textCanvas.Height = chartGrid.ActualHeight; chartCanvas.Children.Clear(); textCanvas.Children.RemoveRange(1, textCanvas.Children.Count - 1); AddChart(); } private void AddChart() { cs.AddChartStyle(tbTitle, tbXLabel, tbYLabel); if (dc.DataList.Count != 0) { dc.AddErrorbars(cs); dc.AddLines(cs);
CHAPTER 9 ■ 2D CHART CONTROLS
371
} } public ChartStyleGridlines ChartStyle { get { return cs; } set { cs = value; } } public DataCollectionErrorbar DataCollection { get { return dc; } set { dc = value; } } public DataSeriesErrorbar DataSeries { get { return ds; } set { ds = value; } } } }
Here, as before, we define only three public properties, which are related directly to the ChartStyleGridlines, DataSeriesErrorbar, and DataCollectionErrorbar objects. These three properties set up an interface between the user control and the original corresponding classes and allow you to access the public properties and methods inside these classes.
Creating Error Bar Charts Here, I’ll show you how to use the error bar chart control to create charts with error bars. Open the Specialized2DChartControl project. Add a new WPF Window to the Specialized2DChartControlTest project and name it ErrorBars. The layout of the example is very simple; you create it using the following XAML:
<Window x:Class="Specialized2DChartControlTest.ErrorBars" xmlns="http://schemas.microsoft.com/winfx/2006/xaml/presentation" xmlns:x="http://schemas.microsoft.com/winfx/2006/xaml" xmlns:local="clr-namespace:Specialized2DChartControl; assembly=Specialized2DChartControl" Title="ErrorBars" Height="300" Width="300"> <Grid x:Name="rootGrid" SizeChanged="rootGrid_SizeChanged"> <local:ErrorbarsControl x:Name="myErrorbar"/> </Grid> </Window>
And the corresponding code-behind file is given below:
using System; using System.Windows; using System.Windows.Controls; using System.Windows.Media;
CHAPTER 9 ■ 2D CHART CONTROLS
372
namespace Specialized2DChartControlTest { public partial class ErrorBars : Window { public ErrorBars() { InitializeComponent(); } private void rootGrid_SizeChanged(object sender, SizeChangedEventArgs e) { myErrorbar.Height = rootGrid.ActualHeight; myErrorbar.Width = rootGrid.ActualWidth; AddData(); } private void AddData() { myErrorbar.DataCollection.DataList.Clear(); myErrorbar.DataCollection.ErrorList.Clear(); Specialized2DCharts.DataSeriesErrorbar ds = new Specialized2DCharts.DataSeriesErrorbar(); myErrorbar.ChartStyle.Title = "Error Bar Chart"; myErrorbar.ChartStyle.Xmin = 0; myErrorbar.ChartStyle.Xmax = 12; myErrorbar.ChartStyle.Ymin = -1; myErrorbar.ChartStyle.Ymax = 6; myErrorbar.ChartStyle.XTick = 2; myErrorbar.ChartStyle.YTick = 1; myErrorbar.ChartStyle.GridlinePattern= Specialized2DCharts.ChartStyleGridlines.GridlinePatternEnum.Dot; myErrorbar.ChartStyle.GridlineColor = Brushes.Black; ds.LineColor = Brushes.Blue; ds.Symbols.SymbolType= Specialized2DCharts.Symbols.SymbolTypeEnum.Circle; ds.Symbols.BorderColor = Brushes.DarkGreen; ds.ErrorLineColor = Brushes.Red; for (int i = 2; i < 22; i++) { ds.LineSeries.Points.Add( new Point(0.5 * i, 10.0 * Math.Exp(-0.5 * i))); ds.ErrorLineSeries.Points.Add(new Point(0.5 * i, 3.0 / (0.5 * i))); } myErrorbar.DataCollection.DataList.Add(ds); } } }
This code is very similar to that used in creating error bar charts directly in code in Chapter 6. Running this example produces the same result as that shown in Figure 6-13.

CHAPTER 9 ■ 2D CHART CONTROLS
373
Area Chart Control In this section, we’ll discuss how to create an area chart control.
Implementation Add a new WPF User Control to the Specialized2DChartControl project and name it AreaControl. Add to the current project the DataSeriesArea and DataCollectionArea classes from the Specialized2DCharts project presented in Chapter 6. When we convert the Window Application into a user control, we’ll try not to change or modify these classes from the original project.
Here is the XAML file for the area control:
<UserControl x:Class="Specialized2DChartControl.AreaControl" xmlns="http://schemas.microsoft.com/winfx/2006/xaml/presentation" xmlns:x="http://schemas.microsoft.com/winfx/2006/xaml" Height="400" Width="500"> <Grid Name="grid1" Margin="10"> <Grid.ColumnDefinitions> <ColumnDefinition Width="Auto"/> <ColumnDefinition Name="column1" Width="*"/> </Grid.ColumnDefinitions> <Grid.RowDefinitions> <RowDefinition Height="Auto"/> <RowDefinition Name="row1" Height="*"/> <RowDefinition Height="Auto"/> </Grid.RowDefinitions> <TextBlock Margin="2" x:Name="tbTitle" Grid.Column="1" Grid.Row="0" RenderTransformOrigin="0.5,0.5" FontSize="14" FontWeight="Bold" HorizontalAlignment="Stretch" VerticalAlignment="Stretch" TextAlignment="Center" Text="Title"/> <TextBlock Margin="2" x:Name="tbXLabel" Grid.Column="1" Grid.Row="2" RenderTransformOrigin="0.5,0.5" TextAlignment="Center" Text="X Axis"/> <TextBlock Margin="2" Name="tbYLabel" Grid.Column="0" Grid.Row="1" RenderTransformOrigin="0.5,0.5" TextAlignment="Center" Text="Y Axis"> <TextBlock.LayoutTransform> <RotateTransform Angle="-90"/> </TextBlock.LayoutTransform> </TextBlock> <Grid Margin="0" x:Name ="chartGrid" Grid.Column="1" Grid.Row="1" ClipToBounds="True" Background="Transparent" SizeChanged="chartGrid_SizeChanged" /> <Canvas Margin="2" Name="textCanvas" ClipToBounds="True" Grid.Column="1" Grid.Row="1"> <Canvas Name="chartCanvas" ClipToBounds="True"> </Canvas> </Canvas> </Grid> </UserControl>
This XAML layout is basically the same as that used in creating a WPF Windows application for area charts.

CHAPTER 9 ■ 2D CHART CONTROLS
374
Next, we need to design the public interface that the bar chart control exposes to the outside world. Here, we only define necessary public properties in the control. Add the following code to the code-behind file:
using System; using System.Windows; using System.Windows.Controls; using System.Windows.Media; using Specialized2DCharts; namespace Specialized2DChartControl { public partial class AreaControl : UserControl { private ChartStyleGridlines cs; private DataCollectionArea dc; private DataSeriesArea area; public AreaControl() { InitializeComponent(); cs = new ChartStyleGridlines(); dc = new DataCollectionArea(); area = new DataSeriesArea(); cs.ChartCanvas = chartCanvas; cs.TextCanvas = textCanvas; } private void chartGrid_SizeChanged(object sender, SizeChangedEventArgs e) { textCanvas.Width = chartGrid.ActualWidth; textCanvas.Height = chartGrid.ActualHeight; chartCanvas.Children.Clear(); textCanvas.Children.RemoveRange(1, textCanvas.Children.Count - 1); AddChart(); } private void AddChart() { cs.AddChartStyle(tbTitle, tbXLabel, tbYLabel); if (dc.AreaList.Count != 0) { dc.AddAreas(cs); } } public ChartStyleGridlines ChartStyle { get { return cs; } set { cs = value; } } public DataCollectionArea DataCollection {
CHAPTER 9 ■ 2D CHART CONTROLS
375
get { return dc; } set { dc = value; } } public DataSeriesArea DataSeries { get { return area; } set { area = value; } } } }
Here, we also define only three public properties, which are related directly to the ChartStyleGridlines, DataSeriesArea, and DataCollectionArea objects. These three properties set up an interface between the user control and the original corresponding classes and allow you to access the public properties and methods inside these classes.
Creating Area Charts Here, I’ll show you how to use the area chart control to create area charts. Open the Specialized2DChartControl project. Add a new WPF Window to the Specialized2DChartControlTest project and name it AreaChart. The layout of the example is very simple; you create it using the following XAML:
<Window x:Class="Specialized2DChartControlTest.AreaChart" xmlns="http://schemas.microsoft.com/winfx/2006/xaml/presentation" xmlns:x="http://schemas.microsoft.com/winfx/2006/xaml" xmlns:local="clr-namespace:Specialized2DChartControl; assembly=Specialized2DChartControl" Title="AreaChart" Height="300" Width="300"> <Grid x:Name="rootGrid" SizeChanged="rootGrid_SizeChanged"> <local:AreaControl x:Name="myAreaChart"/> </Grid> </Window>
Here is the corresponding code-behind file for this example:
using System; using System.Windows; using System.Windows.Controls; using System.Windows.Media; namespace Specialized2DChartControlTest { public partial class AreaChart : Window { public AreaChart() { InitializeComponent(); }

CHAPTER 9 ■ 2D CHART CONTROLS
376
private void rootGrid_SizeChanged(object sender, SizeChangedEventArgs e) { myAreaChart.Height = rootGrid.Height; myAreaChart.Width = rootGrid.ActualWidth; AddData(); } private void AddData() { myAreaChart.DataCollection.AreaList.Clear(); Specialized2DCharts.DataSeriesArea area = new Specialized2DCharts.DataSeriesArea(); myAreaChart.ChartStyle.Title = "Area Chart"; myAreaChart.ChartStyle.Xmin = 0; myAreaChart.ChartStyle.Xmax = 10; myAreaChart.ChartStyle.Ymin = 0; myAreaChart.ChartStyle.Ymax = 10; myAreaChart.ChartStyle.XTick = 2; myAreaChart.ChartStyle.YTick = 2; myAreaChart.ChartStyle.GridlinePattern= Specialized2DCharts.ChartStyleGridlines.GridlinePatternEnum.Dot; myAreaChart.ChartStyle.GridlineColor = Brushes.Black; // Add sine data: area = new Specialized2DCharts.DataSeriesArea(); area.BorderColor = Brushes.Black; area.FillColor = Brushes.LightPink; for (int i = 0; i < 21; i++) { area.AreaSeries.Points.Add( new Point(0.5 * i, 2.0 + Math.Sin(0.5 * i))); } myAreaChart.DataCollection.AreaList.Add(area); // Add cosine data: area = new Specialized2DCharts.DataSeriesArea(); area.BorderColor = Brushes.Black; area.FillColor = Brushes.LightBlue; for (int i = 0; i < 21; i++) { area.AreaSeries.Points.Add( new Point(0.5 * i, 2.0 + Math.Cos(0.5 * i))); } myAreaChart.DataCollection.AreaList.Add(area); // Add another sine data: area = new Specialized2DCharts.DataSeriesArea(); area.BorderColor = Brushes.Black; area.FillColor = Brushes.LightGreen; for (int i = 0; i < 21; i++) { area.AreaSeries.Points.Add( new Point(0.5 * i, 3.0 + Math.Sin(0.5 * i)));

CHAPTER 9 ■ 2D CHART CONTROLS
377
} myAreaChart.DataCollection.AreaList.Add(area); } } }
This code is very similar to that used in Chapter 6 to create area charts directly in code. Running this example produces the same result as that shown in Figure 6-14.
Polar Chart Control In this section, I’ll show you how to create the polar chart control.
Implementation Add a new WPF User Control to the Specialized2DChartControl project and name it PolarControl. Add to the current project the ChartStylePolar and DataCollectionpolar classes from the Specialized2DCharts project presented in Chapter 6. When we convert the Windows application into a user control, we’ll try not to change or modify these classes from the original project.
Here is the XAML file for the stem control:
<UserControl x:Class="Specialized2DChartControl.PolarControl" xmlns="http://schemas.microsoft.com/winfx/2006/xaml/presentation" xmlns:x="http://schemas.microsoft.com/winfx/2006/xaml" Height="400" Width="500"> <Grid Name="grid1" Margin="10"> <Grid.ColumnDefinitions> <ColumnDefinition Width="30"/> <ColumnDefinition Name="column1" Width="*"/> <ColumnDefinition Width="30"/> </Grid.ColumnDefinitions> <Grid.RowDefinitions> <RowDefinition Height="30"/> <RowDefinition Name="row1" Height="*"/> <RowDefinition Height="30"/> </Grid.RowDefinitions> <Grid Margin="0" x:Name ="chartGrid" Grid.Column="1" Grid.Row="1" ClipToBounds="False" Background="Transparent" SizeChanged="chartGrid_SizeChanged" /> <Canvas Margin="2" Name="chartCanvas" ClipToBounds="False" Grid.Column="1" Grid.Row="1"/> </Grid> </UserControl>
This XAML layout is basically the same as that used in creating a WPF Windows application for polar charts.
Next, we need to design the public interface that the bar chart control exposes to the outside world. Here, we only define necessary public properties in the control. Add the following code to the code-behind file:
using System; using System.Windows; using System.Windows.Controls;

CHAPTER 9 ■ 2D CHART CONTROLS
378
using System.Windows.Media; using Specialized2DCharts; namespace Specialized2DChartControl { public partial class PolarControl : UserControl { private ChartStylePolar cs; private DataCollectionPolar dc; private DataSeries ds; public PolarControl() { InitializeComponent(); cs = new ChartStylePolar(); dc = new DataCollectionPolar(); ds = new DataSeries(); cs.ChartCanvas = chartCanvas; } private void chartGrid_SizeChanged(object sender, SizeChangedEventArgs e) { double width = chartGrid.ActualWidth; double height = chartGrid.ActualHeight; double side = width; if (width > height) side = height; chartCanvas.Width = side; chartCanvas.Height = side; chartCanvas.Children.Clear(); AddChart(); } private void AddChart() { cs.SetPolarAxes(); if (dc.DataList.Count != 0) { dc.AddPolar(cs); } } public ChartStylePolar ChartStyle { get { return cs; } set { cs = value; } } public DataCollectionPolar DataCollection { get { return dc; } set { dc = value; } }

CHAPTER 9 ■ 2D CHART CONTROLS
379
public DataSeries DataSeries { get { return ds; } set { ds = value; } } } }
Here, we also define only three public properties, which are related directly to the ChartStylePolar, DataSeries, and DataCollectionPolar objects. These three properties set up an interface between the user control and original corresponding classes and allow you to access the public properties and methods inside these classes.
Creating Polar Charts Here, I’ll show you how to use the polar chart control to create polar charts. Open the Specialized2DChartControl project. Add a new WPF Window to the Specialized2DChartControlTest project and name it PolarChart. The layout of the example is very simple; you create it using the following XAML:
<Window x:Class="Specialized2DChartControlTest.PolarChart" xmlns="http://schemas.microsoft.com/winfx/2006/xaml/presentation" xmlns:x="http://schemas.microsoft.com/winfx/2006/xaml" xmlns:local="clr-namespace:Specialized2DChartControl; assembly=Specialized2DChartControl" Title="PolarChart" Height="300" Width="300"> <Grid x:Name="rootGrid" SizeChanged="rootGrid_SizeChanged"> <local:PolarControl x:Name="myPolarChart"/> </Grid> </Window>
Here is the corresponding code-behind file:
using System; using System.Windows; using System.Windows.Controls; using System.Windows.Media; namespace Specialized2DChartControlTest { public partial class PolarChart : Window { public PolarChart() { InitializeComponent(); } private void rootGrid_SizeChanged(object sender, SizeChangedEventArgs e) { myPolarChart.Height = rootGrid.ActualHeight; myPolarChart.Width = rootGrid.ActualWidth; AddData1(); }

CHAPTER 9 ■ 2D CHART CONTROLS
380
private void AddData() { myPolarChart.DataCollection.DataList.Clear(); Specialized2DCharts.DataSeries ds = new Specialized2DCharts.DataSeries(); myPolarChart.ChartStyle.Rmax = 0.5; myPolarChart.ChartStyle.Rmin = 0; myPolarChart.ChartStyle.NTicks = 4; myPolarChart.ChartStyle.AngleStep = 30; myPolarChart.ChartStyle.AngleDirection= Specialized2DCharts.ChartStylePolar.AngleDirectionEnum.CounterClockWise; myPolarChart.ChartStyle.LinePattern= Specialized2DCharts.ChartStylePolar.LinePatternEnum.Dot; myPolarChart.ChartStyle.LineColor = Brushes.Black; ds.LineColor = Brushes.Red; for (int i = 0; i < 360; i++) { double theta = 1.0 * i; double r = Math.Abs(Math.Cos(2.0 * theta * Math.PI / 180) * Math.Sin(2.0 * theta * Math.PI / 180)); ds.LineSeries.Points.Add(new Point(theta, r)); } myPolarChart.DataCollection.DataList.Add(ds); } private void AddData1() { myPolarChart.DataCollection.DataList.Clear(); Specialized2DCharts.DataSeries ds = new Specialized2DCharts.DataSeries(); myPolarChart.ChartStyle.Rmax = 1; myPolarChart.ChartStyle.Rmin = -7; myPolarChart.ChartStyle.NTicks = 4; myPolarChart.ChartStyle.AngleStep = 30; myPolarChart.ChartStyle.AngleDirection = Specialized2DCharts.ChartStylePolar.AngleDirectionEnum.CounterClockWise; myPolarChart.ChartStyle.LinePattern = Specialized2DCharts.ChartStylePolar.LinePatternEnum.Dot; myPolarChart.ChartStyle.LineColor = Brushes.Black; ds= new Specialized2DCharts.DataSeries(); ds.LineColor = Brushes.Red; for (int i = 0; i < 361; i++) { double theta = 1.0 * i; double r = Math.Log(1.001 + Math.Sin(2 * theta * Math.PI / 180)); ds.LineSeries.Points.Add(new Point(theta, r)); } myPolarChart.DataCollection.DataList.Add(ds);

CHAPTER 9 ■ 2D CHART CONTROLS
381
ds = new Specialized2DCharts.DataSeries(); ds.LineColor = Brushes.Blue; for (int i = 0; i < 361; i++) { double theta = 1.0 * i; double r = Math.Log(1.001 + Math.Cos(2 * theta * Math.PI / 180)); ds.LineSeries.Points.Add(new Point(theta, r)); } myPolarChart.DataCollection.DataList.Add(ds); } } }
This code is very similar to that used in Chapter 6 to create polar charts in code directly. Running this example produces the result shown in Figure 9-5.
Figure 9-5. Polar chart created using the PolarControl
Pie Chart Control Finally, I’ll show you how to create a pie chart control.
Implementation Add a new WPF User Control to the Specialized2DChartControl project and name it PieControl. Add to the current project the PieStyle and PieLegend classes from the Specialized2DCharts project presented in
CHAPTER 9 ■ 2D CHART CONTROLS
382
Chapter 6. When we convert the Windows application into a user control, we’ll try not to change or modify these classes from the original project.
Here is the XAML file for the pie chart control:
<UserControl x:Class="Specialized2DChartControl.PieControl" xmlns="http://schemas.microsoft.com/winfx/2006/xaml/presentation" xmlns:x="http://schemas.microsoft.com/winfx/2006/xaml" Height="400" Width="500"> <Grid Name="grid1" Margin="10"> <Grid.ColumnDefinitions> <ColumnDefinition Width="30"/> <ColumnDefinition Name="column1" Width="*"/> <ColumnDefinition Width="auto"/> <ColumnDefinition Width="30"/> </Grid.ColumnDefinitions> <Grid.RowDefinitions> <RowDefinition Height="30"/> <RowDefinition Name="row1" Height="*"/> <RowDefinition Height="30"/> </Grid.RowDefinitions> <Grid Margin="0" x:Name ="chartGrid" Grid.Column="1" Grid.Row="1" ClipToBounds="False" Background="Transparent" SizeChanged="chartGrid_SizeChanged" /> <Canvas Margin="0,0,0,20" Name="chartCanvas" ClipToBounds="False" Grid.Column="1" Grid.Row="1"/> <Canvas Margin="2" Name="legendCanvas" Grid.Column="2" Grid.Row="1" HorizontalAlignment="Left"/> </Grid> </UserControl>
This XAML layout is basically the same as that used in creating a WPF Windows application for pie charts.
Next, we need to design the public interface that the pie chart control exposes to the outside world. Here, we only define necessary public properties in the control. Add the following code to the code-behind file:
using System; using System.Windows; using System.Windows.Controls; using Specialized2DCharts; namespace Specialized2DChartControl { public partial class PieControl : UserControl { private PieStyle ps; private PieLegend pl; public PieControl() { InitializeComponent(); ps = new PieStyle(); pl = new PieLegend(); }

CHAPTER 9 ■ 2D CHART CONTROLS
383
private void chartGrid_SizeChanged(object sender, SizeChangedEventArgs e) { double width = chartGrid.ActualWidth; double height = chartGrid.ActualHeight; double side = width; if (width > height) side = height; chartCanvas.Width = side; chartCanvas.Height = side; chartCanvas.Children.Clear(); legendCanvas.Children.Clear(); AddChart(); } private void AddChart() { if (ps.DataList.Count != 0) { ps.AddPie(chartCanvas); if (pl.IsLegendVisible) { pl.AddLegend(legendCanvas, ps); } } } public PieStyle PieStyle { get { return ps; } set { ps = value; } } public PieLegend PieLegend { get { return pl; } set { pl = value; } } } }
Here, we also define only two public properties, which are related directly to the PieStyle and PieLegend objects. These two properties set up an interface between the user control and the original corresponding classes and allow you to access the public properties and methods inside these classes.
Creating Pie Charts Here, I’ll show you how to use the pie chart control to create pie charts. Open the Specialized2DChartControl project. Add a new WPF Window to the Specialized2DChartControlTest project and name it PieChart. The layout of the example is very simple; you create it using the following XAML:
<Window x:Class="Specialized2DChartControlTest.PieChart"

CHAPTER 9 ■ 2D CHART CONTROLS
384
xmlns="http://schemas.microsoft.com/winfx/2006/xaml/presentation" xmlns:x="http://schemas.microsoft.com/winfx/2006/xaml" xmlns:local="clr-namespace:Specialized2DChartControl; assembly=Specialized2DChartControl" Title="PieChart" Height="300" Width="400"> <Grid x:Name="rootGrid" SizeChanged="rootGrid_SizeChanged"> <local:PieControl x:Name="myPieChart"/> </Grid> </Window>
Here is the corresponding code-behind file:
using System; using System.Collections.Generic; using System.Windows; using System.Windows.Controls; namespace Specialized2DChartControlTest { public partial class PieChart : Window { public PieChart() { InitializeComponent(); } private void rootGrid_SizeChanged(object sender, SizeChangedEventArgs e) { myPieChart.Height = rootGrid.ActualHeight; myPieChart.Width = rootGrid.ActualWidth; AddData(); } private void AddData() { myPieChart.PieStyle = new Specialized2DCharts.PieStyle(); myPieChart.PieLegend = new Specialized2DCharts.PieLegend(); double[] data = new double[] { 30, 35, 15, 10, 8 }; int[] explode = new int[] { 20, 0, 20, 0, 0 }; string[] labels = new string[] { "Soc. Sec. Tax", "Income Tax", "Borrowing", "Corp. Tax", "Misc." }; for (int i = 0; i < data.Length; i++) { myPieChart.PieStyle.DataList.Add(data[i]); myPieChart.PieStyle.ExplodeList.Add(explode[i]); myPieChart.PieStyle.LabelList.Add(labels[i]); } myPieChart.PieStyle.ColormapBrushes.ColormapBrushType= Specialized2DCharts.ColormapBrush.ColormapBrushEnum.Summer; myPieChart.PieLegend.IsLegendVisible = true; } } }

CHAPTER 9 ■ 2D CHART CONTROLS
385
This code is very similar to that used in Chapter 6 to create pie charts directly in code. Running this example generates the output shown in Figure 9-6.
Figure 9-6. Pie chart created using the PieControl
Creating Multiple Charts In the previous sections, we discussed a variety of specialized chart controls and demonstrated how to use them in WPF applications. In practice, you can also use different chart controls in a single WPF application. Here, I’ll show you how to accomplish this.
Open the Specialized2DChartControl project. Add a new WPF Window to the Specialized2DChartControlTest project and name it MultipleCharts. The layout of the example is very simple; you create it using the following XAML:
<Window x:Class="Specialized2DChartControlTest.MultipleCharts" xmlns="http://schemas.microsoft.com/winfx/2006/xaml/presentation" xmlns:x="http://schemas.microsoft.com/winfx/2006/xaml" xmlns:local="clr-namespace:Specialized2DChartControl; assembly=Specialized2DChartControl" Title="MultipleCharts" Height="700" Width="550"> <Grid> <Grid.ColumnDefinitions> <ColumnDefinition/> <ColumnDefinition/> </Grid.ColumnDefinitions> <Grid.RowDefinitions> <RowDefinition/> <RowDefinition/>

CHAPTER 9 ■ 2D CHART CONTROLS
386
<RowDefinition/> </Grid.RowDefinitions> <Grid x:Name="grid1" SizeChanged="grid1_SizeChanged" Grid.Column="0" Grid.Row="0"> <local:StemControl x:Name="chart1"/> </Grid> <Grid x:Name="grid2" SizeChanged="grid2_SizeChanged" Grid.Column="1" Grid.Row="0"> <local:StairstepControl x:Name="chart2"/> </Grid> <Grid x:Name="grid3" SizeChanged="grid3_SizeChanged" Grid.Column="0" Grid.Row="1"> <local:AreaControl x:Name="chart3"/> </Grid> <Grid x:Name="grid4" SizeChanged="grid4_SizeChanged" Grid.Column="1" Grid.Row="1"> <local:ErrorbarsControl x:Name="chart4"/> </Grid> <Grid x:Name="grid5" SizeChanged="grid5_SizeChanged" Grid.Column="0" Grid.Row="2"> <local:BarControl x:Name="chart5"/> </Grid> <Grid x:Name="grid6" SizeChanged="grid6_SizeChanged" Grid.Column="1" Grid.Row="2"> <local:PolarControl x:Name="chart6"/> </Grid> </Grid> </Window>
Here, we create six charts using six different chart controls. Here is the corresponding code-behind file:
using System; using System.Windows; using System.Windows.Controls; using System.Windows.Media; namespace Specialized2DChartControlTest { public partial class MultipleCharts : Window { public MultipleCharts() { InitializeComponent(); } private void grid1_SizeChanged(object sender, SizeChangedEventArgs e) { chart1.Width = grid1.ActualWidth; chart1.Height = grid1.ActualHeight; AddData1(); }

CHAPTER 9 ■ 2D CHART CONTROLS
387
private void grid2_SizeChanged(object sender, SizeChangedEventArgs e) { chart2.Width = grid2.ActualWidth; chart2.Height = grid2.ActualHeight; AddData2(); } private void grid3_SizeChanged(object sender, SizeChangedEventArgs e) { chart3.Width = grid3.ActualWidth; chart3.Height = grid3.ActualHeight; AddData3(); } private void grid4_SizeChanged(object sender, SizeChangedEventArgs e) { chart4.Width = grid4.ActualWidth; chart4.Height = grid4.ActualHeight; AddData4(); } private void grid5_SizeChanged(object sender, SizeChangedEventArgs e) { chart5.Width = grid5.ActualWidth; chart5.Height = grid5.ActualHeight; AddData5(); } private void grid6_SizeChanged(object sender, SizeChangedEventArgs e) { chart6.Width = grid6.ActualWidth; chart6.Height = grid6.ActualHeight; AddData6(); } private void AddData1() { chart1.DataCollection.DataList.Clear(); Specialized2DCharts.DataSeries ds = new Specialized2DCharts.DataSeries(); chart1.ChartStyle.Title = "Stem Chart"; chart1.ChartStyle.Xmin = 0; chart1.ChartStyle.Xmax = 8; chart1.ChartStyle.Ymin = -1.5; chart1.ChartStyle.Ymax = 1.5; chart1.ChartStyle.XTick = 1; chart1.ChartStyle.YTick = 0.5; chart1.ChartStyle.GridlinePattern = Specialized2DCharts.ChartStyleGridlines.GridlinePatternEnum.Dot; chart1.ChartStyle.GridlineColor = Brushes.Black; // Generate the stair step data:

CHAPTER 9 ■ 2D CHART CONTROLS
388
for (int i = 0; i < 50; i++) { ds.LineSeries.Points.Add(new Point(0.4 * i, Math.Sin(0.4 * i))); } ds.LineColor = Brushes.Red; ds.Symbols.SymbolType = Specialized2DCharts.Symbols.SymbolTypeEnum.Diamond; ds.Symbols.FillColor = Brushes.Yellow; ds.Symbols.BorderColor = Brushes.DarkGreen; chart1.DataCollection.DataList.Add(ds); } private void AddData2() { chart2.DataCollection.DataList.Clear(); chart2.ChartStyle.Title = "Stair Step Chart"; Specialized2DCharts.DataSeriesStairstep ds = new Specialized2DCharts.DataSeriesStairstep(); chart2.ChartStyle.Xmin = 0; chart2.ChartStyle.Xmax = 8; chart2.ChartStyle.Ymin = -1.5; chart2.ChartStyle.Ymax = 1.5; chart2.ChartStyle.XTick = 1; chart2.ChartStyle.YTick = 0.5; chart2.ChartStyle.GridlinePattern = Specialized2DCharts.ChartStyleGridlines.GridlinePatternEnum.Dot; chart2.ChartStyle.GridlineColor = Brushes.Black; // Draw the stair step chart: ds.StairstepLineColor = Brushes.Red; for (int i = 0; i < 50; i++) { ds.LineSeries.Points.Add(new Point(0.4 * i, Math.Sin(0.4 * i))); } ds.LineColor = Brushes.Black; ds.LinePattern = Specialized2DCharts.DataSeries.LinePatternEnum.Dash; ds.Symbols.SymbolType = Specialized2DCharts.Symbols.SymbolTypeEnum.Circle; chart2.DataCollection.DataList.Add(ds); } private void AddData3() { chart3.DataCollection.AreaList.Clear(); Specialized2DCharts.DataSeriesArea area = new Specialized2DCharts.DataSeriesArea(); chart3.ChartStyle.Title = "Area Chart"; chart3.ChartStyle.Xmin = 0; chart3.ChartStyle.Xmax = 10; chart3.ChartStyle.Ymin = 0; chart3.ChartStyle.Ymax = 10; chart3.ChartStyle.XTick = 2; chart3.ChartStyle.YTick = 2;

CHAPTER 9 ■ 2D CHART CONTROLS
389
chart3.ChartStyle.GridlinePattern = Specialized2DCharts.ChartStyleGridlines.GridlinePatternEnum.Dot; chart3.ChartStyle.GridlineColor = Brushes.Black; // Add sine data: area = new Specialized2DCharts.DataSeriesArea(); area.BorderColor = Brushes.Black; area.FillColor = Brushes.LightPink; for (int i = 0; i < 21; i++) { area.AreaSeries.Points.Add( new Point(0.5 * i, 2.0 + Math.Sin(0.5 * i))); } chart3.DataCollection.AreaList.Add(area); // Add cosine data: area = new Specialized2DCharts.DataSeriesArea(); area.BorderColor = Brushes.Black; area.FillColor = Brushes.LightBlue; for (int i = 0; i < 21; i++) { area.AreaSeries.Points.Add( new Point(0.5 * i, 2.0 + Math.Cos(0.5 * i))); } chart3.DataCollection.AreaList.Add(area); // Add another sine data: area = new Specialized2DCharts.DataSeriesArea(); area.BorderColor = Brushes.Black; area.FillColor = Brushes.LightGreen; for (int i = 0; i < 21; i++) { area.AreaSeries.Points.Add( new Point(0.5 * i, 3.0 + Math.Sin(0.5 * i))); } chart3.DataCollection.AreaList.Add(area); } private void AddData4() { chart4.DataCollection.DataList.Clear(); chart4.DataCollection.ErrorList.Clear(); Specialized2DCharts.DataSeriesErrorbar ds = new Specialized2DCharts.DataSeriesErrorbar(); chart4.ChartStyle.Title = "Error Bar Chart"; chart4.ChartStyle.Xmin = 0; chart4.ChartStyle.Xmax = 12; chart4.ChartStyle.Ymin = -1; chart4.ChartStyle.Ymax = 6; chart4.ChartStyle.XTick = 2; chart4.ChartStyle.YTick = 1; chart4.ChartStyle.GridlinePattern = Specialized2DCharts.ChartStyleGridlines.GridlinePatternEnum.Dot;
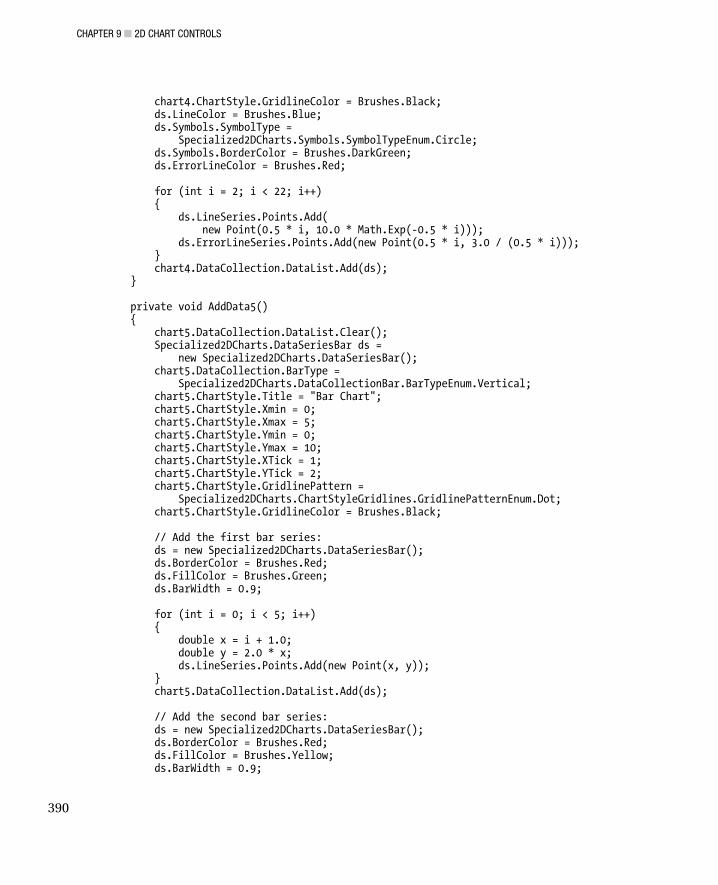
CHAPTER 9 ■ 2D CHART CONTROLS
390
chart4.ChartStyle.GridlineColor = Brushes.Black; ds.LineColor = Brushes.Blue; ds.Symbols.SymbolType = Specialized2DCharts.Symbols.SymbolTypeEnum.Circle; ds.Symbols.BorderColor = Brushes.DarkGreen; ds.ErrorLineColor = Brushes.Red; for (int i = 2; i < 22; i++) { ds.LineSeries.Points.Add( new Point(0.5 * i, 10.0 * Math.Exp(-0.5 * i))); ds.ErrorLineSeries.Points.Add(new Point(0.5 * i, 3.0 / (0.5 * i))); } chart4.DataCollection.DataList.Add(ds); } private void AddData5() { chart5.DataCollection.DataList.Clear(); Specialized2DCharts.DataSeriesBar ds = new Specialized2DCharts.DataSeriesBar(); chart5.DataCollection.BarType = Specialized2DCharts.DataCollectionBar.BarTypeEnum.Vertical; chart5.ChartStyle.Title = "Bar Chart"; chart5.ChartStyle.Xmin = 0; chart5.ChartStyle.Xmax = 5; chart5.ChartStyle.Ymin = 0; chart5.ChartStyle.Ymax = 10; chart5.ChartStyle.XTick = 1; chart5.ChartStyle.YTick = 2; chart5.ChartStyle.GridlinePattern = Specialized2DCharts.ChartStyleGridlines.GridlinePatternEnum.Dot; chart5.ChartStyle.GridlineColor = Brushes.Black; // Add the first bar series: ds = new Specialized2DCharts.DataSeriesBar(); ds.BorderColor = Brushes.Red; ds.FillColor = Brushes.Green; ds.BarWidth = 0.9; for (int i = 0; i < 5; i++) { double x = i + 1.0; double y = 2.0 * x; ds.LineSeries.Points.Add(new Point(x, y)); } chart5.DataCollection.DataList.Add(ds); // Add the second bar series: ds = new Specialized2DCharts.DataSeriesBar(); ds.BorderColor = Brushes.Red; ds.FillColor = Brushes.Yellow; ds.BarWidth = 0.9;

CHAPTER 9 ■ 2D CHART CONTROLS
391
for (int i = 0; i < 5; i++) { double x = i + 1.0; double y = 1.5 * x; ds.LineSeries.Points.Add(new Point(x, y)); } chart5.DataCollection.DataList.Add(ds); // Add the third bar series: ds = new Specialized2DCharts.DataSeriesBar(); ds.BorderColor = Brushes.Red; ds.FillColor = Brushes.Blue; ds.BarWidth = 0.9; for (int i = 0; i < 5; i++) { double x = i + 1.0; double y = 1.0 * x; ds.LineSeries.Points.Add(new Point(x, y)); } chart5.DataCollection.DataList.Add(ds); chart5.DataCollection.AddBars(chart5.ChartStyle); } private void AddData6() { chart6.DataCollection.DataList.Clear(); Specialized2DCharts.DataSeries ds = new Specialized2DCharts.DataSeries(); chart6.ChartStyle.Rmax = 0.5; chart6.ChartStyle.Rmin = 0; chart6.ChartStyle.NTicks = 4; chart6.ChartStyle.AngleStep = 30; chart6.ChartStyle.AngleDirection = Specialized2DCharts.ChartStylePolar. AngleDirectionEnum.CounterClockWise; chart6.ChartStyle.LinePattern = Specialized2DCharts.ChartStylePolar.LinePatternEnum.Dot; chart6.ChartStyle.LineColor = Brushes.Black; ds.LineColor = Brushes.Red; for (int i = 0; i < 360; i++) { double theta = 1.0 * i; double r = Math.Abs(Math.Cos(2.0 * theta * Math.PI / 180) * Math.Sin(2.0 * theta * Math.PI / 180)); ds.LineSeries.Points.Add(new Point(theta, r)); } chart6.DataCollection.DataList.Add(ds); } } }

CHAPTER 9 ■ 2D CHART CONTROLS
392
You should be familiar with the preceding code because we implemented it earlier when we created each individual chart control. Figure 9-7 shows the results of running this example.
Figure 9-7. Multiple charts created using different chart controls

C H A P T E R 10
■ ■ ■
393
Data Interpolations
In numerical analysis, interpolation is a method of constructing new data points within the range of a discrete set of known data points. In science and engineering, we often will have a number of data points obtained by sampling and experimentation, and we must try to construct a function that closely fits those data points. This process is usually called curve fitting or regression analysis. Interpolation can be regarded as a special case of curve fitting in which the function must pass exactly through the data points. This implicitly assumes that the given data points in an interpolation are accurate and distinct.
Suppose that a function y = f(x) is given only at discrete points such as (x0, y0), (x1, y1), …, (xn, yn). The purpose of interpolation is to find the y value at any other point of x besides the ones provided. In this chapter, we will present some popular methods for interpolating the function y = f(x). Most interpolation methods are based on the Taylor series expansion of a function f(x) about a specific value of x0. Each method manipulates the Taylor series differently to yield the interpolation algorithm.
Linear Interpolation Linear interpolation is a simple method of curve fitting based on linear polynomials. It is widely used in numerical analysis and computer graphics.
Algorithm As shown in Figure 10-1, if two known points are given by (x0, y0) and (x1, y1), the linear interpolation is the straight line between these two points. For any value of x in the range (x0, x1), the corresponding y value along the straight line can be found by the following relationship:

CHAPTER 10 ■ DATA INTERPOLATIONS
394
Figure 10-1. Linear interpolation: Given two points (x0, y0) and (x1, y1), the line between these two points is
the result of the linear interpolation.
The linear interpolation on a set of data points (x0, y0), (x1, y1), …, (xn, yn) is defined as the concatenation of linear interpolants between pairs of data points. This results in a continuous curve with a discontinuous derivative.
Implementation Here, we’ll implement the linear interpolation. Start with a new WPF Windows application and name it Interpolation. Add a new class, InterpolationAlgorithms, to the project. Here is the code listing for this class:
using System; using System.Collections.Generic; namespace Interpolation { public class InterpolationAlgorithms { public static double Linear(double[] xarray, double[] yarray, double x) { double y = double.NaN; for (int i = 0; i < xarray.Length - 1; i++) { if (x >= xarray[i] && x < xarray[i + 1]) { y = yarray[i] + (x - xarray[i]) * (yarray[i + 1] - yarray[i]) / (xarray[i + 1] - xarray[i]);

CHAPTER 10 ■ DATA INTERPOLATIONS
395
} } return y; } public static double[] Linear(double[] xarray, double[] yarray, double[] x) { double[] y = new double[x.Length]; for (int i = 0; i < x.Length; i++) y[i] = Linear(xarray, yarray, x[i]); return y; } } }
Here, we implement a static overloaded method, Linear. The xarray and yarray are the sets of x and y data, which present a set of given data points. The Linear method will find a single y value or a y array at the input x (a double value or double array), depending on the input variable x.
Testing Linear Interpolation You can easily perform linear interpolations using the Linear method that we implemented in the InterpolationAlgorithms class. The results can be displayed using the line chart control presented in the previous chapter. To achieve this, you need to add the line chart control to the current project’s References. Right-click References in the Solution Explorer and select Add Reference… to bring up the Add Reference window. Then click the Browse tab to navigate to the directory where the LineChartControl project is located. Go to the bin\Debug subdirectory and select LineChartControl.dll. This process adds the line chart control to the References of your current project so that you can use the control in your current application.
Add a new WPF Window to the current project and name it LinearInterpolation. Here is the XAML layout of this example:
<Window x:Class="Interpolation.LinearInterpolation" xmlns="http://schemas.microsoft.com/winfx/2006/xaml/presentation" xmlns:x="http://schemas.microsoft.com/winfx/2006/xaml" xmlns:chart="clr-namespace:LineChartControl;assembly=LineChartControl" Title="LinearInterpolation" Height="300" Width="300"> <Grid x:Name="rootGrid" SizeChanged="rootGrid_SizeChanged"> <chart:LineChartControlLib x:Name="myChart" Title="Linear Interpolation" Xmin="0" Xmax="7" Ymin="-1.5" Ymax="1.5" XTick="1" YTick="0.5"/> </Grid> </Window>
This XAML file simply creates a line chart control named myChart, which will be used to display the results of the linear interpolation. Here is the corresponding code-behind file:
using System; using System.Windows; using System.Windows.Controls; using System.Windows.Media; namespace Interpolation { public partial class LinearInterpolation : Window

CHAPTER 10 ■ DATA INTERPOLATIONS
396
{ public LinearInterpolation() { InitializeComponent(); } private void rootGrid_SizeChanged(object sender, SizeChangedEventArgs e) { myChart.Width = rootGrid.ActualWidth; myChart.Height = rootGrid.ActualHeight; AddData(); } private void AddData() { double[] x0 = new double[8]; double[] y0 = new double[8]; double[] x = new double[70]; for (int i = 0; i < x0.Length; i++) { x0[i] = 1.0 * i; y0[i] = Math.Sin(x0[i]); } for (int i = 0; i < x.Length; i++) { x[i] = i / 10.0; } double[] y = InterpolationAlgorithms.Linear(x0, y0, x); myChart.DataCollection.DataList.Clear(); // plot interpolated data: LineCharts.DataSeries ds = new LineCharts.DataSeries(); ds.LineColor = Brushes.Transparent; ds.SeriesName = "Interpolated"; ds.Symbols.SymbolType = LineCharts.Symbols.SymbolTypeEnum.Dot; ds.Symbols.SymbolSize = 3; ds.Symbols.BorderColor = Brushes.Red; for (int i = 0; i < x.Length; i++) { ds.LineSeries.Points.Add(new Point(x[i], y[i])); } myChart.DataCollection.DataList.Add(ds); // Plot original data ds = new LineCharts.DataSeries(); ds.LineColor = Brushes.Transparent; ds.SeriesName = "Original"; ds.Symbols.SymbolType = LineCharts.Symbols.SymbolTypeEnum.Diamond; ds.Symbols.BorderColor = Brushes.DarkBlue;

CHAPTER 10 ■ DATA INTERPOLATIONS
397
for (int i = 0; i < x0.Length; i++) { ds.LineSeries.Points.Add(new Point(x0[i], y0[i])); } myChart.DataCollection.DataList.Add(ds); myChart.IsLegend = true; myChart.LegendPosition = LineCharts.Legend.LegendPositionEnum.NorthEast; } } }
Here, we take eight original data points from a sine function and interpolate 70 data points linearly within the original data points using the following statement:
double[] y = InterpolationAlgorithms.Linear(x0, y0, x);
Here, you provide the x and y arrays of the original data and a given x array of the data to be interpolated as inputs of the Linear method. The method will return the interpolated y data array.
Running this example generates the result shown in Figure 10-2. You can see from the figure that the data points interpolated between two adjacent points of the original data form a straight line segment, as expected.
Figure 10-2. Results created using Linear interpolation

CHAPTER 10 ■ DATA INTERPOLATIONS
398
Lagrange Interpolation Lagrange interpolation is a well-known, classic technique for interpolation. Sometimes, Lagrange interpolation is also called polynomial interpolation. In the first-order approximation, Lagrange interpolation reduces to linear interpolation, which we discussed in the previous section.
Algorithm For a given set of n + 1 data points (x0, y0), (x1, y1), …, (xn, yn), where no two xi are the same, the interpolation polynomial in the Lagrange form is the linear combination
where
From the numerator of this definition, you can see that is an nth-order polynomial with zeros at all
of the sample points except the nth.
Implementation Here, we’ll implement the Lagrange interpolation. Add a new public static method, Lagrangian, to the InterpolationAlgorithms class:
public static double Lagrangian(double[] xarray, double[] yarray, double x) { double y = 0.0; double product = yarray[0]; for (int i = 0; i < xarray.Length; i++) { product = yarray[i]; for (int j = 0; j < xarray.Length; j++) { if (i != j) { product *= (x - xarray[j]) / (xarray[i] - xarray[j]); } } y += product; } return y; } public static double[] Lagrangian(double[] xarray, double[] yarray, double[] x) { double[] y = new double[x.Length];

CHAPTER 10 ■ DATA INTERPOLATIONS
399
for (int i = 0; i < x.Length; i++) y[i] = Lagrangian(xarray, yarray, x[i]); return y; }
Here, we implement a public static overloaded method, Lagrangian. The xarray and yarray are the sets of x and y data that present a set of given data points. The Lagrangian method will find a single y value or a y array at the input x (a double value or double array), depending on the input variable x.
Testing Lagrange Interpolation You can easily perform Lagrange interpolation using the Lagrange method implemented in the InterpolationAlgorithms class. The results can be displayed using the line chart control presented in the previous chapter.
Add a new WPF Window to the current project and name it LagrangeInterpolation. Here is the XAML layout of this example:
<Window x:Class="Interpolation.LagrangeInterpolation" xmlns="http://schemas.microsoft.com/winfx/2006/xaml/presentation" xmlns:x="http://schemas.microsoft.com/winfx/2006/xaml" xmlns:chart="clr-namespace:LineChartControl;assembly=LineChartControl" Title="LagrangeInterpolation" Height="300" Width="300"> <Grid x:Name="rootGrid" SizeChanged="rootGrid_SizeChanged"> <chart:LineChartControlLib x:Name="myChart" Title="Lagrange Interpolation" Xmin="0" Xmax="7" Ymin="-1.5" Ymax="1.5" XTick="1" YTick="0.5"/> </Grid> </Window>
This XAML file simply creates a line chart control named myChart, which will be used to display the results of the Lagrange interpolation. Here is the corresponding code-behind file:
using System; using System.Windows; using System.Windows.Controls; using System.Windows.Media; namespace Interpolation { public partial class LagrangeInterpolation : Window { public LagrangeInterpolation() { InitializeComponent(); } private void rootGrid_SizeChanged(object sender, SizeChangedEventArgs e) { myChart.Width = rootGrid.ActualWidth; myChart.Height = rootGrid.ActualHeight; AddData(); } private void AddData() {

CHAPTER 10 ■ DATA INTERPOLATIONS
400
double[] x0 = new double[8]; double[] y0 = new double[8]; double[] x = new double[70]; for (int i = 0; i < x0.Length; i++) { x0[i] = 1.0 * i; y0[i] = Math.Sin(x0[i]); } for (int i = 0; i < x.Length; i++) { x[i] = i / 10.0; } double[] y = InterpolationAlgorithms.Lagrangian(x0, y0, x); myChart.DataCollection.DataList.Clear(); // plot interpolated data: LineCharts.DataSeries ds = new LineCharts.DataSeries(); ds.LineColor = Brushes.Transparent; ds.SeriesName = "Interpolated"; ds.Symbols.SymbolType = LineCharts.Symbols.SymbolTypeEnum.Dot; ds.Symbols.SymbolSize = 3; ds.Symbols.BorderColor = Brushes.Red; for (int i = 0; i < x.Length; i++) { ds.LineSeries.Points.Add(new Point(x[i], y[i])); } myChart.DataCollection.DataList.Add(ds); // Plot original data ds = new LineCharts.DataSeries(); ds.LineColor = Brushes.Transparent; ds.SeriesName = "Original"; ds.Symbols.SymbolType = LineCharts.Symbols.SymbolTypeEnum.Diamond; ds.Symbols.BorderColor = Brushes.DarkBlue; for (int i = 0; i < x0.Length; i++) { ds.LineSeries.Points.Add(new Point(x0[i], y0[i])); } myChart.DataCollection.DataList.Add(ds); myChart.IsLegend = true; myChart.LegendPosition = LineCharts.Legend.LegendPositionEnum.NorthEast; } } }
This file is similar to that used in the previous example, involving linear interpolation. Here, we also take eight original data points from a sine function and try to interpolate 70 data points within the original data points using the following statement to perform a Lagrange interpolation:
double[] y = InterpolationAlgorithms.Lagrangian(x0, y0, x);

CHAPTER 10 ■ DATA INTERPOLATIONS
401
Here, you provide the x and y arrays of the original data and a given x array of the data to be interpolated as inputs of the Lagrangian method, and the method will return the interpolated y data array.
Running this example generates the result shown in Figure 10-3. You can see from the figure that compared to linear interpolation, the interpolated result of the Lagrange method is much closer to the real sine function.
Figure 10-3. Results created using Lagrange interpolation
Barycentric Interpolation The Lagrange interpolation just discussed requires recomputing all of the terms for each distinct x value, meaning this method can be applied only for small-n case. There are several shortcomings associated with Lagrange interpolation:
• Each evaluation of f(x) requires O(n2) additions and multiplications.
• Adding a new data point (xn+1, yn+1) requires a new computation from scratch.
• The computation is numerically unstable.
In order to improve the Lagrange method, we can rearrange the terms in the equation of the Lagrange interpolation by defining weight functions that do not depend on the interpolated value of x.

CHAPTER 10 ■ DATA INTERPOLATIONS
402
Algorithm Let’s introduce the quantity
We can then rearrange the Lagrange basis polynomial as
We can define the barycentric weight function:
Then, we can simply write
which is usually referred to as the barycentric interpolation formula. The advantage of this representation is that the interpolation polynomial may now be evaluated as
Now, if the weight function wi has been precomputed, the barycentric interpolation method requires only O(n) operations, as opposed to the O(n2) operations required to evaluate the Lagrange-basis polynomials of individually.
Implementation Here, we’ll implement the barycentric interpolation. Add a new public static method, Barycentric, to the InterpolationAlgorithms class:
public static double Barycentric(double[] xarray, double[] yarray, double x) { double product; double dx; double c1 = 0; double c2 = 0; int n = xarray.Length; double[] wt = new double[n]; for (int i = 0; i < n; i++) { product = 1;

CHAPTER 10 ■ DATA INTERPOLATIONS
403
for (int j = 0; j < n; j++) { if (i != j) { product *= (xarray[i] - xarray[j]); wt[i] = 1.0 / product; } } } for (int i = 0; i < n; i++) { dx = wt[i] / (x - xarray[i]); c1 += yarray[i] * dx; c2 += dx; } return c1 / c2; } public static double[] Barycentric(double[] xarray, double[] yarray, double[] x) { double[] y = new double[x.Length]; for (int i = 0; i < x.Length; i++) y[i] = Barycentric(xarray, yarray, x[i]); return y; }
Here, we implement a static overloaded method, Barycentric. The xarray and yarray are the sets of x and y data that present a set of given data points. The Barycentric method returns a single y value or a y array at the input x (a double value or double array), depending on the input variable x.
Testing Barycentric interpolation You can easily perform a barycentric interpolation using the Barycentric method implemented in the InterpolationAlgorithms class. You can display the results using the line chart control presented in the previous chapter.
Add a new WPF Window to the current project and name it BarycentricInterpolation. Here is the XAML layout of this example:
<Window x:Class="Interpolation.BarycentricInterpolation" xmlns="http://schemas.microsoft.com/winfx/2006/xaml/presentation" xmlns:x="http://schemas.microsoft.com/winfx/2006/xaml" xmlns:chart="clr-namespace:LineChartControl;assembly=LineChartControl" Title="Barycentric Interpolation" Height="300" Width="300"> <Grid x:Name="rootGrid" SizeChanged="rootGrid_SizeChanged"> <chart:LineChartControlLib x:Name="myChart" Title="Barycentric Interpolation" Xmin="-1" Xmax="1" XTick="0.5" Ymin="-3" Ymax="2" YTick="1"/> </Grid> </Window>
This XAML simply creates a line chart control named myChart, which will be used to display the results of the barycentric interpolation. Here is the corresponding code-behind file:

CHAPTER 10 ■ DATA INTERPOLATIONS
404
using System; using System.Windows; using System.Windows.Controls; using System.Windows.Media; namespace Interpolation { public partial class BarycentricInterpolation : Window { public BarycentricInterpolation() { InitializeComponent(); } private void rootGrid_SizeChanged(object sender, SizeChangedEventArgs e) { myChart.Width = rootGrid.ActualWidth; myChart.Height = rootGrid.ActualHeight; AddData(); } private void AddData() { double[] x0 = new double[15]; double[] y0 = new double[15]; double[] xe = new double[101]; double[] ye = new double[101]; double[] x = new double[31]; for (int i = 0; i < x0.Length; i++) { x0[i] = Math.Round(-1.2 + i / 5.0, 3); y0[i] = Math.Round(Math.Sin(8*x0[i]) + 0.5 * x0[i] - x0[i] * x0[i], 2); } for (int i = 0; i < xe.Length; i++) { xe[i] = Math.Round(-1.0 + i / 50.0, 3); ye[i] = Math.Round(Math.Sin(8*xe[i]) + 0.5 * xe[i] - xe[i] * xe[i], 2); } for (int i = 0; i < x.Length; i++) { x[i] = Math.Round(-1.0 + i / 15.0, 3); } double[] y = InterpolationAlgorithms.Lagrangian(x0, y0, x); myChart.DataCollection.DataList.Clear();
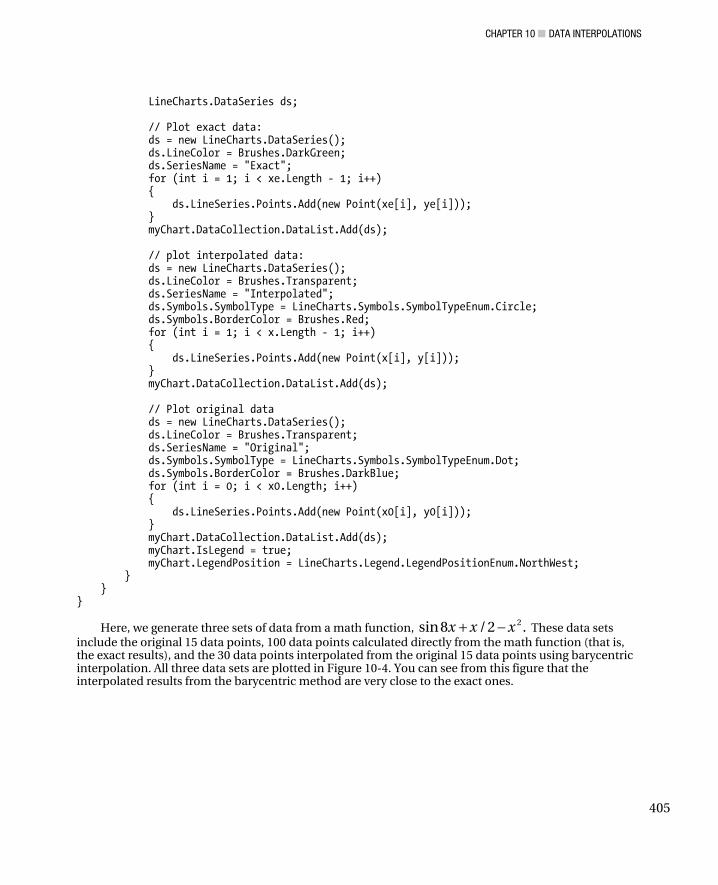
CHAPTER 10 ■ DATA INTERPOLATIONS
405
LineCharts.DataSeries ds; // Plot exact data: ds = new LineCharts.DataSeries(); ds.LineColor = Brushes.DarkGreen; ds.SeriesName = "Exact"; for (int i = 1; i < xe.Length - 1; i++) { ds.LineSeries.Points.Add(new Point(xe[i], ye[i])); } myChart.DataCollection.DataList.Add(ds); // plot interpolated data: ds = new LineCharts.DataSeries(); ds.LineColor = Brushes.Transparent; ds.SeriesName = "Interpolated"; ds.Symbols.SymbolType = LineCharts.Symbols.SymbolTypeEnum.Circle; ds.Symbols.BorderColor = Brushes.Red; for (int i = 1; i < x.Length - 1; i++) { ds.LineSeries.Points.Add(new Point(x[i], y[i])); } myChart.DataCollection.DataList.Add(ds); // Plot original data ds = new LineCharts.DataSeries(); ds.LineColor = Brushes.Transparent; ds.SeriesName = "Original"; ds.Symbols.SymbolType = LineCharts.Symbols.SymbolTypeEnum.Dot; ds.Symbols.BorderColor = Brushes.DarkBlue; for (int i = 0; i < x0.Length; i++) { ds.LineSeries.Points.Add(new Point(x0[i], y0[i])); } myChart.DataCollection.DataList.Add(ds); myChart.IsLegend = true; myChart.LegendPosition = LineCharts.Legend.LegendPositionEnum.NorthWest; } } }
Here, we generate three sets of data from a math function, These data sets include the original 15 data points, 100 data points calculated directly from the math function (that is, the exact results), and the 30 data points interpolated from the original 15 data points using barycentric interpolation. All three data sets are plotted in Figure 10-4. You can see from this figure that the interpolated results from the barycentric method are very close to the exact ones.

CHAPTER 10 ■ DATA INTERPOLATIONS
406
Figure 10-4. Results created using barycentric interpolation
Newton Divided-Difference Interpolation Newton divided-difference interpolation is the interpolation polynomial approximation for a given set of data points in the Newton form. It uses Taylor expansion to perform the interpolation. The divided differences are used to approximate the various derivatives.
Algorithm Let’s first examine the linear and quadratic approximations. Given two data points (x0, y0) and (x1, y1), the linear interpolation can be expressed in the form
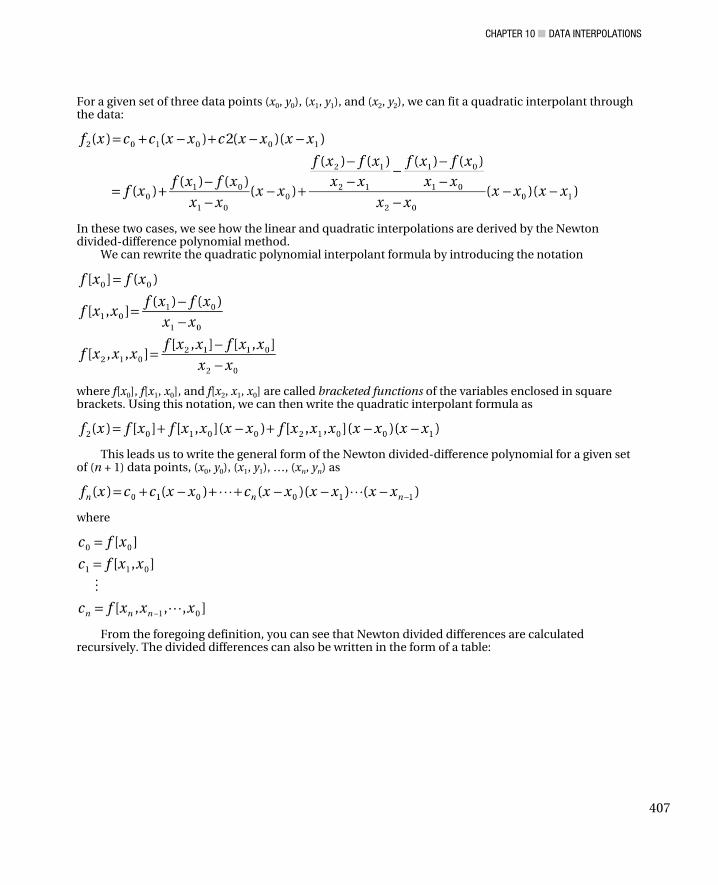
CHAPTER 10 ■ DATA INTERPOLATIONS
407
For a given set of three data points (x0, y0), (x1, y1), and (x2, y2), we can fit a quadratic interpolant through the data:
In these two cases, we see how the linear and quadratic interpolations are derived by the Newton divided-difference polynomial method.
We can rewrite the quadratic polynomial interpolant formula by introducing the notation
where f[x0], f[x1, x0], and f[x2, x1, x0] are called bracketed functions of the variables enclosed in square brackets. Using this notation, we can then write the quadratic interpolant formula as
This leads us to write the general form of the Newton divided-difference polynomial for a given set of (n + 1) data points, (x0, y0), (x1, y1), …, (xn, yn) as
where
From the foregoing definition, you can see that Newton divided differences are calculated recursively. The divided differences can also be written in the form of a table:

CHAPTER 10 ■ DATA INTERPOLATIONS
408
This difference table is an upper triangular matrix. You can store this kind of matrix in a one-dimensional array to save space.
Implementation Here, we’ll implement the Newton divided-difference interpolation. Add a new public static method, NewtonDividedDifference, to the InterpolationAlgorithms class:
public static double NewtonDividedDifference(double[] xarray, double[] yarray, double x) { double y; int n = xarray.Length; double[] temp = new double[n]; for (int i = 0; i < n; i++) { temp[i] = yarray[i]; } for (int i = 0; i < n - 1; i++) { for (int j = n - 1; j > i; j--) { temp[j] = (temp[j - 1] - temp[j]) / (xarray[j - 1 - i] - xarray[j]); } } y = temp[n - 1]; for (int i = n - 2; i >= 0; i--) { y = temp[i] + (x - xarray[i]) * y; } return y; }

CHAPTER 10 ■ DATA INTERPOLATIONS
409
public static double[] NewtonDividedDifference(double[] xarray, double[] yarray, double[] x) { double[] y = new double[x.Length]; for (int i = 0; i < x.Length; i++) y[i] = NewtonDividedDifference(xarray, yarray, x[i]); return y; }
Here, we implement an overloaded method, NewtonDividedDifference. The xarray and yarray are the sets of x and y data that present a set of given data points. This method returns a single y value or a y array at the input x (a double value or double array), depending on the input variable x.
Testing Newton Divided-Difference Interpolation You can easily perform a Newton divided-difference interpolation using the NewtonDividedDifference method implemented in the InterpolationAlgorithms class. You can display the results using the line chart control presented in the previous chapter.
Add a new WPF Window to the current project and name it DividedDifferenceInterpolation. Here is the XAML layout for this example:
<Window x:Class="Interpolation.DividedDifferenceInterpolation" xmlns="http://schemas.microsoft.com/winfx/2006/xaml/presentation" xmlns:x="http://schemas.microsoft.com/winfx/2006/xaml" xmlns:chart="clr-namespace:LineChartControl;assembly=LineChartControl" Title="DividedDifferenceInterpolation" Height="350" Width="400"> <Grid x:Name="rootGrid" SizeChanged="rootGrid_SizeChanged"> <chart:LineChartControlLib x:Name="myChart" Title="Newton Divided Difference Interpolation" Xmin="1950" Xmax="1990" XTick="10" Ymin="140" Ymax="260" YTick="20" XLabel="Year" YLabel="Population (Million)"/> </Grid> </Window>
This XAML file simply creates a line chart control named myChart, which will be used to display the results of the Newton divided-difference interpolation. Here is the corresponding code-behind file:
using System; using System.Windows; using System.Windows.Controls; using System.Windows.Media; namespace Interpolation { public partial class DividedDifferenceInterpolation : Window { public DividedDifferenceInterpolation() { InitializeComponent(); } private void rootGrid_SizeChanged(object sender, SizeChangedEventArgs e) { myChart.Width = rootGrid.ActualWidth;

CHAPTER 10 ■ DATA INTERPOLATIONS
410
myChart.Height = rootGrid.ActualHeight; AddData(); } private void AddData() { double[] x0 = new double[] { 1950, 1960, 1970, 1980, 1990 }; double[] y0 = new double[] { 150.697, 179.323, 203.212, 226.505, 249.633 }; double[] x = new double[] { 1952, 1955, 1958, 1962, 1965, 1968, 1972, 1975, 1978, 1982, 1985, 1988 }; double[] y = InterpolationAlgorithms.NewtonDividedDifference(x0, y0, x); myChart.DataCollection.DataList.Clear(); LineCharts.DataSeries ds; // plot interpolated data: ds = new LineCharts.DataSeries(); ds.LineColor = Brushes.Transparent; ds.SeriesName = "Interpolated"; ds.Symbols.SymbolType = LineCharts.Symbols.SymbolTypeEnum.Circle; ds.Symbols.BorderColor = Brushes.Red; for (int i = 0; i < x.Length; i++) { ds.LineSeries.Points.Add(new Point(x[i], y[i])); } myChart.DataCollection.DataList.Add(ds); // Plot original data ds = new LineCharts.DataSeries(); ds.LineColor = Brushes.DarkGreen; ds.SeriesName = "Original"; ds.Symbols.SymbolType = LineCharts.Symbols.SymbolTypeEnum.Dot; ds.Symbols.BorderColor = Brushes.DarkBlue; for (int i = 0; i < x0.Length; i++) { ds.LineSeries.Points.Add(new Point(x0[i], y0[i])); } myChart.DataCollection.DataList.Add(ds); myChart.IsLegend = true; myChart.LegendPosition = LineCharts.Legend.LegendPositionEnum.NorthWest; } } }
Here, we first create two initial data arrays, x0 and y0, which represent the census years from 1950 to 1990 and the corresponding United States population, in millions of people; we then want to use the Newton divided-difference interpolation to interpolate within the census data to estimate the population in other years.

CHAPTER 10 ■ DATA INTERPOLATIONS
411
This example generates the result shown in Figure 10-5.
Figure 10-5. Results created using the Newton divided-difference interpolation
Cubic Spline Interpolation In numerical analysis, spline interpolation is a form of interpolation in which the interpolant is a special type of piecewise polynomial called a spline. This method provides a great deal of smoothness for interpolations involving data that vary significantly.
Cubic spline interpolation uses weight coefficients on the cubic polynomials to interpolate the data. These coefficients bend the line so that it passes through each of the data points without any erratic behavior or breaks in continuity.

CHAPTER 10 ■ DATA INTERPOLATIONS
412
Algorithm The basic idea of the cubic spline is to fit a piecewise function of the form
where si is a third-degree polynomial defined by
The first and second derivatives of these n – 1 equations are fundamental to this process, and they are given by
We require that the piecewise function S(x) be able to interpolate all data points and that its first and second derivatives be continuous in the interval [x1, xn]. Using these properties, we can compute the coefficients
where
Implementation In order to implement the cubic spline interpolation, we first need to calculate the second derivatives using two private static methods, SecondDerivative and Tridiagonal. Add these two methods to the InterpolationAlgorithms class. Here are code listings for these two methods:
private static double[] SecondDerivatives(double[] xarray, double[] yarray) {
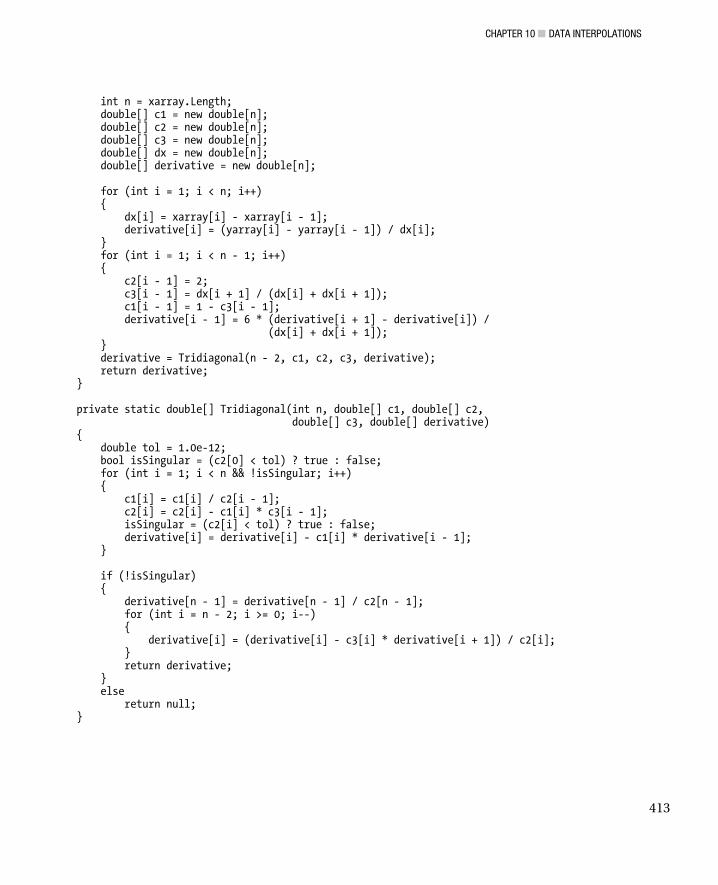
CHAPTER 10 ■ DATA INTERPOLATIONS
413
int n = xarray.Length; double[] c1 = new double[n]; double[] c2 = new double[n]; double[] c3 = new double[n]; double[] dx = new double[n]; double[] derivative = new double[n]; for (int i = 1; i < n; i++) { dx[i] = xarray[i] - xarray[i - 1]; derivative[i] = (yarray[i] - yarray[i - 1]) / dx[i]; } for (int i = 1; i < n - 1; i++) { c2[i - 1] = 2; c3[i - 1] = dx[i + 1] / (dx[i] + dx[i + 1]); c1[i - 1] = 1 - c3[i - 1]; derivative[i - 1] = 6 * (derivative[i + 1] - derivative[i]) / (dx[i] + dx[i + 1]); } derivative = Tridiagonal(n - 2, c1, c2, c3, derivative); return derivative; } private static double[] Tridiagonal(int n, double[] c1, double[] c2, double[] c3, double[] derivative) { double tol = 1.0e-12; bool isSingular = (c2[0] < tol) ? true : false; for (int i = 1; i < n && !isSingular; i++) { c1[i] = c1[i] / c2[i - 1]; c2[i] = c2[i] - c1[i] * c3[i - 1]; isSingular = (c2[i] < tol) ? true : false; derivative[i] = derivative[i] - c1[i] * derivative[i - 1]; } if (!isSingular) { derivative[n - 1] = derivative[n - 1] / c2[n - 1]; for (int i = n - 2; i >= 0; i--) { derivative[i] = (derivative[i] - c3[i] * derivative[i + 1]) / c2[i]; } return derivative; } else return null; }

CHAPTER 10 ■ DATA INTERPOLATIONS
414
Once the derivatives are obtained, we can use them to implement the cubic spline interpolation. Add a new public static method, Spline, to the InterpolationAlgorithms class:
public static double Spline(double[] xarray, double[] yarray, double x) { double[] xa = new double[xarray.Length + 1]; double[] ya = new double[yarray.Length + 1]; xa[0] = (1.0 - 1.0e-6) * xarray[0]; ya[0] = (1.0 - 1.0e-6) * yarray[0]; for (int i = 0; i < xarray.Length; i++) { xa[i + 1] = xarray[i]; ya[i + 1] = yarray[i]; } xarray = xa; yarray = ya; double d1, d2; double y = double.NaN; int n = xarray.Length; double[] dx = new double[n]; double[] derivative = SecondDerivatives(xarray, yarray); for (int i = 1; i < n; i++) { dx[i] = xarray[i] - xarray[i - 1]; } for (int i = 1; i < n - 1; i++) { if (x >= xarray[i] && x < xarray[i + 1]) { d1 = x - xarray[i]; d2 = xarray[i + 1] - x; y = derivative[i - 1] * d2 * d2 * d2 / (6.0 * dx[i + 1]) + derivative[i] * d1 * d1 * d1 / (6.0 * dx[i + 1]) + (yarray[i + 1] / dx[i + 1] - derivative[i] * dx[i + 1] / 6.0) * d1 + (yarray[i] / dx[i + 1] - derivative[i - 1] * dx[i + 1] / 6.0) * d2; } } return y; } public static double[] Spline(double[] xarray, double[] yarray, double[] x) { double[] y = new double[x.Length]; for (int i = 0; i < x.Length; i++) y[i] = Spline(xarray, yarray, x[i]); return y; }
Here, we implement an overloaded method, Spline. The xarray and yarray are the sets of x and y data that present a set of given data points. This method returns a single y value or a y array at the input x (a double value or double array), depending on the input variable x.

CHAPTER 10 ■ DATA INTERPOLATIONS
415
Testing Cubic Spline Interpolation You can easily perform a cubic spline interpolation using the Spline method implemented in the InterpolationAlgorithms class. You can display the results using the line chart control presented in the previous chapter.
Add a new WPF Window to the current project and name it CubicSplineInterpolation. Here is the XAML layout for this example:
<Window x:Class="Interpolation.CubicSplineInterpolation" xmlns="http://schemas.microsoft.com/winfx/2006/xaml/presentation" xmlns:x="http://schemas.microsoft.com/winfx/2006/xaml" xmlns:chart="clr-namespace:LineChartControl;assembly=LineChartControl" Title="CubicSplineInterpolation" Height="350" Width="400"> <Grid x:Name="rootGrid" SizeChanged="rootGrid_SizeChanged"> <chart:LineChartControlLib x:Name="myChart" Title="Cubic Spline Interpolation" Xmin="0" Xmax="4" XTick="1" Ymin="0" Ymax="6" YTick="1"/> </Grid> </Window>
This XAML file simply creates a line chart control named myChart, which will be used to display the results of the cubic spline interpolation. Here is the corresponding code-behind file:
using System; using System.Windows; using System.Windows.Controls; using System.Windows.Media; namespace Interpolation { public partial class CubicSplineInterpolation : Window { public CubicSplineInterpolation() { InitializeComponent(); } private void rootGrid_SizeChanged(object sender, SizeChangedEventArgs e) { myChart.Width = rootGrid.ActualWidth; myChart.Height = rootGrid.ActualHeight; AddData(); } private void AddData() { double[] x0 = new double[] { 1, 2, 3}; double[] y0 = new double[] { 1, 5, 4}; double[] x = new double[199]; for (int i = 0; i < x.Length; i++) { x[i] = 1.01 + i / 100.0; } double[] y = InterpolationAlgorithms.Spline(x0, y0, x);

CHAPTER 10 ■ DATA INTERPOLATIONS
416
myChart.DataCollection.DataList.Clear(); LineCharts.DataSeries ds; // Plot original data ds = new LineCharts.DataSeries(); ds.LineColor = Brushes.Transparent; ds.SeriesName = "Original"; ds.Symbols.SymbolType = LineCharts.Symbols.SymbolTypeEnum.Dot; ds.Symbols.BorderColor = Brushes.DarkBlue; for (int i = 0; i < x0.Length; i++) { ds.LineSeries.Points.Add(new Point(x0[i], y0[i])); } myChart.DataCollection.DataList.Add(ds); // plot interpolated data: ds = new LineCharts.DataSeries(); ds.LineColor = Brushes.DarkGreen; ds.SeriesName = "Interpolated"; for (int i = 0; i < x.Length; i++) { ds.LineSeries.Points.Add(new Point(x[i], y[i])); } myChart.DataCollection.DataList.Add(ds); myChart.IsLegend = true; myChart.LegendPosition = LineCharts.Legend.LegendPositionEnum.NorthWest; } } }
Here, we first create three initial data points represented by the arrays x0 and y0. We then want to find 200 data points using the cubic spline interpolation method. Running this example generates the result shown in Figure 10-6.

CHAPTER 10 ■ DATA INTERPOLATIONS
417
Figure 10-6. Results created using cubic spline interpolation

CHAPTER 10 ■ DATA INTERPOLATIONS
418

C H A P T E R 11
■ ■ ■
419
Curve Fitting
In science and engineering, the data obtained from experiments usually contain a significant amount of random noise due to measurement errors. The purpose of curve fitting is to find a smooth curve that fits the data points on average. We usually require that this curve have a simple form with a low-order polynomial so that it does not reproduce the random errors of the data.
There is a distinction between interpolation and curve fitting. Interpolation, as discussed in the previous chapter, can be regarded as a special case of curve fitting in which the function must pass exactly through the data points. This implicitly assumes that the given data points in an interpolation are accurate and distinct. Curve fitting is applied to data that contain noise, usually due to measurement errors. It tries to find the best fit to a given set of data. Thus, the curve does not necessarily pass through the given data points.
Linear Algebraic Equations Curve-fitting techniques often require solving linear algebraic equations. In this section, we review a commonly used method, the Gauss-Jordan elimination, for solving linear equations. Generally, the linear equation system involves multiple variables. General vector and matrix analysis is the basic theory of this linear system.
Note that the vector and matrix structures contained in WPF are designed specifically for transformation operations on various graphics elements, but they are not general enough for applications such as solving linear equation systems. For example, if a linear system consists of 10 equations and 10 unknowns, the vector and matrix involved in this system will be 10-dimensional. The 2D Vector and Matrix or the 3D Vector3D and Matrix3D structures in WPF cannot be applied to such a system. Thus, we need to create general n-dimensional vectors and n x n matrix structures.
In my other book, Practical Numerical Methods with C#, I presented detailed instructions on how to create such general vectors and matrices for real and complex variables. Here, I’ll use these VectorR and MatrixR structures for real variables directly without derivations. If you are interested in the implementation of these structures, please refer to Practical Numerical Methods with C#.
Here, we’ll consider how to solve linear equations containing an arbitrary number of unknowns. A set of linear equations can be written in a matrix form as
(11.1)
Here, A is a square matrix of coefficients, and both x and b are column vectors representing unknowns and right-hand constants, respectively. In the following sections, I’ll present the Gauss-Jordan method for solving linear equations.

CHAPTER 11 ■ CURVE FITTING
420
Gauss-Jordan Algorithm Solving sets of linear equations using Gauss-Jordan elimination produces both the solution of the equations and the inverse of the coefficient matrix. The Gauss-Jordan elimination process requires two steps. The first step, called the forward elimination, reduces a given system to either triangular or echelon form or results in a degenerate equation indicating that the system has no solution. We accomplish this through the use of elementary operations. The second step, called the backward elimination, uses back-substitution to find the solution of the linear equations.
In terms of matrix formalism, the first step reduces a matrix to row-echelon form using elementary operations, and the second step reduces it to row-canonical form.
Gauss-Jordan elimination computes the matrix decomposition using three elementary operations: multiplying rows, switching rows, and adding multiples of rows to other rows. The first part of the algorithm computes the decomposition; the second part writes the original matrix as the product of a uniquely determined invertible matrix and a uniquely determined reduced row-echelon matrix. The Gauss-Jordan method is generally as efficient as other techniques and is very stable.
The simplest method in Gauss-Jordan elimination is to eliminate x[0] in Equation (11.1) from all equations with i > 0; x[1] from all the resulting equations with i > 1; and, in general, x[j] from all equations with i > j. The process, called Gauss-Jordan elimination, produces a triangular matrix of coefficients with all zero elements below the principal diagonal.
We must take care when using this elimination method. It may fail if one of the diagonal elements becomes zero or becomes too small in the process of triangulation. We can avoid this problem by interchanging the two sets of equations. The order in which the equations are presented makes no difference to their solutions, but it can have a great impact on how you solve the equations. Thus, we can rearrange the equations to make the diagonal elements as large as possible. We’ll use the Pivot method to perform this task.
Implementation Start with a new WPF Windows application and name it CurveFitting. First we need to add the structures VectorR and MatrixR to the current project by right-clicking the CurveFitting project, selecting Add | Add Existing Item…. You can view the source code by opening the VectorR.cs and MatrixR.cs files to see how they are implemented. You can find a detailed explanation of their implementation in Practical Numerical Methods with C#. Add a new class to the project and name it CurveFittingAlgorithms. Here, we only consider linear systems with real variables. The following is the code listing for this class:
using System; using System.Collections; namespace CurveFitting { public class CurveFittingAlgorithms { public static VectorR GaussJordan(MatrixR A, VectorR b) { Triangulate(A, b); int n = b.GetSize(); VectorR x = new VectorR(n); for (int i = n - 1; i >= 0; i--) { double d = A[i, i]; if (Math.Abs(d) < 1.0e-500) throw new ArgumentException("Diagonal element is too small!"); x[i] = (b[i] - VectorR.DotProduct(A.GetRowVector(i), x)) / d;

CHAPTER 11 ■ CURVE FITTING
421
} return x; } private static void Triangulate(MatrixR A, VectorR b) { int n = A.GetRows(); VectorR v = new VectorR(n); for (int i = 0; i < n - 1; i++) { double d = Pivot(A, b, i); if (Math.Abs(d) < 1.0e-500) throw new ArgumentException("Diagonal element is too small!"); for (int j = i + 1; j < n; j++) { double dd = A[j, i] / d; for (int k = i + 1; k < n; k++) { A[j, k] -= dd * A[i, k]; } b[j] -= dd * b[i]; } } } private static double Pivot(MatrixR A, VectorR b, int q) { int n = b.GetSize(); int i = q; double d = 0.0; for (int j = q; j < n; j++) { double dd = Math.Abs(A[j, q]); if (dd > d) { d = dd; i = j; } } if (i > q) { A.GetRowSwap(q, i); b.GetSwap(q, i); } return A[q, q]; } } }
This class includes three methods for performing Gauss-Jordan eliminations. The Pivot method is intended to return the largest available diagonal element by rearranging the equations. If needed, we interchange the rows for both the matrix of coefficients A and the constant vector b by using the Swap method, defined in the MatrixR and VectorR classes.

CHAPTER 11 ■ CURVE FITTING
422
We achieve the triangulation using the Triangulate method. In the first loop, instead of using the diagonal element A[i, i] directly, we use the largest possible element from the Pivot method.
Finally, we implement the public GaussJordan method. In this method, we find the values of the unknowns for triangulated equations by using back-substitution. This process starts with the last equation, which contains a single unknown, meaning we can find its solution immediately. We can substitute this value into the second-to-last equation in order to calculate the next unknown. We repeat this process until we have found all of the unknowns.
Least-Squares Fit The most popular curve-fitting technique is the least-squares method, which is usually used to solve overdetermined systems. It is often applied in statistics, particularly in regression analysis. The best fit in the least-squares sense is the instance of the model in which the sum of the squared residuals has its smallest value. The residual in the least-squares method is the difference between the observed data value and the value provided by the model.
Suppose that a given data set consists of n + 1 data points (xi, yi), i = 0, 1, …, n, where xi is an independent variable and yi is a dependent variable whose value is obtained by observation. The model function can be defined as
This function is to be fitted to a data set with n + 1 data points. The preceding model function contains m + 1 variable parameters a0, a1, …, am, where m < n. We wish to find those parameter values for which the model best fits the data.
The form of the model function is determined beforehand, usually from the theory associated with the experiment from which the data are obtained. The curve-fitting process involves two steps: choosing the form of the model function, followed by computing the parameters that produce the best fit to the data.
The least-squares method minimizes the sum of squared residuals
with respect to each parameter ai. The terms in this equation are called residuals, which represent the discrepancy between the data points and the fitting function. Therefore, the optimal values of the parameters are given by the following conditions:
The foregoing equation is generally nonlinear in ai and may be difficult to solve. This gradient equation applies to all least-squares problems. Each particular problem requires particular expressions for the model function and its partial derivatives. For example, the model function is often chosen as a linear combination of the specified functions fi(x):
In this case, the gradient equation becomes linear. If the model function is a polynomial, we have f0(x) = 1, f1(x) = x, f2(x) = x2, etc.
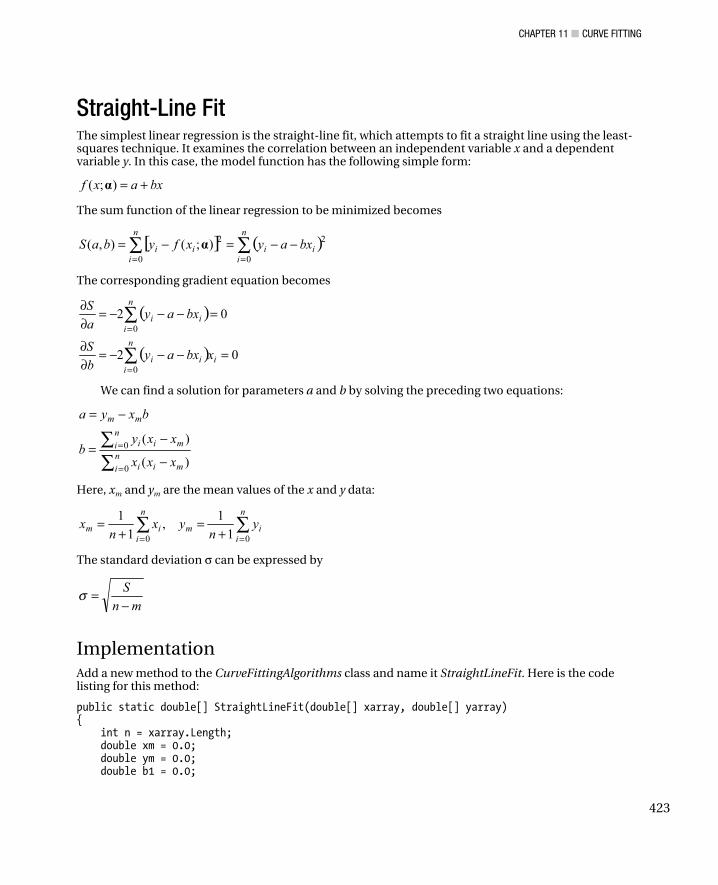
CHAPTER 11 ■ CURVE FITTING
423
Straight-Line Fit The simplest linear regression is the straight-line fit, which attempts to fit a straight line using the least-squares technique. It examines the correlation between an independent variable x and a dependent variable y. In this case, the model function has the following simple form:
The sum function of the linear regression to be minimized becomes
The corresponding gradient equation becomes
We can find a solution for parameters a and b by solving the preceding two equations:
Here, xm and ym are the mean values of the x and y data:
The standard deviation σ can be expressed by
Implementation Add a new method to the CurveFittingAlgorithms class and name it StraightLineFit. Here is the code listing for this method:
public static double[] StraightLineFit(double[] xarray, double[] yarray) { int n = xarray.Length; double xm = 0.0; double ym = 0.0; double b1 = 0.0;

CHAPTER 11 ■ CURVE FITTING
424
double b2 = 0.0; double a = 0.0; double b = 0.0; double s = 0.0; double sigma = 0.0; for (int i = 0; i < n; i++) { xm += xarray[i] / n; ym += yarray[i] / n; } for (int i = 0; i < n; i++) { b1 += yarray[i] * (xarray[i] - xm); b2 += xarray[i] * (xarray[i] - xm); } b = b1 / b2; a = ym - xm * b; for (int i = 0; i < n; i++) { s += (yarray[i] - a - b * xarray[i]) * (yarray[i] - a - b * xarray[i]); } sigma = Math.Sqrt(s / (n - 2)); return new double[] {a, b, sigma }; }
Here, the xarray and yarray are the sets of x and y data that present a set of given data points. This method returns the coefficients a and b of the model function and the standard deviation, sigma.
Testing Straight-Line Fit You can easily perform a straight-line fit using the method implemented in the previous section. To display the results directly on your screen, you’ll need to add the LineChartControl to the References for this project, as we did in the previous chapter. Add a new WPF Windows application to the current project and name it StraightLineFit. Here is the XAML file for this example:
<Window x:Class="CurveFitting.StraightLineFit" xmlns="http://schemas.microsoft.com/winfx/2006/xaml/presentation" xmlns:x="http://schemas.microsoft.com/winfx/2006/xaml" xmlns:chart="clr-namespace:LineChartControl;assembly=LineChartControl" Title="StraightLineFit" Height="350" Width="400"> <Grid x:Name="rootGrid" SizeChanged="rootGrid_SizeChanged"> <chart:LineChartControlLib x:Name="myChart" Xmin="-1" Xmax="6" XTick="1" Ymin="1" Ymax="7" YTick="1" Title="Straight Line Fitting"/> </Grid> </Window>
This XAML creates a line chart control named myChart, which will be used to display the result of the curve fitting. The corresponding code-behind file is listed below:
using System; using System.Windows; using System.Windows.Controls; using System.Windows.Media;
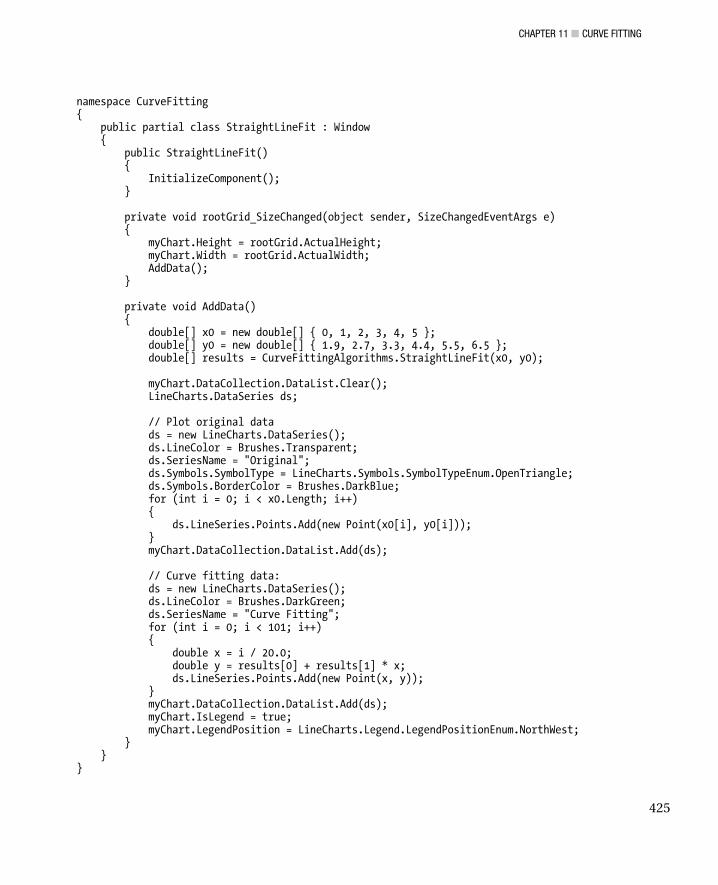
CHAPTER 11 ■ CURVE FITTING
425
namespace CurveFitting { public partial class StraightLineFit : Window { public StraightLineFit() { InitializeComponent(); } private void rootGrid_SizeChanged(object sender, SizeChangedEventArgs e) { myChart.Height = rootGrid.ActualHeight; myChart.Width = rootGrid.ActualWidth; AddData(); } private void AddData() { double[] x0 = new double[] { 0, 1, 2, 3, 4, 5 }; double[] y0 = new double[] { 1.9, 2.7, 3.3, 4.4, 5.5, 6.5 }; double[] results = CurveFittingAlgorithms.StraightLineFit(x0, y0); myChart.DataCollection.DataList.Clear(); LineCharts.DataSeries ds; // Plot original data ds = new LineCharts.DataSeries(); ds.LineColor = Brushes.Transparent; ds.SeriesName = "Original"; ds.Symbols.SymbolType = LineCharts.Symbols.SymbolTypeEnum.OpenTriangle; ds.Symbols.BorderColor = Brushes.DarkBlue; for (int i = 0; i < x0.Length; i++) { ds.LineSeries.Points.Add(new Point(x0[i], y0[i])); } myChart.DataCollection.DataList.Add(ds); // Curve fitting data: ds = new LineCharts.DataSeries(); ds.LineColor = Brushes.DarkGreen; ds.SeriesName = "Curve Fitting"; for (int i = 0; i < 101; i++) { double x = i / 20.0; double y = results[0] + results[1] * x; ds.LineSeries.Points.Add(new Point(x, y)); } myChart.DataCollection.DataList.Add(ds); myChart.IsLegend = true; myChart.LegendPosition = LineCharts.Legend.LegendPositionEnum.NorthWest; } } }

CHAPTER 11 ■ CURVE FITTING
426
Here, we provide the input data points using two double arrays xarray and yarray, and we use the following statement to calculate the coefficients of the straight-line fit:
double[] results = CurveFittingAlgorithms.StraightLineFit(x0, y0);
You can view the results using a Message Box by adding the following code snippet to the AddData method:
MessageBox.Show(results[0].ToString() + ", " + results[1].ToString() + ", " + results[2].ToString());
which should display (1.729, 0.929, 0.191). Therefore, the straight line can be represented by
and the standard deviation is 0.191. Figure 11-1 shows the results of the straight-line fit to the original data.
Figure 11-1. Straight-line fit

CHAPTER 11 ■ CURVE FITTING
427
Linear Regression Let’s first consider the least-squares fit with the linear form
where fi(x) is a predetermined function of x, called a basis function. In this case, the sum of the residuals is given by
The corresponding gradient equation from reduces to
The preceding equation can be rewritten in matrix form:
This matrix form is also called the normal equations of the least-squares fit, which can be solved via the Gauss-Jordan method previously discussed in this chapter.
Implementation Using the algorithm developed in the previous section, we can implement the linear regression method. Add a new public static method, LinearRegression, to the CurveFittingAlgorithms class:
public delegate double ModelFunction(double x); public static VectorR LinearRegression(double[] xarray, double[] yarray, ModelFunction[] f, out double sigma) { int m = f.Length; MatrixR A = new MatrixR(m, m); VectorR b = new VectorR(m); int n = xarray.Length; for (int k = 0; k < m; k++) { b[k] = 0.0; for (int i = 0; i < n; i++) { b[k] += f[k](xarray[i]) * yarray[i]; } }

CHAPTER 11 ■ CURVE FITTING
428
for (int j = 0; j < m; j++) { for (int k = 0; k < m; k++) { A[j, k] = 0.0; for (int i = 0; i < n; i++) { A[j, k] += f[j](xarray[i]) * f[k](xarray[i]); } } } VectorR coef = GaussJordan(A, b); // Calculate the standard deviation: double s = 0.0; for (int i = 0; i < n; i++) { double s1 = 0.0; for (int j = 0; j < m; j++) { s1 += coef[j] * f[j](xarray[i]); } s += (yarray[i] - s1) * (yarray[i] - s1); } sigma = Math.Sqrt(s / (n - m)); return coef; }
Notice that we first define a delegate function that takes a double variable x as its input parameter. Then we implement a public static method, LinearRegression, which returns a VectorR object with its components as the coefficients of a basis function.
Inside the LinearRegression method, we specify the coefficient matrix A and vector b. We then solve the normal equations via the GaussJordan method. Following the solution, we compute the standard deviation. This method returns the coefficients of the polynomial (a VectorR object); we specify the standard deviation using the out prefix in the PolynomialFit method:
public static VectorR LinearRegression(double[] xarray, double[] yarray, ModelFunction[] f, out double sigma) { }
This way, you can obtain multiple output results from a single C# method.

CHAPTER 11 ■ CURVE FITTING
429
Testing Linear Regression You can easily perform a linear regression using the method implemented in the previous section. Add a new WPF Windows application to the current project and name it LinearRegression. Here is the XAML file for this example:
<Window x:Class="CurveFitting.LinearRegression" xmlns="http://schemas.microsoft.com/winfx/2006/xaml/presentation" xmlns:x="http://schemas.microsoft.com/winfx/2006/xaml" xmlns:chart="clr-namespace:LineChartControl;assembly=LineChartControl" Title="LinearRegression" Height="400" Width="450"> <Grid x:Name="rootGrid" SizeChanged="rootGrid_SizeChanged"> <chart:LineChartControlLib x:Name="myChart" Title="Linear Regression" Xmin="-1" Xmax="6" XTick="1" Ymin="0" Ymax="5" YTick="1"/> </Grid> </Window>
This XAML file creates a line chart control named myChart, which will be used to display the result of the curve fitting. Here is the corresponding code-behind file:
using System; using System.Windows; using System.Windows.Controls; using System.Windows.Media; using System.Windows.Shapes; namespace CurveFitting { public partial class LinearRegression : Window { public LinearRegression() { InitializeComponent(); } private void rootGrid_SizeChanged(object sender, SizeChangedEventArgs e) { myChart.Width = rootGrid.ActualWidth; myChart.Height = rootGrid.ActualHeight; AddData(); } private void AddData() { double[] x0 = new double[] { 0, 1, 2, 3, 4, 5 }; double[] y0 = new double[] { 2, 1, 4, 4, 3, 2 }; // First order polynormial (m = 1): CurveFittingAlgorithms.ModelFunction[] f = new CurveFittingAlgorithms.ModelFunction[] { f0, f1 }; double sigma = 0.0; VectorR results1 = CurveFittingAlgorithms.LinearRegression(x0, y0,

CHAPTER 11 ■ CURVE FITTING
430
f, out sigma); // Second order polynormial (m = 2): f = new CurveFittingAlgorithms.ModelFunction[] { f0, f1, f2 }; VectorR results2 = CurveFittingAlgorithms.LinearRegression(x0, y0, f, out sigma); // Third order polynormial (m = 3): f = new CurveFittingAlgorithms.ModelFunction[] { f0, f1, f2, f3 }; VectorR results3 = CurveFittingAlgorithms.LinearRegression(x0, y0, f, out sigma); // Plot results: myChart.DataCollection.DataList.Clear(); LineCharts.DataSeries ds; // Plot original data: ds = new LineCharts.DataSeries(); ds.LineColor = Brushes.Transparent; ds.SeriesName = "Original"; ds.Symbols.SymbolType = LineCharts.Symbols.SymbolTypeEnum.Triangle; ds.Symbols.BorderColor = Brushes.Black; for (int i = 0; i < x0.Length; i++) { ds.LineSeries.Points.Add(new Point(x0[i], y0[i])); } myChart.DataCollection.DataList.Add(ds); // 1st order fitting data: ds = new LineCharts.DataSeries(); ds.LineColor = Brushes.DarkGreen; ds.LineThickness = 2; ds.SeriesName = "1st Order Fitting"; for (int i = 0; i < 141; i++) { double x = -1.0 + i / 20.0; double y = results1[0] + results1[1] * x; ds.LineSeries.Points.Add(new Point(x, y)); } myChart.DataCollection.DataList.Add(ds); // 2nd order fitting data: ds = new LineCharts.DataSeries(); ds.LineColor = Brushes.Red; ds.LineThickness = 2; ds.LinePattern = LineCharts.DataSeries.LinePatternEnum.Dash; ds.SeriesName = "2nd Order Fitting"; for (int i = 0; i < 141; i++) { double x = -1.0 + i / 20.0; double y = results2[0] + results2[1] * x + results2[2] * x * x; ds.LineSeries.Points.Add(new Point(x, y)); }

CHAPTER 11 ■ CURVE FITTING
431
myChart.DataCollection.DataList.Add(ds); // 3rd order fitting data: ds = new LineCharts.DataSeries(); ds.LineColor = Brushes.DarkBlue; ds.LineThickness = 2; ds.LinePattern = LineCharts.DataSeries.LinePatternEnum.DashDot; ds.SeriesName = "3rd Order Fitting"; for (int i = 0; i < 141; i++) { double x = -1.0 + i / 20.0; double y = results3[0] + results3[1] * x + results3[2] * x * x + results3[3] * x * x * x; ds.LineSeries.Points.Add(new Point(x, y)); } myChart.DataCollection.DataList.Add(ds); myChart.IsLegend = true; myChart.LegendPosition = LineCharts.Legend.LegendPositionEnum.NorthWest; } private static double f0(double x) { return 1.0; } private static double f1(double x) { return x; } private static double f2(double x) { return x * x; } private static double f3(double x) { return x * x * x; } } }
Here, we fit a polynomial of different orders (from 1 to 3) to the data points. In addition, we define the delegate functions used to compute the results based on the linear regression.
Running this example generates the results shown in Figure 11-2.

CHAPTER 11 ■ CURVE FITTING
432
Figure 11-2. Curve fitting using the linear regression technique
From these results we see that the second-order polynomial fitting produces the smallest standard deviation. Thus, it could be considered as the “best” fit to the data. Note, however, that the standard deviation is not a reliable measure of the accuracy of the fit. It is always a good idea to plot the data points and the fitting function f(x) before making the final determination. In Figure 11-2, we plot the data points and the first- to third-order polynomials. From this figure, it is hard to see which polynomial provides a better fit to the data.
The linear regression method is very general. You can use any basis functions fj(x) you like.

CHAPTER 11 ■ CURVE FITTING
433
Polynomial Fit As mentioned earlier, the polynomial fit is a special case of the linear least-squares method. In this case, the basis function becomes
Thus, the matrix and vector in the normal equation become
Implementation Using the algorithm developed in the previous section, we can implement the polynomial curve-fitting method. This method is very similar to the LinearRegression method presented earlier, but with the basis
functions fj(x) replaced with Add a new public static method, PolynomialFit, to the CurveFittingAlgorithms class:
public static VectorR PolynomialFit(double[] xarray, double[] yarray, int m, out double sigma) { m++; MatrixR A = new MatrixR(m, m); VectorR b = new VectorR(m); int n = xarray.Length; for (int k = 0; k < m; k++) { b[k] = 0.0; for (int i = 0; i < n; i++) { b[k] += Math.Pow(xarray[i], k) * yarray[i]; } } for (int j = 0; j < m; j++) { for (int k = 0; k < m; k++) { A[j, k] = 0.0; for (int i = 0; i < n; i++) { A[j, k] += Math.Pow(xarray[i], j + k); } } } VectorR coef = GaussJordan(A, b);
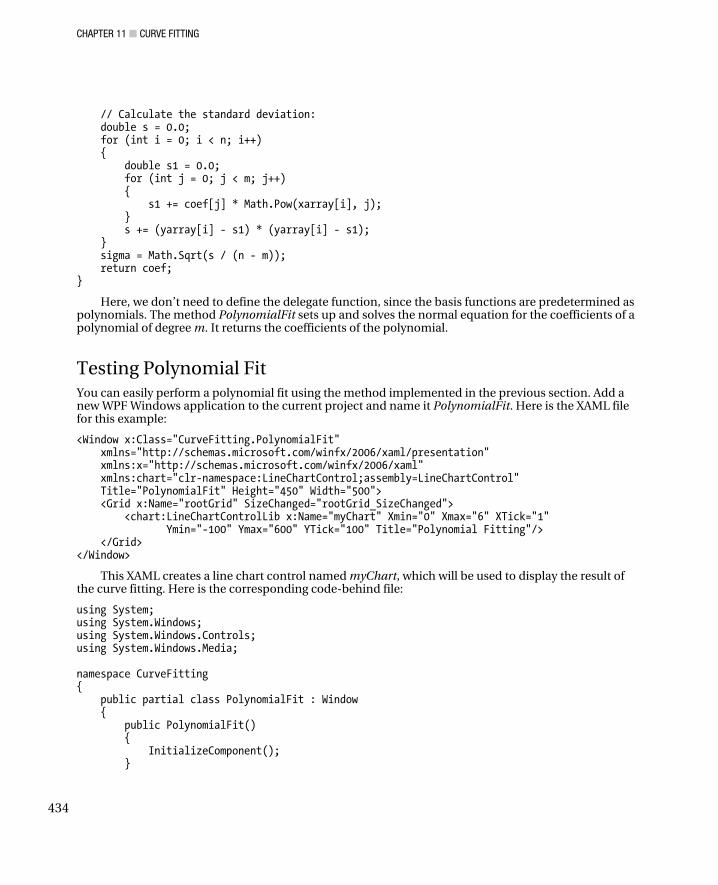
CHAPTER 11 ■ CURVE FITTING
434
// Calculate the standard deviation: double s = 0.0; for (int i = 0; i < n; i++) { double s1 = 0.0; for (int j = 0; j < m; j++) { s1 += coef[j] * Math.Pow(xarray[i], j); } s += (yarray[i] - s1) * (yarray[i] - s1); } sigma = Math.Sqrt(s / (n - m)); return coef; }
Here, we don’t need to define the delegate function, since the basis functions are predetermined as polynomials. The method PolynomialFit sets up and solves the normal equation for the coefficients of a polynomial of degree m. It returns the coefficients of the polynomial.
Testing Polynomial Fit You can easily perform a polynomial fit using the method implemented in the previous section. Add a new WPF Windows application to the current project and name it PolynomialFit. Here is the XAML file for this example:
<Window x:Class="CurveFitting.PolynomialFit" xmlns="http://schemas.microsoft.com/winfx/2006/xaml/presentation" xmlns:x="http://schemas.microsoft.com/winfx/2006/xaml" xmlns:chart="clr-namespace:LineChartControl;assembly=LineChartControl" Title="PolynomialFit" Height="450" Width="500"> <Grid x:Name="rootGrid" SizeChanged="rootGrid_SizeChanged"> <chart:LineChartControlLib x:Name="myChart" Xmin="0" Xmax="6" XTick="1" Ymin="-100" Ymax="600" YTick="100" Title="Polynomial Fitting"/> </Grid> </Window>
This XAML creates a line chart control named myChart, which will be used to display the result of the curve fitting. Here is the corresponding code-behind file:
using System; using System.Windows; using System.Windows.Controls; using System.Windows.Media; namespace CurveFitting { public partial class PolynomialFit : Window { public PolynomialFit() { InitializeComponent(); }
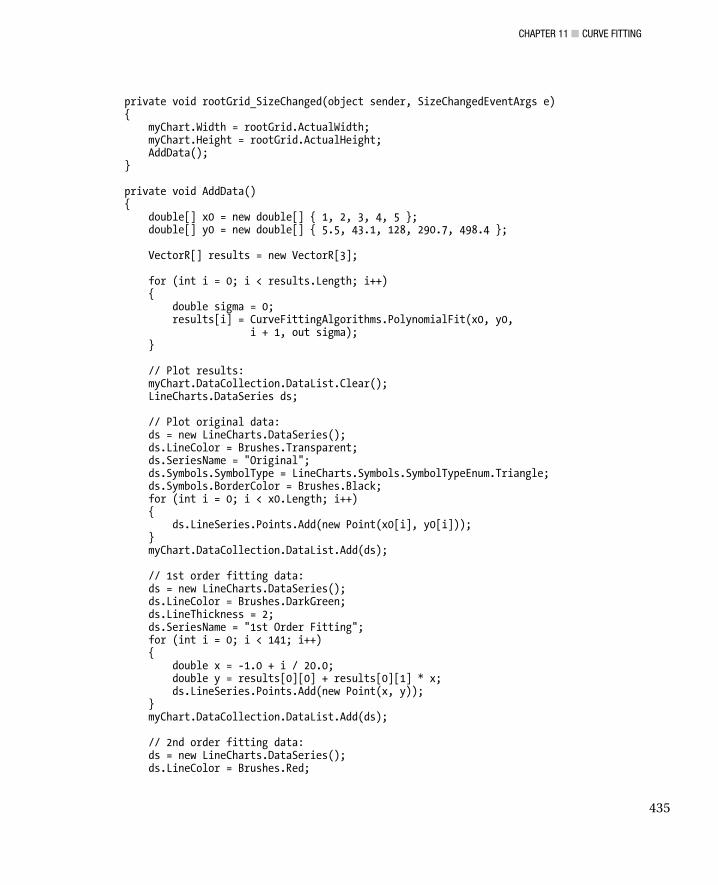
CHAPTER 11 ■ CURVE FITTING
435
private void rootGrid_SizeChanged(object sender, SizeChangedEventArgs e) { myChart.Width = rootGrid.ActualWidth; myChart.Height = rootGrid.ActualHeight; AddData(); } private void AddData() { double[] x0 = new double[] { 1, 2, 3, 4, 5 }; double[] y0 = new double[] { 5.5, 43.1, 128, 290.7, 498.4 }; VectorR[] results = new VectorR[3]; for (int i = 0; i < results.Length; i++) { double sigma = 0; results[i] = CurveFittingAlgorithms.PolynomialFit(x0, y0, i + 1, out sigma); } // Plot results: myChart.DataCollection.DataList.Clear(); LineCharts.DataSeries ds; // Plot original data: ds = new LineCharts.DataSeries(); ds.LineColor = Brushes.Transparent; ds.SeriesName = "Original"; ds.Symbols.SymbolType = LineCharts.Symbols.SymbolTypeEnum.Triangle; ds.Symbols.BorderColor = Brushes.Black; for (int i = 0; i < x0.Length; i++) { ds.LineSeries.Points.Add(new Point(x0[i], y0[i])); } myChart.DataCollection.DataList.Add(ds); // 1st order fitting data: ds = new LineCharts.DataSeries(); ds.LineColor = Brushes.DarkGreen; ds.LineThickness = 2; ds.SeriesName = "1st Order Fitting"; for (int i = 0; i < 141; i++) { double x = -1.0 + i / 20.0; double y = results[0][0] + results[0][1] * x; ds.LineSeries.Points.Add(new Point(x, y)); } myChart.DataCollection.DataList.Add(ds); // 2nd order fitting data: ds = new LineCharts.DataSeries(); ds.LineColor = Brushes.Red;
CHAPTER 11 ■ CURVE FITTING
436
ds.LineThickness = 2; ds.LinePattern = LineCharts.DataSeries.LinePatternEnum.Dash; ds.SeriesName = "2nd Order Fitting"; for (int i = 0; i < 141; i++) { double x = -1.0 + i / 20.0; double y = results[1][0] + results[1][1] * x + results[1][2] * x * x; ds.LineSeries.Points.Add(new Point(x, y)); } myChart.DataCollection.DataList.Add(ds); // 3rd order fitting data: ds = new LineCharts.DataSeries(); ds.LineColor = Brushes.DarkBlue; ds.LineThickness = 2; ds.LinePattern = LineCharts.DataSeries.LinePatternEnum.DashDot; ds.SeriesName = "3rd Order Fitting"; for (int i = 0; i < 141; i++) { double x = -1.0 + i / 20.0; double y = results[2][0] + results[2][1] * x + results[2][2] * x * x + results[2][3] * x * x * x; ds.LineSeries.Points.Add(new Point(x, y)); } myChart.DataCollection.DataList.Add(ds); myChart.IsLegend = true; myChart.LegendPosition = LineCharts.Legend.LegendPositionEnum.NorthWest; } } }
Here, we fit a polynomial of different order (from 1 to 3) to the data points. Running this application generates the results shown in Figure 11-3. You can see from the figure that for this specific set of data points, the result from the second-order polynomial fitting is almost identical to that from the third-order polynomial fitting.

CHAPTER 11 ■ CURVE FITTING
437
Figure 11-3. Polynomial curving fitting
Weighted Linear Regression As we discussed earlier, linear regression is a useful technique for representing observed data by a model function, which is formulated as a least-squares minimization problem. In the case of the linear least squares, the resulting analysis requires the solution of a set of simultaneous equations using the Gauss-Jordan method. One important assumption in linear regression is that all of the errors have the same significance.
However, there are occasions when the confidence in the accuracy of data varies from point to point. For example, there may be a drift in the precision of the measurements, and some errors may be more or less important than others. In order to take these factors into account, we can introduce a weight factor to each data point and minimize the sum of the squares of the weighted residuals:
This procedure forces the fitting function f(x) closer to the data points that have greater weight. For the simplest linear regression, i.e., the straight-line fit, whose fitting function is given by f(x) = a
+ bx, the preceding equation becomes

CHAPTER 11 ■ CURVE FITTING
438
From the minimization conditions and we can determine the coefficients a and b:
Here, xw and yw are weighted averages:
Implementation Using the algorithm developed in the previous section, we can implement the weighted linear regression. Add a new public static method, WeightedLinearRegression, to the CurveFittingAlgorithms class:
public static double[] WeightedLinearRegression(double[] xarray, double[] yarray, double[] warray) { int n = xarray.Length; double xw = 0.0; double yw = 0.0; double b1 = 0.0; double b2 = 0.0; double a = 0.0; double b = 0.0; for (int i = 0; i < n; i++) { xw += xarray[i] / n; yw += yarray[i] / n; } for (int i = 0; i < n; i++) { b1 += warray[i] * warray[i] * yarray[i] * (xarray[i] - xw); b2 += warray[i] * warray[i] * xarray[i] * (xarray[i] - xw); } b = b1 / b2; a = yw - xw * b; return new double[] { a, b }; }
Here, xarray and yarray are the sets of x and y data that present a set of given data points. The warray is the weight for each data point. This method returns the coefficients a and b of the model function.
CHAPTER 11 ■ CURVE FITTING
439
Exponential-Function Fit We can use weighted linear regression to fit various exponential functions to a given set of data points. For example, the model function f(x)=aebx, when used in the least-squares technique, usually leads to nonlinear dependence on the coefficients a and b. However, if we use log y rather than y, the problem is transformed into a linear regression. In this case, the fit function becomes
Note that the least-squares fit to the logarithm of the data is different from the least-squares fit to the original data. The residuals of the logarithmic fit are given by
and the residuals used in fitting the original data are
We can eliminate this discrepancy by weighting the logarithmic fit. From the preceding equation, we have
So the residuals of the logarithmic fit can be rewritten in the form
In the limit of we can use the approximation Ri = ri/yi. You can see that by minimizing
we need to introduce the weight factor 1/yi. We can do this if we apply the weight wi = yi when
fitting F(x) to the data points (xi, ln yi). Thus, minimizing
will be a good approximation of minimizing
Suppose we have the following set of data:
x = 1, 2 , 3, 4, 5 , 6, 7, 8, 9, 10 y = 1.9398, 2.9836, 5.9890, 10.2, 20.7414, 23.232, 69.5855, 82.5836, 98.1779 339.3256
We want to fit these data with an exponential function y = aebx. We first need to perform a logarithmic transformation log y = log a +bx and then use the WeightedLinearRegression method to calculate the coefficients log a and b.
Add a new WPF Windows application to the current project and name it WeightedLinearRegression. Here is the XAML file for this example:
<Window x:Class="CurveFitting.WeightedLinearRegression" xmlns="http://schemas.microsoft.com/winfx/2006/xaml/presentation"
CHAPTER 11 ■ CURVE FITTING
440
xmlns:x="http://schemas.microsoft.com/winfx/2006/xaml" xmlns:chart="clr-namespace:LineChartControl;assembly=LineChartControl" Title="WeightedLinearRegression" Height="320" Width="600"> <Grid x:Name="rootGrid" SizeChanged="rootGrid_SizeChanged"> <StackPanel Orientation="Horizontal"> <chart:LineChartControlLib x:Name="logChart" Xmin="0" Xmax="11" XTick="1" Title="Log Scale Plot"/> <chart:LineChartControlLib x:Name="linearChart" Xmin="0" Xmax="11" XTick="1" Title="Linear Scale Plot"/> </StackPanel> </Grid> </Window>
Here, we create two line chart controls: one to display the result in log scale and the other to display the result in linear scale. Here is the corresponding code-behind file:
using System; using System.Windows; using System.Windows.Controls; using System.Windows.Media; namespace CurveFitting { public partial class WeightedLinearRegression : Window { public WeightedLinearRegression() { InitializeComponent(); } private void rootGrid_SizeChanged(object sender, SizeChangedEventArgs e) { logChart.Width = rootGrid.ActualWidth / 2; logChart.Height = rootGrid.ActualHeight; linearChart.Width = rootGrid.ActualWidth / 2; linearChart.Height = rootGrid.ActualHeight; AddData(); } private void AddData() { double[] x0 = new double[] { 1, 2, 3, 4, 5, 6, 7, 8, 9, 10 }; double[] y0 = new double[] { 1.9398, 2.9836, 5.9890, 10.2, 20.7414, 23.232, 69.5855, 82.5836, 98.1779, 339.3256 }; double[] ylog = new double[] { 0.6626, 1.0931, 1.7899, 2.3224, 3.0321, 3.1455, 4.2426, 4.4138, 4.5868, 5.8270 }; double[] results = CurveFittingAlgorithms.WeightedLinearRegression(x0, ylog, y0); // Plot linear scale results: LinearScale(x0, y0, results); // Plot log scale results:

CHAPTER 11 ■ CURVE FITTING
441
LogScale(x0, ylog, results); } private void LinearScale(double[] x0, double[] y0, double[] results) { linearChart.DataCollection.DataList.Clear(); LineCharts.DataSeries ds; linearChart.ChartStyle.Ymin = -50; linearChart.ChartStyle.Ymax = 350; linearChart.ChartStyle.YTick = 50; linearChart.ChartStyle.YLabel = "Y"; // Plot original data: ds = new LineCharts.DataSeries(); ds.LineColor = Brushes.Transparent; ds.SeriesName = "Original"; ds.Symbols.SymbolType = LineCharts.Symbols.SymbolTypeEnum.Triangle; ds.Symbols.BorderColor = Brushes.Black; for (int i = 0; i < x0.Length; i++) { ds.LineSeries.Points.Add(new Point(x0[i], y0[i])); } linearChart.DataCollection.DataList.Add(ds); // Plot curve fittin data: ds = new LineCharts.DataSeries(); ds.LineColor = Brushes.DarkGreen; ds.LineThickness = 2; ds.SeriesName = "Curve Fitting"; for (int i = 0; i < 111; i++) { double x = 0.1 + i / 10.0; double y = Math.Exp(results[0] + results[1] * x); ds.LineSeries.Points.Add(new Point(x, y)); } linearChart.DataCollection.DataList.Add(ds); linearChart.Legend.IsLegend = true; linearChart.Legend.LegendPosition = LineCharts.Legend.LegendPositionEnum.NorthWest; } private void LogScale(double[] x0, double[] ylog, double[] results) { logChart.DataCollection.DataList.Clear(); LineCharts.DataSeries ds; logChart.ChartStyle.Ymin = 0; logChart.ChartStyle.Ymax = 7; logChart.ChartStyle.YTick = 1; logChart.ChartStyle.YLabel = "Log(y)"; // Plot original data:

CHAPTER 11 ■ CURVE FITTING
442
ds = new LineCharts.DataSeries(); ds.LineColor = Brushes.Transparent; ds.SeriesName = "Original"; ds.Symbols.SymbolType = LineCharts.Symbols.SymbolTypeEnum.Triangle; ds.Symbols.BorderColor = Brushes.Black; for (int i = 0; i < x0.Length; i++) { ds.LineSeries.Points.Add(new Point(x0[i], ylog[i])); } logChart.DataCollection.DataList.Add(ds); // Plot curve fittin data: ds = new LineCharts.DataSeries(); ds.LineColor = Brushes.DarkGreen; ds.LineThickness = 2; ds.SeriesName = "Curve Fitting"; for (int i = 0; i < 111; i++) { double x = 0.1 + i / 10.0; double y = results[0] + results[1] * x; ds.LineSeries.Points.Add(new Point(x, y)); } logChart.DataCollection.DataList.Add(ds); logChart.Legend.IsLegend = true; logChart.Legend.LegendPosition = LineCharts.Legend.LegendPositionEnum.NorthWest; } } }
Inside the AddData method, the statement
double[] results = CurveFittingAlgorithms.WeightedLinearRegression(x0, ylog, y0);
will generate the result (-0.0686983921044781, 0.578232434928087). The first number is the parameter (log a) and the second is the parameter b, which gives
ln y -0.0687 + 0.5782x
We can check how good the fit results are by plotting them graphically (see Figure 11-4). You can see from Figure 11-4 that the weighted linear regression indeed gives a reasonably good fit.

CHAPTER 11 ■ CURVE FITTING
443
Figure 11-4. Results of the weighted linear regression: log plot (left) and linear plot (right)

CHAPTER 11 ■ CURVE FITTING
444

C H A P T E R 12
■ ■ ■
445
3D Transformations
In the previous chapters, we discussed 2D charts, graphics, and transformations. This chapter will explain the mathematical basics of 3D transformations, which will be used to perform operations on 3D graphics objects. Most 3D transformations are analogous to the 2D transformations described in Chapter 2. Using homogeneous coordinates and matrix representations similar to the ones used in 2D, I’ll show you how to perform basic transformations, including translation, scaling, and rotation, in 3D. This chapter will also describe various projection matrices, which allow you to view 3D graphics objects on a 2D screen. As is the case with 2D, you can combine 3D basic transform matrices to represent complicated transformations with a single transform matrix. This chapter will also show you how WPF defines transform matrices in 3D and how to perform a variety of transformations on 3D objects.
3D Matrices in WPF Matrix representations play an important role in transformations and operations on graphics objects. A matrix is a multidimensional array. This section explains the basics of 3D matrices and transformations. General 3D transforms are quite complicated. As in the case of 2D transformations, you can build more useful transforms with combinations of simple basic transforms, including translation, scaling, rotation, and projection. The following sections describe these fundamental transformations. Once you understand how to use these basic 3D transformations, you can combine them to create more general 3D transformations.
3D Points and Vectors WPF defines two 3D Point structures: Point3D and Point4D. The Point3D structure defines the X, Y, and Z coordinates of a point in 3D space. Point4D defines the X, Y, Z, and W coordinates of a point in a 3D homogeneous coordinate system, which is used to perform transformations with nonaffine 3D matrices. The Vector3D structure defines a displacement with components X, Y, and Z in 3D space.
A vector in 3D is represented by a row array with three elements X, Y, and Z. For instance, you can create a 3D vector object using the following code snippet:
Vector3D v = new Vector3D(1, 2, 3);
Note that a Vector3D object and a Point3D object in WPF are two different objects. The following statement is invalid:
Vector3D v = new Point3D(1, 2, 3);

CHAPTER 12 ■ 3D TRANSFORMATIONS
446
However, you can define a Vector3D object using Point3D, or vice versa. The following are valid statements:
Vector3D v1 = new Point3D(2, 3, 4) - new Point3D(1, 2, 3); Vector3D v2 = (Vector3D)new Point3D(1, 2, 3); Point3D pt = (Point3D)new Vector3D(1, 2, 3);
A Vector3D object has five public properties:
• Length – Gets the length of the Vector3D.
• LengthSquared – Gets the square of the length of the Vector3D.
• X – Gets or sets the X component of the Vector3D.
• Y – Gets or sets the Y component of the Vector3D.
• Z – Gets or sets the Z component of the Vector3D.
In addition, there are methods associated with Vector3D that allow you to perform various mathematical operations on Vector3D objects. Here are some frequently used methods:
• Add – Adds a Vector3D structure to a Point3D or to another Vector3D.
• Subtract – Subtracts a Vector3D structure or a Point3D structure from a Vector3D structure.
• Multiply – Multiplies a Vector3D structure by the specified double or Matrix3D and returns the result as a Vector3D.
• Divide – Divides a Vector3D structure by a scalar and returns the result as a Vector3D.
• CrossProduct – Calculates the cross product of two Vector3D structures.
• AngleBetween – Retrieves the angle required to rotate the first Vector3D structure into the second Vector3D structure.
• Normalize – Normalizes the specified Vector3D structure.
For example:
Vector3D v1 = new Vector3D(20, 10, 0); Vector3D v2 = new Vector3D(0, 10, 20); Vector3D cross = Vector3D.CrossProduct(v1, v2); double angle = Vector3D.AngleBetween(v1, v2); v1.Normalize(); double length2 = v1.LengthSquared;
This generates the following output: cross = (100, –200, 100) and angle = 44.42 degrees. The normalized result of v1 is stored in v1 again; in this case, v1 becomes (0.802, 0.535, 0.267), which is confirmed by its length squared: length2 = 1.
A Point3D structure has three public properties:
• X – Gets or sets the X coordinate of the Point3D structure.
• Y – Gets or sets the Y coordinate of the Point3D structure.
• Z – Gets or sets the Z coordinate of the Point3D structure.

CHAPTER 12 ■ 3D TRANSFORMATIONS
447
In addition, there are methods associated with Point3D that allow you to perform various mathematical operations on Point3D objects. Here are some frequently used methods:
• Add – Adds a Point3D structure to a Vector3D and returns the results as a Point3D structure.
• Subtract – Subtracts a Point3D structure or a Vector3D structure from a Point3D structure.
• Multiply – Transforms the specified Point3D structure by a specified Matrix3D structure.
• Offset – Changes the X, Y, and Z values of the Point3D structure by a specified amount.
The Point4D structure represents a 3D point in a homogeneous coordinate system. This structure is specifically designed to perform transforms with nonaffine 3D matrices.
A Point4D structure has four public properties:
• X – Gets or sets the X component of the Point4D structure.
• Y – Gets or sets the Y component of the Point4D structure.
• Z – Gets or sets the Z component of the Point4D structure.
• W – Gets or sets the W component of the Point4D structure.
In addition, there are methods associated with Point4D that allow you to perform various mathematical operations on Point4D objects. The following are some frequently used methods:
• Add – Adds a Point4D structure to another Point4D structure.
• Subtract – Subtracts a Point4D structure from another Point4D structure.
• Multiply – Transforms the specified Point4D structure by the specified Matrix3D structure.
• Offset – Changes the X, Y, Z, and W values of the Point4D structure by a specified amount.
It is possible to cast a Point3D object to a Point4D object, as shown in the following statement:
Point4D pt4 = (Point4D)new Point3D(10, 15, 20);
The following code snippet is also valid:
Point4D pt4 = (Point4D)(Point3D)new Vector3D(10, 15, 20);
where the Vector3D object is first cast to a Point3D object, which is then cast to a Point4D object. In the preceding casting process, the Point4D object has the values pt4 = (10, 15, 20, 1). The W component with a value of 1 is automatically added.

CHAPTER 12 ■ 3D TRANSFORMATIONS
448
Matrix3D Structure WPF defines a 3D matrix structure, Matrix3D. It is a 4 x 4 matrix in the 3D homogeneous coordinate system and has the following row-vector syntax:
Unlike 2D matrices, here the last column is defined and accessible. The Matrix3D structure allows you to represent affine as well as nonaffine 3D transformations. Nonaffine transformations with nonzero M14, M24, or M34 values often represent perspective projection transformations.
All 16 of these elements are public properties of a Matrix3D structure. In particular, the elements of OffsetX, OffsetY, and OffsetZ get and set values of translation in the X, Y, and Z directions, respectively. In addition to the element properties, there are other public properties associated with the Matrix3D structure that are useful in performing matrix operations:
• Determinant – Retrieves the determinant of the Matrix3D structure.
• HasInverse – Gets a value that indicates whether the Matrix3D is invertible.
• Identity – Changes a Matrix3D structure into an identity Matrix3D.
• IsAffine – Gets a value that indicates whether the Matrix3D structure is affine.
• IsIdentity – Determines whether the Matrix3D structure is an identity Matrix3D.
You can create a Matrix3D object in WPF by using overloaded constructors, which take an array of double values as arguments. Please note that before using the Matrix3D structure in your applications, you’ll need to add a reference to the System.Windows.Media.Media3D namespace. The following code snippet creates three Matrix3D objects that perform translation, scaling, and rotation around the Z axis by specifying the corresponding matrix elements directly:
double dx = 3; double dy = 2; double dz = 1.5; double sx = 0.5; double sy = 1.5; double sz = 2.5; double theta = Math.PI / 4; double sin = Math.Sin(theta); double cos = Math.Cos(theta); Matrix3D tm = new Matrix3D( 1, 0, 0, 0, 0, 1, 0, 0, 0, 0, 1, 0, dx, dy, dz, 1); Matrix3D sm = new Matrix3D(sx, 0, 0, 0, 0, sy, 0, 0, 0, 0, sz, 0, 0, 0, 0, 1); Matrix3D rm = new Matrix3D(cos, sin, 0, 0,
CHAPTER 12 ■ 3D TRANSFORMATIONS
449
-sin, cos, 0, 0, 0, 0, 1, 0, 0, 0, 0, 1);
The matrix tm is a translation matrix that translates an object by 3 units in the X direction, by 2 units in the Y direction, and by 1.5 units in the Z direction. The scaling matrix sm scales an object by a factor of 0.5 in the X direction, by a factor of 1.5 in the Y direction, and by a factor of 2.5 in the Z direction. Finally, the matrix rm is a rotation matrix that rotates an object about the Z axis by 45 degrees.
Matrix3D Operations The Matrix3D structure in WPF provides methods to rotate, scale, and translate objects. It also uses several methods to perform matrix operations. For example, the Invert method inverts a Matrix3D object if it is invertible. This method takes no parameters. The Multiply method multiplies two matrices and returns the result in a new matrix.
You must take care when applying Matrix3D to Point3D, Point4D, and Vector3D objects. For standard scaling and rotation, Matrix3D takes a form such that the last row and the last column consist of the elements (0, 0, 0, 1). In such cases, there will be no unexpected results. For example:
Matrix3D m3 = new Matrix3D( 1, 0.5, 0, 0, -0.5, 1, 0, 0, 0, 0, 1, 0, 0, 0, 0, 1); Point3D pt3 = new Point3D(2, 3, 4); Vector3D v3 = new Vector3D(2, 3, 4); Point4D pt4 = new Point4D(2, 3, 4, 1); Point3D pt3t = pt3 * m3; Vector3D v3t = v3 * m3; Point4D pt4t = pt4 * m3;
This generates the expected results of pt3t = (0.5, 4, 4), v3t = (0.5, 4, 4), and pt4t = (0.5, 4, 4, 1) after the transformation. However, if you add a translation in the X direction to Matrix3D by changing m3 to the form
Matrix3D m3 = new Matrix3D( 1, 0.5, 0, 0, -0.5, 1, 0, 0, 0, 0, 1, 0, 100, 0, 0, 1);
then recalculating the transformation produces the output pt3t = (100.5, 4, 4), v3t = (0.5, 4, 4), and pt4t = (100.5, 4, 4, 1). You can see that a translation of 100 units in the X direction has no effect on the Vector3D object. This is because the Vector3D object is defined in real 3D space but not in a homogeneous coordinate system. The Vector3D object has no W component. When you transform a Vector3D object using Matrix3D, WPF simply uses the first 3 x 3 submatrix of the Matrix3D and neglects the last column and the last row.
For a Point3D object, even though it is defined using only the three components X, Y, and Z, WPF implicitly adds a W = 1 component to the Point3D object. That is why both pt3t and pt4t give correct results.
Now let’s change m3 into a nonaffine matrix by adding a nonzero element of M34 = 2:
Matrix3D m3 = new Matrix3D( 1, 0.5, 0, 0, -0.5, 1, 0, 0, 0, 0, 1, 2, 100, 0, 0, 1);

CHAPTER 12 ■ 3D TRANSFORMATIONS
450
This corresponds to a transform matrix with a perspective projection. After applying this transformation, you will obtain the following “strange” results:
pt3t = (11.167, 0.444, 0.444) v3t = (0.5, 4, 4) pt4t = (100.5, 4, 4, 9)
What happened here? It is easy to understand the result of v3t, since a vector always neglects the last row and the last column of a Matrix3D. Thus, v3t will remain the same when you change the elements of the last row or the last column. The result of pt4t is also expected, since it is simply a direct multiplication of pt4*m3.
Let’s take a look at pt3t. This result is obtained in two steps. First, Matrix3D and Point3D object are directly multiplied with an additional W = 1 component, which gives the result of pt4t. Then pt3t is obtained by normalizing the X, Y, and Z components of pt4t with its W component:
pt3t = (100.9/9, 4/9, 4/9) = (11.167, 0.444, 0.444)
In general, for an arbitrary Point4D = (x, y, z, w) in the homogeneous coordinate system, the plane at infinity is usually identified by a set of points with w = 0. When points are away from the plane at infinity, you can use (x/w, y/w, z/w) to define the Point3D’s X, Y, and Z components. WPF automatically performs the transform on the Point3D objects and gives you the normalized results. The discussion presented here simply shows you the mathematical basis used by WPF to perform transforms on Point3D objects.
Let’s consider an example to show you how to perform 3D matrix operations in WPF. Start with a new WPF Windows application project and call it Transformation3D. Add a new WPF Window and name it StartMenu. This window will be the main menu window, from which you can access all the examples in this chapter.
Next, add another WPF Window, called Matrix3DOperation, to the project. Here is the XAML file for this example:
<Window x:Class="Transformation3D.Matrix3DOperation" xmlns="http://schemas.microsoft.com/winfx/2006/xaml/presentation" xmlns:x="http://schemas.microsoft.com/winfx/2006/xaml" Title="Matrix3D Operation" Height="320" Width="260"> <StackPanel> <TextBlock Margin="10,10,5,5" Text="Original Matrix:"/> <TextBlock Name="tbOriginal" Margin="20,0,5,5"/> <TextBlock Name="tbOriginal1" Margin="20,0,5,5"/> <TextBlock Margin="10,0,5,5" Text="Inverted Matrix:"/> <TextBlock TextWrapping="Wrap" x:Name="tbInvert" Margin="20,0,5,5"/> <TextBlock Margin="10,0,5,5" Text="M * M_Invert:"/> <TextBlock TextWrapping="Wrap" x:Name="tbInvert1" Margin="20,0,5,5"/> <TextBlock Margin="10,0,5,5" Text="Original Matrices:"/> <TextBlock Name="tbM1" Margin="20,0,5,5"/> <TextBlock Name="tbM2" Margin="20,0,5,5"/> <TextBlock Margin="10,0,5,5" Text="M1 x M2:"/> <TextBlock Name="tbM12" Margin="20,0,5,5"/> <TextBlock Margin="10,0,5,5" Text="M2 x M1:"/> <TextBlock Name="tbM21" Margin="20,0,5,5"/> </StackPanel> </Window>
The foregoing code creates the layout, which displays results in text blocks. Here is the corresponding code-behind file for this example:
using System; using System.Windows;

CHAPTER 12 ■ 3D TRANSFORMATIONS
451
using System.Windows.Media; using System.Windows.Media.Media3D; namespace Transformation3D { public partial class Matrix3DOperation : Window { public Matrix3DOperation() { InitializeComponent(); Matrix3D M = new Matrix3D(1, 2, 3, 4, 2, 1, 0, 0, 0, 0, 1, 0, 1, 2, 3, 1); Matrix3D M1 = M; Matrix3D M2 = new Matrix3D(1, 2, 0, 0, 2, 1, 0, 3, 0, 0, 1, 2, 1, 2, 3, 1); tbOriginal.Text = "M = (" + M.ToString() + ")"; tbOriginal1.Text = "M1 = M"; // Invert matrix: M.Invert(); tbInvert.Text = "(" + Utility.Matrix3DRound(M, 3).ToString() + ")"; tbInvert1.Text = "(" + (M1 * M).ToString() + ")"; // Matrix multiplication: Matrix3D M12 = M1 * M2; Matrix3D M21 = M2 * M1; tbM1.Text = "M1 = (" + M1.ToString() + ")"; tbM2.Text = "M2 = (" + M2.ToString() + ")"; tbM12.Text = "(" + M12.ToString() + ")"; tbM21.Text = "(" + M21.ToString() + ")"; } } }
Here, you perform matrix inversions and multiplications. Note that this example uses a static method, Matrix3DRound, which is implemented in the Utility class, to display the results of the Matrix3D inversion. For your reference, here is the code snippet for this method:
public static Matrix3D Matrix3DRound(Matrix3D m, int n) { m.M11 = Math.Round(m.M11, n); m.M12 = Math.Round(m.M12, n); m.M13 = Math.Round(m.M13, n); m.M14 = Math.Round(m.M14, n); m.M21 = Math.Round(m.M21, n); m.M22 = Math.Round(m.M22, n); m.M23 = Math.Round(m.M23, n); m.M24 = Math.Round(m.M24, n); m.M31 = Math.Round(m.M31, n);

CHAPTER 12 ■ 3D TRANSFORMATIONS
452
m.M32 = Math.Round(m.M32, n); m.M33 = Math.Round(m.M33, n); m.M34 = Math.Round(m.M34, n); m.OffsetX = Math.Round(m.OffsetX, n); m.OffsetY = Math.Round(m.OffsetY, n); m.OffsetZ = Math.Round(m.OffsetZ, n); m.M44 = Math.Round(m.M44, n); return m; }
This method allows you to round the decimals of matrix elements for a Matrix3D object. You can see that the results of the matrix multiplications depend on the order of the matrices. By executing the project and selecting Matrix3DOperation from the Start Menu, you will obtain the output shown in Figure 12-1. First, we examine the matrix Invert method, which inverts the matrix (1, 2, 3, 4, 2, 1, 0, 0, 0, 0, 1, 0, 1, 2, 3, 1). The Matrix3D.Invert method gives the result shown in the figure. You can confirm this result by directly multiplying M and its inverted matrix, which will indeed give you an identity matrix.
Figure 12-1. Results of Matrix3D operations in WPF
For matrix multiplications, as expected, the result depends on the order of the matrices. The results shown in Figure 12-1 demonstrate that M1 * M2 ≠ M2 * M1.

CHAPTER 12 ■ 3D TRANSFORMATIONS
453
Matrix3D Transforms The Matrix3D structure in WPF also provides methods to rotate, scale, and translate matrices. Here are some of the most frequently used methods for Matrix3D operations:
• Scale – Appends the specified scale Vector3D to the Matrix3D structure.
• ScaleAt – Scales the Matrix3D by the specified Vector3D about the specified Point3D.
• Translate – Appends a translation of the specified offsets to the current Matrix3D structure.
• Rotate – Appends a rotation transformation to the current Matrix3D.
• RotateAt – Rotates the Matrix3D about the specified Point3D.
• Invert – Inverts the Matrix3D structure.
• Multiply – Multiplies the specified matrices.
• Transform – Transforms the specified Point3D, array of Point3D objects, Point4D, array of Point4D objects, Vector3D, or array of Vector3D objects by the Matrix3D.
Please note that there is no Skew transform in the Matrix3D structure. To perform a Skew transformation in 3D, you need to manipulate the elements of the Matrix3D object directly. There are corresponding Prepend methods associated with the scale, translation, and rotation transformations. The default methods are Append. Both Append and Prepend determine the matrix operation order. Append specifies that the new operation be applied after the preceding operation; Prepend specifies that the new operation be applied before the preceding operation during cumulative operations.
Let’s illustrate the basic Matrix3D transforms (translation, scaling, and rotation) in WPF using an example. Add a new WPF Window to the project Transformation3D, and call it Matrix3DTransforms. The following is the XAML file for this example:
<Window x:Class=" Transformation3D.Matrix3DTransforms" xmlns="http://schemas.microsoft.com/winfx/2006/xaml/presentation" xmlns:x="http://schemas.microsoft.com/winfx/2006/xaml" Title="Matrix3D Transformations" Height="450" Width="300"> <StackPanel> <TextBlock Margin="10,10,5,5" Text="Original Matrix:"/> <TextBlock Name="tbOriginal" Margin="20,0,5,5"/> <TextBlock Margin="10,0,5,5" Text="Scale:"/> <TextBlock Name="tbScale" Margin="20,0,5,5"/> <TextBlock Margin="10,0,5,5" Text="Scale - Prepend:"/> <TextBlock Name="tbScalePrepend" Margin="20,0,5,5"/> <TextBlock Margin="10,0,5,5" Text="Translation:"/> <TextBlock Name="tbTranslate" Margin="20,0,5,5"/> <TextBlock Margin="10,0,5,5" Text="Translation - Prepend:"/> <TextBlock Name="tbTranslatePrepend" Margin="20,0,5,5"/> <TextBlock Margin="10,0,5,5" Text="Rotation:"/> <TextBlock Name="tbRotate" Margin="20,0,5,5" TextWrapping="Wrap"/> <TextBlock Margin="10,0,5,5" Text="Rotation - Prepend:"/> <TextBlock Name="tbRotatePrepend" Margin="20,0,5,5" TextWrapping="Wrap"/> <TextBlock Margin="10,0,5,5" Text="RotationAt:"/> <TextBlock Name="tbRotateAt" Margin="20,0,5,5" TextWrapping="Wrap"/> <TextBlock Margin="10,0,5,5" Text="RotationAt - Prepend:"/> <TextBlock Name="tbRotateAtPrepend" Margin="20,0,5,5" TextWrapping="Wrap"/>

CHAPTER 12 ■ 3D TRANSFORMATIONS
454
</StackPanel> </Window>
The foregoing code creates a layout that displays results using text blocks, which are embedded in a StackPanel control. The corresponding code-behind file is given by the following code:
using System; using System.Windows; using System.Windows.Media; using System.Windows.Media.Media3D; namespace Transformation3D { public partial class Matrix3DTransforms: Window { public Matrix3DTransforms() { InitializeComponent(); // Original matrix: Matrix3D M = new Matrix3D(1, 2, 3, 4, 2, 1, 0, 0, 0, 0, 1, 0, 1, 2, 3, 1); Matrix3D M1 = M; tbOriginal.Text = "(" + M.ToString() + ")"; //Scale: M.Scale(new Vector3D(0.5, 1.5, 2.5)); tbScale.Text = "(" + M.ToString() + ")"; M = M1; // Reset M to the original matrix. M.ScalePrepend(new Vector3D(0.5, 1.5, 2.5)); tbScalePrepend.Text = "(" + M.ToString() + ")"; //Translation: M = M1; // Reset M to the original matrix. M.Translate(new Vector3D(100, 150, 200)); tbTranslate.Text = "(" + M.ToString() + ")"; // Translation - Prepend: M = M1; // Reset M to the original matrix. M.TranslatePrepend(new Vector3D(100, 150, 200)); tbTranslatePrepend.Text = "(" + M.ToString() + ")"; // Rotation: M = M1; // Reset M to the original matrix. M.Rotate(new Quaternion(new Vector3D(1, 2, 3), 45)); tbRotate.Text = "(" + Utility.Matrix3DRound(M, 3).ToString() + ")"; // Rotation - Prepend: M = M1; // Reset M to the original matrix. M.RotatePrepend(new Quaternion(new Vector3D(1, 2, 3), 45)); tbRotatePrepend.Text = "(" + Utility.Matrix3DRound(M, 3).ToString() + ")";

CHAPTER 12 ■ 3D TRANSFORMATIONS
455
//Rotation at (x = 10, y = 20, z = 30): M = M1; // Reset M to the original matrix. M.RotateAt(new Quaternion(new Vector3D(1, 2, 3), 45), new Point3D(10, 20, 30)); tbRotateAt.Text = "(" + Utility.Matrix3DRound(M, 3).ToString() + ")"; // Rotation at (x = 10, y = 20, z = 30) - Prepend: M = M1; // Reset M to the original matrix. M.RotateAtPrepend(new Quaternion(new Vector3D(1, 2, 3), 45), new Point3D(10, 20, 30)); tbRotateAtPrepend.Text = "(" + Utility.Matrix3DRound(M, 3).ToString() + ")"; } } }
Building and running this example generates the output shown in Figure 12-2. The original Matrix3D object M is operated on by various transforms. Next, we’ll examine the WPF results using direct matrix computations.
Figure 12-2. Results of the Matrix3D transformations

CHAPTER 12 ■ 3D TRANSFORMATIONS
456
First, let’s examine the scale transformation, which sets a scaling factor of 0.5 in the X direction, 1.5 in the Y direction, and 2.5 in the Z direction. You must specify these scale parameters using a Vector3D object. For the Append scaling (the default setting), we have
This gives the same result seen in Figure 12-2. On the other hand, for the Prepend scaling, we have
This confirms the output shown in Figure 12-1. Next, you translate the matrix M by 100 units in the X direction, 150 units in the Y direction, and 200
units in the Z direction. For the default Append translation, you have
This is consistent with the results shown in Figure 12-2. The Prepend translation involves the following transformation:
This is also confirmed by the result shown in Figure 12-2.
Rotation and Quaternion Rotation is one of the most commonly used transforms in 3D. 3D rotation about an arbitrary axis is also one of the most complex 3D transforms. WPF uses quaternion notation, which can be specified either by a position Vector3D object and a rotation angle or by four quaternion components in the form of (x, y, z, w).
You can calculate the quaternion components from a rotation axis vector and rotation angle, but note that the axis vector must be normalized. Suppose that the rotation axis for a 3D rotation is denoted

CHAPTER 12 ■ 3D TRANSFORMATIONS
457
by a unit Vector3D object (ax, ay, az) and the rotation angle is θ. You can find the quaternion (x, y, z, w) using the following formula:
(12.1)
For the rotation transform demonstrated in the Matrix3DTransforms example, you rotate the original M matrix by 45 degrees along the axis specified by a Vector3D object (1, 2, 3). The unit rotation axis can be obtained by normalizing this Vector3D object:
and θ = 45 degrees. You can then easily calculate its quaternion using Equation (12.1):
You can see that the preceding quaternion (x, y, z, w) is also normalized to unity. Using this quaternion, you can construct the rotation matrix:
From this rotation matrix, you can examine the effect of the rotation on the original Matrix3D object M. In the case of the Append rotation, we have
This result is the same as that given in Figure 12-2. For the Prepend rotation, we have

CHAPTER 12 ■ 3D TRANSFORMATIONS
458
This result is also consistent with that given in Figure 12-2. The RotateAt method in 3D is designed for cases in which you need to change the center of rotation.
In fact, the Rotate method is a special case of RotateAt, with the rotation center at (0, 0, 0). The rotation center in 3D is specified by a Point3D object. In this example, the matrix is rotated at the point (10, 20, 30). As we’ve discussed previously, the rotation of an object about an arbitrary point P1 must be performed according to the following procedures:
• Translate P1 to the origin.
• Rotate the object to the desired angle.
• Translate so that the point at the origin returns to P1.
Considering the definition of matrix transforms in WPF, the rotation matrix at the point (10, 30, 20) should be expressed in the following form:
Thus, the Append rotation of matrix M at point (10, 30, 20) becomes:
This again confirms the result shown in Figure 12-2. Similarly, the Prepend rotation of Matrix3D object M at point (10, 30, 20) should be
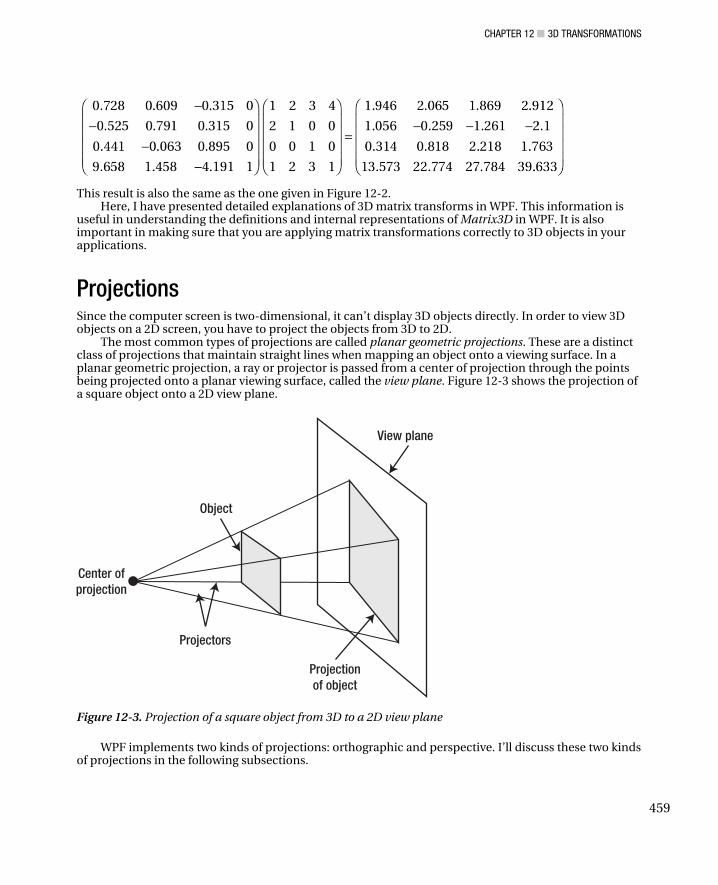
CHAPTER 12 ■ 3D TRANSFORMATIONS
459
This result is also the same as the one given in Figure 12-2. Here, I have presented detailed explanations of 3D matrix transforms in WPF. This information is
useful in understanding the definitions and internal representations of Matrix3D in WPF. It is also important in making sure that you are applying matrix transformations correctly to 3D objects in your applications.
Projections Since the computer screen is two-dimensional, it can’t display 3D objects directly. In order to view 3D objects on a 2D screen, you have to project the objects from 3D to 2D.
The most common types of projections are called planar geometric projections. These are a distinct class of projections that maintain straight lines when mapping an object onto a viewing surface. In a planar geometric projection, a ray or projector is passed from a center of projection through the points being projected onto a planar viewing surface, called the view plane. Figure 12-3 shows the projection of a square object onto a 2D view plane.
Figure 12-3. Projection of a square object from 3D to a 2D view plane
WPF implements two kinds of projections: orthographic and perspective. I’ll discuss these two kinds of projections in the following subsections.

CHAPTER 12 ■ 3D TRANSFORMATIONS
460
Orthographic Projections Orthographic projection is kind of parallel projection, meaning that the center of projection is located at an infinite distance from the view plane. By placing the center of projection at an infinite distance from the view plane, the projectors become parallel to the view plane. For a parallel projection, instead of specifying a center of projection, you need to specify a direction of projection. Figure 12-4 shows a parallel projection of a square object onto the view plane.
Figure 12-4. A parallel projection of a square object
In addition to being parallel, projectors in an orthographic projection are perpendicular to the view plane. Orthographic projections are often used in architectural and mechanical drawings. We can categorize them further as either multiview or axonometric projections, which we describe next.
Multiview Projections A multiview projection shows a single face of a 3D object. Common choices for viewing a 3D object in 2D include front, side, and top view. Figure 12-5 shows a house object as well as its front, side, and top views.
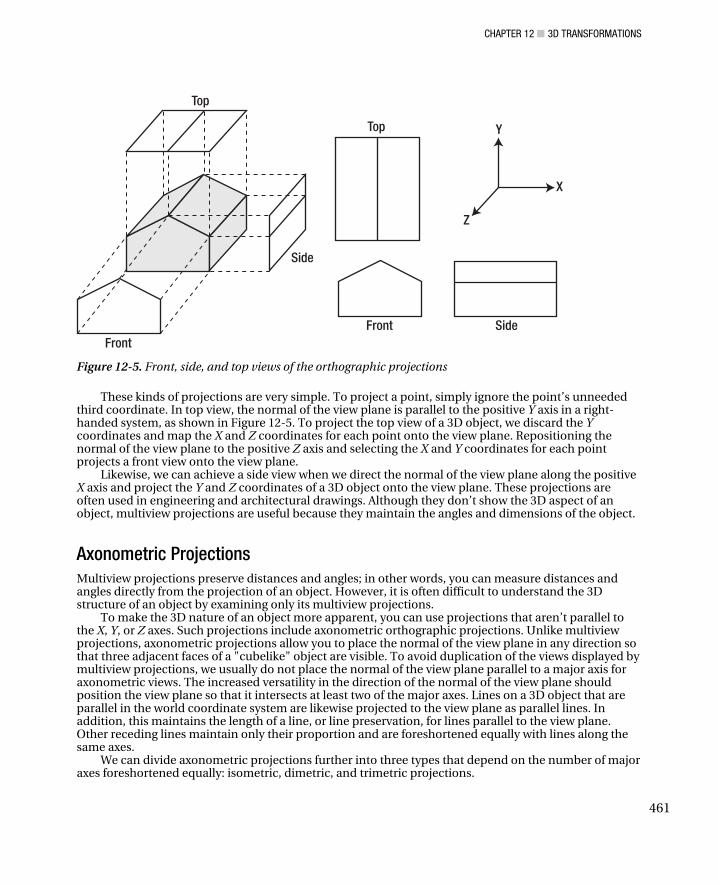
CHAPTER 12 ■ 3D TRANSFORMATIONS
461
Figure 12-5. Front, side, and top views of the orthographic projections
These kinds of projections are very simple. To project a point, simply ignore the point’s unneeded third coordinate. In top view, the normal of the view plane is parallel to the positive Y axis in a right-handed system, as shown in Figure 12-5. To project the top view of a 3D object, we discard the Y coordinates and map the X and Z coordinates for each point onto the view plane. Repositioning the normal of the view plane to the positive Z axis and selecting the X and Y coordinates for each point projects a front view onto the view plane.
Likewise, we can achieve a side view when we direct the normal of the view plane along the positive X axis and project the Y and Z coordinates of a 3D object onto the view plane. These projections are often used in engineering and architectural drawings. Although they don’t show the 3D aspect of an object, multiview projections are useful because they maintain the angles and dimensions of the object.
Axonometric Projections Multiview projections preserve distances and angles; in other words, you can measure distances and angles directly from the projection of an object. However, it is often difficult to understand the 3D structure of an object by examining only its multiview projections.
To make the 3D nature of an object more apparent, you can use projections that aren’t parallel to the X, Y, or Z axes. Such projections include axonometric orthographic projections. Unlike multiview projections, axonometric projections allow you to place the normal of the view plane in any direction so that three adjacent faces of a "cubelike" object are visible. To avoid duplication of the views displayed by multiview projections, we usually do not place the normal of the view plane parallel to a major axis for axonometric views. The increased versatility in the direction of the normal of the view plane should position the view plane so that it intersects at least two of the major axes. Lines on a 3D object that are parallel in the world coordinate system are likewise projected to the view plane as parallel lines. In addition, this maintains the length of a line, or line preservation, for lines parallel to the view plane. Other receding lines maintain only their proportion and are foreshortened equally with lines along the same axes.
We can divide axonometric projections further into three types that depend on the number of major axes foreshortened equally: isometric, dimetric, and trimetric projections.
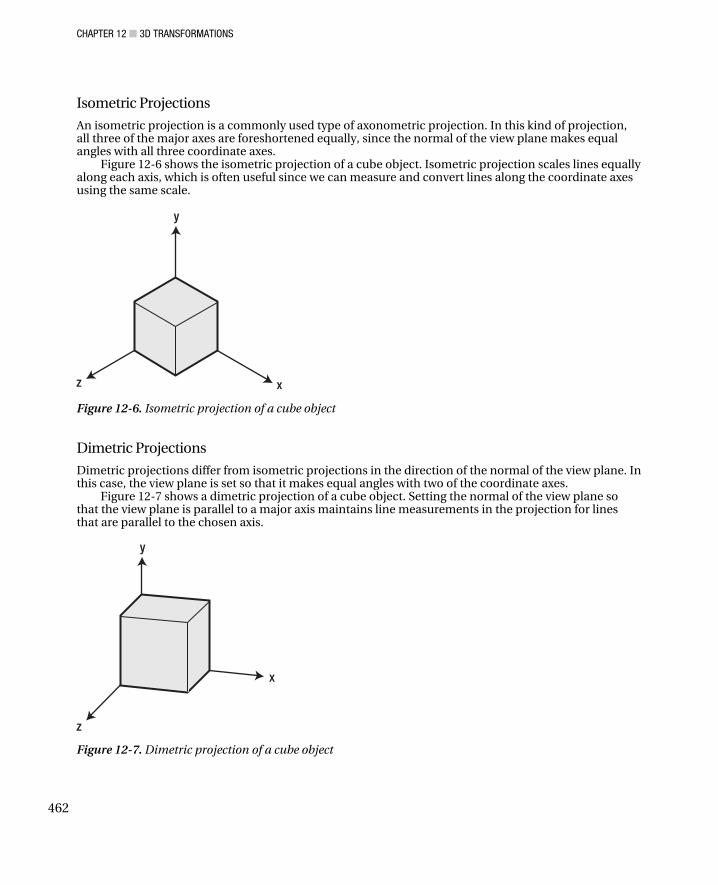
CHAPTER 12 ■ 3D TRANSFORMATIONS
462
Isometric Projections
An isometric projection is a commonly used type of axonometric projection. In this kind of projection, all three of the major axes are foreshortened equally, since the normal of the view plane makes equal angles with all three coordinate axes.
Figure 12-6 shows the isometric projection of a cube object. Isometric projection scales lines equally along each axis, which is often useful since we can measure and convert lines along the coordinate axes using the same scale.
Figure 12-6. Isometric projection of a cube object
Dimetric Projections
Dimetric projections differ from isometric projections in the direction of the normal of the view plane. In this case, the view plane is set so that it makes equal angles with two of the coordinate axes.
Figure 12-7 shows a dimetric projection of a cube object. Setting the normal of the view plane so that the view plane is parallel to a major axis maintains line measurements in the projection for lines that are parallel to the chosen axis.
Figure 12-7. Dimetric projection of a cube object

CHAPTER 12 ■ 3D TRANSFORMATIONS
463
Trimetric Projections
In trimetric projection, the normal of the view plane makes different angles with each coordinate axis, since no two components have the same value. As with a dimetric view, a trimetric view can display different orientations when differing amounts of emphasis are placed on the faces. A potential disadvantage of the trimetric projections is that measuring lines along the axes becomes difficult due to the difference in scaling factors.
Figure 12-8 shows a trimetric projection of a cube object. You can see how the unequal-foreshortening characteristic of this type of projection affects line measurements along the different axes. While disadvantageous for maintaining measurements, a trimetric projection, with the correct orientation, can offer a realistic and natural view of an object.
Figure 12-8. Trimetric projection of a cube object
In addition to orthographic projections, parallel projections include oblique projections. Oblique projections are useful because they combine the advantageous qualities of both multiview and axonometric projections. Like axonometric projections, this type of projection emphasizes the 3D features of an object. At the same time, like multiview projections, oblique views display the exact shape of one face. Oblique view uses parallel projectors, but the angle between the projectors and the view plane is no longer orthogonal. Because of these properties, more than one face of the object is visible in an oblique projection. We will not discuss oblique projections further in this book. For more information about these projections and their projection matrices, please refer to my other book, Practical C# Charts and Graphics.
Perspective Projections In a perspective projection, objects of equal size at different distances from the view plane will be projected at different sizes, so nearer objects will appear closer. The projectors pass from a center of projection through each point in the object onto the view plane.
Figure 12-9 shows a perspective projection of two identical square objects. The square that is farther from the center of projection is projected as a smaller image on the view plane.

CHAPTER 12 ■ 3D TRANSFORMATIONS
464
Figure 12-9. Perspective projections: Objects farther from the center of projection appear smaller than
closer objects.
In comparison to parallel projections, perspective projections often provide a more natural and realistic view of a 3D object. If we compare the view plane of a perspective projection with the view seen from the lens of a camera, we can easily understand the underlying principle of perspective projection. Like the view from a camera, lines in a perspective projection that are not parallel to the view plane converge at a distant point (called the vanishing point) in the background. When the eye or camera is positioned close to the object, perspective foreshortening occurs, with distant objects appearing smaller in the view plane than closer objects of the same size, as shown in Figure 12-9.
We can classify perspective projections by the number of vanishing points they contain. There are three types of perspective projections: one-point, two-point, and three-point perspective projections. Each type differs in the orientation of the view plane and the number of vanishing points.
One-Point Perspective Projections In one-point perspective, lines of a 3D object along a coordinate axis converge at a single vanishing point and lines parallel to the other axes remain horizontal or vertical in the view plane. To create a one-point perspective view, we set the view plane parallel to one of the principal planes in the world coordinate system. Figure 12-10 shows a one-point perspective view of a cube. In this projection, we have positioned the view plane in front of the cube and parallel to the X-Y plane.
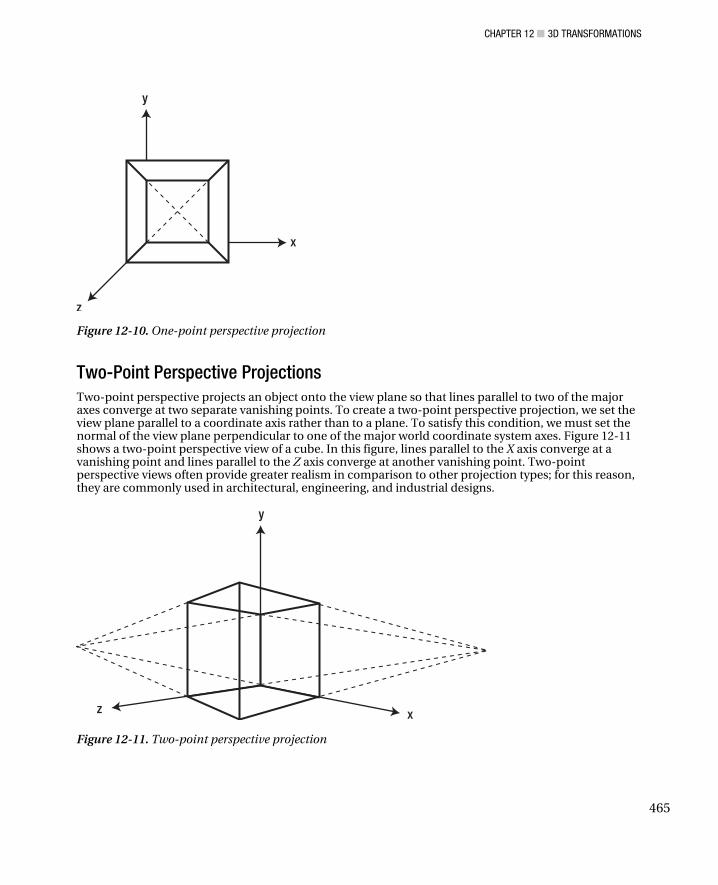
CHAPTER 12 ■ 3D TRANSFORMATIONS
465
Figure 12-10. One-point perspective projection
Two-Point Perspective Projections Two-point perspective projects an object onto the view plane so that lines parallel to two of the major axes converge at two separate vanishing points. To create a two-point perspective projection, we set the view plane parallel to a coordinate axis rather than to a plane. To satisfy this condition, we must set the normal of the view plane perpendicular to one of the major world coordinate system axes. Figure 12-11 shows a two-point perspective view of a cube. In this figure, lines parallel to the X axis converge at a vanishing point and lines parallel to the Z axis converge at another vanishing point. Two-point perspective views often provide greater realism in comparison to other projection types; for this reason, they are commonly used in architectural, engineering, and industrial designs.
Figure 12-11. Two-point perspective projection

CHAPTER 12 ■ 3D TRANSFORMATIONS
466
Three-Point Perspective Projections A three-point perspective projection has three vanishing points. In this case, the view plane is not parallel to any of the major axes. To position the view plane, each component of the view plane’s normal is set to a nonzero value so that the view plane intersects three major axes. Artists often use three-vanishing-point projection for highlighting features or increasing dramatic effect. Figure 12-12 shows a three-point perspective projection of a cube.
Figure 12-12. Three-point perspective projection
Perspective Projection Matrix Constructing a general perspective projection matrix is quite complicated. Here, we will only discuss a simple case of perspective projection. This simple perspective view projects onto the X-Y plane when the center of projection lies on the Z axis. Figure 12-13 shows a point P = (x, y, z) being projected onto the point P1 = (x1, y1, z1) in the X-Y plane. The center of projection is located at (0, 0, d), where d is the distance along the Z axis. On the right of Figure 12-13 is a side view of the projection showing the Y and Z axes. The point A is the center of projection, and the point B is the point on the Z axis that has the same Z coordinates as point P.
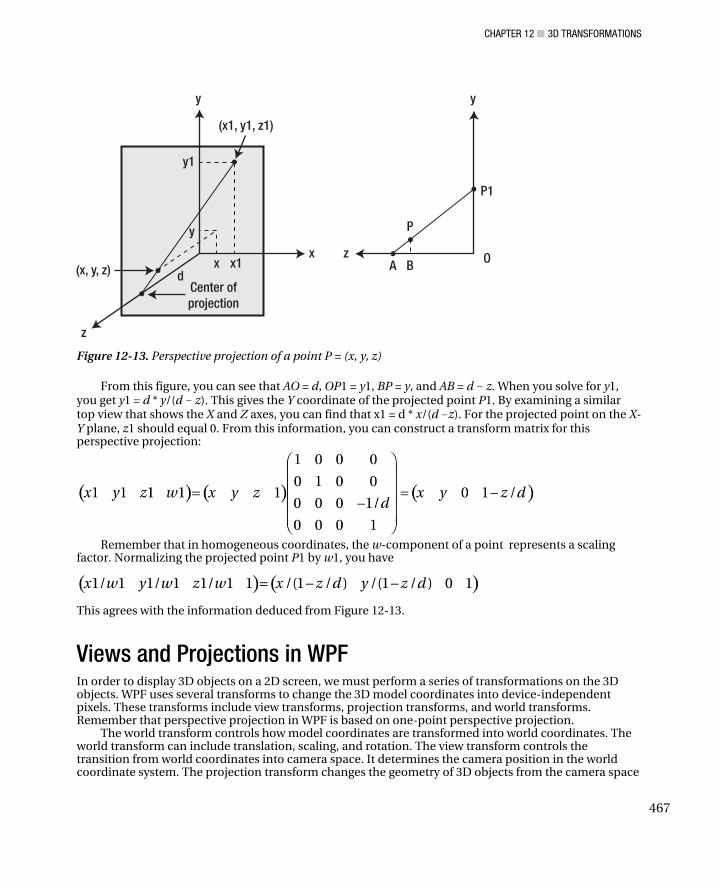
CHAPTER 12 ■ 3D TRANSFORMATIONS
467
Figure 12-13. Perspective projection of a point P = (x, y, z)
From this figure, you can see that AO = d, OP1 = y1, BP = y, and AB = d - z. When you solve for y1, you get y1 = d * y/(d - z). This gives the Y coordinate of the projected point P1. By examining a similar top view that shows the X and Z axes, you can find that x1 = d * x/(d -z). For the projected point on the X-Y plane, z1 should equal 0. From this information, you can construct a transform matrix for this perspective projection:
Remember that in homogeneous coordinates, the w-component of a point represents a scaling
factor. Normalizing the projected point P1 by w1, you have
This agrees with the information deduced from Figure 12-13.
Views and Projections in WPF In order to display 3D objects on a 2D screen, we must perform a series of transformations on the 3D objects. WPF uses several transforms to change the 3D model coordinates into device-independent pixels. These transforms include view transforms, projection transforms, and world transforms. Remember that perspective projection in WPF is based on one-point perspective projection.
The world transform controls how model coordinates are transformed into world coordinates. The world transform can include translation, scaling, and rotation. The view transform controls the transition from world coordinates into camera space. It determines the camera position in the world coordinate system. The projection transform changes the geometry of 3D objects from the camera space

CHAPTER 12 ■ 3D TRANSFORMATIONS
468
into the clipping space and applies perspective distortion to the objects. The clipping space refers to how the geometry is clipped to the view volume during this transformation. Finally, the geometry in the clipping space is transformed into device-independent pixels (the screen space). This transform is controlled by the Viewport settings.
WPF provides a variety of classes that allow you to perform various transformations on 3D objects. It also constructs transform matrices for View and Projection and performs the corresponding transforms behind the scene. For your part, you simply need to specify the Camera and Viewport settings. Technically, in order to create 3D objects in WPF, you don’t need to know the matrices of view and projection transforms. However, understanding the mathematical basics of these transform matrices and knowing how to construct them from Camera and Viewport settings is still very important in developing professional 3D graphics applications. For example, if you want to customize the Camera and Viewport settings provided by WPF, you’ll have to construct your own view and projection transform matrices.
In the following sections, you’ll learn how to construct the view and projection transform matrices that are used in WPF.
View Transform In order to display 3D objects on a 2D computer screen, you must first decide how you want to position the objects in the scene, and you must choose a vantage point from which to view the scene.
The transformation process used to create the scene for viewing is analogous to taking a photograph with a camera. Using a view transform is analogous to positioning and aligning a camera. A view transform changes the position and orientation of the viewport.
View transforms locate the viewer in world space and transform 3D objects into camera space. In camera space, the camera (or viewer) is at the origin, looking in the negative Z direction. Recall that WPF uses a right-handed coordinate system, so Z is negative in a scene. The view matrix relocates the objects in the world coordinate system around a camera’s position — the origin and orientation of the camera.
There are many ways to construct a view matrix. In each case, the camera has a logical position and orientation in world space, which serves as a starting point to create a view matrix. We will apply this view matrix to the models in a scene. The view matrix translates and rotates objects in order to place them in camera space, where the camera is at the origin. One way to construct a view matrix is to combine a translation matrix with rotation matrices for each axis. Here are steps to obtain a view transform:
• Translate a given camera position to the origin.
• Rotate about the Y axis in the world space to bring the camera coordinate’s Z axis into the Y-Z plane of world coordinates.
• Rotate about the world coordinate X axis to align the Z axes of both the world and camera systems.
• Rotate about the world coordinate Z axis to align the Y axis in both the world and camera spaces.
Then, the view transform can be written in the form
In this formula, V is the view matrix, T is a translation matrix that repositions objects (or the camera) in the world space, and R(x), R(y), and R(z) are rotation matrices that rotate objects along the X, Y, and Z axes, respectively. The translation and rotation matrices are based on the camera’s logical position and orientation in world space. So if the camera’s logical position in the world is (10, 20, 30), the purpose of the translation matrix is to move objects –10 units along the X axis, –20 units along the Y axis, and –30

CHAPTER 12 ■ 3D TRANSFORMATIONS
469
units along the Z axis. The rotation matrices in the formula are based on the camera’s orientation, in terms of the degree to which we rotate the axes of camera space out of alignment with the world space.
In practice, we specify the relationship between the camera and the object by three sets of arguments: the camera position P(x, y, z), the look at vector N, which defines the camera’s look-at direction, and the up vector U, which indicates which is the up-direction of the camera. Choose the camera position to yield the desired view of the scene, which will typically be somewhere in the middle of the scene. WPF uses these three quantities to set the camera. Here, I’ll show you how to construct the view transform matrix using these three parameters.
• Create three vectors in 3D space: XScale, YScale, and ZScale.
• Normalize N and U; i.e., let both N and U be unit vectors.
• Let ZScale = N; i.e., set ZScale to the look-at direction.
• Compute YScale using the formula .
• Compute XScale using the formula .
• Construct an M matrix in the 3D homogeneous coordinate system
.
• Translate the camera position to the origin and reflect it about the Z axis. Thus, the view transform matrix V is given by ,
where T is a translation matrix and S is a scaling matrix with a scaling factor of sz = -1, which corresponds to a reflection about the Z axis.
You can easily construct a view transform matrix following the foregoing steps. Open the Transformation3D project and add a public static method, SetViewMatrix, to the Utility class:
public static Matrix3D SetViewMatrix(Point3D cameraPosition, Vector3D lookDirection, Vector3D upDirection) { // Normalize vectors: lookDirection.Normalize(); upDirection.Normalize(); // Define vectors, XScale, YScale, and ZScale: double denom = Math.Sqrt(1 - Math.Pow(Vector3D.DotProduct(lookDirection, upDirection), 2)); Vector3D XScale = Vector3D.CrossProduct(lookDirection, upDirection) / denom; Vector3D YScale = (upDirection – (Vector3D.DotProduct(upDirection, lookDirection)) * lookDirection) / denom; Vector3D ZScale = lookDirection;

CHAPTER 12 ■ 3D TRANSFORMATIONS
470
// Construct M matrix: Matrix3D M = new Matrix3D(); M.M11 = XScale.X; M.M21 = XScale.Y; M.M31 = XScale.Z; M.M12 = YScale.X; M.M22 = YScale.Y; M.M32 = YScale.Z; M.M13 = ZScale.X; M.M23 = ZScale.Y; M.M33 = ZScale.Z; // Translate the camera position to the origin: Matrix3D translateMatrix = new Matrix3D(); translateMatrix.Translate(new Vector3D(-cameraPosition.X, -cameraPosition.Y, -cameraPosition.Z)); // Define reflect matrix about the Z axis: Matrix3D reflectMatrix = new Matrix3D(); reflectMatrix.M33 = -1; // Construct the View matrix: Matrix3D viewMatrix = translateMatrix * M * reflectMatrix; return viewMatrix; }
Perspective Projection The preceding section described how to compose the view transform matrix so that you can apply the correct modeling and viewing transform. In this section, I’ll explain how to define the desired perspective projection matrix in WPF, which is needed to transform the vertices in your scene.
View Frustum In earlier sections of this chapter we discussed the projections in a general way, but we didn’t consider the effect of the camera and viewport settings on projections. Now we need to consider these factors in order to apply projections in real-world WPF graphics applications.
The purpose of the projection transformation is to define a view volume, called View Frustum, which we use in two ways. The frustum determines how an object is projected onto the screen. It also defines which objects or portions of objects are clipped out of the final image.
The key feature of perspective projection is foreshortening: The farther an object is from the camera, the smaller it appears on the screen. This occurs because the frustum for a perspective projection is a truncated pyramid whose top has been cut off by a plane parallel to its base. Objects falling within the frustum are projected toward the apex of the pyramid, where the camera is located. Objects that are closer to the camera appear larger because they occupy a proportionately larger amount of the viewing volume than those that are farther away. This method of projection is commonly used in 3D computer graphics and visual simulation, because it is similar to how a camera works.
Remember that the viewing volume is used to clip objects that lie outside of it; the four sides of the frustum, its top, and its base correspond to the six clipping planes of the viewing volume, as shown in Figure 12-14. Objects or parts of objects outside these planes are clipped from the final image.

CHAPTER 12 ■ 3D TRANSFORMATIONS
471
Figure 12-14. Projective view frustum
Perspective Transform Matrix Now our task is to construct the perspective transform matrix used in WPF. A perspective projection maps the X and Y coordinates onto the projection plane while maintaining depth information, which we can achieve by mapping the view frustum onto a cube. This cube is the projection into 3D space of what is called the clip space, which is centered at the origin and extends from –1 to 1 on each of the X, Y, and Z axes.
Let P = (x, y, z, 1) be a point in the camera space that lies inside the view frustum. We will try to construct the projection matrix using the parameters of this view frustum. The left edge of the rectangle carved out of the near plane by the four side planes of the view frustum will be at x = l, the right edge at x = r, the bottom edge at y = b, and the top edge at y = t.
The near plane and the far plane are located at z = –zn and zf in the right-hand coordinate system. Thus, you can calculate the projected x1 and y1 coordinates of the point P on the near plane:
(12.2)
Note that z < 0 because the camera points in the negative Z direction. We want to map these coordinates into the range [–1, 1], which is needed to fit the view frustum into the clip space. This can be done using the following relationships:
(12.3)
Substituting x1 and y1 in Equation (12.3) using Equation (12.1) yields:

CHAPTER 12 ■ 3D TRANSFORMATIONS
472
(12.4)
I should point out here that the range used to map the projected Z component is different for different technologies. In the OpenGL platform, this mapping range is from –1 to +1. However, Microsoft uses the mapping range [0, 1] for its Direct3D and WPF frameworks. These two mapping ranges do give slightly different projection matrices; however, they have no effect on the final image displayed on your screen.
Here, we’ll use Microsoft convention. That is, we will use the range [0, 1] for mapping the projected Z component. This mapping involves a somewhat more complex computation. Since the point P lies inside the view frustum, its Z component must be within the range [–zf, –zn]. We need to find a function that maps –zn → 0, –zf → 1. Assume that the mapping function has the following form:
(12.5)
You can solve for the coefficients C1 and C2 by plugging in the known mappings –zn → 0 and –zf → 1 to obtain
and
Solving these equations yields the following results:
Substituting the foregoing equations into Equation (12.5) yields
(12.6)
You can see from Equations (12.4) and (12.6) that x2, y2, and z2 are all divided by –z, so the 3D point P2 = (x2, y2, z2) is equivalent to the following 4D point in the homogeneous coordinate system:
From Equations (12.4) and (12.6) we obtain the values of –x2 z, –y2 z, and –z2 z by means of the following equations:

CHAPTER 12 ■ 3D TRANSFORMATIONS
473
The foregoing equations can be rewritten in matrix form:
(12.7)
The Mperpective in Equation (12.7) is the perspective projection matrix. This matrix is in a general form and applies to the view frustum both if it’s symmetric and if it’s not.
For a symmetric view frustum, you can specify the width (w) and the height (h) of the near plane and use the following relationships:
Then the perspective matrix in Equation (12.7) reduces to
(12.8)
Sometimes, it is convenient to specify the view frustum using the field of view (fov) in the Y direction and the aspect ratio, instead of the width and the height. In this case, we have the following relationships:
Here, aspectRatio = w/h. Thus you can express the perspective matrix in terms of the field of view angle:

CHAPTER 12 ■ 3D TRANSFORMATIONS
474
(12.9)
Implementing Perspective Transforms WPF has implemented a PerspectiveCamera class, which requires a symmetric view frustum with a square near and far plane. It uses the field of view and the distances to the near plane and the far plane as input parameters. Although it is convenient, this class does have many limitations. If you want to customize your perspective transforms, you need to implement your own perspective transform matrix and pass it to the MatrixCamera class.
Now you are ready to implement the customized perspective matrices described in Equations (12.7) to (12.9). Open the project Transformation3D and add the following three public static methods to the Utility class:
public static Matrix3D SetPerspectiveOffCenter(double left, double right, double bottom, double top, double near, double far) { Matrix3D perspectiveMatrix = new Matrix3D(); perspectiveMatrix.M11 = 2 * near / (right - left); perspectiveMatrix.M22 = 2 * near / (top - bottom); perspectiveMatrix.M31 = (right + left) / (right - left); perspectiveMatrix.M32 = (top + bottom) / (top - bottom); perspectiveMatrix.M33 = far / (near - far); perspectiveMatrix.M34 = -1.0; perspectiveMatrix.OffsetZ = near * far / (near - far); perspectiveMatrix.M44 = 0; return perspectiveMatrix; } public static Matrix3D SetPerspective(double width, double height, double near, double far) { Matrix3D perspectiveMatrix = new Matrix3D(); perspectiveMatrix.M11 = 2 * near / width; perspectiveMatrix.M22 = 2 * near / height; perspectiveMatrix.M33 = far / (near - far); perspectiveMatrix.M34 = -1.0; perspectiveMatrix.OffsetZ = near * far / (near - far); perspectiveMatrix.M44 = 0; return perspectiveMatrix; } public static Matrix3D SetPerspectiveFov(double fov, double aspectRatio, double near, double far)

CHAPTER 12 ■ 3D TRANSFORMATIONS
475
{ Matrix3D perspectiveMatrix = new Matrix3D(); double yscale = 1.0 / Math.Tan(fov * Math.PI / 180 / 2); double xscale = yscale / aspectRatio; perspectiveMatrix.M11 = xscale; perspectiveMatrix.M22 = yscale; perspectiveMatrix.M33 = far / (near - far); perspectiveMatrix.M34 = -1.0; perspectiveMatrix.OffsetZ = near * far / (near - far); perspectiveMatrix.M44 = 0; return perspectiveMatrix; }
The SetPerspectiveOffCenter method returns a general perspective matrix for an asymmetric frustum, which takes as input parameters four sides of the near plane as well as the distances to the near plane and the far plane.
The method SetPerspetive is designed for a symmetric-view frustum with four input parameters: the width and height of the near plane and the distances to the near and far planes.
The method SetPerspectiveFov is also for a symmetric-view frustum, but with the field of view and aspect ratio, instead of the width and height, as parameters. By setting the aspect ratio to 1, you can compare the results of this custom perspective matrix method with those obtained by using the PerspectiveCamera class directly.
Testing Perspective Projections Using the view transform and perspective projection matrices that we have implemented in the Utility class, we can test the perspective projection of a 3D graphics object. To examine the effect of perspective projections, you will first need to create a 3D object. I’ll describe in detail the steps of creating various 3D objects in later chapters. Here, we’ll simply create a 3D cube for the purpose of testing the perspective effect without getting into the procedure of creating such a cube.
Let’s consider an example that applies perspective projection to a 3D cube object. Add a new WPF Window to the project Transformation3D and name it PerspectiveProjection. Here is the XAML file for this example:
<Window x:Class="Transformation3D.PerspectiveProjection" xmlns="http://schemas.microsoft.com/winfx/2006/xaml/presentation" xmlns:x="http://schemas.microsoft.com/winfx/2006/xaml" Title="Perspective Projection" Height="320" Width="400"> <Window.Resources> <MeshGeometry3D x:Key="geometry" Positions="-1 1 1, 1 1 1, 1 1 -1,-1 1 -1, -1 -1 1,-1 -1 -1, 1 -1 -1, 1 -1 1, -1 1 1,-1 -1 1, 1 -1 1, 1 1 1, 1 1 1, 1 -1 1, 1 -1 -1, 1 1 -1, 1 1 -1, 1 -1 -1,-1 -1 -1,-1 1 -1, -1 1 -1,-1 -1 -1,-1 -1 1,-1 1 1" TriangleIndices=" 0 1 2, 2 3 0, 4 5 6, 6 7 4, 8 9 10,10 11 8, 12 13 14,14 15 12, 16 17 18,18 19 16, 20 21 22,22 23 20"/>

CHAPTER 12 ■ 3D TRANSFORMATIONS
476
<DiffuseMaterial x:Key="material" Brush="SteelBlue"/> </Window.Resources> <Viewbox Stretch="Uniform"> <Grid Width="430" Height="320" HorizontalAlignment="Left" VerticalAlignment="Top" ShowGridLines="False"> <Grid.ColumnDefinitions> <ColumnDefinition Width="100" /> <ColumnDefinition Width="330" /> </Grid.ColumnDefinitions> <StackPanel Margin="5" Grid.Column="0"> <TextBlock Text="Camera Position" Margin="2"/> <TextBox Name="tbCameraPosition" Margin="2" HorizontalAlignment="Left" Text="3,4,5"/> <TextBlock Text="Look Direction" Margin="2"/> <TextBox Name="tbLookDirection" Margin="2" HorizontalAlignment="Left" Text="-3,-4,-5"/> <TextBlock Text="Up Direction" Margin="2"/> <TextBox Name="tbUpDirection" Margin="2" HorizontalAlignment="Left" Text="0,1,0"/> <TextBlock Text="Near Plane" Margin="2"/> <TextBox Name="tbNearPlane" Margin="2" HorizontalAlignment="Left" Text="1"/> <TextBlock Text="Far Plane" Margin="2"/> <TextBox Name="tbFarPlane" Margin="2" HorizontalAlignment="Left" Text="100"/> <TextBlock Text="Field of View" Margin="2"/> <TextBox Name="tbFieldOfView" Margin="2" HorizontalAlignment="Left" Text="60"/> <Button Name="btnApply" Margin="2,5,2,2" Click="btnApply_Click">Apply</Button> </StackPanel> <Border Margin="5" BorderBrush="Black" BorderThickness="1" HorizontalAlignment="Left" Width="320" Height="290" Grid.Column="1"> <Viewport3D ClipToBounds="True"> <!-- Set camera: --> <Viewport3D.Camera> <MatrixCamera x:Name="myCameraMatrix"/> </Viewport3D.Camera> <ContainerUIElement3D> <ModelUIElement3D> <Model3DGroup> <!-- Create a cube: --> <GeometryModel3D Geometry="{StaticResource geometry}" Material="{StaticResource material}"> <!-- Set translation: --> <GeometryModel3D.Transform>

CHAPTER 12 ■ 3D TRANSFORMATIONS
477
<TranslateTransform3D OffsetZ="1"/> </GeometryModel3D.Transform> </GeometryModel3D> <!-- Create another cube: --> <GeometryModel3D Geometry="{StaticResource geometry}" Material="{StaticResource material}"> <!-- Set translation: --> <GeometryModel3D.Transform> <TranslateTransform3D OffsetZ="-2"/> </GeometryModel3D.Transform> </GeometryModel3D> <!-- Create another cube: --> <GeometryModel3D Geometry="{StaticResource geometry}" Material="{StaticResource material}"> <!-- Set translation: --> <GeometryModel3D.Transform> <TranslateTransform3D OffsetZ="-5"/> </GeometryModel3D.Transform> </GeometryModel3D> <!-- Set light source: --> <AmbientLight Color="Gray"/> <DirectionalLight Color="Gray" Direction="-1 -2 -3"/> </Model3DGroup> </ModelUIElement3D> </ContainerUIElement3D> </Viewport3D> </Border> </Grid> </Viewbox> </Window>
Here, we first create a Window Resource, which defines the mesh geometry and material for a 3D cube object. You can easily create multiple cube objects by using this resource. In the XAML file, three cube objects are created at different locations by performing different translation transforms on the original cube geometry defined in Window.Resources. This XAML file also creates a user interface that allows you to examine interactively the perspective projection effect on the three cube objects by entering different values in the text boxes. These values include the camera position, the camera look-at direction, the up vector, and the near plane, far plane, and field of view. Notice that the camera is set for the Viewport3D using the MatrixCamera, indicating that a custom camera setting will be used. This camera setting includes both the view transformation and perspective projection. We will specify both transforms using the transform matrices created in the Utility class.
Here is the corresponding code-behind file for this example:
using System; using System.Windows; using System.Windows.Media; using System.Windows.Media.Media3D;

CHAPTER 12 ■ 3D TRANSFORMATIONS
478
namespace Transformation3D { public partial class PerspectiveProjection : Window { public PerspectiveProjection() { InitializeComponent(); SetMatrixCamera(); } private void btnApply_Click(object sender, RoutedEventArgs e) { SetMatrixCamera(); } private void SetMatrixCamera() { Point3D cameraPosition = Point3D.Parse(tbCameraPosition.Text); Vector3D lookDirection = Vector3D.Parse(tbLookDirection.Text); Vector3D upDirection = Vector3D.Parse(tbUpDirection.Text); double fov = Double.Parse(tbFieldOfView.Text); double zn = Double.Parse(tbNearPlane.Text); double zf = Double.Parse(tbFarPlane.Text); double aspectRatio = 1.0; myCameraMatrix.ViewMatrix = Utility.SetViewMatrix(cameraPosition, lookDirection, upDirection); myCameraMatrix.ProjectionMatrix = Utility.SetPerspectiveFov(fov, aspectRatio, zn, zf); } } }
This class implements the SetMatrixCamera method, whose parameters are specified by the user’s input. Then these parameters are passed to the custom view and perspective projection matrices implemented in the Utility class. Finally, these custom matrices are attached to the ViewMatrix and ProjectionMatrix properties of the MatrixCamera, named myCameraMatrix.
Building and running this project and selecting PerspectiveProjection from the Start Menu produces the output shown in Figure 12-15. Note that the physical dimensions of these three cubes are the same. From the figure you can clearly see the foreshortening effect of the perspective projection: The farther the cube is from the camera, the smaller it appears on the screen.

CHAPTER 12 ■ 3D TRANSFORMATIONS
479
Figure 12-15. Perspective projection of cube objects
Of course, you can also use the built-in PerspectiveCamera class in WPF to perform a similar perspective projection. When you use the PerspectiveCamera class, WPF will create corresponding view and projection transform matrices internally, and it will use them to create the 3D objects on the screen. The purpose of using a custom MatrixCamera is to demonstrate how the view transformation and perspective projection matrices are constructed and how they work mathematically.
Orthographic Projection In WPF, the viewing volume for an orthographic projection is a rectangular parallelepiped, or a box, as shown in Figure 12-16.

CHAPTER 12 ■ 3D TRANSFORMATIONS
480
Figure 12-16. Orthographic viewing volume
Unlike perspective projection, the size of the viewing volume doesn’t change from one end to the other, so the distance from the camera doesn’t affect how large an object appears. Namely, no perspective distortion occurs in orthographic projections. The points in the camera space are always mapped to the projection plane by casting rays that are parallel to the camera’s viewing direction. As mentioned previously, this type of projection is usually used in applications for architecture and computer-aided design (CAD), where it is important to maintain the actual sizes of objects and the angles between them as they are projected.
Orthographic Transform Matrix Orthographic projection corresponds to transforming the viewing volume shown in Figure 12-16 into a box with –1 ≤ x ≤ 1, –1 ≤ y ≤ 1, and 0 ≤ z ≤ 1. Again, we use Microsoft’s conventions here. In other technologies, such as OpenGL, the range [–1, 1] is used for mapping in the Z direction.
Since there is no perspective distortion, the orthographic projection must be a linear transformation. Therefore, the transform can be written in the following form:
The mapping relations lead to the following results:

CHAPTER 12 ■ 3D TRANSFORMATIONS
481
You can obtain the orthographic transform by solving the preceding equations:
You can then get the orthographic projection matrix by rewriting the preceding equations in matrix form:
(12.10)
The matrix Morthographic is the orthographic projection matrix, which is valid for general cases, including for asymmetric viewing volume, or off-center, cases.
For symmetric cases, you can specify the width (w) and height the (h) of the near plane and use the following relations:
The orthographic projection matrix becomes
(12.11)

CHAPTER 12 ■ 3D TRANSFORMATIONS
482
Implementing Orthographic Transforms WPF has implemented an OrthographicCamera class, which requires a symmetric viewing volume with a square near and far plane. This class takes the width and the distances to the near and far plane as input parameters. Although this class is convenient, it does have many limitations. If you want a customized orthographic transform, you have to implement your own orthographic transform matrix and pass it to the MatrixCamera class.
You can implement the customized orthographic matrices given in Equations (12.10) and (12.11). Open the project Transformation3D and add two public static methods to the Utility class:
public static Matrix3D SetOrthographicOffCenter(double left, double right, double bottom, double top, double near, double far) { Matrix3D orthographicMatrix = new Matrix3D(); orthographicMatrix.M11 = 2 / (right - left); orthographicMatrix.M22 = 2 / (top - bottom); orthographicMatrix.M33 = 1 / (near - far); orthographicMatrix.OffsetX = (left + right) / (left - right); orthographicMatrix.OffsetY = (bottom + top) / (bottom - top); orthographicMatrix.OffsetZ = near / (near - far); return orthographicMatrix; } public static Matrix3D SetOrthographic(double width, double height, double near, double far) { Matrix3D orthographicMatrix = new Matrix3D(); orthographicMatrix.M11 = 2 / width; orthographicMatrix.M22 = 2 / height; orthographicMatrix.M33 = 1 / (near - far); orthographicMatrix.OffsetZ = near / (near - far); return orthographicMatrix; }
The method SetOrthographicOffCenter returns a general orthographic matrix for an asymmetric viewing volume, which takes the four sides of the near plane and the distances to the near and far planes as input parameters.
The method SetOrthographic is designed for a symmetric-view frustum with four input parameters: the width and height of the near plane and the distances to the near and far planes. WPF has implemented an OrthographicCamera class, that uses squared near and far planes. This means that this class takes only three parameters: the side length (width) of the near plane and the distances to the near and far planes. By setting height = width in the SetOrthographic method, you can compare the results given by the custom matrix method with those obtained by using the OrthographicCamera class directly.
Testing Orthographic Projections Now you can perform an orthographic projection on a 3D object using the view transform and orthographic projection matrices that we have implemented in the Utility class.
Add a new WPF Window to the project Transformation3D and name it OrthographicProjection. You can use the same XAML file as in the previous example to test perspective projections. The only parameter you need to change is the field of view. Simply change the parameter fov to the width, which can be done by modifying the code snippet in the previous XAML file:

CHAPTER 12 ■ 3D TRANSFORMATIONS
483
<TextBlock Text="Field of View" Margin="2"/> <TextBox Name="tbFieldOfView" Margin="2" HorizontalAlignment="Left" Text="60"/>
to the following statements:
<TextBlock Text="Width" Margin="2"/> <TextBox Name="tbWidth" Margin="2" HorizontalAlignment="Left" Text="8"/>
The code-behind file is also similar to the one we used to test perspective projections. The only change occurs in the SetMatrixCamera method:
private void SetMatrixCamera() { Point3D cameraPosition = Point3D.Parse(tbCameraPosition.Text); Vector3D lookDirection = Vector3D.Parse(tbLookDirection.Text); Vector3D upDirection = Vector3D.Parse(tbUpDirection.Text); double w = Double.Parse(tbWidth.Text); double zn = Double.Parse(tbNearPlane.Text); double zf = Double.Parse(tbFarPlane.Text); myCameraMatrix.ViewMatrix = Utility.SetViewMatrix(cameraPosition, lookDirection, upDirection); myCameraMatrix.ProjectionMatrix = Utility.SetOrthographic(w, w, zn, zf); }
Here, you set the ProjectionMatrix property of the MatrixCamera to the orthographic matrix defined using the SetOrthographic method in the Utility class.
Executing this project generates the result shown in Figure 12-17. As you can see, the three cubes have the same view size on your screen regardless of where they are located, indicating that there is no foreshortening effect in an orthographic projection. For comparison, you can perform a similar orthographic projection using the built-in WPF OrthographicCamera class.

CHAPTER 12 ■ 3D TRANSFORMATIONS
484
Figure 12-17. Orthographic projection of cube objects
Object Transforms in WPF Previously, we discussed the Vector3D and Matrix3D structures as well as their operations in WPF. You can apply the Matrix3D structure to a Point3D or a Vector3D object. However, if you want to apply 3D transforms to objects or coordinate systems, you will need to use the Transform3D class. Unlike 2D objects, in order to display a transformed 3D object on your computer screen, you also need to perform projection transforms, as discussed in the previous two sections. WPF has several classes derived from the Transform3D class that you can use to perform specific transforms on 3D objects:
• ScaleTransform3D – Scales a 3D object in the X-Y-Z directions, starting from a defined center. The scaling factors ScaleX, ScaleY, and ScaleZ are defined in the X, Y, and Z directions from this center point.
• TranslateTransform3D – Defines a translation along the X, Y, and Z directions. You specify the amount an object is translated using the OffsetX, OffsetY, and OffsetZ properties.
• RotateTransform3D – Rotates an object in 3D space by specifying a 3D rotation using the rotation property and a center point specified by the CenterX, CenterY and CenterZ properties. The rotation property can be specified by a Rotation3D object. If you want to represent a 3D rotation using a specified angle about a specified rotation axis, you can use the AxisAngleRotation3D object to specify the rotation property.
CHAPTER 12 ■ 3D TRANSFORMATIONS
485
• MatrixTransform3D – Creates a 3D transform, specified by a Matrix3D object, used to manipulate objects or coordinate systems in 3D space. It is usually used to provide custom transforms not provided by the other Transform3D classes. You can multiply custom transform matrices to form any number of linear transforms; for example, you can rotate and scale an object and then translate it.
The structure of the 3D transform matrix is the same as that of the Matrix3D in WPF. In the homogeneous coordinate system, the 3D transform matrix has 16 elements defined by Mij (with i, j = 1, 2, 3, 4), except for M4j (with j = 1, 2, 3), where they are replaced by OffsetX, OffsetY, and OffsetZ. These three elements represent a translation in 3D space.
By manipulating matrix values directly via the MatrixTransform3D class, you can rotate, scale, move, and even skew a 3D object. For example, if you change the value of OffsetX to 10, you move an object 10 units along the X axis in the world space. If you change the value in the second column of the second row to 3, you stretch an object to three times its current size in the Y direction. If you change both values at the same time, you simultaneously move the object 10 units along the X axis and stretch its dimension by a factor of 3 in the Y direction.
Although WPF enables you to manipulate matrix values directly in the MatrixTransform3D class, it also provides several transform classes that enable you to transform an object without knowing how the underlying matrix structure is configured. For example, the ScaleTransform3D class enables you to scale an object by setting its ScaleX, ScaleY, and ScaleZ properties instead of by manipulating an underlying transform matrix. Likewise, the RotateTransfrom3D class enables you to rotate an object simply by specifying the angle about a rotation axis through its Rotation property. WPF will use the underlying structure of the transform matrix to perform the corresponding operations on objects.
In the following sections, you’ll apply various transforms to the 3D cube we used to discuss projections.
ScaleTransform3D Class The ScaleTransform3D class in WPF enables you to scale a 3D object by setting its ScaleX, ScaleY, and ScaleZ properties.
Let’s look at an example. Open the Transformation3D project, add a new WPF Window, and name it ScaleTransformation. The following is the XAML file for this example:
<Window x:Class="Transformation3D.ScaleTransformation" xmlns="http://schemas.microsoft.com/winfx/2006/xaml/presentation" xmlns:x="http://schemas.microsoft.com/winfx/2006/xaml" Title="Scale Transformation" Height="310" Width="400"> <Window.Resources> <MeshGeometry3D x:Key="geometry" Positions="-1 1 1, 1 1 1, 1 1 -1,-1 1 -1, -1 -1 1,-1 -1 -1, 1 -1 -1, 1 -1 1, -1 1 1,-1 -1 1, 1 -1 1, 1 1 1, 1 1 1, 1 -1 1, 1 -1 -1, 1 1 -1, 1 1 -1, 1 -1 -1,-1 -1 -1,-1 1 -1, -1 1 -1,-1 -1 -1,-1 -1 1,-1 1 1" TriangleIndices=" 0 1 2, 2 3 0, 4 5 6, 6 7 4, 8 9 10,10 11 8, 12 13 14,14 15 12, 16 17 18,18 19 16, 20 21 22,22 23 20"/>

CHAPTER 12 ■ 3D TRANSFORMATIONS
486
<DiffuseMaterial x:Key="material" Brush="SteelBlue"/> </Window.Resources> <Viewbox Stretch="Uniform"> <Grid Width="430" Height="300" HorizontalAlignment="Left" VerticalAlignment="Top" ShowGridLines="False"> <Grid.ColumnDefinitions> <ColumnDefinition Width="100" /> <ColumnDefinition Width="330" /> </Grid.ColumnDefinitions> <StackPanel Margin="5" Grid.Column="0"> <RadioButton x:Name="rbOrthographic" Margin="2" Content="Orthorgriphic" IsChecked="True"/> <RadioButton x:Name="rbPerspective" Margin="2" Content="Perspective" IsChecked="False"/> <TextBlock Text="ScaleX" Margin="2"/> <TextBox Name="tbScaleX" Margin="2" HorizontalAlignment="Left" Text="1"/> <TextBlock Text="ScaleY" Margin="2"/> <TextBox Name="tbScaleY" Margin="2" HorizontalAlignment="Left" Text="1"/> <TextBlock Text="ScaleZ" Margin="2"/> <TextBox Name="tbScaleZ" Margin="2" HorizontalAlignment="Left" Text="1"/> <TextBlock Text="Scale Center" Margin="2"/> <TextBox Name="tbScaleCenter" Margin="2" HorizontalAlignment="Left" Text="0,0,0"/> <Button Name="btnApply" Margin="2,5,2,2" Click="btnApply_Click">Apply</Button> </StackPanel> <Border Margin="5" BorderBrush="Black" BorderThickness="1" HorizontalAlignment="Left" Width="320" Height="290" Grid.Column="1"> <Viewport3D Name="myViewport" ClipToBounds="True"> <Viewport3D.Camera> <MatrixCamera x:Name="myCameraMatrix"/> </Viewport3D.Camera> <ContainerUIElement3D> <ModelUIElement3D> <Model3DGroup> <!-- Create a cube: --> <GeometryModel3D Geometry="{StaticResource geometry}" Material="{StaticResource material}"> <!-- Set transform: --> <GeometryModel3D.Transform> <ScaleTransform3D x:Name="myTransform"/> </GeometryModel3D.Transform> </GeometryModel3D>
CHAPTER 12 ■ 3D TRANSFORMATIONS
487
<!-- Set light source: --> <AmbientLight Color="Gray"/> <DirectionalLight Color="Gray" Direction="-1 -2 -3"/> </Model3DGroup> </ModelUIElement3D> </ContainerUIElement3D> </Viewport3D> </Border> </Grid> </Viewbox> </Window>
Here, you use the same Window.Resources as in the previous example to define the cube geometry and material. This XAML file also creates a user interface that allows you to change the input parameters interactively. Here, you use the MatrixCamera class to set the camera by using the customized View and Projection matrices defined in the Utility class. Of course, you can instead use the WPF built-in PerspectiveCamera class or OrthographicCamera class to set the camera. The user interface also allows you to choose either perspective or orthographic projection. The input parameters the user can specify include the scale factors ScaleX, ScaleY, and ScaleZ as well as the scaling center.
The corresponding code-behind file is used to handle the MatrixCamera and scale transform:
using System; using System.Windows; using System.Windows.Media; using System.Windows.Media.Media3D; namespace Transformation3D { public partial class ScaleTransformation : Window { public ScaleTransformation() { InitializeComponent(); SetMatrixCamera(); SetTransform(); } private void btnApply_Click(object sender, RoutedEventArgs e) { SetMatrixCamera(); SetTransform(); } private void SetTransform() { Point3D center = Point3D.Parse(tbScaleCenter.Text); myTransform.CenterX = center.X; myTransform.CenterY = center.Y; myTransform.CenterZ = center.Z; myTransform.ScaleX = Double.Parse(tbScaleX.Text); myTransform.ScaleY = Double.Parse(tbScaleY.Text); myTransform.ScaleZ = Double.Parse(tbScaleZ.Text);

CHAPTER 12 ■ 3D TRANSFORMATIONS
488
} private void SetMatrixCamera() { Point3D cameraPosition = new Point3D(3, 3, 3); Vector3D lookDirection = new Vector3D(-3, -3, -3); Vector3D upDirection = new Vector3D(0, 1, 0); double w = 6; double zn = 1; double zf = 100; double fov = 60; double aspectRatio = 1.0; myCameraMatrix.ViewMatrix = Utility.SetViewMatrix(cameraPosition, lookDirection, upDirection); if (rbOrthographic.IsChecked == true) { myCameraMatrix.ProjectionMatrix = Utility.SetOrthographic(w, w, zn, zf); } else if (rbPerspective.IsChecked == true) { myCameraMatrix.ProjectionMatrix = Utility.SetPerspectiveFov(fov, aspectRatio, zn, zf); } } } }
The SetMatrixCamera method sets the camera using either perspective or orthographic projection. You can change the parameters used to set the camera as you like.
The SetTransform method in this class performs the scale transform on the cube. You first pass the input parameters to a Point3D object and then attach this Point3D object and the ScaleX, ScaleY, and ScaleZ input by the user to the corresponding properties of myTransform, defined in the XAML file.
Executing this project generates the result shown in Figure 12-18. You can change any parameter in the user interface and click Apply to examine the scale effect on the cube.

CHAPTER 12 ■ 3D TRANSFORMATIONS
489
Figure 12-18. Scale transform on a cube
TranslateTransform3D class The TranslateTransform3D class enables you to move a 3D object by setting its OffsetX, OffsetY and OffsetZ properties. This transformation has no center property to set because the translation effect is the same regardless of where it is centered.
Here, let’s consider an example that demonstrates a translation on a cube object using a layout and user interface similar to that in the previous example. Open the Transformation3D project, add a WPF Window, and call it TranslateTransformation. The XAML code is similar to that for the previous ScaleTransformation example, except now you need to change the scale transform to a translation transform. Replace the bolded part of the XAML file with the following snippet:
<GeometryModel3D.Transform> <TranslateTransform3D x:Name="myTransform"/> </GeometryModel3D.Transform>
Also you need to change the corresponding statements related to the scale parameters within the StackPanel in the previous XAML file to the following:
<StackPanel Margin="5" Grid.Column="0"> <RadioButton x:Name="rbOrthographic" Margin="2" Content="Orthographic" IsChecked="True"/> <RadioButton x:Name="rbPerspective" Margin="2" Content="Perspective" IsChecked="False"/> <TextBlock Text="OffsetX" Margin="2"/> <TextBox Name="tbOffsetX" Margin="2" HorizontalAlignment="Left" Text="0"/> <TextBlock Text="OffsetY" Margin="2"/>

CHAPTER 12 ■ 3D TRANSFORMATIONS
490
<TextBox Name="tbOffsetY" Margin="2" HorizontalAlignment="Left" Text="0"/> <TextBlock Text="OffsetZ" Margin="2"/> <TextBox Name="tbOffsetZ" Margin="2" HorizontalAlignment="Left" Text="0"/> <Button Name="btnApply" Margin="2,5,2,2" Click="btnApply_Click">Apply</Button> </StackPanel>
The corresponding code-behind file is also similar to that for the previous example, except you need to rewrite the SetTransform method:
private void SetTransform() { myTransform.OffsetX = Double.Parse(tbOffsetX.Text); myTransform.OffsetY = Double.Parse(tbOffsetY.Text); myTransform.OffsetZ = Double.Parse(tbOffsetZ.Text); }
Here, you attach the corresponding input parameters to the OffsetX, OffsetY, and OffsetZ properties of myTransform, defined in the XAML file.
Running this project produces the result shown in Figure 12-19. You can move the cube around your screen by playing with different parameters for OffsetX, OffsetY, and OffsetZ.
Figure 12-19. Translation transformation on a cube.

CHAPTER 12 ■ 3D TRANSFORMATIONS
491
RotateTransform3D Class In an earlier section of this chapter, “Rotation and Quaternion,” we discussed how to perform a 3D rotation using a quaternion matrix. You can use such a matrix to construct your own custom 3D rotation class; however, there is no need to do so. WPF already provides a 3D rotation class, called RotateTransform3D. This class defines a Rotation property, which you set to an object of type Rotation3D. The Rotation3D class is an abstract class. WPF implements two useful classes that derive from Rotation3D: AxisAngleRotation3D and QuaternionRotation3D. You can use either one to perform a 3D rotation. In fact, these two classes use the same mathematical model; both are based on the quaternion technique.
When the 3D object in question is rotated a finite angle about a specified axis, you can use AxisAngleRotation3D to perform the rotation. On the other hand, you can also calculate the quaternion of the rotation using Equation (12.1) and then use QuaternionRotation3D to perform the same rotation. For example, to rotate an object 90 degrees about the Y axis, you can use the following XAML snippet:
<RotateTransform3D> <RotateTransform3D.Rotation> <AxisAngleRotation3D Axis="0 1 0" Angle="90"/> </RotateTransform3D.Rotation> </RotateTransform3D>
This rotation can also be performed using QuaternionRotation3D:
<RotateTransform3D> <RotateTransform3D.Rotation> <QuaternionRotation3D Quaternion="0 0.707 0 0.707"/> </RotateTransform3D.Rotation> </RotateTransform3D>
The Quaternion in this XAML snippet is calculated using Equation (12.1). This quaternion describes a rotation of 90 degrees about the Y axis. The number 0.707 (the Y component) is the Sine of half the angle (or 45 degrees), while the other 0.707 (the W component) is the Cosine of 45 degrees. You can use either class to perform 3D rotations. The AxisAngleRotation3D class, which is more straightforward, will be used extensively in this book.
Here, let’s consider an example that performs a rotation transform on a cube object using the same layout as in the previous example. Open the Transformation3D project, add a WPF Window, and call it RotateTransformation. You can open the project to look at the complete source code for this example. The XAML file is similar to that used in the previous ScaleTransformation example, except you need to change the transform to a rotation. Replace the bolded part of the XAML file with the following snippet:
<GeometryModel3D.Transform> <RotateTransform3D x:Name="myTransform"/> </GeometryModel3D.Transform>
Also, you need to change the corresponding statements related to the scale parameters within the StackPanel in the previous XAML file to the following:
<StackPanel Margin="5" Grid.Column="0"> <RadioButton x:Name="rbOrthographic" Margin="2" Content="Orthographic" IsChecked="True"/> <RadioButton x:Name="rbPerspective" Margin="2" Content="Perspective" IsChecked="False"/> <TextBlock Text="Rotation Axis" Margin="2"/> <TextBox Name="tbAxis" Margin="2" HorizontalAlignment="Left" Text="0,1,0"/> <TextBlock Text="Rotation Angle" Margin="2"/>

CHAPTER 12 ■ 3D TRANSFORMATIONS
492
<TextBox Name="tbAngle" Margin="2" HorizontalAlignment="Left" Text="0"/> <TextBlock Text="Rotation Center" Margin="2"/> <TextBox Name="tbCenter" Margin="2" HorizontalAlignment="Left" Text="0,0,0"/> <Button Name="btnApply" Margin="2,5,2,2" Click="btnApply_Click">Apply</Button> </StackPanel>
The corresponding code-behind file is also similar to that used in the ScaleTransformation example, except you need to rewrite the SetTransform method:
private void SetTransform() { Point3D rotateCenter = Point3D.Parse(tbCenter.Text); Vector3D rotateAxis = Vector3D.Parse(tbAxis.Text); double rotateAngle = Double.Parse(tbAngle.Text); myTransform.CenterX = rotateCenter.X; myTransform.CenterY = rotateCenter.Y; myTransform.CenterZ = rotateCenter.Z; myTransform.Rotation = new AxisAngleRotation3D(rotateAxis, rotateAngle); }
Here, you define the rotateCenter, rotateAxis, and rotateAngle with the user’s input parameters. Then you attach the rotateCenter to the CenterX, CenterY, and CenterZ properties of the RotateTransform3D object, myTransform, defined in the XAML file. Then you create a new AxisAngleRotation3D object using the rotateAxis and rotateAngle properties and attach it to the Rotation property of myTransform.
Executing this project produces the result shown in Figure 12-20. You can play around with this example by changing the rotation center, angle, and axis and then clicking Apply to see the effect on the cube. You can select the Perspective or Orthographic radio button to examine the different projection effects, as well.
Figure 12-20. Rotation transformation on a cube

CHAPTER 12 ■ 3D TRANSFORMATIONS
493
MatrixTransform3D Class In the previous sections, we discussed basic 3D transforms on graphics objects. These transforms include scale, translation, and rotation. However, if you want to perform a 3D transform that isn’t provided by the basic Transform3D classes (for example, a 3D skew transform), you can create a custom 3D transform using the MatrixTransform3D class.
Here, I’ll use an example to illustrate how to perform 3D custom transforms directly on a cube object using the MatrixTransform3D class. Add a new WPF Window to the project Transformation3D and name it MatrixTransformation. The XAML file for the MatrixTransformation and its layout are similar to those in the previous ScaleTransformaion example. The interface allows you to change all 16 elements of the transform matrix and to view the transformed cube on the screen interactively. In the XAML file, you need to make the following change to the 3D transform:
<GeometryModel3D.Transform> <MatrixTransform3D x:Name="myTransform"/> </GeometryModel3D.Transform>
Here, the name myTransform represents the MatrixTransform3D object. Also you need to change the corresponding statements related to the scale parameters within the original StackPanel in the previous XAML file to the following code snippet within a Grid control:
<Grid Width="Auto"> <Grid.ColumnDefinitions> <ColumnDefinition Width="Auto"/> <ColumnDefinition Width="Auto"/> <ColumnDefinition Width="Auto"/> <ColumnDefinition Width="Auto"/> </Grid.ColumnDefinitions> <Grid.RowDefinitions> <RowDefinition Height="Auto"/> <RowDefinition Height="Auto"/> <RowDefinition Height="Auto"/> <RowDefinition Height="Auto"/> <RowDefinition Height="Auto"/> <RowDefinition Height="Auto"/> <RowDefinition Height="Auto"/> <RowDefinition Height="Auto"/> <RowDefinition Height="Auto"/> <RowDefinition Height="Auto"/> <RowDefinition Height="Auto"/> </Grid.RowDefinitions> <TextBlock Grid.Column="0" Grid.Row="0" Text="M11" Margin="2,5,2,2"/> <TextBlock Grid.Column="0" Grid.Row="1" Text="M21" Margin="2"/> <TextBlock Grid.Column="0" Grid.Row="2" Text="M31" Margin="2"/> <TextBlock Grid.Column="0" Grid.Row="3" Text="M41" Margin="2"/> <TextBlock Grid.Column="0" Grid.Row="4" Text="M12" Margin="2"/> <TextBlock Grid.Column="0" Grid.Row="5" Text="M22" Margin="2"/> <TextBlock Grid.Column="0" Grid.Row="6" Text="M32" Margin="2"/> <TextBlock Grid.Column="0" Grid.Row="7" Text="M42" Margin="2"/> <TextBox Name="tbM11" Grid.Column="1" Grid.Row="0" Margin="2,5,2,2" HorizontalAlignment="Left" Text="1"/> <TextBox Name="tbM21" Grid.Column="1" Grid.Row="1" Margin="2" HorizontalAlignment="Left" Text="0"/>

CHAPTER 12 ■ 3D TRANSFORMATIONS
494
<TextBox Name="tbM31" Grid.Column="1" Grid.Row="2" Margin="2" HorizontalAlignment="Left" Text="0"/> <TextBox Name="tbM41" Grid.Column="1" Grid.Row="3" Margin="2" HorizontalAlignment="Left" Text="0"/> <TextBox Name="tbM12" Grid.Column="1" Grid.Row="4" Margin="2" HorizontalAlignment="Left" Text="0"/> <TextBox Name="tbM22" Grid.Column="1" Grid.Row="5" Margin="2" HorizontalAlignment="Left" Text="1"/> <TextBox Name="tbM32" Grid.Column="1" Grid.Row="6" Margin="2" HorizontalAlignment="Left" Text="0"/> <TextBox Name="tbM42" Grid.Column="1" Grid.Row="7" Margin="2" HorizontalAlignment="Left" Text="0"/> <TextBlock Grid.Column="2" Grid.Row="0" Text="M13" Margin="2,5,2,2"/> <TextBlock Grid.Column="2" Grid.Row="1" Text="M23" Margin="2"/> <TextBlock Grid.Column="2" Grid.Row="2" Text="M33" Margin="2"/> <TextBlock Grid.Column="2" Grid.Row="3" Text="M43" Margin="2"/> <TextBlock Grid.Column="2" Grid.Row="4" Text="M14" Margin="2"/> <TextBlock Grid.Column="2" Grid.Row="5" Text="M24" Margin="2"/> <TextBlock Grid.Column="2" Grid.Row="6" Text="M34" Margin="2"/> <TextBlock Grid.Column="2" Grid.Row="7" Text="M44" Margin="2"/> <TextBox Name="tbM13" Grid.Column="3" Grid.Row="0" Margin="2,5,2,2" HorizontalAlignment="Left" Text="0"/> <TextBox Name="tbM23" Grid.Column="3" Grid.Row="1" Margin="2" HorizontalAlignment="Left" Text="0"/> <TextBox Name="tbM33" Grid.Column="3" Grid.Row="2" Margin="2" HorizontalAlignment="Left" Text="1"/> <TextBox Name="tbM43" Grid.Column="3" Grid.Row="3" Margin="2" HorizontalAlignment="Left" Text="0"/> <TextBox Name="tbM14" Grid.Column="3" Grid.Row="4" Margin="2" HorizontalAlignment="Left" Text="0"/> <TextBox Name="tbM24" Grid.Column="3" Grid.Row="5" Margin="2" HorizontalAlignment="Left" Text="0"/> <TextBox Name="tbM34" Grid.Column="3" Grid.Row="6" Margin="2" HorizontalAlignment="Left" Text="0"/> <TextBox Name="tbM44" Grid.Column="3" Grid.Row="7" Margin="2" HorizontalAlignment="Left" Text="1"/> <RadioButton x:Name="rbOrthographic" Margin="2,10,2,2" Grid.Column="0" Grid.ColumnSpan="4" Grid.Row="8" Content="Orthographic" IsChecked="True"/> <RadioButton x:Name="rbPerspective" Margin="2" Grid.Column="0" Grid.ColumnSpan="4" Grid.Row="9" Content="Perspective" IsChecked="False"/> <Button Name="btnApply" Margin="2,10,2,2" Grid.Column="0" Grid.Row="10" Grid.ColumnSpan="4" Click="btnApply_Click">Apply</Button> </Grid>
The corresponding code-behind file is also similar to that used in the ScaleTransformation example, except you need to rewrite the SetTransform method:

CHAPTER 12 ■ 3D TRANSFORMATIONS
495
private void SetTransform() { Matrix3D m3 = new Matrix3D(); m3.M11 = Double.Parse(tbM11.Text); m3.M21 = Double.Parse(tbM21.Text); m3.M31 = Double.Parse(tbM31.Text); m3.OffsetX = Double.Parse(tbM41.Text); m3.M12 = Double.Parse(tbM12.Text); m3.M22 = Double.Parse(tbM22.Text); m3.M32 = Double.Parse(tbM32.Text); m3.OffsetY = Double.Parse(tbM42.Text); m3.M13 = Double.Parse(tbM13.Text); m3.M23 = Double.Parse(tbM23.Text); m3.M33 = Double.Parse(tbM33.Text); m3.OffsetZ = Double.Parse(tbM43.Text); m3.M14 = Double.Parse(tbM14.Text); m3.M24 = Double.Parse(tbM24.Text); m3.M34 = Double.Parse(tbM34.Text); m3.M44 = Double.Parse(tbM44.Text); myTransform.Matrix = m3; }
You can see that the SetTransform method creates a custom transform matrix m3 by taking the input parameters as its elements. This matrix is then attached to the Matrix property of the MatrixTransform3D object myTransform, defined in the XAML file.
Executing this project produces the output shown in Figure 12-21. You obtain this result by setting the elements M13 and M23 to 2, producing a shearing effect on the cube. You must create this 3D shearing effect by means of a custom transform matrix, because WPF doesn’t provide a SkewTransform3D class. You can use the MatrixTransform3D class to create any 3D transform you desire by manipulating its corresponding elements directly.
Figure 12-21. Custom transformation on a cube

CHAPTER 12 ■ 3D TRANSFORMATIONS
496
Combining Transforms The Transform3DGroup class is useful when you want to create a combining transformation consisting of any number of Transform3D children in its Transform3D collection.
Here, I’ll present an example to illustrate how to use the Transform3DGroup class in a WPF application. In this example, we’ll consider a combining transformation that contains a scale transformation and a rotation transformation. We will apply this combining transformation to a cube object.
Open the Transformation3D project, add a new WPF Window, and name it CombineTransformation. The layout for this example is also similar to that used in the previous ScaleTransformation example. Here, I’ll only show you the key steps for performing the combining transform. You can view the complete source code for this example by opening its XAML and code-behind files in Visual Studio. In the XAML file for this example, you need to make the following changes to the 3D transform definition:
<GeometryModel3D.Transform> <Transform3DGroup> <ScaleTransform3D x:Name="scaleTransform"/> <RotateTransform3D x:Name="rotateTransform"/> </Transform3DGroup> </GeometryModel3D.Transform>
Here, you create a Transform3DGroup object that includes two transforms: a ScaleTransform3D called scaleTransform and a RotateTransform3D called rotateTransform. A Transform3DGroup object can contain any number of Transform3D objects. Thus, you can easily create complex 3D composite transforms using the Transform3DGroup.
You also need to change the SetTransform method in the corresponding code-behind file:
private void SetTransform() { // Scale transformation: scaleTransform.ScaleX = Double.Parse(tbScaleX.Text); scaleTransform.ScaleY = Double.Parse(tbScaleY.Text); scaleTransform.ScaleZ = Double.Parse(tbScaleZ.Text); // Rotation Transformation: Vector3D rotateAxis = Vector3D.Parse(tbAxis.Text); double rotateAngle = Double.Parse(tbAngle.Text); rotateTransform.Rotation = new AxisAngleRotation3D(rotateAxis, rotateAngle); }
Here, you first perform a scale transform, followed by a rotation transform. You specify these transforms by attaching the user’s input parameters to the corresponding properties of the 3D transform, scaleTransform and rotateTransform.
Executing this project produces the results shown in Figure 12-22.

CHAPTER 12 ■ 3D TRANSFORMATIONS
497
Figure 12-22. Combining transformation on a cube

CHAPTER 12 ■ 3D TRANSFORMATIONS
498
C H A P T E R 13
■ ■ ■
499
WPF Graphics Basics in 3D
In the previous chapter, you learned the mathematical basics of 3D transformations and how these transformations are implemented in WPF. In this chapter, you’ll learn how to create basic 3D shapes in WPF.
WPF introduces an extensive 3D model that allows you to draw, transform, and animate 3D graphics objects in both markup and code-behind files, using the same capabilities the platform offers for 2D graphics objects. This makes WPF 3D graphics suitable for everything from eye-catching effects in simple games to 3D charts and data visualization in business applications.
Please remember that 3D support in WPF isn’t designed to provide a full-featured real-time game development platform. If you are planning to build a complex real-time game application, you will be much better off using the raw power of DirectX or OpenGL.
Even though WPF’s 3D model is similar to its 2D counterpart, implementing rich 3D graphics in WPF is still difficult. Creating any meaningful 3D graphics besides trivial 3D scenes using XAML or code-behind files is far more involved than the 2D equivalent of creating an XAML or C# code vector image. This chapter covers 3D graphics basics in WPF, including Viewport3D, geometry and mesh, light source, camera setting, and creating basic 3D shapes.
3D Graphics Basics Even creating the simplest 3D graphics object in WPF, such as a triangle, involves several basic steps:
• Specifying a Viewport3D object to host the 3D content.
• Defining the 3D object, which derives from either ModelVisual3D or ModelUIElement3D.
• Specifying a light source that illuminates a part of or the entire 3D scene.
• Applying materials to the 3D model, which determine the appearance characteristics of the 3D model’s surface.
• Setting a camera that projects the 3D object onto a 2D representation, from which you can view the 3D scene.
This list includes only the basic steps for creating 3D objects in WPF. In a practical 3D WPF application, you may require additional procedures, such as transforms and animation. A practical application may also contain multiple graphics objects, multiple light sources, and different materials. These basic ingredients, however, provide a good starting point.
To a new WPF 3D programmer, some of the basic steps just listed may seem unnecessary, especially when compared to the process of creating 2D graphics. You might assume that WPF 3D classes are just a

CHAPTER 13 ■ WPF GRAPHICS BASICS IN 3D
500
simple means of creating an object with a 3D appearance. In some situations, such as for simple 3D applications, you can construct a graphics object using 2D drawing classes, shapes, and transformations that appears to be 3D. In fact, this approach is usually easier than working with WPF’s 3D classes.
However, there are some advantages to using the 3D support offered in WPF. First, you can create effects that would otherwise be extremely complex to calculate using a simulated 3D model. For instance, the lighting effects for an application with multiple light sources and a variety of materials become very involved if you try constructing it using 2D graphics and ray tracing. The other advantage to using the WPF 3D model is that it allows you to interact with your graphics as a set of 3D objects. This greatly extends what you can do programmatically. For example, once you build your desired 3D scene, it becomes almost trivial to rotate your object or to rotate the camera around your object. Doing the same work with 2D programming would require an avalanche of code and math.
In the following sections, you’ll learn some basic concepts of 3D graphics in WPF.
Viewport3D 3D graphics content in WPF is encapsulated in the Viewport3D class. The graphics object treats Viewport3D as a 2D visual element similar to many others in WPF, meaning it can be placed anywhere you can place a normal element. Viewport3D functions as a window — a viewport — into a 3D scene. More accurately, it is the surface on which a 3D scene is projected.
The Viewport3D class has only two properties, Camera and Children. The Camera property defines your viewpoint into the 3D scene; the Children property holds all the 3D objects you want to place in the scene. The light source that illuminates your 3D scene is itself an object in the viewport.
3D Objects in WPF The Viewport3D element can host any 3D object that derives from the Visual3D class. However, you need to perform a bit more work than you might expect to create a 3D graphics object. In .NET 3.0 and 3.5, the WPF library lacks a collection of 3D shape primitives. If you want a basic 3D shape such as a cube to be displayed on your screen, you need to build it yourself.
Model3D is an abstract base class that represents a generic 3D object. To build a 3D scene, you need objects to view that derive from Model3D. WPF supports modeling Geometries with GeometryModel3D. The Geometry property of this model takes a mesh primitive.
In .NET 3.0, Visual3D is the base class for all 3D objects. As with the Visual class in the 2D world, you could use the Visual3D class to derive 3D shapes or to create more complex 3D controls to provide a richer set of events and framework services. WPF includes only one class that derives from Visual3D: the all-purpose ModelVisual3D.
.NET 3.5 adds some new features to the WPF 3D model. One of these features is the UIElement3D class. As you already know, in the 2D world, UIElement adds layout, input, focus, and events to the Visual class. UIElement3D brings these same things to the Visual3D class. This means that the standard events and means of adding event handlers in 2D using UIElement, with which you are already familiar, now apply to the 3D world with UIElement3D.
UIElement3D itself is an abstract class that derives from the Visual3D class. To make it so that you don’t have to derive from UIElement3D yourself, WPF provides two new classes, ModelUIElement3D and ContainerUIElement3D. The latter is a container for other Visual3D objects. It has one main property, Children, which you use to add and remove 3D objects. The ContainerUIElement3D class doesn’t have a visual representation itself; rather, it is simply a collection of other 3D objects. The ModelUIElement3D class has one property, Model, which is the Model3D displayed to represent the UIElement3D objects. It has no children itself, and in some ways you can think of ModelUIElement3D as a Shape object in the 2D world.

CHAPTER 13 ■ WPF GRAPHICS BASICS IN 3D
501
If you are familiar with the ModelVisual3D class often used in .NET 3.0, then the ContainerUIElement3D and ModelUIElement3D classes should look very familiar. The difference is that WPF splits the functionality of ModelVisual3D (i.e., a model and its children) into two separate classes, one holding the model and the other holding the children.
With these classes, making use of layout, focus, and events in 3D is very easy. For instance, if you want to create a 3D object that responds to mouse events, you can simply use the following statement:
<ModelUIElement3D MouseDown="OnMouseDown"/>
You can then implement the OnMouseDown event handler in the code-behind file, a process identical to that used to add event handlers in the 2D world. Thus, with the addition of UIElement3D, you can get in the 3D world all of the functionality that UIElement provides to 2D.
From the foregoing discussion, you can see that building a 3D graphics object involves a two-step process. First, you need to define the shapes (which derive from either ModelVisual3D or UIElement3D) that you want to utilize and then use them with a visual. You can employ this approach for 2D drawing, but it is entirely optional. However, it is mandatory for 3D drawing because there are no built-in 3D shape classes in WPF.
The two-step process is also important because 3D models are much more complex than 2D models. For instance, when you create a Geometry3D object, you specify not only the vertices of the shape but also the material out of which it is composed. Different materials have different properties for reflecting and absorbing light.
Geometry and Mesh To build a 3D object, you begin by building a shape primitive, or mesh. A 3D primitive is a collection of vertices that form a single 3D entity. Most 3D systems provide primitives modeled on the simplest closed figure: a triangle defined by three vertices. Since the three points of a triangle are coplanar, you can continue adding triangles to model more complex shapes, called meshes.
Currently, WPF’s 3D model provides the MeshGeometry3D class, which allows you to specify any geometry. If you have ever dealt with 3D drawings or 3D finite-element CAD packages before, you may already know the concept of the mesh. Understanding how a mesh is defined is one of the first keys to 3D programming. If you examine the MeshGeometry3D class carefully, you’ll find that it adds the following four properties:
• Positions — Contains a collection of all the points that define the mesh. Each vertex is specified as a Point3D object. Depending on its geometry, the mesh might be composed of many triangles, some of which share the same corners (vertices), meaning that one point will become the vertex of several triangles. You may choose to define the same shared vertex multiple times so that you can better control the way individual triangles are shaded with the Normals property.
• TriangleIndices — Defines the triangles. Each entry in this collection represents a single triangle by referring to three points from the Positions collection. This property specifies the order in which the points in the Positions list will determine a triangle.
• Normals — Provides a vector for each vertex. To render the surface of the model, the graphics system needs information about the direction the surface is facing at any given triangle. It uses this Normals property to make lighting calculations for the model: Surfaces that face directly toward a light source appear brighter than those angled away from the light. WPF can determine default normal vectors by using the position coordinates; you can also specify normal vectors to approximate the appearance of curved surfaces.

CHAPTER 13 ■ WPF GRAPHICS BASICS IN 3D
502
• TextureCoordinates — Specifies a point collection that tells the graphics system how to map the coordinates, which will determine how a texture is drawn to vertices of the mesh. TextureCoordinates are specified as a value between zero and 1. As in the Normals property, WPF can calculate default texture coordinates, but you may choose to set different texture coordinates to control the mapping of a texture that, for example, includes part of a repeating pattern.
Let’s look at the simplest possible mesh, which consists of a single triangle. The units you use to create the 3D model aren’t important because you can always move the camera closer or farther away, and you can change the size or location of individual 3D objects by means of transformations. What’s important is the coordinate system, which is shown in Figure 13-1. As you can see, the X and Y axes have the same orientation as in 2D drawing. What’s new is the Z axis. As the Z axis value decreases, the point moves farther away; as it increases, the point moves closer.
Figure 13-1. A triangle in 3D space
You can use MeshGeometry3D to define this mesh shape inside a 3D visual. The MeshGeometry3D object in this example doesn’t require us to specify the Normals property or the TextureCoordinates property (the default values will be used for these two properties) because the shape is simple and will be painted with a SolidColorBrush:
<MeshGeometry3D Positions=”1,0,0 0,1,0 0,0,1” TriangleIndices=”0,1,2”/>
Here, there are just three points, which are listed one after another in the Positions property. The order you put points in the Positions property is important because a position’s index value in a mesh’s position collection is used when adding the triangle indices. For example, let’s say you have a surface composed of four positions {p0, p1, p2, p3}. If you want to define a triangle from p0, p2, and p3, you would add triangle indices with index values 0, 2, and 3. If the positions were given in a different order, for instance, {p3, p1, p0, p2}, and you want to create a triangle made of the same positions, you would add triangle indices with the values 2, 3, 0.

CHAPTER 13 ■ WPF GRAPHICS BASICS IN 3D
503
The mesh positions alone can’t describe the mesh triangles. After you have added the Positions property, you need to define which positions make up which triangles. The order in which you add triangle indices is also important. When you define a triangle, you are basically defining the points in either a clockwise or a counterclockwise direction, depending on the side of the triangle you are on. This is important because it affects which side of the triangle is visible.
In this example, the TriangleIndices property states that there is a single triangle made of points #0, #1, and #2. In other words, the TriangleIndices property tells WPF to draw the triangle by drawing a line from (1, 0, 0) to (0, 1, 0) and then to (0, 0, 1).
WPF’s 3D model uses a right-hand coordinate system. When defining a shape, you must list the points in counterclockwise order around the Z axis. This example follows that rule. However, you could easily violate the rule by changing the TriangleIndices to 0, 2, 1. In this case, you would still define the same triangle, but the triangle will be backwards. In other words, if you look at it down the Z axis, you will actually be looking at the back of the triangle.
The difference between the back of a 3D shape and the front is not trivial. In some cases, you may paint both sides with a different brush. You may also choose not to paint the back at all in order to avoid using resources for a part of the scene that you will never see.
GeometryModel3D and Surfaces Once you have a properly configured MeshGeometry3D, you need to wrap it in a GeometryModel3D. The GeometryModel3D class has three properties: Geometry, Material, and BackMaterial. The Geometry property takes the MeshGeometry3D object that defines the shape of your 3D object. The Material and BackMaterial properties define the surface out of which your shape is composed.
For a mesh to look like a 3D object, it must have an applied texture that covers the surface defined by its vertices and triangles so that it can be lit and projected by the camera. In 2D, you use the Brush class to apply colors, patterns, gradients, or other visual content to areas of the screen. The appearance of 3D objects, however, is a function of the lighting model, not just of the color or pattern applied to objects. Real-world objects reflect light differently depending on the quality of their surfaces. The surface defines the color of the object and how that material responds to light.
To define the characteristics of a 3D model’s surface, WPF uses the Material abstract class. The concrete subclasses of Material determine some of the appearance characteristics of the model’s surface, and each subclass provides a Brush property to which you can pass a SolidColorBrush, TileBrush, or VisualBrush.
WPF includes four subclasses of Material, all of which derive from the abstract Material class:
• DiffuseMaterial — Specifies that the brush will be applied to the model as though the model is lit diffusely. Using DiffuseMaterial resembles using brushes directly on 2D models. The model surfaces do not appear shiny because they don’t reflect light.
• SpecularMaterial — Specifies that the brush will be applied to the model as though the model’s surface is hard or shiny and capable of reflecting highlights. You can use this to create glossy and highlighted effects. It reflects light back directly, like a mirror.
• EmissiveMaterial — Specifies that texture will be applied so that the model looks like it is emitting light equal to the color of the brush. It creates a glowing look.
• MaterialGroup — Allows you to combine more than one material. To achieve certain surface qualities, such as glowing or reflective effects, you may want to apply several different brushes to a model in succession.
CHAPTER 13 ■ WPF GRAPHICS BASICS IN 3D
504
Let’s look at a sample XAML code snippet that shows us how to paint a triangle surface with a solid color brush:
<GeometryModel3D> // Create geometry: <GoemetryModel3D.Goemetry> <MeshGeometry3D Positions="1,0,0 0,1,0 0,0,1" TriangleIndices="0,1,2"/> </GeometryModel3D.Geometry> // Set materials: <GeometryModel3D.Material> <DiffuseMaterial Brush="LightBlue"/> </GeometryModel3D.Material> <GoemtryModel3D.BackMaterial> <DiffuseMaterial Brush = "LightCoral"/> </GeometryModel3D.BackMaterial> </GeometryModel3D>
In this example, the BackMaterial property is also specified, so the triangle is differently colored if viewed from behind.
Our next step is to use this GeometryModel3D to set the Content property of a ModelVisual3D or ModelUIElement3D inside a ContainerUIElement3D and to place that ModelVisual3D or ContainerUIElement3D in a viewport. However, in order to see your object, you will need to specify a light source and set a camera.
Illuminating the Scene In order to create real-world shaded 3D graphics objects, WPF uses a lighting model that adds one or more light sources to your 3D scene. Your objects are then illuminated based on the type of light you specify, its position, its direction, and its power. Lights determine which portion of a scene will be included in the projection. Light objects in WPF create a variety of light and shadow effects and are modeled after the behavior of various real-world lights. You must specify at least one light source in your 3D scene, or no objects will be visible.
WPF provides four light classes that derive from the base class, Light:
• AmbientLight — Provides ambient lighting that illuminates all objects uniformly regardless of their location or orientation.
• DirectionalLight — Illuminates like a distant light source with parallel rays of light. Directional lights have a direction specified as a Vector3D but no specified location.
• PointLight — Illuminates like a nearby light source that radiates light in all directions from a single point in 3D space. A PointLight has a position and casts light from that position. Objects in the scene are illuminated depending on their position and distance with respect to the light. PointLightBase exposes a Range property, which determines a distance beyond which models will not be illuminated by light. PointLight also exposes attenuation properties that determine how the light’s intensity diminishes with distance. You can specify constant, linear, or quadratic interpolations for the light’s attenuation.
• SpotLight — Inherits from PointLight. It illuminates like PointLight and has both a position and direction. It projects light in a cone-shaped area set by the InnerConeAngle and OuterConeAngle properties, specified in degrees.
CHAPTER 13 ■ WPF GRAPHICS BASICS IN 3D
505
Here, we define a white DirectionalLight to illuminate the triangle you created in the previous section using the following statement:
<DirectionalLight Color="White" Direction="-1,-1,-1"/>
where the vector that determines the path of the light starts at the origin (0, 0, 0) and goes to (–1, –1, –1). This means that each ray of light is a straight line that travels from the top-right front toward the bottom-left back. This makes sense in this example because the front surface of the triangle shown in Figure 13-1 lines up exactly with the direction of the light.
Camera Position In Chapter 12, you learned how to construct a projection matrix and set up a camera using the MatrixCamera class. When you create a 3D scene, it is important to remember that you are really creating a 2D representation of 3D objects through projection. Since a 3D scene looks different depending on the point of view, you must specify your point of view using the Camera class in WPF. This means that in order to see a 3D object, you must set a camera at the correct position and orient it in the correct direction. You achieve this by specifying the Viewport3D.Camera property with a Camera object.
Basically, as discussed in Chapter 12, the camera determines how a 3D scene is represented on the 2D viewing surface of a viewport. WPF introduces three camera classes: PerspectiveCamera, OrthographicCamera, and MatrixCamera. All of these camera classes and their corresponding matrices were discussed in great detail in Chapter 12. The PerspectiveCamera specifies a projection that foreshortens the scene. In other words, the PerspectiveCamera renders the scene so that objects that are farther away appear smaller; i.e., it provides a vanishing-point perspective projection. You can specify the position of the camera in the coordinate space of the scene, the camera’s direction and its field of view, and a vector that defines the direction of “up” in the scene.
As you learned in Chapter 12 when we discussed the view frustum, the NearPlaneDistance and FarPlaneDistance properties of the ProjectionCamera limit the range of the camera’s projection. Because you can locate cameras anywhere in the scene, it is possible to position the camera inside of a model or very near a model, making it hard to distinguish objects properly. NearPlaneDistance allows you to specify a minimum distance from the camera within which objects will not be drawn. Conversely, FarPlaneDistance lets you specify a distance from the camera beyond which objects will not be drawn, which ensures that objects too far away to be recognizable will not be included in the scene.
The OrthographicCamera flattens 3D objects so that the exact scale is preserved, no matter where a shape is positioned, which is useful for some types of visualization tools, such as 3D chart and technical drawing applications. Like other cameras, it specifies a position, viewing direction, and “upward” direction.
Finally, the MatrixCamera allows you to specify a matrix that is used to transform the 3D scene into a 2D view. This is an advanced tool intended for highly specialized effects and for porting code from other frameworks that use this type of camera, such as DirectX and OpenGL. In Chapter 12, you used the MatrixCamera extensively to view a simple cube object.
Selecting the right camera is relatively easy, but placing and configuring it is a bit trickier. First you need to specify a point in 2D space at which the camera will be positioned by setting its Position property. The second step is to set a Vector3D object for the LookDirection property, which indicates how the camera is oriented. To make sure the camera is correctly oriented, pick a point — the center point of interest — you want to see from your camera. You can then calculate the LookDirection using this formula:
CameraLookDirection = CenterPointOfInterest – CameraPosition
In the triangle example, you can place the camera at the position (2, 2, 2), i.e., right on top of the front surface of the triangle. Assuming you want to focus on the origin (0, 0, 0), you would use the following look direction:

CHAPTER 13 ■ WPF GRAPHICS BASICS IN 3D
506
CameraLookDirection = (0, 0, 0) – (2, 2, 2) = (-2, -2, -2)
This is equivalent to the normalized vector (–1, –1, –1) because the direction it describes is the same. Once you have set the Position and LookDirection properties, you also need to set the UpDirection property. The UpDirection determines how the camera is tilted. Generally, the UpDirection is set to (0, 1, 0), which means the up-direction is lined up with the positive Y axis.
With these details in mind, you can define a PerspectiveCamera for this simple triangle example:
<Viewport3D.Camera> <PerspectiveCamera Position="2,2,2" LookDirection="-2,-2,-2" UpDirection="0,1,0"/> </Viewport3D.Camera>
Simple Triangle in 3D Now it is time to put all the pieces of our triangle example together. Start a new WPF project and name it GraphicsBasics3D. Add a new WPF Window to the project and name it SimpleTriangle. The following is the complete XAML file for this example:
<Window x:Class="GraphicsBasics3D.SimpleTriangle" xmlns="http://schemas.microsoft.com/winfx/2006/xaml/presentation" xmlns:x="http://schemas.microsoft.com/winfx/2006/xaml" Title="Simple Triangle Example" Height="300" Width="300"> <Grid Margin="5"> <Grid.RowDefinitions> <RowDefinition/> <RowDefinition Height="Auto"/> </Grid.RowDefinitions> <Border BorderBrush="Gray" BorderThickness="1" Grid.Row="0"> <Viewport3D> <Viewport3D.Camera> <PerspectiveCamera Position="2,2,2" LookDirection="-2,-2,-2" UpDirection="0,1,0"/> </Viewport3D.Camera> <ContainerUIElement3D> <ModelUIElement3D> <Model3DGroup> <!-- Set light source: --> <DirectionalLight Color="White" Direction="-1,-1,-1" /> <!-- Add triangle: --> <GeometryModel3D> <GeometryModel3D.Geometry> <MeshGeometry3D Positions="1,0,0 0,1,0 0,0,1" TriangleIndices="0,1,2" /> </GeometryModel3D.Geometry> <!-- Set material: --> <GeometryModel3D.Material> <DiffuseMaterial Brush="Blue" /> </GeometryModel3D.Material> <GeometryModel3D.BackMaterial> <DiffuseMaterial Brush="Red" /> </GeometryModel3D.BackMaterial>

CHAPTER 13 ■ WPF GRAPHICS BASICS IN 3D
507
<!-- Set rotation: --> <GeometryModel3D.Transform> <RotateTransform3D> <RotateTransform3D.Rotation> <AxisAngleRotation3D x:Name="myRotate" Axis="-0.707,1,-0.707"/> </RotateTransform3D.Rotation> </RotateTransform3D> </GeometryModel3D.Transform> </GeometryModel3D> </Model3DGroup> </ModelUIElement3D> </ContainerUIElement3D> </Viewport3D> </Border> <Slider Margin="10,20,10,10" Grid.Row="1" Minimum="0" Maximum="360" Orientation="Horizontal" Value="{Binding ElementName=myRotate, Path=Angle}"/> </Grid> </Window>
Here we add the light source and the Model3DGroup contained inside the ModelUIElement3D. If you are working in the .NET 3.0 framework, you can replace ModelUIElement3D and ContainerUIElement3D with ModelVisual3D.Content and ModelVisual3D, respectively.
We also add a rotation transform to the triangle, which allows you to examine the front and back surfaces of the triangle so that you can see that they are painted with brushes of different colors. Using this rotation, called myRotate, you create a data-bound Slider that allows you to use your mouse to rotate the triangle interactively around the axis you specify.
Figure 13-2 shows the result of running this example. You can move the slider with your mouse to see how the color changes as the triangle rotates.
Figure 13-2. A triangle created using the WPF 3D model

CHAPTER 13 ■ WPF GRAPHICS BASICS IN 3D
508
Basic 3D Shapes In this section, you’ll learn how to create some basic 3D shapes in WPF, including coordinate axes, simple wireframes, cubes, cylinders, cones, spheres, and toruses.
Coordinate Axes and Wireframe In WPF, everything in 3D is considered a triangle. If you want to draw a 3D line, you have to somehow create it using triangles. It is surprising that WPF doesn’t contain a 3D line class, since a 3D line object is so fundamental.
Fortunately, the WPF 3D team at Microsoft has created a 3D tools library that contains several classes designed to make WPF 3D programming easier. One of these classes is the ScreenSpaceLines3D class. You can download the 3DTools library from http://www.codeplex.com/3DTools. The DLL library was originally built for the .NET 3.0 framework. I have rebuilt it for NET 3.5 and Visual Studio 2008. This newly built DLL library is included in the References for the GraphicsBasics3D project. If you’re working on the .NET 3.0 platform, you should use the original DLL from codeplex; if you’re working on the .NET 3.5 platform, use newly built DLL.
If you carefully examine the source code of the ScreenSpaceLines3D class, you’ll find that this class inherits from the ModelVisual3D base class. The line event handler is attached to CompositionTarget.Rendering, just as it is for a Per-Frame animation. This handy feature of WPF allows you to register a callback function that gets called whenever something is being rendered. However, this callback may get called too often — in fact, it gets called every frame, about 60 times per second! — which may lead to serious memory leaks for complex 3D wireframes you produce using ScreenSpaceLines3D objects.
Here, I still want to use this 3DTools library, because it has already become popular in the WPF 3D community. The ScreenSpaceLines3D class allows you to draw straight lines of invariant width in 3D space. In other words, these lines stay fixed at the thickness you specify, no matter where you place the camera. This makes these lines useful for creating coordinate axes and wireframes.
Because the ScreenSpaceLines3D object is a ModelVisual3D object, you can add this object directly to the Viewport3D, as shown in the following XAML snippet:
… xmlns:tool3d="clr-namespace:_3DTools;assembly=3DTools" … <Viewport3D> <tool3d:ScreenSpaceLines3D Points=”0,0,0 0,2,0” Color=”Black” Thickness=”2”/> </Viewport3D> …
Here, to use this class, you first need to register the namespace and assembly in XAML. Then you can create a 3D line object by specifying its points, color, and thickness properties. You can draw multiple line segments by adding a points collection. Please note that the points in the collection must be paired, with each pair of points determining one line segment. For instance, if you have a point collection {p0, p1, p2, p3}, the ScreenSpaceLines3D class will draw two line segments, one from p0 to p1 and the other from p2 to p3. Notice that there is no line segment drawn from p1 to p2. If you want to draw a continuous line, you need to set a point collection in the form {p0, p1, p1, p2, p2, p3}.
Let’s create a simple triangle wireframe with coordinate axes. Add a new WPF Window to the GraphicsBasics3D project and name it Wireframe. The following is the XAML code for this example:
<Window x:Class="GraphicsBasics3D.Wireframe" xmlns="http://schemas.microsoft.com/winfx/2006/xaml/presentation" xmlns:x="http://schemas.microsoft.com/winfx/2006/xaml"
CHAPTER 13 ■ WPF GRAPHICS BASICS IN 3D
509
xmlns:tool3d="clr-namespace:_3DTools;assembly=3DTools" Title="Simple Triangle Example" Height="350" Width="300"> <Window.Resources> <RotateTransform3D x:Key="rotate"> <RotateTransform3D.Rotation> <AxisAngleRotation3D Axis="0,1,0" Angle="{Binding ElementName=slider, Path=Value, Mode=TwoWay}" /> </RotateTransform3D.Rotation> </RotateTransform3D> </Window.Resources> <Grid Margin="5"> <Grid.RowDefinitions> <RowDefinition/> <RowDefinition Height="Auto"/> </Grid.RowDefinitions> <Border BorderBrush="Gray" BorderThickness="1" Grid.Row="0"> <Viewport3D> <Viewport3D.Camera> <PerspectiveCamera Position="1,3,3" LookDirection="-1,-3,-3" UpDirection="0,1,0"/> </Viewport3D.Camera> <!-- Add coordinate axes: --> <tool3d:ScreenSpaceLines3D Points="0,0,0 1.5,0,0" Color="Red" Transform="{StaticResource rotate}"/> <tool3d:ScreenSpaceLines3D Points="0,0,0 0,1.5,0" Color="Green" Transform="{StaticResource rotate}"/> <tool3d:ScreenSpaceLines3D Points="0,0,0 0,0,1.5" Color="Blue" Transform="{StaticResource rotate}"/> <!-- Add triangle wireframe --> <tool3d:ScreenSpaceLines3D Points="1,0,0 0,1,0 0,1,0 0,0,1 0,0,1 1,0,0" Thickness="3" Color="Black" Transform="{StaticResource rotate}"/> </Viewport3D> </Border> <Slider Name="slider" Margin="10,20,10,10" Grid.Row="1" Minimum="0" Maximum="360" Orientation="Horizontal"/> </Grid> </Window>
Here, the code first creates a Window resource that defines a RotateTransform3D object. The Angle property of this rotation is controlled by a slider’s Value property. You then draw three lines for the coordinate axes, using different colors: red for the X axis, green for the Y axis, and blue for the Z axis. Next, you create a triangular wireframe using ScreenSpaceLines3D. We also perform a rotation transform

CHAPTER 13 ■ WPF GRAPHICS BASICS IN 3D
510
on the coordinate axes and triangle wireframe by attaching a RotateTransform3D object, called “rotate,” defined in the Window.Resources, to the Transform property of the ScreenSpaceLines3D objects. Notice that we only need to define a camera to view the line objects. There is no need to specify the light source and material if all you want to display on your screen are line objects.
Figure 13-3 illustrates the results of running this example. If you move the slider with your mouse, the coordinate axes and triangular wireframe will rotate together accordingly.
Figure 13-3. Triangle wireframe and coordinate axes
Creating a Cube In this section, you will create a cube shape in WPF. In the previous chapter, we created such a cube in an XAML file by using Window.Resources directly . Here, we’ll add more features to the cube object, such as painting different faces with different colors and adding a wireframe, from which you can clearly see how the triangular meshes are generated. To add these new features, we’ll create the cube object in a code-behind file. A cube object is simply an extension of creating a triangle. The cube consists of six faces, each of which can be constructed with two triangles. Remember to follow the right-hand rule and to follow a counterclockwise direction when you create the triangles.
Let’s consider an example of creating a cube in code. Add a new class to the project GraphicsBasics3D and name it Utility. Add a CreateTriangleFace method to the Utility class. Here is the code for this class:
using System; using System.Windows;

CHAPTER 13 ■ WPF GRAPHICS BASICS IN 3D
511
using System.Windows.Media; using System.Windows.Media.Media3D; using System.Windows.Controls; using _3DTools; namespace GraphicsBasics3D { public class Utility { public static void CreateTriangleFace( Point3D p0, Point3D p1, Point3D p2, Color color, bool isWireframe, Viewport3D viewport) { MeshGeometry3D mesh = new MeshGeometry3D(); mesh.Positions.Add(p0); mesh.Positions.Add(p1); mesh.Positions.Add(p2); mesh.TriangleIndices.Add(0); mesh.TriangleIndices.Add(1); mesh.TriangleIndices.Add(2); SolidColorBrush brush = new SolidColorBrush(); brush.Color = color; Material material = new DiffuseMaterial(brush); GeometryModel3D geometry = new GeometryModel3D(mesh, material); ModelUIElement3D model = new ModelUIElement3D(); model.Model = geometry; viewport.Children.Add(model); if (isWireframe == true) { ScreenSpaceLines3D ssl = new ScreenSpaceLines3D(); ssl.Points.Add(p0); ssl.Points.Add(p1); ssl.Points.Add(p1); ssl.Points.Add(p2); ssl.Points.Add(p2); ssl.Points.Add(p0); ssl.Color = Colors.Black; ssl.Thickness = 2; viewport.Children.Add(ssl); } } } }
Note that a using statement
using _3DTools;
is added to this class so that we can use the ScreenSpaceLines3D object directly. The CreateTriangleFace method creates a single triangle model, which includes a triangle face and a wireframe if the isWireframe field is set to true. The triangle face is created as a UIElement3D object that defines the geometry mesh and the material. You then add both the triangle face and the wireframe directly to the Viewport3D.
CHAPTER 13 ■ WPF GRAPHICS BASICS IN 3D
512
Thus, each triangle is treated as an individual 3D model. From a programmer’s point of view, this approach doesn’t seem very efficient. For greater efficiency, you may want to use another method, such as putting all of the triangles into a Model3DGroup collection and then adding this Model3DGroup to the Viewport3D. However, the approach based on the individual triangle model does provide some advantages. For example, it is easier to implement, and it provides the flexibility to paint each triangle face with a different material. In addition, since the ScreenSpaceLines3D class derives from ModelVisual3D, you can’t put the wireframe for each triangle into a Model3DGroup collection, meaning you need to add it directly to Viewport3D. So for illustration purposes, here we’ll create a cube object with a wireframe using the individual triangle model.
Now add a new WPF Window to the project GraphicsBasics3D and name it Cube. In the layout, you’ll set the camera and light source and add the coordinate axes using the ScreenSpaceLines3D objects. Here is the XAML file for this example:
<Window x:Class=" GraphicsBasics3D.Cube" xmlns="http://schemas.microsoft.com/winfx/2006/xaml/presentation" xmlns:x="http://schemas.microsoft.com/winfx/2006/xaml" xmlns:tool3d="clr-namespace:_3DTools;assembly=3DTools" Title="Cube" Height="350" Width="300"> <Grid Margin="5"> <Border BorderBrush="Gray" BorderThickness="1"> <Viewport3D Name="myViewport"> <Viewport3D.Camera> <PerspectiveCamera Position="4,5,6" LookDirection="-4,-5,-6" UpDirection="0,1,0"/> </Viewport3D.Camera> <!-- Set light source: --> <ModelUIElement3D> <DirectionalLight Color="White" Direction="-1,-1,-1" /> </ModelUIElement3D> <!-- Add coordinate axes: --> <tool3d:ScreenSpaceLines3D Points="-4,0,0 3,0,0" Color="Red"/> <tool3d:ScreenSpaceLines3D Points="0,-5,0 0,3,0" Color="Green"/> <tool3d:ScreenSpaceLines3D Points="0,0,-10 0,0,3" Color="Blue"/> </Viewport3D> </Border> </Grid> </Window>
The corresponding code-behind file shows the detailed procedure of creating a cube shape in WPF:
using System; using System.Windows; using System.Windows.Controls; using System.Windows.Media; using System.Windows.Media.Media3D; namespace GraphicsBasics3D { public partial class Cube : Window { public Cube()
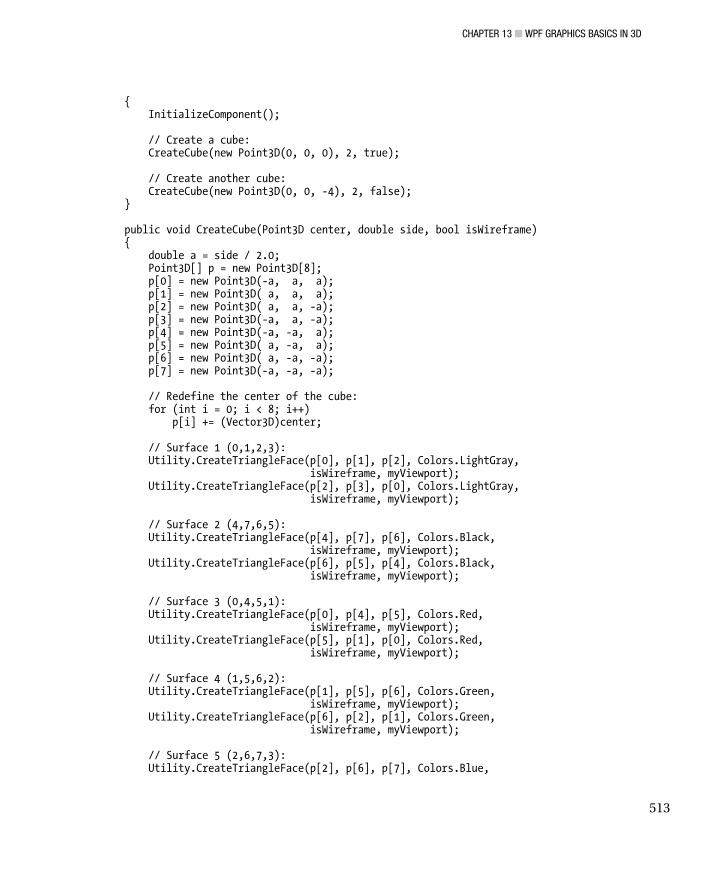
CHAPTER 13 ■ WPF GRAPHICS BASICS IN 3D
513
{ InitializeComponent(); // Create a cube: CreateCube(new Point3D(0, 0, 0), 2, true); // Create another cube: CreateCube(new Point3D(0, 0, -4), 2, false); } public void CreateCube(Point3D center, double side, bool isWireframe) { double a = side / 2.0; Point3D[] p = new Point3D[8]; p[0] = new Point3D(-a, a, a); p[1] = new Point3D( a, a, a); p[2] = new Point3D( a, a, -a); p[3] = new Point3D(-a, a, -a); p[4] = new Point3D(-a, -a, a); p[5] = new Point3D( a, -a, a); p[6] = new Point3D( a, -a, -a); p[7] = new Point3D(-a, -a, -a); // Redefine the center of the cube: for (int i = 0; i < 8; i++) p[i] += (Vector3D)center; // Surface 1 (0,1,2,3): Utility.CreateTriangleFace(p[0], p[1], p[2], Colors.LightGray, isWireframe, myViewport); Utility.CreateTriangleFace(p[2], p[3], p[0], Colors.LightGray, isWireframe, myViewport); // Surface 2 (4,7,6,5): Utility.CreateTriangleFace(p[4], p[7], p[6], Colors.Black, isWireframe, myViewport); Utility.CreateTriangleFace(p[6], p[5], p[4], Colors.Black, isWireframe, myViewport); // Surface 3 (0,4,5,1): Utility.CreateTriangleFace(p[0], p[4], p[5], Colors.Red, isWireframe, myViewport); Utility.CreateTriangleFace(p[5], p[1], p[0], Colors.Red, isWireframe, myViewport); // Surface 4 (1,5,6,2): Utility.CreateTriangleFace(p[1], p[5], p[6], Colors.Green, isWireframe, myViewport); Utility.CreateTriangleFace(p[6], p[2], p[1], Colors.Green, isWireframe, myViewport); // Surface 5 (2,6,7,3): Utility.CreateTriangleFace(p[2], p[6], p[7], Colors.Blue,

CHAPTER 13 ■ WPF GRAPHICS BASICS IN 3D
514
isWireframe, myViewport); Utility.CreateTriangleFace(p[7], p[3], p[2], Colors.Blue, isWireframe, myViewport); // Surface 2 (0,3,7,4): Utility.CreateTriangleFace(p[0], p[3], p[7], Colors.Black, isWireframe, myViewport); Utility.CreateTriangleFace(p[7], p[4], p[0], Colors.Black, isWireframe, myViewport); } } }
The CreateCube method in this class creates the cube object. It first defines a point array object that contains eight vertices, which specify the coordinates of the cube in the 3D space. Then we create the trangle models, with different colors for the different surfaces of the cube, by calling the static CreateTriangleFace method in the Utility class. This way, you have the flexibility to specify a different material and wireframe for each individual triangle.
Finally, we create two cube objects at different locations using the CreateCube method, one cube with the wireframe and the other without it.
Figure 13-4 illustrates the results of running this application.
Figure 13-4. Cubes in WPF
You can add more features to this example, such as normals and texture coordinates. For example, it is easy to create normals inside the CreateTriangleFace method in the Utility class by adding the following few lines of code:
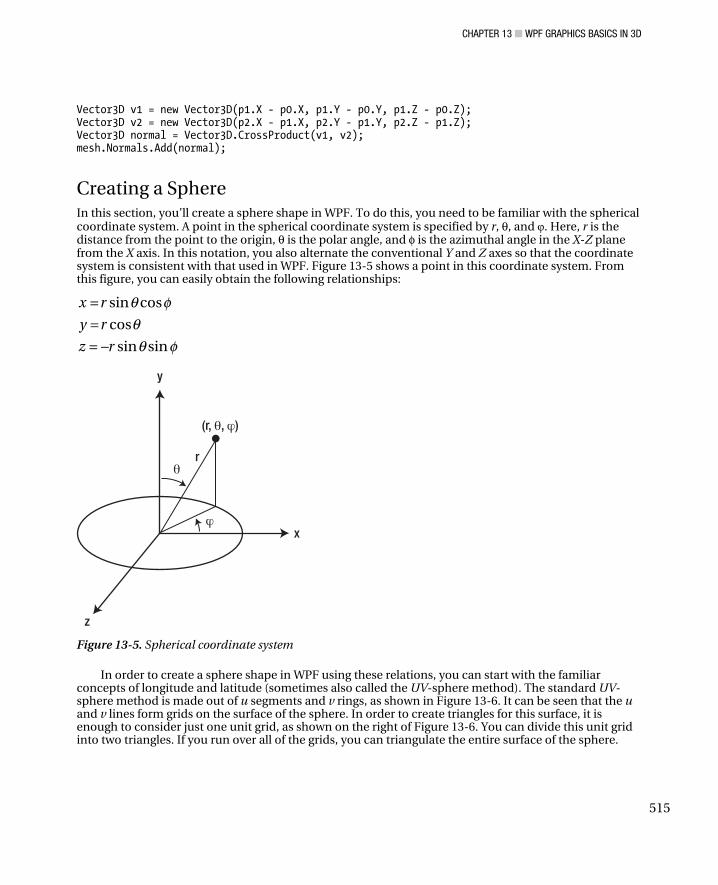
CHAPTER 13 ■ WPF GRAPHICS BASICS IN 3D
515
Vector3D v1 = new Vector3D(p1.X - p0.X, p1.Y - p0.Y, p1.Z - p0.Z); Vector3D v2 = new Vector3D(p2.X - p1.X, p2.Y - p1.Y, p2.Z - p1.Z); Vector3D normal = Vector3D.CrossProduct(v1, v2); mesh.Normals.Add(normal);
Creating a Sphere In this section, you’ll create a sphere shape in WPF. To do this, you need to be familiar with the spherical coordinate system. A point in the spherical coordinate system is specified by r, θ, and . Here, r is the distance from the point to the origin, θ is the polar angle, and φ is the azimuthal angle in the X-Z plane from the X axis. In this notation, you also alternate the conventional Y and Z axes so that the coordinate system is consistent with that used in WPF. Figure 13-5 shows a point in this coordinate system. From this figure, you can easily obtain the following relationships:
Figure 13-5. Spherical coordinate system
In order to create a sphere shape in WPF using these relations, you can start with the familiar concepts of longitude and latitude (sometimes also called the UV-sphere method). The standard UV-sphere method is made out of u segments and v rings, as shown in Figure 13-6. It can be seen that the u and v lines form grids on the surface of the sphere. In order to create triangles for this surface, it is enough to consider just one unit grid, as shown on the right of Figure 13-6. You can divide this unit grid into two triangles. If you run over all of the grids, you can triangulate the entire surface of the sphere.
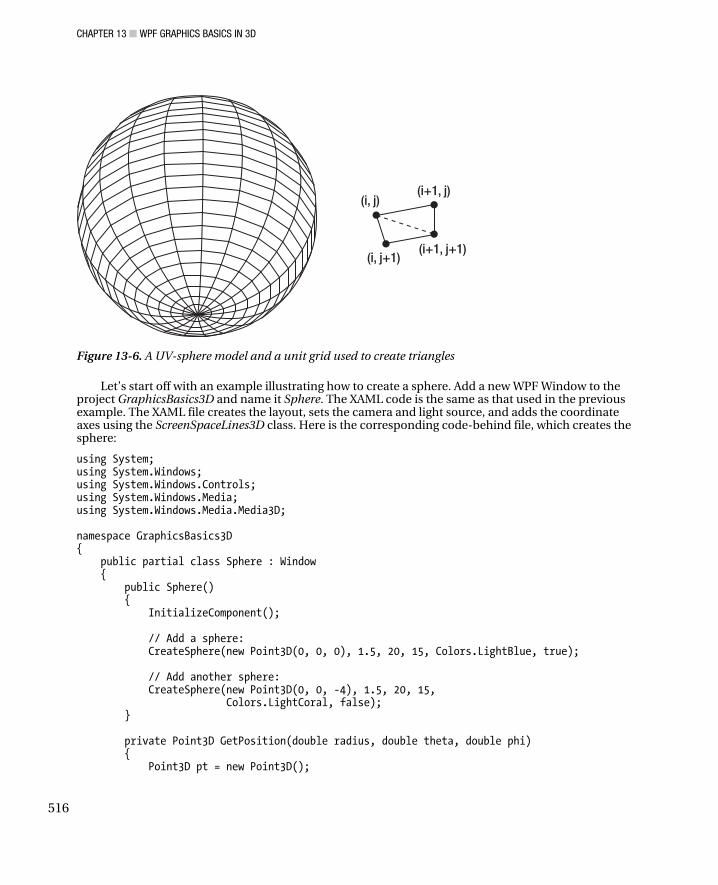
CHAPTER 13 ■ WPF GRAPHICS BASICS IN 3D
516
Figure 13-6. A UV-sphere model and a unit grid used to create triangles
Let’s start off with an example illustrating how to create a sphere. Add a new WPF Window to the project GraphicsBasics3D and name it Sphere. The XAML code is the same as that used in the previous example. The XAML file creates the layout, sets the camera and light source, and adds the coordinate axes using the ScreenSpaceLines3D class. Here is the corresponding code-behind file, which creates the sphere:
using System; using System.Windows; using System.Windows.Controls; using System.Windows.Media; using System.Windows.Media.Media3D; namespace GraphicsBasics3D { public partial class Sphere : Window { public Sphere() { InitializeComponent(); // Add a sphere: CreateSphere(new Point3D(0, 0, 0), 1.5, 20, 15, Colors.LightBlue, true); // Add another sphere: CreateSphere(new Point3D(0, 0, -4), 1.5, 20, 15, Colors.LightCoral, false); } private Point3D GetPosition(double radius, double theta, double phi) { Point3D pt = new Point3D();

CHAPTER 13 ■ WPF GRAPHICS BASICS IN 3D
517
double snt = Math.Sin(theta * Math.PI / 180); double cnt = Math.Cos(theta * Math.PI / 180); double snp = Math.Sin(phi * Math.PI / 180); double cnp = Math.Cos(phi * Math.PI / 180); pt.X = radius * snt * cnp; pt.Y = radius * cnt; pt.Z = -radius * snt * snp; return pt; } private void CreateSphere(Point3D center, double radius, int u, int v, Color color, bool isWireframe) { if (u < 2 || v < 2) return; Point3D[,] pts = new Point3D[u, v]; for (int i = 0; i < u; i++) { for (int j = 0; j < v; j++) { pts[i, j] = GetPosition(radius, i * 180 / (u - 1), j * 360 / (v - 1)); pts[i, j] += (Vector3D)center; } } Point3D[] p = new Point3D[4]; for (int i = 0; i < u - 1; i++) { for (int j = 0; j < v - 1; j++) { p[0] = pts[i, j]; p[1] = pts[i + 1, j]; p[2] = pts[i + 1, j + 1]; p[3] = pts[i, j + 1]; Utility.CreateTriangleFace(p[0], p[1], p[2], color, isWireframe, myViewport); Utility.CreateTriangleFace(p[2], p[3], p[0], color, isWireframe, myViewport); } } } } }
Here, you construct triangle meshes by dividing the sphere surface into segments and rings. You can specify the number of segments and rings using two integers, u and v. This application also allows you to specify the radius and position (the center location) of the sphere. The GetPosition method returns the points on the sphere surface by specifying their radius, longitude, and latitude.
Notice how you perform the triangulation for the unit grid inside the CreateSphere method, in which the four vertex points that define the unit grid are specified, and two triangles are defined using these four vertices within two for-loops. The triangle is created by calling the CreateTriangleFace method in the Utility class, which is the same as that used in the previous example.

CHAPTER 13 ■ WPF GRAPHICS BASICS IN 3D
518
Finally, you create two sphere objects at different locations using the CreateSphere method, one with the wireframe and the other without it.
Figure 13-7 shows the results of running this example.
Figure 13-7. Spheres created in WPF
Creating a Cylinder In this section, I’ll show you how to create a cylinder shape in WPF. Here, we’ll create a general cylinder shape that will allow you to specify its inner and outer radii. By setting a nonzero inner radius, you can create a cylindrical tube shape.
As you probably know, in a cylindrical coordinate system, a point is specified by three parameters, r, θ, and y, which are a bit different from the conventional definition of the system using r, θ, and z. The notation we use here is only for convenience, since the computer screen can always be described using the X-Y plane. Here, r is the distance of a projected point on the X-Z plane from the origin, and θ is the azimuthal angle.
Figure 13-8 shows a point in the cylindrical coordinate system. From this figure you have

CHAPTER 13 ■ WPF GRAPHICS BASICS IN 3D
519
Figure 13-8. Cylindrical coordinate system
By using the cylindrical coordinate system, you can easily create cylindrical objects in WPF. First, we
need to make slices on the surface of the cylinder. As shown in Figure 13-9, the cylinder surface is divided into n slices, and a unit cell is formed by the ith and (i + 1)th slice lines. You can see that each unit contains eight vertices and four surfaces, which need to be triangulated. Furthermore, each surface can be represented using two triangles.
Figure 13-9. A cylinder and a unit cell

CHAPTER 13 ■ WPF GRAPHICS BASICS IN 3D
520
With this background information, it is now time to consider an example in which we create a cylinder shape in WPF. Add a new WPF Window to the project GraphicsBasics3D and name it Cylinder. The XAML code is the same as that used in the previous example. The following is the code-behind file for this example:
using System; using System.Windows; using System.Windows.Media; using System.Windows.Media.Media3D; namespace GraphicsBasics3D { public partial class Cylinder : Window { public Cylinder() { InitializeComponent(); //AddCylinder(); // Create a cylinder: CreateCylinder(new Point3D(0, 0, 0), 0, 1.2, 2, 20, Colors.LightBlue, true); // Create the other cylinder: CreateCylinder(new Point3D(0, 0, -4), 0.8, 1.2, 0.5, 20, Colors.LightCoral, true); // Create the other cylinder: CreateCylinder(new Point3D(-3, 0, 0), 1, 1.2, 0.5, 40, Colors.Red, false); } private Point3D GetPosition(double radius, double theta, double y) { Point3D pt = new Point3D(); double sn = Math.Sin(theta * Math.PI / 180); double cn = Math.Cos(theta * Math.PI / 180); pt.X = radius * cn; pt.Y = y; pt.Z = -radius * sn; return pt; } private void CreateCylinder(Point3D center, double rin, double rout, double height, int n, Color color, bool isWireframe) { if (n < 2 || rin == rout) return; double radius = rin; if (rin > rout) { rin = rout; rout = radius;

CHAPTER 13 ■ WPF GRAPHICS BASICS IN 3D
521
} double h = height / 2; Model3DGroup cylinder = new Model3DGroup(); Point3D[,] pts = new Point3D[n, 4]; for (int i = 0; i < n; i++) { pts[i, 0] = GetPosition(rout, i * 360 / (n - 1), h); pts[i, 1] = GetPosition(rout, i * 360 / (n - 1), -h); pts[i, 2] = GetPosition(rin, i * 360 / (n - 1), -h); pts[i, 3] = GetPosition(rin, i * 360 / (n - 1), h); } for (int i = 0; i < n; i++) { for (int j = 0; j < 4; j++) pts[i, j] += (Vector3D)center; } Point3D[] p = new Point3D[8]; for (int i = 0; i < n - 1; i++) { p[0] = pts[i, 0]; p[1] = pts[i, 1]; p[2] = pts[i, 2]; p[3] = pts[i, 3]; p[4] = pts[i + 1, 0]; p[5] = pts[i + 1, 1]; p[6] = pts[i + 1, 2]; p[7] = pts[i + 1, 3]; // Top surface: Utility.CreateTriangleFace(p[0], p[4], p[3], color, isWireframe, myViewport); Utility.CreateTriangleFace(p[4], p[7], p[3], color, isWireframe, myViewport); // Bottom surface: Utility.CreateTriangleFace(p[1], p[5], p[2], color, isWireframe, myViewport); Utility.CreateTriangleFace(p[5], p[6], p[2], color, isWireframe, myViewport); // Outer surface: Utility.CreateTriangleFace(p[0], p[1], p[4], color, isWireframe, myViewport); Utility.CreateTriangleFace(p[1], p[5], p[4], color, isWireframe, myViewport); // Inner surface: Utility.CreateTriangleFace(p[2], p[7], p[6], color, isWireframe, myViewport); Utility.CreateTriangleFace(p[2], p[3], p[7], color,
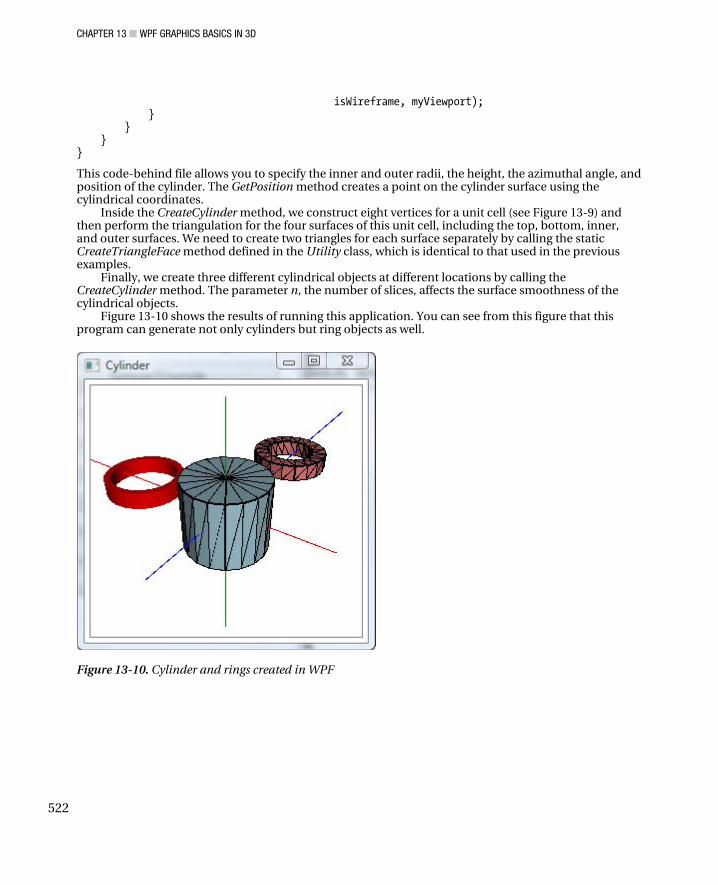
CHAPTER 13 ■ WPF GRAPHICS BASICS IN 3D
522
isWireframe, myViewport); } } } }
This code-behind file allows you to specify the inner and outer radii, the height, the azimuthal angle, and position of the cylinder. The GetPosition method creates a point on the cylinder surface using the cylindrical coordinates.
Inside the CreateCylinder method, we construct eight vertices for a unit cell (see Figure 13-9) and then perform the triangulation for the four surfaces of this unit cell, including the top, bottom, inner, and outer surfaces. We need to create two triangles for each surface separately by calling the static CreateTriangleFace method defined in the Utility class, which is identical to that used in the previous examples.
Finally, we create three different cylindrical objects at different locations by calling the CreateCylinder method. The parameter n, the number of slices, affects the surface smoothness of the cylindrical objects.
Figure 13-10 shows the results of running this application. You can see from this figure that this program can generate not only cylinders but ring objects as well.
Figure 13-10. Cylinder and rings created in WPF

CHAPTER 13 ■ WPF GRAPHICS BASICS IN 3D
523
Creating a Cone You can also create cone shapes using the cylindrical coordinate system. Here we want to create a general cone shape whose top radius, bottom radius, and height can all be specified. Figure 13-11 illustrates how slices are made on the surface of the cone and how a unit cell is defined. This unit cell has three surfaces that need to be triangulated, including a top, bottom, and outer surface. The top and bottom surfaces are already triangular shapes, and the outer surface can be represented with two triangles.
Figure 13-11. A cone shape and a unit cell
With this background knowledge, we can now create a cone shape in WPF. Let’s consider an example: Add a new WPF Windows application to the project GraphicsBasics3D and name it Cone. Again, we can use the same XAML code as in the previous examples. Here is the C# code that generates the cone shape:
using System; using System.Windows; using System.Windows.Media; using System.Windows.Media.Media3D; namespace GraphicsBasics3D { public partial class Cone : Window { public Cone() { InitializeComponent(); // Create a cone: CreateCone(new Point3D(0, 0, 0), 0, 1.2, 2, 20, Colors.LightBlue, true); // Create another cone:
CHAPTER 13 ■ WPF GRAPHICS BASICS IN 3D
524
CreateCone(new Point3D(0, 0, -3), 0.6, 1.2, 1, 20, Colors.LightCoral, false); // Create another cone: CreateCone(new Point3D(0, 0, -6), 1.2, 0.4, 2, 20, Colors.LightGreen, false); // Create another cone: CreateCone(new Point3D(0, 0, 3), 0.5, 1.2, 1.2, 4, Colors.Goldenrod, false); // Create another cone: CreateCone(new Point3D(-3, 0, 0), 0.8, 0.8, 1.5, 20, Colors.Red, true); // Create another cone: CreateCone(new Point3D(3, 0, 0), 0, 0.8, 1.5, 5, Colors.SteelBlue, false); } private Point3D GetPosition(double radius, double theta, double y) { Point3D pt = new Point3D(); double sn = Math.Sin(theta * Math.PI / 180); double cn = Math.Cos(theta * Math.PI / 180); pt.X = radius * cn; pt.Y = y; pt.Z = -radius * sn; return pt; } private void CreateCone(Point3D center, double rtop, double rbottom, double height, int n, Color color, bool isWireframe) { if (n < 2) return; double h = height / 2; Model3DGroup cone = new Model3DGroup(); Point3D[,] pts = new Point3D[n + 1, 4]; for (int i = 0; i < n + 1; i++) { pts[i, 0] = GetPosition(rtop, i * 360 / (n - 1), h); pts[i, 1] = GetPosition(rbottom, i * 360 / (n - 1), -h); pts[i, 2] = GetPosition(0, i * 360 / (n - 1), -h); pts[i, 3] = GetPosition(0, i * 360 / (n - 1), h); } for (int i = 0; i < n + 1; i++) { for (int j = 0; j < 4; j++) pts[i, j] += (Vector3D)center; }

CHAPTER 13 ■ WPF GRAPHICS BASICS IN 3D
525
Point3D[] p = new Point3D[6]; for (int i = 0; i < n; i++) { p[0] = pts[i, 0]; p[1] = pts[i, 1]; p[2] = pts[i, 2]; p[3] = pts[i, 3]; p[4] = pts[i + 1, 0]; p[5] = pts[i + 1, 1]; // Top surface: Utility.CreateTriangleFace(p[0], p[4], p[3], color, isWireframe, myViewport); // Bottom surface: Utility.CreateTriangleFace(p[1], p[5], p[2], color, isWireframe, myViewport); // Side surface: Utility.CreateTriangleFace(p[0], p[1], p[5], color, isWireframe, myViewport); Utility.CreateTriangleFace(p[0], p[5], p[4], color, isWireframe, myViewport); } } } }
Note that the CreateCone method, like the CreateCylinder method in the previous example, still uses the GetPosition method, which returns a point represented in the cylindrical coordinate system, to specify the positions of the vertices of the unit cell. Within a for-loop, the corresponding triangles for each of the three surfaces are constructed from these vertices by calling the CreateTriangleFace method in the Utility class. Finally, we create several different cone objects using the CreateCone method by specifying the top and bottom radii, the height, and the number of slices.
Figure 13-12 shows the results of running this example. You can see that this application can create various cone shapes, including a cylinder (by setting the top and bottom radii to be equal), a cone (by setting one of the radii to zero), a truncated cone (by setting both radii to be finite), and even a pyramid (by setting the number of slices to a small integer).
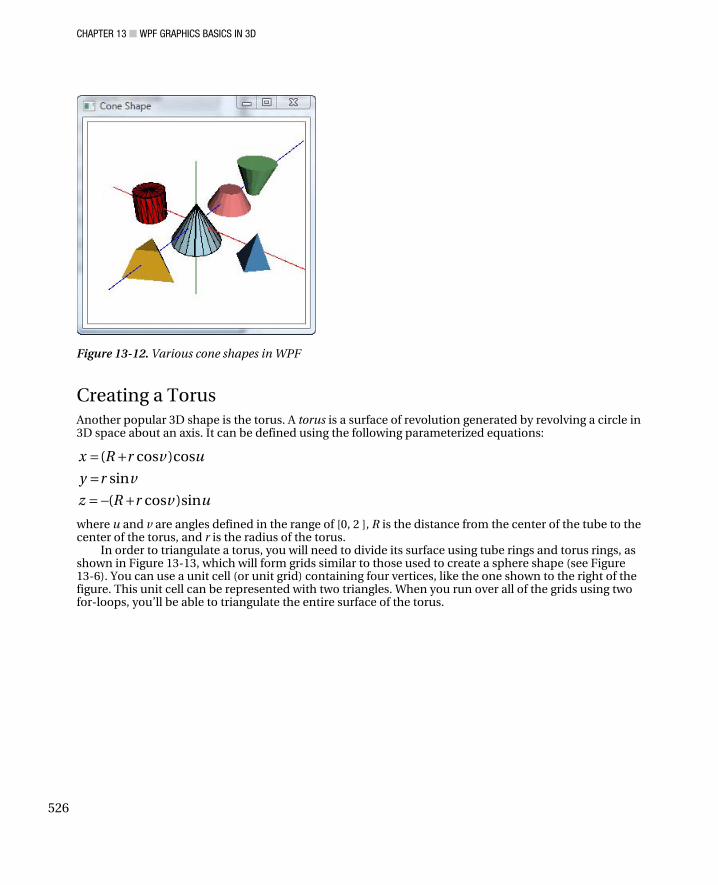
CHAPTER 13 ■ WPF GRAPHICS BASICS IN 3D
526
Figure 13-12. Various cone shapes in WPF
Creating a Torus Another popular 3D shape is the torus. A torus is a surface of revolution generated by revolving a circle in 3D space about an axis. It can be defined using the following parameterized equations:
where u and v are angles defined in the range of [0, 2 ], R is the distance from the center of the tube to the center of the torus, and r is the radius of the torus.
In order to triangulate a torus, you will need to divide its surface using tube rings and torus rings, as shown in Figure 13-13, which will form grids similar to those used to create a sphere shape (see Figure 13-6). You can use a unit cell (or unit grid) containing four vertices, like the one shown to the right of the figure. This unit cell can be represented with two triangles. When you run over all of the grids using two for-loops, you’ll be able to triangulate the entire surface of the torus.
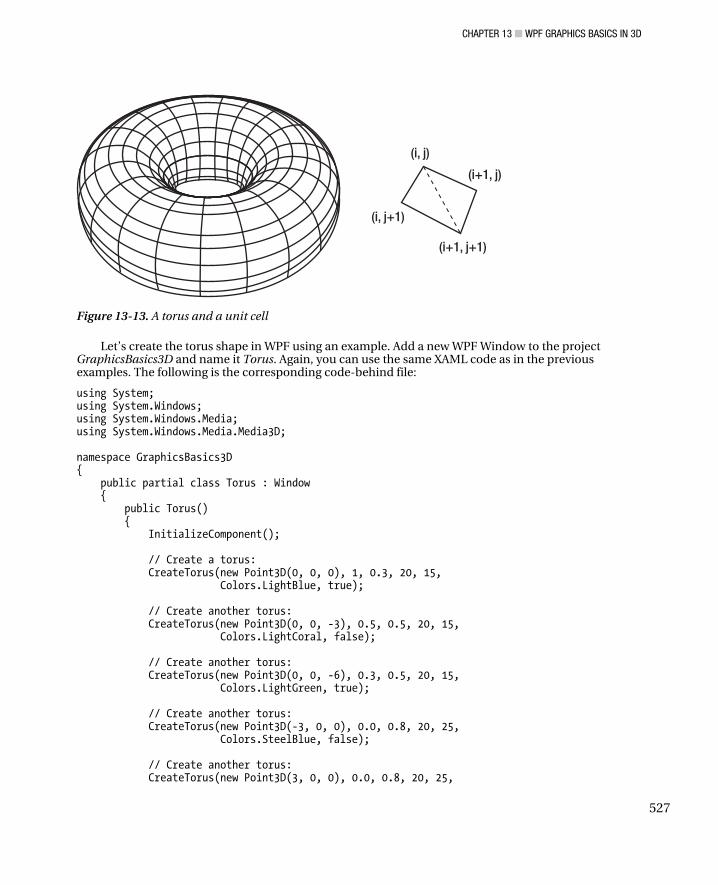
CHAPTER 13 ■ WPF GRAPHICS BASICS IN 3D
527
Figure 13-13. A torus and a unit cell
Let’s create the torus shape in WPF using an example. Add a new WPF Window to the project GraphicsBasics3D and name it Torus. Again, you can use the same XAML code as in the previous examples. The following is the corresponding code-behind file:
using System; using System.Windows; using System.Windows.Media; using System.Windows.Media.Media3D; namespace GraphicsBasics3D { public partial class Torus : Window { public Torus() { InitializeComponent(); // Create a torus: CreateTorus(new Point3D(0, 0, 0), 1, 0.3, 20, 15, Colors.LightBlue, true); // Create another torus: CreateTorus(new Point3D(0, 0, -3), 0.5, 0.5, 20, 15, Colors.LightCoral, false); // Create another torus: CreateTorus(new Point3D(0, 0, -6), 0.3, 0.5, 20, 15, Colors.LightGreen, true); // Create another torus: CreateTorus(new Point3D(-3, 0, 0), 0.0, 0.8, 20, 25, Colors.SteelBlue, false); // Create another torus: CreateTorus(new Point3D(3, 0, 0), 0.0, 0.8, 20, 25,
CHAPTER 13 ■ WPF GRAPHICS BASICS IN 3D
528
Colors.Goldenrod, false); } private Point3D GetPosition(double R, double r, double u, double v) { Point3D pt = new Point3D(); double snu = Math.Sin(u * Math.PI / 180); double cnu = Math.Cos(u * Math.PI / 180); double snv = Math.Sin(v * Math.PI / 180); double cnv = Math.Cos(v * Math.PI / 180); pt.X = (R + r * cnv) * cnu; pt.Y = r * snv; pt.Z = -(R + r * cnv) * snu; return pt; } private void CreateTorus(Point3D center, double R, double r, int N, int n, Color color, bool isWireframe) { if (n < 2 || N < 2) return; Model3DGroup torus = new Model3DGroup(); Point3D[,] pts = new Point3D[N, n]; for (int i = 0; i < N; i++) { for (int j = 0; j < n; j++) { pts[i, j] = GetPosition(R, r, i * 360 / (N - 1), j * 360 / (n - 1)); pts[i, j] += (Vector3D)center; } } Point3D[] p = new Point3D[4]; for (int i = 0; i < N - 1; i++) { for (int j = 0; j < n - 1; j++) { p[0] = pts[i, j]; p[1] = pts[i + 1, j]; p[2] = pts[i + 1, j + 1]; p[3] = pts[i, j + 1]; Utility.CreateTriangleFace(p[0], p[1], p[2], color, isWireframe, myViewport); Utility.CreateTriangleFace(p[2], p[3], p[0], color, isWireframe, myViewport); } } } } }

CHAPTER 13 ■ WPF GRAPHICS BASICS IN 3D
529
The GetPosition method in the foregoing code returns a point on the torus surface. The CreateTorus method uses the GetPosition method to define the four vertices of the unit cell. The two triangles are constructed from these four vertices within two for-loops by calling the static CreateTriangleFace method in the Utility class. Finally, we use the CreateTorus method to create several different torus shapes with different sets of parameters at different locations.
Figure 13-14 shows the results of running this application. You can see that as the distance to the axis of revolution decreases, the ring torus becomes a spindle torus and finally degenerates into a sphere when the distance goes to zero.
Figure 13-14. Torus shapes in WPF
In this chapter, you learned how to create various 3D shapes directly in WPF. This approach is easy to follow and gives you the flexibility to specify a different material for each individual triangle.

CHAPTER 13 ■ WPF GRAPHICS BASICS IN 3D
530

C H A P T E R 14
■ ■ ■
531
3D Charts with the WPF 3D Engine
In the previous two chapters, we discussed 3D transformations and 3D graphics basics in WPF. In this chapter, I’ll show you how to create various surface charts in 3D space. Surfaces play an important role in various applications, including computer graphics, virtual reality, computer games, and 3D data visualizations. This chapter begins by describing data structures and the algorithm you use to manipulate and display simple surfaces. With this technique, you can create a variety of simple surfaces, including surfaces containing random data.
The chapter then covers several specialized techniques by which you can create all sorts of complex surface charts, including parametric, extruded, and rotated surfaces.
Simple Surfaces Mathematically, a surface draws a Z function on a surface for each X and Y coordinate in a region of interest. For each X and Y value, a simple surface can have at most one Z value. Complex surfaces can have multiple Z values for each pair of X and Y values; these will be discussed later in this chapter.
The coordinate system in WPF is oriented so that the Y axis is the “up” direction. To be consistent with WPF notation, we’ll consider surfaces defined by functions that return a Y value (instead of a Z value) for each X and Z coordinate in a region of interest. In order to translate a function from a system that gives Z as a function of X and Y, you simply reverse the roles of the Y and Z axes.
You can define a simple surface by the Y coordinates of points above a rectangular grid in the X-Z plane. The surface is formed by joining adjacent points using straight lines. Simple surfaces are useful for visualizing 2D data arrays (matrices) that are too large to display in numerical form and for graphing functions of two variables.
Typically, a surface is formed using rectangular meshes. However, WPF only provides triangles as a basic unit to represent any surface in 3D. In order to represent a surface using the traditional rectangles, you need to write your own class and methods.
Rectangular Meshes In this section, you’ll learn how to write your own class and methods, which will allow you to create rectangular meshes. Since this class provides a technique for generating rectangular meshes that can be used not only in simple surfaces but in complex surfaces as well, you’ll implement it in a general Utility class.
Start with a new WPF project and name it Chart3DWithWPFEngine. Add a new class to this project and call it Utility. You’ll also need to add Microsoft’s 3DTools to the References. Here is the code listing for this class:

CHAPTER 14 ■ 3D CHARTS WITH THE WPF 3D ENGINE
532
using System; using System.Collections.Generic; using System.Windows; using System.Windows.Media; using System.Windows.Media.Media3D; using System.Windows.Controls; using _3DTools; namespace Chart3DWithWPFEngine { public class Utility { public static void CreateRectangleFace(Point3D p0, Point3D p1, Point3D p2, Point3D p3, Color surfaceColor, Viewport3D viewport) { MeshGeometry3D mesh = new MeshGeometry3D(); mesh.Positions.Add(p0); mesh.Positions.Add(p1); mesh.Positions.Add(p2); mesh.Positions.Add(p3); mesh.TriangleIndices.Add(0); mesh.TriangleIndices.Add(1); mesh.TriangleIndices.Add(2); mesh.TriangleIndices.Add(2); mesh.TriangleIndices.Add(3); mesh.TriangleIndices.Add(0); SolidColorBrush brush = new SolidColorBrush(); brush.Color = surfaceColor; Material material = new DiffuseMaterial(brush); GeometryModel3D geometry = new GeometryModel3D(mesh, material); ModelVisual3D model = new ModelVisual3D(); model.Content = geometry; viewport.Children.Add(model); } public static void CreateWireframe(Point3D p0, Point3D p1, Point3D p2, Point3D p3, Color lineColor, Viewport3D viewport) { ScreenSpaceLines3D ssl = new ScreenSpaceLines3D(); ssl.Points.Add(p0); ssl.Points.Add(p1); ssl.Points.Add(p1); ssl.Points.Add(p2); ssl.Points.Add(p2); ssl.Points.Add(p3); ssl.Points.Add(p3); ssl.Points.Add(p0); ssl.Color = lineColor; ssl.Thickness = 2; viewport.Children.Add(ssl); } public static Point3D GetNormalize(Point3D pt, double xmin, double xmax,

CHAPTER 14 ■ 3D CHARTS WITH THE WPF 3D ENGINE
533
double ymin, double ymax, double zmin, double zmax) { pt.X = -1 + 2 * (pt.X - xmin) / (xmax - xmin); pt.Y = -1 + 2 * (pt.Y - ymin) / (ymax - ymin); pt.Z = -1 + 2 * (pt.Z - zmin) / (zmax - zmin); return pt; } } }
This class includes three static public methods. The CreateRectangleFace method takes four vertex points as its inputs. Inside this method, the rectangular face is constructed using two triangles. You can specify the color of the rectangular face and theViewport3D in which it resides.
The CreateWireframe method also takes four vertices as its inputs. Here, you draw a rectangular mesh directly instead of a triangular one. When this method is called, it will create a rectangular wireframe for your surfaces.
The GetNormalize method maps the region of your surface into a region of [–1, 1], which gives you a better view on your screen.
SimpleSurface Class The simplest way to store surface data is to use a 2D array. For each point (X, Z) in the region defined for the surface, the (X, Z) entry in the array gives the Y coordinate of the corresponding point on the surface.
Creating simple surfaces is easy. Add a new class called SimpleSurface to the project Chart3DWithWPFEngine. Here is the code listing for this class:
using System; using System.Collections.Generic; using System.Windows; using System.Windows.Media; using System.Windows.Media.Media3D; using System.Windows.Controls; namespace Chapter13 { public class SimpleSurface { public delegate Point3D Function(double x, double z); private double xmin = -3; private double xmax = 3; private double ymin = -8; private double ymax = 8; private double zmin = -3; private double zmax = 3; private int nx = 30; private int nz = 30; private Color lineColor = Colors.Black; private Color surfaceColor = Colors.White; private Point3D center = new Point3D(); private bool isHiddenLine = false; private bool isWireframe = true; private Viewport3D viewport3d = new Viewport3D();
CHAPTER 14 ■ 3D CHARTS WITH THE WPF 3D ENGINE
534
public bool IsWireframe { get { return isWireframe; } set { isWireframe = value; } } public bool IsHiddenLine { get { return isHiddenLine; } set { isHiddenLine = value; } } public Color LineColor { get { return lineColor; } set { lineColor = value; } } public Color SurfaceColor { get { return surfaceColor; } set { surfaceColor = value; } } public double Xmin { get { return xmin; } set { xmin = value; } } public double Xmax { get { return xmax; } set { xmax = value; } } public double Ymin { get { return ymin; } set { ymin = value; } } public double Ymax { get { return ymax; } set { ymax = value; } } public double Zmin { get { return zmin; } set { zmin = value; } }

CHAPTER 14 ■ 3D CHARTS WITH THE WPF 3D ENGINE
535
public double Zmax { get { return zmax; } set { zmax = value; } } public int Nx { get { return nx; } set { nx = value; } } public int Nz { get { return nz; } set { nz = value; } } public Point3D Center { get { return center; } set { center = value; } } public Viewport3D Viewport3d { get { return viewport3d; } set { viewport3d = value; } } public void CreateSurface(Function f) { double dx = (Xmax - Xmin) / Nx; double dz = (Zmax - Zmin) / Nz; if (Nx < 2 || Nz < 2) return; Point3D[,] pts = new Point3D[Nx, Nz]; for (int i = 0; i < Nx; i++) { double x = Xmin + i * dx; for (int j = 0; j < Nz; j++) { double z = Zmin + j * dz; pts[i, j] = f(x, z); pts[i, j] += (Vector3D)Center; pts[i, j] = Utility.GetNormalize(pts[i, j], Xmin, Xmax, Ymin, Ymax, Zmin, Zmax); } } Point3D[] p = new Point3D[4];

CHAPTER 14 ■ 3D CHARTS WITH THE WPF 3D ENGINE
536
for (int i = 0; i < Nx - 1; i++) { for (int j = 0; j < Nz - 1; j++) { p[0] = pts[i, j]; p[1] = pts[i, j + 1]; p[2] = pts[i + 1, j + 1]; p[3] = pts[i + 1, j]; //Create rectangular face: if (IsHiddenLine == false) Utility.CreateRectangleFace(p[0], p[1], p[2], p[3], SurfaceColor, Viewport3d); // Create wireframe: if (IsWireframe == true) Utility.CreateWireframe(p[0], p[1], p[2], p[3], LineColor, Viewport3d); } } } } }
First, you define a public delegate function that allows users to import their own functions or data, which will be used to draw the surface. Then you define several fields and their corresponding public properties. The Nx and Nz properties define the 2D data grid in the X-Z plane. Two bool properties, IsHiddenLine and IsWireframe, control whether or not the hidden lines and wireframes appear on your surface. The default value is false for IsHiddenLine (without hidden lines) and true for IsWireframe (with wireframes).
Inside the CreateSurface method, you first populate a 2D point array with the delegate function f(x, z) on the 2D data grid and then normalize the data of this array into the region [–1, 1] by calling the GetNormalize method from the Utility class. Next, you define a rectangular mesh using four adjacent vertex points and then call the CreateRectangleFace and CreateWireframe methods from the Utility class to create the rectangular mesh. The entire surface is then created when you run over all the grid points.
Creating Simple Surfaces Here, you’ll create some simple surfaces using the SimpleSurface class presented in the previous section. Add a new WPF Windows application to the project Chart3DWithWPFEngine and name it SimpleSurfaceTest. Here is the XAML file for this example:
<Window x:Class="Chart3DWithWPFEngine.SimpleSurfaceTest" xmlns="http://schemas.microsoft.com/winfx/2006/xaml/presentation" xmlns:x="http://schemas.microsoft.com/winfx/2006/xaml" Title="Simple Surface Test" Height="300" Width="600"> <Grid> <Grid.ColumnDefinitions> <ColumnDefinition/> <ColumnDefinition/> </Grid.ColumnDefinitions> <Viewport3D Name="viewport1" Grid.Column="0"> <Viewport3D.Camera>
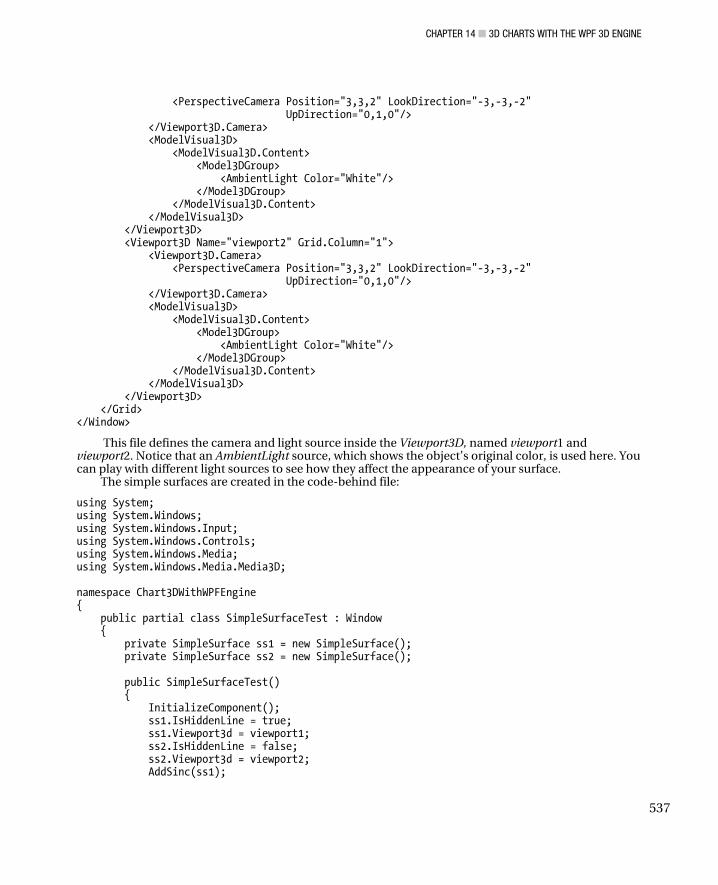
CHAPTER 14 ■ 3D CHARTS WITH THE WPF 3D ENGINE
537
<PerspectiveCamera Position="3,3,2" LookDirection="-3,-3,-2" UpDirection="0,1,0"/> </Viewport3D.Camera> <ModelVisual3D> <ModelVisual3D.Content> <Model3DGroup> <AmbientLight Color="White"/> </Model3DGroup> </ModelVisual3D.Content> </ModelVisual3D> </Viewport3D> <Viewport3D Name="viewport2" Grid.Column="1"> <Viewport3D.Camera> <PerspectiveCamera Position="3,3,2" LookDirection="-3,-3,-2" UpDirection="0,1,0"/> </Viewport3D.Camera> <ModelVisual3D> <ModelVisual3D.Content> <Model3DGroup> <AmbientLight Color="White"/> </Model3DGroup> </ModelVisual3D.Content> </ModelVisual3D> </Viewport3D> </Grid> </Window>
This file defines the camera and light source inside the Viewport3D, named viewport1 and viewport2. Notice that an AmbientLight source, which shows the object’s original color, is used here. You can play with different light sources to see how they affect the appearance of your surface.
The simple surfaces are created in the code-behind file:
using System; using System.Windows; using System.Windows.Input; using System.Windows.Controls; using System.Windows.Media; using System.Windows.Media.Media3D; namespace Chart3DWithWPFEngine { public partial class SimpleSurfaceTest : Window { private SimpleSurface ss1 = new SimpleSurface(); private SimpleSurface ss2 = new SimpleSurface(); public SimpleSurfaceTest() { InitializeComponent(); ss1.IsHiddenLine = true; ss1.Viewport3d = viewport1; ss2.IsHiddenLine = false; ss2.Viewport3d = viewport2; AddSinc(ss1);

CHAPTER 14 ■ 3D CHARTS WITH THE WPF 3D ENGINE
538
AddSinc(ss2); } private void AddSinc(SimpleSurface ss) { ss.Xmin = -8; ss.Xmax = 8; ss.Zmin = -8; ss.Zmax = 8; ss.Ymin = -1; ss.Ymax = 1; ss.CreateSurface(Sinc); } private Point3D Sinc(double x, double z) { double r = Math.Sqrt(x * x + z * z) + 0.00001; double y = Math.Sin(r) / r; return new Point3D(x, y, z); } } }
Here, you first create two SimpleSurface instances, ss1 and ss2 and then specify the Viewport3D property of these instances as the viewport1 and viewport2 defined in the XAML file. Next, you define a Sinc function, which is called directly by the CreateSurface method. Inside the AddSinc method, you also specify the data range of interest.
Figure 14-1 shows the results of running this application.
Figure 14-1. Simple surfaces with (left) and without (right) hidden lines
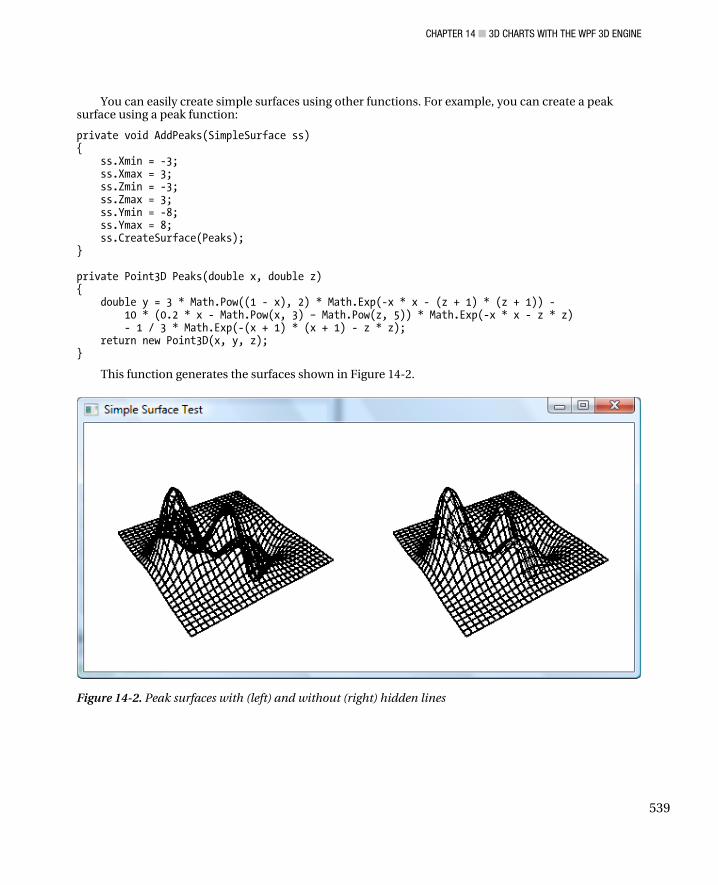
CHAPTER 14 ■ 3D CHARTS WITH THE WPF 3D ENGINE
539
You can easily create simple surfaces using other functions. For example, you can create a peak surface using a peak function:
private void AddPeaks(SimpleSurface ss) { ss.Xmin = -3; ss.Xmax = 3; ss.Zmin = -3; ss.Zmax = 3; ss.Ymin = -8; ss.Ymax = 8; ss.CreateSurface(Peaks); } private Point3D Peaks(double x, double z) { double y = 3 * Math.Pow((1 - x), 2) * Math.Exp(-x * x - (z + 1) * (z + 1)) - 10 * (0.2 * x - Math.Pow(x, 3) – Math.Pow(z, 5)) * Math.Exp(-x * x - z * z) - 1 / 3 * Math.Exp(-(x + 1) * (x + 1) - z * z); return new Point3D(x, y, z); }
This function generates the surfaces shown in Figure 14-2.
Figure 14-2. Peak surfaces with (left) and without (right) hidden lines

CHAPTER 14 ■ 3D CHARTS WITH THE WPF 3D ENGINE
540
You can even create a surface using a Random function:
private void AddRandomSurface(SimpleSurface ss) { ss.Xmin = -8; ss.Xmax = 8; ss.Zmin = -8; ss.Zmax = 8; ss.Ymin = -1; ss.Ymax = 1; ss.CreateSurface(RandomSurface); } private Random rand = new Random(); private Point3D RandomSurface(double x, double z) { double r = Math.Sqrt(x * x + z * z) + 0.00001; double y = Math.Sin(r) / r + 0.2 * rand.NextDouble(); return new Point3D(x, y, z); }
This function produces the surfaces shown in Figure 14-3.
Figure 14-3. Random surfaces with (left) and without (right) hidden lines

CHAPTER 14 ■ 3D CHARTS WITH THE WPF 3D ENGINE
541
Parametric Surfaces In the previous section, you learned how to create simple surfaces. A key feature of this type of surface is that there is at most one Y value for each pair of X and Z values. However, sometimes you may want to create a complex surface of a certain shape. This kind of complex surface can’t be represented by a simple function. For certain values of X and Z, this type of surface has more than one Y value. This means that you can’t use the approach discussed in the previous sections to store and display the data.
One way to represent such a surface is to use a set of parametric equations. These equations define the X, Y, and Z coordinates of points on the surface in terms of the parametric variables u and v. Many complex surfaces can be represented using parametric equations. For example, the sphere, the torus, and quadric surfaces are all parametric surfaces.
ParametricSurface Class In this section, you’ll write a ParametricSurface class that can create parametric surfaces. Add a new class called ParametricSurface to the project Chart3DWithWPFEngine. Here is the code listing for this class:
using System; using System.Collections.Generic; using System.Windows; using System.Windows.Media; using System.Windows.Media.Media3D; using System.Windows.Controls; namespace Chart3DWithWPFEngine { public class ParametricSurface { public delegate Point3D Function(double u, double v); private int nu = 30; private int nv = 30; private double umin = -3; private double umax = 3; private double vmin = -8; private double vmax = 8; private double xmin = -1; private double xmax = 1; private double ymin = -1; private double ymax = 1; private double zmin = -1; private double zmax = 1; private Color lineColor = Colors.Black; private Color surfaceColor = Colors.White; private Point3D center = new Point3D(); private bool isHiddenLine = false; private bool isWireframe = true; private Viewport3D viewport3d = new Viewport3D(); public bool IsWireframe

CHAPTER 14 ■ 3D CHARTS WITH THE WPF 3D ENGINE
542
{ get { return isWireframe; } set { isWireframe = value; } } public bool IsHiddenLine { get { return isHiddenLine; } set { isHiddenLine = value; } } public Color LineColor { get { return lineColor; } set { lineColor = value; } } public Color SurfaceColor { get { return surfaceColor; } set { surfaceColor = value; } } public double Umin { get { return umin; } set { umin = value; } } public double Umax { get { return umax; } set { umax = value; } } public double Vmin { get { return vmin; } set { vmin = value; } } public double Vmax { get { return vmax; } set { vmax = value; } } public int Nu { get { return nu; } set { nu = value; } }

CHAPTER 14 ■ 3D CHARTS WITH THE WPF 3D ENGINE
543
public int Nv { get { return nv; } set { nv = value; } } public double Xmin { get { return xmin; } set { xmin = value; } } public double Xmax { get { return xmax; } set { xmax = value; } } public double Ymin { get { return ymin; } set { ymin = value; } } public double Ymax { get { return ymax; } set { ymax = value; } } public double Zmin { get { return zmin; } set { zmin = value; } } public double Zmax { get { return zmax; } set { zmax = value; } } public Point3D Center { get { return center; } set { center = value; } } public Viewport3D Viewport3d { get { return viewport3d; } set { viewport3d = value; } }

CHAPTER 14 ■ 3D CHARTS WITH THE WPF 3D ENGINE
544
public void CreateSurface(Function f) { double du = (Umax - Umin) / (Nu - 1); double dv = (Vmax - Vmin) / (Nv - 1); if (Nu < 2 || Nv < 2) return; Point3D[,] pts = new Point3D[Nu, Nv]; for (int i = 0; i < Nu; i++) { double u = Umin + i * du; for (int j = 0; j < Nv; j++) { double v = Vmin + j * dv; pts[i, j] = f(u, v); pts[i, j] += (Vector3D)Center; pts[i, j] = Utility.GetNormalize(pts[i, j], Xmin, Xmax, Ymin, Ymax, Zmin, Zmax); } } Point3D[] p = new Point3D[4]; for (int i = 0; i < Nu - 1; i++) { for (int j = 0; j < Nv - 1; j++) { p[0] = pts[i, j]; p[1] = pts[i, j + 1]; p[2] = pts[i + 1, j + 1]; p[3] = pts[i + 1, j]; //Create rectangular face: if (IsHiddenLine == false) Utility.CreateRectangleFace(p[0], p[1], p[2], p[3], SurfaceColor, Viewport3d); // Create wireframe: if (IsWireframe == true) Utility.CreateWireframe(p[0], p[1], p[2], p[3], LineColor, Viewport3d); } } } } }
The structure of this class is basically similar to that of the SimpleSurface class, except you define the delegate function using the parametric variables u and v instead of x and z. You also define the umin, umax, vmin, and vmax fields and their corresponding properties to specify the parametric region of interest. This means that in the parametric u-v space, you create a constant u-v grid (with equal spacing in the u and v directions). The delegate function f(u, v) in this space has at most one value for each pair of u and v values. Thus, you actually create a simple surface in the u-v space using an approach similar to the one for creating simple surfaces. The trick to creating a parametric surface is to map the simple

CHAPTER 14 ■ 3D CHARTS WITH THE WPF 3D ENGINE
545
surface in the u-v space back to the X-Y-Z coordinate system. This mapping is governed by the parametric equations. The resulting surface in the real-world space can be very different than the surface in the parametric space.
Creating Parametric Surfaces Here, I’ll demonstrate how to create common parametric surfaces using the ParametricSurface class implemented in the previous section. Add a new WPF Window to the project Chart3DWithWPFEngine and name it ParametricSurfaceTest. The XAML file for this example is very simple:
<Window x:Class="Chart3DWithWPFEngine.ParametricSurfaceTest" xmlns="http://schemas.microsoft.com/winfx/2006/xaml/presentation" xmlns:x="http://schemas.microsoft.com/winfx/2006/xaml" Title="Parametric Surface Test" Height="300" Width="300"> <Grid> <Viewport3D Name="viewport"> <Viewport3D.Camera> <PerspectiveCamera Position="3,2,2" LookDirection="-3,-2,-2" UpDirection="0,1,0"/> </Viewport3D.Camera> <ModelVisual3D> <ModelVisual3D.Content> <Model3DGroup> <AmbientLight Color="White"/> </Model3DGroup> </ModelVisual3D.Content> </ModelVisual3D> </Viewport3D> </Grid> </Window>
This XAML file defines the camera and light source inside the Viewport3D, named viewport. Notice that we use here an AmbientLight source, which shows the object’s original color. You can play with different light sources to see how they affect the appearance of your surface. In the following sections, we’ll create several parametric surfaces in code.
Helicoid Surface A helicoid is a trace of a line. For any point on the surface, there is a line on the surface passing through it. Helicoids are shaped like screws and can be described in the Cartesian coordinate system by the following parametric equations:
You can easily create a helicoid surface in code using the ParametricSurface class:
using System; using System.Windows; using System.Windows.Input;

CHAPTER 14 ■ 3D CHARTS WITH THE WPF 3D ENGINE
546
using System.Windows.Controls; using System.Windows.Media; using System.Windows.Media.Media3D; namespace Chart3DWithWPFEngine { public partial class ParametricSurfaceTest : Window { private ParametricSurface ps = new ParametricSurface(); public ParametricSurfaceTest() { InitializeComponent(); ps.IsHiddenLine = false; ps.Viewport3d = viewport; AddHelicoid(); } private void AddHelicoid() { ps.Umin = 0; ps.Umax = 1; ps.Vmin = -3 * Math.PI; ps.Vmax = 3 * Math.PI; ps.Nv = 100; ps.Nu = 10; ps.Ymin = ps.Vmin; ps.Ymax = ps.Vmax; ps.CreateSurface(Helicoid); } private Point3D Helicoid(double u, double v) { double x = u * Math.Cos(v); double z = u * Math.Sin(v); double y = v; return new Point3D(x, y, z); } } }
The Helicoid method defines a delegate function in terms of the parameters u and v and returns a Point3D object in X-Y-Z coordinates. Inside the AddHelicoid method, you specify the parameter region and call the CreateSurface method using the Helicoid function to create the parametric surface.
Figure 14-4 shows the result of running this example.

CHAPTER 14 ■ 3D CHARTS WITH THE WPF 3D ENGINE
547
Figure 14-4. Helicoid surface
Sphere Surface You can also create a sphere surface using the ParametricSurface class. This can be done by simply replacing the Helicoid and AddHelicoid methods in the previous code listing with the following two code snippets:
private void AddSphere() { ps.Umin = 0; ps.Umax = 2 * Math.PI; ps.Vmin = -0.5 * Math.PI; ps.Vmax = 0.5 * Math.PI; ps.Nu = 20; ps.Nv = 20; ps.CreateSurface(Sphere); } private Point3D Sphere(double u, double v) { double x = Math.Cos(v) * Math.Cos(u); double z = Math.Cos(v) * Math.Sin(u); double y = Math.Sin(v); return new Point3D(x, y, z); }
This generates the results shown in Figure 14-5. You can see that these results provide a better surface appearance than the sphere we created using triangular meshes in the previous chapter.

CHAPTER 14 ■ 3D CHARTS WITH THE WPF 3D ENGINE
548
Figure 14-5. Sphere surface
Torus Surface You can also use the ParametricSurface class to create a torus surface, using the following methods:
private void AddTorus() { ps.Umin = 0; ps.Umax = 2 * Math.PI; ps.Vmin = 0; ps.Vmax = 2 * Math.PI; ps.Nu = 50; ps.Nv = 20; ps.CreateSurface(Torus); } private Point3D Torus(double u, double v) { double x = (1 + 0.3 * Math.Cos(v)) * Math.Cos(u); double z = (1 + 0.3 * Math.Cos(v)) * Math.Sin(u); double y = 0.3 * Math.Sin(v); return new Point3D(x, y, z); }
This gives the result shown in Figure 14-6.

CHAPTER 14 ■ 3D CHARTS WITH THE WPF 3D ENGINE
549
Figure 14-6. Torus surface
Quadric Surfaces You can also easily create various quadric surfaces using the ParametricSurface class. For example, consider the following four irreducible quadrics:
• Hyperboloid — described by these parametric equations:
•
• Paraboloid — described by these parametric equations:
• Elliptic cone — described by these parametric equations:

CHAPTER 14 ■ 3D CHARTS WITH THE WPF 3D ENGINE
550
• Elliptic cylinder — described by these parametric equations:
Here, a, b, and c are constants. You can easily implement the corresponding methods for each of these quadrics using the preceding parametric equations. You can view the complete source code by opening the file ParametricSurfaceTest.xaml.cs.
Figure 14-7 shows the results of creating these quadric surfaces using the ParametricSurface class.
Figure 14-7. Quadric surfaces: (a) hyperboloid, (b) paraboloid, (c) elliptic cone, and (d) elliptic cylinder

CHAPTER 14 ■ 3D CHARTS WITH THE WPF 3D ENGINE
551
Extruded Surfaces In 3D graphics, you can perform an extrusion by moving a base curve through space along a generating path, sweeping out a 3D surface. This type of surface is called an extruded surface. The cross sections of the surface look like the base curve that you are moving. For example, if you move a line segment in the direction perpendicular to it, you’ll sweep out a rectangle. In this case, the cross sections of the surface are line segments.
The generating path is not limited to being a straight line. It can also be a longer path or a curved path. The base curve can be any kind of curve. Extruded surfaces have several interesting features. For example, each of the areas that make up the surface is a parallelogram. Each time the base curve is moved along the generating path, the points along the curve are moved a fixed distance and direction determined by the generating path. Since the distance and direction are the same for any two adjacent points along the curve, the line segments connecting the points’ new and old positions are parallel. Because these segments are also the same length, connecting any two of these segments results in a parallelogram.
Another interesting feature of extruded surfaces is that you can create the same surface both by moving the base curve along the generating path and by moving the generating path along the base curve. You can create extruded surfaces using either approach.
Like the simple surfaces described earlier in this chapter, you generate extruded surfaces from a set of data points. As you did when you created simple surfaces, you can implement an ExtrudeSurface class that stores, manipulates, and displays extruded surfaces.
ExtrudeSurface Class In order to create the ExtrudeSurface class, you need two sets of data points: One set of data points is created along the base curve, and the other is created along the generating path. You can define these two sets of data points using two List objects, which allow the user to specify the base curve and the generating path.
Add a new ExtrudeSurface class to the project Chart3DWithWPFEngine. Here is the code listing for this class:
using System; using System.Collections.Generic; using System.Windows; using System.Windows.Media; using System.Windows.Media.Media3D; using System.Windows.Controls; using _3DTools; namespace Chart3DWithWPFEngine { public class ExtrudeSurface { private List<Point3D> curvePoints = new List<Point3D>(); private List<Point3D> pathPoints = new List<Point3D>(); private double xmin = -1; private double xmax = 1; private double ymin = -1; private double ymax = 1; private double zmin = -1; private double zmax = 1; private Color lineColor = Colors.Black;
CHAPTER 14 ■ 3D CHARTS WITH THE WPF 3D ENGINE
552
private Color surfaceColor = Colors.White; private Point3D center = new Point3D(); private bool isHiddenLine = false; private bool isWireframe = true; private Viewport3D viewport3d = new Viewport3D(); public bool IsWireframe { get { return isWireframe; } set { isWireframe = value; } } public bool IsHiddenLine { get { return isHiddenLine; } set { isHiddenLine = value; } } public Color LineColor { get { return lineColor; } set { lineColor = value; } } public Color SurfaceColor { get { return surfaceColor; } set { surfaceColor = value; } } public List<Point3D> CurvePoints { get { return curvePoints; } set { curvePoints = value; } } public List<Point3D> PathPoints { get { return pathPoints; } set { pathPoints = value; } } public double Xmin { get { return xmin; } set { xmin = value; } } public double Xmax { get { return xmax; } set { xmax = value; } }

CHAPTER 14 ■ 3D CHARTS WITH THE WPF 3D ENGINE
553
public double Ymin { get { return ymin; } set { ymin = value; } } public double Ymax { get { return ymax; } set { ymax = value; } } public double Zmin { get { return zmin; } set { zmin = value; } } public double Zmax { get { return zmax; } set { zmax = value; } } public Point3D Center { get { return center; } set { center = value; } } public Viewport3D Viewport3d { get { return viewport3d; } set { viewport3d = value; } } public void CreateSurface() { double dx, dy, dz; // create all points used to create extruded surface: Point3D[,] pts = new Point3D[PathPoints.Count, CurvePoints.Count]; for (int i = 0; i < PathPoints.Count; i++) { // Calculate offsets for path points: dx = PathPoints[i].X - PathPoints[0].X; dy = PathPoints[i].Y - PathPoints[0].Y; dz = PathPoints[i].Z - PathPoints[0].Z; for (int j = 0; j < CurvePoints.Count; j++) { pts[i, j].X = CurvePoints[j].X + dx;

CHAPTER 14 ■ 3D CHARTS WITH THE WPF 3D ENGINE
554
pts[i, j].Y = CurvePoints[j].Y + dy; pts[i, j].Z = CurvePoints[j].Z + dz; pts[i, j] += (Vector3D)Center; pts[i, j] = Utility.GetNormalize(pts[i, j], Xmin, Xmax, Ymin, Ymax, Zmin, Zmax); } } Point3D[] p = new Point3D[4]; for (int i = 0; i < PathPoints.Count - 1; i++) { for (int j = 0; j < CurvePoints.Count - 1; j++) { p[0] = pts[i, j]; p[1] = pts[i + 1, j]; p[2] = pts[i + 1, j + 1]; p[3] = pts[i, j + 1]; //Create rectangular face: if (IsHiddenLine == false) Utility.CreateRectangleFace(p[0], p[1], p[2], p[3], SurfaceColor, Viewport3d); // Create wireframe: if (IsWireframe == true) Utility.CreateWireframe(p[0], p[1], p[2], p[3], LineColor, Viewport3d); } } } } }
This class begins by defining two Point3D lists, curvePoints and pathPoints, which will be used to define the base curve and the generating path. The other fields and their corresponding properties are similar to those used in creating simple surfaces.
Inside the CreateSurface method, you compute the positions of the points on the surface using the CurvePoints and PathPoints objects. As long as you obtain all of the points on the surface, you can process them the same way you did when you created simple surfaces.
Creating Extruded Surfaces It is easy to create extruded surfaces using the ExtrudeSurface class. Add a new WPF Window application to the project Chart3DWithWPFEngine and name it ExtrudeSurfaceTest. The XAML file for this example is similar to that used to create simple surfaces, except for the changes in creating the Viewport3D and Camera. The following is the code-behind file for this example:
using System; using System.Windows; using System.Windows.Input; using System.Windows.Controls; using System.Windows.Media; using System.Windows.Media.Media3D;

CHAPTER 14 ■ 3D CHARTS WITH THE WPF 3D ENGINE
555
namespace Chart3DWithWPFEngine { public partial class ExtrudeSurfaceTest : Window { private ExtrudeSurface es = new ExtrudeSurface(); public ExtrudeSurfaceTest() { InitializeComponent(); es.Viewport3d = viewport; es.IsHiddenLine = false; AddExtrudeSurface1(); //AddExtrudeSurface2(); } // Extruded surface: private void AddExtrudeSurface1() { for (int i = 0; i < 17; i++) { double angle = i * Math.PI / 16 + 3 * Math.PI / 2; es.CurvePoints.Add(new Point3D(Math.Cos(angle), 0, Math.Sin(angle))); } for (int i = 0; i < 33; i++) { es.PathPoints.Add(new Point3D(Math.Cos(i * Math.PI / 12), i * Math.PI / 12, 0)); } es.Xmin = -3; es.Xmax = 3; es.Ymin = 5; es.Ymax = 20; es.Zmin = -3; es.Zmax = 5; es.CreateSurface(); } // Another Extruded surface: private void AddExtrudeSurface2() { for (int i = 0; i < 17; i++) { double angle = i * Math.PI / 8; es.CurvePoints.Add(new Point3D(1 + 0.3 * Math.Cos(angle), 0, 0.3 * Math.Sin(angle))); } for (int i = 0; i < 45; i++) {

CHAPTER 14 ■ 3D CHARTS WITH THE WPF 3D ENGINE
556
double angle = i * Math.PI / 16; es.PathPoints.Add(new Point3D(1.3*Math.Cos(angle), angle, 1.3*Math.Sin(angle))); } es.Xmin = -3; es.Xmax = 3; es.Ymin = 5; es.Ymax = 30; es.Zmin = -3; es.Zmax = 3; es.CreateSurface(); } } }
Here, you create two extruded surfaces. The first surface is generated by moving a semicircle (the base curve) along a cosine path (the generating path). The other surface is created by moving a circle (the base curve) along a helix path (the generating path).
Figure 14-8 shows the results of running this example.
Figure 14-8. Extruded surfaces in WPF
Surfaces of Revolution When you create an extruded surface, you move a base curve along a generating path. To create a surface of revolution, on the other hand, you rotate a base curve around an axis of rotation. Figure 14-9 shows a surface of revolution, with the base curve drawn in heavy lines. To create this surface, you rotate the base curve around the Y axis.

CHAPTER 14 ■ 3D CHARTS WITH THE WPF 3D ENGINE
557
Figure 14-9. A surface of revolution created by rotating a base curve (heavy lines) around the Y axis
Creating a surface of revolution is similar to creating an extruded surface. In both cases, you take a base curve and repeatedly transform it. You can produce a surface of revolution by rotating the base curve around any axis in 3D space.
In practice, however, it is much easier to rotate the base curve around the coordinate axes. If you want to rotate a curve around some other axis, you first apply translations and rotations until the axis you specify coincides with a coordinate axis. After you perform the rotation of the base curve around the coordinate axis, you then simply translate and rotate the axis back to its original position. These transform operations are described in detail in Chapter 12.
RotateSurface Class In this section, you’ll implement a RotateSurface class, which you can use to create surfaces of revolution. Add a new class called RotateSurface to the project Chart3DWithWPFEngine. Here is the code listing for this class:
using System; using System.Collections.Generic; using System.Windows; using System.Windows.Media; using System.Windows.Media.Media3D; using System.Windows.Controls; using _3DTools; namespace Chart3DWithWPFEngine { public class RorateSurface { private List<Point3D> curvePoints = new List<Point3D>(); private int thetaDiv = 20; private double xmin = -1; private double xmax = 1; private double ymin = -1;

CHAPTER 14 ■ 3D CHARTS WITH THE WPF 3D ENGINE
558
private double ymax = 1; private double zmin = -1; private double zmax = 1; private Color lineColor = Colors.Black; private Color surfaceColor = Colors.White; private Point3D center = new Point3D(); private bool isHiddenLine = false; private bool isWireframe = true; private Viewport3D viewport3d = new Viewport3D(); public bool IsWireframe { get { return isWireframe; } set { isWireframe = value; } } public int ThetaDiv { get { return thetaDiv; } set { thetaDiv = value; } } public bool IsHiddenLine { get { return isHiddenLine; } set { isHiddenLine = value; } } public Color LineColor { get { return lineColor; } set { lineColor = value; } } public Color SurfaceColor { get { return surfaceColor; } set { surfaceColor = value; } } public List<Point3D> CurvePoints { get { return curvePoints; } set { curvePoints = value; } } public double Xmin { get { return xmin; } set { xmin = value; } } public double Xmax
CHAPTER 14 ■ 3D CHARTS WITH THE WPF 3D ENGINE
559
{ get { return xmax; } set { xmax = value; } } public double Ymin { get { return ymin; } set { ymin = value; } } public double Ymax { get { return ymax; } set { ymax = value; } } public double Zmin { get { return zmin; } set { zmin = value; } } public double Zmax { get { return zmax; } set { zmax = value; } } public Point3D Center { get { return center; } set { center = value; } } public Viewport3D Viewport3d { get { return viewport3d; } set { viewport3d = value; } } private Point3D GetPosition(double r, double y, double theta) { double x = r * Math.Cos(theta); double z = -r * Math.Sin(theta); return new Point3D(x, y, z); } public void CreateSurface() { // create all points used to create surfaces of revolution around // the Y axis:

CHAPTER 14 ■ 3D CHARTS WITH THE WPF 3D ENGINE
560
Point3D[,] pts = new Point3D[ThetaDiv, CurvePoints.Count]; for (int i = 0; i < ThetaDiv; i++) { double theta = i * 2 * Math.PI / (ThetaDiv - 1); for (int j = 0; j < CurvePoints.Count; j++) { double x = CurvePoints[j].X; double z = CurvePoints[j].Z; double r = Math.Sqrt(x * x + z * z); pts[i, j] = GetPosition(r, CurvePoints[j].Y, theta); pts[i, j] += (Vector3D)Center; pts[i, j] = Utility.GetNormalize(pts[i, j], Xmin, Xmax, Ymin, Ymax, Zmin, Zmax); } } Point3D[] p = new Point3D[4]; for (int i = 0; i < ThetaDiv - 1; i++) { for (int j = 0; j < CurvePoints.Count - 1; j++) { p[0] = pts[i, j]; p[1] = pts[i + 1, j]; p[2] = pts[i + 1, j + 1]; p[3] = pts[i, j + 1]; //Create rectangular face: if (IsHiddenLine == false) Utility.CreateRectangleFace(p[0], p[1], p[2], p[3], SurfaceColor, Viewport3d); // Create wireframe: if (IsWireframe == true) Utility.CreateWireframe(p[0], p[1], p[2], p[3], LineColor, Viewport3d); } } } } }
This class begins by defining a Point3D list object called curvePoints, which will be used to create the base curve. The other fields and their corresponding properties are similar to those used in creating simple surfaces.
Inside the CreateSurface method, you compute the positions of the points on the surface using the CurvePoints and GetPostion methods. The GetPosition method computes the positions of the points on the surface when the base curve is rotated around the Y axis. As long as all of the points on the surface are obtained, you can process them the same way you processed simple surfaces.
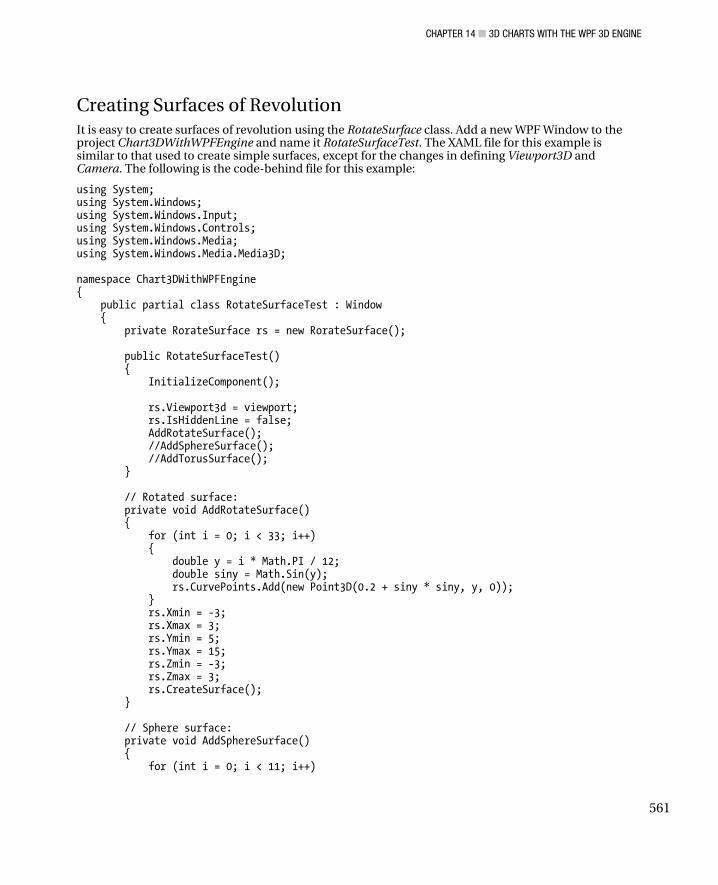
CHAPTER 14 ■ 3D CHARTS WITH THE WPF 3D ENGINE
561
Creating Surfaces of Revolution It is easy to create surfaces of revolution using the RotateSurface class. Add a new WPF Window to the project Chart3DWithWPFEngine and name it RotateSurfaceTest. The XAML file for this example is similar to that used to create simple surfaces, except for the changes in defining Viewport3D and Camera. The following is the code-behind file for this example:
using System; using System.Windows; using System.Windows.Input; using System.Windows.Controls; using System.Windows.Media; using System.Windows.Media.Media3D; namespace Chart3DWithWPFEngine { public partial class RotateSurfaceTest : Window { private RorateSurface rs = new RorateSurface(); public RotateSurfaceTest() { InitializeComponent(); rs.Viewport3d = viewport; rs.IsHiddenLine = false; AddRotateSurface(); //AddSphereSurface(); //AddTorusSurface(); } // Rotated surface: private void AddRotateSurface() { for (int i = 0; i < 33; i++) { double y = i * Math.PI / 12; double siny = Math.Sin(y); rs.CurvePoints.Add(new Point3D(0.2 + siny * siny, y, 0)); } rs.Xmin = -3; rs.Xmax = 3; rs.Ymin = 5; rs.Ymax = 15; rs.Zmin = -3; rs.Zmax = 3; rs.CreateSurface(); } // Sphere surface: private void AddSphereSurface() { for (int i = 0; i < 11; i++)
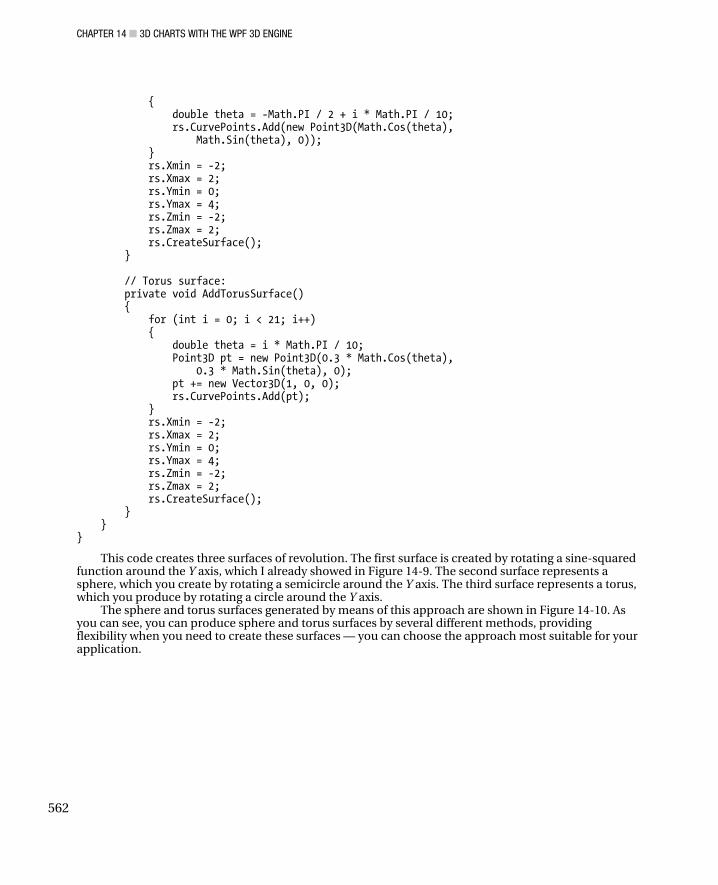
CHAPTER 14 ■ 3D CHARTS WITH THE WPF 3D ENGINE
562
{ double theta = -Math.PI / 2 + i * Math.PI / 10; rs.CurvePoints.Add(new Point3D(Math.Cos(theta), Math.Sin(theta), 0)); } rs.Xmin = -2; rs.Xmax = 2; rs.Ymin = 0; rs.Ymax = 4; rs.Zmin = -2; rs.Zmax = 2; rs.CreateSurface(); } // Torus surface: private void AddTorusSurface() { for (int i = 0; i < 21; i++) { double theta = i * Math.PI / 10; Point3D pt = new Point3D(0.3 * Math.Cos(theta), 0.3 * Math.Sin(theta), 0); pt += new Vector3D(1, 0, 0); rs.CurvePoints.Add(pt); } rs.Xmin = -2; rs.Xmax = 2; rs.Ymin = 0; rs.Ymax = 4; rs.Zmin = -2; rs.Zmax = 2; rs.CreateSurface(); } } }
This code creates three surfaces of revolution. The first surface is created by rotating a sine-squared function around the Y axis, which I already showed in Figure 14-9. The second surface represents a sphere, which you create by rotating a semicircle around the Y axis. The third surface represents a torus, which you produce by rotating a circle around the Y axis.
The sphere and torus surfaces generated by means of this approach are shown in Figure 14-10. As you can see, you can produce sphere and torus surfaces by several different methods, providing flexibility when you need to create these surfaces — you can choose the approach most suitable for your application.

CHAPTER 14 ■ 3D CHARTS WITH THE WPF 3D ENGINE
563
Figure 14-10. Sphere and torus created using the RotateSurface class
Surface Shading In the previous sections, we created surfaces using rectangular mesh lines. In some applications, however, you may want to paint your surfaces with color and shading effects. In this section, you’ll learn how to paint surfaces with different color, shading, and lighting effects. Here, when you are considering surface shading, you won’t draw mesh lines on the surfaces.
SurfaceShading Class In this section, you’ll write a SurfaceShading class, which can create surfaces with lighting and shading effects. Add a new class called SurfaceShading to the project Chart3DWithWPFEngine. Here is the code listing for this class:
using System; using System.Collections.Generic; using System.Windows; using System.Windows.Media; using System.Windows.Media.Media3D; using System.Windows.Controls; namespace Chart3DWithWPFEngine { public class SurfaceShading { public delegate Point3D Function(double u, double v); private MaterialGroup materialGroup = new MaterialGroup(); private Material backMaterial = new DiffuseMaterial(); private int nu = 30; private int nv = 30; private double umin = -3; private double umax = 3; private double vmin = -8; private double vmax = 8; private double xmin = -1; private double xmax = 1; private double ymin = -1;
CHAPTER 14 ■ 3D CHARTS WITH THE WPF 3D ENGINE
564
private double ymax = 1; private double zmin = -1; private double zmax = 1; private Point3D center = new Point3D(); private Viewport3D viewport3d = new Viewport3D(); public Material BackMaterial { get { return backMaterial; } set { backMaterial = value; } } public MaterialGroup MaterialGroup { get { return materialGroup; } set { materialGroup = value; } } public double Umin { get { return umin; } set { umin = value; } } public double Umax { get { return umax; } set { umax = value; } } public double Vmin { get { return vmin; } set { vmin = value; } } public double Vmax { get { return vmax; } set { vmax = value; } } public int Nu { get { return nu; } set { nu = value; } } public int Nv { get { return nv; } set { nv = value; } }

CHAPTER 14 ■ 3D CHARTS WITH THE WPF 3D ENGINE
565
public double Xmin { get { return xmin; } set { xmin = value; } } public double Xmax { get { return xmax; } set { xmax = value; } } public double Ymin { get { return ymin; } set { ymin = value; } } public double Ymax { get { return ymax; } set { ymax = value; } } public double Zmin { get { return zmin; } set { zmin = value; } } public double Zmax { get { return zmax; } set { zmax = value; } } public Point3D Center { get { return center; } set { center = value; } } public Viewport3D Viewport3d { get { return viewport3d; } set { viewport3d = value; } } public void CreateSurface(Function f) { double du = (Umax - Umin) / (Nu - 1); double dv = (Vmax - Vmin) / (Nv - 1);

CHAPTER 14 ■ 3D CHARTS WITH THE WPF 3D ENGINE
566
if (Nu < 2 || Nv < 2) return; Point3D[,] pts = new Point3D[Nu, Nv]; for (int i = 0; i < Nu; i++) { double u = Umin + i * du; for (int j = 0; j < Nv; j++) { double v = Vmin + j * dv; pts[i, j] = f(u, v); pts[i, j] += (Vector3D)Center; pts[i, j] = GetNormalize(pts[i, j]); } } Point3D[] p = new Point3D[4]; for (int i = 0; i < Nu - 1; i++) { for (int j = 0; j < Nv - 1; j++) { p[0] = pts[i, j]; p[1] = pts[i, j + 1]; p[2] = pts[i + 1, j + 1]; p[3] = pts[i + 1, j]; CreateRectangleFace(p[0], p[1], p[2], p[3]); } } } public void CreateRectangleFace(Point3D p0, Point3D p1, Point3D p2, Point3D p3) { MeshGeometry3D mesh = new MeshGeometry3D(); mesh.Positions.Add(p0); mesh.Positions.Add(p1); mesh.Positions.Add(p2); mesh.Positions.Add(p3); mesh.TriangleIndices.Add(0); mesh.TriangleIndices.Add(1); mesh.TriangleIndices.Add(2); mesh.TriangleIndices.Add(2); mesh.TriangleIndices.Add(3); mesh.TriangleIndices.Add(0); GeometryModel3D geometry = new GeometryModel3D(mesh, MaterialGroup); geometry.BackMaterial = BackMaterial; ModelVisual3D model = new ModelVisual3D(); model.Content = geometry; Viewport3d.Children.Add(model); }

CHAPTER 14 ■ 3D CHARTS WITH THE WPF 3D ENGINE
567
public Point3D GetNormalize(Point3D pt) { pt.X = -1 + 2 * (pt.X - Xmin) / (Xmax - Xmin); pt.Y = -1 + 2 * (pt.Y - Ymin) / (Ymax - Ymin); pt.Z = -1 + 2 * (pt.Z - Zmin) / (Zmax - Zmin); return pt; } } }
This class creates surfaces based on the parametric approach discussed earlier. In order to obtain better color and lighting effects, you use a MaterialGroup to specify the Material property of the surfaces. The MaterialGroup can contain multiple materials. You also define a BackMaterial property for the surface, because parametric surfaces usually are not closed surfaces. In order to see the back side of your surface, you need to specify the BackMaterial property of the surface.
Creating Shaded Surfaces It is easy to create surfaces with shading effects using the SurfaceShading class. Add a new WPF Windows application to the project Chart3DWithWPFEngine and name it SurfaceShadingTest. Here is the XAML file for this example:
<Window x:Class=" Chart3DWithWPFEngine.SurfaceShadingTest" xmlns="http://schemas.microsoft.com/winfx/2006/xaml/presentation" xmlns:x="http://schemas.microsoft.com/winfx/2006/xaml" Title="Surface Shading" Height="300" Width="300"> <Grid> <Viewport3D Name="viewport"> <Viewport3D.Camera> <PerspectiveCamera Position="6,4,4" LookDirection="-6,-4,-4" UpDirection="0,1,0"/> </Viewport3D.Camera> <ModelUIElement3D> <Model3DGroup> <AmbientLight Color="Gray"/> <DirectionalLight Color="Gray" Direction="-1,0,-1"/> <DirectionalLight Color="Gray" Direction="1,-1,-1"/> </Model3DGroup> </ModelUIElement3D> </Viewport3D> </Grid> </Window>
This XAML file sets the camera and light sources. Note that three light sources are used to illuminate the surfaces in order to get a better lighting effect. The following is the code-behind file for this example:
using System; using System.Windows; using System.Windows.Input; using System.Windows.Controls; using System.Windows.Media; using System.Windows.Media.Media3D;

CHAPTER 14 ■ 3D CHARTS WITH THE WPF 3D ENGINE
568
namespace Chart3DWithWPFEngine { public partial class SurfaceShadingTest : Window { private SurfaceShading ss; public SurfaceShadingTest() { InitializeComponent(); AddHyperboloid(); AddEllipticCone(); AddEllipticCylinder(); } // Hyperboloid surface: private void AddHyperboloid() { ss = new SurfaceShading(); Material material = new DiffuseMaterial(Brushes.Red); ss.MaterialGroup.Children.Add(material); material = new SpecularMaterial(Brushes.Yellow, 60); ss.MaterialGroup.Children.Add(material); material = new DiffuseMaterial(Brushes.SteelBlue); ss.BackMaterial = material; ss.Viewport3d = viewport; ss.Center = new Point3D(0, 0, 2); ss.Umin = 0; ss.Umax = 2 * Math.PI; ss.Vmin = -1; ss.Vmax = 1; ss.Nu = 30; ss.Nv = 30; ss.CreateSurface(Hyperboloid); } private Point3D Hyperboloid(double u, double v) { double x = 0.3 * Math.Cos(u) * Math.Cosh(v); double z = 0.5 * Math.Sin(u) * Math.Cosh(v); double y = Math.Sinh(v); return new Point3D(x, y, z); } //Elliptic cone: private void AddEllipticCone() { ss = new SurfaceShading(); Material material = new DiffuseMaterial(Brushes.Green); ss.MaterialGroup.Children.Add(material); material = new SpecularMaterial(Brushes.LightGreen, 60); ss.MaterialGroup.Children.Add(material);
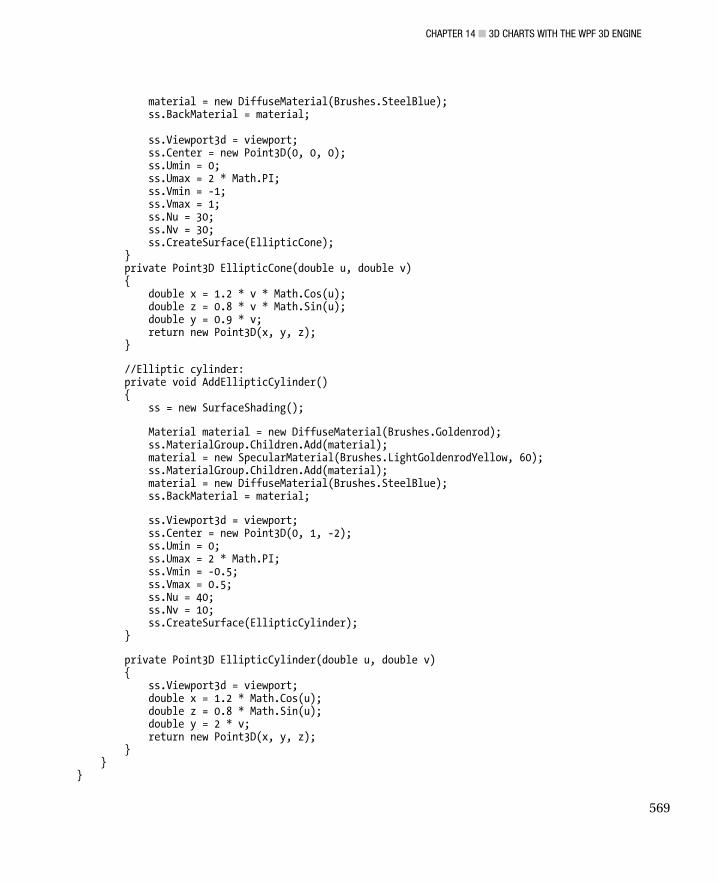
CHAPTER 14 ■ 3D CHARTS WITH THE WPF 3D ENGINE
569
material = new DiffuseMaterial(Brushes.SteelBlue); ss.BackMaterial = material; ss.Viewport3d = viewport; ss.Center = new Point3D(0, 0, 0); ss.Umin = 0; ss.Umax = 2 * Math.PI; ss.Vmin = -1; ss.Vmax = 1; ss.Nu = 30; ss.Nv = 30; ss.CreateSurface(EllipticCone); } private Point3D EllipticCone(double u, double v) { double x = 1.2 * v * Math.Cos(u); double z = 0.8 * v * Math.Sin(u); double y = 0.9 * v; return new Point3D(x, y, z); } //Elliptic cylinder: private void AddEllipticCylinder() { ss = new SurfaceShading(); Material material = new DiffuseMaterial(Brushes.Goldenrod); ss.MaterialGroup.Children.Add(material); material = new SpecularMaterial(Brushes.LightGoldenrodYellow, 60); ss.MaterialGroup.Children.Add(material); material = new DiffuseMaterial(Brushes.SteelBlue); ss.BackMaterial = material; ss.Viewport3d = viewport; ss.Center = new Point3D(0, 1, -2); ss.Umin = 0; ss.Umax = 2 * Math.PI; ss.Vmin = -0.5; ss.Vmax = 0.5; ss.Nu = 40; ss.Nv = 10; ss.CreateSurface(EllipticCylinder); } private Point3D EllipticCylinder(double u, double v) { ss.Viewport3d = viewport; double x = 1.2 * Math.Cos(u); double z = 0.8 * Math.Sin(u); double y = 2 * v; return new Point3D(x, y, z); } } }
CHAPTER 14 ■ 3D CHARTS WITH THE WPF 3D ENGINE
570
In this class, you create three surfaces using different materials. These three surfaces are a hyperboloid, an elliptic cone, and an elliptic cylinder.
Figure 14-11 shows the results of running this application.
Figure 14-11. Shaded surfaces in WPF
In this chapter, we emphasized the algorithm used to create various surfaces, leaving some important topics untouched. For example, you may want your surfaces to have a colormap scaled with the Y values and a colorbar. This will be the topic of the next chapter, where you’ll find an in-depth discussion of surface colormaps, colorbars, and various surface charts that don’t use the WPF 3D engine.
We did not discuss two kinds of parametric surfaces: Bezier and B-spline surfaces. These surfaces are the 3D counterparts to 2D Bezier curves and B-splines. Following the procedures presented here, you should be able to create these two particular kinds of surfaces without any difficulty.

C H A P T E R 15
■ ■ ■
571
3D Charts Without the WPF
3D Engine
In the previous chapter, I demonstrated how to create a variety of 3D surface charts using the WPF 3D engine. However, it is difficult to implement professional 3D charts based on the default WPF 3D framework. In this chapter, you’ll learn how to use a direct projection approach, without using the WPF 3D engine, to create more sophisticated 3D charts with more features, including colormaps and colorbars. I’ll start with a description of the coordinate system used for 3D charts and show you how to create 3D coordinate axes, tick marks, axis labels, and gridlines. The 3D coordinate system used in 3D charts is the most fundamental part of creating 3D chart applications because it involves almost all of the matrix operations and transformations used to create 3D charts.
This chapter will then show you how to create various 3D chart applications, including 3D line charts, 3D meshes, and surface charts. The example programs in this chapter provide basic solutions for 3D chart applications. Based on this example code, with or without modifications, you can easily create your own professional and advanced 3D charts in your WPF applications.
3D Coordinate System Here, I’ll show you how to create a 3D coordinate system using a direct projection method, disregarding the WPF 3D engine. Creating 3D coordinate axes on a 2D screen is more involved than creating 2D coordinates. Here, we’ll use the azimuth and elevation view to control the orientation of the 3D charts and graphics objects displayed in the coordinate axes.
Azimuth and Elevation View Specifying the viewpoint in terms of azimuth and elevation is conceptually simple. The 3D charts that will be represented in the following sections will use this azimuth and elevation view to display various 3D plots on a 2D computer screen. There are some limitations to this view setting, however. Azimuth and elevation view does not allow you to specify the actual position of the viewpoint — just its direction — and the Z axis is always pointing up. In addition, it does not allow you to zoom in and out of the scene or perform arbitrary rotations and translations. Even with these limitations, this view setting is good enough for most 3D chart and graphics applications.
In this view setting, the conventional Cartesian coordinate system is used. The azimuth angle is a polar angle in the X-Y plane, with positive angles indicating a counterclockwise rotation of the viewpoint. Elevation is the angle above (positive angle) or below (negative angle) the X-Y plane, as shown in Figure 15-1.

CHAPTER 15 ■ 3D CHARTS WITHOUT THE WPF 3D ENGINE
572
Figure 15-1. Azimuth and elevation view system
We can construct the transformation matrix for this view system by considering two successive 2D rotations. First, we rotate the original coordinate system by an angle –φ about the Z axis; then we rotate the newly generated coordinate system by θ – π/2 about the X axis. We can then obtain the combined effect of these two 2D rotations:
You can easily implement this azimuth and elevation view matrix in WPF. Start with a new WPF Windows application and name it Chart3DNoWPFEngine. Add a new Utility class to the project. Here is the code listing for the Utility class:
using System; using System.Windows; using System.Windows.Media; using System.Windows.Media.Media3D; namespace Chart3DNoWPFEngine { public class Utility { public static Matrix3D AzimuthElevation(double elevation, double azimuth)

CHAPTER 15 ■ 3D CHARTS WITHOUT THE WPF 3D ENGINE
573
{ // Make sure elevation is in the range of [-90, 90]: if (elevation > 90) elevation = 90; else if (elevation < -90) elevation = -90; // Make sure azimuth is in the range of [-180, 180]: if (azimuth > 180) azimuth = 180; else if (azimuth < -180) azimuth = -180; elevation = elevation * Math.PI / 180; azimuth = azimuth * Math.PI / 180; double sne = Math.Sin(elevation); double cne = Math.Cos(elevation); double sna = Math.Sin(azimuth); double cna = Math.Cos(azimuth); Matrix3D result = new Matrix3D(cna, -sne * sna, cne * sna, 0, sna, sne * cna, -cne * cna, 0, 0, cne, sne, 0, 0, 0, 0, 1); return result; } } }
This method takes elevation and azimuth angles as input parameters. In real-world 3D chart applications, we usually use parallel projection instead of perspective projection. This means that we can use the preceding azimuth and elevation view matrix to perform a 3D parallel projection on a 2D screen.
Creating a Cube Here, I’ll show you how to create a simple 3D cube object using the azimuth and elevation view matrix presented in the previous section. Add a new WPF Windows application to the project Chart3DNoWPFEngine and name it Cube. Here is the XAML file for this example:
<Window x:Class="Chart3DNoWPFEngine.Cube" xmlns="http://schemas.microsoft.com/winfx/2006/xaml/presentation" xmlns:x="http://schemas.microsoft.com/winfx/2006/xaml" Title="Cube" Height="350" Width="450"> <Grid x:Name="LayoutRoot" Background="White"> <Border BorderBrush="Gray" BorderThickness="1" CornerRadius="10" Margin="10"> <StackPanel Orientation="Horizontal"> <StackPanel Margin="5" Grid.Column="0"> <TextBlock Text="Elevation" Margin="2" FontSize="12"/> <TextBox Name="tbElevation" Margin="2" Text="30" FontSize="12" Width="70" Height="20"

CHAPTER 15 ■ 3D CHARTS WITHOUT THE WPF 3D ENGINE
574
TextAlignment="Center"/> <TextBlock Text="Azimuth" Margin="2" FontSize="12"/> <TextBox Name="tbAzimuth" Margin="2" Text="-30" FontSize="12" Width="70" Height="20" TextAlignment="Center"/> <Button Margin="2,30,2,2" Click="Apply_Click" Content="Apply" Width="70" Height="22"/> </StackPanel> <Border BorderBrush="Gray" BorderThickness="1" Margin="10"> <Canvas x:Name="canvas1" Width="300" Height="305"> <Canvas.Clip> <RectangleGeometry Rect="0 0 300 305"/> </Canvas.Clip> </Canvas> </Border> </StackPanel> </Border> </Grid> </Window>
This XAML file creates an interface that allows the user to change the azimuth and elevation angles interactively. The cube object will be created on the canvas1 control in code. Here is the code-behind file for this example:
using System; using System.Windows; using System.Windows.Controls; using System.Windows.Media; using System.Windows.Media.Media3D; using System.Windows.Shapes; namespace Chart3DNoWPFEngine { public partial class Cube : Window { private double side = 50; private Point center; private Point3D[] vertices0; private Point3D[] vertices; private Face[] faces; private bool isVisible; public Cube() { InitializeComponent(); center = new Point(canvas1.Width / 2, canvas1.Height / 2); center = new Point(canvas1.Width / 2, canvas1.Height / 2); vertices0 = new Point3D[] { new Point3D(-side,-side,-side), new Point3D( side,-side,-side), new Point3D( side, side,-side), new Point3D(-side, side,-side), new Point3D(-side, side, side), new Point3D( side, side, side), new Point3D( side,-side, side),

CHAPTER 15 ■ 3D CHARTS WITHOUT THE WPF 3D ENGINE
575
new Point3D(-side,-side, side)}; faces = new Face[] {new Face(0,1,2,3), new Face(4,5,6,7), new Face(3,4,7,0), new Face(2,1,6,5), new Face(5,4,3,2), new Face(0,7,6,1)}; AddCube(); } public void AddCube() { double elevation = double.Parse(tbElevation.Text); double azimuth = double.Parse(tbAzimuth.Text); Matrix3D transformMatrix = Utility.AzimuthElevation(elevation, azimuth); vertices = new Point3D[8]; for (int i = 0; i < vertices0.Length; i++) { vertices[i] = Point3D.Multiply(vertices0[i], transformMatrix); } canvas1.Children.Clear(); int ii = 0; foreach (Face face in this.faces) { ii++; Point3D va = vertices[face.VertexA]; Point3D vb = vertices[face.VertexB]; Point3D vc = vertices[face.VertexC]; Point3D vd = vertices[face.VertexD]; Vector3D normal = Utility.NormalVector(va, vb, vc); Vector3D viewDirection = new Vector3D(); viewDirection = new Vector3D(0, 0, -1); double mixProduct = Vector3D.DotProduct(normal, viewDirection); isVisible = mixProduct > 0; if (isVisible) { byte red = 0; byte green = 0; byte blue = 0; if (ii == 1) { red = 255; green = 0; blue = 0; } else if (ii == 2) { red = 0; green = 255; blue = 0; } else if (ii == 3) { red = 0; green = 0;
CHAPTER 15 ■ 3D CHARTS WITHOUT THE WPF 3D ENGINE
576
blue = 255; } else if (ii == 4) { red = 255; green = 0; blue = 255; } else if (ii == 5) { red = 255; green = 255; blue = 0; } else if (ii == 6) { red = 0; green = 255; blue = 255; } Polygon polygon = new Polygon(); PointCollection collection = new PointCollection(); collection.Add(new Point(va.X, va.Y)); collection.Add(new Point(vb.X, vb.Y)); collection.Add(new Point(vc.X, vc.Y)); collection.Add(new Point(vd.X, vd.Y)); polygon.Points = collection; polygon.Fill = new SolidColorBrush(Color.FromArgb(255, red, green, blue)); TranslateTransform tt = new TranslateTransform(); tt.X = center.X; tt.Y = center.Y; polygon.RenderTransform = tt; canvas1.Children.Add(polygon); } } } private void Apply_Click(object sender, RoutedEventArgs e) { AddCube(); } } public class Face { public int VertexA, VertexB, VertexC, VertexD; public Face(int vertexA, int vertexB, int vertexC, int vertexD) { this.VertexA = vertexA; this.VertexB = vertexB; this.VertexC = vertexC; this.VertexD = vertexD;

CHAPTER 15 ■ 3D CHARTS WITHOUT THE WPF 3D ENGINE
577
} } }
Note that we implement a new class, Face, which contains four vertex indices. For a cube object, there are six faces, each with four vertices. The Face class allows you to create the cube faces easily.
Inside the constructor of the Cube class, we define a vertex point array and a face object array, which are used to create the cube object. The AddCube method first converts the user’s inputs into azimuth and elevation angles; then it creates a transform matrix using the azimuth and elevation view defined in the Utility class. Next, we perform the projection transformation on the vertex points. This way, we project the 3D point objects on a 2D screen.
In order to distinguish the faces of the cube, we paint each face with a different color. Depending on the viewing direction, not all six faces will be visible at one time. We need to implement a technique that removes the back faces. Here, we use the sign of the dot product of the face’s normal and the view direction to identify whether the face is a back or front face. If this dot product is less than or equal to zero, then the surface is a back face and we don’t need to draw it on the computer screen.
Mathematically, we can represent a face in 3D using three points. We add a new method, NormalVector, to the Utility class. This method takes three points, representing a face in 3D, as inputs and returns a vector object that represents the normal of the face:
public static Vector3D NormalVector(Point3D pt1, Point3D pt2, Point3D pt3) { Vector3D v1 = new Vector3D(); Vector3D v2 = new Vector3D(); v1.X = pt2.X - pt1.X; v1.Y = pt2.Y - pt1.Y; v1.Z = pt2.Z - pt1.Z; v2.X = pt3.X - pt2.X; v2.Y = pt3.Y - pt2.Y; v2.Z = pt3.Z - pt1.Z; return Vector3D.CrossProduct(v1, v2); }
Finally, we use the projected point collection to draw a 2D polygon for each front face. Running this example generates the output of Figure 15-2. You can see that the cube object in the
figure corresponds to an orthogonal projection with an elevation angle of 30 degrees and an azimuth angle of –30 degrees. You can rotate the cube by entering different elevation and azimuth angles. Pay special attention to how the back faces are automatically removed when you rotate the cube.

CHAPTER 15 ■ 3D CHARTS WITHOUT THE WPF 3D ENGINE
578
Figure 15-2. A cube object created directly using azimuth and elevation view
Chart Style in 3D The chart style used in 3D charts is similar to that in 2D. Add a new class, ChartStyle, to the current project. The following code snippet shows its member fields and corresponding public properties:
using System; using System.Collections.Generic; using System.Windows; using System.Windows.Controls; using System.Windows.Media; using System.Windows.Media.Media3D; using System.Windows.Shapes; namespace Chart3DNoWPFEngine { public class ChartStyle { private Canvas chartCanvas; private double xmin = -5; private double xmax = 5; private double ymin = -3; private double ymax = 3;

CHAPTER 15 ■ 3D CHARTS WITHOUT THE WPF 3D ENGINE
579
private double zmin = -6; private double zmax = 6; private double xtick = 1; private double ytick = 1; private double ztick = 3; private FontFamily tickFont = new FontFamily("Arial Narrow"); private double tickFontSize = (double)new FontSizeConverter().ConvertFrom("8pt"); private Brush tickColor = Brushes.Black; private string title = "My 3D Chart"; private FontFamily titleFont = new FontFamily("Arial Narrow"); private double titleFontSize = (double)new FontSizeConverter().ConvertFrom("14pt"); private Brush titleColor = Brushes.Black; private string xLabel = "X Axis"; private string yLabel = "Y Axis"; private string zLabel = "Z Axis"; private FontFamily labelFont = new FontFamily("Arial Narrow"); private double labelFontSize = (double)new FontSizeConverter().ConvertFrom("10pt"); private Brush labelColor = Brushes.Black; private double elevation = 30; private double azimuth = -37.5; private bool isXGrid = true; private bool isYGrid = true; private bool isZGrid = true; private bool isColorBar = false; private Line gridline = new Line(); private Brush gridlineColor = Brushes.LightGray; private double gridlineThickness = 1; private GridlinePatternEnum gridlinePattern = GridlinePatternEnum.Dash; private Line axisLine = new Line(); private Brush axisColor = Brushes.Black; private AxisPatternEnum axisPattern = AxisPatternEnum.Solid; private double axisThickness = 1; public Canvas ChartCanvas { get { return chartCanvas; } set { chartCanvas = value; } } public bool IsColorBar { get { return isColorBar; } set { isColorBar = value; } } public Brush AxisColor { get { return axisColor; } set { axisColor = value; } }

CHAPTER 15 ■ 3D CHARTS WITHOUT THE WPF 3D ENGINE
580
public AxisPatternEnum AxisPattern { get { return axisPattern; } set { axisPattern = value; } } public double AxisThickness { get { return axisThickness; } set { axisThickness = value; } } public Brush GridlineColor { get { return gridlineColor; } set { gridlineColor = value; } } public GridlinePatternEnum GridlinePattern { get { return gridlinePattern; } set { gridlinePattern = value; } } public double GridlineThickness { get { return gridlineThickness; } set { gridlineThickness = value; } } public FontFamily LabelFont { get { return labelFont; } set { labelFont = value; } } public Brush LabelColor { get { return labelColor; } set { labelColor = value; } } public double LabelFontSize { get { return labelFontSize; } set { labelFontSize = value; } } public FontFamily TitleFont { get { return titleFont; } set { titleFont = value; }

CHAPTER 15 ■ 3D CHARTS WITHOUT THE WPF 3D ENGINE
581
} public Brush TitleColor { get { return titleColor; } set { titleColor = value; } } public double TitleFontSize { get { return titleFontSize; } set { titleFontSize = value; } } public FontFamily TickFont { get { return tickFont; } set { tickFont = value; } } public Brush TickColor { get { return tickColor; } set { tickColor = value; } } public double TickFontSize { get { return tickFontSize; } set { tickFontSize = value; } } public bool IsXGrid { get { return isXGrid; } set { isXGrid = value; } } public bool IsYGrid { get { return isYGrid; } set { isYGrid = value; } } public bool IsZGrid { get { return isZGrid; } set { isZGrid = value; } } public string Title { get { return title; }

CHAPTER 15 ■ 3D CHARTS WITHOUT THE WPF 3D ENGINE
582
set { title = value; } } public string XLabel { get { return xLabel; } set { xLabel = value; } } public string YLabel { get { return yLabel; } set { yLabel = value; } } public string ZLabel { get { return zLabel; } set { zLabel = value; } } public double Elevation { get { return elevation; } set { elevation = value; } } public double Azimuth { get { return azimuth; } set { azimuth = value; } } public double Xmax { get { return xmax; } set { xmax = value; } } public double Xmin { get { return xmin; } set { xmin = value; } } public double Ymax { get { return ymax; } set { ymax = value; } }

CHAPTER 15 ■ 3D CHARTS WITHOUT THE WPF 3D ENGINE
583
public double Ymin { get { return ymin; } set { ymin = value; } } public double Zmax { get { return zmax; } set { zmax = value; } } public double Zmin { get { return zmin; } set { zmin = value; } } public double XTick { get { return xtick; } set { xtick = value; } } public double YTick { get { return ytick; } set { ytick = value; } } public double ZTick { get { return ztick; } set { ztick = value; } } public enum GridlinePatternEnum { Solid = 1, Dash = 2, Dot = 3, DashDot = 4 } public enum AxisPatternEnum { Solid = 1, Dash = 2, Dot = 3, DashDot = 4 } ...... } }

CHAPTER 15 ■ 3D CHARTS WITHOUT THE WPF 3D ENGINE
584
You can specify and change the chart style for a 3D chart using the foregoing properties. If you need more features to control the appearance of your 3D charts, you can easily add your own member fields and corresponding properties to this class.
Another basic class you will need in 3D charts is DataSeries, which we discuss in the following example projects. You don’t need the DataCollection class in 3D charts because most 3D charts display only one set of data.
3D Coordinate Axes Correctly creating 3D coordinate axes is critical for 3D chart applications. First, we need to create the coordinates of the chart box, as shown in Figure 15-3. In 3D charts, all data are plotted within the chart box defined by [xMin, xMax, yMin, yMax, zMin, zMax] in the world coordinate system. The coordinate axes are represented by the bold lines in the figure. The Z axis is the vertical bold line, which can be independent of the elevation and azimuth angles. The X and Y axes, on the other hand, cannot be predefined. Which edge of the chart box represents the X or Y axis depends on both the elevation and azimuth angles.
Figure 15-3. 3D chart box and coordinate axes
In order to create such a coordinate system in WPF, we first need to create the eight-point coordinates of the chart box; then we select four of the points to define three coordinate axes. Add the following method, CoordinatesOfChartBox, to the ChartStyle class:

CHAPTER 15 ■ 3D CHARTS WITHOUT THE WPF 3D ENGINE
585
private Point3D[] CoordinatesOfChartBox() { Point3D[] pta = new Point3D[8]; pta[0] = new Point3D(Xmax, Ymin, Zmin); pta[1] = new Point3D(Xmin, Ymin, Zmin); pta[2] = new Point3D(Xmin, Ymax, Zmin); pta[3] = new Point3D(Xmin, Ymax, Zmax); pta[4] = new Point3D(Xmin, Ymin, Zmax); pta[5] = new Point3D(Xmax, Ymin, Zmax); pta[6] = new Point3D(Xmax, Ymax, Zmax); pta[7] = new Point3D(Xmax, Ymax, Zmin); Point3D[] pts = new Point3D[4]; int[] npts = new int[4] { 0, 1, 2, 3 }; if (elevation >= 0) { if (azimuth >= -180 && azimuth < -90) npts = new int[4] { 1, 2, 7, 6 }; else if (azimuth >= -90 && azimuth < 0) npts = new int[4] { 0, 1, 2, 3 }; else if (azimuth >= 0 && azimuth < 90) npts = new int[4] { 7, 0, 1, 4 }; else if (azimuth >= 90 && azimuth <= 180) npts = new int[4] { 2, 7, 0, 5 }; } else if (elevation < 0) { if (azimuth >= -180 && azimuth < -90) npts = new int[4] { 1, 0, 7, 6 }; else if (azimuth >= -90 && azimuth < 0) npts = new int[4] { 0, 7, 2, 3 }; else if (azimuth >= 0 && azimuth < 90) npts = new int[4] { 7, 2, 1, 4 }; else if (azimuth >= 90 && azimuth <= 180) npts = new int[4] { 2, 1, 0, 5 }; } for (int i = 0; i < 4; i++) pts[i] = pta[npts[i]]; return pts; }
In this method, we use a trial-and-error approach to select a different four-point array every time the azimuth and elevation angles change. Calling this method creates a point array of four points, which determines the X, Y, and Z axes for arbitrary elevation and azimuth angles. Now we can create the coordinate axes by adding the following two methods, AddAxes and Normalize3D, to the ChartStyle class:
private void AddAxes() { Matrix3D m = Utility.AzimuthElevation(Elevation, Azimuth); Point3D[] pts = CoordinatesOfChartBox(); for (int i = 0; i < pts.Length; i++) {
CHAPTER 15 ■ 3D CHARTS WITHOUT THE WPF 3D ENGINE
586
pts[i] = Normalize3D(m, pts[i]); } DrawAxisLine(pts[0], pts[1]); DrawAxisLine(pts[1], pts[2]); DrawAxisLine(pts[2], pts[3]); } public Point3D Normalize3D(Matrix3D m, Point3D pt) { Point3D result = new Point3D(); // Normalize the point: double x1 = (pt.X - Xmin) / (Xmax - Xmin) - 0.5; double y1 = (pt.Y - Ymin) / (Ymax - Ymin) - 0.5; double z1 = (pt.Z - Zmin) / (Zmax - zmin) - 0.5; // Perform transformation on the point using matrix m: result.X = m.Transform(new Point3D(x1, y1, z1)).X; result.Y = m.Transform(new Point3D(x1, y1, z1)).Y; // Coordinate transformation from World to Device system: double xShift = 1.05; double xScale = 1; double yShift = 1.05; double yScale = 0.9; if (Title == "No Title") { yShift = 0.95; yScale = 1; } if (IsColorBar) { xShift = 0.95; xScale = 0.9; } result.X = (xShift + xScale * result.X) * ChartCanvas.Width / 2; result.Y = (yShift - yScale * result.Y) * ChartCanvas.Height / 2; return result; }
The Normalize3D method is very similar to the NormalizePoint method previously used in 2D. It takes the transform matrix and a Point3D object as inputs. In this method, we first normalize the X, Y, and Z data ranges into a unit cube so that the transformations that are performed on the point within this unit cube are independent of the real data ranges. Then we transform the normalized point using the transform matrix. Finally, we carry out the coordinate transformation from the world coordinate system to the device coordinate system. This method performs all of the transformations necessary for a point to be displayed on a 2D screen, which will greatly simplify the programming procedure for 3D chart applications.
You might notice that in this method, only the X and Y components of the point undergo the transformations, whereas the Z and W components retain their original values. You can see this from the following code snippet:
// Perform transformation on the point using matrix m: result.X = m.Transform(new Point3D(x1, y1, z1)).X; result.Y = m.Transform(new Point3D(x1, y1, z1)).Y;

CHAPTER 15 ■ 3D CHARTS WITHOUT THE WPF 3D ENGINE
587
The Z and W components retain their original information; otherwise, after the orthogonal transformations, the Z component might end up a combination of the original X, Y, and Z values, which destroys the original Z coordinate information, meaning that you cannot use the Z component to compare the points’ Z values. In 3D charts, we often do need the original Z coordinate information, such as when we apply color maps to a 3D chart.
In the AddAxes method, we first get the coordinates of the three coordinate axes by calling the CoordinatesOfChartBox method. Then we perform the transformation and normalization on these four points using the elevation and azimuth matrix and the Normalize3D method. Finally, we use the X and Y components of the transformed points to draw the coordinate axes. Although the AddAxes method creates three coordinate axes, we still do not know which axis is the X or Y axis. The program will automatically tell you when you place labels on the coordinate axes.
The following AddTicks method in the ChartStyle class creates tick marks on the coordinate axes:
private void AddTicks() { Matrix3D m = Utility.AzimuthElevation(Elevation, Azimuth); Point3D[] pta = new Point3D[2]; Point3D[] pts = CoordinatesOfChartBox(); // Add x ticks: double offset = (Ymax - Ymin) / 30.0; double ticklength = offset; for (double x = Xmin; x <= Xmax; x = x + XTick) { if (Elevation >= 0) { if (Azimuth >= -90 && Azimuth < 90) ticklength = -offset; } else if (Elevation < 0) { if ((Azimuth >= -180 && Azimuth < -90) || Azimuth >= 90 && Azimuth <= 180) ticklength = -(Ymax - Ymin) / 30; } pta[0] = new Point3D(x, pts[1].Y + ticklength, pts[1].Z); pta[1] = new Point3D(x, pts[1].Y, pts[1].Z); for (int i = 0; i < pta.Length; i++) { pta[i] = Normalize3D(m, pta[i]); } AddTickLine(pta[0], pta[1]); } // Add y ticks: offset = (Xmax - Xmin) / 30.0; ticklength = offset; for (double y = Ymin; y <= Ymax; y = y + YTick) { pts = CoordinatesOfChartBox(); if (Elevation >= 0) { if (Azimuth >= -180 && Azimuth < 0) ticklength = -offset;

CHAPTER 15 ■ 3D CHARTS WITHOUT THE WPF 3D ENGINE
588
} else if (Elevation < 0) { if (Azimuth >= 0 && Azimuth < 180) ticklength = -offset; } pta[0] = new Point3D(pts[1].X + ticklength, y, pts[1].Z); pta[1] = new Point3D(pts[1].X, y, pts[1].Z); for (int i = 0; i < pta.Length; i++) { pta[i] = Normalize3D(m, pta[i]); } AddTickLine(pta[0], pta[1]); } // Add z ticks: double xoffset = (Xmax - Xmin) / 45.0f; double yoffset = (Ymax - Ymin) / 20.0f; double xticklength = xoffset; double yticklength = yoffset; for (double z = Zmin; z <= Zmax; z = z + ZTick) { if (Elevation >= 0) { if (Azimuth >= -180 && Azimuth < -90) { xticklength = 0; yticklength = yoffset; } else if (Azimuth >= -90 && Azimuth < 0) { xticklength = xoffset; yticklength = 0; } else if (Azimuth >= 0 && Azimuth < 90) { xticklength = 0; yticklength = -yoffset; } else if (Azimuth >= 90 && Azimuth <= 180) { xticklength = -xoffset; yticklength = 0; } } else if (Elevation < 0) { if (Azimuth >= -180 && Azimuth < -90) { yticklength = 0; xticklength = xoffset; } else if (Azimuth >= -90 && Azimuth < 0)

CHAPTER 15 ■ 3D CHARTS WITHOUT THE WPF 3D ENGINE
589
{ yticklength = -yoffset; xticklength = 0; } else if (Azimuth >= 0 && Azimuth < 90) { yticklength = 0; xticklength = -xoffset; } else if (Azimuth >= 90 && Azimuth <= 180) { yticklength = yoffset; xticklength = 0; } } pta[0] = new Point3D(pts[2].X, pts[2].Y, z); pta[1] = new Point3D(pts[2].X + yticklength, pts[2].Y + xticklength, z); for (int i = 0; i < pta.Length; i++) { pta[i] = Normalize3D(m, pta[i]); } AddTickLine(pta[0], pta[1]); } } private void AddTickLine(Point3D pt1, Point3D pt2) { Line line = new Line(); line.Stroke = AxisColor; line.X1 = pt1.X; line.Y1 = pt1.Y; line.X2 = pt2.X; line.Y2 = pt2.Y; ChartCanvas.Children.Add(line); }
In this method, we define the length of the ticks in terms of the axis limit instead of a fixed length in the device coordinate system. This keeps the ticks distributed proportionally when the chart is resized. Please note how we place the tick markers in their proper positions on the coordinate axes when the elevation and azimuth angles are changed.
Gridlines As in 2D charts, gridlines in 3D charts can help you to get a better view of the data ranges. In the case of 3D, we want to place gridlines on three faces located behind your data curves or surfaces. These three faces (or planes) must be properly selected according to the variation of the elevation and azimuth angles. The following AddGrids method in the ChartStyle class creates gridlines on the proper faces:
private void AddGridlines() { Matrix3D m = Utility.AzimuthElevation(Elevation, Azimuth); Point3D[] pta = new Point3D[3]; Point3D[] pts = CoordinatesOfChartBox();

CHAPTER 15 ■ 3D CHARTS WITHOUT THE WPF 3D ENGINE
590
// Draw x gridlines: if (IsXGrid) { for (double x = Xmin; x <= Xmax; x = x + XTick) { pts = CoordinatesOfChartBox(); pta[0] = new Point3D(x, pts[1].Y, pts[1].Z); if (Elevation >= 0) { if ((Azimuth >= -180 && Azimuth < -90) || (Azimuth >= 0 && Azimuth < 90)) { pta[1] = new Point3D(x, pts[0].Y, pts[1].Z); pta[2] = new Point3D(x, pts[0].Y, pts[3].Z); } else { pta[1] = new Point3D(x, pts[2].Y, pts[1].Z); pta[2] = new Point3D(x, pts[2].Y, pts[3].Z); } } else if (Elevation < 0) { if ((Azimuth >= -180 && Azimuth < -90) || (Azimuth >= 0 && Azimuth < 90)) { pta[1] = new Point3D(x, pts[2].Y, pts[1].Z); pta[2] = new Point3D(x, pts[2].Y, pts[3].Z); } else { pta[1] = new Point3D(x, pts[0].Y, pts[1].Z); pta[2] = new Point3D(x, pts[0].Y, pts[3].Z); } } for (int i = 0; i < pta.Length; i++) { pta[i] = Normalize3D(m, pta[i]); } DrawGridline(pta[0], pta[1]); DrawGridline(pta[1], pta[2]); } // Draw y gridlines: if (IsYGrid) { for (double y = Ymin; y <= Ymax; y = y + YTick) { pts = CoordinatesOfChartBox(); pta[0] = new Point3D(pts[1].X, y, pts[1].Z); if (Elevation >= 0) {

CHAPTER 15 ■ 3D CHARTS WITHOUT THE WPF 3D ENGINE
591
if ((Azimuth >= -180 && Azimuth < -90) || (Azimuth >= 0 && Azimuth < 90)) { pta[1] = new Point3D(pts[2].X, y, pts[1].Z); pta[2] = new Point3D(pts[2].X, y, pts[3].Z); } else { pta[1] = new Point3D(pts[0].X, y, pts[1].Z); pta[2] = new Point3D(pts[0].X, y, pts[3].Z); } } if (elevation < 0) { if ((Azimuth >= -180 && Azimuth < -90) || (Azimuth >= 0 && Azimuth < 90)) { pta[1] = new Point3D(pts[0].X, y, pts[1].Z); pta[2] = new Point3D(pts[0].X, y, pts[3].Z); } else { pta[1] = new Point3D(pts[2].X, y, pts[1].Z); pta[2] = new Point3D(pts[2].X, y, pts[3].Z); } } for (int i = 0; i < pta.Length; i++) { pta[i] = Normalize3D(m, pta[i]); } DrawGridline(pta[0], pta[1]); DrawGridline(pta[1], pta[2]); } } // Draw Z gridlines: if (IsZGrid) { for (double z = Zmin; z <= Zmax; z = z + ZTick) { pts = CoordinatesOfChartBox(); pta[0] = new Point3D(pts[2].X, pts[2].Y, z); if (Elevation >= 0) { if ((Azimuth >= -180 && Azimuth < -90) || (Azimuth >= 0 && Azimuth < 90)) { pta[1] = new Point3D(pts[2].X, pts[0].Y, z); pta[2] = new Point3D(pts[0].X, pts[0].Y, z); } else { pta[1] = new Point3D(pts[0].X, pts[2].Y, z);
CHAPTER 15 ■ 3D CHARTS WITHOUT THE WPF 3D ENGINE
592
pta[2] = new Point3D(pts[0].X, pts[1].Y, z); } } if (Elevation < 0) { if ((Azimuth >= -180 && Azimuth < -90) || (Azimuth >= 0 && Azimuth < 90)) { pta[1] = new Point3D(pts[0].X, pts[2].Y, z); pta[2] = new Point3D(pts[0].X, pts[0].Y, z); } else { pta[1] = new Point3D(pts[2].X, pts[0].Y, z); pta[2] = new Point3D(pts[0].X, pts[0].Y, z); } } for (int i = 0; i < pta.Length; i++) { pta[i] = Normalize3D(m, pta[i]); } DrawGridline(pta[0], pta[1]); DrawGridline(pta[1], pta[2]); } } } } private void DrawGridline(Point3D pt1, Point3D pt2) { gridline = new Line(); gridline.Stroke = GridlineColor; gridline.StrokeThickness = GridlineThickness; AddGridlinePattern(); gridline.X1 = pt1.X; gridline.Y1 = pt1.Y; gridline.X2 = pt2.X; gridline.Y2 = pt2.Y; ChartCanvas.Children.Add(gridline); }
In the AddGridlines method, we create the X, Y, and Z gridlines on different faces, depending on values of the elevation and azimuth angles, ensuring that the gridlines are drawn on the right faces when the 3D chart is rotated.
Labels 3D labels include three parts: the title, the tick labels, and the labels for the coordinate axes. Creating a title label in 3D is similar to doing so in 2D. However, the tick labels and axis labels in 3D charts are much more complicated than those in 2D charts. First, we need to properly position these labels by considering the variation of the elevation and azimuth angles. Then we need to rotate them to be parallel to the coordinate axes when the elevation and azimuth angles are changed. Finally, we want these labels to be properly spaced from the coordinate axes.

CHAPTER 15 ■ 3D CHARTS WITHOUT THE WPF 3D ENGINE
593
The following AddLabels method in the ChartStyle class creates labels in a 3D chart:
private void AddLabels() { Matrix3D m = Utility.AzimuthElevation(Elevation, Azimuth); Point3D pt = new Point3D(); Point3D[] pts = CoordinatesOfChartBox(); TextBlock tb = new TextBlock(); // Add x tick labels: double offset = (Ymax - Ymin) / 20; double labelSpace = offset; for (double x = Xmin; x <= Xmax; x = x + XTick) { if (Elevation >= 0) { if (Azimuth >= -90 && Azimuth < 90) labelSpace = -offset; } else if (Elevation < 0) { if ((Azimuth >= -180 && Azimuth < -90) || Azimuth >= 90 && Azimuth <= 180) labelSpace = -offset; } pt = new Point3D(x, pts[1].Y + labelSpace, pts[1].Z); pt = Normalize3D(m, pt); tb = new TextBlock(); tb.Text = x.ToString(); tb.Foreground = TickColor; tb.FontFamily = TickFont; tb.FontSize = TickFontSize; tb.TextAlignment = TextAlignment.Center; ChartCanvas.Children.Add(tb); Canvas.SetLeft(tb, pt.X); Canvas.SetTop(tb, pt.Y); } // Add y tick labels: offset = (Xmax - Xmin) / 20; labelSpace = offset; for (double y = Ymin; y <= Ymax; y = y + YTick) { pts = CoordinatesOfChartBox(); if (elevation >= 0) { if (azimuth >= -180 && azimuth < 0) labelSpace = -offset; } else if (elevation < 0) { if (azimuth >= 0 && azimuth < 180) labelSpace = -offset; }

CHAPTER 15 ■ 3D CHARTS WITHOUT THE WPF 3D ENGINE
594
pt = new Point3D(pts[1].X + labelSpace, y, pts[1].Z); pt = Normalize3D(m, pt); tb = new TextBlock(); tb.Text = y.ToString(); tb.Foreground = TickColor; tb.FontFamily = TickFont; tb.FontSize = TickFontSize; tb.Measure(new Size(Double.PositiveInfinity, Double.PositiveInfinity)); Size ytickSize = tb.DesiredSize; ChartCanvas.Children.Add(tb); Canvas.SetLeft(tb, pt.X - ytickSize.Width / 2); Canvas.SetTop(tb, pt.Y); } // Add z tick labels: double xoffset = (Xmax - Xmin) / 30.0; double yoffset = (Ymax - Ymin) / 15.0; double xlabelSpace = xoffset; double ylabelSpace = yoffset; tb = new TextBlock(); tb.Text = "A"; tb.Measure(new Size(Double.PositiveInfinity, Double.PositiveInfinity)); Size size = tb.DesiredSize; for (double z = Zmin; z <= Zmax; z = z + ZTick) { pts = CoordinatesOfChartBox(); if (Elevation >= 0) { if (Azimuth >= -180 && Azimuth < -90) { xlabelSpace = 0; ylabelSpace = yoffset; } else if (Azimuth >= -90 && Azimuth < 0) { xlabelSpace = xoffset; ylabelSpace = 0; } else if (Azimuth >= 0 && Azimuth < 90) { xlabelSpace = 0; ylabelSpace = -yoffset; } else if (Azimuth >= 90 && Azimuth <= 180) { xlabelSpace = -xoffset; ylabelSpace = 0; } } else if (Elevation < 0) { if (Azimuth >= -180 && Azimuth < -90) {

CHAPTER 15 ■ 3D CHARTS WITHOUT THE WPF 3D ENGINE
595
ylabelSpace = 0; xlabelSpace = xoffset; } else if (Azimuth >= -90 && Azimuth < 0) { ylabelSpace = -yoffset; xlabelSpace = 0; } else if (Azimuth >= 0 && Azimuth < 90) { ylabelSpace = 0; xlabelSpace = -xoffset; } else if (Azimuth >= 90 && Azimuth <= 180) { ylabelSpace = yoffset; xlabelSpace = 0; } } pt = new Point3D(pts[2].X + ylabelSpace, pts[2].Y + xlabelSpace, z); pt = Normalize3D(m, pt); tb = new TextBlock(); tb.Text = z.ToString(); tb.Foreground = TickColor; tb.FontFamily = TickFont; tb.FontSize = TickFontSize; tb.Measure(new Size(Double.PositiveInfinity, Double.PositiveInfinity)); Size ztickSize = tb.DesiredSize; ChartCanvas.Children.Add(tb); Canvas.SetLeft(tb, pt.X - ztickSize.Width - 1); Canvas.SetTop(tb, pt.Y - ztickSize.Height / 2); } // Add Title: tb = new TextBlock(); tb.Text = Title; tb.Foreground = TitleColor; tb.FontSize = TitleFontSize; tb.FontFamily = TitleFont; tb.Measure(new Size(Double.PositiveInfinity, Double.PositiveInfinity)); Size titleSize = tb.DesiredSize; if (tb.Text != "No Title") { ChartCanvas.Children.Add(tb); Canvas.SetLeft(tb, ChartCanvas.Width / 2 - titleSize.Width / 2); Canvas.SetTop(tb, ChartCanvas.Height / 30); } // Add x axis label: offset = (Ymax - Ymin) / 3; labelSpace = offset; double offset1 = (Xmax - Xmin) / 10; double xc = offset1;
CHAPTER 15 ■ 3D CHARTS WITHOUT THE WPF 3D ENGINE
596
if (Elevation >= 0) { if (Azimuth >= -90 && Azimuth < 90) labelSpace = -offset; if (Azimuth >= 0 && Azimuth <= 180) xc = -offset1; } else if (Elevation < 0) { if ((Azimuth >= -180 && Azimuth < -90) || Azimuth >= 90 && Azimuth <= 180) labelSpace = -offset; if (Azimuth >= -180 && Azimuth <= 0) xc = -offset1; } Point3D[] pta = new Point3D[2]; pta[0] = new Point3D(Xmin, pts[1].Y + labelSpace, pts[1].Z); pta[1] = new Point3D((Xmin + Xmax) / 2 - xc, pts[1].Y + labelSpace, pts[1].Z); pta[0] = Normalize3D(m, pta[0]); pta[1] = Normalize3D(m, pta[1]); double theta = Math.Atan((pta[1].Y - pta[0].Y) / (pta[1].X - pta[0].X)); theta = theta * 180 / Math.PI; tb = new TextBlock(); tb.Text = XLabel; tb.Foreground = LabelColor; tb.FontFamily = LabelFont; tb.FontSize = LabelFontSize; tb.Measure(new Size(Double.PositiveInfinity, Double.PositiveInfinity)); Size xLabelSize = tb.DesiredSize; TransformGroup tg = new TransformGroup(); RotateTransform rt = new RotateTransform(theta, 0.5, 0.5); TranslateTransform tt = new TranslateTransform(pta[1].X + xLabelSize.Width / 2, pta[1].Y - xLabelSize.Height / 2); tg.Children.Add(rt); tg.Children.Add(tt); tb.RenderTransform = tg; ChartCanvas.Children.Add(tb); // Add y axis label: offset = (Xmax - Xmin) / 3; offset1 = (Ymax - Ymin) / 5; labelSpace = offset; double yc = YTick; if (Elevation >= 0) { if (Azimuth >= -180 && Azimuth < 0) labelSpace = -offset; if (Azimuth >= -90 && Azimuth <= 90) yc = -offset1; } else if (Elevation < 0) { yc = -offset1;

CHAPTER 15 ■ 3D CHARTS WITHOUT THE WPF 3D ENGINE
597
if (Azimuth >= 0 && Azimuth < 180) labelSpace = -offset; if (Azimuth >= -90 && Azimuth <= 90) yc = offset1; } pta[0] = new Point3D(pts[1].X + labelSpace, Ymin, pts[1].Z); pta[1] = new Point3D(pts[1].X + labelSpace, (Ymin + Ymax) / 2 + yc, pts[1].Z); pta[0] = Normalize3D(m, pta[0]); pta[1] = Normalize3D(m, pta[1]); theta = (double)Math.Atan((pta[1].Y - pta[0].Y) / (pta[1].X - pta[0].X)); theta = theta * 180 / (double)Math.PI; tb = new TextBlock(); tb.Text = YLabel; tb.Foreground = LabelColor; tb.FontFamily = LabelFont; tb.FontSize = LabelFontSize; tb.Measure(new Size(Double.PositiveInfinity, Double.PositiveInfinity)); Size yLabelSize = tb.DesiredSize; tg = new TransformGroup(); tt = new TranslateTransform(pta[1].X - yLabelSize.Width / 2, pta[1].Y - yLabelSize.Height / 2); rt = new RotateTransform(theta, 0.5, 0.5); tg.Children.Add(rt); tg.Children.Add(tt); tb.RenderTransform = tg; ChartCanvas.Children.Add(tb); // Add z axis labels: double zticklength = 10; labelSpace = -1.3f * offset; offset1 = (Zmax - Zmin) / 8; double zc = -offset1; for (double z = Zmin; z < Zmax; z = z + ZTick) { tb = new TextBlock(); tb.Text = z.ToString(); tb.Measure(new Size(Double.PositiveInfinity, Double.PositiveInfinity)); Size size1 = tb.DesiredSize; if (zticklength < size1.Width) zticklength = size1.Width; } double zlength = -zticklength; if (Elevation >= 0) { if (Azimuth >= -180 && Azimuth < -90) { zlength = -zticklength; labelSpace = -1.3f * offset; zc = -offset1; } else if (Azimuth >= -90 && Azimuth < 0) { zlength = zticklength;

CHAPTER 15 ■ 3D CHARTS WITHOUT THE WPF 3D ENGINE
598
labelSpace = 2 * offset / 3; zc = offset1; } else if (Azimuth >= 0 && Azimuth < 90) { zlength = zticklength; labelSpace = 2 * offset / 3; zc = -offset1; } else if (Azimuth >= 90 && Azimuth <= 180) { zlength = -zticklength; labelSpace = -1.3f * offset; zc = offset1; } } else if (Elevation < 0) { if (Azimuth >= -180 && Azimuth < -90) { zlength = -zticklength; labelSpace = -1.3f * offset; zc = offset1; } else if (Azimuth >= -90 && Azimuth < 0) { zlength = zticklength; labelSpace = 2 * offset / 3; zc = -offset1; } else if (Azimuth >= 0 && Azimuth < 90) { zlength = zticklength; labelSpace = 2 * offset / 3; zc = offset1; } else if (Azimuth >= 90 && Azimuth <= 180) { zlength = -zticklength; labelSpace = -1.3f * offset; zc = -offset1; } } pta[0] = new Point3D(pts[2].X - labelSpace, pts[2].Y, (Zmin + Zmax) / 2 + zc); pta[0] = Normalize3D(m, pta[0]); tb = new TextBlock(); tb.Text = ZLabel; tb.Foreground = LabelColor; tb.FontFamily = LabelFont; tb.FontSize = LabelFontSize; tb.Measure(new Size(Double.PositiveInfinity, Double.PositiveInfinity)); Size zLabelSize = tb.DesiredSize; tg = new TransformGroup();

CHAPTER 15 ■ 3D CHARTS WITHOUT THE WPF 3D ENGINE
599
tt = new TranslateTransform(pta[0].X - zlength, pta[0].Y + zLabelSize.Width / 2); rt = new RotateTransform(270, 0.5, 0.5); tg.Children.Add(rt); tg.Children.Add(tt); tb.RenderTransform = tg; ChartCanvas.Children.Add(tb); }
The AddLabels method may seem complicated, due to the fact that we need to adjust the positions of the labels according to the values of the elevation and azimuth angles.
Finally, in order to simplify the process of adding chart styles to our charts, we need to add a new public method, AddChartStyle, to the ChartStyle class:
public void AddChartStyle() { AddTicks(); AddGridlines(); AddAxes(); AddLabels(); }
Testing the Project Now we can put together all of the code created in the previous sections in a new WPF project. Add a new WPF window and name it Coordinates3D. Here is the XAML file for this example:
<Window x:Class="Chart3DNoWPFEngine.Coordinates3D" xmlns="http://schemas.microsoft.com/winfx/2006/xaml/presentation" xmlns:x="http://schemas.microsoft.com/winfx/2006/xaml" Title="Coordinates3D" Height="400" Width="520"> <Grid> <Grid.ColumnDefinitions> <ColumnDefinition Width="100"/> <ColumnDefinition Width="*"/> </Grid.ColumnDefinitions> <StackPanel Margin="10 10 0 0"> <TextBlock Margin="0,0,0,5" Text="Elevation:"/> <TextBox x:Name="tbElevation" Text="30" Margin="0,0,0,5" TextAlignment="Center" Width="75"/> <TextBlock Margin="0,0,0,5" Text="Azimuth:"/> <TextBox x:Name="tbAzimuth" Text="-37" Margin="0,0,0,5" TextAlignment="Center" Width="75"/> <Button x:Name="Apply" Content="Apply" Click="Apply_Click" Margin="0 20,0,0" Width="75"/> </StackPanel> <Grid x:Name="chartGrid" SizeChanged="chartGrid_SizeChanged" Margin="10" Grid.Row="0" Grid.Column="1"> <Border BorderBrush="Gray" BorderThickness="1"> <Canvas x:Name="chartCanvas" Background="Transparent" ClipToBounds="True"/> </Border> </Grid>

CHAPTER 15 ■ 3D CHARTS WITHOUT THE WPF 3D ENGINE
600
</Grid> </Window>
This XAML file creates a resizable Canvas, named chartCanvas, on which you’ll draw graphics objects. It also sets up an interface that allows the user to change the values of the elevation and azimuth angles interactively. Here is the corresponding code-behind file:
using System; using System.Windows; using System.Windows.Controls; using System.Windows.Media; using System.Windows.Media.Imaging; namespace Chart3DNoWPFEngine { public partial class Coordinates3D : Window { ChartStyle cs; public Coordinates3D() { InitializeComponent(); } private void chartGrid_SizeChanged(object sender, SizeChangedEventArgs e) { chartCanvas.Width = chartGrid.ActualWidth; chartCanvas.Height = chartGrid.ActualHeight; AddCoordinateAxes(); } private void AddCoordinateAxes() { chartCanvas.Children.Clear(); cs = new ChartStyle(); cs.ChartCanvas = this.chartCanvas; cs.GridlinePattern = ChartStyle.GridlinePatternEnum.Solid; cs.Elevation = double.Parse(tbElevation.Text); cs.Azimuth = double.Parse(tbAzimuth.Text); cs.AddChartStyle(); } private void Apply_Click(object sender, RoutedEventArgs e) { AddCoordinateAxes(); } } }
This code-behind file is very simple. Inside the AddCoordinateAxes method, we specify the elevation and azimuth angles by taking the user’s inputs directly from the corresponding text boxes, and then we call the AddChartStyle method.
Running this example produces the output of Figure 15-4. You can see how the coordinate axes, gridlines, and labels respond to changes in the elevation and azimuth angles.

CHAPTER 15 ■ 3D CHARTS WITHOUT THE WPF 3D ENGINE
601
Figure 15-4. Coordinate system used in 3D charts
3D Line Charts In the previous section, we implemented the basic coordinate system for 3D charts in WPF without using the WPF 3D engine, a process that seems quite involved. However, once you have finished this framework, you can use it without any modification for a wide variety of 3D chart applications. Here, I will show you how easy it is to create a 3D line chart based on this basic framework. The 3D line chart displays a 3D plot of a set of data points. It is similar to a 2D line chart, except it uses an additional Z component to provide data for the third dimension.
Implementation Add a new DataSeriesLine3D class to the current project. This class is very similar to the DataSeries class used extensively in 2D charts, except the PointList in this class must hold 3D points. The following is its code listing:
using System; using System.Collections.Generic;

CHAPTER 15 ■ 3D CHARTS WITHOUT THE WPF 3D ENGINE
602
using System.Windows; using System.Windows.Media; using System.Windows.Media.Media3D; using System.Windows.Shapes; namespace Chart3DNoWPFEngine { public class DataSeriesLine3D { private Polyline lineSeries = new Polyline(); private Brush lineColor; private double lineThickness = 1; private LinePatternEnum linePattern; private List<Point3D> point3DList = new List<Point3D>(); public List<Point3D> Point3DList { get { return point3DList; } set { point3DList = value; } } public Brush LineColor { get { return lineColor; } set { lineColor = value; } } public Polyline LineSeries { get { return lineSeries; } set { lineSeries = value; } } public double LineThickness { get { return lineThickness; } set { lineThickness = value; } } public LinePatternEnum LinePattern { get { return linePattern; } set { linePattern = value; } } public void AddLinePattern() { LineSeries.Stroke = LineColor; LineSeries.StrokeThickness = LineThickness; switch (LinePattern) { case LinePatternEnum.Dash:

CHAPTER 15 ■ 3D CHARTS WITHOUT THE WPF 3D ENGINE
603
LineSeries.StrokeDashArray = new DoubleCollection(new double[2] { 4, 3 }); break; case LinePatternEnum.Dot: LineSeries.StrokeDashArray = new DoubleCollection(new double[2] { 1, 2 }); break; case LinePatternEnum.DashDot: LineSeries.StrokeDashArray = new DoubleCollection(new double[4] { 4, 2, 1, 2 }); break; case LinePatternEnum.None: LineSeries.Stroke = Brushes.Transparent; break; } } public enum LinePatternEnum { Solid = 1, Dash = 2, Dot = 3, DashDot = 4, None = 5 } public void AddLine3D(ChartStyle cs) { Matrix3D m = Utility.AzimuthElevation(cs.Elevation, cs.Azimuth); Point3D[] pts = new Point3D[Point3DList.Count]; for (int i = 0; i < Point3DList.Count; i++) { pts[i] = cs.Normalize3D(m, Point3DList[i]); LineSeries.Points.Add(new Point(pts[i].X, pts[i].Y)); } AddLinePattern(); cs.ChartCanvas.Children.Add(LineSeries); } } }
You can see that this class is basically similar to that used in 2D chart applications. However, unlike 2D charts, here you do not need a DataCollection class, because in a 3D chart you typically allow only one set of data points to be drawn. Drawing multiple sets of data points in a 3D chart becomes more confusing than in 2D. If you do want to have this capability, you can easily add it to your applications using the DataCollection class the same way you do in 2D charts. To simplify our discussion, we’ll only consider 3D charts containing one set of data points.
Thus, we implement an AddLine3D method in the DataSeriesLine3D class instead of a DataCollection class. Inside the AddLine3D method, we first perform the necessary transformations on the 3D data points by calling the Normalize3D method, using the AzimuthElevation orthogonal projection matrix. Then we draw the line chart using the X and Y components of the projected 3D data points.

CHAPTER 15 ■ 3D CHARTS WITHOUT THE WPF 3D ENGINE
604
Testing the Project You can test the 3D line chart in WPF applications. Add a new WPF window to the current project and name it Line3D. The XAML file for this example is the same as that used in the previous Coordinates3D example; here is the code-behind file:
using System; using System.Collections.Generic; using System.Windows; using System.Windows.Controls; using System.Windows.Media; using System.Windows.Media.Media3D; namespace Chart3DNoWPFEngine { public partial class Line3D : Window { private ChartStyle cs; private DataSeriesLine3D ds; public Line3D() { InitializeComponent(); } private void chartGrid_SizeChanged(object sender, SizeChangedEventArgs e) { chartCanvas.Width = chartGrid.ActualWidth; chartCanvas.Height = chartGrid.ActualHeight; AddChart(); } private void AddChart() { chartCanvas.Children.Clear(); cs = new ChartStyle(); ds = new DataSeriesLine3D(); cs.ChartCanvas = this.chartCanvas; cs.GridlinePattern = ChartStyle.GridlinePatternEnum.Solid; cs.Elevation = double.Parse(tbElevation.Text); cs.Azimuth = double.Parse(tbAzimuth.Text); cs.Xmin = -1; cs.Xmax = 1; cs.Ymin = -1; cs.Ymax = 1; cs.Zmin = 0; cs.Zmax = 30; cs.XTick = 0.5; cs.YTick = 0.5; cs.ZTick = 5; cs.Title = "No Title"; cs.AddChartStyle(); ds.LineColor = Brushes.Red; for (int i = 0; i < 300; i++)

CHAPTER 15 ■ 3D CHARTS WITHOUT THE WPF 3D ENGINE
605
{ double t = 0.1 * i; double x = Math.Exp(-t / 30) * Math.Cos(t); double y = Math.Exp(-t / 30) * Math.Sin(t); double z = t; ds.Point3DList.Add(new Point3D(x, y, z)); } ds.AddLine3D(cs); } private void Apply_Click(object sender, RoutedEventArgs e) { AddChart(); } } }
Please note how we add the 3D data points to the Point3DList in the AddChart method. This project generates the result of Figure 15-5. As with 2D line charts, here you can specify the line
color, dash style, and thickness. You can also look at the line chart from different viewpoints by changing the elevation and azimuth angles.
Figure 15-5. A 3D line chart

CHAPTER 15 ■ 3D CHARTS WITHOUT THE WPF 3D ENGINE
606
3D Surface Charts As we mentioned in Chapter 14, a surface chart draws a Z function on a surface for each X and Y coordinate in a region of interest. In this chapter, we will discuss only simple types of surface charts. For each X and Y value, a simple surface can have at most one Z value. Complicated surfaces with multiple Z values for each pair of X and Y values were discussed in Chapter 14.
We now define a surface by the Z coordinates of points above a rectangular grid in the X-Y plane. The surface chart is formed by joining adjacent points with straight lines. Surface charts are useful for visualizing 2D data arrays (i.e., matrices) that are too large to display in numerical form and for graphing functions of two variables.
In this section, I will show you how to create different forms of surface charts. Mesh charts are special cases of surface charts. They are basically wireframe surfaces that draw only the lines connecting the defining points. On the other hand, surface charts display both the connecting lines and the faces of the surface in color. I will implement the following specific methods in WPF to create various surface charts:
• AddMesh — Creates a mesh chart with or without hidden lines.
• AddMeshZ — Creates a mesh chart with a curtain (reference plane).
• AddWaterfall — Creates a chart similar to MeshZ but without lines from the Y data.
• AddSurface — Creates a surface chart with or without a colormap.
Implementation The simplest way to store surface data is in a 2D array. For each point (X, Y) in the region defined for the surface, the (X, Y) entry in the array gives the Z coordinate of the corresponding point on the surface.
DataSeries Class To make managing the surface easier, we can create a data structure specifically for surface charts in the DataSeries class. This class should contain variables to describe the data it holds, including the minimum X and Y data values, the spacing between the rows of data in the X and Y directions, and the number of data points in the X and Y directions. Add a new class to the current project and name it DataSeriesSurface. The following is the code listing for this class:
using System; using System.Collections.Generic; using System.Windows; using System.Windows.Media; using System.Windows.Media.Media3D; using System.Windows.Shapes; namespace Chart3DNoWPFEngine { public class DataSeriesSurface : DataSeriesLine3D { private double xLimitMin = -5; private double yLimitMin = 5; private double zLimitMin = -5;
CHAPTER 15 ■ 3D CHARTS WITHOUT THE WPF 3D ENGINE
607
private double xSpacing = 1; private double ySpacing = 1; private double zSpacing = 1; private int xNumber = 10; private int yNumber = 10; private int zNumber = 10; public Point3D[,] PointArray { get; set; } public double XLimitMin { get { return xLimitMin; } set { xLimitMin = value; } } public double YLimitMin { get { return yLimitMin; } set { yLimitMin = value; } } public double ZLimitMin { get { return zLimitMin; } set { zLimitMin = value; } } public double XSpacing { get { return xSpacing; } set { xSpacing = value; } } public double YSpacing { get { return ySpacing; } set { ySpacing = value; } } public double ZSpacing { get { return zSpacing; } set { zSpacing = value; } } public int XNumber { get { return xNumber; } set { xNumber = value; } } public int YNumber {

CHAPTER 15 ■ 3D CHARTS WITHOUT THE WPF 3D ENGINE
608
get { return yNumber; } set { yNumber = value; } } public int ZNumber { get { return zNumber; } set { zNumber = value; } } public double ZDataMin() { double zmin = 0; for (int i = 0; i < PointArray.GetLength(0); i++) { for (int j = 0; j < PointArray.GetLength(1); j++) { zmin = Math.Min(zmin, PointArray[i, j].Z); } } return zmin; } public double ZDataMax() { double zmax = 0; for (int i = 0; i < PointArray.GetLength(0); i++) { for (int j = 0; j < PointArray.GetLength(1); j++) { zmax = Math.Max(zmax, PointArray[i, j].Z); } } return zmax; } } }
This class inherits from the DataSeriesLine3D class and sets the data range for the X, Y, and Z axes. It also contains a couple of public methods that compute the minimum and maximum of the data set.
Chart Functions When we are testing our 3D surface charts, we’ll use two 3D math functions, Peak3D and Sinc3D, and put them together into the Utility class:
public static void Peak3D(ChartStyle cs, DataSeriesSurface ds) { cs.Xmin = -3; cs.Xmax = 3; cs.Ymin = -3; cs.Ymax = 3; cs.Zmin = -8;

CHAPTER 15 ■ 3D CHARTS WITHOUT THE WPF 3D ENGINE
609
cs.Zmax = 8; cs.XTick = 1; cs.YTick = 1; cs.ZTick = 4; ds.XLimitMin = cs.Xmin; ds.YLimitMin = cs.Ymin; ds.XSpacing = 0.2; ds.YSpacing = 0.2; ds.XNumber = Convert.ToInt16((cs.Xmax - cs.Xmin) / ds.XSpacing) + 1; ds.YNumber = Convert.ToInt16((cs.Ymax - cs.Ymin) / ds.YSpacing) + 1; Point3D[,] pts = new Point3D[ds.XNumber, ds.YNumber]; for (int i = 0; i < ds.XNumber; i++) { for (int j = 0; j < ds.YNumber; j++) { double x = ds.XLimitMin + i * ds.XSpacing; double y = ds.YLimitMin + j * ds.YSpacing; double z = 3 * Math.Pow((1 - x), 2) * Math.Exp(-x * x - (y + 1) * (y + 1)) - 10 * (0.2 * x - Math.Pow(x, 3) - Math.Pow(y, 5)) * Math.Exp(-x * x - y * y) - 1 / 3 * Math.Exp(-(x + 1) * (x + 1) - y * y); pts[i, j] = new Point3D(x, y, z); } } ds.PointArray = pts; } public static void Sinc3D(ChartStyle cs, DataSeriesSurface ds) { cs.Xmin = -8; cs.Xmax = 8; cs.Ymin = -8; cs.Ymax = 8; cs.Zmin = -0.5f; cs.Zmax = 1; cs.XTick = 4; cs.YTick = 4; cs.ZTick = 0.5f; ds.XLimitMin = cs.Xmin; ds.YLimitMin = cs.Ymin; ds.XSpacing = 0.5; ds.YSpacing = 0.5; ds.XNumber = Convert.ToInt16((cs.Xmax - cs.Xmin) / ds.XSpacing) + 1; ds.YNumber = Convert.ToInt16((cs.Ymax - cs.Ymin) / ds.YSpacing) + 1; Point3D[,] pts = new Point3D[ds.XNumber, ds.YNumber]; for (int i = 0; i < ds.XNumber; i++) { for (int j = 0; j < ds.YNumber; j++) { double x = ds.XLimitMin + i * ds.XSpacing;

CHAPTER 15 ■ 3D CHARTS WITHOUT THE WPF 3D ENGINE
610
double y = ds.YLimitMin + j * ds.YSpacing; double r = Math.Sqrt(x * x + y * y) + 0.000001; double z = Math.Sin(r) / r; pts[i, j] = new Point3D(x, y, z); } } ds.PointArray = pts; }
Both the Peak3D and Sinc3D methods generate data for testing mesh and surface charts.
DrawSurfaceChart Class Now add to the current project the class ColormapBrush from the ColorsAndBrushes project in Chapter 4, and change its namespace to Chart3DNoWPFEngine. We’ll need this class when we create surface charts and colorbars. Add another new class to the current project and name it DrawSurfaceChart. Here is the code listing for this class:
using System; using System.Collections.Generic; using System.Windows; using System.Windows.Controls; using System.Windows.Media; using System.Windows.Media.Media3D; using System.Windows.Shapes; namespace Chart3DNoWPFEngine { public class DrawSurfaceChart { private SurfaceChartTypeEnum surfaceChartType = SurfaceChartTypeEnum.Mesh; private bool isColormap = true; private bool isHiddenLine = false; private bool isInterp = false; private int numberInterp = 2; private ColormapBrush colormap = new ColormapBrush(); public ColormapBrush Colormap { get { return colormap; } set { colormap = value; } } public SurfaceChartTypeEnum SurfaceChartType { get { return surfaceChartType; } set { surfaceChartType = value; } } public bool IsColormap { get { return isColormap; } set { isColormap = value; }

CHAPTER 15 ■ 3D CHARTS WITHOUT THE WPF 3D ENGINE
611
} public bool IsHiddenLine { get { return isHiddenLine; } set { isHiddenLine = value; } } public bool IsInterp { get { return isInterp; } set { isInterp = value; } } public int NumberInterp { get { return numberInterp; } set { numberInterp = value; } } public enum SurfaceChartTypeEnum { Surface = 1, Mesh = 2, MeshZ = 3, Waterfall =4 } public void AddSurfaceChart(ChartStyle cs, DataSeriesSurface ds) { switch (SurfaceChartType) { case SurfaceChartTypeEnum.Mesh: AddMesh(cs, ds); //AddColorBar(cs, ds); break; case SurfaceChartTypeEnum.MeshZ: AddMeshZ(cs, ds); break; case SurfaceChartTypeEnum.Waterfall: AddWaterfall(cs, ds); break; case SurfaceChartTypeEnum.Surface: AddSurface(cs, ds); break; } } public void AddColorBar(ChartStyle cs, DataSeriesSurface ds, double zmin, double zmax) { TextBlock tb; tb = new TextBlock();
CHAPTER 15 ■ 3D CHARTS WITHOUT THE WPF 3D ENGINE
612
tb.Text = "A"; tb.FontFamily = cs.TickFont; tb.FontSize = cs.TickFontSize; tb.Measure(new Size(Double.PositiveInfinity, Double.PositiveInfinity)); Size tickSize = tb.DesiredSize; double x = 6 * cs.ChartCanvas.Width / 7; double y = cs.ChartCanvas.Height / 10; double width = cs.ChartCanvas.Width / 25; double height = 8 * cs.ChartCanvas.Height / 10; Point3D[] pts = new Point3D[64]; double dz = (zmax - zmin) / 63; // Create the color bar: Polygon plg; for (int i = 0; i < 64; i++) { pts[i] = new Point3D(x, y, zmin + i * dz); } for (int i = 0; i < 63; i++) { SolidColorBrush brush = GetBrush(pts[i].Z, zmin, zmax); double y1 = y + height - (pts[i].Z - zmin) * height / (zmax - zmin); double y2 = y + height – (pts[i + 1].Z - zmin) * height / (zmax - zmin); plg = new Polygon(); plg.Points.Add(new Point(x, y2)); plg.Points.Add(new Point(x + width, y2)); plg.Points.Add(new Point(x + width, y1)); plg.Points.Add(new Point(x, y1)); plg.Fill = brush; plg.Stroke = brush; cs.ChartCanvas.Children.Add(plg); } Rectangle rect = new Rectangle(); rect.Width = width + 2; rect.Height = height + 2; rect.Stroke = Brushes.Black; Canvas.SetLeft(rect, x - 1); Canvas.SetTop(rect, y - 1); cs.ChartCanvas.Children.Add(rect); // Add ticks and labels to the color bar: double tickLength = 0.15 * width; for (double z = zmin; z <= zmax; z = z + (zmax - zmin) / 6) { double yy = y + height - (z - zmin) * height / (zmax - zmin); AddTickLine(cs, new Point(x, yy), new Point(x + tickLength, yy)); AddTickLine(cs, new Point(x + width, yy), new Point(x + width - tickLength, yy)); tb = new TextBlock(); tb.Text = (Math.Round(z, 2)).ToString(); tb.FontFamily = cs.TickFont;

CHAPTER 15 ■ 3D CHARTS WITHOUT THE WPF 3D ENGINE
613
tb.FontSize = cs.TickFontSize; cs.ChartCanvas.Children.Add(tb); Canvas.SetLeft(tb, x + width + 5); Canvas.SetTop(tb, yy - tickSize.Height / 2); } } private void AddTickLine(ChartStyle cs, Point pt1, Point pt2) { Line line = new Line(); line.X1 = pt1.X; line.Y1 = pt1.Y; line.X2 = pt2.X; line.Y2 = pt2.Y; line.Stroke = Brushes.Black; cs.ChartCanvas.Children.Add(line); } private SolidColorBrush GetBrush(double z, double zmin, double zmax) { SolidColorBrush brush = new SolidColorBrush(); Colormap.Ydivisions = (int)((zmax - zmin) / (Colormap.ColormapLength - 1)); Colormap.Ymin = zmin; Colormap.Ymax = zmax; Colormap.Ydivisions = 64; int colorIndex = (int)(((Colormap.ColormapLength - 1) * (z - zmin) + zmax - z) / (zmax - zmin)); if (colorIndex < 0) colorIndex = 0; if (colorIndex >= Colormap.ColormapLength) colorIndex = Colormap.ColormapLength - 1; brush = Colormap.ColormapBrushes()[colorIndex]; return brush; } private void AddMesh(ChartStyle cs, DataSeriesSurface ds) { … … } private void AddMeshZ(ChartStyle cs, DataSeriesSurface ds) { … … } private void AddWaterfall(ChartStyle cs, DataSeriesSurface ds) { … … } private void AddSurface(ChartStyle cs, DataSeriesSurface ds) { … … } } }

CHAPTER 15 ■ 3D CHARTS WITHOUT THE WPF 3D ENGINE
614
In this class, the field members and their corresponding public properties are used to control the appearance of various 3D charts. You can create a specific 3D chart by selecting the SurfaceChartType from the enumeration SurfaceChartTypeEnum. You can see that four different chart types are available to select from in this enumeration. You can add more chart types to this enumeration and create their corresponding 3D charts the same way we do here.
The ColormapBrush property is used to create the colormap for a specified 3D chart type. The colormap is associated with the Z value. The AddColorBar method creates a colorbar on the right side of a 3D chart. This colorbar, much like the legend in a 2D chart, indicates the data values for different colors in the colormap.
In the following few sections, I’ll present the detailed procedures for creating various 3D charts.
Mesh Charts To create mesh charts, we’ll add an AddMesh method to the DrawSurfaceChart class. The following is the code listing for this method:
private void AddMesh(ChartStyle cs, DataSeriesSurface ds) { Matrix3D m = Utility.AzimuthElevation(cs.Elevation, cs.Azimuth); Polygon plg = new Polygon(); Point3D[,] pts = ds.PointArray; double[,] zValues = new double[pts.GetLength(0), pts.GetLength(1)]; double zmin = ds.ZDataMin(); double zmax = ds.ZDataMax(); for (int i = 0; i < pts.GetLength(0); i++) { for (int j = 0; j < pts.GetLength(1); j++) { zValues[i, j] = pts[i, j].Z; pts[i, j] = cs.Normalize3D(m, pts[i, j]); } } // Draw mesh chart: for (int i = 0; i < pts.GetLength(0) - 1; i++) { int ii = i; if (cs.Elevation >= 0) { ii = i; if (cs.Azimuth >= -180 && cs.Azimuth < 0) ii = pts.GetLength(0) - 2 - i; } else { ii = pts.GetLength(0) - 2 - i; if (cs.Azimuth >= -180 && cs.Azimuth < 0) ii = i; } for (int j = 0; j < pts.GetLength(1) - 1; j++) { int jj = j;

CHAPTER 15 ■ 3D CHARTS WITHOUT THE WPF 3D ENGINE
615
if (cs.Elevation < 0) jj = pts.GetLength(1) - 2 - j; plg = new Polygon(); plg.Points.Add(new Point(pts[ii, jj].X, pts[ii, jj].Y)); plg.Points.Add(new Point(pts[ii, jj + 1].X, pts[ii, jj + 1].Y)); plg.Points.Add(new Point(pts[ii + 1, jj + 1].X, pts[ii + 1, jj + 1].Y)); plg.Points.Add(new Point(pts[ii + 1, jj].X, pts[ii + 1, jj].Y)); plg.Stroke = Brushes.Black; plg.StrokeThickness = ds.LineThickness; plg.Fill = Brushes.White; if (IsHiddenLine) plg.Fill = Brushes.Transparent; if (IsColormap) plg.Stroke = GetBrush(zValues[ii, jj], zmin, zmax); cs.ChartCanvas.Children.Add(plg); } } if (cs.IsColorBar && IsColormap) AddColorBar(cs, ds, zmin, zmax); }
You can select the Mesh chart type using the following code snippet:
DrawSurfaceChart dsc = new DrawSurfaceChart(); dsc.ChartType = DrawChart.ChartTypeEnum.Mesh;
This way, you can create a 3D mesh chart with or without hidden lines. You can also produce a mesh chart with a single color or with a complete scaled colormap. We use the Z-order algorithm to remove hidden lines in a mesh plot. The Z-order algorithm draws polygons from back to front. A polygon drawn in this order can obscure only the polygon drawn before it. Filling the polygon with a white color (or the background color of the plot area) covers up any lines that should be obscured. Notice that when the elevation and azimuth angles change, we change the order of drawing the polygons, ensuring that the program always draws the polygons from back to front.
Here, I’ll show you how to create a mesh chart in a WPF application. Add a new WPF window and name it SurfaceChart. Here is the XAML file for this example:
<Window x:Class="Chart3DNoWPFEngine.SurfaceChart" xmlns="http://schemas.microsoft.com/winfx/2006/xaml/presentation" xmlns:x="http://schemas.microsoft.com/winfx/2006/xaml" Title="Surface Chart" Height="400" Width="500"> <Grid> <Grid.ColumnDefinitions> <ColumnDefinition Width="*"/> <ColumnDefinition Width="auto"/> </Grid.ColumnDefinitions> <Grid x:Name="chartGrid" SizeChanged="chartGrid_SizeChanged" Margin="10 10 0 10" Grid.Row="0" Grid.Column="0"> <Canvas x:Name="chartCanvas" Background="Transparent" ClipToBounds="True"/> </Grid> <Grid x:Name="colorbarGrid" Margin="0 10 10 10" Grid.Row="0" Grid.Column="1"> </Grid> </Grid> </Window>

CHAPTER 15 ■ 3D CHARTS WITHOUT THE WPF 3D ENGINE
616
This XAML file creates a resizable chart canvas, on which we’ll draw the mesh chart. Here is the corresponding code-behind file for this example:
using System; using System.Collections.Generic; using System.Windows; using System.Windows.Controls; using System.Windows.Media; using System.Windows.Media.Media3D; using System.Windows.Shapes; namespace Chart3DNoWPFEngine { public partial class SurfaceChart : Window { private ChartStyle cs; private DataSeriesSurface ds; private DrawSurfaceChart dsc; public SurfaceChart() { InitializeComponent(); } private void chartGrid_SizeChanged(object sender, SizeChangedEventArgs e) { chartCanvas.Width = chartGrid.ActualWidth; chartCanvas.Height = chartGrid.ActualHeight; AddChart(); } private void AddChart() { chartCanvas.Children.Clear(); cs = new ChartStyle(); cs.ChartCanvas = this.chartCanvas; cs.GridlinePattern = ChartStyle.GridlinePatternEnum.Solid; cs.Elevation = 30; cs.Azimuth = -37; cs.Title = "No Title"; cs.AddChartStyle(); ds = new DataSeriesSurface(); ds.LineColor = Brushes.Black; Utility.Peak3D(cs, ds); dsc = new DrawSurfaceChart(); dsc.SurfaceChartType = DrawSurfaceChart.SurfaceChartTypeEnum.Mesh; dsc.IsColormap = false; dsc.IsHiddenLine = true; dsc.AddSurfaceChart(cs, ds); } } }

CHAPTER 15 ■ 3D CHARTS WITHOUT THE WPF 3D ENGINE
617
By building and running this project, you’ll create a mesh chart with hidden lines, as shown in Figure 15-6.
Figure 15-6. Mesh chart with hidden lines
You can just as easily create a mesh chart without hidden lines by changing one line of code:
dsc.IsHiddenLine = false;
The bool parameter IsHiddenLine is set to false, meaning that you do not want to show the hidden lines in your mesh plot. This produces the results of Figure 15-7.

CHAPTER 15 ■ 3D CHARTS WITHOUT THE WPF 3D ENGINE
618
Figure 15-7. Mesh chart without hidden lines
You can also create a colormapped mesh chart with a colorbar using the following code snippet:
cs.IsColorBar = true; dsc.IsColormap = true;
This tells the program to draw the mesh plot using a colormapped brush and to add a colorbar to the chart. The result is shown in Figure 15-8.

CHAPTER 15 ■ 3D CHARTS WITHOUT THE WPF 3D ENGINE
619
Figure 15-8. Mesh chart with a colormap and a colorbar
Curtain Charts The chart type MeshZ creates a curtain plot from a reference plane around the mesh chart. The curtain is drawn by dropping lines down from the edge of the surface to the plane parallel to the X-Y plane, at a height equal to the lowest point on the surface.
We can create a curtain chart using the following AddMeshZ method in the DrawSurfaceChart class:
private void AddMeshZ(ChartStyle cs, DataSeriesSurface ds) { Matrix3D m = Utility.AzimuthElevation(cs.Elevation, cs.Azimuth); Polygon plg = new Polygon(); Point3D[,] pts = ds.PointArray; Point3D[,] pts1 = new Point3D[pts.GetLength(0), pts.GetLength(1)]; double[,] zValues = new double[pts.GetLength(0), pts.GetLength(1)]; double zmin = ds.ZDataMin(); double zmax = ds.ZDataMax(); for (int i = 0; i < pts.GetLength(0); i++)

CHAPTER 15 ■ 3D CHARTS WITHOUT THE WPF 3D ENGINE
620
{ for (int j = 0; j < pts.GetLength(1); j++) { zValues[i, j] = pts[i, j].Z; pts1[i, j] = new Point3D(pts[i, j].X, pts[i, j].Y, pts[i, j].Z); pts[i, j] = cs.Normalize3D(m, pts[i, j]); } } // Draw mesh using the z-order method: for (int i = 0; i < pts.GetLength(0) - 1; i++) { int ii = i; if (cs.Elevation >= 0) { ii = i; if (cs.Azimuth >= -180 && cs.Azimuth < 0) ii = pts.GetLength(0) - 2 - i; } else { ii = pts.GetLength(0) - 2 - i; if (cs.Azimuth >= -180 && cs.Azimuth < 0) ii = i; } for (int j = 0; j < pts.GetLength(1) - 1; j++) { int jj = j; if (cs.Elevation < 0) jj = pts.GetLength(1) - 2 - j; plg = new Polygon(); plg.Points.Add(new Point(pts[ii, jj].X, pts[ii, jj].Y)); plg.Points.Add(new Point(pts[ii, jj + 1].X, pts[ii, jj + 1].Y)); plg.Points.Add(new Point(pts[ii + 1, jj + 1].X, pts[ii + 1, jj + 1].Y)); plg.Points.Add(new Point(pts[ii + 1, jj].X, pts[ii + 1, jj].Y)); plg.Stroke = Brushes.Black; plg.StrokeThickness = ds.LineThickness; plg.Fill = Brushes.White; if (!IsHiddenLine) plg.Fill = Brushes.Transparent; if (IsColormap) plg.Stroke = GetBrush(zValues[ii, jj], zmin, zmax); cs.ChartCanvas.Children.Add(plg); } } //Draw curtain lines: Point3D[] pta = new Point3D[4]; for (int i = 0; i < pts1.GetLength(0); i++) { int jj = pts1.GetLength(0) - 1; if (cs.Elevation >= 0) {

CHAPTER 15 ■ 3D CHARTS WITHOUT THE WPF 3D ENGINE
621
if (cs.Azimuth >= -90 && cs.Azimuth <= 90) jj = 0; } else if (cs.Elevation < 0) { jj = 0; if (cs.Azimuth >= -90 && cs.Azimuth <= 90) jj = pts1.GetLength(0) - 1; } if (i < pts1.GetLength(0) - 1) { pta[0] = new Point3D(pts1[i, jj].X, pts1[i, jj].Y, pts1[i, jj].Z); pta[1] = new Point3D(pts1[i + 1, jj].X, pts1[i + 1, jj].Y, pts1[i + 1, jj].Z); pta[2] = new Point3D(pts1[i + 1, jj].X, pts1[i + 1, jj].Y, cs.Zmin); pta[3] = new Point3D(pts1[i, jj].X, pts1[i, jj].Y, cs.Zmin); for (int k = 0; k < 4; k++) pta[k] = cs.Normalize3D(m, pta[k]); plg = new Polygon(); plg.Stroke = Brushes.Black; plg.StrokeThickness = ds.LineThickness; plg.Fill = Brushes.White; plg.Points.Add(new Point(pta[0].X, pta[0].Y)); plg.Points.Add(new Point(pta[1].X, pta[1].Y)); plg.Points.Add(new Point(pta[2].X, pta[2].Y)); plg.Points.Add(new Point(pta[3].X, pta[3].Y)); if (!IsHiddenLine) plg.Fill = Brushes.Transparent; if (IsColormap) plg.Stroke = GetBrush(pts1[i,jj].Z, zmin, zmax); cs.ChartCanvas.Children.Add(plg); } } for (int j = 0; j < pts1.GetLength(1); j++) { int ii = 0; if (cs.Elevation >= 0) { if (cs.Azimuth >= 0 && cs.Azimuth <= 180) ii = pts1.GetLength(1) - 1; } else if (cs.Elevation < 0) { if (cs.Azimuth >= -180 && cs.Azimuth <= 0) ii = pts1.GetLength(1) - 1; } if (j < pts1.GetLength(1) - 1) { pta[0] = new Point3D(pts1[ii, j].X, pts1[ii, j].Y, pts1[ii, j].Z); pta[1] = new Point3D(pts1[ii, j + 1].X, pts1[ii, j + 1].Y, pts1[ii, j + 1].Z); pta[2] = new Point3D(pts1[ii, j + 1].X, pts1[ii, j + 1].Y, cs.Zmin);
CHAPTER 15 ■ 3D CHARTS WITHOUT THE WPF 3D ENGINE
622
pta[3] = new Point3D(pts1[ii, j].X, pts1[ii, j].Y, cs.Zmin); for (int k = 0; k < 4; k++) pta[k] = cs.Normalize3D(m, pta[k]); plg = new Polygon(); plg.Stroke = Brushes.Black; plg.StrokeThickness = ds.LineThickness; plg.Fill = Brushes.White; plg.Points.Add(new Point(pta[0].X, pta[0].Y)); plg.Points.Add(new Point(pta[1].X, pta[1].Y)); plg.Points.Add(new Point(pta[2].X, pta[2].Y)); plg.Points.Add(new Point(pta[3].X, pta[3].Y)); if (IsHiddenLine) plg.Fill = Brushes.Transparent; if (IsColormap) plg.Stroke = GetBrush(pts1[ii, j].Z, zmin, zmax); cs.ChartCanvas.Children.Add(plg); } } if (cs.IsColorBar && IsColormap) AddColorBar(cs, ds, zmin, zmax); }
In this method, we first create a mesh plot, and then we add the curtain to it. The curtain lines must be drawn on the appropriate surface when the elevation and azimuth angles are changed.
We can test the curtain chart using the same code we used to test mesh charts, except for a change in the following line:
dsc.SurfaceChartType = DrawSurfaceChart.SurfaceChartTypeEnum.MeshZ;
You can also change the chart function to Sinc3D and the colormap matrix to Cool:
Utility.Sinc3D(cs, ds); dsc.IsColormap = true; dsc.IsHiddenLine = false; dsc.Colormap.ColormapBrushType = ColormapBrush.ColormapBrushEnum.Cool;
This produces the output of Figure 15-9.

CHAPTER 15 ■ 3D CHARTS WITHOUT THE WPF 3D ENGINE
623
Figure 15-9. Curtain mesh chart
Waterfall Charts A waterfall chart draws a mesh plot similar to a curtain chart, but it does not generate vertical lines from the X component of the data. This produces a “waterfall” effect.
You can create a waterfall chart using the following AddWaterfall method in the DrawSurfaceChart class:
private void AddWaterfall(ChartStyle cs, DataSeriesSurface ds) { Matrix3D m = Utility.AzimuthElevation(cs.Elevation, cs.Azimuth); Polygon plg = new Polygon(); Point3D[,] pts = ds.PointArray; Point3D[] pt3 = new Point3D[pts.GetLength(0) + 2]; double[] zValues = new double[pts.Length]; Point[] pta = new Point[pts.GetLength(0) + 2]; double zmin = ds.ZDataMin(); double zmax = ds.ZDataMax();

CHAPTER 15 ■ 3D CHARTS WITHOUT THE WPF 3D ENGINE
624
for (int j = 0; j < pts.GetLength(1); j++) { int jj = j; if (cs.Elevation >= 0) { if (cs.Azimuth >= -90 && cs.Azimuth < 90) jj = pts.GetLength(1) - 1 - j; } else if (cs.Elevation < 0) { jj = pts.GetLength(1) - 1 - j; if (cs.Azimuth >= -90 && cs.Azimuth < 90) jj = j; } for (int i = 0; i < pts.GetLength(0); i++) { pt3[i + 1] = pts[i, jj]; if (i == 0) pt3[0] = new Point3D(pt3[i + 1].X, pt3[i + 1].Y, cs.Zmin); if (i == pts.GetLength(0) - 1) { pt3[pts.GetLength(0) + 1] = new Point3D(pt3[i + 1].X, pt3[i + 1].Y, cs.Zmin); } } plg = new Polygon(); for (int i = 0; i < pt3.Length; i++) { zValues[i] = pt3[i].Z; pt3[i] = cs.Normalize3D(m, pt3[i]); pta[i] = new Point(pt3[i].X, pt3[i].Y); plg.Points.Add(new Point(pt3[i].X, pt3[i].Y)); } plg.Stroke = Brushes.Transparent; plg.StrokeThickness = ds.LineThickness; plg.Fill = Brushes.White; cs.ChartCanvas.Children.Add(plg); for (int i = 1; i < pt3.Length; i++) { Line line = new Line(); line.Stroke = Brushes.Black; line.StrokeThickness = ds.LineThickness; if (IsColormap) { if (i < pt3.Length - 1) line.Stroke = GetBrush(zValues[i], zmin, zmax); else line.Stroke = GetBrush(zValues[i - 1], zmin, zmax); } line.X1 = pta[i - 1].X; line.Y1 = pta[i - 1].Y; line.X2 = pta[i].X; line.Y2 = pta[i].Y;

CHAPTER 15 ■ 3D CHARTS WITHOUT THE WPF 3D ENGINE
625
cs.ChartCanvas.Children.Add(line); } } if (cs.IsColorBar && IsColormap) AddColorBar(cs, ds, zmin, zmax); }
In this method, we first create the mesh plot, and then we add the vertical lines from the Y component of the data, producing the waterfall effect. The vertical lines must be drawn on the appropriate surface when the elevation and azimuth angles change.
We can test the waterfall chart using the same code we used to test curtain charts, except for a change in the following line:
dsc.SurfaceChartType = DrawSurfaceChart.SurfaceChartTypeEnum.Waterfall;
This generates the output of Figure 15-10.
Figure 15-10. Waterfall chart

CHAPTER 15 ■ 3D CHARTS WITHOUT THE WPF 3D ENGINE
626
Surface Charts Surface charts are similar to mesh charts, in that both display data as a shaded surface. The difference between surface and mesh charts is that a surface chart creates colored quadrilaterals and black mesh lines, whereas a mesh plot creates only mesh lines, which can be black or colored.
We can create a surface chart using the following AddSurface method in the DrawSurfaceChart class:
private void AddSurface(ChartStyle cs, DataSeriesSurface ds) { Matrix3D m = Utility.AzimuthElevation(cs.Elevation, cs.Azimuth); Polygon plg = new Polygon(); Point3D[,] pts = ds.PointArray; Point3D[,] pts1 = new Point3D[pts.GetLength(0), pts.GetLength(1)]; double zmin = ds.ZDataMin(); double zmax = ds.ZDataMax(); for (int i = 0; i < pts.GetLength(0); i++) { for (int j = 0; j < pts.GetLength(1); j++) { pts1[i, j] = pts[i, j]; pts[i, j] = cs.Normalize3D(m, pts[i, j]); } } // Draw surface chart: if (!IsInterp) { for (int i = 0; i < pts.GetLength(0) - 1; i++) { int ii = i; if (cs.Elevation >= 0) { ii = i; if (cs.Azimuth >= -180 && cs.Azimuth < 0) ii = pts.GetLength(0) - 2 - i; } else { ii = pts.GetLength(0) - 2 - i; if (cs.Azimuth >= -180 && cs.Azimuth < 0) ii = i; } for (int j = 0; j < pts.GetLength(1) - 1; j++) { int jj = j; if (cs.Elevation < 0) jj = pts.GetLength(1) - 2 - j; plg = new Polygon(); plg.Points.Add(new Point(pts[ii, jj].X, pts[ii, jj].Y)); plg.Points.Add(new Point(pts[ii, jj + 1].X, pts[ii, jj + 1].Y)); plg.Points.Add(new Point(pts[ii + 1, jj + 1].X,

CHAPTER 15 ■ 3D CHARTS WITHOUT THE WPF 3D ENGINE
627
pts[ii + 1, jj + 1].Y)); plg.Points.Add(new Point(pts[ii + 1, jj].X, pts[ii + 1, jj].Y)); plg.StrokeThickness = ds.LineThickness; plg.Stroke = ds.LineColor; plg.Fill = GetBrush(pts1[ii,jj].Z, zmin, zmax); cs.ChartCanvas.Children.Add(plg); } } if (cs.IsColorBar && IsColormap) AddColorBar(cs, ds, zmin, zmax); } else if (IsInterp) { for (int i = 0; i < pts.GetLength(0) - 1; i++) { int ii = i; if (cs.Elevation >= 0) { ii = i; if (cs.Azimuth >= -180 && cs.Azimuth < 0) ii = pts.GetLength(0) - 2 - i; } else { ii = pts.GetLength(0) - 2 - i; if (cs.Azimuth >= -180 && cs.Azimuth < 0) ii = i; } for (int j = 0; j < pts.GetLength(1) - 1; j++) { int jj = j; if (cs.Elevation < 0) jj = pts.GetLength(1) - 2 - j; Point3D[] points = new Point3D[4]; points[0] = pts1[ii, j]; points[1] = pts1[ii, j + 1]; points[2] = pts1[ii + 1, j + 1]; points[3] = pts1[ii + 1, j]; Interp(cs, m, points, zmin, zmax); plg = new Polygon(); plg.Stroke = ds.LineColor; plg.Points.Add(new Point(pts[ii, j].X, pts[ii, j].Y)); plg.Points.Add(new Point(pts[ii, j+1].X, pts[ii, j+1].Y)); plg.Points.Add(new Point(pts[ii+1, j+1].X, pts[ii+1, j+1].Y)); plg.Points.Add(new Point(pts[ii+1, j].X, pts[ii+1, j].Y)); } } } if (cs.IsColorBar && IsColormap) AddColorBar(cs, ds, zmin, zmax); }

CHAPTER 15 ■ 3D CHARTS WITHOUT THE WPF 3D ENGINE
628
In this method, we draw surface charts using two different approaches: One is similar to the approach used to create mesh charts; the other applies interpolated shading to the surface plot by calling the following Interp method:
private void Interp(ChartStyle cs, Matrix3D m, Point3D[] pta, double zmin, double zmax) { Polygon plg = new Polygon(); Point[] points = new Point[4]; int npoints = NumberInterp; Point3D[,] pts = new Point3D[npoints + 1, npoints + 1]; Point3D[,] pts1 = new Point3D[npoints + 1, npoints + 1]; double x0 = pta[0].X; double y0 = pta[0].Y; double x1 = pta[2].X; double y1 = pta[2].Y; double dx = (x1 - x0) / npoints; double dy = (y1 - y0) / npoints; double c00 = pta[0].Z; double c10 = pta[3].Z; double c11 = pta[2].Z; double c01 = pta[1].Z; double x, y, c; for (int i = 0; i <= npoints; i++) { x = x0 + i * dx; for (int j = 0; j <= npoints; j++) { y = y0 + j * dy; c = (y1 - y) * ((x1 - x) * c00 + (x - x0) * c10) / (x1 - x0) / (y1 - y0) + (y - y0) * ((x1 - x) * c01 + (x - x0) * c11) / (x1 - x0) / (y1 - y0); pts[i, j] = new Point3D(x, y, c); pts1[i, j] = new Point3D(x, y, c); pts[i, j] = cs.Normalize3D(m, pts[i, j]); } } for (int i = 0; i < npoints; i++) { for (int j = 0; j < npoints; j++) { plg = new Polygon(); Brush brush = GetBrush(pts1[i, j].Z, zmin, zmax); plg.Fill = brush; plg.StrokeThickness = 0.1; plg.Stroke = brush; plg.Points.Add(new Point(pts[i, j].X, pts[i, j].Y)); plg.Points.Add(new Point(pts[i + 1, j].X, pts[i + 1, j].Y)); plg.Points.Add(new Point(pts[i + 1, j + 1].X, pts[i + 1, j + 1].Y)); plg.Points.Add(new Point(pts[i, j + 1].X, pts[i, j + 1].Y)); cs.ChartCanvas.Children.Add(plg);

CHAPTER 15 ■ 3D CHARTS WITHOUT THE WPF 3D ENGINE
629
} } }
This interpolation method forces the color within each polygon of a surface chart to vary bilinearly, producing the effect of smooth color variation across the surface. You can control the fineness of the interpolated surface by changing the NumberInterp property.
We can test the surface chart using the same code we used to test mesh charts, except for a change in the following line:
dsc.SurfaceChartType = DrawSurfaceChart.SurfaceChartTypeEnum.Surface;
You can also change the chart function to Peak3D and the colormap matrix to Jet:
Utility.Peak3D(cs, ds); dsc.Colormap.ColormapBrushType = ColormapBrush.ColormapBrushEnum.Jet;
This produces the output of Figure 15-11.
Figure 15-11. A standard surface chart
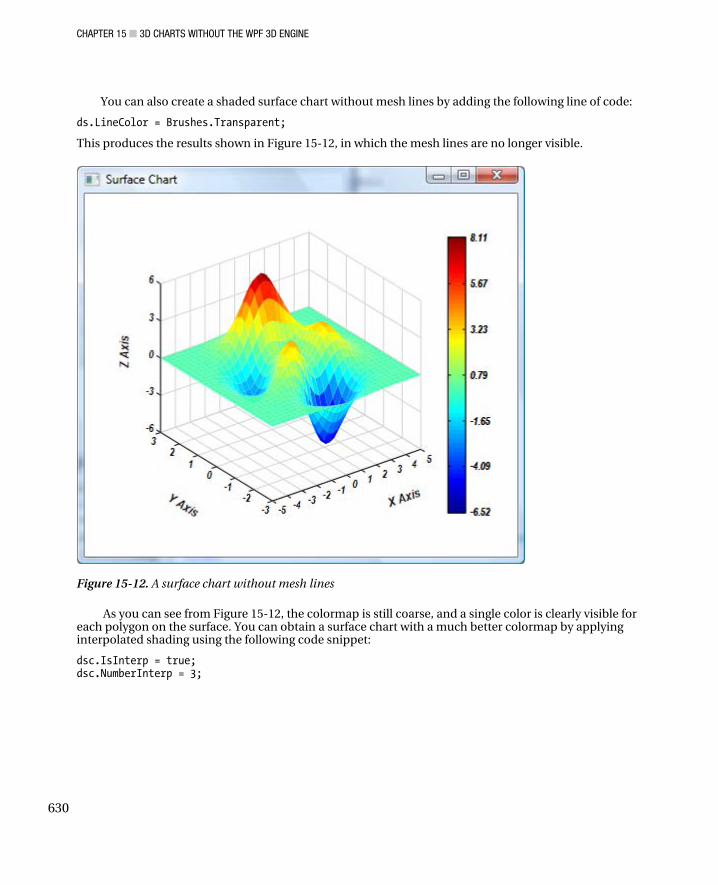
CHAPTER 15 ■ 3D CHARTS WITHOUT THE WPF 3D ENGINE
630
You can also create a shaded surface chart without mesh lines by adding the following line of code:
ds.LineColor = Brushes.Transparent;
This produces the results shown in Figure 15-12, in which the mesh lines are no longer visible.
Figure 15-12. A surface chart without mesh lines
As you can see from Figure 15-12, the colormap is still coarse, and a single color is clearly visible for each polygon on the surface. You can obtain a surface chart with a much better colormap by applying interpolated shading using the following code snippet:
dsc.IsInterp = true; dsc.NumberInterp = 3;

CHAPTER 15 ■ 3D CHARTS WITHOUT THE WPF 3D ENGINE
631
This creates the surface chart shown in Figure 15-13, which has a much smoother color across its whole surface.
Figure 15-13. A surface chart with interpolated shading

CHAPTER 15 ■ 3D CHARTS WITHOUT THE WPF 3D ENGINE
632
C H A P T E R 16
■ ■ ■
633
Specialized 3D Charts
In the previous chapter, I showed you how to create simple 3D surface charts without using the WPF 3D engine. This approach allows you to create professional 3D chart applications in WPF that include more advanced features, including colormaps and colorbars. In this chapter, I’ll show you how to create a variety of specialized 3D charts, such as contour charts and 3D bar charts, among others, using the same framework discussed in Chapter 15. Based on these example projects, with or without modifications, you can easily create your own professional and sophisticated 3D charts in your WPF applications.
Implementation Since all of the different specialized 3D charts share a similar framework, instead of creating a separate program for each type of 3D chart, here we’ll implement a unified program, which integrates several types of specialized 3D charts. With this program as a basis, you can easily create your own professional 3D chart applications.
2D Chart Style Some 3D specialized charts are actually projections of 3D charts on a 2D X-Y plane. For example, a contour chart helps visualize 3D surfaces on a 2D screen. In this case, data values are plotted as a function of mesh grid points in the X-Y plane. Thus, these projected specialized 3D charts require a 2D-like chart style, similar to that used to create 2D charts in Chapters 5 and 6. However, this 2D-like chart style must also inherit some 3D features from the original 3D chart style used in the previous chapter, because the X and Y coordinates must be the projected coordinates in 3D space. Here, for your reference, I’ll list the source code of this 2D-like chart style.
Start with a new WPF Windows application and name it Specialized3DChart. Add to the current project the classes DataSeriesLine3D, DataSeriesSurface, ChartStyle, ColormapBrush, DrawSurfaceChart, and Utility as well as the WPF project SurfaceChart from the Chart3DNoWPFEngine project in Chapter 15, and change their corresponding namespace to Specialized3DChart. Add a new class to the current project and name it ChartStyle2D. This class is inherited from the original 3D ChartStyle class:
using System; using System.Windows.Controls; using System.Windows; using System.Windows.Media; using System.Windows.Media.Media3D; using System.Windows.Shapes;

CHAPTER 16 ■ SPECIALIZED 3D CHARTS
634
namespace Specialized3DChart { public class ChartStyle2D : ChartStyle { private double leftOffset = 20; private double bottomOffset = 40; private double rightOffset = 10; private Canvas chart2dCanvas = new Canvas(); Border chart2dBorder; double colorbarWidth; Line gridline = new Line(); public Canvas Chart2dCanvas { get { return chart2dCanvas; } } public ChartStyle2D() { chart2dBorder = new Border(); chart2dBorder.BorderBrush = Brushes.Black; chart2dBorder.BorderThickness = new Thickness(1); chart2dBorder.Child = chart2dCanvas; } public void AddChartStyle2D(DrawSurfaceChart dsc) { colorbarWidth = ChartCanvas.Width / 7; ChartCanvas.Children.Clear(); ChartCanvas.Children.Add(chart2dBorder); Point pt = new Point(); Line tick = new Line(); double offset = 0; double dx, dy; TextBlock tb = new TextBlock(); // determine right offset: tb.Text = Xmax.ToString(); tb.Measure(new Size(Double.PositiveInfinity, Double.PositiveInfinity)); Size size = tb.DesiredSize; rightOffset = size.Width / 2 + 2; // Determine left offset: for (dy = Ymin; dy <= Ymax; dy += YTick) { pt = NormalizePoint(new Point(Xmin, dy)); tb = new TextBlock(); tb.Text = dy.ToString(); tb.TextAlignment = TextAlignment.Right; tb.Measure(new Size(Double.PositiveInfinity, Double.PositiveInfinity)); size = tb.DesiredSize; if (offset < size.Width)

CHAPTER 16 ■ SPECIALIZED 3D CHARTS
635
offset = size.Width; } leftOffset = offset + 5 + 30; Canvas.SetLeft(chart2dBorder, leftOffset); Canvas.SetBottom(chart2dBorder, bottomOffset); if (!IsColorBar) colorbarWidth = 0; chart2dCanvas.Width = ChartCanvas.Width - leftOffset - rightOffset - colorbarWidth; chart2dCanvas.Height = ChartCanvas.Height - bottomOffset - size.Height / 2; // Create vertical gridlines: if (IsYGrid == true) { for (dx = Xmin + XTick; dx < Xmax; dx += XTick) { gridline = new Line(); gridline.Stroke = GridlineColor; gridline.StrokeThickness = GridlineThickness; gridline.X1 = NormalizePoint(new Point(dx, Ymin)).X; gridline.Y1 = NormalizePoint(new Point(dx, Ymin)).Y; gridline.X2 = NormalizePoint(new Point(dx, Ymax)).X; gridline.Y2 = NormalizePoint(new Point(dx, Ymax)).Y; chart2dCanvas.Children.Add(gridline); } } // Create horizontal gridlines: if (IsXGrid == true) { for (dy = Ymin + YTick; dy < Ymax; dy += YTick) { gridline = new Line(); gridline.Stroke = GridlineColor; gridline.StrokeThickness = GridlineThickness; gridline.X1 = NormalizePoint(new Point(Xmin, dy)).X; gridline.Y1 = NormalizePoint(new Point(Xmin, dy)).Y; gridline.X2 = NormalizePoint(new Point(Xmax, dy)).X; gridline.Y2 = NormalizePoint(new Point(Xmax, dy)).Y; chart2dCanvas.Children.Add(gridline); } } // Create x-axis tick marks: for (dx = Xmin; dx <= Xmax; dx += XTick) { pt = NormalizePoint(new Point(dx, Ymin)); tick = new Line(); tick.Stroke = Brushes.Black; tick.X1 = pt.X; tick.Y1 = pt.Y;

CHAPTER 16 ■ SPECIALIZED 3D CHARTS
636
tick.X2 = pt.X; tick.Y2 = pt.Y - 5; chart2dCanvas.Children.Add(tick); tb = new TextBlock(); tb.Text = dx.ToString(); tb.Measure(new Size(Double.PositiveInfinity, Double.PositiveInfinity)); size = tb.DesiredSize; ChartCanvas.Children.Add(tb); Canvas.SetLeft(tb, leftOffset + pt.X - size.Width / 2); Canvas.SetTop(tb, pt.Y + 2 + size.Height / 2); } // Create y-axis tick marks: for (dy = Ymin; dy <= Ymax; dy += YTick) { pt = NormalizePoint(new Point(Xmin, dy)); tick = new Line(); tick.Stroke = Brushes.Black; tick.X1 = pt.X; tick.Y1 = pt.Y; tick.X2 = pt.X + 5; tick.Y2 = pt.Y; chart2dCanvas.Children.Add(tick); tb = new TextBlock(); tb.Text = dy.ToString(); tb.Measure(new Size(Double.PositiveInfinity, Double.PositiveInfinity)); size = tb.DesiredSize; ChartCanvas.Children.Add(tb); Canvas.SetRight(tb, chart2dCanvas.Width + 10 + colorbarWidth); Canvas.SetTop(tb, pt.Y); } tb = new TextBlock(); tb.Text = XLabel; tb.FontFamily = LabelFont; tb.FontSize = LabelFontSize; tb.Foreground = LabelColor; tb.Measure(new Size(Double.PositiveInfinity, Double.PositiveInfinity)); size = tb.DesiredSize; ChartCanvas.Children.Add(tb); Canvas.SetBottom(tb, bottomOffset / 10); Canvas.SetLeft(tb, leftOffset + chart2dCanvas.Width / 2 - size.Width / 2); tb = new TextBlock(); tb.Text = YLabel; tb.FontFamily = LabelFont; tb.FontSize = LabelFontSize; tb.Foreground = LabelColor; tb.RenderTransform = new RotateTransform(-90, 0.5, 0.5);
CHAPTER 16 ■ SPECIALIZED 3D CHARTS
637
tb.Measure(new Size(Double.PositiveInfinity, Double.PositiveInfinity)); size = tb.DesiredSize; ChartCanvas.Children.Add(tb); Canvas.SetBottom(tb, chart2dCanvas.Height / 2 + size.Width / 3); Canvas.SetLeft(tb, leftOffset / 10); } public Point NormalizePoint(Point pt) { if (chart2dCanvas.Width.ToString() == "NaN") chart2dCanvas.Width = 270; if (chart2dCanvas.Height.ToString() == "NaN") chart2dCanvas.Height = 250; Point result = new Point(); result.X = (pt.X - Xmin) * chart2dCanvas.Width / (Xmax - Xmin); result.Y = chart2dCanvas.Height – (pt.Y - Ymin) * chart2dCanvas.Height / (Ymax - Ymin); return result; } public void AddColorBar2D(ChartStyle2D cs, DataSeriesSurface ds, Draw3DChart dsc, double zmin, double zmax) { TextBlock tb; tb = new TextBlock(); tb.Text = "A"; tb.FontFamily = cs.TickFont; tb.FontSize = cs.TickFontSize; tb.Measure(new Size(Double.PositiveInfinity, Double.PositiveInfinity)); Size tickSize = tb.DesiredSize; double x = 8 * cs.ChartCanvas.Width / 9; double y = 7; double width = cs.ChartCanvas.Width / 25; double height = chart2dCanvas.Height; Point3D[] pts = new Point3D[64]; double dz = (zmax - zmin) / 63; // Create the color bar: Polygon plg; for (int i = 0; i < 64; i++) { pts[i] = new Point3D(x, y, zmin + i * dz); } for (int i = 0; i < 63; i++) { SolidColorBrush brush = dsc.GetBrush(pts[i].Z, zmin, zmax); double y1 = y + height - (pts[i].Z - zmin) * height / (zmax - zmin); double y2 = y + height – (pts[i + 1].Z - zmin) * height / (zmax - zmin); plg = new Polygon(); plg.Points.Add(new Point(x, y2)); plg.Points.Add(new Point(x + width, y2));
CHAPTER 16 ■ SPECIALIZED 3D CHARTS
638
plg.Points.Add(new Point(x + width, y1)); plg.Points.Add(new Point(x, y1)); plg.Fill = brush; plg.Stroke = brush; cs.ChartCanvas.Children.Add(plg); } Rectangle rect = new Rectangle(); rect.Width = width + 2; rect.Height = height + 2; rect.Stroke = Brushes.Black; Canvas.SetLeft(rect, x - 1); Canvas.SetTop(rect, y - 1); cs.ChartCanvas.Children.Add(rect); // Add ticks and labels to the color bar: double tickLength = 0.15 * width; for (double z = zmin; z <= zmax; z = z + (zmax - zmin) / 6) { double yy = y + height - (z - zmin) * height / (zmax - zmin); dsc.AddTickLine(cs, new Point(x, yy), new Point(x + tickLength, yy)); dsc.AddTickLine(cs, new Point(x + width, yy), new Point(x + width - tickLength, yy)); tb = new TextBlock(); tb.Text = (Math.Round(z, 2)).ToString(); tb.FontFamily = cs.TickFont; tb.FontSize = cs.TickFontSize; cs.ChartCanvas.Children.Add(tb); Canvas.SetLeft(tb, x + width + 5); Canvas.SetTop(tb, yy - tickSize.Height / 2); } } } }
This class is basically similar to that used to create 2D charts in Chapters 5 and 6, except here we implement a colorbar on the right side.
Draw3DChart Class In this section, we’ll implement all chart-drawing-related code in the Draw3DChart class. This class derives from the DrawSurfaceChart class implemented in the previous chapter. Here is the code listing for this class:
using System; using System.Collections.Generic; using System.Windows; using System.Windows.Controls; using System.Windows.Media; using System.Windows.Media.Media3D; using System.Windows.Shapes;

CHAPTER 16 ■ SPECIALIZED 3D CHARTS
639
namespace Specialized3DChart { public class Draw3DChart : DrawSurfaceChart { private int numberContours = 10; private bool isBarSingleColor = true; private bool isLineColorMatch = false; private ChartTypeEnum chartType = ChartTypeEnum.XYColor; private Polygon plg = new Polygon(); public ChartTypeEnum ChartType { get { return chartType; } set { chartType = value; } } public int NumberContours { get { return numberContours; } set { numberContours = value; } } public bool IsBarSingleColor { get { return isBarSingleColor; } set { isBarSingleColor = value; } } public bool IsLineColorMatch { get { return isLineColorMatch; } set { isLineColorMatch = value; } } public enum ChartTypeEnum { XYColor = 1, Contour = 2, FillContour = 3, XYColor3D = 4, MeshContour3D = 5, SurfaceContour3D = 6, SurfaceFillContour3D = 7, BarChart3D = 8 } public void AddChart(ChartStyle2D cs, DataSeriesSurface ds) { switch (ChartType) { case ChartTypeEnum.XYColor: cs.AddChartStyle2D(this); if (cs.IsColorBar && IsColormap)
CHAPTER 16 ■ SPECIALIZED 3D CHARTS
640
{ cs.AddColorBar2D(cs, ds, this, ds.ZDataMin(), ds.ZDataMax()); } AddXYColor(cs, ds); break; case ChartTypeEnum.Contour: cs.AddChartStyle2D(this); if (cs.IsColorBar && IsColormap) { cs.AddColorBar2D(cs, ds, this, ds.ZDataMin(), ds.ZDataMax()); } AddContour(cs, ds); break; case ChartTypeEnum.FillContour: cs.AddChartStyle2D(this); if (cs.IsColorBar && IsColormap) { cs.AddColorBar2D(cs, ds, this, ds.ZDataMin(), ds.ZDataMax()); } AddXYColor(cs, ds); AddContour(cs, ds); break; case ChartTypeEnum.MeshContour3D: cs.AddChartStyle(); AddContour3D(cs, ds); AddMesh(cs, ds); break; case ChartTypeEnum.SurfaceContour3D: cs.AddChartStyle(); AddContour3D(cs, ds); AddSurface(cs, ds); break; case ChartTypeEnum.SurfaceFillContour3D: cs.AddChartStyle(); AddXYColor3D(cs, ds); AddContour3D(cs, ds); AddSurface(cs, ds); break; } } private void AddXYColor(ChartStyle2D cs2d, DataSeriesSurface ds) { …… }

CHAPTER 16 ■ SPECIALIZED 3D CHARTS
641
private void AddContour(ChartStyle2D cs2d, DataSeriesSurface ds) { …… } private void AddXYColor3D(ChartStyle cs, DataSeriesSurface ds) { …… } private void AddContour3D(ChartStyle cs, DataSeriesSurface ds) { …… } public void AddBar3D(ChartStyle2D cs, Bar3DStyle bs) { …… } } }
In this class, the field members and their corresponding public properties are used to control the appearance of specialized 3D charts. You can create a specific 3D chart by selecting the ChartType from the enumeration, ChartTypeEnum. You can see that there are eight different chart types to select in this enumeration. Some of them are a combination of a few different chart types. You can add more chart types to this enumeration and create their corresponding 3D charts in the same manner as we do here.
You may notice that several methods in the Draw3DChart class have only a signature. In the following few sections, I’ll present detailed implementation of these methods.
Color Charts on the X-Y Plane The X-Y color chart can be considered a projected surface chart on the X-Y plane. In fact, it is a rectangle mesh grid in the X-Y plane with colors determined by the data values at the grid points. Here, we create the X-Y color chart using each set of four adjacent points to define the polygon. Each polygon is shaded in a single color. As with surface charts, X-Y color charts can have the interpolated shading, in which each polygon is colored by bilinear interpolation of the colors at its four vertices using all elements of the data values. The minimum and maximum elements of data values at grid points are assigned the first and last colors in the colormap. Colors for the remaining elements in the data values are determined by a linear mapping from value to colormap element.
Implementation In this section, we’ll implement the X-Y color chart. Add a new public method, AddXYColor, to the Draw3DChart class:
private void AddXYColor(ChartStyle2D cs2d, DataSeriesSurface ds) { Point3D[,] pts = ds.PointArray; double zmin = ds.ZDataMin(); double zmax = ds.ZDataMax();

CHAPTER 16 ■ SPECIALIZED 3D CHARTS
642
// Draw surface on the XY plane: if (!IsInterp) { for (int i = 0; i < pts.GetLength(0) - 1; i++) { for (int j = 0; j < pts.GetLength(1) - 1; j++) { plg = new Polygon(); plg.Stroke = ds.LineColor; plg.StrokeThickness = ds.LineThickness; plg.Fill = GetBrush(pts[i, j].Z, zmin, zmax); if(IsLineColorMatch) plg.Stroke = GetBrush(pts[i, j].Z, zmin, zmax); plg.Points.Add(cs2d.NormalizePoint(new Point(pts[i, j].X, pts[i, j].Y))); plg.Points.Add(cs2d.NormalizePoint(new Point(pts[i, j + 1].X, pts[i, j + 1].Y))); plg.Points.Add(cs2d.NormalizePoint(new Point(pts[i + 1, j + 1].X, pts[i + 1, j + 1].Y))); plg.Points.Add(cs2d.NormalizePoint(new Point(pts[i + 1, j].X, pts[i + 1, j].Y))); cs2d.Chart2dCanvas.Children.Add(plg); } } } else if (IsInterp) { for (int i = 0; i < pts.GetLength(0) - 1; i++) { for (int j = 0; j < pts.GetLength(1) - 1; j++) { Point3D[] points = new Point3D[4]; points[0] = pts[i, j]; points[1] = pts[i, j + 1]; points[2] = pts[i + 1, j + 1]; points[3] = pts[i + 1, j]; Interp2D(cs2d, points, zmin, zmax); plg = new Polygon(); plg.Stroke = ds.LineColor; if (IsLineColorMatch) plg.Stroke = GetBrush(pts[i, j].Z, zmin, zmax); plg.StrokeThickness = ds.LineThickness; plg.Fill = Brushes.Transparent; plg.Points.Add(cs2d.NormalizePoint(new Point(pts[i, j].X, pts[i, j].Y))); plg.Points.Add(cs2d.NormalizePoint(new Point(pts[i, j + 1].X, pts[i, j + 1].Y))); plg.Points.Add(cs2d.NormalizePoint(new Point(pts[i + 1, j + 1].X, pts[i + 1, j + 1].Y))); plg.Points.Add(cs2d.NormalizePoint(new Point(pts[i + 1, j].X, pts[i + 1, j].Y))); cs2d.Chart2dCanvas.Children.Add(plg);

CHAPTER 16 ■ SPECIALIZED 3D CHARTS
643
} } } } private void Interp2D(ChartStyle2D cs2d, Point3D[] pta, double zmin, double zmax) { Polygon plg = new Polygon(); Point[] points = new Point[4]; int npoints = NumberInterp; Point3D[,] pts = new Point3D[npoints + 1, npoints + 1]; double x0 = pta[0].X; double y0 = pta[0].Y; double x1 = pta[2].X; double y1 = pta[2].Y; double dx = (x1 - x0) / npoints; double dy = (y1 - y0) / npoints; double c00 = pta[0].Z; double c10 = pta[3].Z; double c11 = pta[2].Z; double c01 = pta[1].Z; double x, y, c; for (int i = 0; i <= npoints; i++) { x = x0 + i * dx; for (int j = 0; j <= npoints; j++) { y = y0 + j * dy; c = (y1 - y) * ((x1 - x) * c00 + (x - x0) * c10) / (x1 - x0) / (y1 - y0) + (y - y0) * ((x1 - x) * c01 + (x - x0) * c11) / (x1 - x0) / (y1 - y0); pts[i, j] = new Point3D(x, y, c); } } for (int i = 0; i < npoints; i++) { for (int j = 0; j < npoints; j++) { plg = new Polygon(); Brush brush = GetBrush(pts[i, j].Z, zmin, zmax); plg.Fill = brush; plg.Stroke = brush; plg.Points.Add(cs2d.NormalizePoint(new Point(pts[i, j].X, pts[i, j].Y))); plg.Points.Add(cs2d.NormalizePoint(new Point(pts[i, j + 1].X, pts[i, j + 1].Y))); plg.Points.Add(cs2d.NormalizePoint(new Point(pts[i + 1, j + 1].X, pts[i + 1, j + 1].Y))); plg.Points.Add(cs2d.NormalizePoint(new Point(pts[i + 1, j].X, pts[i + 1, j].Y))); cs2d.Chart2dCanvas.Children.Add(plg);

CHAPTER 16 ■ SPECIALIZED 3D CHARTS
644
} } }
In this method, we draw the X-Y color chart via two different approaches: One is the standard single-shaded approach; the other applies interpolated shading to the plot by calling the following Interp2D method. This interpolation method forces the color within each polygon to vary bilinearly, producing the effect of a smooth color variation across the chart. You can control the fineness of the interpolated surface by changing the NumberInterp property.
Testing X-Y Color Charts Here, I’ll show you how to create an X-Y color chart using the method implemented in the previous section. Add a new WPF window and name it XYColor. The XAML file for this example is very simple:
<Window x:Class="Specialized3DChart.XYColor" xmlns="http://schemas.microsoft.com/winfx/2006/xaml/presentation" xmlns:x="http://schemas.microsoft.com/winfx/2006/xaml" Title="XY Color Chart" Height="400" Width="500"> <Grid> <Grid.ColumnDefinitions> <ColumnDefinition Width="*"/> <ColumnDefinition Width="auto"/> </Grid.ColumnDefinitions> <Grid x:Name="chartGrid" SizeChanged="chartGrid_SizeChanged" Margin="20" Grid.Row="0" Grid.Column="0"> <Canvas x:Name="chartCanvas" Background="Transparent" ClipToBounds="True"/> </Grid> </Grid> </Window>
Here is the corresponding code-behind file:
using System; using System.Windows; using System.Windows.Controls; using System.Windows.Media; using System.Windows.Media.Imaging; namespace Specialized3DChart { public partial class XYColor : Window { private ChartStyle2D cs; private DataSeriesSurface ds; private Draw3DChart d3c; public XYColor() { InitializeComponent(); } private void chartGrid_SizeChanged(object sender, SizeChangedEventArgs e)
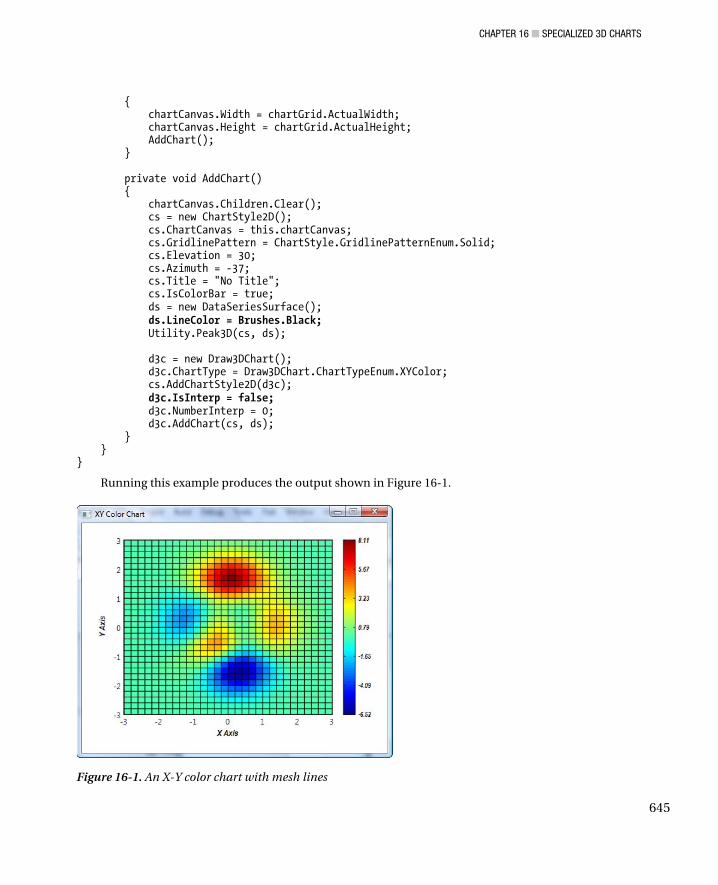
CHAPTER 16 ■ SPECIALIZED 3D CHARTS
645
{ chartCanvas.Width = chartGrid.ActualWidth; chartCanvas.Height = chartGrid.ActualHeight; AddChart(); } private void AddChart() { chartCanvas.Children.Clear(); cs = new ChartStyle2D(); cs.ChartCanvas = this.chartCanvas; cs.GridlinePattern = ChartStyle.GridlinePatternEnum.Solid; cs.Elevation = 30; cs.Azimuth = -37; cs.Title = "No Title"; cs.IsColorBar = true; ds = new DataSeriesSurface(); ds.LineColor = Brushes.Black; Utility.Peak3D(cs, ds); d3c = new Draw3DChart(); d3c.ChartType = Draw3DChart.ChartTypeEnum.XYColor; cs.AddChartStyle2D(d3c); d3c.IsInterp = false; d3c.NumberInterp = 0; d3c.AddChart(cs, ds); } } }
Running this example produces the output shown in Figure 16-1.
Figure 16-1. An X-Y color chart with mesh lines

CHAPTER 16 ■ SPECIALIZED 3D CHARTS
646
You can remove the mesh lines from the X-Y color chart by changing the LineColor property from Black to Transparent:
ds.LineColor = Brushes.Transparent;
This generates the result shown in Figure 16-2.
Figure 16-2. An X-Y color chart without mesh lines
You can see from the Figure 16-2 that each polygon on the X-Y color chart is shaded in a single color. You can obtain an X-Y color chart with a much better colormap by applying interpolated shading using the following modified code snippet:
d3c.IsInterp = true; d3c.NumberInterp = 5;
This produces the interpolated X-Y color chart shown in Figure 16-3.

CHAPTER 16 ■ SPECIALIZED 3D CHARTS
647
Figure 16-3. An X-Y color chart with an interpolated color shading
Contour Charts Contour charts help the visualizing of 3D surfaces on a 2D computer screen. In this case, data values are plotted as a function of mesh grid points in the X-Y plane. In order to do contouring in a WPF application, you need to describe the data surface and the contour levels you want to draw. Given this information, the program must call an algorithm that calculates the line segments that make up a contour curve and then plot these line segments on your computer screen.
In order to satisfy the foregoing requirements, here we’ll use an algorithm that is relatively simple to implement and very reliable and that does not require sophisticated programming techniques or a high level of mathematics to understand how it works.
Algorithm Suppose that 3D surface data are stored in a 2D array to form a rectangular grid in the X-Y plane. We consider four grid points at a time: the rectangular cell (i, j), (i + 1, j), (i, j + 1), and (i + 1, j + 1). This rectangular grid cell is further divided into two triangular grid cells, as shown in Figure 16-4. The contouring is drawn by systematically examining each triangular cell. Intersection points, if any, between each edge of the cell and a given contour-level curve are computed using bilinear interpolation. Line segments are plotted between intersection points of a contour-level curve, with each of the two edges belonging to the cell. Note that if any edges belonging to a triangular cell are intersected by a given-level curve, then exactly two edges are intersected.
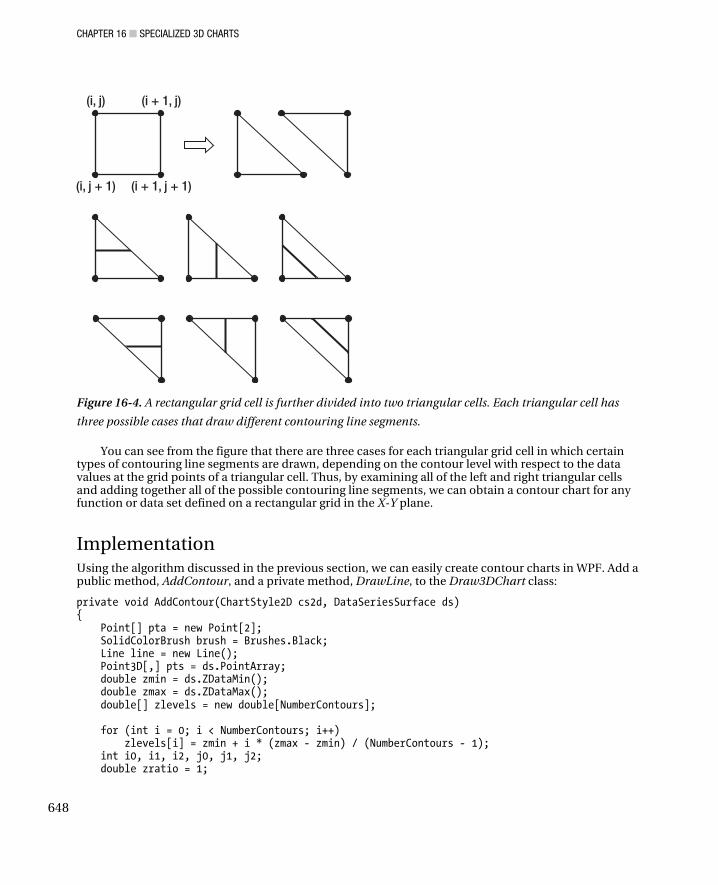
CHAPTER 16 ■ SPECIALIZED 3D CHARTS
648
Figure 16-4. A rectangular grid cell is further divided into two triangular cells. Each triangular cell has
three possible cases that draw different contouring line segments.
You can see from the figure that there are three cases for each triangular grid cell in which certain types of contouring line segments are drawn, depending on the contour level with respect to the data values at the grid points of a triangular cell. Thus, by examining all of the left and right triangular cells and adding together all of the possible contouring line segments, we can obtain a contour chart for any function or data set defined on a rectangular grid in the X-Y plane.
Implementation Using the algorithm discussed in the previous section, we can easily create contour charts in WPF. Add a public method, AddContour, and a private method, DrawLine, to the Draw3DChart class:
private void AddContour(ChartStyle2D cs2d, DataSeriesSurface ds) { Point[] pta = new Point[2]; SolidColorBrush brush = Brushes.Black; Line line = new Line(); Point3D[,] pts = ds.PointArray; double zmin = ds.ZDataMin(); double zmax = ds.ZDataMax(); double[] zlevels = new double[NumberContours]; for (int i = 0; i < NumberContours; i++) zlevels[i] = zmin + i * (zmax - zmin) / (NumberContours - 1); int i0, i1, i2, j0, j1, j2; double zratio = 1;
CHAPTER 16 ■ SPECIALIZED 3D CHARTS
649
// Draw contour on the XY plane: for (int i = 0; i < pts.GetLength(0) - 1; i++) { for (int j = 0; j < pts.GetLength(1) - 1; j++) { if (IsColormap && ChartType != ChartTypeEnum.FillContour) brush = GetBrush(pts[i, j].Z, zmin, zmax); for (int k = 0; k < NumberContours; k++) { // Left triangle: i0 = i; j0 = j; i1 = i; j1 = j + 1; i2 = i + 1; j2 = j + 1; if ((zlevels[k] >= pts[i0, j0].Z && zlevels[k] < pts[i1, j1].Z || zlevels[k] < pts[i0, j0].Z && zlevels[k] >= pts[i1, j1].Z) && (zlevels[k] >= pts[i1, j1].Z && zlevels[k] < pts[i2, j2].Z || zlevels[k] < pts[i1, j1].Z && zlevels[k] >= pts[i2, j2].Z)) { zratio = (zlevels[k] - pts[i0, j0].Z) / (pts[i1, j1].Z - pts[i0, j0].Z); pta[0] = cs2d.NormalizePoint(new Point(pts[i0, j0].X, (1 - zratio) * pts[i0, j0].Y + zratio * pts[i1, j1].Y)); zratio = (zlevels[k] - pts[i1, j1].Z) / (pts[i2, j2].Z - pts[i1, j1].Z); pta[1] = cs2d.NormalizePoint(new Point((1 - zratio) * pts[i1, j1].X + zratio * pts[i2, j2].X, pts[i1, j1].Y)); DrawLine(cs2d, ds, brush, pta[0], pta[1]); } else if ((zlevels[k] >= pts[i0, j0].Z && zlevels[k] < pts[i2, j2].Z || zlevels[k] < pts[i0, j0].Z && zlevels[k] >= pts[i2, j2].Z) && (zlevels[k] >= pts[i1, j1].Z && zlevels[k] < pts[i2, j2].Z || zlevels[k] < pts[i1, j1].Z && zlevels[k] >= pts[i2, j2].Z)) { zratio = (zlevels[k] - pts[i0, j0].Z) / (pts[i2, j2].Z - pts[i0, j0].Z); pta[0] = cs2d.NormalizePoint(new Point((1 - zratio) * pts[i0, j0].X + zratio * pts[i2, j2].X, (1 - zratio) * pts[i0, j0].Y + zratio * pts[i2, j2].Y));

CHAPTER 16 ■ SPECIALIZED 3D CHARTS
650
zratio = (zlevels[k] - pts[i1, j1].Z) / (pts[i2, j2].Z - pts[i1, j1].Z); pta[1] = cs2d.NormalizePoint(new Point((1 - zratio) * pts[i1, j1].X + zratio * pts[i2, j2].X, pts[i1, j1].Y)); DrawLine(cs2d, ds, brush, pta[0], pta[1]); } else if ((zlevels[k] >= pts[i0, j0].Z && zlevels[k] < pts[i1, j1].Z || zlevels[k] < pts[i0, j0].Z && zlevels[k] >= pts[i1, j1].Z) && (zlevels[k] >= pts[i0, j0].Z && zlevels[k] < pts[i2, j2].Z || zlevels[k] < pts[i0, j0].Z && zlevels[k] >= pts[i2, j2].Z)) { zratio = (zlevels[k] - pts[i0, j0].Z) / (pts[i1, j1].Z - pts[i0, j0].Z); pta[0] = cs2d.NormalizePoint(new Point(pts[i0, j0].X, (1 - zratio) * pts[i0, j0].Y + zratio * pts[i1, j1].Y)); zratio = (zlevels[k] - pts[i0, j0].Z) / (pts[i2, j2].Z - pts[i0, j0].Z); pta[1] = cs2d.NormalizePoint(new Point(pts[i0, j0].X * (1 - zratio) + pts[i2, j2].X * zratio, pts[i0, j0].Y * (1 - zratio) + pts[i2, j2].Y * zratio)); DrawLine(cs2d, ds, brush, pta[0], pta[1]); } // right triangle: i0 = i; j0 = j; i1 = i + 1; j1 = j; i2 = i + 1; j2 = j + 1; if ((zlevels[k] >= pts[i0, j0].Z && zlevels[k] < pts[i1, j1].Z || zlevels[k] < pts[i0, j0].Z && zlevels[k] >= pts[i1, j1].Z) && (zlevels[k] >= pts[i1, j1].Z && zlevels[k] < pts[i2, j2].Z || zlevels[k] < pts[i1, j1].Z && zlevels[k] >= pts[i2, j2].Z)) { zratio = (zlevels[k] - pts[i0, j0].Z) / (pts[i1, j1].Z - pts[i0, j0].Z); pta[0] = cs2d.NormalizePoint(new Point(pts[i0, j0].X * (1 - zratio) + pts[i1, j1].X * zratio, pts[i0, j0].Y)); zratio = (zlevels[k] - pts[i1, j1].Z) / (pts[i2, j2].Z - pts[i1, j1].Z); pta[1] = cs2d.NormalizePoint(new Point(pts[i1, j1].X,
CHAPTER 16 ■ SPECIALIZED 3D CHARTS
651
pts[i1, j1].Y * (1 - zratio) + pts[i2, j2].Y * zratio)); DrawLine(cs2d, ds, brush, pta[0], pta[1]); } else if ((zlevels[k] >= pts[i0, j0].Z && zlevels[k] < pts[i2, j2].Z || zlevels[k] < pts[i0, j0].Z && zlevels[k] >= pts[i2, j2].Z) && (zlevels[k] >= pts[i1, j1].Z && zlevels[k] < pts[i2, j2].Z || zlevels[k] < pts[i1, j1].Z && zlevels[k] >= pts[i2, j2].Z)) { zratio = (zlevels[k] - pts[i0, j0].Z) / (pts[i2, j2].Z - pts[i0, j0].Z); pta[0] = cs2d.NormalizePoint(new Point(pts[i0, j0].X * (1 - zratio) + pts[i2, j2].X * zratio, pts[i0, j0].Y * (1 - zratio) + pts[i2, j2].Y * zratio)); zratio = (zlevels[k] - pts[i1, j1].Z) / (pts[i2, j2].Z - pts[i1, j1].Z); pta[1] = cs2d.NormalizePoint(new Point(pts[i1, j1].X, pts[i1, j1].Y * (1 - zratio) + pts[i2, j2].Y * zratio)); DrawLine(cs2d, ds, brush, pta[0], pta[1]); } else if ((zlevels[k] >= pts[i0, j0].Z && zlevels[k] < pts[i1, j1].Z || zlevels[k] < pts[i0, j0].Z && zlevels[k] >= pts[i1, j1].Z) && (zlevels[k] >= pts[i0, j0].Z && zlevels[k] < pts[i2, j2].Z || zlevels[k] < pts[i0, j0].Z && zlevels[k] >= pts[i2, j2].Z)) { zratio = (zlevels[k] - pts[i0, j0].Z) / (pts[i1, j1].Z - pts[i0, j0].Z); pta[0] = cs2d.NormalizePoint(new Point(pts[i0, j0].X * (1 - zratio) + pts[i1, j1].X * zratio, pts[i0, j0].Y)); zratio = (zlevels[k] - pts[i0, j0].Z) / (pts[i2, j2].Z - pts[i0, j0].Z); pta[1] = cs2d.NormalizePoint(new Point(pts[i0, j0].X * (1 - zratio) + pts[i2, j2].X * zratio, pts[i0, j0].Y * (1 - zratio) + pts[i2, j2].Y * zratio)); DrawLine(cs2d, ds, brush, pta[0], pta[1]); } } } } } private void DrawLine(ChartStyle2D cs2d, DataSeriesSurface ds,

CHAPTER 16 ■ SPECIALIZED 3D CHARTS
652
SolidColorBrush brush, Point pt0, Point pt1) { Line line = new Line(); if (IsLineColorMatch) line.Stroke = brush; else line.Stroke = ds.LineColor; line.StrokeThickness = ds.LineThickness; line.X1 = pt0.X; line.Y1 = pt0.Y; line.X2 = pt1.X; line.Y2 = pt1.Y; cs2d.Chart2dCanvas.Children.Add(line); }
In this method, there are several parameters that can be used to control the appearance of the contour chart. The most important parameter is the NumberContours property, which determines how many contour lines will be drawn. You can also specify the IsLineColorMatch property to determine the kind of color that will be used to draw the contour lines. If this property is set to be false, a single color (specified by the LineColor property) is used to draw the contour. On the other hand, if this property is set to be true, a colormapped color is used, depending on the values of the contour levels.
Testing Contour Charts Add a new WPF window to the project and name it Contour. The XAML file is the same as that used earlier in testing the X-Y color chart. The only difference is the AddChart method in the code-behind file:
private void AddChart() { chartCanvas.Children.Clear(); cs = new ChartStyle2D(); cs.ChartCanvas = this.chartCanvas; cs.GridlinePattern = ChartStyle.GridlinePatternEnum.Solid; cs.IsColorBar = false; cs.Title = "No Title"; ds = new DataSeriesSurface(); ds.LineColor = Brushes.Black; Utility.Peak3D(cs, ds); d3c = new Draw3DChart(); d3c.Colormap.ColormapBrushType = ColormapBrush.ColormapBrushEnum.Jet; d3c.ChartType = Draw3DChart.ChartTypeEnum.Contour; d3c.IsLineColorMatch = false; d3c.NumberContours = 15; d3c.AddChart(cs, ds); }
Running this example generates the result shown in Figure 16-5.

CHAPTER 16 ■ SPECIALIZED 3D CHARTS
653
Figure 16-5. A contour chart
You can also easily create a contour chart with colormapped contouring lines by changing the following code snippet:
cs.IsColorBar = true; d3c.IsLineColorMatch = true;
This produces the colormapped contour chart shown in Figure 16-6.
Figure 16-6. A colormapped contour chart

CHAPTER 16 ■ SPECIALIZED 3D CHARTS
654
Combination Charts Combination charts are a useful way to exploit the informative properties of various types of graphics charting methods. In this section, we’ll show you a few examples of typical combination charts, including filled contour, mesh contour, surface contour, and surface-filled contour charts. By using a similar approach, you can create your own combination charts.
Notice that when we discussed X-Y color charts and contour charts in previous sections, we drew these charts directly on the 2D computer screen. However, in order to combine a contour or X-Y color chart with a 3D surface chart, we must modify the original 2D X-Y color chart and contour chart to be consistent with the 3D coordinate system the surface chart uses.
X-Y Charts in 3D In creating original 2D X-Y charts, we transform the world coordinates to device coordinates by using the X and Y components of the data points directly and neglecting the Z component. In order to add the 3D feature to X-Y color charts, you must perform an orthogonal projection transformation on the X and Y components of the data points at a constant Z value (the projection plane where the X-Y color chart is drawn) using the transformation matrix defined in the Utility class. The AddXYColor3D method in the Draw3DChart class is implemented in this manner:
private void AddXYColor3D(ChartStyle cs, DataSeriesSurface ds) { Point3D[,] pts = ds.PointArray; Point3D[,] pts1 = new Point3D[pts.GetLength(0), pts.GetLength(1)]; Matrix3D m = Utility.AzimuthElevation(cs.Elevation, cs.Azimuth); Polygon plg = new Polygon(); // Find the minumum and maximum z values: double zmin = ds.ZDataMin(); double zmax = ds.ZDataMax(); // Perform transformation on points: for (int i = 0; i < pts.GetLength(0); i++) { for (int j = 0; j < pts.GetLength(1); j++) { pts1[i, j] = new Point3D(pts[i, j].X, pts[i, j].Y, cs.Zmin); pts1[i, j] = cs.Normalize3D(m, pts1[i, j]); } } // Draw surface on the XY plane: for (int i = 0; i < pts.GetLength(0) - 1; i++) { for (int j = 0; j < pts.GetLength(1) - 1; j++) { plg = new Polygon(); plg.Points.Add(new Point(pts1[i, j].X, pts1[i, j].Y)); plg.Points.Add(new Point(pts1[i, j + 1].X, pts1[i, j + 1].Y)); plg.Points.Add(new Point(pts1[i + 1, j + 1].X, pts1[i + 1, j + 1].Y)); plg.Points.Add(new Point(pts1[i + 1, j].X, pts1[i + 1, j].Y)); plg.StrokeThickness = ds.LineThickness;

CHAPTER 16 ■ SPECIALIZED 3D CHARTS
655
plg.Fill = GetBrush(pts[i, j].Z, zmin, zmax); plg.Stroke = GetBrush(pts[i, j].Z, zmin, zmax); cs.ChartCanvas.Children.Add(plg); } } }
You can see that the transformation is indeed performed on the data points at a constant Z = zmin using the elevation-azimuth transform matrix. This indicates that we’ll draw the X-Y color chart on the Z = zmin plane.
Contour Charts in 3D Similarly, in order to combine the contour chart with 3D surface charts, you must create a contour chart consistent with the 3D coordinate system. The following listing is for the AddContour3D method in the Draw3DChart class:
private void AddContour3D(ChartStyle cs, DataSeriesSurface ds) { Point3D[] pta = new Point3D[2]; Point3D[,] pts = ds.PointArray; Matrix3D m = Utility.AzimuthElevation(cs.Elevation, cs.Azimuth); SolidColorBrush brush = Brushes.Black; // Find the minumum and maximum z values: double zmin = ds.ZDataMin(); double zmax = ds.ZDataMax(); double[] zlevels = new Double[NumberContours]; for (int i = 0; i < NumberContours; i++) zlevels[i] = zmin + i * (zmax - zmin) / (NumberContours - 1); int i0, i1, i2, j0, j1, j2; double zratio = 1; // Draw contour on the XY plane: for (int i = 0; i < pts.GetLength(0) - 1; i++) { for (int j = 0; j < pts.GetLength(1) - 1; j++) { if (IsColormap && ChartType != ChartTypeEnum.FillContour) brush = GetBrush(pts[i, j].Z, zmin, zmax); for (int k = 0; k < numberContours; k++) { // Left triangle: i0 = i; j0 = j; i1 = i; j1 = j + 1; i2 = i + 1; j2 = j + 1; if ((zlevels[k] >= pts[i0, j0].Z && zlevels[k] < pts[i1, j1].Z || zlevels[k] < pts[i0, j0].Z && zlevels[k] >= pts[i1, j1].Z) &&

CHAPTER 16 ■ SPECIALIZED 3D CHARTS
656
(zlevels[k] >= pts[i1, j1].Z && zlevels[k] < pts[i2, j2].Z || zlevels[k] < pts[i1, j1].Z && zlevels[k] >= pts[i2, j2].Z)) { zratio = (zlevels[k] - pts[i0, j0].Z) / (pts[i1, j1].Z - pts[i0, j0].Z); pta[0] = new Point3D(pts[i0, j0].X, (1 - zratio) * pts[i0, j0].Y + zratio * pts[i1, j1].Y, cs.Zmin); zratio = (zlevels[k] - pts[i1, j1].Z) / (pts[i2, j2].Z - pts[i1, j1].Z); pta[1] = new Point3D((1 - zratio) * pts[i1, j1].X + zratio * pts[i2, j2].X, pts[i1, j1].Y, cs.Zmin); pta[0] = cs.Normalize3D(m, pta[0]); pta[1] = cs.Normalize3D(m, pta[1]); DrawLine3D(cs, ds, brush, new Point(pta[0].X, pta[0].Y), new Point(pta[1].X, pta[1].Y)); } else if ((zlevels[k] >= pts[i0, j0].Z && zlevels[k] < pts[i2, j2].Z || zlevels[k] < pts[i0, j0].Z && zlevels[k] >= pts[i2, j2].Z) && (zlevels[k] >= pts[i1, j1].Z && zlevels[k] < pts[i2, j2].Z || zlevels[k] < pts[i1, j1].Z && zlevels[k] >= pts[i2, j2].Z)) { zratio = (zlevels[k] - pts[i0, j0].Z) / (pts[i2, j2].Z - pts[i0, j0].Z); pta[0] = new Point3D((1 - zratio) * pts[i0, j0].X + zratio * pts[i2, j2].X, (1 - zratio) * pts[i0, j0].Y + zratio * pts[i2, j2].Y, cs.Zmin); zratio = (zlevels[k] - pts[i1, j1].Z) / (pts[i2, j2].Z - pts[i1, j1].Z); pta[1] = new Point3D((1 - zratio) * pts[i1, j1].X + zratio * pts[i2, j2].X, pts[i1, j1].Y, cs.Zmin); pta[0] = cs.Normalize3D(m, pta[0]); pta[1] = cs.Normalize3D(m, pta[1]); DrawLine3D(cs, ds, brush, new Point(pta[0].X, pta[0].Y), new Point(pta[1].X, pta[1].Y)); } else if ((zlevels[k] >= pts[i0, j0].Z && zlevels[k] < pts[i1, j1].Z || zlevels[k] < pts[i0, j0].Z && zlevels[k] >= pts[i1, j1].Z) && (zlevels[k] >= pts[i0, j0].Z && zlevels[k] < pts[i2, j2].Z || zlevels[k] < pts[i0, j0].Z && zlevels[k] >= pts[i2, j2].Z)) { zratio = (zlevels[k] - pts[i0, j0].Z) / (pts[i1, j1].Z - pts[i0, j0].Z); pta[0] = new Point3D(pts[i0, j0].X, (1 - zratio) * pts[i0, j0].Y

CHAPTER 16 ■ SPECIALIZED 3D CHARTS
657
+ zratio * pts[i1, j1].Y, cs.Zmin); zratio = (zlevels[k] - pts[i0, j0].Z) / (pts[i2, j2].Z - pts[i0, j0].Z); pta[1] = new Point3D(pts[i0, j0].X * (1 - zratio) + pts[i2, j2].X * zratio, pts[i0, j0].Y * (1 - zratio) + pts[i2, j2].Y * zratio, cs.Zmin); pta[0] = cs.Normalize3D(m, pta[0]); pta[1] = cs.Normalize3D(m, pta[1]); DrawLine3D(cs, ds, brush, new Point(pta[0].X, pta[0].Y), new Point(pta[1].X, pta[1].Y)); } // right triangle: i0 = i; j0 = j; i1 = i + 1; j1 = j; i2 = i + 1; j2 = j + 1; if ((zlevels[k] >= pts[i0, j0].Z && zlevels[k] < pts[i1, j1].Z || zlevels[k] < pts[i0, j0].Z && zlevels[k] >= pts[i1, j1].Z) && (zlevels[k] >= pts[i1, j1].Z && zlevels[k] < pts[i2, j2].Z || zlevels[k] < pts[i1, j1].Z && zlevels[k] >= pts[i2, j2].Z)) { zratio = (zlevels[k] - pts[i0, j0].Z) / (pts[i1, j1].Z - pts[i0, j0].Z); pta[0] = new Point3D(pts[i0, j0].X * (1 - zratio) + pts[i1, j1].X * zratio, pts[i0, j0].Y, cs.Zmin); zratio = (zlevels[k] - pts[i1, j1].Z) / (pts[i2, j2].Z - pts[i1, j1].Z); pta[1] = new Point3D(pts[i1, j1].X, pts[i1, j1].Y * (1 - zratio) + pts[i2, j2].Y * zratio, cs.Zmin); pta[0] = cs.Normalize3D(m, pta[0]); pta[1] = cs.Normalize3D(m, pta[1]); DrawLine3D(cs, ds, brush, new Point(pta[0].X, pta[0].Y), new Point(pta[1].X, pta[1].Y)); } else if ((zlevels[k] >= pts[i0, j0].Z && zlevels[k] < pts[i2, j2].Z || zlevels[k] < pts[i0, j0].Z && zlevels[k] >= pts[i2, j2].Z) && (zlevels[k] >= pts[i1, j1].Z && zlevels[k] < pts[i2, j2].Z || zlevels[k] < pts[i1, j1].Z && zlevels[k] >= pts[i2, j2].Z)) { zratio = (zlevels[k] - pts[i0, j0].Z) / (pts[i2, j2].Z - pts[i0, j0].Z); pta[0] = new Point3D(pts[i0, j0].X * (1 - zratio) +

CHAPTER 16 ■ SPECIALIZED 3D CHARTS
658
pts[i2, j2].X * zratio, pts[i0, j0].Y * (1 - zratio) + pts[i2, j2].Y * zratio, cs.Zmin); zratio = (zlevels[k] - pts[i1, j1].Z) / (pts[i2, j2].Z - pts[i1, j1].Z); pta[1] = new Point3D(pts[i1, j1].X, pts[i1, j1].Y * (1 - zratio) + pts[i2, j2].Y * zratio, cs.Zmin); pta[0] = cs.Normalize3D(m, pta[0]); pta[1] = cs.Normalize3D(m, pta[1]); DrawLine3D(cs, ds, brush, new Point(pta[0].X, pta[0].Y), new Point(pta[1].X, pta[1].Y)); } else if ((zlevels[k] >= pts[i0, j0].Z && zlevels[k] < pts[i1, j1].Z || zlevels[k] < pts[i0, j0].Z && zlevels[k] >= pts[i1, j1].Z) && (zlevels[k] >= pts[i0, j0].Z && zlevels[k] < pts[i2, j2].Z || zlevels[k] < pts[i0, j0].Z && zlevels[k] >= pts[i2, j2].Z)) { zratio = (zlevels[k] - pts[i0, j0].Z) / (pts[i1, j1].Z - pts[i0, j0].Z); pta[0] = new Point3D(pts[i0, j0].X * (1 - zratio) + pts[i1, j1].X * zratio, pts[i0, j0].Y, cs.Zmin); zratio = (zlevels[k] - pts[i0, j0].Z) / (pts[i2, j2].Z - pts[i0, j0].Z); pta[1] = new Point3D(pts[i0, j0].X * (1 - zratio) + pts[i2, j2].X * zratio, pts[i0, j0].Y * (1 - zratio) + pts[i2, j2].Y * zratio, cs.Zmin); pta[0] = cs.Normalize3D(m, pta[0]); pta[1] = cs.Normalize3D(m, pta[1]); DrawLine3D(cs, ds, brush, new Point(pta[0].X, pta[0].Y), new Point(pta[1].X, pta[1].Y)); } } } } } private void DrawLine3D(ChartStyle cs, DataSeriesSurface ds, SolidColorBrush brush, Point pt0, Point pt1) { Line line = new Line(); line.Stroke = ds.LineColor; if (IsLineColorMatch) line.Stroke = brush; line.StrokeThickness = ds.LineThickness; line.X1 = pt0.X; line.Y1 = pt0.Y; line.X2 = pt1.X; line.Y2 = pt1.Y; cs.ChartCanvas.Children.Add(line); }
CHAPTER 16 ■ SPECIALIZED 3D CHARTS
659
This method draws the contour chart on the Z = zmin plane.
Filled Contour Charts Here, I’ll show you how to create a simple filled contour chart by combining a contour chart with an X-Y color chart, as implemented previously in the AddChart method of the Draw3DChart class:
case ChartTypeEnum.FillContour: cs.AddChartStyle2D(this); if (cs.IsColorBar && IsColormap) cs.AddColorBar2D(cs, ds, this, ds.ZDataMin(), ds.ZDataMax()); AddXYColor(cs, ds); AddContour(cs, ds); break;
You can see from this code snippet that we draw first an X-Y color chart and then a contour chart. You can test this by adding a new WPF Windows application, named FilledContour, to the project. The XAML file is the same as that used to test the X-Y color chart. Here is the code-behind files:
using System; using System.Windows; using System.Windows.Controls; using System.Windows.Media; using System.Windows.Media.Imaging; namespace Specialized3DChart { public partial class FilledContour : Window { private ChartStyle2D cs; private DataSeriesSurface ds; private Draw3DChart d3c; public FilledContour() { InitializeComponent(); } private void chartGrid_SizeChanged(object sender, SizeChangedEventArgs e) { chartCanvas.Width = chartGrid.ActualWidth; chartCanvas.Height = chartGrid.ActualHeight; AddChart(); } private void AddChart() { chartCanvas.Children.Clear(); cs = new ChartStyle2D(); cs.ChartCanvas = this.chartCanvas; cs.GridlinePattern = ChartStyle.GridlinePatternEnum.Solid; cs.IsColorBar = true; cs.Title = "No Title";
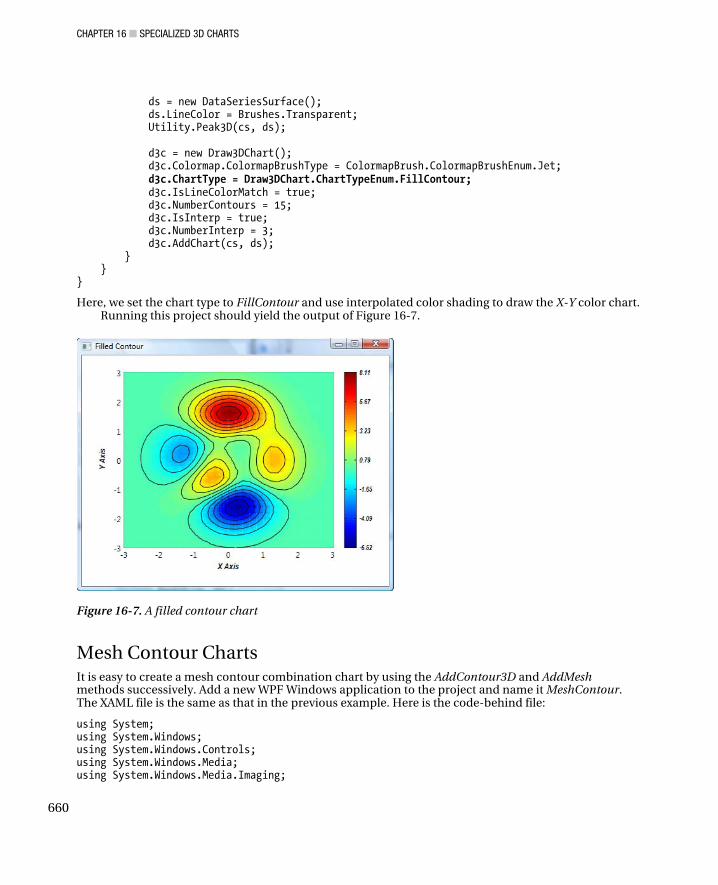
CHAPTER 16 ■ SPECIALIZED 3D CHARTS
660
ds = new DataSeriesSurface(); ds.LineColor = Brushes.Transparent; Utility.Peak3D(cs, ds); d3c = new Draw3DChart(); d3c.Colormap.ColormapBrushType = ColormapBrush.ColormapBrushEnum.Jet; d3c.ChartType = Draw3DChart.ChartTypeEnum.FillContour; d3c.IsLineColorMatch = true; d3c.NumberContours = 15; d3c.IsInterp = true; d3c.NumberInterp = 3; d3c.AddChart(cs, ds); } } }
Here, we set the chart type to FillContour and use interpolated color shading to draw the X-Y color chart. Running this project should yield the output of Figure 16-7.
Figure 16-7. A filled contour chart
Mesh Contour Charts It is easy to create a mesh contour combination chart by using the AddContour3D and AddMesh methods successively. Add a new WPF Windows application to the project and name it MeshContour. The XAML file is the same as that in the previous example. Here is the code-behind file:
using System; using System.Windows; using System.Windows.Controls; using System.Windows.Media; using System.Windows.Media.Imaging;

CHAPTER 16 ■ SPECIALIZED 3D CHARTS
661
namespace Specialized3DChart { public partial class MeshContour : Window { private ChartStyle2D cs; private DataSeriesSurface ds; private Draw3DChart d3c; public MeshContour() { InitializeComponent(); } private void chartGrid_SizeChanged(object sender, SizeChangedEventArgs e) { chartCanvas.Width = chartGrid.ActualWidth; chartCanvas.Height = chartGrid.ActualHeight; AddChart(); } private void AddChart() { chartCanvas.Children.Clear(); cs = new ChartStyle2D(); cs.ChartCanvas = this.chartCanvas; cs.GridlinePattern = ChartStyle.GridlinePatternEnum.Solid; cs.IsColorBar = true; cs.Title = "No Title"; ds = new DataSeriesSurface(); Utility.Peak3D(cs, ds); d3c = new Draw3DChart(); d3c.Colormap.ColormapBrushType = ColormapBrush.ColormapBrushEnum.Jet; d3c.ChartType = Draw3DChart.ChartTypeEnum.MeshContour3D; d3c.IsLineColorMatch = true; d3c.NumberContours = 15; d3c.AddChart(cs, ds); } } }
Running this application produces Figure 16-8.

CHAPTER 16 ■ SPECIALIZED 3D CHARTS
662
Figure 16-8. A mesh contour chart
Surface Contour Charts Similarly, you can easily create a surface contour chart. You can use the same XAML and code-behind code as in the previous example, except you must set the chart type to SurfaceContour3D:
d3c.ChartType = Draw3DChart.ChartTypeEnum.SurfaceContour3D;
This creates the result shown in Figure 16-9.
Figure 16-9. A surface contour chart

CHAPTER 16 ■ SPECIALIZED 3D CHARTS
663
Surface-Filled Contour Charts You can create a surface-filled contour chart by combining a surface chart with an X-Y color chart and a 3D contour chart. You can use the same XAML and code-behind code as in the previous example, except now you set the chart type to SurfaceFillContour3D:
d3c.ChartType = Draw3DChart.ChartTypeEnum.SurfaceFillContour3D;
This creates the result shown in Figure 16-10.
Figure 16-10. A surface-filled contour chart
3D Bar Charts Using the same data series as when we created the mesh and surface charts, we can also create 3D bar charts. A 3D bar can be constructed in 3D space, as shown in Figure 16-11.

CHAPTER 16 ■ SPECIALIZED 3D CHARTS
664
Figure 16-11. A 3D bar defined in 3D space
Suppose there is a data point (x, y, z) in 3D space. We can define a 3D bar around this point by specifying three parameters: zorigin, xlength, and ylength. The parameter zorigin defines the Z = zorigin plane from which the 3D bar is filled; the two other parameters set the size of the 3D bar in the X and Y directions. These length parameters are measured as a percentage of the total amount of space available. In this book, we set these parameters to be in the range [0.1, 0.5]. If you set xlength = ylength = 0.5, you’ll obtain the so-called histogram bar chart; namely, each bar fills the space up to its adjoining bars.
Implementation First we need to add a Bar3DStyle class to the current project:
using System; using System.Collections.Generic; using System.Windows; using System.Windows.Controls; using System.Windows.Media; using System.Windows.Media.Media3D; using System.Windows.Shapes; namespace Specialized3DChart { public class Bar3DStyle : DataSeriesSurface { private double xLength = 0.5; private double yLength = 0.5; private double zOrigin = 0; private bool isBarSingleColor = true;

CHAPTER 16 ■ SPECIALIZED 3D CHARTS
665
public bool IsBarSingleColor { get { return isBarSingleColor; } set { isBarSingleColor = value; } } public double ZOrigin { get { return zOrigin; } set { zOrigin = value; } } public double YLength { get { return yLength; } set { yLength = value; } } public double XLength { get { return xLength; } set { xLength = value; } } } }
This class is very simple. We first define the field members and their corresponding public properties, which allow you to control the appearance and size of the 3D bars. The bool property IsBarSingleColor lets you specify whether the bars are drawn using a single color or a colormap. Next, we need to create an AddBar3D method in the Draw3DChart class:
public void AddBar3D(ChartStyle2D cs, Bar3DStyle bs) { Matrix3D m = Utility.AzimuthElevation(cs.Elevation, cs.Azimuth); Point[] pta = new Point[4]; Point3D[,] pts = bs.PointArray; // Find the minumum and maximum z values: double zmin = bs.ZDataMin(); double zmax = bs.ZDataMax(); // Check parameters: double xlength = bs.XLength; if (xlength <= 0) xlength = 0.1 * bs.XSpacing; else if (xlength > 0.5) xlength = 0.5 * bs.XSpacing; else xlength = bs.XLength * bs.XSpacing; double ylength = bs.YLength; if (ylength <= 0) ylength = 0.1 * bs.YSpacing;

CHAPTER 16 ■ SPECIALIZED 3D CHARTS
666
else if (ylength > 0.5) ylength = 0.5 * bs.YSpacing; else ylength = bs.YLength * bs.YSpacing; double zorigin = bs.ZOrigin; // Draw 3D bars: for (int i = 0; i < pts.GetLength(0) - 1; i++) { for (int j = 0; j < pts.GetLength(1) - 1; j++) { int ii = i; int jj = j; if (cs.Azimuth >= -180 && cs.Azimuth < -90) { ii = pts.GetLength(0) - 2 - i; jj = j; } else if (cs.Azimuth >= -90 && cs.Azimuth < 0) { ii = pts.GetLength(0) - 2 - i; jj = pts.GetLength(1) - 2 - j; } else if (cs.Azimuth >= 0 && cs.Azimuth < 90) { ii = i; jj = pts.GetLength(1) - 2 - j; } else if (cs.Azimuth >= 90 && cs.Azimuth <= 180) { ii = i; jj = j; } DrawBar(cs, bs, m, pts[ii, jj], xlength, ylength, zorigin, zmax, zmin); } } if (cs.IsColorBar && IsColormap) { AddColorBar(cs, bs, zmin, zmax); } }
In this method, we first examine whether the parameters provided by the user are in the right ranges. Then we examine the order of drawing the bars according to the variations of the elevation and azimuth angles, making sure that we always draw the bars in back-to-front order (the Z-order approach). As mentioned previously, when drawn in this order, a bar can obscure only the bars that have been drawn before it. When the program draws a bar, it fills it so that it covers up any bars that it should obscure. Finally, this method calls another method, DrawBar, which performs the actual bar-drawing task:
private void DrawBar(ChartStyle2D cs, Bar3DStyle bs, Matrix3D m, Point3D pt, double xlength, double ylength, double zorign, double zmax, double zmin) {

CHAPTER 16 ■ SPECIALIZED 3D CHARTS
667
SolidColorBrush lineBrush = (SolidColorBrush)bs.LineColor; SolidColorBrush fillBrush = GetBrush(pt.Z, zmin, zmax); Point3D[] pts = new Point3D[8]; Point3D[] pts1 = new Point3D[8]; Point3D[] pt3 = new Point3D[4]; Point[] pta = new Point[4]; pts[0] = new Point3D(pt.X - xlength, pt.Y - ylength, zorign); pts[1] = new Point3D(pt.X - xlength, pt.Y + ylength, zorign); pts[2] = new Point3D(pt.X + xlength, pt.Y + ylength, zorign); pts[3] = new Point3D(pt.X + xlength, pt.Y - ylength, zorign); pts[4] = new Point3D(pt.X + xlength, pt.Y - ylength, pt.Z); pts[5] = new Point3D(pt.X + xlength, pt.Y + ylength, pt.Z); pts[6] = new Point3D(pt.X - xlength, pt.Y + ylength, pt.Z); pts[7] = new Point3D(pt.X - xlength, pt.Y - ylength, pt.Z); for (int i = 0; i < pts.Length; i++) { pts1[i] = new Point3D(pts[i].X, pts[i].Y, pts[i].Z); pts[i] = cs.Normalize3D(m, pts[i]); } int[] nconfigs = new int[8]; if (IsBarSingleColor) { pta[0] = new Point(pts[4].X, pts[4].Y); pta[1] = new Point(pts[5].X, pts[5].Y); pta[2] = new Point(pts[6].X, pts[6].Y); pta[3] = new Point(pts[7].X, pts[7].Y); DrawPolygon(cs, bs, pta, fillBrush,lineBrush); if (cs.Azimuth >= -180 && cs.Azimuth < -90) nconfigs = new int[8] { 1, 2, 5, 6, 1, 0, 7, 6 }; else if (cs.Azimuth >= -90 && cs.Azimuth < 0) nconfigs = new int[8] { 1, 0, 7, 6, 0, 3, 4, 7 }; else if (cs.Azimuth >= 0 && cs.Azimuth < 90) nconfigs = new int[8] { 0, 3, 4, 7, 2, 3, 4, 5 }; else if (cs.Azimuth >= 90 && cs.Azimuth < 180) nconfigs = new int[8] { 2, 3, 4, 5, 1, 2, 5, 6 }; pta[0] = new Point(pts[nconfigs[0]].X, pts[nconfigs[0]].Y); pta[1] = new Point(pts[nconfigs[1]].X, pts[nconfigs[1]].Y); pta[2] = new Point(pts[nconfigs[2]].X, pts[nconfigs[2]].Y); pta[3] = new Point(pts[nconfigs[3]].X, pts[nconfigs[3]].Y); DrawPolygon(cs, bs, pta, fillBrush, lineBrush); pta[0] = new Point(pts[nconfigs[4]].X, pts[nconfigs[4]].Y); pta[1] = new Point(pts[nconfigs[5]].X, pts[nconfigs[5]].Y); pta[2] = new Point(pts[nconfigs[6]].X, pts[nconfigs[6]].Y); pta[3] = new Point(pts[nconfigs[7]].X, pts[nconfigs[7]].Y); DrawPolygon(cs, bs, pta, fillBrush, lineBrush); } else if (!IsBarSingleColor && IsColormap) { pta[0] = new Point(pts[4].X, pts[4].Y);
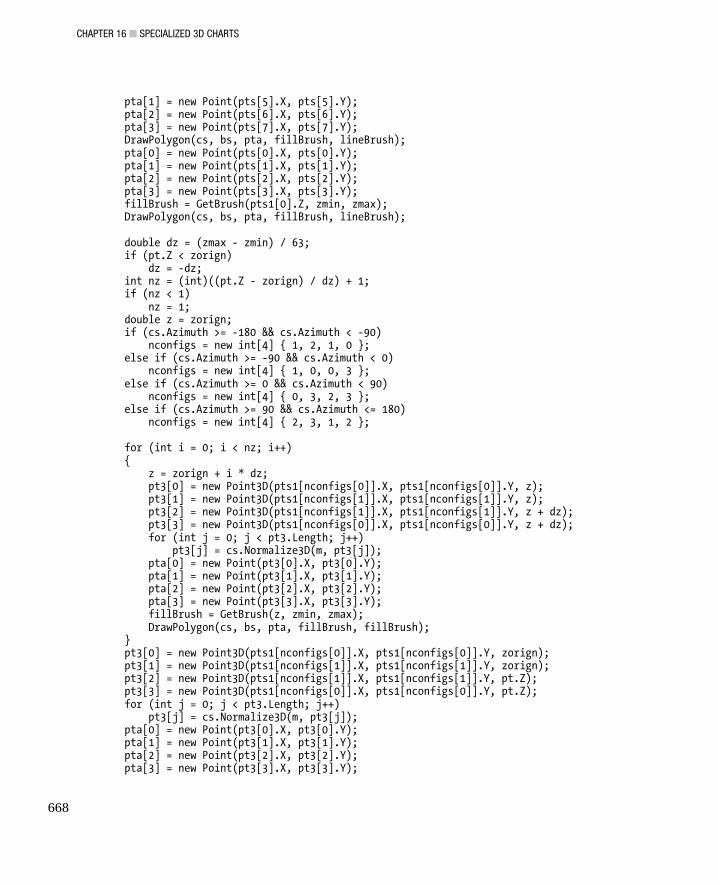
CHAPTER 16 ■ SPECIALIZED 3D CHARTS
668
pta[1] = new Point(pts[5].X, pts[5].Y); pta[2] = new Point(pts[6].X, pts[6].Y); pta[3] = new Point(pts[7].X, pts[7].Y); DrawPolygon(cs, bs, pta, fillBrush, lineBrush); pta[0] = new Point(pts[0].X, pts[0].Y); pta[1] = new Point(pts[1].X, pts[1].Y); pta[2] = new Point(pts[2].X, pts[2].Y); pta[3] = new Point(pts[3].X, pts[3].Y); fillBrush = GetBrush(pts1[0].Z, zmin, zmax); DrawPolygon(cs, bs, pta, fillBrush, lineBrush); double dz = (zmax - zmin) / 63; if (pt.Z < zorign) dz = -dz; int nz = (int)((pt.Z - zorign) / dz) + 1; if (nz < 1) nz = 1; double z = zorign; if (cs.Azimuth >= -180 && cs.Azimuth < -90) nconfigs = new int[4] { 1, 2, 1, 0 }; else if (cs.Azimuth >= -90 && cs.Azimuth < 0) nconfigs = new int[4] { 1, 0, 0, 3 }; else if (cs.Azimuth >= 0 && cs.Azimuth < 90) nconfigs = new int[4] { 0, 3, 2, 3 }; else if (cs.Azimuth >= 90 && cs.Azimuth <= 180) nconfigs = new int[4] { 2, 3, 1, 2 }; for (int i = 0; i < nz; i++) { z = zorign + i * dz; pt3[0] = new Point3D(pts1[nconfigs[0]].X, pts1[nconfigs[0]].Y, z); pt3[1] = new Point3D(pts1[nconfigs[1]].X, pts1[nconfigs[1]].Y, z); pt3[2] = new Point3D(pts1[nconfigs[1]].X, pts1[nconfigs[1]].Y, z + dz); pt3[3] = new Point3D(pts1[nconfigs[0]].X, pts1[nconfigs[0]].Y, z + dz); for (int j = 0; j < pt3.Length; j++) pt3[j] = cs.Normalize3D(m, pt3[j]); pta[0] = new Point(pt3[0].X, pt3[0].Y); pta[1] = new Point(pt3[1].X, pt3[1].Y); pta[2] = new Point(pt3[2].X, pt3[2].Y); pta[3] = new Point(pt3[3].X, pt3[3].Y); fillBrush = GetBrush(z, zmin, zmax); DrawPolygon(cs, bs, pta, fillBrush, fillBrush); } pt3[0] = new Point3D(pts1[nconfigs[0]].X, pts1[nconfigs[0]].Y, zorign); pt3[1] = new Point3D(pts1[nconfigs[1]].X, pts1[nconfigs[1]].Y, zorign); pt3[2] = new Point3D(pts1[nconfigs[1]].X, pts1[nconfigs[1]].Y, pt.Z); pt3[3] = new Point3D(pts1[nconfigs[0]].X, pts1[nconfigs[0]].Y, pt.Z); for (int j = 0; j < pt3.Length; j++) pt3[j] = cs.Normalize3D(m, pt3[j]); pta[0] = new Point(pt3[0].X, pt3[0].Y); pta[1] = new Point(pt3[1].X, pt3[1].Y); pta[2] = new Point(pt3[2].X, pt3[2].Y); pta[3] = new Point(pt3[3].X, pt3[3].Y);

CHAPTER 16 ■ SPECIALIZED 3D CHARTS
669
fillBrush = Brushes.Transparent; DrawPolygon(cs, bs, pta, fillBrush, lineBrush); for (int i = 0; i < nz; i++) { z = zorign + i * dz; pt3[0] = new Point3D(pts1[nconfigs[2]].X, pts1[nconfigs[2]].Y, z); pt3[1] = new Point3D(pts1[nconfigs[3]].X, pts1[nconfigs[3]].Y, z); pt3[2] = new Point3D(pts1[nconfigs[3]].X, pts1[nconfigs[3]].Y, z + dz); pt3[3] = new Point3D(pts1[nconfigs[2]].X, pts1[nconfigs[2]].Y, z + dz); for (int j = 0; j < pt3.Length; j++) pt3[j] = cs.Normalize3D(m, pt3[j]); pta[0] = new Point(pt3[0].X, pt3[0].Y); pta[1] = new Point(pt3[1].X, pt3[1].Y); pta[2] = new Point(pt3[2].X, pt3[2].Y); pta[3] = new Point(pt3[3].X, pt3[3].Y); fillBrush = GetBrush(z, zmin, zmax); DrawPolygon(cs, bs, pta, fillBrush, fillBrush); } pt3[0] = new Point3D(pts1[nconfigs[2]].X, pts1[nconfigs[2]].Y, zorign); pt3[1] = new Point3D(pts1[nconfigs[3]].X, pts1[nconfigs[3]].Y, zorign); pt3[2] = new Point3D(pts1[nconfigs[3]].X, pts1[nconfigs[3]].Y, pt.Z); pt3[3] = new Point3D(pts1[nconfigs[2]].X, pts1[nconfigs[2]].Y, pt.Z); for (int j = 0; j < pt3.Length; j++) pt3[j] = cs.Normalize3D(m, pt3[j]); pta[0] = new Point(pt3[0].X, pt3[0].Y); pta[1] = new Point(pt3[1].X, pt3[1].Y); pta[2] = new Point(pt3[2].X, pt3[2].Y); pta[3] = new Point(pt3[3].X, pt3[3].Y); fillBrush = Brushes.Transparent; DrawPolygon(cs, bs, pta, fillBrush, lineBrush); } } private void DrawPolygon(ChartStyle2D cs, Bar3DStyle bs, Point[] pts, SolidColorBrush fillBrush, SolidColorBrush lineBrush) { Polygon plg = new Polygon(); plg.Stroke = lineBrush; plg.StrokeThickness = bs.LineThickness; plg.Fill = fillBrush; for (int i = 0; i < pts.Length; i++) plg.Points.Add(pts[i]); cs.ChartCanvas.Children.Add(plg); }
In the DrawBar method, we first create eight vertices of a 3D bar using a data point and the xlength, ylength, and zorigin parameters. We then perform an orthogonal projection transformation on these vertices using the azimuth-elevation matrix. Next, we consider two cases separately: drawing bars using a single color or a colormap. For each case, we examine which faces should be drawn, depending on the elevation and azimuth angles. In the case of single-color shading, the color of a bar is determined by the Z value of the input point; in the case of a colormap, each bar is colormapped linearly from the zorigin to the Z value of its input point.

CHAPTER 16 ■ SPECIALIZED 3D CHARTS
670
Testing 3D Bar Charts In this section, I’ll show how to create a 3D bar chart using the code implemented in the previous section. Add a new WPF window to the current project and name it BarChart3D. The XAML file is similar to that used in creating the contour chart, except for changing the window title from “Contour Chart” to “3D Bar Chart.” Here is the code-behind file:
using System; using System.Windows; using System.Windows.Controls; using System.Windows.Media; using System.Windows.Media.Imaging; namespace Specialized3DChart { public partial class BarChart3D : Window { private ChartStyle2D cs; private Bar3DStyle ds; private Draw3DChart d3c; public BarChart3D() { InitializeComponent(); } private void chartGrid_SizeChanged(object sender, SizeChangedEventArgs e) { chartCanvas.Width = chartGrid.ActualWidth; chartCanvas.Height = chartGrid.ActualHeight; AddChart(); } private void AddChart() { chartCanvas.Children.Clear(); cs = new ChartStyle2D(); cs.ChartCanvas = this.chartCanvas; cs.GridlinePattern = ChartStyle.GridlinePatternEnum.Solid; cs.IsColorBar = true; cs.Title = "No Title"; ds = new Bar3DStyle(); ds.LineColor = Brushes.Black; ds.ZOrigin = cs.Zmin; ds.XLength = 0.6; ds.YLength = 0.6; Utility.Peak3D(cs, ds); d3c = new Draw3DChart(); d3c.Colormap.ColormapBrushType = ColormapBrush.ColormapBrushEnum.Jet; d3c.IsBarSingleColor = true; d3c.IsColormap = true; cs.AddChartStyle(); d3c.AddBar3D(cs, ds);

CHAPTER 16 ■ SPECIALIZED 3D CHARTS
671
} } }
Here, we set ZOrigin = cs.Zmin. The bars are drawn in a single color because we set the parameter IsBarSingleColor to true. This produces the output of Figure 16-12.
Figure 16-12. A single-colored 3D bar chart
If we set the property IsBarSingleColor to false:
d3c.IsBarSingleColor = false;
we’ll obtain a colormapped 3D bar chart, as shown in Figure 16-13.

CHAPTER 16 ■ SPECIALIZED 3D CHARTS
672
Figure 16-13. A colormapped 3D bar chart
You can also change the ZOrigin property. Figure 16-14 is created by setting the ZOrigin property to zero.
Figure 16-14. A single-colored 3D bar chart with ZOrigin = 0
In this chapter, I demonstrated how to create a variety of 3D specialized charts. Following the same procedures we used to create the 2D chart control, you can easily create a 3D chart control. You can then use this 3D chart control in your own WPF applications.

Index
■ ■ ■
673
■ Numbers .2D
2D-like chart style (3D charts), 633–638 chart controls. See controls, chart (2D) interactive charts. See interactive 2D charts line charts. See line charts, 2D viewports, 72–73
2D transformations homogeneous coordinates. See
homogeneous coordinates reflection of objects, 13 rotation of objects, 13–14 scaling objects, 12–13 translation of objects, 14–15 vectors and points, 11–12. See also vectors
3D coordinate axes, 584–589 tools library, 508 triangle example (3D graphics), 506–507
3D charts 2D-like chart style, 633–638 bar charts. See bar charts (3D) chart controls, 672 chart style in, 578–584 color charts on X-Y plane. See color charts
on X-Y plane combination charts. See combination charts
(3D) contour charts. See contour charts (3D) coordinate axes, 584–589
coordinate system. See 3D coordinate system
Draw3DChart class, 638–641 gridlines, 589–592 labels, 592–599 line charts, 601–605 surface charts. See surface charts, 3D testing Coordinates3D project, 599–600
3D coordinate system azimuth and elevation view system, 571–573 cube, creating, 573–577
3D transformations matrices in WPF, 445 Matrix3D operations, 449–452 Matrix3D structure, 448–449 Matrix3D transforms, 453–456 object transforms. See object transforms
(3D) points and vectors, 445–447 projections. See projections rotation and quaternion notation in 3D,
456–459 views and projections. See views
■ A AddAxes method (ChartStyle class), 585–587 AddBar3D method (Draw3DChart class), 665–
666 AddChart method, 652–653

■ INDEX
674
AddChartStyle method (ChartStyle class), 179, 599
AddColorBar method, 614 AddContour method (Draw3DChart class),
648–652 AddContour3D method (Draw3DChart class),
655–659, 660–661 AddGrids method (ChartStyle class), 589–592 AddHorizontalBarChart method, 227–228 AddHorizontalGroupBarChart method, 231–
232 AddLabels method (ChartStyle class), 593–599 AddMesh method (DrawSurfaceChart class),
614–615, 660–661 AddMeshZ method (DrawSurfaceChart class),
619–622 AddStairstep method, 238 AddSurface method (DrawSurfaceChart class),
626–631 AddTicks method (ChartStyle class), 587–589 AddVerticalBarChart method, 226–228 AddVerticalGroupBarChart method, 228–229 AddWaterfall method (DrawSurfaceChart
class), 623–625 AddXYColor method, 641–644 AddXYColor3D method, 654 algorithms
barycentric interpolation, 402 contour curves (3D), 647–648 cubic spline interpolation, 412 Gauss-Jordan algorithm, 420, 421–422 Lagrange interpolation, 398 linear interpolation, 393–394 Newton divided-difference interpolation,
406–408 AmbientLight class, 504 AmbientLight source, 537, 545 AngleStep property, 259 Append methods, 22, 453 Append rotation, 29, 458 Append scaling, 456 Append Skew transformation, 31 Append translation, 456 Apppend scaling, 28 ArcSegment objects, 99–100, 265
area charts control, creating, 373–375 creating, 253–254 creating with control, 375–377 DataCollection class for, 251–253 DataSeries class for, 250–251 overview, 250
ARGB color values, 124 ArrowLine class, 112–117 automatic ticks, creating charts with, 309–312 axes 3D coordinate, 584–589
AxisAngleRotation3D class, 491 defined (charts), 163 surfaces and, 531
axonometric projections, orthographic, 461 azimuth/elevation view system (3D
coordinates), 571–573
■ B B-spline surfaces (3D), 570 BackMaterial property, 567 backward elimination (Gauss-Jordan
elimination), 420 bar charts
control, creating, 350–352 creating multiple with control, 355–360 creating simple, 224–228 creating with control, 352–355 DataCollection class for, 218–223 DataSeries class for, 217–218 error bar charts. See error bar charts group bar charts, creating, 229–233 overlay bar charts, creating, 233–234 overview, 217 stacked bar charts, creating, 234–235
bar charts (3D) AddBar3D method (Draw3DChart class),
665–666 Bar3DStyle class, 664–665 DrawBar method, 666–669 implementation, 664–669 overview, 663–664 testing, 670–672

■ INDEX
675
barycentric interpolation, 401–405 basis function (linear regression), 427 Bezier curves, 100–102 Bezier surfaces (3D), 570 bilinear color interpolation, 156–161 bilinear interpolation, 647 BilinearCoeff method, 159 BorderColor property (symbols), 198 bracketed functions (algorithms), 407 Brush property, 503 brushes
colormap, testing, 153–155 custom colormap, 147–153 DrawingBrush, 144–147 GetBrush method, 153 LinearGradientBrush, 137–140 RadialGradientBrush, 141–143 SolidColorBrush, 134–136 types of, 134
Button controls (example), 5
■ C Camera and Viewport settings, 467–468 charts
2D line charts. See line charts, 2D 3D. See 3D charts area. See area charts bar. See bar charts ChartStyle class, 166–167 ChartStyle2D class, 633–638 ChartTypeEnum, 641 controls, 2D. See controls, chart (2D) creating with automatic ticks, 309–312 data, retrieving, 326–332 error bar. See error bar charts interactive 2D. See interactive 2D charts panning with mouse, 313–317 pie. See pie charts polar. See polar charts stair-step. See stair-step charts stem. See stem charts X-Y color, 641–644 X-Y color, testing, 644–646 zooming with mouse, 317–322
zooming with mouse wheel, 322–325 chart styles
in 3D charts, 578–584 for pie charts, 265–267 for polar charts, 255–259
classes, Transform. See Transform classes clipping space, 467–468, 471 code-only WPF example, 7–9 color
color bars, 614 color shading, 155–159 ColorConverter class, 124 ColorPickerDialog, 127–134 sRGB and ScRGB systems, 123–124 system colors, 124–127 testing color shading, 159–161 ways to specify, 124
color charts on X-Y plane implementation, 641–644 overview, 641 testing, 644–646
colormaps brushes, custom, 147–153 brushes, testing, 153–155 ColormapBrush property (3D charts), 614 colormapped mesh charts, 618 custom, 147–153
combination charts (3D) contour charts, 655–659 filled contour charts, 659–660 mesh contour charts, 660–661 overview, 654 surface contour charts, 662 surface-filled contour charts, 663 X-Y charts, 654–655
CombinedGeometry class, 95–97 combining transforms, 18–19 composite transforms, 55–56 cone, creating (3D graphics), 523–525 ContainerUIElement3D class, 500 contour charts (3D)
algorithm, 647–648 consistent with 3D coordinate system, 655–
659

■ INDEX
676
filled, 659–660 implementation, 648–652 mesh, 660–661 overview, 647 surface, 662 surface-filled, 663 testing, 652–653
controls, chart (2D) area chart, creating, 373–375 area chart, creating area charts with, 375–
377 bar chart, creating, 350–352 bar chart, creating bar charts with, 352–355 bar chart, creating multiple bar charts with,
355–360 error bar chart, creating, 369–371 error bar chart, creating error bar charts
with, 371–372 line chart control. See line chart controls multiple charts, creating, 385–392 overview, 333 pie chart, creating, 381–383 pie chart, creating pie charts with, 383–385 polar chart, creating, 377–379 polar chart, creating polar charts with, 379–
381 specialized, 350 stair-step chart, creating, 361–363 stair-step chart, creating stair-step charts
with, 364–365 stem chart, creating, 365–367 stem chart, creating stem charts with, 367–
369 controls, chart (3D), 672 coordinate axes and wireframe (3D graphics),
508–510 coordinate systems (2D)
Canvas element, resizing, 76–79 custom coordinates, 62–67 custom coordinates for 2D charts, 67–72 default coordinates, 59–61 viewports, 2D, 72–73 zooming and panning, 73–75
coordinates Coordinates3D project, testing, 599–600
XYZ, 531, 606 CreateSurface method, 536 cubes
creating (3D graphics), 510–514 creating with azimuth and elevation view
matrix, 573–577 cubic spline interpolation, 411–416 curtain charts (3D surface charts), 619–622 curve fitting
defined, 393 Gauss-Jordan algorithm, 420–422 least-squares fit, 422 linear algebraic equations, 419–422 linear regression, 427–432 overview, 419 polynomial fit, 433–436 straight-line fit, 423–426 weighted linear regression, 437–442
CurvePoint object, 554 custom colormap brushes, 147–153 custom coordinates (2D), 62–72 custom shapes. See shapes, custom cylinders, creating (3D graphics), 518–522
■ D dash style lines, 81 data
DataList property, 171, 267 interpolations. See interpolations, data retrieving chart data, 326–332
DataCollection class for area charts, 251–253 for bar charts, 218–223 code listing for, 170–171 for error bar charts, 246–247 for polar charts, 260–261 for stem charts, 241–242 for stock charts, 278–281
DataSeries class for 3D charts, 584 for area charts, 250–251 for bar charts, 217–218 code listing for, 168–169 for error bar charts, 244–246
■ INDEX
677
for stair-step charts, 236–237 for stock charts, 278–281
Direct3D technology in WPF, 1 DirectionalLight class, 504 drawing
Draw3DChart class, 638–641 DrawBar method (3D), 666–669 DrawColorbar method, 154 DrawingBrush, 134, 144–147 DrawLine method (Draw3DChart class),
648–652 DrawSurfaceChart class, creating (3D
charts), 610–614
■ E ellipses
ellipse/rectangle/line geometries, 92–93 and rectangles, 82–86
EMA curves, creating, 299–300 EndPoints, 137–138 error bar charts
control, creating, 369–371 creating, 248–249 creating with control, 371–372 DataCollection class for, 246–247 DataSeries class for, 244–246 overview, 244
events, mouse, 316–317, 321, 331 ExplodeList property, 267 exponential-function fit (curve fitting), 439–442 exponential moving averages (EMAs), 296–300 extruded surfaces
creating, 554–556 ExtrudeSurface class, 551–554 overview, 551
■ F Face class (cubes), 577
■ G geometries
CombinedGeometry class, 95–97 ellipse/rectangle/line geometries, 92–93 GeometryGroup class, 93–95
MeshGeometry3D class, 501 PathGeometry class, 98–102 and paths. See paths and geometries StreamGeometry class, 102–104 surfaces and GeometryModel3D, 503–504
graphics in 2D basic shapes. See shapes in 2D graphics coordinate systems. See coordinate systems
(2D) custom shapes. See shapes, custom hit-testing, 105–107 paths and geometries. See paths and
geometries graphics in 3D
3D graphics objects in WPF, 500–501 3D triangle example, 506–507 basics for creating, 499–500 camera position, 505 cone, creating, 523–525 coordinate axes and wireframe, 508–510 cube, creating, 510–514 cylinder, creating, 518–522 geometry and meshes, 501–503 GeometryModel3D and surfaces, 503–504 lighting model, 504 sphere, creating, 515–518 torus, creating, 526–529 Viewport3D class, 500
Grid control, defined, 4 gridlines
in 3D charts, 589–592 chart style with, 174–179 GridlinePattern property, 179, 343 LineChartWithGridlines example, 179–182
■ H homogeneous coordinates
basics, 15 combining transforms, 18–19 defined, 15 rotation in, 17–18 scaling in, 16–17 translation in, 15–16

■ INDEX
678
■ I ImageBrush, 134 InitializeComponent method, 4 interactive 2D charts
creating with automatic ticks, 309–312 data, retrieving, 326–332 optimal tick spacing, 305–309 overview, 305 panning with mouse, 313–317 zooming with mouse, 317–322 zooming with mouse wheel, 322–325
Interp method, 628–629 interpolated shading, 644 interpolations, data
barycentric interpolation, 401–405 cubic spline interpolation, 411–416 Lagrange interpolation, 398–401 linear interpolation, 393–397 Newton divided-difference interpolation,
406–411 overview, 393
Invert method (matrices), 22, 24, 452 IsHiddenLine property, 536 IsLineColorMatch property, 652 isometric projections, orthographic, 462 IsWireframe property, 536 IsXGrid and IsYGrid bool properties, 179
■ L labels
in 3D charts, 592–599 for axes (line charts), 174, 179 defined, 163 LabelList property, 267
Lagrange interpolation, 398–401 LayoutTransforms, 41 lean string-based syntax, 86 least-squares fit (curve fitting), 422 legends
defined (charts), 163 Legend class, 183–188, 268–269 LineChartWithLegend example, 188–191
lighting model (3D graphics), 504 line charts, 2D
basic chart elements, 163 chart style with gridlines, 174–179 chart style with two Y axes, 205–211 ChartStyle class, 166–167 creating chart with two Y axes, 213–216 creating multiple, 346–349 creating simple, 163–166, 343–346 creating with legend, 188–191 DataCollection class, 170–171 DataSeries class, 168–169 DataSeries/DataCollection with two Y axes,
211–213 labels for axes, 174, 179 Legend class, 183–188 LineChartExample, 171–173 LineChartWith2YAxes example, 213–216 LineChartWithGridlines example, 179–182 symbols displayed in. See symbols (charts) with two Y axes, reason for, 203–204
line charts, 3D creating, 601–605 testing in WPF applications, 604–605
line chart controls basics, 333–335 dependency properties, defining, 335–342 using in WPF applications, 343
linear algebraic equations (curve fitting), 419–422
linear interpolation, 393–397 linear regression (curve fitting), 427–432 LinearGradientBrush, 134, 137–140 lines
defined (charts), 163 Line class, 80–82 line/rectangle/ellipse geometries, 92–93 LinePatternEnum, 169 LineSegment/PolyLineSegment classes, 99
■ M Material abstract class (3D graphics), 503 MaterialGroups, 567 matrices
3D in WPF, 445 defining perspective projection, 470

■ INDEX
679
matrix and vector structures, 419 Matrix3D operations, 449–452 Matrix3D structure, 448–449 Matrix3D transforms, 453–456 Matrix3DRound static method, 451–452 MatrixCamera class, 474, 482, 487, 505–506 MatrixTransform classes, 37–42 MatrixTransform3D class, 485, 493–495 operations, 22–25 orthographic transform, 480–482 perpendicular lines, creating, 31–36 perspective transform, 471–473 structure of, 21–22 transforms in, 25–26
mesh charts AddMesh method, 614–615 colormapped, 618 creating in WPF application, 615–618 mesh contour charts, 660–661
meshes and geometry (3D graphics), 501–503 MeshGeometry3D class, 501 rectangular, 531–533
methods for matrix operations, 22 Matrix3D operations, 453 Point3D structure, 447 Point4D structure, 447 for surface charts in WPF, 606 Vector3D object, 446
mini-language commands, 103–104 Model3D abstract base class, 500 ModelUIElement3D class, 500 mouse
chart panning with, 313–317 chart zooming with, 317–322 chart zooming with mouse wheel, 322–325 events, 316–317, 321, 331
moving averages EMA curves, creating, 299–300 exponential moving averages, 296–300 overview, 287 simple moving averages, 287–293 SMA curves, creating, 290–293
weighted moving averages, 293–296 WMA curves, creating, 295–296
multiple charts, creating (controls), 385–392 multiply method (matrices), 22 multiview projections, orthographic, 460–461 MyGrayGridBrush (gridlines), 40
■ N NearPlaneDistance property, 505 Newton divided-difference interpolation, 406–
411 normal equations of least-squares fit, 427 Normalize3D method (ChartStyle class), 585–
587 NormalizePoint method, 166, 167, 171, 179, 205 Normals property (MeshGeometry3D class),
501 NumberContours property, 652 NumberInterp property, 629, 644 numerical analysis, 393
■ O object transforms (3D)
combining transforms, 496 MatrixTransform3D class, 485, 493–495 overview, 36–38 RotateTransform3D class, 484, 491–492 ScaleTransform3D class, 484–488 TranslateTransform3D class, 484, 489–490
one-point perspective projections, 464 operations, matrix, 22–25 optimal tick spacing, 305–309 OptimalSpacing method, 309–312 orthographic projections
axonometric projections, 461 dimetric projections, 462 isometric projections, 462 multiview projections, 460–461 orthographic transform matrix, 480–482 orthographic transforms, 482 OrthographicCamera class, 482, 505–506 overview, 460 testing, 482–483 trimetric projections, 463

■ INDEX
680
viewing volume, 479–480 overlay bar charts, creating, 233–234
■ P panning
charts with mouse, 313–317 and zooming, 65, 73–75
parallel projections, 460, 573 parametric surfaces
helicoid surfaces, 545–546 overview, 545 quadric surfaces, 549–550 sphere surfaces, 547 torus surfaces, 548
PathGeometry class ArcSegment objects, 99–100 Bezier curves, 100–102 LineSegment and PolyLineSegment classes,
99 overview, 98–99
paths and geometries basics, 91–92 CombinedGeometry class, 95–97 GeometryGroup class, 93–95 line/rectangle/ellipse geometries, 92–93 mini-language commands, 103–104 PathFigure object, 98 PathFigureCollection class, 103 PathPoint object, 554 PathSegment class, 98 StreamGeometry class, 102–104
peak surface, creating, 539 Peak3D math function, 608–610 perpendicular lines, creating (matrices), 31–36 perspective projections
basics, 463–464 matrix, 466–467, 470–473 one-point, 464 perspective transforms, 474–475 PerspectiveCamera class, 474, 487, 505–506 testing, 475–479 three-point, 466 two-point, 465 View Frustum, 470
pie charts control, creating, 381–383 creating, 269–273 creating with control, 383–385 Legend class for, 268–269 overview, 265 style, 265–267
Pivot method, 420, 422 planar geometric projections, 459 points
coordinates, 15 at infinity, 15 Point objects, 198 PointCollection object, 86 PointLight class, 504 and vectors, 11–12, 445–447
polar charts chart style for, 255–259 control, creating, 377–379 creating, 261–264 creating with control, 379–381 DataCollection class for, 260–261 overview, 255
polygons, 88–91, 615 polylines, 86–87 PolyLineSegment/LineSegment classes, 99 polynomial fit (curve fitting), 433–436 polynomial interpolation, 398 Positions property (MeshGeometry3D class),
501, 503 Practical C# Charts and Graphics, 463 Practical Numerical Methods with C#, 419–420 Prepend methods, 22, 453 Prepend rotation, 29–30, 458 Prepend scaling, 29, 456 Prepend Skew transformation, 31 Prepend translation, 29, 456 projections
orthographic. See orthographic projections overview, 459 perspective. See perspective projections planar geometric, 459 projection transforms, 467–468
properties
■ INDEX
681
GeometryModel3D, 503 Matrix3D structure, 448 MeshGeometry3D class, 501–502 Point3D structure, 446 Point4D structure, 447 type transform, 37–38 Vector3D object, 446 of vectors, 20–21
■ Q quaternion notation in 3D, 456–459
■ R Rectangle shape transforms example, 38 rectangular meshes, 531–533 reflection of objects, 13 regression analysis, 393 RenderTransforms, 41, 331 residuals, defined (equations), 422 resizing Canvas element, 76–79 retrieving chart data, 326–332 revolution, surfaces of
creating, 561–562 overview, 556–557 RotateSurface class, 557–560
RNormalize method, 259 rotation
in 3D, 456–459 in homogeneous coordinates, 17–18 of objects, 13–14 Rotate methods (matrices), 25, 29 RotateSurface class, 557–560 RotateTransform class, 37, 48–51 RotateTransform3D class, 484, 491–492 Rotation3D class, 491
■ S scaling
in homogeneous coordinates, 16–17 objects, 12–13 ScaleTransform class, 36, 42–45 ScaleTransform3D class, 484–488
SecondDerivative method, 412
segment classes, 98–99 SetInterpShading method, 159 SetMatrixCamera method, 488 SetOriginalShading method, 159 SetOrthographic methods, 482 SetPerspective methods, 475 SetPolarAxes method, 259 SetTransform method, 488, 494–496 shading
color, 155–159 interpolated, 644 shaded surfaces, creating, 567–570 SurfaceShading class, 563–567
shapes, custom ArrowLine class, 112–117 overview, 108 Star class, 108–112 testing, 117–120
shapes in 2D graphics Hape class, 80 lines, 80–82 polygons, 88–91 polylines, 86–87 rectangles and ellipses, 82–86
simple moving averages (SMAs), 287–293 simple surfaces
creating, 536–540 overview, 531 rectangular meshes, 531–533 SimpleSurface class, 533–536
SimpleLineChart example, 163–166 Sinc3D math function, 608–610, 622 sine/cosine functions (charts), 166, 244 Skew transformation in 3D, 453 SkewTransform class, 37, 52–54 SMA curves, creating, 290–293 SolidColorBrush, 134–136, 153, 155 specialized 3D charts, 633 Specialized2DCharts, 217 spheres
creating (3D graphics), 515–518 sphere surfaces, 547, 562
spline, defined, 411 SpotLight class, 504

■ INDEX
682
sRGB and ScRGB color systems, 123–124 stacked bar charts, creating, 234–235 StackPanel control, defined, 4 stair-step charts
control, creating, 361–363 creating, 238–241 creating with control, 364–365 DataSeries class for, 236–237 overview, 236
Star class, 108–112 StartPoints, 137–138 StaticStockCharts application, 281–284 stem charts
control, creating, 365–367 creating, 242–244 creating with control, 367–369 DataCollection class for, 241–242 overview, 241
stock charts candlestick, 286–287 DataSeries/DataCollection for, 278–281 Hi-Lo, 281–285 Hi-Lo Open-Close, 285–286 moving averages. See moving averages static, 275 StaticStockCharts application, 281–284 text file reader, 275–278 Yahoo, connecting to, 300–301 Yahoo, creating in WPF, 302–303
straight-line fit (curve fitting), 423–426 StreamGeometry class, 102–104 Stretch properties (shapes), 69, 85–86 StrokeDashArray property, 81, 169 StrokeThickness, 67 structures
of matrices, 21–22 of vectors, 19–21
surfaces and GeometryModel3D (3D graphics), 503–
504 SurfaceShading class, 563–567
surface charts, 3D creating with AddSurface method, 626–631 curtain charts, 619–622
DataSeriesSurface class, creating, 606–608 DrawSurfaceChart class, creating, 610–614 extruded surfaces. See extruded surfaces mesh charts. See mesh charts overview, 606 parametric surfaces. See parametric
surfaces simple surfaces. See simple surfaces surface contour charts, 662–663 surface shading. See shading SurfaceChart, creating (mesh chart), 615–
618 SurfaceContour3D chart type, 662 surfaces of revolution. See surfaces of
revolution testing with 3D math functions, 608–610 waterfall charts, 623–625
surfaces of revolution creating, 561–562 overview, 556–557 RotateSurface class, 557–560
Swap method, 421 symbols (charts)
creating chart with, 200–202 defining, 192–193 Symbols class, 193–200
system colors, 124–127 System.Reflection statement, 127 System.Windows.Media namespace, 123 System.Windows.Media.Imaging
namespace, 147
■ T Taylor expansion, 406 testing
3D line chart in WPF applications, 604–605 3D surface charts, 608–610 bar charts (3D), 670–672 barycentric interpolation, 403–405 color charts on X-Y plane, 644–646 color shading, 159–161 colormap brushes, 153–155 contour charts (3D), 652–653

■ INDEX
683
Coordinates3D project, 599–600 cubic spline interpolation, 415–416 custom shapes, 117–120 hit-testing for graphics objects, 105–107 Lagrange interpolation, 399–401 linear interpolation, 395–397 linear regression, 429–432 Newton divided-difference interpolation,
409–411 orthographic projections, 482–483 perspective projections, 475–479 polynomial fit, 434–436 straight-line fit, 424–426
text defined (charts), 163 file reader, stock charts and, 275–278 TextBlock control example, 5 TextCanvas property, 178, 182, 189
TextureCoordinates property (MeshGeometry3D class), 502
three-point perspective projections, 466 ticks
creating charts with automatic, 309–312 tick labels in 3D charts, 592 tick spacing, optimal, 305–309
TileMode property (DrawingBrush), 145 titles
defined (charts), 163 title labels in 3D charts, 592
tools library (3D), 508 torus
creating (3D graphics), 526–529 surfaces, 548, 562
transforms combining, 18–19, 496 composite, 55–56 in matrices, 25–26
Transform classes MatrixTransform, 38–42 overview, 36–37 RotateTransform, 48–51 ScaleTransform, 42–45 SkewTransform, 52–54 Transform3D class, 484
Transform3DGroup class, 496 TransformGroup, 55–56 TransformMatrix classes, 37 TranslateTransform, 36, 38, 45–48 TranslateTransform3D class, 484, 489–490
transformations, 3D. See 3D transformations translation
of objects, 14–15 TranslateTransform class, 36, 38, 45–48 TranslateTransform3D class, 484, 489–490
■ U UserControl, defined, 333 Utility class, 451, 475 UV-sphere method, 515
■ V vanishing point, defined, 464 vectors
and matrix structures, 419 and points, 11–12, 445–447 structure of, 19–21 Vector object, 20
viewports 2D, 72–73 Viewport property (DrawingBrush), 145 Viewport3D class (graphics), 500
views and projections, 467–470 view planes, 459 view transforms, 467–470 viewing volume, orthographic projections,
479–480 Visibility property, 331 VisualBrush, 134 VisualTreeHelper.HitTest method, 105–107
■ W waterfall charts (3D surface charts), 623–625 websites, for downloading
3DTools library, 508 ColorPickerDialog control, 127
wireframe and coordinate axes (3D graphics), 508–510

■ INDEX
684
WMA curves, creating, 295–296 world coordinate system, 72 world transforms, 467–468 WPF (Windows Presentation Foundation)
code-only example, 7–9 new features in, 1–2 simple example, 4–6 XAML-only example, 9–10 Yahoo stock charts in applications, 300–303
■ X X-Y charts
in 3D, 654–655 color, 641–644 color, testing, 644–646
XAML (Extensible Application Markup Language)
basics, 2–4 XAML-only WPF example, 9–10
XNormalize/YNormalize methods, 71
■ Y Y axes (charts)
chart style with two, 205–211 creating chart with two, 213–216 DataSeries/DataCollection with two, 211–
213 reasons for two, 203–204
Yahoo stock charts connecting to, 300–301 creating in WPF, 302–303
■ Z Z-order algorithm, 615 zooming
charts with mouse, 317–322 charts with mouse wheel, 322–325 and panning, 65, 73–