Madrid System for the International Registration of Marks
16
Madrid System for the International Registration of Marks Report for 2011
Transcript of Madrid System for the International Registration of Marks

Madrid System for the International Registration of Marks
Report for 2011

TABLE OF CONTENTS
Page
OVERALL REGISTRATION ACTIVITY .................................................................................................. 1 Selected Transactions Recorded in 2011 (Table 1)................................................................................ 1
PROFILE OF REGISTRATIONS ............................................................................................................ 2 Coverage (goods, services, business sectors) ....................................................................................... 2 Most Popular Classes in International Registrations (Table 2) ............................................................... 2 Coverage (territories) .............................................................................................................................. 2 Amount of Fees Paid............................................................................................................................... 2
REGISTRATIONS IN FORCE................................................................................................................. 2
FEE DISTRIBUTION AMONG CONTRACTING PARTIES .................................................................... 3
FILING TRENDS..................................................................................................................................... 3 Global ...................................................................................................................................................... 3 By Contracting Party................................................................................................................................ 3
TRENDS IN DESIGNATIONS................................................................................................................. 3
NEW SERVICES OFFERED TO USERS (APPLICANTS AND HOLDERS) .......................................... 4 Goods and Services Manager................................................................................................................. 4
INFORMATION TECHNOLOGY SUPPORT .......................................................................................... 4
ELECTRONIC COMMUNICATION WITH THE OFFICES OF THE MADRID UNION MEMBERS .............................................................................................................................................. 4
MEMBERSHIP AND LEGAL DEVELOPMENT OF THE MADRID SYSTEM ..................................... 4–5 Membership............................................................................................................................................. 4 Working Group on the Legal Development of the Madrid System...................................................... 4–5
GRAPHS AND TABLES.................................................................................................................... 6–12 Graph 1 – International Registrations Recorded in 2007-2011............................................................... 6 Graph 2 – International Registrations Recorded in 2010-2011 (by month)............................................. 6 Graph 3 – Renewals Recorded in 2007-2011......................................................................................... 7 Graph 4 – Renewals Recorded in 2010-2011 (by month)....................................................................... 7 Graph 5 – International Applications Filed in 2007-2011 ........................................................................ 8 Graph 6 – International Applications Filed in 2010-2011 (by month) ...................................................... 8 Graph 7 – Number of Classes per International Registration (2011) ...................................................... 9 Graph 8 – Number of Designations per International Registration (2011) .............................................. 9 Graph 9 – Amounts of Fees Paid per International Registration (2011) ............................................... 10 Graph 10 – Trademarks in Force in the International Register (by December 31, 2011) ..................... 10 Table 3 – Major Filing Contracting Parties – Number of Applications Filed by Contracting Party......... 11 Table 4 – Most Designated Contracting Parties – Number of Designations by Designated Contracting Party ............................................................................................................... 12
LIST OF MEMBERS OF THE MADRID UNION (85) ............................................................................ 13

MADRID SYSTEM FOR THE INTERNATIONAL REGISTRATION 1 OF MARKS – REPORT FOR 2011
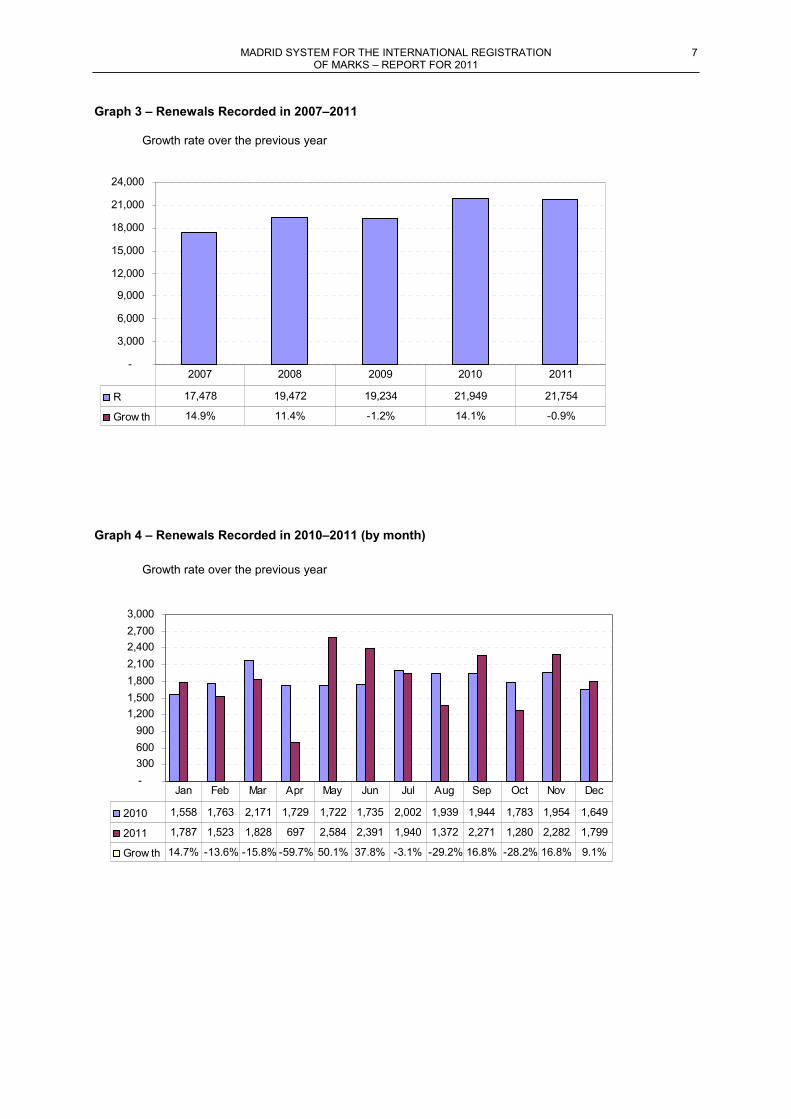
Overall Registration Activity In 2011, the overall volume of registration activity under the Madrid system increased relative to 2010. The International Bureau received 42,270 international applications (+6.5%) and recorded 40,711 international registrations (+8.5%). During the same period, it received 23,313 renewal requests (-1.6%) and recorded 21,754 renewals (-0.9%). It further received 14,791 requests for territorial extension (subsequent designations) (+5.2%) and recorded 13,667 such designations (+12.8%) (for further details, see Graphs 1 to 4, and Table 1, below).
At the end of the year, over half a million (540,089) international registrations were active in the International Register (a 2.5% increase relative to 2010).
Table 1, below, provides data concerning also other recordings. Some significant decreases took place with respect to certain types of decisions notified by designated Contracting Parties, including final decisions following a refusal (-17.4%), extensions of the time-limit for refusal based on opposition (-10.5%) and refusals (-3.6%).
Table 1
Selected Transactions Recorded in 2011
Growth rates relative to 2010
2010 2011 Growth
International Registrations 37,533 40,711 8.5%
Renewals 21,949 21,754 -0.9%
Subsequent designations 12,112 13,667 12.8%
Individual Designations
in International Registrations 261,105 280,443 7.4%
in Renewals 254,290 253,407 -0.3%
as Subsequent Designations 38,371 43,412 13.1%
International Registrations in force (at the end of the year)
Active Registrations 526,674 540,089 2.5%
Active Designations 5,553,204 5,540,000 -0.2%
Number of Right Holders 174,349 178,507 2.4%
Decisions by Designated Contracting Parties 267,955 347,816 29.8%
Grants of Protection 81,037 162,569 100.6%
Refusals (total or partial) 75,798 73,051 -3.6%
Extensions of the time-limit for refusal based on opposition 20,082 17,973 -10.5%
Final decisions following a refusal 44,215 36,533 -17.4%
Invalidations 364 443 21.7%
Further decision 3,415 517 -84.9%
Interim Status 43,084 56,730 31.7%
Modifications 83,310 86,776 4.2%
Changes in ownership 13,155 13,711 4.2%
Cancellations Due to Ceasing of Effect (Rule 22) 2,277 3,838 68.6%
Total 927 1,352 45.8%
Partial 1,350 2,486 84.1%
Cancellations by Holder 328 311 -5.2%
Renunciations 1,369 1,368 -0.1%
Limitations of the list of goods and services 2,948 3,533 19.8%
Changes in name or address of the holder 19,415 20,246 4.3%
Other changes (entries concerning representatives, corrections, etc.) 41,541 43,769 5.4%
2 MADRID SYSTEM FOR THE INTERNATIONAL REGISTRATION OF MARKS – REPORT FOR 2011
Profile of Registrations
Coverage (goods, services, business sectors)
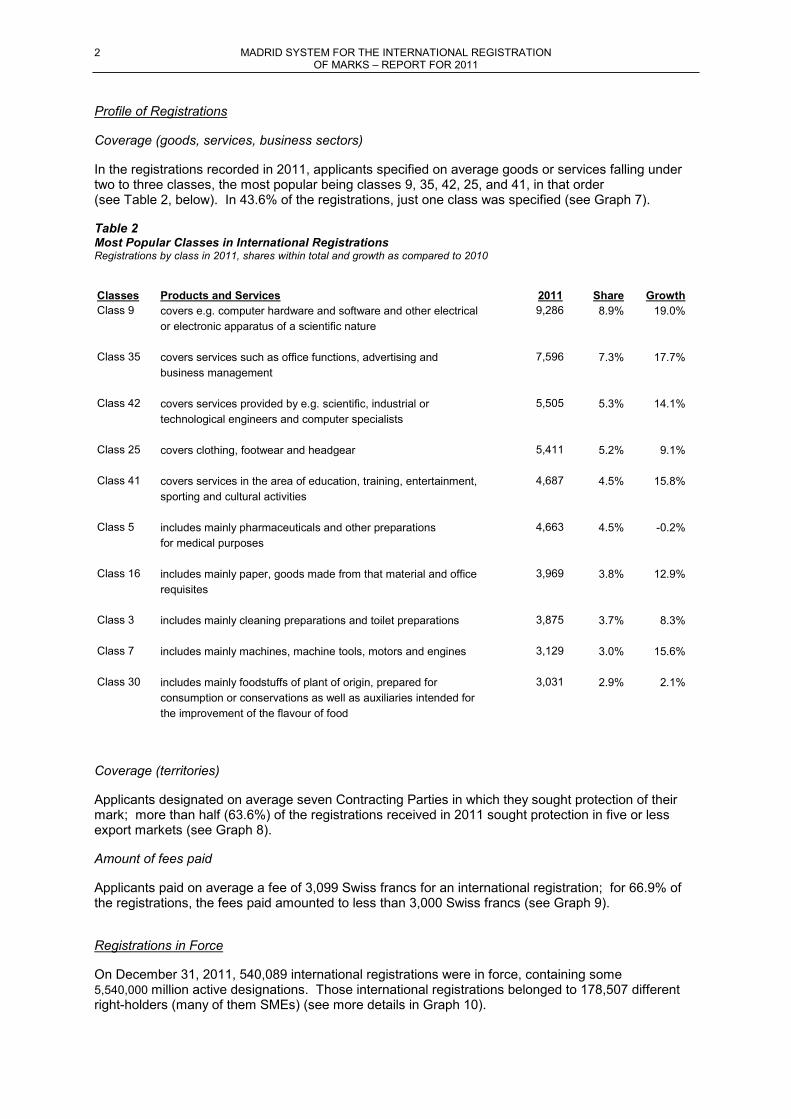
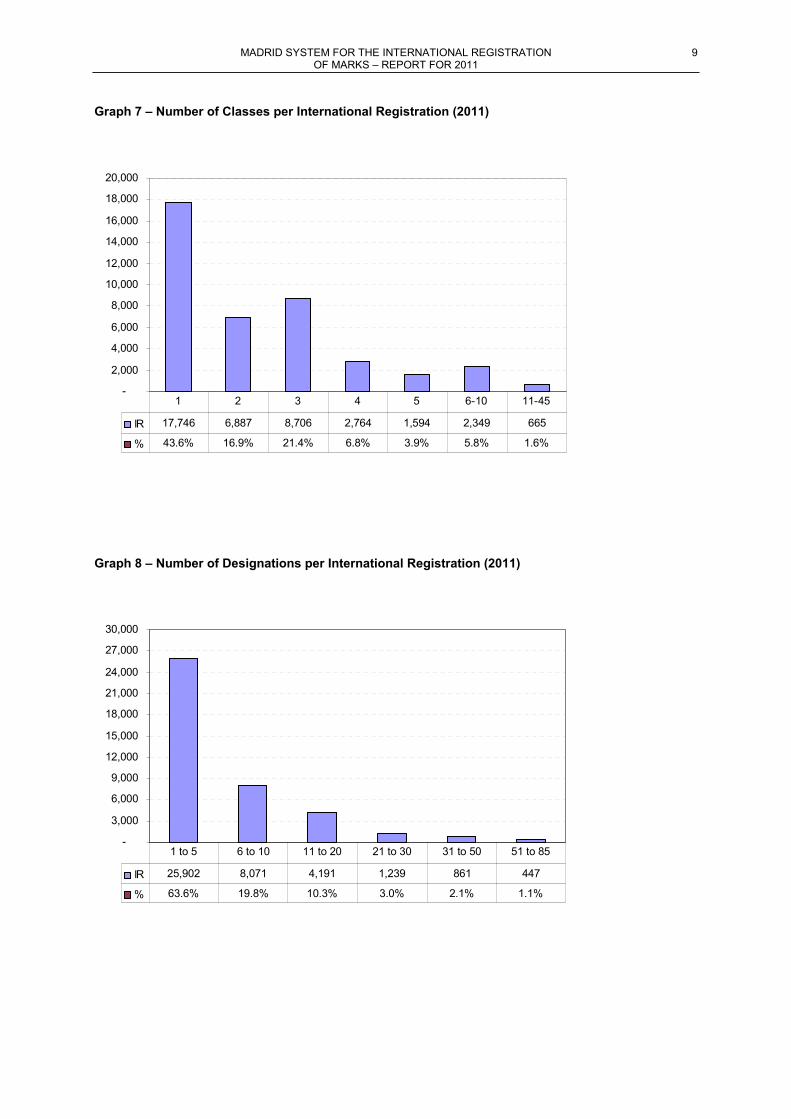
In the registrations recorded in 2011, applicants specified on average goods or services falling under two to three classes, the most popular being classes 9, 35, 42, 25, and 41, in that order (see Table 2, below). In 43.6% of the registrations, just one class was specified (see Graph 7).
Table 2 Most Popular Classes in International Registrations Registrations by class in 2011, shares within total and growth as compared to 2010
Classes Products and Services 2011 Share Growth
Class 9 covers e.g. computer hardware and software and other electrical 9,286 8.9% 19.0%
or electronic apparatus of a scientific nature
Class 35 covers services such as office functions, advertising and 7,596 7.3% 17.7%
business management
Class 42 covers services provided by e.g. scientific, industrial or 5,505 5.3% 14.1%
technological engineers and computer specialists
Class 25 covers clothing, footwear and headgear 5,411 5.2% 9.1%
Class 41 covers services in the area of education, training, entertainment, 4,687 4.5% 15.8%
sporting and cultural activities
Class 5 includes mainly pharmaceuticals and other preparations 4,663 4.5% -0.2%
for medical purposes
Class 16 includes mainly paper, goods made from that material and office 3,969 3.8% 12.9%
requisites
Class 3 includes mainly cleaning preparations and toilet preparations 3,875 3.7% 8.3%
Class 7 includes mainly machines, machine tools, motors and engines 3,129 3.0% 15.6%
Class 30 includes mainly foodstuffs of plant of origin, prepared for 3,031 2.9% 2.1%
consumption or conservations as well as auxiliaries intended for
the improvement of the flavour of food
Coverage (territories)
Applicants designated on average seven Contracting Parties in which they sought protection of their mark; more than half (63.6%) of the registrations received in 2011 sought protection in five or less export markets (see Graph 8).
Amount of fees paid
Applicants paid on average a fee of 3,099 Swiss francs for an international registration; for 66.9% of the registrations, the fees paid amounted to less than 3,000 Swiss francs (see Graph 9).
Registrations in Force
On December 31, 2011, 540,089 international registrations were in force, containing some 5,540,000 million active designations. Those international registrations belonged to 178,507 different right-holders (many of them SMEs) (see more details in Graph 10).

MADRID SYSTEM FOR THE INTERNATIONAL REGISTRATION 3 OF MARKS – REPORT FOR 2011
Fee Distribution Among Contracting Parties
In 2011, WIPO collected supplementary fees for an amount of 3,215,800 Swiss francs and complementary fees for an amount of 38,752,200 Swiss francs, for distribution among designated Contracting Parties. In addition, WIPO collected and distributed among designated Contracting Parties individual fees for a total amount of 117,624,445 Swiss francs.
Filing Trends
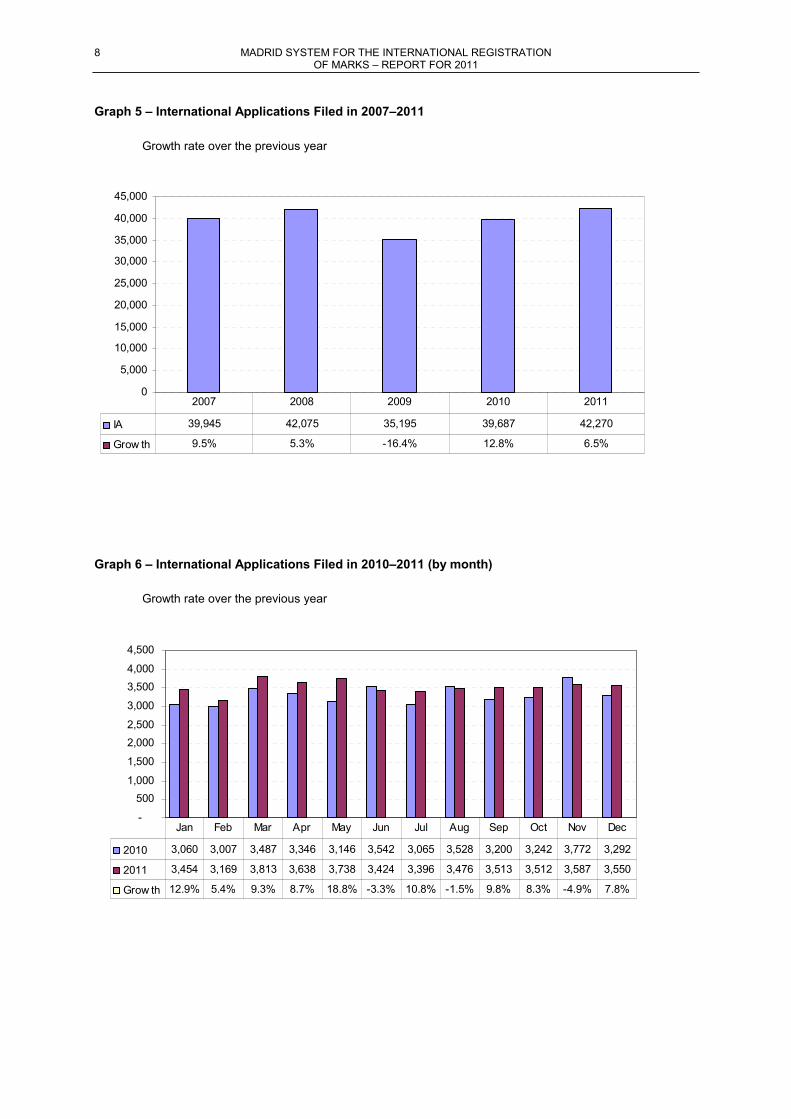
Global In 2011, the International Bureau received 42,270 international applications, a 6.5% increase relative to 2010. Graphs 5 and 6 compare total and monthly figures with those of previous years.
By Contracting Party (Table 3) With 5,859 international applications filed in 2011, the European Union is now the largest filer Contracting Party (accounting for 13.9% of the total number of applications filed that year), followed by Germany, the United States of America, France and Switzerland, in that order.
Most countries showed an increase in the number of international applications filed in 2011. This was the case of the Republic of Korea (+38.1%), the Russian Federation (+35.6%), the European Union (+24.5%), the United States of America (+15.5%), Turkey (+14.4%), China (+11.5%), France (+6.7%). There were decreases in the number of international applications filed in Austria (-21.2%), Italy (-11.2%), Australia (-4%), United Kingdom (-4%), Spain (-3.1%) and Japan (-2.5%) (see Table 3). Some Contracting Parties moved up in the list of major users of the Madrid system, including the European Union (from 2
nd to 1
st), the Russian Federation (from 10
th to 9
th), Turkey (from 14
th to 13
th),
the Republic of Korea (from 17th to 16
th), Norway (from 18
th to 17
th), Ukraine (from 21
st to 18
th) and
Israel (from 48th to 27
th).
Trends in Designations (Table 4) 323,855 new designations (contained in new registrations or territorial extensions) were notified to Contracting Parties in 2011. That represented an 8.1% increase relative to 2010.
With 18,724 designations, China continued to be the most designated Contracting Party, immediately followed by the European Union, the United States of America, the Russian Federation, Switzerland and Japan.
The top eight list of most designated Contracting Parties remains unchanged from last year. Several countries moved up in the list of most designated Contracting Parties. This was the case of Turkey (from 10
th to 9
th), Viet Nam (from 19
th to 15
th), Kazakhstan (from 26
th to 16
th), Egypt (from 21
st to 17
th),
Israel (from 81st to 24
th) and Azerbaijan (from 31
st to 27
th).

4 MADRID SYSTEM FOR THE INTERNATIONAL REGISTRATION OF MARKS – REPORT FOR 2011
New Services Offered to Users (Applicants and Holders)
Goods and Services Manager In December 2010, the Goods and Services Manager (G&S Manager) became publicly available on the WIPO website. This on-line tool, developed by WIPO in the context of a project approved by the Madrid Union Assembly in 2009, is designed to assist trademark applicants and their representatives in compiling the lists of goods and services that they need to submit when filing international applications under the Madrid system. The G&S Manager contains some 30,000 terms that can be used to describe goods or services in English, and their equivalents in French and Spanish. The G&S Manager supports 10 languages, namely English, French, Spanish, German, Italian, Arabic, Portuguese, Russian, Korean and Dutch, and plans are advanced to provide Chinese and Japanese.
The G&S Manager can be accessed through the Madrid system webpage (http://www.wipo.int/madrid/en/services/) or the WIPO GOLD portal (http://www.wipo.int/wipogold/en/trademarks.html). More information on the G&S Manager can be found under the shortcut FAQ at: http://www.wipo.int/madrid/en/services/gs_manager.html
Information Technology Support
Progress on Phase I and Phase II of the IT Modernization Program was reported to the Madrid Assembly in 2011. For more details reference is made to MM/A/44/4. Work on Phase I will be concluded in 2012, and Phase II will commence in early 2012.
Electronic Communication with the Offices of the Madrid Union Members The number of the Offices of the Madrid Union members communicating electronically with WIPO has increased significantly, with a total of 42 Offices sending some documents in an electronic format. It includes 23 Offices sending the statements of grant of protection by electronic means. The share of documents received electronically increased from 46% in 2010 to 60% in 2011. A number of Offices have identified new opportunities to enhance their electronic communication with WIPO and three Memoranda of Understanding (MOU) have been negotiated and signed (the Federal Service for Intellectual Property, Patents and Trademarks (ROSPATENT), the Office for Harmonization in the Internal Market (OHIM), the State Intellectual Property Office of the Republic of Croatia (SIPO)), formalizing those new electronic exchange arrangements. Membership and Legal Development of the Madrid System Membership
After the accession to the Madrid Protocol by Tajikistan, the number of Contracting Parties of the Protocol has increased to 84. The total number of Contracting Parties of the Madrid system is 85 (see the list of members of the Madrid Union in page 13).
Working Group on the Legal Development of the Madrid System
At the ninth session of the Working Group on the Legal Development of the Madrid System, the International Bureau presented a document on the possible introduction of division of international registrations. The Working Group requested this issue to be further studied by the International Bureau in cooperation with interested Offices and Organizations, in order to submit a revised proposal at the next session of the Working Group.

MADRID SYSTEM FOR THE INTERNATIONAL REGISTRATION 5 OF MARKS – REPORT FOR 2011
The discussion on the review of some fundamental features of the system (like ceasing of effect - Central Attack) continued when the International Bureau presented the data received during a six-month information gathering exercise related to notification of ceasing of effects. 24 Offices had, when transmitting to the International Bureau notifications of ceasing of effect in accordance with Rule 22 of the Common Regulations, also submitted additional relevant information concerning the underlying grounds associated with these notifications. These Offices were behind 90% of all the notifications of ceasing of effect recorded by the International Bureau in 2010. The International Bureau received from these Offices 1240 notifications of ceasing of effect, where 215 appeared to have resulted from Central Attack, of which 64 were total and 151 partial Central Attacks, thus suggesting that Central Attack is not widely used. The Working Group requested the International Bureau to gather more information on this issue and present the findings at a future meeting.
One of the conclusions of the eighth session was the consensus on the fact that the ninth session of the Working Group would deal with issues relating to the further simplification of the internal processes carried out by the International Bureau, in order to make the Madrid system more efficient, reliable, flexible, user-friendly as well as time and cost-effective.
The International Bureau presented a document on possible simplifications of the Madrid system. One proposal was for the introduction of translation upon request of two specific documents, namely (a) statement of grant of protection following a provisional refusal made under Rule 18ter(2)(ii), and (b) limitation of the list of goods and services contained in an international application, subsequent designation or presented in a request for limitation in official form MM6. This proposal targeted the building of efficient and financially sound processes to make information available in the Madrid system as well as streamlining recording and publication procedures. Another proposal regarded an amendment to Rule 32 to reflect that the Gazette shall be published on the website of WIPO.
The Working Group did not reach agreement to amend the legal framework regarding the proposal to introduce translation upon request. The Working Group did however recommend that the Madrid Union Assembly take note of these practices on translation. The Assembly noted this recommendation by the Working Group and also requested a review of the issue of translation at the next session of the Working Group. The Assembly adopted the recommendation of the Working Group to amend Rule 32(3).
Due to the review of the safeguard clause by the Assembly in September 2007, it is now the Madrid Protocol alone that in all aspects applies between States bound by both treaties. This principle has an exception in subparagraph (b) of Article 9sexies(1) which renders inoperative declarations made under Article 5(2)(b) and (c) or Article 8(7) of the Protocol. As a result the standard regime of time limit of one year for the notification of a provisional refusal and the payment of the supplementary and complementary fee applies. Under paragraph (2) of Article 9sexies, the Assembly, after the expiry of three years from September 1, 2008, shall review the application of paragraph (1)(b). As a result, the International Bureau presented a document on the review of the application of Article 9sexies(1)(b), and in particular provided information with respect to the inoperativeness of the two mentioned declarations. The Assembly decided to neither repeal nor restrict paragraph (1)(b) and to review this issue again in 2012. Consequently, this matter will be discussed at the tenth session of the Working Group.
[Graphs and Tables follow]

6 MADRID SYSTEM FOR THE INTERNATIONAL REGISTRATION OF MARKS – REPORT FOR 2011
Graph 1 – International Registrations Recorded in 2007–2011
Growth rate over the previous year
-
5,000
10,000
15,000
20,000
25,000
30,000
35,000
40,000
45,000
IR 38,471 40,985 35,925 37,533 40,711
Grow th 3.3% 6.5% -12.3% 4.5% 8.5%
2007 2008 2009 2010 2011
Graph 2 – International Registrations Recorded in 2010–2011 (by month)
Growth rate over the previous year
-
500
1,000
1,500
2,000
2,500
3,000
3,500
4,000
4,500
2010 2,656 3,109 3,339 3,121 2,564 3,030 2,848 2,515 3,259 4,190 3,072 3,830
2011 2,893 3,220 3,472 2,784 3,338 4,134 3,408 3,460 3,422 3,081 3,595 3,904
Grow th 8.9% 3.6% 4.0% -10.8% 30.2% 36.4% 19.7% 37.6% 5.0% -26.5% 17.0% 1.9%
Jan Feb Mar Apr May Jun Jul Aug Sep Oct Nov Dec
MADRID SYSTEM FOR THE INTERNATIONAL REGISTRATION 7 OF MARKS – REPORT FOR 2011
Graph 3 – Renewals Recorded in 2007–2011
Growth rate over the previous year
-
3,000
6,000
9,000
12,000
15,000
18,000
21,000
24,000
R 17,478 19,472 19,234 21,949 21,754
Grow th 14.9% 11.4% -1.2% 14.1% -0.9%
2007 2008 2009 2010 2011
Graph 4 – Renewals Recorded in 2010–2011 (by month)
Growth rate over the previous year
-
300
600
900
1,200
1,500
1,800
2,100
2,400
2,700
3,000
2010 1,558 1,763 2,171 1,729 1,722 1,735 2,002 1,939 1,944 1,783 1,954 1,649
2011 1,787 1,523 1,828 697 2,584 2,391 1,940 1,372 2,271 1,280 2,282 1,799
Grow th 14.7% -13.6% -15.8% -59.7% 50.1% 37.8% -3.1% -29.2% 16.8% -28.2% 16.8% 9.1%
Jan Feb Mar Apr May Jun Jul Aug Sep Oct Nov Dec
8 MADRID SYSTEM FOR THE INTERNATIONAL REGISTRATION OF MARKS – REPORT FOR 2011
Graph 5 – International Applications Filed in 2007–2011
Growth rate over the previous year
0
5,000
10,000
15,000
20,000
25,000
30,000
35,000
40,000
45,000
IA 39,945 42,075 35,195 39,687 42,270
Grow th 9.5% 5.3% -16.4% 12.8% 6.5%
2007 2008 2009 2010 2011
Graph 6 – International Applications Filed in 2010–2011 (by month)
Growth rate over the previous year
-
500
1,000
1,500
2,000
2,500
3,000
3,500
4,000
4,500
2010 3,060 3,007 3,487 3,346 3,146 3,542 3,065 3,528 3,200 3,242 3,772 3,292
2011 3,454 3,169 3,813 3,638 3,738 3,424 3,396 3,476 3,513 3,512 3,587 3,550
Grow th 12.9% 5.4% 9.3% 8.7% 18.8% -3.3% 10.8% -1.5% 9.8% 8.3% -4.9% 7.8%
Jan Feb Mar Apr May Jun Jul Aug Sep Oct Nov Dec
MADRID SYSTEM FOR THE INTERNATIONAL REGISTRATION 9 OF MARKS – REPORT FOR 2011
Graph 7 – Number of Classes per International Registration (2011)
-
2,000
4,000
6,000
8,000
10,000
12,000
14,000
16,000
18,000
20,000
IR 17,746 6,887 8,706 2,764 1,594 2,349 665
% 43.6% 16.9% 21.4% 6.8% 3.9% 5.8% 1.6%
1 2 3 4 5 6-10 11-45
Graph 8 – Number of Designations per International Registration (2011)
-
3,000
6,000
9,000
12,000
15,000
18,000
21,000
24,000
27,000
30,000
IR 25,902 8,071 4,191 1,239 861 447
% 63.6% 19.8% 10.3% 3.0% 2.1% 1.1%
1 to 5 6 to 10 11 to 20 21 to 30 31 to 50 51 to 85

10 MADRID SYSTEM FOR THE INTERNATIONAL REGISTRATION OF MARKS – REPORT FOR 2011
Graph 9 – Amounts of Fees Paid per International Registration (2011)
-
3,000
6,000
9,000
12,000
15,000
18,000
21,000
24,000
27,000
IR 27,218 8,338 2,395 1,491 802 467
% 66.9% 20.5% 5.9% 3.7% 2.0% 1.1%
Less than
3,000 CHF
3,000 to
4,999 CHF
5,000 to
6,999 CHF
7,000 to
9,999 CHF
10,000 to
14,999 CHF
more than
15,000 CHF
Graph 10 – Trademarks in Force in the International Register (by December 31, 2011)
Trademarksby right-holder
1-2 marks3-10 marks11-100 marks101-500 marks> 500 marks
All
79.48%
16.91%
3.43%
0.16%
0.02%
100.00%
141,87130,1896,12029235
178,507
Number ofright-holders
Right-holders(178,507)
⇒
Registrationsin force(540,089)
⇒
1-2 marks31.76%
11-100 marks27.16% 3-10 marks
25.81%
101-500 marks9.42%
> 500 marks5.85%

MADRID SYSTEM FOR THE INTERNATIONAL REGISTRATION 11 OF MARKS – REPORT FOR 2011
Table 3
Major Filing Contracting Parties
Number of applications filed by Contracting Party Shares within total filings in 2011 and growth rates as compared to 2010
Contracting Party of Origin 2007 2008 2009 2010 2011 Share Growth
1 European Union (EM) 3,371 3,600 3,710 4,707 5,859 13.9% 24.5%
2 Germany (DE) 6,090 6,214 4,793 5,006 5,000 11.8% -0.1%
3 United States of America (US) 3,741 3,684 3,201 4,147 4,791 11.3% 15.5%
4 France (FR) 3,930 4,218 3,523 3,565 3,804 9.0% 6.7%
5 Switzerland (CH) 2,657 2,885 2,671 2,893 2,933 6.9% 1.4%
6 Italy (IT) 2,664 2,763 1,872 2,596 2,306 5.5% -11.2%
7 China (CN) 1,444 1,585 1,358 1,928 2,149 5.1% 11.5%
8 Benelux (BX) 2,510 2,667 1,968 1,922 1,920 4.5% -0.1%
9 Russian Federation (RU) 889 1,190 1,068 1,218 1,652 3.9% 35.6%
10 Japan (JP) 984 1,278 1,312 1,577 1,538 3.6% -2.5%
11 United Kingdom (GB) 1,178 1,162 1,008 1,176 1,129 2.7% -4.0%
12 Australia (AU) 1,169 1,092 1,000 1,035 987 2.3% -4.6%
13 Turkey (TR) 717 890 792 859 983 2.3% 14.4%
14 Austria (AT) 1,134 1,245 1,050 1,020 804 1.9% -21.2%
15 Spain (ES) 859 981 688 586 568 1.3% -3.1%
16 Republic of Korea (KR) 330 186 249 354 489 1.2% 38.1%
17 Norway (NO) 403 368 333 346 423 1.0% 22.3%
18 Ukraine (UA) 195 217 188 287 365 0.9% 27.2%
19 Czech Republic (CZ) 541 607 397 344 361 0.9% 4.9%
20 Denmark (DK) 573 565 412 432 350 0.8% -19.0%
21 Poland (PL) 294 416 364 326 342 0.8% 4.9%
22 Sweden (SE) 478 476 314 284 259 0.6% -8.8%
23 Hungary (HU) 438 214 245 159 235 0.6% 47.8%
24 Singapore (SG) 146 166 200 198 227 0.5% 14.6%
25 Croatia (HR) 185 200 235 154 218 0.5% 41.6%
26 Belarus (BY) 63 69 54 106 203 0.5% 91.5%
27 Israel (IL) - - - 35 200 0.5% 471.4%
28 Bulgaria (BG) 431 386 331 257 189 0.4% -26.5%
29 Finland (FI) 278 282 245 206 189 0.4% -8.3%
30 Slovenia (SI) 182 296 254 263 183 0.4% -30.4%
31 Portugal (PT) 355 344 135 149 175 0.4% 17.4%
32 Serbia (RS) 275 282 241 267 163 0.4% -39.0%
33 Lithuania (LT) 78 93 57 68 113 0.3% 66.2%
34 Latvia (LV) 115 171 102 121 109 0.3% -9.9%
35 Slovakia (SK) 190 187 158 134 105 0.2% -21.6%
36 Liechtenstein (LI) 148 169 97 82 103 0.2% 25.6%
37 Morocco (MA) 93 73 62 81 84 0.2% 3.7%
38 Romania (RO) 103 99 47 97 76 0.2% -21.6%
39 Greece (GR) 80 117 57 58 70 0.2% 20.7%
40 Ireland (IE) 49 35 38 44 63 0.1% 43.2%
Other countries 585 603 366 600 553 1.3% -7.8%
Total 39,945 42,075 35,195 39,687 42,270 100% 6.5%

12 MADRID SYSTEM FOR THE INTERNATIONAL REGISTRATION OF MARKS – REPORT FOR 2011
Table 4
Most Designated Contracting Parties (2011)
Number of designations by designated Contracting Party
(Includes designations in new registrations and subsequent designations) Growth rates as compared to 2010
Designated Contracting Party 2007 2008 2009 2010 2011 Share Growth
1 China (CN) 16,676 17,829 14,766 16,143 18,724 5.8% 16.0%
2 European Union (EM) 12,744 14,502 12,564 14,604 16,344 5.0% 11.9%
3 United States of America (US) 14,618 15,715 13,406 14,252 15,890 4.9% 11.5%
4 Russian Federation (RU) 15,455 16,768 14,150 14,250 15,691 4.8% 10.1%
5 Switzerland (CH) 14,528 14,907 13,161 12,469 13,695 4.2% 9.8%
6 Japan (JP) 12,348 12,748 10,386 11,124 12,211 3.8% 9.8%
7 Australia (AU) 9,848 10,529 8,575 9,222 10,453 3.2% 13.3%
8 Republic of Korea (KR) 8,988 9,539 7,755 8,336 9,821 3.0% 17.8%
9 Turkey (TR) 9,377 9,844 7,942 8,210 9,277 2.9% 13.0%
10 Ukraine (UA) 9,751 10,635 8,539 8,288 8,903 2.7% 7.4%
11 Norway (NO) 9,346 9,787 7,627 7,503 8,546 2.6% 13.9%
12 Singapore (SG) 7,005 7,607 5,957 6,444 7,589 2.3% 17.8%
13 Belarus (BY) 6,140 6,724 5,380 5,328 5,857 1.8% 9.9%
14 Croatia (HR) 7,059 7,482 5,967 5,531 5,463 1.7% -1.2%
15 Viet Nam (VN) 4,381 4,966 4,169 4,345 5,120 1.6% 17.8%
16 Kazakhstan (KZ) 4,004 4,331 3,488 3,607 5,112 1.6% 41.7%
17 Serbia (RS) 5,956 6,315 5,130 4,837 4,989 1.5% 3.1%
18 Germany (DE) 7,184 6,955 5,593 5,260 4,908 1.5% -6.7%
19 Egypt (EG) 3,141 3,338 2,816 3,941 4,487 1.4% 13.9%
20 France (FR) 6,443 6,035 4,735 4,307 4,175 1.3% -3.1%
21 United Kingdom (GB) 6,502 6,204 4,671 4,398 4,148 1.3% -5.7%
22 Morocco (MA) 4,194 4,362 3,762 3,928 4,104 1.3% 4.5%
23 Italy (IT) 6,618 6,171 4,713 4,382 4,069 1.3% -7.1%
24 Israel (IL) - - - 596 3,860 1.2% 547.7%
25 Bosnia and Herzegovina (BA) 3,976 4,041 3,771 3,870 3,754 1.2% -3.0%
26 Spain (ES) 6,298 5,830 4,264 3,751 3,559 1.1% -5.1%
27 Azerbaijan (AZ) 3,145 3,801 3,214 3,304 3,553 1.1% 7.5%
28 Republic of Moldova (MD) 4,274 4,346 3,385 3,489 3,445 1.1% -1.3%
29 Montenegro (ME) 4,680 5,210 3,920 3,361 3,413 1.1% 1.5%
30 The former Yugoslav Republic of Macedonia (MK) 4,689 4,882 3,774 3,419 3,387 1.0% -0.9%
31 Benelux (BX) 5,979 5,463 4,102 3,624 3,384 1.0% -6.6%
32 Iran (Islamic Republic of ) (IR) 3,352 3,463 3,006 3,088 3,384 1.0% 9.6%
33 Georgia (GE) 3,801 3,980 3,154 2,988 3,215 1.0% 7.6%
34 Austria (AT) 5,928 5,208 4,118 3,545 3,197 1.0% -9.8%
35 Poland (PL) 5,553 4,815 3,724 3,261 3,143 1.0% -3.6%
36 Armenia (AM) 3,219 3,289 2,681 2,655 2,902 0.9% 9.3%
37 Albania (AL) 3,267 3,588 3,060 2,897 2,776 0.9% -4.2%
38 Liechtenstein (LI) 3,713 4,050 3,011 2,674 2,628 0.8% -1.7%
39 Kyrgyzstan (KG) 3,065 3,213 2,573 2,530 2,624 0.8% 3.7%
40 Uzbekistan 3,263 3,020 2,508 2,481 2,621 0.8% 5.6%
Other countries 100,609 97,402 73,827 67,234 69,434 21.4% 3.3%
Total 371,117 378,894 303,344 299,476 323,855 100% 8.1%

MADRID SYSTEM FOR THE INTERNATIONAL REGISTRATION 13 OF MARKS – REPORT FOR 2011
List of Members of the Madrid Union (85)
Albania (A&P) Iceland (P) Romania (A&P)
Algeria (A) Iran (Islamic Republic of) (A&P) Russian Federation (A&P)
Antigua and Barbuda (P) Ireland (P) San Marino (A&P)
Armenia (A&P) Israel (P) Sao Tome and Principe (P)
Australia (P) Italy (A&P) Serbia (A&P)
Austria (A&P) Japan (P) Sierra Leone (A&P)
Azerbaijan (A&P) Kazakhstan (A&P) Singapore (P)
Bahrain (P) Kenya (A&P) Slovakia (A&P)
Belarus (A&P) Kyrgyzstan (A&P) Slovenia (A&P)
Belgium* (A&P) Latvia (A&P) Spain (A&P)
Bhutan (A&P) Lesotho (A&P) Sudan (A&P)
Bosnia and Herzegovina (A&P) Liberia (A&P) Swaziland (A&P)
Botswana (P) Liechtenstein (A&P) Sweden (P)
Bulgaria (A&P) Lithuania (P) Switzerland (A&P)
China (A&P) Luxembourg* (A&P) Syrian Arab Republic (A&P)
Croatia (A&P) Madagascar (P) Tajikistan (A&P)
Cuba (A&P) Monaco (A&P) The former Yugoslav Republic of
Cyprus (A&P) Mongolia (A&P) Macedonia (A&P)
Czech Republic (A&P) Montenegro (A&P) Turkey (P)
Democratic People’s Morocco (A&P) Turkmenistan (P)
Republic of Korea (A&P) Mozambique (A&P) Ukraine (A&P)
Denmark (P) Namibia (A&P) United Kingdom (P)
Egypt (A&P) Netherlands: United States of America (P)
Estonia (P) – Territory in Europe* (A&P) Uzbekistan (P)
European Union (P) – Curaçao** (P) Viet Nam (A&P)
Finland (P) – Sint Maarten** (P) Zambia (P)
France (A&P) Norway (P)
Georgia (P) Oman (P)
Germany (A&P) Poland (A&P)
Ghana (P) Portugal (A&P) Greece (P) Republic of Korea (P)
Hungary (A&P) Republic of Moldova (A&P)
(A): indicates a party to the Agreement (56) (P): indicates a party to the Protocol (84)
* Belgium, Luxembourg and the territory of the Kingdom of the Netherlands in Europe have a unified legislation on trademarks and a common Office for the registration of trademarks under that legislation (Benelux Office). Under the Madrid system, protection shall be requested as if they were one country (Benelux). Their designation shall be subject to payment of a single complementary or individual fee.
** Curaçao and Sint Maarten are territories of the Kingdom of the Netherlands to which Benelux
trademark law does not apply, but which have their own trademark laws and their own Offices for the registration of trademarks under those laws. Protection in respect of Curaçao and Sint Maarten shall be requested through a specific designation under the Protocol, distinct from that of the Benelux.

World Intellectual Property Organization
Address:34, chemin des Colombettes P.O. Box 18CH-1211 Geneva 20Switzerland
Telephone:+41 22 338 91 11
Fax:+41 22 733 54 28
Website:www.wipo.int
WIPO Publication No. 940(E) ISBN 978-92-805-2237-2