Made in India for the World: An Empirical Investigation...
35
Made in India for the World: An Empirical Investigation into Novelty and Nature of Innovations By: Daniel Tobias Hagenau 1 and Rajnish Tiwari 2 Abstract After an initial introduction into the areas of innovations within emerging markets, the study develops a consistent innovation typology for categorizing large data samples from a variety of existing litera- ture. It then describes and finally evaluates a sample of 178 innovations for the Indian market based on 38 different criteria. It uses internet-based news reports over a two year timeframe for the study sam- ple. The study’s results show a considerable amount of radical innovations and innovations with disruptive potential among the sample and a special concentration on small- and micro-sized innovators from India. It confirms previous suggestions that India is especially focused on innovations within the soft- ware and electronics engineering sectors. The results also support the importance of local knowledge and ‘social capital’ for successful disruptive innovation. Finally, a perceivable increase in the technol- ogy orientation of innovations by foreign companies suggests a continuous build-up of local technolo- gy-competence and foreign trust in the same. A focus on local competencies and the leading position of India concerning innovative distribution are among the managerial implication of the study. It also opens numerous avenues for future research, expanding both depth and scale of the database as well as the analysis underlying this study. Keywords: frugal innovation, India, innovation typology, disruptive innovation, local compe- tencies Note: An edited version of this paper has been published as a book chapter in “Lead Market India: Key Elements and Corporate Perspectives for Frugal Innovations”, edited by C. Herstatt and R. Ti- wari. Suggested citation: Hagenau, D. T. and R. Tiwari (2017). Made in India for the World: An Empirical Investigation into Novelty and Nature of Innovations. Lead Market India: Key Elements and Corpo- rate Perspectives for Frugal Innovations. C. Herstatt and R. Tiwari. Heidelberg, Springer: 163-192. 1 Hamburg University of Technology and HQLabs GmbH; [email protected] 2 Corresponding author; Hamburg University of Technology; [email protected]
Transcript of Made in India for the World: An Empirical Investigation...

Made in India for the World: An Empirical Investigation
into Novelty and Nature of Innovations
By: Daniel Tobias Hagenau1 and Rajnish Tiwari2
Abstract
After an initial introduction into the areas of innovations within emerging markets, the study develops
a consistent innovation typology for categorizing large data samples from a variety of existing litera-
ture. It then describes and finally evaluates a sample of 178 innovations for the Indian market based on
38 different criteria. It uses internet-based news reports over a two year timeframe for the study sam-
ple.
The study’s results show a considerable amount of radical innovations and innovations with disruptive
potential among the sample and a special concentration on small- and micro-sized innovators from
India. It confirms previous suggestions that India is especially focused on innovations within the soft-
ware and electronics engineering sectors. The results also support the importance of local knowledge
and ‘social capital’ for successful disruptive innovation. Finally, a perceivable increase in the technol-
ogy orientation of innovations by foreign companies suggests a continuous build-up of local technolo-
gy-competence and foreign trust in the same.
A focus on local competencies and the leading position of India concerning innovative distribution are
among the managerial implication of the study. It also opens numerous avenues for future research,
expanding both depth and scale of the database as well as the analysis underlying this study.
Keywords: frugal innovation, India, innovation typology, disruptive innovation, local compe-
tencies
Note: An edited version of this paper has been published as a book chapter in “Lead Market India:
Key Elements and Corporate Perspectives for Frugal Innovations”, edited by C. Herstatt and R. Ti-
wari.
Suggested citation: Hagenau, D. T. and R. Tiwari (2017). Made in India for the World: An Empirical
Investigation into Novelty and Nature of Innovations. Lead Market India: Key Elements and Corpo-
rate Perspectives for Frugal Innovations. C. Herstatt and R. Tiwari. Heidelberg, Springer: 163-192.
1 Hamburg University of Technology and HQLabs GmbH; [email protected] 2 Corresponding author; Hamburg University of Technology; [email protected]
Made in India for the World: An Empirical Investigation into Novelty and Nature of Innovations
Hagenau and Tiwari (2017) 2
1. Introduction
For several years, there has been an increasing technology- and market-driven shift of innova-
tion activities from established, developed markets towards emerging economies such as In-
dia (UNCTAD, 2005; Herstatt, Tiwari, Buse and Ernst, 2008; Kumar and Puranam, 2012;
Gerybadze and Merk, 2014). Many large western companies establish R&D facilities in de-
veloping countries, realizing how quickly local educational standards are catching up to west-
ern structures and how quickly local markets grow at all levels of the economic pyramid.
Nearly 70% of researching Fortune 500 companies conduct at least part of their R&D in India
(Herstatt et al, 2008). With well above 2 million graduates a year, India and China are creat-
ing an impressive resource pool for further R&D investments (Knowledge@Wharton, 2005).
At the same time, local markets are growing rapidly and multinationals begin to understand
the potential of as yet untapped segments. C.K. Prahalad estimated the combined purchasing
power at the “Bottom of the Pyramid”3 to be roughly 3 trillion US$ p.a. (Prahalad and Hart,
2002). Countries like India also have a large and growing middle class (Ablett, Baijal,
Beinhocker, Bose et al, 2007).
In this context, a special interest has arisen in innovations that not only thrive under the still
restricted resource pools in developing markets but make special use of their ‘frugality’. Con-
cepts like “Gandhian”, “Reverse” or “Frugal” Innovation are used to describe products and
services specifically tailored to the needs of developing countries such as India or China and
their mostly rural population (Immelt, Govindarajan and Trimble, 2009; Prahalad and
Mashelkar, 2010; Sehgal, Dehoff and Panneer, 2010). C.K. Prahalad describes in his 2010
article ‘Innovation’s Holy Grail’ how “affordability and sustainability replace abundance and
premium pricing as drivers for Innovation” in developing countries (Prahalad and Mashelkar,
2010). Due to limited infrastructure, financial resources and education, the distribution, (inter-
face-)design and cost-structure are of higher importance than in developed countries
(Wooldridge, 2010). Instead of simply cutting costs and offering technologically outdated
products from western markets at lower prices, true innovation in terms of technology and
process are necessary in order to satisfy the demands of developing markets (Tiwari and
Herstatt, 2012b). Stripping products of non-essential features and applying sophisticated
technologies in order to reduce costs and adopt products to local environments makes the dif-
ference between failure and success of such innovations (Immelt et al, 2009; Sehgal et al,
3 Part of the population with less than US$ 1,500 p.a. at purchasing power parity at their disposal; roughly 4 bil-
lion people worldwide (Prahalad and Hart 2002).
Made in India for the World: An Empirical Investigation into Novelty and Nature of Innovations
Hagenau and Tiwari (2017) 3
2010; Nakata, 2012). As a result, innovations developed under the severe constraints de-
scribed above can result in out-of-the-box solutions that might not have been possible in more
developed environments (Gibbert, Hoegl and Välikangas, 2007). Because of these special
properties, some studies find promising potential in frugal innovations as lower-price alterna-
tives for established markets (Tiwari and Herstatt, 2012b) as well as the seeds for disruptive
innovation (Hart and Christensen, 2002), which may prove to the origin of industry-changing
innovations (Christensen and Raynor, 2003).
While numerous case studies exist on frugal innovations in varying industries and their trans-
fer potential (e.g. Immelt et al, 2009; Wooldridge, 2010; Tiwari and Herstatt, 2012a; b) there
exists to the authors’ knowledge little quantitative research on such innovations, their poten-
tial and their corporate and social context. Such research may help in better understanding the
factors involved in successful frugal innovation and deliver an empirical basis to the alleged
promise emerging nations are showing in this area.
This study aims at providing an initial quantitative evaluation of innovations being developed
for an emerging market (India), by both local and foreign innovators. In order to do so, a da-
tabase of 178 innovations has been created from online news-reports that were published be-
tween January 1st 2010 and December 31st 2011. The initial focus is put on three distinct areas,
necessary to derive further additions to the data sample and meaningful research questions
building upon this study and its database. They are:
1. What industry and company structures are the primary sources of innovation within an
emerging market such as India?
2. Who (in terms of company origin) is the primary driver of innovation and where (in
terms of R&D location) are innovations being developed?
3. What types of innovations arise from an emerging market such as India?
The paper is structured on the following lines: In order to consistently classify the recorded
innovations, section 2 of this study develops an innovation typology based on existing litera-
ture on the subject. Section 3 then introduces the data sample and remaining criteria used for
analysis and conducts the actual data evaluation. Section 4 concludes the paper with a discus-
sion of the results, practical implications and avenues for future research.

Made in India for the World: An Empirical Investigation into Novelty and Nature of Innovations
Hagenau and Tiwari (2017) 4
2. Innovation Typology
In order do derive meaningful consequences from raw-data on individual innovations, these
have to be categorized into consistently applicable sub-groups. The settings and chosen
sources of this study require classification criteria that (a) enable the uniform, consistent cate-
gorization of large data samples with limited access to background information and (b) relate
to the success of the innovation and the circumstances of its development (cf. Christensen and
Raynor, 2003: 73). As Garcia and Calantone (2001) show, a variety of classification themes
(typologies) of innovations are being used in current research applying similar terminologies
(such as ‘radical’ or ‘breakthrough’ innovation) but differing definitions and classification
criteria making an intuitive understanding and comparison difficult. In order to design the
classification used for this study and future studies building upon its database as transparent
and comparable as possible, the following sections draw upon the work of Garcia and Calan-
tone (2001) as well as other widely accepted publications on innovation typology, such as the
Olso Manual, in creating a transferrable innovation typology in accordance with the classifi-
cation criteria.
2.1. Defining Innovation
One of the first comprehensive definitions of innovation has been created by Joseph A.
Schumpeter in 1934, highlighting many of the aspects that are still considered to be the basis
of modern understanding of innovations; among them the introduction of a new good or its
quality, production method, new market, source of supply, or industrial organization
(Schumpeter, 1934). In more recent times, strongly referencing Schumpeter and his seminal
work, one of the most widely accepted definitions of the term innovation has been grafted by
the Organization of Economic Co-operation and Development’s (OECD) and Eurostat known
as the “Olso Manual” (OECD and Eurostat, 2005) for collecting and interpreting innovation
data:
„An innovation is the implementation of a new or significantly improved product (good
or service), or process, a new marketing method, or a new organisational method in busi-
ness practices, workplace organisation or external relations.”
Due to its wide acceptance and application as well as its extensive documentation, this
definition will be assumed and used throughout this study.

Made in India for the World: An Empirical Investigation into Novelty and Nature of Innovations
Hagenau and Tiwari (2017) 5
To be highlighted in this context is the aspect of the implementation, a mere concept or idea
as such is not yet considered to be an innovation. Within this study only such cases are
considered for the data sample that fulfil this basic definition of innovation.
2.2. Types of Innovations
The Oslo Manual identifies four distinct types of innovations (OECD and Eurostat, 2005).
They are:
1. Product Innovations: involve significant changes in the capabilities of goods or ser-
vices or the creation of completely new goods or services.
2. Process Innovations: represent significant changes in production and delivery meth-
ods.
3. Organizational Innovations: refer to the implementation of new organisational
methods. These can be changes in business practices, in workplace organisation or in
the firm’s external relations.
4. Marketing Innovations: involve the implementation of new marketing methods.
These can include changes in product design and packaging, in product promotion and
placement, and in methods for pricing goods and services.
When implementing this framework it is important to notice that the four available types of
innovation are not mutually exclusive for any given good or service. When introducing a new
product to a market, this can (and often does) involve several types of innovation. The follow-
ing example illustrates one such instance.
In 2010 a Chinese manufacturer introduced a new kind of ceramic tiles, made from the ex-
haust of coal power plants (Veach, 2010). The tiles are especially resistant to environmental
influences. The manufacturing process had never been used before and therefore needs to be
classified as a process innovation. At the same time, the special attributes of the tiles make
them a product innovation in themselves.
Another difficulty can be the classification of marketing innovations vs. product innovations.
In 2010, the Indian TV-Channel ‘Zing’ rebranded its entire identity, including channel-logo,
colours and themes as a continuous ad for the product launch of a new toiletry product brand
(Chakrabarty, 2010). This had never been done before and hence classifies as an innovation -
but is it a marketing innovation by the toiletry brand ‘Lux’, or a product innovation by the
Bollywood-channel ‘Zing’, whose business model is based on the sales of advertisement?

Made in India for the World: An Empirical Investigation into Novelty and Nature of Innovations
Hagenau and Tiwari (2017) 6
Since the responsible innovator, addressing his customers with a new channel, is the initiator
(in this example ‘Lux’), such cases are considered to be marketing innovations by the produc-
ing firm.
2.3. Degree of Novelty
Even though the degrees of Innovations (also degree of novelty or newness) is covered in the
OECD’s Oslo manual, Garcia and Calantone (2001) show in their thorough literature review
on innovation typology how different interpretations and operationalizations of these concepts
can lead to very different classification results. By introducing a comprehensive framework
they offer a toolbox for grouping innovations by their degree of novelty using two levels of
evaluation:
1. The macro level: evaluating the impact on an entire industry
2. The micro level: evaluating the impact on a particular firm
On both levels, the novelty/ discontinuity of the technology and of the market are evaluated
on a yes/ no basis, thus reducing the classification of an innovation’s novelty to several binary
choices. This facilitates the individual assessment but requires additional information for each
decision, as described in the following sections.
2.3.1. Newness of a Technology
Technology in this study’s context is defined as extending beyond engineering and manufac-
turing. It is the process by which an organization transforms inputs such as capital, labour,
materials and information into outputs (products and services) of greater value (Christensen,
1997).
The question to ask when assessing the newness of a technology to a firm (micro-level) is
therefore: “Has Company A used the same or a very similar technology earlier in order to
provide a product or service to a customer?” In addition, this question needs to be considered
with respect to the type of innovation to be evaluated (product, process, marketing or organi-
zation). For marketing innovations for instance, the technology used for specific marketing
purposes needs to be considered instead of the technology used in the actual product or ser-
vice.
On the macro-level the according question to ask is: “Has this or a very similar technology
been used before by any company within the same industry?” Important to note is the focus

Made in India for the World: An Empirical Investigation into Novelty and Nature of Innovations
Hagenau and Tiwari (2017) 7
on a specific industry, not the worldwide usage of a technology. (Garcia and Calantone, 2001)
show that this distinction is reasonable for a useful classification framework, since innova-
tions on a worldwide scale, with worldwide impact are extremely rare. As a consequence, the
direct transfer of a technology from one industry to another is to be considered as a disconti-
nuity on a macro-level.
2.3.2. Newness of a Market
Similar considerations are necessary for the market and marketing factors. First of all, a mar-
ket is not to be understood in a regional sense. Launching an already established product,
marketing method or organizational structure to the same customer segment in a new country
does not imply new market/ marketing know-how. Instead, market is to be understood in the
sense of a new customer segment that has new needs and/ or requires new access channels to
be reached (Garcia and Calantone, 2001; Christensen and Raynor, 2003; OECD and Eurostat,
2005).
On a micro-level this implies the question: “Has Company A addressed this or a very similar
customer segment before?” One might add “with this or a very similar product” since a
company can address different needs of a customer segment with different products. Say, a
company has been selling agricultural tools to farmers and now introduces information ser-
vices on weather conditions and agricultural best-practices; this definitely involves new mar-
keting know-how - even though the part of the population addressed is very similar. By enter-
ing a different industry (agricultural tools vs. information services), the company also changes
its market segment. Note, that the marketing process involved in addressing a market segment
plays no role in the evaluation of the newness of the market. A marketing innovation therefore
does not necessarily imply a market/ marketing discontinuity on a micro- or macro-level.
On a macro-level the according question is: “Has this or a very similar customer segment ev-
er been addressed (by this industry)?” Considering above mentioned example, a company
that has been offering information services to farmers in developed countries and now (as the
first company in the industry) starts offering these same services to rural farmers in India, in-
troduces market discontinuities in both micro- and macro-levels, since needs and access
channels of this new customer segment are very much different from the original segment.
Therefore the move to a new regional market can also imply new market/ marketing know-
how.
Made in India for the World: An Empirical Investigation into Novelty and Nature of Innovations
Hagenau and Tiwari (2017) 8
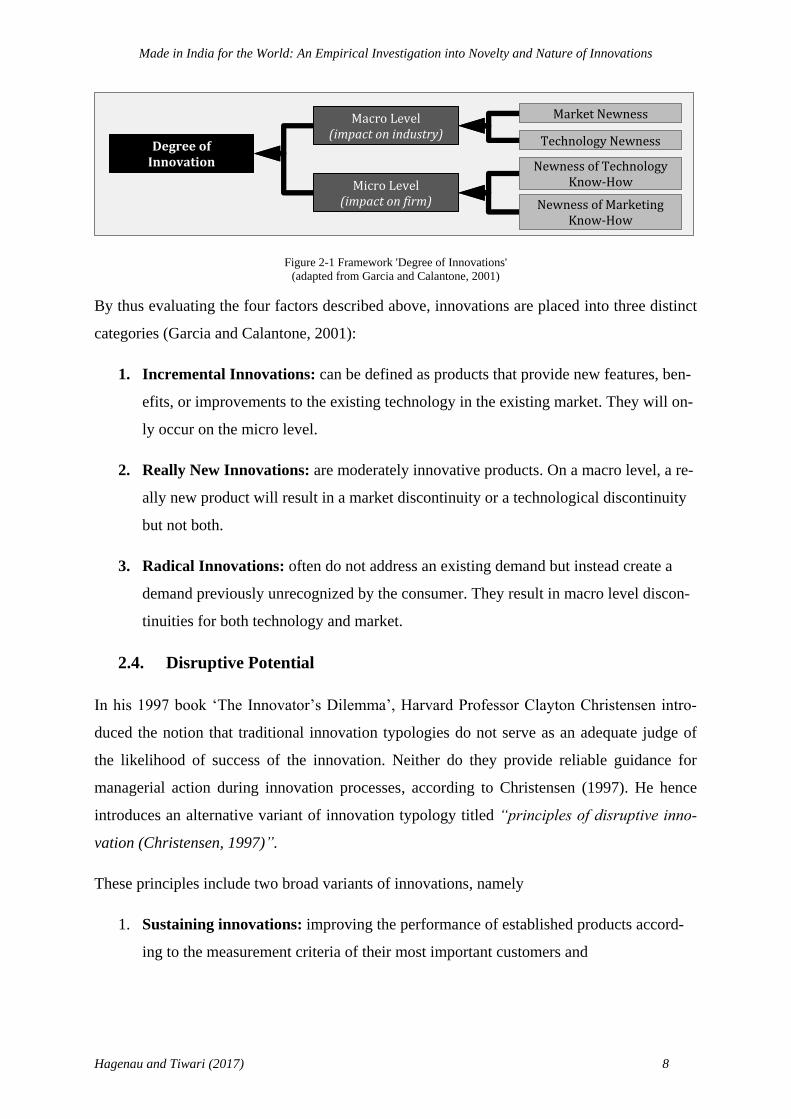
Figure 2-1 Framework 'Degree of Innovations'
(adapted from Garcia and Calantone, 2001)
By thus evaluating the four factors described above, innovations are placed into three distinct
categories (Garcia and Calantone, 2001):
1. Incremental Innovations: can be defined as products that provide new features, ben-
efits, or improvements to the existing technology in the existing market. They will on-
ly occur on the micro level.
2. Really New Innovations: are moderately innovative products. On a macro level, a re-
ally new product will result in a market discontinuity or a technological discontinuity
but not both.
3. Radical Innovations: often do not address an existing demand but instead create a
demand previously unrecognized by the consumer. They result in macro level discon-
tinuities for both technology and market.
2.4. Disruptive Potential
In his 1997 book ‘The Innovator’s Dilemma’, Harvard Professor Clayton Christensen intro-
duced the notion that traditional innovation typologies do not serve as an adequate judge of
the likelihood of success of the innovation. Neither do they provide reliable guidance for
managerial action during innovation processes, according to Christensen (1997). He hence
introduces an alternative variant of innovation typology titled “principles of disruptive inno-
vation (Christensen, 1997)”.
These principles include two broad variants of innovations, namely
1. Sustaining innovations: improving the performance of established products accord-
ing to the measurement criteria of their most important customers and
Degree of
Innovation
Macro Level (impact on industry)
Micro Level (impact on firm)
Technology Newness
Market Newness
Newness of Technology Know-How
Newness of Marketing Know-How

Made in India for the World: An Empirical Investigation into Novelty and Nature of Innovations
Hagenau and Tiwari (2017) 9
2. Disruptive innovations: generally underperforming existing technologies according
to established performance criteria but introducing features valued by new or fringe
markets.
Developed by start-ups or independent divisions and ripened in emerging market segments,
disruptive innovations gradually become competitive in the initial markets and finally have
the potential to fully substitute established technologies (Christensen, 1997). Disruptive inno-
vations tend to be cheaper, simpler, smaller, or more convenient to use than established solu-
tions (Christensen, 1997). This definition is similar to how (Tiwari and Herstatt, 2012b) de-
fine ‘frugal innovation’. A connection between the two classes of innovations is possible and
shall be investigated further.
In order to take into consideration the potential difference between more traditional typologies
as described in section 2.3and Christensen’s proposal, the above model is appended by two
additional evaluation criteria. In 2003, Christensen and Raynor extended the model of disrup-
tive innovations by subdividing disruptive innovation into “new-market disruption” and
“low-end disruption” also providing simple-to-integrate litmus tests for checking specific in-
novations for their disruptive potential (Christensen and Raynor, 2003):
New-market disruption
Is there a large population of people who have not had the money, equipment, or skill
to do this thing for themselves, and as a result have gone without it altogether or have
needed to pay someone with more expertise to do it for them?
To use the product or service, do customers need to go to an inconvenient, centralized
location?
Low-end disruption
Are there customers at the low end of the market who would be happy to purchase a
product with less (but good enough) performance if they could get it at a lower price?
Can we create a business model that enables us to earn attractive profits at the dis-
count prices required to win the business of these overserved customers at the low
end?
Made in India for the World: An Empirical Investigation into Novelty and Nature of Innovations
Hagenau and Tiwari (2017) 10
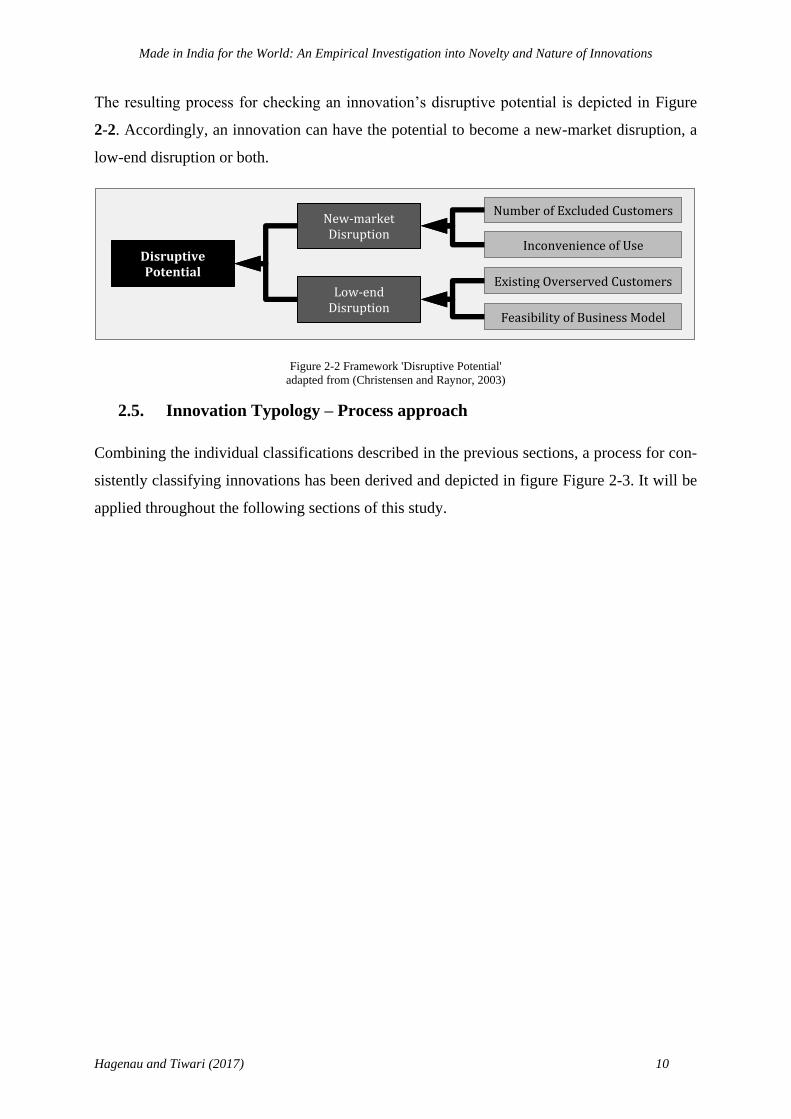
The resulting process for checking an innovation’s disruptive potential is depicted in Figure
2-2. Accordingly, an innovation can have the potential to become a new-market disruption, a
low-end disruption or both.
Figure 2-2 Framework 'Disruptive Potential'
adapted from (Christensen and Raynor, 2003)
2.5. Innovation Typology – Process approach
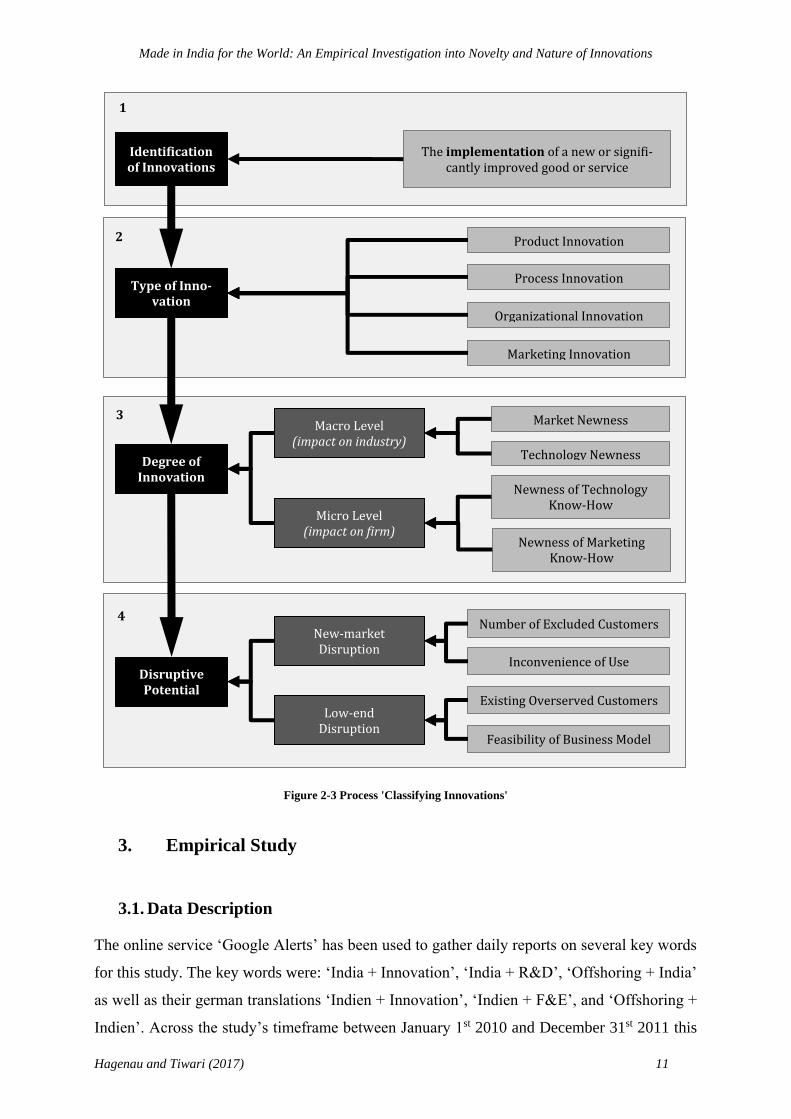
Combining the individual classifications described in the previous sections, a process for con-
sistently classifying innovations has been derived and depicted in figure Figure 2-3. It will be
applied throughout the following sections of this study.
Disruptive Potential
New-market Disruption
Low-end Disruption
Inconvenience of Use
Number of Excluded Customers
Existing Overserved Customers
Feasibility of Business Model
Made in India for the World: An Empirical Investigation into Novelty and Nature of Innovations
Hagenau and Tiwari (2017) 11
Figure 2-3 Process 'Classifying Innovations'
3. Empirical Study
3.1. Data Description
The online service ‘Google Alerts’ has been used to gather daily reports on several key words
for this study. The key words were: ‘India + Innovation’, ‘India + R&D’, ‘Offshoring + India’
as well as their german translations ‘Indien + Innovation’, ‘Indien + F&E’, and ‘Offshoring +
Indien’. Across the study’s timeframe between January 1st 2010 and December 31st 2011 this
Type of Inno-
vation
Product Innovation
Process Innovation
Organizational Innovation
Marketing Innovation
2
Identification of Innovations
The implementation of a new or signifi-cantly improved good or service
1
Degree of Innovation
Macro Level (impact on industry)
Micro Level (impact on firm)
Technology Newness
Market Newness
Newness of Technology Know-How
Newness of Marketing Know-How
3
Disruptive Potential
New-market Disruption
Low-end Disruption
Inconvenience of Use
Number of Excluded Customers
Existing Overserved Customers
Feasibility of Business Model
4

Made in India for the World: An Empirical Investigation into Novelty and Nature of Innovations
Hagenau and Tiwari (2017) 12
query resulted in a total of well above 1.200 online-news reports that have been evaluated for
references to innovations introduced in India. A total of 178 innovations have been identified.
They were described in 69 individual publications primarily encompassing newspapers (such
as Wall Street Journal and Times of India), innovation-oriented news portals (such as
afaqs.com and siliconindia.com) as well as press archives (such as indiaPRwire.com and
PR.com). The news reports were evenly spaced across the entire two-year time frame of the
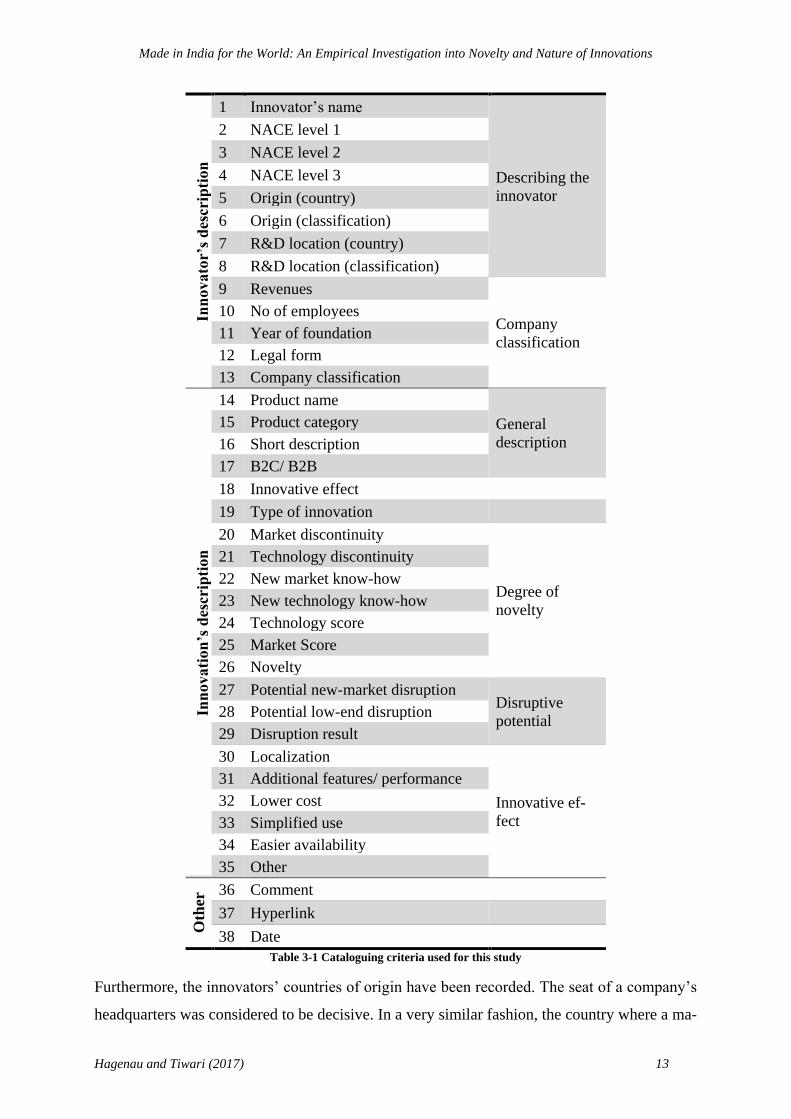
study. Wherever such data was available, the innovations have been catalogued according to
the 38 criteria shown in Table 3-1. In order to properly classify the innovation itself, a typolo-
gy as described in chapter 2 has been applied using criteria 19 through 29. Building upon
these direct criteria, further aggregation and evaluation has been conducted as described in
section 3.2ff. Additionally, company data has been recorded from publicly available data
sources such as annual reports and press releases where available. The full dataset as been
submitted with this study. An excerpt containing key criteria for all records is included in the
appendix.
3.1.1. Innovator’s Description
In order to investigate connections between the innovator’s background, origin, and structure
and the resulting innovations, several criteria relating to the innovating company or individual
have been recorded.
General Information (criteria 1 – 8)
Apart from the innovator’s name, his industry has been recorded according to the second revi-
sion of the European standard for statistical classification of economic activity in its second
iteration (NACE v.2) (eurostat, 2008) with a detail of up to three levels. This facilitates a flex-
ible aggregation of innovators into sub-sectors and their individual evaluation.
Made in India for the World: An Empirical Investigation into Novelty and Nature of Innovations
Hagenau and Tiwari (2017) 13
Inn
ovato
r’s
des
crip
tion
1 Innovator’s name
Describing the
innovator
2 NACE level 1
3 NACE level 2
4 NACE level 3
5 Origin (country)
6 Origin (classification)
7 R&D location (country)
8 R&D location (classification)
9 Revenues
Company
classification
10 No of employees
11 Year of foundation
12 Legal form
13 Company classification
Inn
ovati
on
’s d
escr
ipti
on
14 Product name
General
description
15 Product category
16 Short description
17 B2C/ B2B
18 Innovative effect
19 Type of innovation
20 Market discontinuity
Degree of
novelty
21 Technology discontinuity
22 New market know-how
23 New technology know-how
24 Technology score
25 Market Score
26 Novelty
27 Potential new-market disruption Disruptive
potential 28 Potential low-end disruption
29 Disruption result
30 Localization
Innovative ef-
fect
31 Additional features/ performance
32 Lower cost
33 Simplified use
34 Easier availability
35 Other
Oth
er 36 Comment
37 Hyperlink
38 Date
Table 3-1 Cataloguing criteria used for this study
Furthermore, the innovators’ countries of origin have been recorded. The seat of a company’s
headquarters was considered to be decisive. In a very similar fashion, the country where a ma-
Made in India for the World: An Empirical Investigation into Novelty and Nature of Innovations
Hagenau and Tiwari (2017) 14
jor proportion of R&D related to the innovation in question has been conducted was included
wherever possible. Since the differences and similarities between developed regions of the
world (including Europe, North America, Japan, and Australia) and developing regions (with
a focus on India) were of special interest to this study, an aggregation of both the innovators’
countries of origin and their R&D locations has been conducted into these two categories.
Company Classification (criteria 9 – 13)
For relating innovative capacities and patterns to company size, a standardized classification
scheme has been applied in accordance with the European Union’s standard for business clas-
sification (eurostat, 2011). For a more uniform classification one additional range “very large”
has been added above 10bn € in revenues or 10.000 employees. Companies and innovators
have been assigned the next higher category as soon as one of the two criteria was fulfilled.
Class Yearly revenues €4 No of employees
Micro < 10
Small < 1mn 10 - 49
Medium 1mn - 49mn 50 - 249
Large 50mn - 10bn 250 – 10.000
Very Large > 10bn > 10.000
Table 3-2 Company classification scheme in accordance with (eurostat, 2011)
In addition to a classification of company size, the legal form has been recorded as one of
public, private, NGO, or cooperative. Where available, the year of the company’s foundation
has been included as well.
3.1.2. Innovation’s Description
The following criteria include the innovation typology process developed in section 2 and
complement it with specific product information, wherever such was available from the data
sources.
General Information (criteria 14 – 17)
The general section encompasses the innovations’ product name (where applicable) as well as
a more general categorization and short description, giving the researcher a short impression
of the kind of product/ service the innovation in question belongs to (The name could e.g. be
‘ClimaCon’, which is of the category ‘apparel’ and has the description ‘temperature regulat-
4 Based on average exchange rates over the fiscal year in question

Made in India for the World: An Empirical Investigation into Novelty and Nature of Innovations
Hagenau and Tiwari (2017) 15
ing clothes’ ). In addition, the target group has been identified as one of B2B or B2C, discern-
ing end-consumers from business customers.
Innovative Effect (criteria 18 and 30 – 35)
Some studies attribute special importance to certain innovative effects (such as cost reduction)
expected in above average quantities of innovations of certain typologies and origins (e.g. dis-
ruption and simplified usage (see Christensen, 1997) or innovations of Indian origin and re-
duced cost of ownership (see Tiwari and Herstatt, 2012a)). In order to inspect such correla-
tions, every innovation in the dataset has been evaluated with respect to its innovative effect.
The qualitative effect has been recorded in continuous text as mentioned in the sources. It has
furthermore been classified into the following categories as described in several descriptive
studies and reports (e.g. Utterback and Abernathy, 1975; Christensen, 1997; OECD and
Eurostat, 2005; Tiwari and Herstatt, 2012b):
Additional features – Existing functionality is extended and/ or supplemented. New
functionality is added to the product or service.
Lower cost – Life-cycle cost for the direct consumer is reduced. The origin can lie
anywhere along the supply chain.
Simplified use – The use of the product/ service has been simplified through interface
design or modification of working principles.
Localization – Existing or new functionality is adapted to special regional circum-
stances or tastes.
Easier availability – Access to the product or service has been simplified. Access is
provided to consumers previously excluded by limited technological, infrastructural or
regional provisions.
Other
Innovation Typology (criteria 19 – 29)
Type, degree of novelty and disruptive potential has been evaluated according to the process
developed in section 2.

Made in India for the World: An Empirical Investigation into Novelty and Nature of Innovations
Hagenau and Tiwari (2017) 16
Other (criteria 36 – 38)
For each recorded innovation, the date of the according source-report has been recorded as
well as the hyperlink of the source-report and additional comments. While the according hy-
perlink may not be available forever, each source-report has been separately documented and
archived for future reference.
3.2. Data Evaluation
From the large variance of available evaluation criteria, three areas of primary interest have
been chosen for this initial study.
In order to answer more detailed research questions in subsequent studies and prioritize future
additions to the data sample, the focus for this initial study has been put on answering the tree
questions
1. What types of innovations arise from an emerging market such as India?
(covered in section 3.2.1),
2. Who (in terms of company origin) is the primary driver of innovation and where (in
terms of R&D location) are innovations being developed?
(covered in section 3.2.2),
3. What industry and company structures are the primary sources of innovation within an
emerging market such as India?
(covered in section 3.2.1).
3.2.1. Industry Distribution & Company Classification
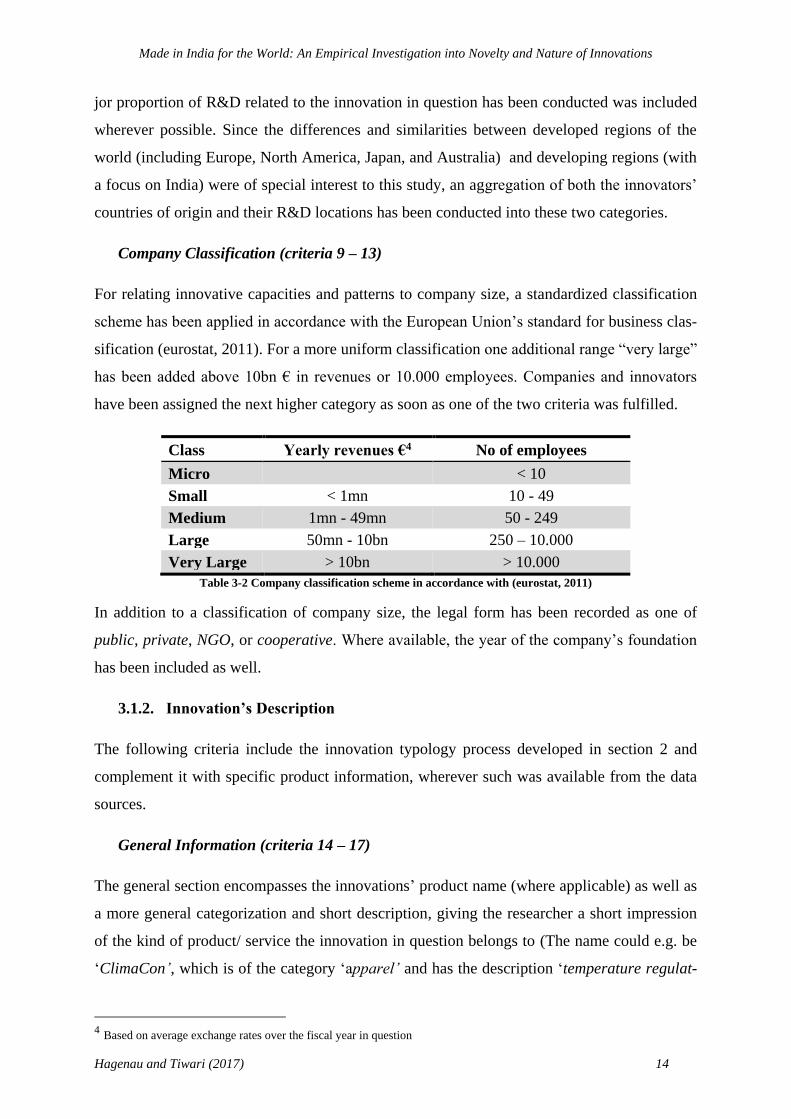
Within the study’s sample there is a strong concentration of innovations in the NACE level 1
industry clusters C (manufacturing, 60%) and J (information and communication, 34%). Fur-
thermore, a majority of innovations belong to NACE level 2 clusters C26 (manufacture of
computer, electronic and optical products, 20%) and J62 (computer programming, consultan-
cy and related activities, 21%). This corresponds to existing studies, claiming that India has
become a growing hub for software innovation and development of computers and electronics
(Ernst, Dubiel, and Fischer, 2009; Vardi, 2010) as well as to recent data on telecom penetra-
tion (above 70%) and rising engineering exports (4.95b US$ to 68.8b US$ from ‘97 to ‘11)
(RBI, 2011; TRAI, 2011). For a complete overview of industries represented within the sam-
ple see Figure 3-1, Figure 3-2 and corresponding supplementary legend in Table 3-3.

Made in India for the World: An Empirical Investigation into Novelty and Nature of Innovations
Hagenau and Tiwari (2017) 17
Figure 3-1 Number of innovations by NACE level 1 cluster
Accordingly, the top five industry clusters (NACE level 2) account for more than 62% of all
innovations within the sample. Within these five clusters the distribution of innovative effects
differs (as shown in Figure 3-3). While cluster 62 (programming etc.) has a large share of in-
novations with added functionality as well as increased availability, cluster 26 (manufacturing
of electronics etc.) has a much larger share of innovations reducing cost. This may indicate
the increased use of information technology and adapted software in supply chains distributed
across rural environments, solving some of the inherent distribution challenges described by
previous case studies (see e.g. Mahajan and Ramola, 1996; Gradl, Herrndorf, Knobloch, and
Sengupta, 2010 for examples from the financial services sector). At the same time similar
forces may be behind the focus on cost-reduction within the engineering sector, where the su-
perb cost of highly engineered products until now hinders their widespread distribution.
106
61
3 2 2 1 1 1 10
20
40
60
80
100
120N
oo
f in
no
va
tio
ns
n = 178

Made in India for the World: An Empirical Investigation into Novelty and Nature of Innovations
Hagenau and Tiwari (2017) 18
Figure 3-2 Number of innovations in NACE clusters C and J by NACE level 2 clusters
(for the legend see table 3-10)
Figure 3-3 Number of innovations in TOP 5 NACE (L2) clusters by impact
C Manufacturing
10 Manufacture of food products 11 Manufacture of beverages
0
5
10
15
20
25
30
35
40
26 27 29 11 20 32 21 14 28 10 17 23 13 25 62 63 61 60 58 59
Manufacturing (C) Information andcommunication (J)
No
of
inn
ov
ati
on
s
0
5
10
15
20
25
30
35
40
45
50
62 26 27 63 11
No
of
inn
ov
ati
on
s
Simplified use
Easier availability
Localization
Lower cost
Inc. perform./ add. Features
n = 167
n = 108
Made in India for the World: An Empirical Investigation into Novelty and Nature of Innovations
Hagenau and Tiwari (2017) 19
13 Manufacture of textiles 14 Manufacture of wearing apparel 17 Manufacture of paper and paper products 20 Manufacture of chemicals and chemical products 21 Manufacture of basic pharmaceutical products and pharmaceutical preparations 23 Manufacture of other non-metallic mineral products 25 Manufacture of fabricated metal products, except machinery and equipment 26 Manufacture of computer, electronic and optical products 27 Manufacture of electrical equipment 28 Manufacture of machinery and equipment n.e.c. 29 Manufacture of motor vehicles, trailers and semi-trailers 32 Other manufacturing
J Information and communication
58 Publishing activities 59 Motion picture, video and television programme production, sound recording and
music publishing activities 60 Programming and broadcasting activities 61 Telecommunications 62 Computer programming, consultancy and related activities 63 Information service activities
Table 3-3 Relevant excerpt from the NACE classification of industrial activity
(Based on: Eurostat, 2008, p. 55ff.)
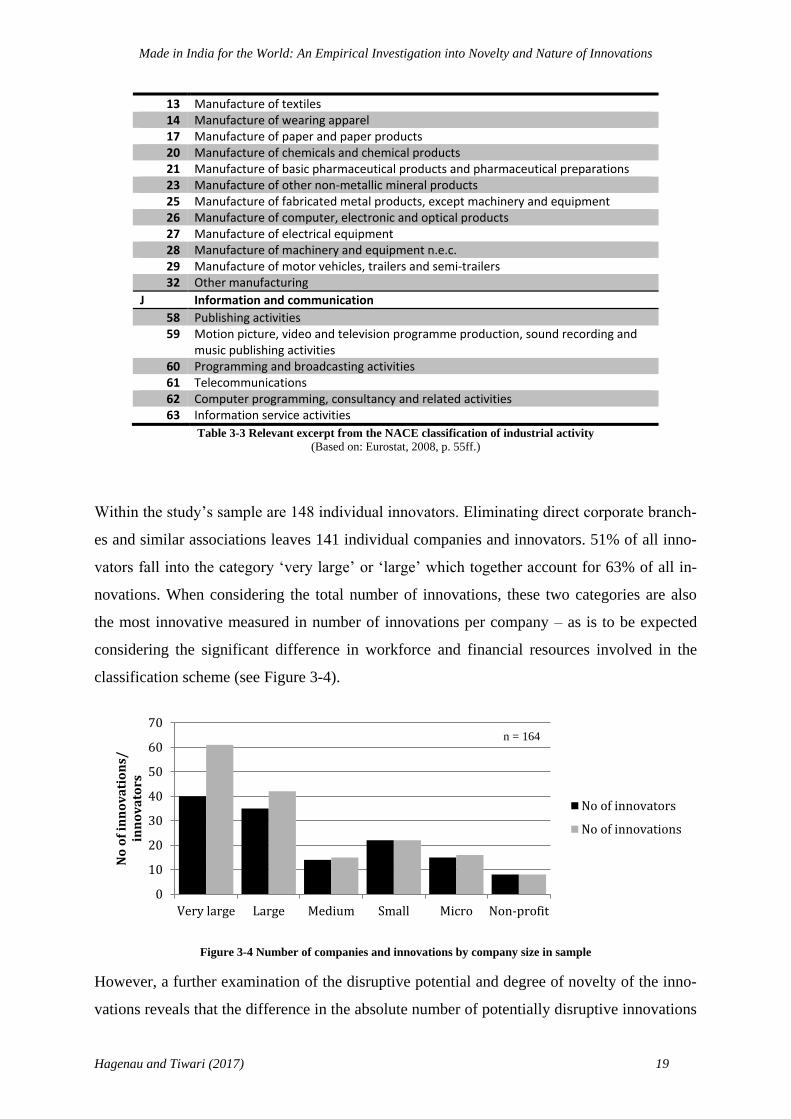
Within the study’s sample are 148 individual innovators. Eliminating direct corporate branch-
es and similar associations leaves 141 individual companies and innovators. 51% of all inno-
vators fall into the category ‘very large’ or ‘large’ which together account for 63% of all in-
novations. When considering the total number of innovations, these two categories are also
the most innovative measured in number of innovations per company – as is to be expected
considering the significant difference in workforce and financial resources involved in the
classification scheme (see Figure 3-4).
Figure 3-4 Number of companies and innovations by company size in sample
However, a further examination of the disruptive potential and degree of novelty of the inno-
vations reveals that the difference in the absolute number of potentially disruptive innovations
0
10
20
30
40
50
60
70
Very large Large Medium Small Micro Non-profit
No
of
inn
ov
ati
on
s/
inn
ov
ato
rs
No of innovators
No of innovations
n = 164

Made in India for the World: An Empirical Investigation into Novelty and Nature of Innovations
Hagenau and Tiwari (2017) 20
is much smaller across company sizes than for incremental and sustaining innovations. Hence
the relative number of radical and disruptive innovations is much higher for the smaller com-
pany sizes (e.g. in the extreme: 0,44 radical innovations per micro-innovator vs. 0,08 per very
large-innovator; see Figure 3-5 and Figure 3-6 for details). This supports the claim that poten-
tially disruptive and/ or radical innovations flourish more easily within smaller organizations
(Christensen and Raynor, 2003). It thereby also suggests that start-ups and grassroot innova-
tors (31 within the sample, all local in origin) account for a relatively large portion of these
innovations, highlighting their importance for the innovation climate in an emerging market
such as India. Consequently, scholars arguing for the importance of social capital and
knowledge of local conduct in the frugal innovation process (e.g. Subramaniam and Youndt,
2005; Tiwari and Herstatt, 2012b) may find support in this result.
Figure 3-5 Number of innovations by disruptive potential and company size
Figure 3-6 Number of innovations by degree of novelty and company size
0
10
20
30
40
50
Very Large Large Medium Small Micro Non-profit
No
of
inn
ov
ati
on
s
Disruptive
Sustaining
0
10
20
30
40
Very Large Large Medium Small Micro Non-profit
No
of
inn
ov
ati
on
s
Incremental
Really New
Radical
n = 164
n = 164

Made in India for the World: An Empirical Investigation into Novelty and Nature of Innovations
Hagenau and Tiwari (2017) 21
3.2.2. Influence of Innovator’s Origin and R&D Location
Within the given sample a majority of innovations (71%) stem from Indian innovators and
have been developed within India. A second large block (21%) originates in companies from
the developed world but has also been developed in India. Table 3-4 shows an overview of
the number of innovations within the sample by their innovator’s origin and their R&D loca-
tion.
R&D location
Developed
World India RoW
Grand
Total
Inn
ova
tor’
s
ori
gin
Developed
World 7
(4%)
35 (21%)
0 (0%)
42 (25%)
India 2 (1%)
117 (71%)
0 (0%)
119 (72%)
RoW 0 (0%)
1 (1%)
3 (2%)
4 (2%)
Grand Total 9 (5%)
153 (93%)
3 (2%)
165 (100%)
Table 3-4 Number and share of innovations in sample by innovator's origin and R&D location
When looking at the timeline of innovations (shown in Figure 3-7) and their share by country of
origin, the average share of Innovations by Indian companies increases slightly over the 24
month timeframe of the study.
Figure 3-7 Timeline of the share of innovations by the innovator's origin5
5 For reasons of simplicity only India and developed world are shown in the figure. The four innovations originating in the
rest of the world (RoW) have been omitted. Due to their wide spread across the depicted timeframe, they do not change its
appearance perceptibly.
0%
20%
40%
60%
80%
100%
Jan
Feb
Mrz
Ap
r
Mai
Jun
Jul
Au
g
Sep
Ok
t
No
v
Dez Jan
Feb
Mrz
Ap
r
Mai
Jun
Jul
Au
g
Sep
Ok
t
No
v
Dez
2010 2011
Developed World India Linear (India) n = 161

Made in India for the World: An Empirical Investigation into Novelty and Nature of Innovations
Hagenau and Tiwari (2017) 22
Table 3-5 and Table 3-6 show the distribution of the degree of novelty by R&D location for
Indian innovators and those from developed countries, respectively. While the share of really
new innovations developed in India is much larger for innovators from the developed world
(50%) than for Indian innovators (34%), the reverse is true for radical innovations that make
up a share of 17% of all innovations by Indian companies and entrepreneurs but only 2% of
those by companies from developed countries.
Degree of novelty
R&
D l
oca
tion
Incremental Really new Radical Grand total
Developed world 2 (2%)
0 (0%)
0 (0%)
2 (2%)
India 56 (47%)
41 (34%)
20 (17%)
117 (98%)
Grand total 58 (49%)
41 (34%)
20 (17%)
119 (100%)
Table 3-5 Number and share of innovations by Indian companies by their R&D
location and degree of novelty
Degree of novelty
R&
D l
oca
tion
Incremental Really New Radical Grand Total
Developed world 1 (2%)
5 (12%)
1 (2%)
7 (17%)
India 13 (31%)
21 (50%)
1 (2%)
35 (83%)
Grand Total 14 (33%)
26 (62%)
2 (5%)
42 (100%)
Table 3-6 Number and share of innovations by companies from developed countries by
their R&D location and degree of novelty
In order to gain a deeper understanding of the kind of innovations developed within the sam-
ple, Table 3-7 and Table 3-8 evaluate the technology score of the innovations in a similar
fashion as above. This evaluation reveals, that the share of high-technology innovation (caus-
ing a technology discontinuity on a macro level) of innovations developed within India is
more than twice as high (46%) for Indian innovators as it is for their counterparts from the
developed world (19%). This result could be an indication that, while companies from devel-
oped countries continue to expand their R&D facilities within the emerging markets, their
most sophisticated technology oriented R&D is still conducted elsewhere, presumably within
their home-markets. At the same time, Indian companies concentrate also their most advanced
technology development in India.

Made in India for the World: An Empirical Investigation into Novelty and Nature of Innovations
Hagenau and Tiwari (2017) 23
Technology score
R&
D l
oca
tion
0 1 2 Grand total
Developed world 0 (0%)
2 (2%)
0 (0%)
2 (2%)
India 25 (21%)
37 (31%)
55 (46%)
117 (98%)
Grand total 25 (21%)
39 (33%)
55 (46%)
119 (100%)
Table 3-7 Number and share of innovations by Indian companies
by their technology score and R&D location
Technology score
R&
D l
oca
tion
0 1 2 Grand total
Developed world 3 (8%)
0 (0%)
4 (10%)
7 (17%)
India 18 (43%)
9 (21%)
8 (19%)
35 (83%)
Grand total 21 (50%)
9 (21%)
12 (29%)
42 (100%)
Table 3-8 Number and share of innovations by companies from developed countries
by their technology score and R&D location
This observation poses the question of the development of technology oriented innovations in
India over time, i.e. has foreign innovators’ trust in technology oriented R&D within India
risen over the past years. As several current studies (see Herstatt et al, 2008) suggest, the av-
erage technology score of innovations by companies from developed countries has risen con-
siderably across the study’s timeframe, pointing towards increased availability of according
infrastructure and technology distribution as well as increased outsourcing activities in tech-
nology oriented areas (e.g. Tiwari and Herstatt, 2012a). However, the average technology
score of innovations by Indian innovators has decreased slightly, very much in contrast to the
studies and suggested trends mentioned above. This poses the question, whether there is an
actual decrease in technology oriented innovation underlying this apparent tendency or
whether an above average increase in less technology heavy innovation causes the phenome-
non (see Figure 3-8).

Made in India for the World: An Empirical Investigation into Novelty and Nature of Innovations
Hagenau and Tiwari (2017) 24
Figure 3-8 Average technology score by innovator's origin
Indeed, Figure 3-9 shows a slight increase in innovations with technology score 2 by Indian
innovators. The overall decrease in the average technology score is caused by a decrease in
innovations with a technology score of 1 (technology discontinuity on a micro-level). In es-
sence, this may imply the move from innovations that are merely technologically new on a
micro-level, towards more globally revolutionary R&D conducted by Indian innovators.
Figure 3-9 Timeline: number of innovations by Indian companies by their technology score6
Finally, the number and share of innovations with disruptive potential varies only slightly be-
tween Indian innovators (34%) and those from developed countries (45%) as shown in Table
3-9 and Table 3-10. This may be an indication that the unique circumstances within emerging
6 The considerable spike in Mach 2011 results from in-depth media coverage of a nation-wide Indian innovation contest
conducted by the National Association of Software and Services Companies (NASSCOM).
0,0
0,5
1,0
1,5
2,0
Jan
Feb
Mrz
Ap
r
Mai
Jun
Jul
Au
g
Sep
Ok
t
No
v
Dez Jan
Feb
Mrz
Ap
r
Mai
Jun
Jul
Au
g
Sep
Ok
t
No
v
Dez
2010 2011
Developed World India Linear (Developed World) Linear (India)
0
2
4
6
8
10
Jan
Feb
Mrz
Ap
r
Mai
Jun
Jul
Au
g
Sep
Ok
t
No
v
Dez Jan
Feb
Mrz
Ap
r
Mai
Jun
Jul
Au
g
Sep
Ok
t
No
v
Dez
2010 2011
No
of
inn
ov
ati
on
s
0 1 2 Linear (0) Linear (1) Linear (2)
n = 121

Made in India for the World: An Empirical Investigation into Novelty and Nature of Innovations
Hagenau and Tiwari (2017) 25
economies resulting in a special composition of innovations apply similarly to indigenous and
foreign innovators. However, the influence of ‘social capital’ in the emergence of innovations
tailored to emerging markets (see Subramaniam and Youndt, 2005) needs to be further inves-
tigated.
Disruptive potential
R&
D l
oca
tion
Yes No Grand total
Developed world 0 (0%)
2 (2%)
2 (2%)
India 40 (34%)
77 (65%)
117 (98%)
Grand total 40 (34%)
79 (66%)
119 (100%)
Table 3-9 Number and share of innovations by Indian companies
by R&D location and disruptive potential
Disruptive potential
R&
D l
oca
tion
Yes No Grand total
Developed world 4 (10%)
3 (7%)
7 (17%)
India 15 (36%)
20 (48%)
35 (83%)
Grand total 19 (45%)
23 (55%)
42 (100%)
Table 3-10 Number an share of innovations by companies from developed
countries by R&D location and disruptive potential
3.2.3. Innovation Typology
Of the 178 innovations within the sample, 83 (47%) have been rated as incremental innova-
tions. Accordingly, just under half of all recorded innovations happen solely on the micro-
level and hence require the firm to develop new technology- and/ or marketing-know-how
that has already been applied by competitors within the same industry.
72 innovations require the innovator to apply either technological or marketing skills that
have never been implemented within the same industry before and finally 23 (13%) of all in-
novations within the sample classify as being radical in the sense that they require the innova-
tor to apply both market-know-how and technology-know-how that hasn’t been used within
his industry before (see Figure 3-10). Considering how previous studies have described radi-
cal innovation as rare, and, when successful, game-changing within their industry (e.g.

Made in India for the World: An Empirical Investigation into Novelty and Nature of Innovations
Hagenau and Tiwari (2017) 26
Chandy and Tellis, 2000; Hill and Rothaermel, 2003), this number is to be considered quite
substantial.
Figure 3-10 Number of innovations in sample by their newness
Figure 3-11 shows the distribution of the innovations’ disruptive potential according to the
criteria described in section 2.4. While 116 (65%) of the sample carry no disruptive potential
and can therefore be classified as ‘sustaining’ innovations, 62 (35%) have the potential to be
shaped into a disruptive innovation in the sense of (Christensen, 1997) and (Christensen and
Raynor, 2003). Closer inspection shows that among the third of the sample having disruptive
potential, the largest group of 29 innovations (16%) has some potential for being shaped into
a new-market disruption, extending a product or service into parts of the population excluded
by previous offers, while a somewhat smaller group of 17 innovations (10%) have potential to
become low-end disruptions in markets where previous customers have been overserved by
existing alternatives. 16 innovations combine both kinds of disruptive potential.
When combining both evaluations (degree of novelty and disruptive potential, as shown in
Figure 3-12), the overall picture is confirming initial expectations. All 23 innovations classi-
fied as radical also have potential to become disruptive innovations. Among the really new
category only 34 (close to 50%) of innovations have disruptive potential, while the rest (38)
are of purely sustaining character. A large majority (78 of 83) of incremental innovations
have no disruptive potential. However, the five remaining innovations have potential to be
shaped into low-end disruptions. While this combination may seem unlikely, (Christensen and
Raynor, 2003) describe how incremental und sustaining are not mutually enforcing classifica-
tions. The cases included in this study encompass innovations that lower the price of the
product/ service to the consumer while utilizing established technology in functionally simpli-
fied solutions. Among them is for example an e-book reader using standardized, well estab-
Incremental; 83; 47%
Really New; 72; 40%
Radical; 23; 13% n = 178

Made in India for the World: An Empirical Investigation into Novelty and Nature of Innovations
Hagenau and Tiwari (2017) 27
lished components and drastically simplified functionality in order to reduce its price to
around 40% of its largest competitors. While the product in question does not apply technolo-
gy- or market-know-how that is in any way new to the industry, its value proposition may be
shaped into a product serving established customers who are presently overserved by the
functionality of existing e-book readers and willing to accept a less functional product at a
significantly lower price.
Figure 3-11 Number of innovations in sample by their disruptive potential
The match between the degree of novelty and disruptive potential of the innovations within
the sample suggests that, even though individual innovations might diverge as exceptions,
both classifications describe the innovative potential of an innovation along similar lines.
While both classifications certainly contribute to the understanding of an innovations poten-
tial, this result somewhat contradicts the presumption that ‘traditional’ classifications oriented
along the degree of novelty fail to adequately classify an innovations character (Christensen
and Raynor, 2003).
An additional result emerging from the present data-analysis is the direct correlation of the
definitions for a market-discontinuity on a macro (industry) level and potential new-market
disruptions. Whenever an innovation involves a market-discontinuity on a macro-level as de-
scribed in section 2.3.2the innovator addresses a customer segment that by definition has nev-
er had access to the product or service being offered. Especially, but not exclusively, when the
innovator’s industry is already well established in other market-segments, this by itself fulfills
a potential new-market disruption as described in section 2.4Vice-versa, any innovation ful-
filling the criteria for a potential new-market disruption must by definition involve a market-
discontinuity on a macro-level – otherwise the new customer segment would have had access
to the product or service before.
None; 116; 65%
Low-end; 17; 10%
New Market; 29; 16%
Both; 16; 9%
None
Low-end
New Market
Both
n = 178

Made in India for the World: An Empirical Investigation into Novelty and Nature of Innovations
Hagenau and Tiwari (2017) 28
Figure 3-12 Share and number of innovations by degree of novelty and disruptive potential
A large group of 143 (80%) of all innovations within the sample are product innovations, fol-
lowed by marketing (19, 11%), process (13, 7%) and organizational (3, 2%) innovations (see
Figure 3-13). As publicly available news reports were used as the primary source for this
sample, a connection between the choice of sources and the large share of product innovation
in the sample is possible as a consequence of the high media attention focused on the launch
of innovative products compared to company-internal changes inherent to organizational in-
novation. Across all types of innovations, the share of incremental, really new and radical in-
novations is comparable (Figure 3-13). Due to the small sample-sizes in all but product inno-
vations, these results would have to be validated using an additional data source, possibly
more focused on firm-internal innovation.
Figure 3-13 Number of innovations in sample by their type and newness
Corresponding to the majorities of incremental and sustaining innovations, a large number
within the sample (70, 47%) encompasses additional product features in their innovative ef-
fect. This is in turn followed by innovations lowering product cost (57, 30%) and innovations
0%
20%
40%
60%
80%
100%
Incremental Really New Radical
Sustaining
Disruptive
0
20
40
60
80
100
120
140
160
Product Marketing Process Organization
Radical
Really New
Incremental
n = 178
n = 178

Made in India for the World: An Empirical Investigation into Novelty and Nature of Innovations
Hagenau and Tiwari (2017) 29
increasing availability (41, 23%). When subdividing the sample into its sustaining and poten-
tially disruptive subgroups (as shown in Figure 3-14), the innovative effects split as predicted
by literature (Christensen and Raynor, 2003). While more than half of all sustaining innova-
tions involve additional product features and thereby put a focus on increased versatility, less
than 10% of innovations with disruptive potential involve such additional functionality. In-
stead, they are dominated by reduced cost and increased availability. There is no discernible
difference in the share of localizations and innovations simplifying product use between the
sustaining and disruptive subgroups.
Some studies (e.g. Hart and Christensen, 2002; Lee, Lin, Wong and Calantone, 2011) have
suggested that simplified usage is of primary importance in order to ensure swift adoption of
new products within developing markets. While some of the innovations within the sample do
include simplification, it is the rarest of the innovative effects recorded. (Tiwari and Herstatt,
2012b) describe innovations emerging from India as being characterized by “their affordabil-
ity, robustness and ‘good enough’ quality”. The considerable share of potentially disruptive
innovations and innovations introducing reduced costs seem to confirm the affordability and
‘good enough’ quality of the products and services within the study’s sample. The results also
suggest that robustness may just be a necessary precondition for enabling easier distribution
and availability of innovations in rural environments where infrastructure and population are
stretched thinly across vast regions.
Figure 3-14 Share of impacts of innovations by disruptive potential
Add. features; 64
Add. features; 6
Simplified use; 8
Simplified use; 6
Localization; 13
Localization; 9
Lower cost; 20
Lower cost; 37
Availability; 11
Availability; 30
0%
10%
20%
30%
40%
50%
60%
70%
80%
90%
100%
Sustaining Disruptive
n = 178, multiple selections possible

Made in India for the World: An Empirical Investigation into Novelty and Nature of Innovations
Hagenau and Tiwari (2017) 30
4. Conclusions and Implications
This study built a database of 178 innovations by more than 140 individual innovators from a
basis of 1.200 news reports. The innovations were classified by a variety of criteria derived
from current literature and an initial evaluation of the results has been conducted. The follow-
ing sections discuss the methods and sources used for this study and its initial results. Possible
practical implications as well as avenues for future research will be examined.
4.1. Discussion
The evaluations conducted in section 3.2.1showed a considerable share of radical innovations
and such with disruptive potential (both low-end and new-market) among the study sample.
This finding very much agrees with past statements that India is in the process of establishing
itself as a hub for disruptive innovation (Bellman, Misquitta and Glader, 2009; Prahalad and
Mashelkar, 2010) and the interconnectedness between disruptiveness and frugality (Hart and
Christensen, 2002; Tiwari and Herstatt, 2012a).
The distribution of innovative effects among the evaluated innovations confirms the im-
portance of reduced costs for potentially disruptive innovations (e.g. Christensen, 1997) and
also highlights a large share of innovations increasing the availability of a product or service
among those with disruptive potential. As numerous case studies have shown, the rural Indian
environment poses significant challenges to traditional distribution networks and supply
chains both in the product and service sectors (Immelt et al, 2009; Gradl et al, 2010;
Wooldridge, 2010). As these challenges, among others comprised of widespread population,
little infrastructure and low levels of literacy and education, and low amounts of daily per
capita income (Prahalad and Hart, 2002), have seldom been part of the innovation process of
products and services from the developed world, they create a number of difficulties for com-
panies trying to transfer their innovations into the emerging market. Hence, innovations
adapting traditional solutions from the developed world often encompass ways to simplify
access and distribution. For similar reasons, data-infrastructure and telecommunications (that
reduce the dependence on heavy infrastructure such as power grids, land lines etc.) are among
the most strongly represented industries within the sample. While the tendency of India de-
veloping towards a hub for software and electronics has been recognized before (e.g. Ernst et
al, 2009; Vardi, 2010), this finding further justifies this development towards an Indian lead-
ership in widespread, cheap access channels (be they digital or not).

Made in India for the World: An Empirical Investigation into Novelty and Nature of Innovations
Hagenau and Tiwari (2017) 31
A considerably higher share of radical innovations by innovators from India compared to in-
novators from the developed world (section 3.2.2(similar numbers for innovations with dis-
ruptive potential) support the importance of ‘social capital’ and knowledge of local customs
and environments as an important factor in the successful development of innovations tailored
for an emerging market, as other studies have suggested on a case and theory basis
(Subramaniam and Youndt, 2005; Tiwari and Herstatt, 2012a). The findings of section
3.2.1contribute to this a much higher share of radical and disruptive innovations for small and
micro-innovators, giving credit to a) Christensen and Raynor’s (2003) claim that such innova-
tions thrive better within smaller organizational units and start-ups and b) supporting the con-
nection between frugality and disruption, as small and especially micro-enterprises are ex-
pected to make more use of ‘good enough’/ frugal technologies and choosing unestablished
solutions for their innovations (Hart and Christensen, 2002; Prahalad and Mashelkar, 2010).
Combined, these findings also provide credit to emerging theories talking about India as a
possible ‘Lead Market’ for frugal innovation (Tiwari and Herstatt, 2012a; b).
Additionally, the strong increase in technology orientation for innovations by companies from
developed countries suggests a rising availability as well as trust in local resources and know-
how.
Beyond the results from the actual data evaluation, the process for categorizing innovations
according to a consistent typology developed in section 2 of this paper can easily be applied
for other innovation studies and thereby contributes the literature on innovation studies and
their comparison. The application of this process on the study’s data sample yielded addition-
al insights into the relation of different innovation classification schemes (such as disruption
vs. novelty), further simplifying future studies.
4.2. Practical & Managerial Implications
The findings presented in this study have several implications for firms innovating in the con-
text of emerging markets and especially India. When aiming for radical and/ or disruptive in-
novations that may be transferrable to developed markets, India’s natural conditions favor in-
novative distribution channels, high product and service availability, and low life-cycle cost.
Hence these are areas best developed within the emerging market, using local knowledge.
Additionally, the use of small organizational sizes for such innovations seems preferable.
As the amount of technology oriented innovation from India as well as for the Indian market
(especially by innovators from developed countries) increases noticeably over the timeframe

Made in India for the World: An Empirical Investigation into Novelty and Nature of Innovations
Hagenau and Tiwari (2017) 32
of inspection, traditional reservations against building technology hubs within emerging mar-
kets seem to shrink for established players, thereby further increasing the viability of localized
R&D within emerging markets.
4.3. Implications for Further Research
The sources used for this study are all internet-based news reports. An influence of this choice
on the resulting spectrum of innovations through uneven coverage of the innovative landscape
and focused PR-campaigns of major firms cannot be ruled out. However, these effects may
well be countermanded by focused grassroot-networks and innovation prizes, making up a
significant portion of the sample.
The scope of this study allowed for the chosen two-year timeframe. While this yielded a suf-
ficiently large number of innovations to deduce clusters, timelines are still heavily influenced
by spikes and outliers introduced through tournaments, prizes and in-depth media coverage of
single events. Accordingly, regressional analyses and statistical significance testing are
among the analysis methods suggested for future research projects.
Building upon the results of this study as well as its above mentioned limitations, several ex-
tensions and more specific avenues for further research are suggested. For once, the
timeframe and depth of analysis can be extended consistently by using the criteria described
in this paper. By covering a greater timespan and increasing the number of innovations, the
results, especially for timeline evaluations, can be improved and made less vulnerable to out-
liers and spikes in the data. Such an extension of the study would also permit the evaluation
of policy changes on innovation activity – changes that would not be visible within the pre-
sent timelines.
By extending not the number of cases in the sample but the evaluation criteria, additional in-
fluences on the success of innovations may be gained. Promising criteria for such extensions
are the innovations’ target population (rural/ urban, rich/ poor) and the requirement of social
capital in order to implement any given innovation. These two criteria might deliver meaning-
ful insight into the possibilities of foreign innovators to develop solutions for local markets
with or without local involvement in the R&D process.
Finally, a comparison of the results with similar data from other emerging markets (e.g. China,
Russia, South America) would yield a valuable distinction between factors typical for the in-
dividual market and results generally applicable to emerging economies and their innovation

Made in India for the World: An Empirical Investigation into Novelty and Nature of Innovations
Hagenau and Tiwari (2017) 33
systems. Similar results could be achieved by gathering a comparable sample of innovations
from developed countries in order to better contrast the different shares of innovation types
against each other.
Extending the database in one or several of the above directions should also permit the use of
more in-depth statistical analysis such as regressions and significance testing.
---
Acknowledgements
Rajnish Tiwari would like to thank Claussen Simon Foundation for supporting his research at TUHH with a gen-
erous grant.
---
Bibliography
Ablett, J., A. Baijal, E. Beinhocker, A. Bose, et al (2007): "The 'Bird of Gold': The Rise of
India's Consumer Market", San Francisco, McKinsey Global Institute.
Bellman, E., S. Misquitta, and P. Glader (2009):Indian Firms Shift Focus to the Poor, Wall
Street Journal Online
Chakrabarty, R. (2010):Bollywood channel Zing creates India's first channel innovation,
Chandy, R. K. and G. J. Tellis (2000): "The incumbent's curse? Incumbency, size, and radical
product innovation," The Journal of Marketing 64: 1-17.
Christensen, C. (1997): The Innovator's Dilemma, New York, HarperCollins.
Christensen, C. M. and M. E. Raynor (2003): The innovator's solution: Creating and
sustaining successful growth, Boston, Harvard Business Press.
Ernst, H., A. Dubiel, and M. Fischer (2009): Industrielle Forschung Und Entwicklung in
Emerging Markets: Motive, Erfolgsfaktoren, Best-Practice-Beispiele, Wiesbaden, Gabler
Verlag.
eurostat (2008): "NACE Rev. 2 - Statistical classification of economic activites in the
European Community", Luxembourg, eurostat - Statistical Office of the European
Communities.
eurostat (2011): "Key figures on European business", Luxembourg, eurostat - Statistical
Office of the European Communities.
Garcia, R. and R. Calantone (2001): "A critical look at technological innovation typology and
innovativeness terminology: a literature review," Journal of Product Innovation
Management 19: 110 - 132.

Made in India for the World: An Empirical Investigation into Novelty and Nature of Innovations
Hagenau and Tiwari (2017) 34
Gerybadze, A. and S. Merk (2014): "Offshore R&D and Host-country Patenting of
Multinational Corporations in Emerging Countries," International Journal of Technology
Management 64(2-4): 148-179.
Gibbert, M., M. Hoegl, and L. Välikangas (2007): "In praise of resource constraints," MIT
Sloan Management Review 48(3): 15-17.
Gradl, C., M. Herrndorf, C. Knobloch, and R. Sengupta (2010): "Learning to Insure The Poor
- Microinsurance Report", Munich, Allianz Group.
Hart, S. L. and C. M. Christensen (2002): "The great leap," Sloan Management Review 44(1):
51-56.
Herstatt, C., R. Tiwari, S. Buse, and D. Ernst (2008): "India's National Innovation System:
Key elements and corporate perspectives," East-West Center Working Papers; Economic
Series 96.
Hill, C. W. L. and F. T. Rothaermel (2003): "The performance of incumbent firms in the face
of radical technological innovation," Academy of Management Review 28(2): 257-274.
Immelt, J. R., V. Govindarajan, and C. Trimble (2009): "How GE is Disrupting Itself,"
Harvard Business Review October 2009: 56-65.
Knowledge@Wharton (2005):Human Capital: Can India Bridge the Knowledge Gaps Needed
for Research?, Knowledge@Wharton
Kumar, N. and P. Puranam (2012): India Inside: The Emerging Innovation Challenge to the
West, Boston, MA, Harvard Business Review Press.
Lee, Y., B. W. Lin, Y. Y. Wong, and R. J. Calantone (2011): "Understanding and Managing
International Product Launch: A Comparison between Developed and Emerging Markets,"
Journal of Product Innovation Management 28(s1): 104-120.
Mahajan, V. and B. G. Ramola (1996): "Financial services for the rural poor and women in
India: Access and sustainability," Journal of International Development 8(2): 211-224.
Nakata, C. (2012): "Creating New Products and Services for and with the Base of the
Pyramid," Journal of Product Innovation Management 29(1): 3-5.
OECD and Eurostat (2005): Oslo Manual: Guidelines for Collecting and Interpreting
Innovation Data, Paris, Organisation for Economic Co-Operation and Development (in
joint publication with Eurostat).
Prahalad, C. K. and S. L. Hart (2002): "The Fortune at the Bottom of the Pyramid,"
strategy+business Spring 2002(26).
Prahalad, C. K. and R. A. Mashelkar (2010): "Innovation's Holy Grail," Harvard Business
Review July-August 2010.
RBI (2011): "Handbook of Statistics on Indian Economy", Mumbai, Reserve Bank of India.
Schumpeter, J. A. (1934): Theorie der wirtschaftlichen Entwicklung: Eine Untersuchung über
Unternehmergewinn, Kapital, Kredit, Zins und den Konjukturzyklus, Berlin, Duncker &
Humblot.
Made in India for the World: An Empirical Investigation into Novelty and Nature of Innovations
Hagenau and Tiwari (2017) 35
Sehgal, V., K. Dehoff, and G. Panneer (2010): "The importance of frugal engineering,"
strategy+business Summer 2010(59): 1-5.
Subramaniam, M. and M. A. Youndt (2005): "The influence of intellectual capital on the
types of innovative capabilities," The Academy of Management Journal: 450-463.
Tiwari, R. and C. Herstatt (2012a): "Frugal Innovations for the ‘Unserved’ Customer: An
Assessment of India’s Attractiveness as a Lead Market for Cost-effective Products,"
Hamburg University of Technology - Working Paper 69.
Tiwari, R. and C. Herstatt (2012b): "India – A Lead Market for Frugal Innovations?
Extending the Lead Market Theory to Emerging Economies," Hamburg University of
Technology - Working Paper 67.
TRAI (2011): "Highlights of Telecom Subscription Data as on 31st December, 2011", Press
Release, New Delhi, Telecom Regulatory Authority of India.
UNCTAD (2005): Globalization of R&D and Developing Countries: Proceedings of the
Expert Meeting, New York, United Nations Conference on Trade and Development.
Utterback, J. M. and W. J. Abernathy (1975): "A Dynamic Model of Process and Product
Innovation," The International Journal of Management Science 3(6).
Vardi, M. Y. (2010): "Globalization and Offshoring of Software Revisited," Communications
of the ACM 53(5): 5-5.
Veach, E. (2010): Vecor Recycles Waste From Coal Plants Into Building Materials, The Wall
Street Journal.
Wooldridge, A. (2010): The World Turned Upside Down - A special report on innovation in
emerging markets, The Economist, London, The Economist.