MAC/PHY Cross-Layer Design for Improved Vehicular … Cross-Layer Design for Improved Vehicular...
69
University of Windsor Scholarship at UWindsor Electronic eses and Dissertations 2013 MAC/PHY Cross-Layer Design for Improved Vehicular Safety Messaging Reliability and Simulation Environment Design William Cassidy Universty of Windsor Follow this and additional works at: hp://scholar.uwindsor.ca/etd is online database contains the full-text of PhD dissertations and Masters’ theses of University of Windsor students from 1954 forward. ese documents are made available for personal study and research purposes only, in accordance with the Canadian Copyright Act and the Creative Commons license—CC BY-NC-ND (Aribution, Non-Commercial, No Derivative Works). Under this license, works must always be aributed to the copyright holder (original author), cannot be used for any commercial purposes, and may not be altered. Any other use would require the permission of the copyright holder. Students may inquire about withdrawing their dissertation and/or thesis from this database. For additional inquiries, please contact the repository administrator via email ([email protected]) or by telephone at 519-253-3000ext. 3208. Recommended Citation Cassidy, William, "MAC/PHY Cross-Layer Design for Improved Vehicular Safety Messaging Reliability and Simulation Environment Design" (2013). Electronic eses and Dissertations. Paper 4963.
Transcript of MAC/PHY Cross-Layer Design for Improved Vehicular … Cross-Layer Design for Improved Vehicular...

University of WindsorScholarship at UWindsor
Electronic Theses and Dissertations
2013
MAC/PHY Cross-Layer Design for ImprovedVehicular Safety Messaging Reliability andSimulation Environment DesignWilliam CassidyUniversty of Windsor
Follow this and additional works at: http://scholar.uwindsor.ca/etd
This online database contains the full-text of PhD dissertations and Masters’ theses of University of Windsor students from 1954 forward. Thesedocuments are made available for personal study and research purposes only, in accordance with the Canadian Copyright Act and the CreativeCommons license—CC BY-NC-ND (Attribution, Non-Commercial, No Derivative Works). Under this license, works must always be attributed to thecopyright holder (original author), cannot be used for any commercial purposes, and may not be altered. Any other use would require the permission ofthe copyright holder. Students may inquire about withdrawing their dissertation and/or thesis from this database. For additional inquiries, pleasecontact the repository administrator via email ([email protected]) or by telephone at 519-253-3000ext. 3208.
Recommended CitationCassidy, William, "MAC/PHY Cross-Layer Design for Improved Vehicular Safety Messaging Reliability and Simulation EnvironmentDesign" (2013). Electronic Theses and Dissertations. Paper 4963.
MAC/PHY Cross-Layer Design for Improved Vehicular Safety Messaging Reliability and Simulation Environment Design
By
William G. Cassidy
A Thesis Submitted to the Faculty of Graduate Studies through the Department of Electrical and Computer Engineering
in Partial Fulfillment of the Requirements for the Degree of Master of Applied Science
at the University of Windsor
Windsor, Ontario, Canada
2013
© 2013 William G. Cassidy

MAC/PHY Cross-Layer Design for Improved Vehicular Safety Messaging Reliability and Simulation Environment Design
by
William G. Cassidy
APPROVED BY:
______________________________________________
Dr. Arunita Jaekel School of Computer Science
______________________________________________
Dr. Huapeng Wu Electrical & Computer Engineering
______________________________________________
Dr. Kemal E. Tepe, Advisor Electrical & Computer Engineering
(2013-06-26)

iii
DECLARATION OF CO-AUTHORSHIP / PREVIOUS PUBLICATION
I. Co-Authorship Declaration
I hereby declare that this thesis incorporates material that is result of joint research, as follows: results of investigations used technologies that were developed in the WiCIP research laboratory. The investigations were supported by collaborative help from others in lab the form of advice, critiques, and mentoring. This thesis also incorporates the outcome of joint research undertaken in collaboration myself and Dr. Nabih Jaber under the supervision of Professor Dr. Kemal E. Tepe. Additionally, results from from interference modelling were published with assistance and supervision from Dr. Nabih Jaber, Shawn Ruppert, Jahangir Toomoir, Dr. Kemal E. Tepe and Dr. Esam Abdel Raheem. In all cases, the key ideas, primary contributions, experimental designs, data analysis and interpretation, were performed by the author, and the contribution of co-authors was primarily through the provision of suggestions, comments, critiques, verification and other supports.
I am aware of the University of Windsor Senate Policy on Authorship and I certify that I have properly acknowledged the contribution of other researchers to my thesis, and have obtained written permission from each of the co-authors to include the above material(s) in my thesis.
I certify that, with the above qualification, this thesis, and the research to which it refers, is the product of my own work.
II. Declaration of Previous Publication
This thesis includes parts from [5] original papers that have been previously published/submitted for publication in peer reviewed journals, as follows:
Thesis Chapter
Publication title/full citation Publication status*
Part of Chapter 2
W. G. Cassidy, N. Jaber and K. E. Tepe. Cross layer consideration for improved reliability of vehicular safety messaging. Presented at Communications (QBSC), 2012 26th Biennial Symposium on. 2012.
Published
Part of Chapter 3
W. G. Cassidy, N. Jaber, S. A. Ruppert, J. Toimoor, K. E. Tepe and E. Abdel-Raheem. Interference modelling and SNR threshold study for use in vehicular safety messaging simulation. Presented at Communications (QBSC), 2012 26th Biennial Symposium on. 2012.
Published
Part of Chapter 2, 4
W. G. Cassidy, N. Jaber and K. E. Tepe. Cross layer MAC and PHY architecture for collision correction of DSRC safety messages. Presented at New Technologies, Mobility and Security (NTMS), 2012 5th International Conference on. 2012.
Published

iv
Part of Chapters 2, 3, and 4
W. G. Cassidy, N. Jaber, K. E. Tepe. Collision Correction using a Cross-Layer Design Architecture for Dedicated Short Range Communications Vehicle Safety Messaging, submitted to Ad hoc networks (accepted minor corrections), 2013
Submitted (accepted minor corrections)
Part of Chapters 3 and 4
Simulation Paper, (In press) In Press
I certify that I have obtained a written permission from the copyright owners to include the above published materials in my thesis. I certify that the above material describes work completed during my registration as graduate student at the University of Windsor.
I declare that, to the best of my knowledge, my thesis does not infringe upon anyone’s copyright nor violate any proprietary rights and that any ideas, techniques, quotations, or any other material from the work of other people included in my thesis, published or otherwise, are fully acknowledged in accordance with the standard referencing practice. Furthermore, to the extent that I have included copyrighted material that surpasses the bounds of fair dealing within the meaning of the Canada Copyright Act, I certify that I have obtained a written permission from the copyright owner(s) to include such material(s) in my thesis.
I declare that this is a true copy of my thesis, including any final revisions, as approved by my thesis committee and the Graduate Studies office, and that this thesis has not been submitted for a higher degree to any other University or Institution.

v
ABSTRACT
In vehicle-to-vehicle safety messaging, periodic safety messages can be used for safety
applications. These applications require low latency and high probability of reception, however
there can be a problem with unsuccessful reception due to collision of these safety messages
when there are sufficiently large amount of vehicles and/or repetitions. Literature proposes
repetition based broadcasting to increase reception probability, while decreasing average
reception delay; however this increases the probability of packet collision and overall network
traffic. In this thesis, we introduce a new cross-layer design, which allows for collision correction
of safety message repetitions for further improving probability of reception. We describe our
design as well as simulation using various repetition schemes under different packet error rates
and compare our cross-layer collision correction method with non-collision correcting
performance. Once implemented, this new approach can substantially improve the reception
likelihood of safety messages, without loss of latency, and potentially make active vehicle safety
applications more responsive.

vi
DEDICATION
I dedicate this to my close friends and family, whom have provided their support and love over the years.
Especially for my parents Gerald and Rosina, foster mother Linda, and my siblings Nicole, Lianne, Jamie, Julianne, Danny, Jeannine, Sheana, Sean, and Peter.

vii
ACKNOWLEDGMENTS
I would like to express my thanks to Dr. Kemal Tepe, committee members, WiCIP Lab, and my good friend and colleague Dr. Nabih Jaber.

viii
TABLE OF CONTENTS
Declaration of Co-Authorship / Previous Publication .................................................................... iii
Abstract ............................................................................................................................................ v
Dedication ....................................................................................................................................... vi
Acknowledgments.......................................................................................................................... vii
List of Tables .................................................................................................................................. xi
List of Figures ................................................................................................................................ xii
List of Appendices ........................................................................................................................ xiv
List of Abbreviations/Symbols ...................................................................................................... xv
Nomenclature ............................................................................................................................... xvii
Chapter 1 Introduction ..................................................................................................................... 1
1.1. Motivation for this work .................................................................................................. 1
1.2. Introduction to this thesis ................................................................................................. 1
1.3. Introduction summary ...................................................................................................... 2
Chapter 2 Literature Review ............................................................................................................ 3
2.1. Literature review .............................................................................................................. 3
2.1.1. CLD related works ................................................................................................... 3
2.1.2. Repetition protocols ................................................................................................. 3
2.1.3. DSRC MAC ............................................................................................................. 4
2.1.4. DSRC PHY .............................................................................................................. 5
2.1.5. Conventional DSRC receiver ................................................................................... 6
2.2. Literature review summary .............................................................................................. 7
Chapter 3 Philosophy of approach ................................................................................................... 8
3.1. Philosophy of approach highlights ................................................................................... 8
3.2. Research and literature review of technology .................................................................. 8
3.2.1. Literature review of DSRC and simulation tools ..................................................... 8
3.2.2. Recognizing safety application requirements of DSRC ........................................... 8
3.3. Identifying potential problems ......................................................................................... 8
3.4. Choosing a problem to solve ............................................................................................ 9
3.4.1. Cross-layer design .................................................................................................... 9

ix
3.4.2. Synchronous vs. Asynchronous ............................................................................... 9
3.5. Proposing a solution ......................................................................................................... 9
3.5.1. Required frame format ........................................................................................... 10
3.6. Scenario analysis ............................................................................................................ 10
3.7. Modelling analytically ................................................................................................... 12
3.7.1. Scenario.................................................................................................................. 12
3.8. Model for simulation ...................................................................................................... 16
3.8.1. Simulation methodology and parameters ............................................................... 16
3.8.2. Interference Modelling Approach .......................................................................... 17
3.9. Drawing conclusions ...................................................................................................... 20
3.10. Documentation publication and sharing knowledge gained ...................................... 20
3.11. Philosophy of approach summary .............................................................................. 20
Chapter 4 Description of the work ................................................................................................. 21
4.1. Cross-Layer Architecture Design................................................................................... 21
4.1.1. Correction scheme ................................................................................................. 22
4.1.2. Detailed design behaviour ...................................................................................... 23
4.2. Simulator ........................................................................................................................ 26
4.2.1. Simulator implementation ...................................................................................... 26
4.2.2. Simulator Optimization .......................................................................................... 27
4.2.3. Architecture ............................................................................................................ 27
4.2.4. Mobility Model ...................................................................................................... 28
4.2.5. Channel simulation ................................................................................................ 33
4.2.6. Model Broadcast .................................................................................................... 34
4.2.7. Model verification .................................................................................................. 34
4.2.8. Simulator Conclusions ........................................................................................... 36
4.3. Simulation results........................................................................................................... 36
4.4. Summary of CLD proposal and simulation ................................................................... 40
Chapter 5 Conclusion ..................................................................................................................... 41
5.1. Concluding statements ................................................................................................... 41
5.1.1. Literature review conclusions ................................................................................ 41
5.1.2. Philosophy of approach conclusions ...................................................................... 41

x
5.1.3. Description of work conclusions ............................................................................ 41
5.1.4. Results conclusions ................................................................................................ 42
5.2. Final thoughts................................................................................................................. 42
References ...................................................................................................................................... 43
Appendices ..................................................................................................................................... 46
Appendix A Simulation Manual .................................................................................................... 46
A.1. DSRC Simulator System Requirements ........................................................................ 46
A.2. Running a simulation ..................................................................................................... 46
A.3. Physical layer test script ................................................................................................. 46
Appendix B Appendix B – List of Related Publications ............................................................... 49
B.1. Conferences.................................................................................................................... 49
B.2. Journals .......................................................................................................................... 49
VITA AUCTORIS ......................................................................................................................... 50

xi
LIST OF TABLES
Table 1 Summary of simulation parameters .................................................................................... 17
Table II – Example in range matrix ................................................................................................. 19
Table III – Example hidden node matrix ......................................................................................... 19
Table IV Example interference matrix ............................................................................................. 19
Table V – Class diagram attributes and methods descriptions ........................................................ 30
xii
LIST OF FIGURES
Figure 1 MAC data plane architecture [11]. .................................................................................... 5
Figure 2 Conventional DSRC PHY with symbols. .......................................................................... 6
Figure 3 Repetition control extended header of the MAC frame. .................................................. 10
Figure 4 Scenario with vehicles’ message colliding. ..................................................................... 11
Figure 5 Use case diagram showing repetition collision scenarios. ............................................... 12
Figure 6 Scenario with vehicle safety messages colliding ............................................................. 13
Figure 7 Probability of two collisions per slot for various repetitions. .......................................... 14
Figure 8 Monte Carlo simulation results, estimating the probability of having correctible collisions in a failed frame. ............................................................................................................ 15
Figure 9 Mobility model: varying interference ranges. ................................................................. 18
Figure 10 Interfering and hidden nodes. ........................................................................................ 18
Figure 11 Conventional DSRC PHY receiver dataflow. ............................................................... 21
Figure 12 Dataflow for combined PHY and MAC receivers. ........................................................ 22
Figure 13 Activity diagram for the MAC and PHY layers with cross-layer correction. ............... 24
Figure 14 Sequence diagram for CC CE and equalization. ........................................................... 26
Figure 15 MAC simulation processing flow, including hidden and warning matrices. ................. 28
Figure 16 Marked Emergency and non-EVs in SUMO. ................................................................ 29
Figure 17 Class diagram for mobility model, OFDM PHY and channel model ............................ 29
Figure 18 MAC simulator deployment diagram. ........................................................................... 32
Figure 19 Mobility model conversion steps. .................................................................................. 33
Figure 20 Flow between MAC, PHY, and channel simulation...................................................... 34
Figure 21 Broadcast simulation sequence diagram ........................................................................ 35
Figure 22 Sequence diagram for computing success ratio for user broadcasts. ............................. 35
Figure 23 Averaging users sequence diagram. .............................................................................. 36
Figure 24 Probability of success vs. SNR for SFR under 16QAM under varying repetitions. ...... 37
Figure 25 PER vs. SNR for SFR under 16QAM under varying repetitions. ................................. 37
Figure 26 Probability of success vs. SNR for both SPR and SFR vs. cross-layer SPR and cross-layer SFR under QPSK with 3 repetitions. .................................................................................... 38
Figure 27 Probability of success vs. SNR for SFR vs. cross-layer SFR under various modulations, 7 repetitions. ................................................................................................................................... 39
xiii
Figure 28 Probability of success vs. SNR for SFR vs. cross-layer SFR with varying modulations, 10 repetitions. ................................................................................................................................. 40

xiv
LIST OF APPENDICES
Appendix A – Simulation Manual
Appendix B – List of Related Publications

xv
LIST OF ABBREVIATIONS/SYMBOLS
Symbol Description
Y FFT of received OFDM transmission.
� OFDM symbol number.
� OFDM symbol subcarrier index.
� OFDM transmission equalization matrix.
� Original OFDM transmission.
� Noise component of OFDM transmission.
�� Estimated combined channel response.
� Total number of OFDM symbols.
�� Original training symbols.
� Known interference range from in range, non-hidden nodes.
Communication range.
�� Interference range from taking into account hidden nodes.
� Success threshold.
Pr(T) Probability of frame transmission.
� Vehicle density.
� Transmission range.
� Repetitions per frame.
� Interfering users.
� Number of time slots in MAC frame.

xvi
� Number of repetition successes for a vehicle.
� Number of collisions for a time slot.
� Probability of transmission for a vehicle in a particular slot, given they are transmitting in the frame.

xvii
NOMENCLATURE
Acronym Description
AWGN Additive white Gaussian noise
BER Bit error rate
BPSK Binary phase shift keying
CC Collision correction
CCEQ Collision correction equalization (also CC/EQ)
CE Channel estimator
CLD Cross-layer design
DOM Document object model
DSRC Dedicated short range communication
EQ Equalizer
ITS Intelligent Transportation System
KIC Known interference cancellation
LLC Logical Link Control
MAC Medium access control layer
MRH MAC repetition history
MSDU MAC service data unit
NS2 Network simulator 2
OFDM Orthogonal Frequency Division Multiplexing
PER Packet error rate

xviii
PHY Physical layer
QAM16 Quadrature amplitude modulation 16
QAM64 Quadrature amplitude modulation 64
QoS Quality of service
QPSK Quadrature phase shift keying
SFR Synchronous fixed repetition
SNR Signal-to-noise ratio
SPR Synchronous P-persistent repetition
SUMO Simulation of urban mobility
UML Unified modelling language
XML Extensible markup language
1
Chapter 1 INTRODUCTION
In this chapter, an introduction to this thesis is provided for the purpose of highlighting what the reader will be presented with in this work. Initially a discussion with brief overview of the research approach is offered, which is followed by an introduction to the work that was done for this thesis. Details and more descriptive explanations are presented in the later chapters.
1.1. Motivation for this work
Dedicated short range communications (DSRC) is a communication technology intended vehicle-to-vehicle and vechile-to-infrastructure communications. It has channel bands intended for safety and non-safety applications, and has spectrum allocated in the 5.9GHz band. The draft version of the DSRC lower medium access control (MAC) and (PHY) was published as part of the IEEE 802.11p amendment standard for wireless access in vehicular environment in 2010.
Safety applications are being developed for future use when DSRC technologies are installed in a large number of vehicles. In order to get good performance from safety applications, good QoS guarantees for latency and reception reliability is desired. This requirement has led to the investigation and testing of repetition-based medium access control (MAC) protocols for use in DSRC safety messaging. Current repetition based repetition protocols can improve reception reliability and keep latency relatively low, but can also suffer as the number of packet repetitions and vehicles increases. The number of packet collisions increases with this increased users and repetitions, which can be very detrimental to the reliability and latency performance.
Cross-layer design (CLD) can be used to improve interaction between communication layers that normally do not share information, and can lead to optimized overall performance. Because the DSRC MAC and PHY layers have access to different information about the packet, information sharing can be investigated for optimizing communication. The potential for correcting safety message repetition packet collisions using CLD is the main motivation for this work.
1.2. Introduction to this thesis
This thesis presents a foundation for a new collision correcting MAC and PHY CLD for safety messages in DSRC. The design is intended to improve probability of reception for safety messages under certain conditions. Additionally, it requires a cache of previously received packets, and pre-informed packet repetitions.
The proposed MAC layer is based on the 802.11 DSRC MAC, but with additional components for monitoring and controlling the collision correction at the PHY. The proposed PHY is based on the conventional DSRC PHY receiver defined as part of the [1] standard for wireless access in vehicular environments.
2
A summary of the research approach is as follows:
• Literature review • Identifying potential problems • Classify problems • Proposing and designing solution(s) • Modelling solutions analytically • Model solution for simulation • Deriving conclusions
• Documenting and sharing conclusions
For this work the technologies that had to be reviewed included the DSRC MAC and PHY, as well as mobility modelling and simulation techniques. CLD, and repetitions protocols are discussed in Chapter 2 subsections 2.1.1 and 2.1.2 respectively, with more literature review presented in this thesis in Chapter 2 subsection 2.1.3 through 2.1.5 for DSRC receiver related review, and Chapter 3, specifically section 3.6 through 3.8 for analysis and modelling.
The problem of trying to reduce the effect of increased frequency of frame collisions from repetition broadcasts is investigated. More detail is given in the following chapters, including Chapter 3 section 3.3, but also specifically Chapter 4 section 4.1 provides the design for the proposed collision correcting scheme. Additionally Chapter 4 section 4.2 presents a simulation design for use in simulating the MAC and PHY layers with a combined mobility model.
A solution was designed by investigating possible areas of improvement between the MAC and PHY layers. It was found that by caching received messages at the PHY layer, and with analysis at the MAC layer, collisions could be corrected yielding improved probability of successful frame reception. More detail on this in Chapter 3 section 3.4 and also in Chapter 4.
A common method of test the efficacy of a proposed solution is to model its performance analytically. This can serve as a benchmark for approaching a particular problem, and help steer an investigation. More details on this in Chapter 3 section 3.7.
Simulation modelling is required in order to test the proposed solution, and can be tested against existing performance data, or a simulation of the conventional system. In this work the both the conventional and proposed systems were tested alongside each other under the same network conditions. More detail on this in Chapter 4 section 4.2.
From the analytical and simulation results, the modelled design was compared to the conventional system. More detail on this in Chapter 4 subsection 4.2.8, also section 4.3 and in Chapter 5.
1.3. Introduction summary
This chapter introduced what the thesis will provide the reader with, including a basic overview of research approach. The sections where the pertinent topics are discussed are indicated to make the thesis easier to navigate. The main components of this work introduced consist of repetition based DSRC MAC and PHY research and development, CLD, simulation and modelling design, and analysis and conclusions.

3
Chapter 2 LITERATURE REVIEW
In this chapter various literatures pertinent to this work are discussed. Topics covered include CLD related works, repetition protocols, and conventional DSRC receiver, all of which have been referred to in the design of the solution presented in this thesis.
2.1. Literature review
Broadcasting frequency, which depends on vehicle density and number of repetitions, and vehicle mobility can significantly affect the reliability of the reception and reduce the probability of successful message transmission due to message collisions [2]. Collisions in such random MAC schemes are not completely avoidable, especially when a large number of vehicles in the transmission region are present and number of repetitions is large. It is shown in [2] that increasing number of repetitions does not always contribute to increasing probability of success. That is why innovative techniques must be introduced to improve the probability of success to take full advantage of active safety applications that would be provided with DSRC deployment. One of such innovative techniques is to introduce cross-layer design (CLD) in the receiver architecture to improve the reception probability.
2.1.1. CLD related works
In [3], ZigZag decoding corrects packets by utilizing the a-synchronicity between collisions in repetitions to construct an error free packet. In our system, the safety messages are synchronous and hence collisions result in full packet corruption meaning the ZigZag method is not feasible. Authors in [4] make the argument that in wireless networks dealing with repetition messages, initial repetitions can be used to cancel out interference, which they call known interference cancellation (KIC). We also have the same philosophy for our proposal, but our work focuses on DSRC safety messaging as an application of KIC. Other works as in [5] propose blind methods of removing known interference in packets. Our design differs in that we intend to use repetitions of short safety messages to correct future collisions, which to our knowledge has not been proposed before.
Reference [6] presents an overview of different wireless CLDs, which motivated us to choose a CLD with shared database stored in the PHY for fast access by its components, addressable by the MAC for collision correction (CC) decision.
2.1.2. Repetition protocols
In order to improve the reliability of transmissions, repetition schemes are employed by the safety and emergency message broadcast MAC protocol of DSRC. These schemes simply repeat the messages based on some scheduling and scrambling mechanisms, such as synchronous fixed repetition (SFR), or synchronous p-persistent repetition (SPR) [7], [8] to improve reception probability (i.e., probability of successful reception) of the vehicle safety messages. However, there is no feedback (i.e., acknowledgement or negative acknowledgement) in the MAC protocol and the transmitting node assumes that at least one of the repeated messages is successfully received. Broadcasting frequency, which depends on vehicle density and number of repetitions, and vehicle mobility can significantly affect the reliability of the reception and reduce the
4
probability of successful message transmission due to message collisions [2]. Collisions in such random MAC schemes are not completely avoidable, especially when a large number of vehicles in the transmission region are present and number of repetitions is large. It is shown in [2] that increasing number of repetitions does not always contribute to increasing probability of success. That is why innovative techniques must be introduced to improve the probability of success to take full advantage of active safety applications that would be provided with DSRC deployment.
Synchronous p-persistent repetition (SPR)
SPR has a probability of transmission � for a particular slot, in such a way that each slot is independent of each other slot in the frame. The decision of whether to transmit is checked by a random comparison function. For SPR, � is chosen such that the expected number of repetitions �� � � � �, where � is the number of timeslots in the frame, but the number of repetitions is between 0 � � � �. Normally it may not be known which repetitions are scheduled to transmit when, but this decision can be pre-computed.
Synchronous fixed repetition (SFR)
SFR has a fixed number of � that can occur in the frame, here � � ��, which is chosen by the MAC protocol depending on the amount of vehicles detected as being present. The repetition slot positions are chosen randomly, but may also be pseudo random to aid in prediction of future repetitions. It was observed that SFR performs better than SPR in most cases because SFR repetition selection between nodes is fairer than SPR (SPR produces variable number of repetitions, causing sub-optimal fairness between nodes with variable resulting network traffic).
2.1.3. DSRC MAC
Dedicated short-range communications is also known as IEEE 802.11p 2010 [1] was originally proposed by the ITS for its use in the smart vehicle initiative. The MAC and PHY layers are covered in this standard.
The MAC layer for DSRC serves to coordinate the sending and receiving of messages within the wireless medium. The DSRC spectrum is a 75MHz band centred at 5.9GHz, consisting seven 10 MHz channels with a 5 MHz guard [9] (~1 MHz between each channel. Three DSRC safety message channels can be used for safety messaging purposes, these channels are defined centred at 5.850 GHz (Ch. 172), 5.890 GHz, and 5.920 GHz, for critical safety of life, control channel, and high power public safety respectively [10]. The other four channels are intended for non-safety applications such as topography updating, roadside information downloading, media streaming, infotainment, toll processing or other purposes. The proposed design in this thesis is intended for use in either of these two safety channels.
The MAC layer facilitates data exchange between nodes through the logical link control (LLC). Data is exchanged in the form of MAC service data units (MSDUs) according to the QoS specifications. For DSRC repetition based QoS is recommended. The 802.11 standard supports both synchronous and asynchronous MSDU delivery; however we only study synchronous delivery. Figure 1 illustrates data flow and various components used by the standard 802.11 based MAC including MSDU processing between the PHY and network layers.

5
Figure 1 MAC data plane architecture [11].
2.1.4. DSRC PHY
The latest revision of the 802.11p amendment from 2010 was recently incorporated as part of the 802.11 2012 standard [11], which will allow future Wi-Fi related technologies to benefit from the changes proposed for wireless access in vehicular environments.
Emergency and safety messaging applications provided by DSRC is the largest step in the direction of employing active safety mechanisms at the vehicles [12], [1], [13]. In order to convey safety messages, vehicles heart beat information is broadcasted periodically from DSRC transmitters. These messages will provide vital information such as location, heading, speed, as well as emergency information, such as airbag deployment, accident reports, to surrounding vehicles as warnings. Since reliability of these messages is very important for safety applications, repetition based broadcast MAC protocol is adopted by DSRC. These schemes simply repeat the
6
messages based on predefined scheduling and scrambling mechanisms, such as synchronous fixed repetitions (SFR) or synchronous p-persistent repetitions (SPR) [7] for improving reliability. Broadcasting frequency, which depends on vehicle density and number of repetitions, and vehicle mobility can significantly affect the reliability of the reception and reduce the probability of successful message transmission due to collisions [2], where it was shown that increasing repetitions does not always increase probability of success.
Alternative and innovative receiver design techniques must be employed to improve the probability of success in order to benefit from active safety applications provided with DSRC deployment. In this thesis, we introduce cross-layer design (CLD) to enhance the reception of messages that may have collided. CLD, which deviates from conventional layered protocol stack, has been effective in wireless communication systems as shown in [6], [14], and [15]. CLD utilizes some information and parameters available in the other layers of the protocol stack, and allows them to optimize their operation. For example, congestion information in the MAC utilized in network layer routing allows for significant routing efficiencies in wireless ad hoc networks [16]. In this work, CLD approach is between PHY and MAC layer for recovering short safety messages collisions. If one repetition is received prior to the collision event, the other message in the collision can be recovered, and potentially improve the probability of success.
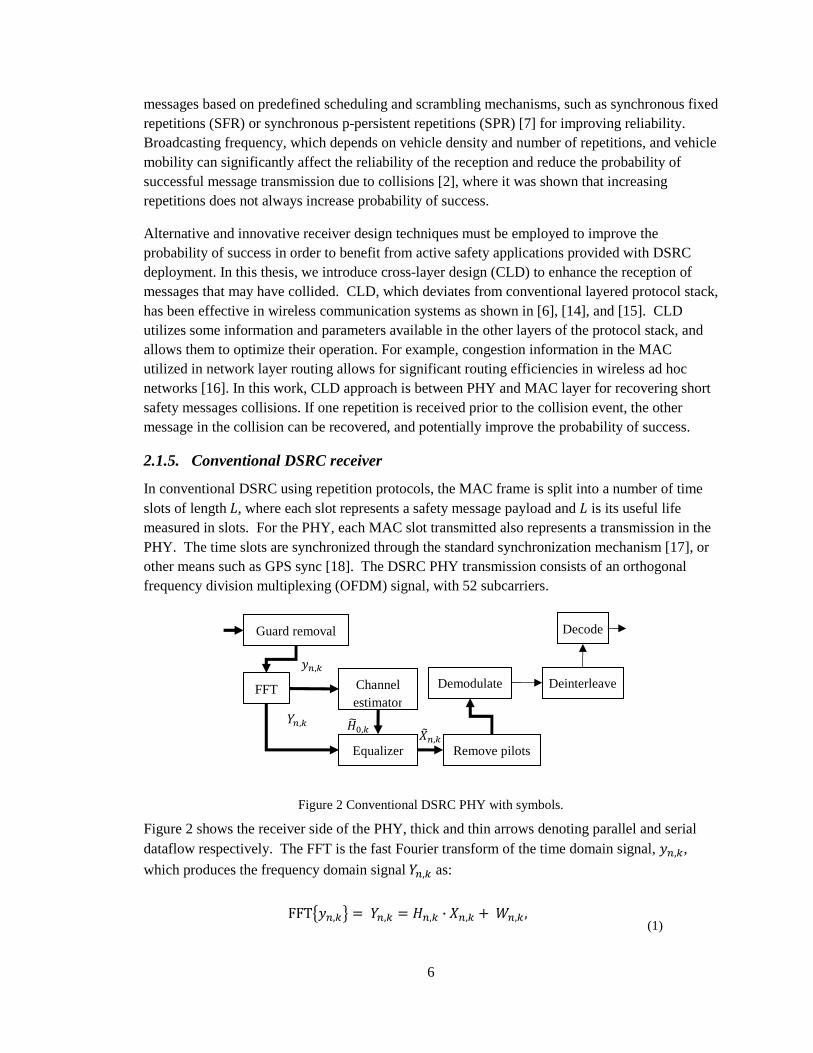
2.1.5. Conventional DSRC receiver
In conventional DSRC using repetition protocols, the MAC frame is split into a number of time slots of length �, where each slot represents a safety message payload and � is its useful life measured in slots. For the PHY, each MAC slot transmitted also represents a transmission in the PHY. The time slots are synchronized through the standard synchronization mechanism [17], or other means such as GPS sync [18]. The DSRC PHY transmission consists of an orthogonal frequency division multiplexing (OFDM) signal, with 52 subcarriers.
Figure 2 Conventional DSRC PHY with symbols.
Figure 2 shows the receiver side of the PHY, thick and thin arrows denoting parallel and serial dataflow respectively. The FFT is the fast Fourier transform of the time domain signal, � ,",
which produces the frequency domain signal # ," as:
FFT&� ,"' � # ," � � ," · � ," ) � ," , (1)
FFT
Guard removal
Channel estimator
Equalizer Remove pilots
Demodulate Deinterleave
Decode
� ,"
# ," ��*," �+ ,"

7
for 0 � � � �, where � is the total number of OFDM symbols in the PHY frame, and � ,"
and � ," are the channel frequency response and AWGN for the �,- OFDM symbol and the �,- subcarrier, respectively. The training symbols are the known OFDM Symbols for use in the channel estimation (CE) block. In the CE, two training symbols �� are used to obtain the estimated channel response for the first OFDM symbol averaged over the first two received symbols:
��*," � .�/0," ) �/1,"2 .2 · ��,"2⁄ (2)
where the subscripts y6 and y7 represent the first two received OFDM symbols. The conventional DSRC system uses the same channel response estimated for the first OFDM symbol
throughout the entire packet; hence the channels were assumed time-invariant (i.e. ��*," 8 �� ,"). At the signal compensator, the received data symbols of the packet are compensated by the estimated channel response:
�+ ," � # ," ��*,"⁄ (3)
The knowledge of how the conventional DSRC receiver equalizes the received frame is used in our design and is discussed more in Chapter 3 section 3.2 and Chapter 4 section 4.1.
2.2. Literature review summary
This chapter provided a review of works related to this thesis specifically in regard to CLD, repetition, protocols, and how the standard DSRC receiver performs CE using its PHY. These are important as they formed a basis and starting point for the knowledge used in approaching the solution presented in this work.

8
Chapter 3 PHILOSOPHY OF APPROACH
3.1. Philosophy of approach highlights
In this chapter the methodology of approach and problem solving related to reducing the effect of message collisions on vehicular safety messages is presented. The approach consisted roughly of learning of existing technology; identifying potential problems; classify problems; proposing solution(s); modelling solutions analytically; modelling solutions for simulating; deriving conclusions; and finally documenting and sharing conclusions.
3.2. Research and literature review of technology
3.2.1. Literature review of DSRC and simulation tools
Significant time was spent researching related works and standards for the DSRC PHY and MAC layers. In order to acquire more knowledge about DSRC, work done previously was studied including work done by researchers at WiCIP research lab, the IEEE standard committees and other scholarly authors. Hands-on experience was gained through the use of an OFDM based simulator, for which custom experiments could be performed. The code of the simulator was inspected to learn more about it, which served as a research aid while studying related materials, especially with respect to learning how the signals were being processed.
3.2.2. Recognizing safety application requirements of DSRC
The scope of the final safety applications is not entirely known and is a subject that is currently popular in the literature. The potential for safety applications is high, and additionally strict QoS requirements are not the same for each application. Hence it is important to try and achieve as high QoS requirements as possible with the information we have, i.e. knowledge that high reliability and low latency is desired. Therefore the improvement of these two metrics of reception probability and to a lesser extent latency is the main focus for this work.
3.3. Identifying potential problems
It is clear that vehicle-to-vehicle safety applications require low latency, and high probability of reception success.
The time interval should be small, between when the transmitting node sends some safety critical information to the time in which a receiving vehicle receives and responds to this information. Suggested minimum times are commonly related to human reaction time, stating minimums around 200 ms. This is because if a critical safety application is slower than this; its benefit is seen as not as good as what a human can do already. Not all safety applications require such stringent delays, but when designing at the lower network layers it is good to optimize under the knowledge of what kind of constraints may be needed.
The probability of success for the safety messages needs to be high, which can be reduced due to the broadcast nature of DSRC safety transmissions. This one-to-many approach does not allow for acknowledgment of reception of frames. One of the reasons for this is that the size of an

9
acknowledgment message would be significant in size to a safety message itself. Additionally having multiple acknowledgments from many vehicles is not feasible. CSMA/CA is normally used for collision avoidance, but cannot be used for broadcast transmissions efficiently.
Repetition has been proposed as a method of both increasing probability of success, while decreasing average delay, but at the expense of increased network traffic. This increased network traffic can cause increased number of frame collisions.
3.4. Choosing a problem to solve
Reducing the effect of repetition messaging’s increased network traffic, specifically reducing the negative effect of increased frame collisions was chosen as the problem to tackle for this thesis. Additionally the design of a simulation environment to model interactions between MAC and PHY layers with mobility is also paramount in this work.
3.4.1. Cross-layer design
Because increasing the number of repetitions alone cannot always increase the probability of successful reception of the frame, CLD is chosen as a technique to explore for this thesis. In this work, CLD is utilized to improve the probability of transmission success in emergency messaging scheme, where physical layer and MAC layer interacts to recover emergency messages even when there are message collisions. If one of the collided messages has been received successfully prior to collision event, the other message in the collision, which was not successfully received, can be recovered with knowledge of the successfully received message. Hence, the probability of success will be significantly improved. The CLD is modeled in the simulator and tested in various channel conditions. It is shown that it is most effective in high repetition scenarios.
3.4.2. Synchronous vs. Asynchronous
Accurate time can be achieved using periodic synchronization using GPS as in [18]. Additionally, vehicles have a relatively large amount of power available relative to WSNs, hence can perform time synchronization whenever required, keeping entire vehicle network synchronized. Of course propagation delay still can affect reception time, but this is assumed to be very small difference.
3.5. Proposing a solution
In order to increase probability of safety message success, a combination of using repetition messaging and CLD was approached. The existing DSRC system model is required for comparing the performance to proposed system.
MATLAB provides an interactive environment that can be used for numerical analysis, data visualization, and model programming. MATLAB is also known for its high-level language, and is a popular for engineering research and development. In this work, object oriented MATLAB classes are used for developing analytical and simulation results of the proposed CLD.

10
Unified modeling language (UML) is a method used for communicating system behaviour and relationships between components. UML is used for communicating and documenting the design throughout this thesis.
Vehicle movement simulator chosen is called the simulation of urban mobility (SUMO), which is used in vehicle traffic simulations and intended to be adapted for our use.
3.5.1. Required frame format
The frame format used for the MAC repetition control contains the number of repetitions and the position in the frame for which subsequent repetitions are scheduled. This is illustrated in Figure 3.
Figure 3 Repetition control extended header of the MAC frame.
We assume this frame structure because the addresses are read by our system in the MAC layer for the purpose of identifying potential collisions. It would also be still possible to do perform correction without this information, but would require the system to perform multiple permutations of correction, thus increasing complexity and hardware requirements considerably.
3.6. Scenario analysis
The proposed system is intended to correct a frame collision between two colliding safety messages, where one transmission is a repetition from a previously received time slot. For example, let us suppose that vehicle A has transmitted a safety message to vehicle B in a previous time slot. Suppose that vehicle C then transmits at the same time as vehicle A’s next repetition, vehicle B receives the combined collided version of vehicle A and C’s transmissions as in Figure 4. For this example, we define 3 scenarios in which vehicle B receives transmissions from vehicles A and C.

11
Figure 4 Scenario with vehicles’ message colliding.
Scenario 1: One transmission in slot (No Collision).
Step 1: A sends a packet into the wireless medium
Step 2: PHY of B detects incoming packet and checks the MAC repetition history (MRH). If no threats or any information is present, use standard OFDM PHY channel estimation (CE), otherwise see Scenario 2.
Step 3: PHY of B receives packet from A, and stores packet in the cache of received frames (CRF).
Step 4: MAC of B receives packet from PHY and inspects header (finds no potential collisions since no nodes have sent anything yet). A is sending in k time slots from now, so B records in the
�,- slot information in the MRH.
Scenario 2: Collision occurs (unavoidable) with past information of a packet is known.
Step 1: A and C send simultaneously.
Step 2: PHY of B detects incoming packet and checks MRH for potential threats, a threat is detected from A’s already received packet, so we chose to use OFDM PHY with Corrective Channel Estimation (CE\CC). The Previous Frame Selector (PFS) chooses from the MRH which packet to use for (CE\CC).
Step 3: PHY of B receives packet from A, and stores packet in CRF.
Step 4: B’s MAC Layer receives corrected packet from PHY, and inspects header for potential future collisions for improving MAC adaptive prediction and control.
Scenario 3: Collision occurs (unavoidable) with no past information.
Steps are the same as normal operation or scenario 1 assuming no cross-layer information.
A C B

12
Figure 5 Use case diagram showing repetition collision scenarios.
The UML use case diagram in Figure 5 shows the three main scenarios that a vehicle’s MAC and PHY must cope with for standard operation and collision correcting operation. The most critical scenarios are scenario 1 and 2. Scenario 1 stores a packet for future use, and transmits the safety message to the upper layers, while scenario 2 does that only after using previously stored packet to correct the reception from another transmitter. Based on this use case diagram a controller can be made to switch the CE and EQ to the appropriate mode based on the contents of the MRH and CRF.
3.7. Modelling analytically
3.7.1. Scenario
The system is intended to correct collision between two colliding safety messages given a repetition from at least one of the colliding frames has been received previously. For example in Figure 6, two nodes A and D are transmitting such that nodes B and C received corrupted frames during this transmission. In this case, if either of nodes A or D has transmitted a repetition previously, then this is the scenario in which our design comes into play and can possibly recover the other frame using the previously received one, hence KIC.

13
Figure 6 Scenario with vehicle safety messages colliding
The probability of frames colliding is based on several factors including message length l, message rate, frame length in slots (L), transmission range, vehicle distribution, channel fading, repetition scheme, and other possible factors. We can estimate the probability of collision of one vehicle’s transmissions based on a vehicle density �, transmission range d, and fixed message repetitions per frame �, and frame transmission frequency Pr.;2 as follows:
Pr<,=.successful transmission28 Pr<,J,KL.M2.� interferers2 N Pr=,O .success given � interferers2
RSTUV .W2
S*,
(4)
where I is the maximum number of possible interferers based on the distribution, and the probability of success given � interferers depends on transmission and mobility model used. Additionally the probability of success given i interferers for a node is defined as:
Pr=,O.success given � interferers2� Pr.;2W .1 Y Pr.;22RZW [ Pr.frame success2, (5)
which depends on having � users out of \ possible interfering users transmitting in the same frame, where the probability of frame success is:
Pr.frame success2 � N.Y12]6 ^��_ `aOZ= b
aO=b cW=
S6,
(6)
where s represents the number of successes of the node’s repetitions. The probability of success of at least 1 repetition in the frame is the hypergeometric relationship between successes, frame length, repetitions and number of interferers provided in Equation (6).

14
The calculation of the probability of success given that some repetitions are corrected is non-trivial. For this probability we must take into account the fact that success is not improved by simply correcting repetitions that inevitably arrive successfully. Crucially, instead we must say that only repetitions that would normally result in all failures increase the probability of success, otherwise the effect of correcting these slots would be overestimated. Needless to say, the probability of having exactly � collisions during a repetition is also required for measuring potential benefit of collision correction.
First from (6) we can directly find the probability of no success in the frame as:
Pr.no frame success2 � 1 Y N.Y12]6 ^��_ `aOZ= b
aO=b cW=
S6.
(7)
We can find the probability that exactly � collisions in a slot occur which can be written as:
Pr.� frame collisions2 � e� ) 1� f ��.1 Y �2W]6Z� , (8)
where p is:
� � Pr.slot transmission by one node2 � ��. (9)
Figure 7 shows the probability two frame collisions when L = 100 slots under various repetitions for a varying amount of interfering users.
Figure 7 Probability of two collisions per slot for various repetitions.
10 20 30 40 50 60 70 80 90 1000
0.05
0.1
0.15
0.2
0.25
0.3
0.35
i (interferers)
Pr(
2 sl
ot c
ollis
ions
)
Probability slot collisions for various repetitions vs. users
r = 2
r = 3
r = 4r = 5
r = 6
15
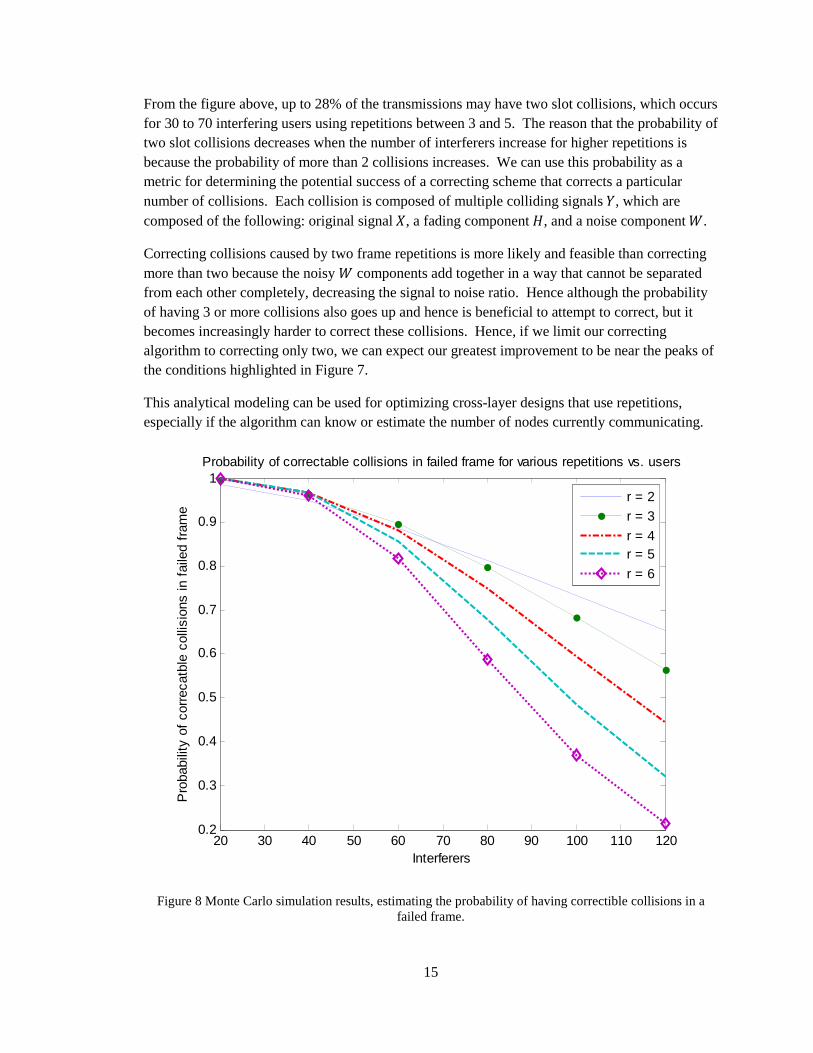
From the figure above, up to 28% of the transmissions may have two slot collisions, which occurs for 30 to 70 interfering users using repetitions between 3 and 5. The reason that the probability of two slot collisions decreases when the number of interferers increase for higher repetitions is because the probability of more than 2 collisions increases. We can use this probability as a metric for determining the potential success of a correcting scheme that corrects a particular number of collisions. Each collision is composed of multiple colliding signals #, which are composed of the following: original signal �, a fading component �, and a noise component �.
Correcting collisions caused by two frame repetitions is more likely and feasible than correcting more than two because the noisy � components add together in a way that cannot be separated from each other completely, decreasing the signal to noise ratio. Hence although the probability of having 3 or more collisions also goes up and hence is beneficial to attempt to correct, but it becomes increasingly harder to correct these collisions. Hence, if we limit our correcting algorithm to correcting only two, we can expect our greatest improvement to be near the peaks of the conditions highlighted in Figure 7.
This analytical modeling can be used for optimizing cross-layer designs that use repetitions, especially if the algorithm can know or estimate the number of nodes currently communicating.
Figure 8 Monte Carlo simulation results, estimating the probability of having correctible collisions in a failed frame.
20 30 40 50 60 70 80 90 100 110 1200.2
0.3
0.4
0.5
0.6
0.7
0.8
0.9
1
Interferers
Pro
babi
lity
of c
orre
catb
le c
ollis
ions
in f
aile
d fr
ame
Probability of correctable collisions in failed frame for various repetitions vs. users
r = 2
r = 3
r = 4r = 5
r = 6

16
Monte Carlo simulation can be used to estimate the improvement made to the reliability of the system from the proposed CLD architecture. Figure 8 provides probability of correctable two collisions given that there is a frame failure. This figure was generated using 10000 frames per scenario for two to six repetitions per users for given interfering users, assuming 150 slots per frame. Here we can see that the probability of failure due to frames that have repetitions failing by collisions involving two users is above 95% for 40 interferers, 60% to 80% for 80 interferers, and 20% to 60% for 120 interferers. This figure highlights importance of the proposed CLD architecture, where it can be effectively utilized in the majority of cases of frame failures and can be indispensible in improving reliability.
3.8. Model for simulation
To learn about how to simulate the effect of the channel the OFDM based simulator developed at WiCIP research lab [19] was studied extensively. This choice was motivated by the fact that the simulator’s designer was available to assist in the research and investigation process, facilitating understanding of how to model wireless communication. Having the source code for the simulator allowed for adaptation and re-use of various components. The existing based simulator though was designed without the ability to track collided packets. This is true of many simulators including NS2, which drop packets that collide at a receiver without further processing. Because this work focuses on collision correction, the existing simulator needed to be upgraded.
3.8.1. Simulation methodology and parameters
We simulated our system using a realistic discrete event OFDM PHY simulator developed in [19]; with appropriate changes being made to implement our CLD. The modified MAC layer and channel model are also simulated using vehicle traces in highway environments to emulate mobility. Based on these mobility traces and the probability of transmission of each user, the average number of interfering nodes was measured to be between 30 and 50 nodes variably. Additionally, because the simulation model has a boundary at which no communications are heard from beyond the scope of the trace files, we do not include nodes that are close to the edge boundary in the success calculations. Specifically, our simulator still processes these nodes, but does not take their transmission success into account for the final results, while allowing them to interfere with other users in the mobility model. Channel model depends on the mobility model’s relative velocities and relative positions to model Doppler shift and signal-to-noise ratio (SNR) respectively. Each transmission has its own channel modeling and simulation based on the environment, with colliding transmissions being combined. Appropriately, each transmission has its own channel frequency response, but we use the prior channel frequency response in the correction scheme as stored in its database, hence just like it would be in actual implementation. Doppler shift worst-case scenario for highways is simulated at 1300 Hz for vehicles travelling opposite direction to each other. Table 1 provides a summary of relevant simulation parameters used for this thesis’ results.

17
Table 1 Summary of simulation parameters
Parameter Value
Number of Vehicles 30 to 50
Mobility model Highway environment
Frame size per slot 100 bytes
Slot time 66 µs, 133 µs, and 267 µs
Slots per repetition frame (i) 150
Doppler shift range Between 0 and 1300Hz
Repetitions (j) 3, 5, 7, and 10
Modulation levels BPSK, QPSK, and QAM16
Data rate 3 Mb/s, 6 Mb/s, 12 Mb/s
Simulation duration 60 seconds (between 1500 and 6000 frames per vehicle)
If a node transmits successfully either before or after it has had one of its frames corrected by the CCE, its improved success is not included as an improvement because the vehicle’s message would have been received regardless of the CC operation.
3.8.2. Interference Modelling Approach
In this sub-section, the approach regarding interference modelling is discussed. This includes aspects of the PHY including modulation level (i.e. BPSK vs. QPSK), signal to noise ratio, and channel fading.
In order to calculate the interference of each user to another user, the data rate of each user, and the intended range of each broadcast needs to be taken into account. For the interference modelling the parameters include the distance between vehicles provided by the mobility model, and transmission power as calculated from the minimum SNR required for path loss.
Figure 9 shows a simplified example of the vehicle model with respect to interference range. It is not assumed that communication range of each vehicle is known, nor are positions known to each node, but rather it is assumed that the transmission power is related to the desired communication range. This is referred to as the minimum safety message range. This is important for incoming vehicles to be able to receive broadcasts from oncoming vehicles, but this is only possible if the transmission power can reach at least the safety message.

18
Figure 9 Mobility model: varying interference ranges.
For example in Figure 9, if the power of user A, is set to minimum required to transmit with user B, then user C will not be able to properly receive messages from A. Conversely while D maintains communication with E, user F can detect and understand communications from D. This increased message range increases safety communications at the expense of a much larger interference range. Interfering users must be taken into account to accurately simulate the communication system we are testing. We accurately model the physical layer taking into account not only hidden nodes, but also secondary interferers. This is necessary because of the passive feedback system can only be accurately modeled by taking into account these extra interfering users.
Figure 10 Interfering and hidden nodes.
In Figure 10, the nodes that are out of range of the marked user but still causing communication failures due to their transmission power. The transmission power is related to the intended range of the transmitter, and the code rate and modulation schemes. Here the circular solid line surrounds the region of communication range; the circular dashed lines show the extent of the hidden nodes from the desired user, while the circular dotted lines represents the boundary for interfering nodes which cause secondary interference to users within the communication range. The primary interference range � is:
� � 10kRlm/7* � (10)
where is the communication range, and resultantly the secondary and final interference range �� is therefore:
�� � � ) � a10kRlm/7* ) 1 b � (11)
Short range
Long
range
A
B
C
D
E
F

19
Table II – Example in range matrix
N 1 2 3 4 5 6 7 8 9
1 - 1 1 1 0 0 0 0 0
2 1 - 1 1 1 0 0 0 0
3 1 1 - 1 1 1 0 0 0
4 1 1 1 - 1 1 0 0 0
5 0 1 1 1 - 1 0 0 0
6 0 0 0 1 1 - 1 1 0
7 0 0 0 0 0 1 - 1 1
8 0 0 0 0 0 1 1 - 1
9 0 0 0 0 0 0 1 1 -
Table III – Example hidden node matrix
N 1 2 3 4 5 6 7 8 9
1 - 0 0 0 1 1 0 0 0
2 0 - 0 0 0 1 1 0 0
3 0 0 - 0 0 0 1 0 0
4 1 1 0 - 0 0 1 1 0
5 1 1 0 0 - 0 0 1 1
6 1 1 1 0 0 - 0 0 1
7 0 1 0 1 0 0 - 0 0
8 0 0 0 0 1 0 0 - 1
9 0 0 0 0 0 1 0 0 -
Table IV Example interference matrix
N 1 2 3 4 5 6 7 8 9
1 - 0 0 0 0 0 1 1 0
2 0 - 0 0 0 0 0 1 1
3 0 0 - 0 0 0 0 1 1
4 0 0 0 - 0 0 0 0 1
5 0 0 0 0 - 0 0 0 0
6 0 0 0 0 0 - 0 0 0
7 1 0 1 0 0 0 - 0 0
8 1 1 1 1 0 0 0 - 0
9 0 1 1 1 1 0 0 0 -
In order to properly measure success from the simulation, the hidden terminals need to be taken into account, defined as nodes hidden from the user whose performance we are measuring, but only include nodes detectible within one hop (i.e. detectible by users within the marked node’s communication range by other users). Interfering hidden terminals must also be taken into account which are out of communication range of each other. Hence in the simulator, both a hidden node matrix and an interference node matrix are constructed for relating the user’s visibility to each other in terms of communication and interference range. Tables II, III, and IV illustrate the contents of the in range, hidden, and interfering matrices respectively using a simple example with 9 users. Here for the hidden node matrix, a 1 indicates that a node is hidden from the adjacent node, while a 0 represents not hidden.

20
These matrices are used in the success calculations by multiplying the successes a user achieves relative to all nodes, so as to block out hidden and interfering users from the calculation. Additionally, when measuring success of a broadcast message, a success threshold � is used when counting a broadcast as being successful. Here success is only considered if the ratio between actual receivers o� and possible receivers o is greater than the success threshold. That is
if p�p q �, then success for the broadcast is considered successful, for example if � is 0.9 (90%
success threshold). If there are 10 in range users, and 9 out of 10 receive the broadcast, then the broadcast is considered successful even though there was a failure. An algorithm for determining success was used and operates as follows: for each transmitting user, compare against all possible interferers.
3.9. Drawing conclusions
In order to draw conclusions from the proposed design, the design was modelled as well as a simulator was developed. Chapter 4 section 4.3 presents simulation results, and draws conclusions from performances results.
3.10. Documentation publication and sharing knowledge gained
Several publications were created as a direct result of the investigations in this thesis; Appendix B contains a listing of related publications.
3.11. Philosophy of approach summary
In this chapter the reader was provided with a detailed account of the various choices that were made that lead to the development the proposed CC design and simulation environment. Details have been included such as interference modelling, and system requirements, and simulation methodology, which guided the design and produced results shown in the upcoming Chapter 4.

21
Chapter 4 DESCRIPTION OF THE WORK
This chapter provides a description of the work. It is hoped that by reading this that the reader can follow and understand the created designs.
4.1. Cross-Layer Architecture Design
This chapter begins with a description of the cross-layer architecture design by highlighting the components of the original DSRC PHY receiver because it links with the proposed CLD. Additionally, highlights are made regarding some components of the DSRC MAC receiver. Next the correction scheme employed in our design is introduced, including the behaviour of the new components introduced in the system. Finally we explain the simulator design used to test the performance the system.
The conventional DSRC PHY transmitter and receiver consist of components that are used for increasing reception quality, reducing interference and error correction. The first main component of the transmitter is a convolution encoder, which encodes the message. This encoding may omit some predictable bits of the encoding, i.e. puncture the encoding, which reduces message size while increasing SNR requirements at the receiver. Next a block interleaver is employed for re-arranging the encoded message; this helps with the receiver cope with burst errors that can occur in the channel. A modulator converts the interleaved message from unipolar non-return-to-zero line coding to various modulation levels (i.e. BPSK, QPSK, QAM16 or QAM64). At this point a BPSK modulated pilot and training symbol are added to the frame, which is used for predicable equalization at the receiver. The frame is mapped to a form suitable for performing the inverse 64-point FFT, used to reduce the effect of channel distortions. Finally a cyclic guard interval is added for use in correcting cross-channel interference. From here the frame is converted to analog form for transmission into the channel.
Figure 11 Conventional DSRC PHY receiver dataflow.
The DSRC PHY receiver acts in a similar but slightly more in depth inverse way as the DSRC PHY transmitter. The conventional DSRC PHY receiver components and their data flow are depicted in Figure 11, the behaviour of which is described in the rest of this paragraph. On reception from the channel the received analog signal is first quantized using an appropriate quantizer (commonly between a 6 and 8-bit quantizer is sufficient, and hence assumed for our work) and passed to the digital portion of the PHY. The resulting message has its guard interval removed, and the 64-point FFT is performed on it. Subsequently the channel estimator analyses the distortion imprinted on the set of BPSK modulated training symbols. This estimation results

22
in an estimated transfer function that can be used by the equalizer block for equalizing the received frame to more appropriate values. The frame is then demapped and has its training and pilot symbols removed before being sent through the demodulator, which produces a soft UNRZ signal. After this the frame is de-interleaved and then decoded using a Viterbi decoder.
In the next subsection we will discuss the proposed correction scheme.
4.1.1. Correction scheme
In our cross-layer frame CC method, the DSRC PHY receiver is modified to include a cache of received frames (CRF) for storing previously received frames, and also has a modified channel estimator and equalizer for performing CC. The MAC layer has previous knowledge of which frames’ repetitions have been received as stored; an index of the CRF is used as a previous frame selector (PFS) to inform the PHY as to when CC may be employed.
Figure 12 Dataflow for combined PHY and MAC receivers.

23
Figure 12 shows the dataflow for the proposed MAC and PHY receiver layers. Data coming into the PHY from the FFT is stored for future use by the cache of received frames (CRF) component. The FFT block is the same as in the standard IEEE 802.11 PHY receiver except that its output is directed towards not only the channel estimator and equalizer, but also the CRF for potential future re-use. The channel estimator of our new system differs from the original in that in addition to obtaining the regular CE using training symbols, it also provides an estimated CE based on the average difference between the input signal and a previously received and assumed collided frame. Subsequently the equalizer has been modified to take into account potential collisions in its correction as determined using information from the MAC layer, and the equalization is performed using the new CE information and CC data from a collided frame. The mathematical operations are explained in section “Channel estimation and collision correction equalizer”.
The normal dataflow between these two layers is normally just the link between decoder and cyclic redundancy code (CRC) validation, which then passes to duplication removal, MAC protocol data unit (MPDU) decryption and logical link control (LLC). As part of the LLC, the frame header is interpreted, which is used to give indication of future potential repetitions by receiving users. The PFS receives this information and provides the most likely previously received frame pointer to the CE/CC decision block in the PHY. The CE/CC decision block tells the equalizer and channel estimator (CE) blocks to perform normally, or to use the data from the CRF and operate in CC mode. Collisions are detected based on combined information of CRC failure during an MRH indicated scheduled transmission. The PFS can then identify which frame the CE/CC should use for influencing CC.
4.1.2. Detailed design behaviour
The following section is intended to provide further detail in order to facilitate reproduction of work.
This activity diagram provided in Figure 13 shows the behaviour of the improved DSRC receiver from the point just after a frame signal is received from the channel. The diagram shows what actions are performed by various components in the lower portion of the composite boxes. The execution path can end using either a termination symbol (circle with a black dot) or an end thread (circle with an x), which puts the component into an idle/wait state. It will be useful to refer to this diagram while reading the descriptions of the various components so as to more easily understand how the components interact with each other in the receiver process. The description of the components of our CC system follows.
MAC Repetition History (MRH)
The MAC repetition history (MRH) contains the information telling when frames have repeated within the previous frame. This information is used in the PFS to construct a prediction of where repetitions will next repeat.
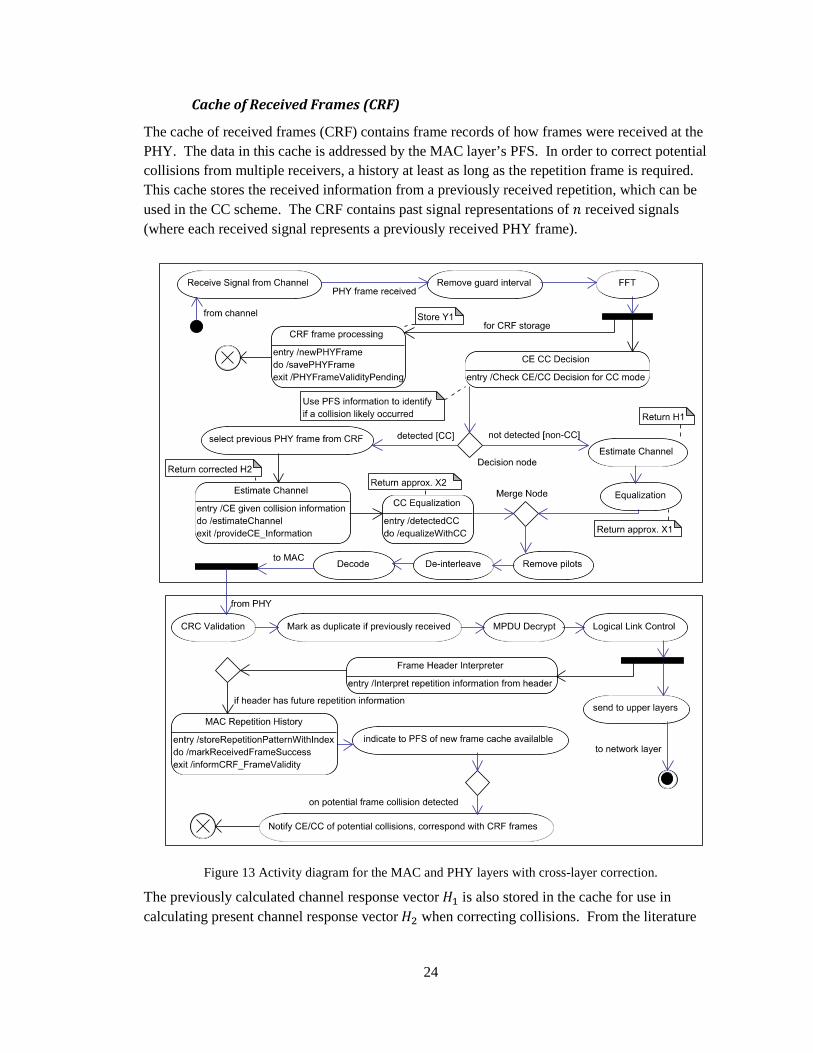
24
Cache of Received Frames (CRF)
The cache of received frames (CRF) contains frame records of how frames were received at the PHY. The data in this cache is addressed by the MAC layer’s PFS. In order to correct potential collisions from multiple receivers, a history at least as long as the repetition frame is required. This cache stores the received information from a previously received repetition, which can be used in the CC scheme. The CRF contains past signal representations of � received signals (where each received signal represents a previously received PHY frame).
Figure 13 Activity diagram for the MAC and PHY layers with cross-layer correction.
The previously calculated channel response vector �6 is also stored in the cache for use in calculating present channel response vector �7 when correcting collisions. From the literature
25
such as in [20] and [21]; it is shown that if the amount of time between the vectors is short, a subsequent future �6 will be similar.
Previous Frame Selector (PFS)
The PFS uses the MRH and CRF to make a prediction of where frame collisions may occur that can be corrected. The PFS determines the frame choice �6 sent previously and successfully by one of the nodes causing the collision to use in the correction process and is based on MRH block.
Channel estimation and collision correction decision
The CE and CC decision is made with the help of the PFS, and decides when to apply CC CE and CCE versus when to apply the standard CC and equalization. The corrective channel estimation (CE\CC) scheme takes the received previous frame from the previous PFS, and uses training data to recover either a frame header, or a full frame for use in the MAC layer. However, we need to make a decision to use the standard signal compensator (SC) for equalization or the CE/CC for correction and compensation. If the decision was that no correction is needed then the conventional SC will be used, otherwise the CE/CC will perform the CC operation to correct the corrupted message.
Channel estimation and collision correction equalizer
The CE/CCE blocks perform the CC estimation and equalization. To do this, we define the received message that was corrupted due to the collision at the MAC layer. In the cross-layer design we define that received message as simply #, and it is given by:
# � #6 ) #7 (12)
where #6 and #7 are approximately equal �6�6 and �7�7 respectively, when neglecting the effect of noise. Where for simplicity we will call �7 the originally transmitted signal we wish to recover from a collision (but it could also be �6 depending on the information available). Hence:
# 8 �6�6 ) �7�7 � ��� (13)
where �� represents the combined channel response obtained from the regular CE using the training symbols
But we need to extract the unknown received signal �7 and hence need to estimate the fading of amount of that signal �7. We estimate �7 using the currently received training data from the collided frame, subtract the mean of the previously recorded response �6� /6,/7 (apostrophe
indicates previously recorded version from CRF) achieving corrected �r7 as
�7 8 �r7 � ea��/0 ) ��/1b Y ^�6� /0 ) �6� /1_f 2 ��s . (14)
Going back to Equation (13), we have:
�7 8 �+7 � .# Y �6�62 �7⁄ . (15)

26
Therefore using Equation (14) we achieve:
�+7 8 .# Y �6�62 �r7⁄ . (16)
Now with that, the values to obtain the message �7 are possible to recover or correct.
Figure 14 Sequence diagram for CC CE and equalization.
Figure 14 represents the sequence diagram of the overall functionality of the system showing the order and how each block interacts during various operations. The CRF is storing received data from the FFT block in the PHY, and is indexed by the MRH after the frame header interpretation block confirms that its data applies to future time slots. The CRF will remove data that is not validated, or is no longer valid based on a timestamp measured in slots. The previous frame selector has access to both the MRH and CRF for the CE/CC decision block to choose either standard or CC operation, on a per slot basis. The CE/CC decision block is also must pass the address of the CC data in the CRF for CE and equalization.
4.2. Simulator
In order to test the performance of the proposed design, the simulator and simulation environment has to be developed. The following apply to the simulator: multiple vehicles broadcast and interfere with each other; SNR changes with respect to distance; Doppler shift due to relative velocity differences between transmitters and receivers effects channel fading.
4.2.1. Simulator implementation
The simulator was designed to simulate the effect of having multiple vehicle broadcasting safety messages according to a repetition protocol. This can be achieved by using discrete event

27
simulation that allows multiple vehicles to interfere at once. Combining this with Monte Carlo simulation methodology allows for more average case results to be shown.
4.2.2. Simulator Optimization
In order to reduce the time in which the simulation took to simulate transmissions, optimization of some operations was necessary. Lookup tables for BER at various Doppler shifts and signal to noise levels can be used for optimizing simulation time of transmissions that do not collide. For the situations that involve colliding frames, lookup tables are not appropriate and are fully simulated through the PHY simulator.
4.2.3. Architecture
The following illustrates our proposed architecture for simulation of the MAC layer in a vehicular safety environment. It facilitates MAC protocol comparisons that use cooperative signalling, single hop, multi hop, unicast and broadcast communications. This is done over a realistic mobility model, with vehicle positions, and relative velocities used to influence channel conditions. Additionally, the OFDM PHY is fully simulated across the channel conditions with multiple PHY simulations performed per transmission to determine appropriate success for each intended reception, as is discussed later in this section.
Important aspects of the MAC portion of the simulator will now be presented describing how MAC transmissions are processed under the assumption of message feedback that is present in such a protocol as PCCW [22]. First a transmission matrix is generated for each node which represents the intended next frame of transmission, with appropriate repetition patterns included. This matrix will be modified by the MAC protocol based on information from the previous frame, where applicable, including which nodes were heard by each other nodes. This information comes from the MAC upstream of each node that the node has access to, which has influenced its state according to its design. Combining the hidden node matrix with the warning matrix gives a very accurate representation of which nodes actually hear the warnings. Figure 15 illustrates the relationship of the simulator behaviours to one another. The warning matrix represents the view of each node’s transmissions according to MAC protocol. The influencing mobility and channel models are used for generating the Hidden node matrix, which obscures information exchange between users. The warning and hidden node matrices are used to form a view of which nodes successfully warned each other, which is used in making decisions for future slots and frames.
Essentially, to simulate the MAC, the protocol’s functionality is duplicated in the simulator so that a warning matrix can be generated for each node, basically indicating which nodes are known potential problems. In order to simulate the effects of vehicle movement on the MAC performance, the mobility model is used to get the precise locations for the purpose of simulating interference and communication range effects on the communications. The mobility model is used to calculate relative success of broadcast data. Now that we have a full node view based on in range nodes and received intentions from other nodes, the MAC protocol can then be used to broadcast into the channel. The MAC state changes after receiving new information from the PHY. This process repeats for each slot of every frame being processed as long as at least one user is transmitting during that slot.

28
Figure 15 MAC simulation processing flow, including hidden and warning matrices.
Also in Figure 15 the transmission matrix exists to represent expected transmissions as generated by the chosen MAC safety messaging protocol. This information will directly affect performance because of the passive nature of our design, where both pending possible transmissions are derived as well as potential transmission slots in which to include warning information. As mentioned, the warning matrix contains a list of future time slots that are marked for potential collisions, where each collision determination calculation is performed according to MAC warnings that each node successfully received. The success of the warnings is partially correlated with the mobility model discussed in the next subsection, which is used to generate the hidden node matrix for the simulator. Node view of warnings is where the view of each warning message is interpreted by the state machine.
4.2.4. Mobility Model
The mobility model is used to model positions, densities, number of vehicle lanes, and velocities of vehicles being simulated. It is used to modify channel conditions due to distance, affecting SNR between users as well as Doppler shift due to relative velocities of each vehicle to each other. The mobility model is a federated mobility model defined in Simulation of Urban MObility (SUMO) [23], which is a validated vehicle traffic simulator used for traffic management. It uses eXtensible Markup Language (XML) for its configuration and output, which we were able to interface with using MATLAB. Hence while the simulations of the movements were done using the Java based simulator SUMO, the configuration settings were mirrored in MATLAB for federating SUMO into our Simulator.
Figure 16 shows a visual representation of the vehicles simulated. The SUMO simulation has 2, 4, and 8 lanes and we consider a road length of 1000m. Additionally, because the simulation model has a boundary at which no communications are heard from beyond the simulation, we do not include nodes that are close to the edge boundary in the success calculations. Specifically, our simulator still processes these nodes, but does not take their transmission success into account for the final results, while allowing them to interfere with other users in the mobility model. Channel model depends on the mobility model’s relative velocities and relative positions to
Transmission
Matrix Update
Warning
matrix
Mobility
model
Hidden node
matrix
Node view of
warnings
Node state changes
check
Node’s
intentions
Transmission
pending indication
To next frame
Channel model
From previous frame Start
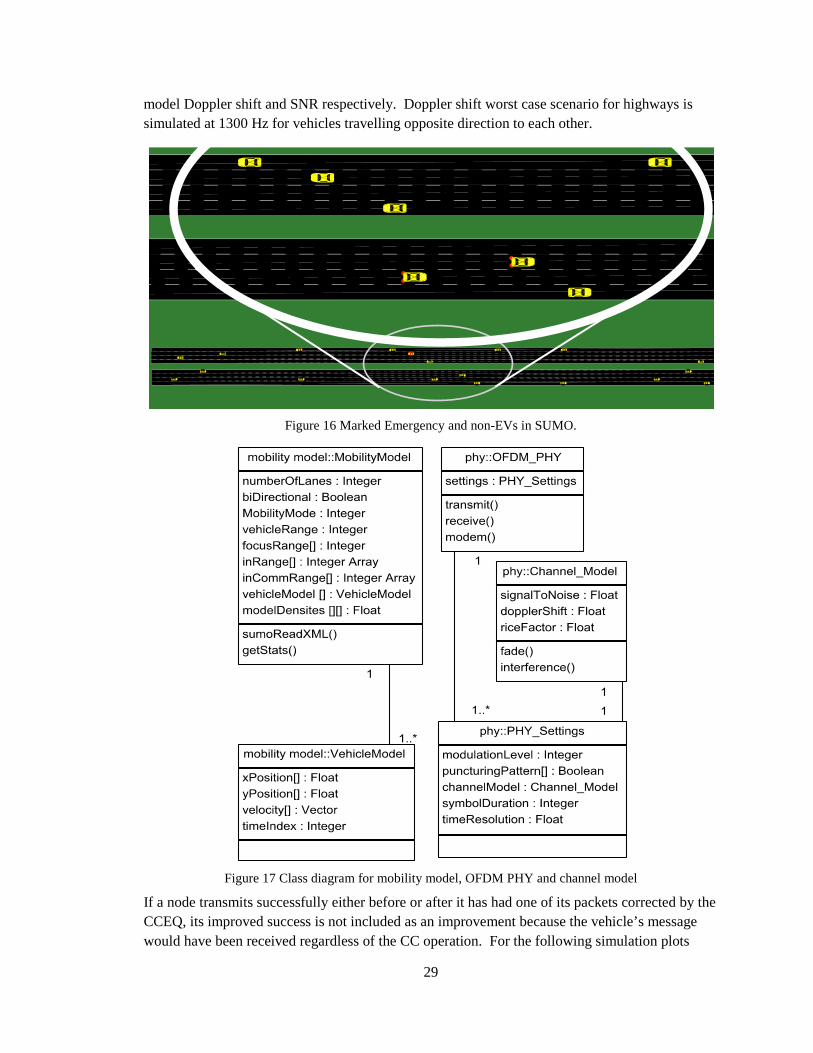
29
model Doppler shift and SNR respectively. Doppler shift worst case scenario for highways is simulated at 1300 Hz for vehicles travelling opposite direction to each other.
Figure 16 Marked Emergency and non-EVs in SUMO.
Figure 17 Class diagram for mobility model, OFDM PHY and channel model
If a node transmits successfully either before or after it has had one of its packets corrected by the CCEQ, its improved success is not included as an improvement because the vehicle’s message would have been received regardless of the CC operation. For the following simulation plots
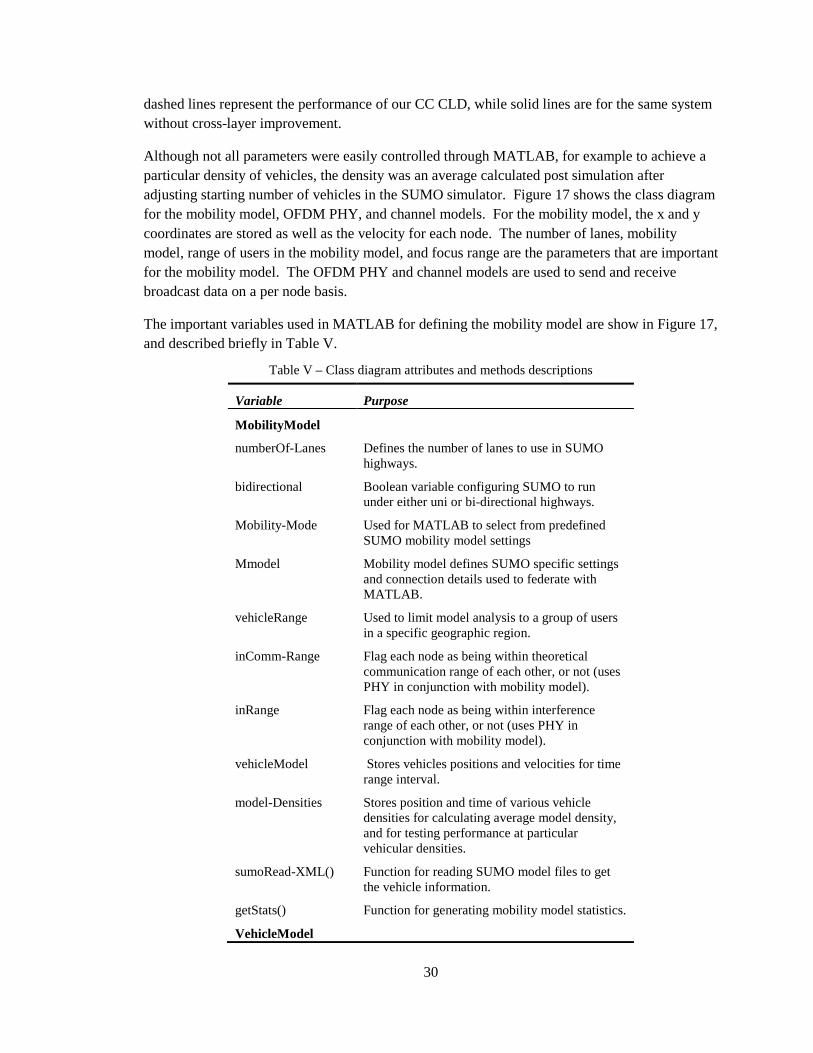
30
dashed lines represent the performance of our CC CLD, while solid lines are for the same system without cross-layer improvement.
Although not all parameters were easily controlled through MATLAB, for example to achieve a particular density of vehicles, the density was an average calculated post simulation after adjusting starting number of vehicles in the SUMO simulator. Figure 17 shows the class diagram for the mobility model, OFDM PHY, and channel models. For the mobility model, the x and y coordinates are stored as well as the velocity for each node. The number of lanes, mobility model, range of users in the mobility model, and focus range are the parameters that are important for the mobility model. The OFDM PHY and channel models are used to send and receive broadcast data on a per node basis.
The important variables used in MATLAB for defining the mobility model are show in Figure 17, and described briefly in Table V.
Table V – Class diagram attributes and methods descriptions
Variable Purpose
MobilityModel
numberOf-Lanes Defines the number of lanes to use in SUMO highways.
bidirectional Boolean variable configuring SUMO to run under either uni or bi-directional highways.
Mobility-Mode Used for MATLAB to select from predefined SUMO mobility model settings
Mmodel Mobility model defines SUMO specific settings and connection details used to federate with MATLAB.
vehicleRange Used to limit model analysis to a group of users in a specific geographic region.
inComm-Range Flag each node as being within theoretical communication range of each other, or not (uses PHY in conjunction with mobility model).
inRange Flag each node as being within interference range of each other, or not (uses PHY in conjunction with mobility model).
vehicleModel Stores vehicles positions and velocities for time range interval.
model-Densities Stores position and time of various vehicle densities for calculating average model density, and for testing performance at particular vehicular densities.
sumoRead-XML() Function for reading SUMO model files to get the vehicle information.
getStats() Function for generating mobility model statistics.
VehicleModel

31
xPosition, yPosition X and Y coordinates at particular times for individual vehicles, for calculating interference of different vehicles.
velocity Velocity of vehicles for use by PHY to calculate relative velocities between vehicles for returning Doppler shift.
timeIndex Used for knowing which time the x and y coordinates are for each vehicle.
Variable Purpose
OFDM_PHY
settings Stores the OFDM PHY settings for particular vehicles, and is used to simulate the PHY.
transmit() Simulates transmission of a packet into the channel from the MAC.
receive() Simulates reception of a packet from the channel for processing by the MAC.
modem() Performs various PHY processing such as modulate, demodulate, equalize etc.
PHY_Settings
modulation-Level Is used for part of choosing data rate, selects the number of modulation bits per OFDM symbol.
puncturing-Pattern Contains a matrix of 0s and 1s for indicating which symbols will be punctured after convolution.
channel-Model Stores the channel model simulator for the broadcast.
symbol-Duration Defines the length of time that an OFDM symbol takes to transmit, for DSRC this is 8us.
timeResolution Used for synchronizing the Mobility, MAC and PHY simulators to use the same time units.
Channel_Model
signalTo-Noise Used for modeling signal to noise ratio of each broadcast.
dopplerShift Used to model Doppler shift of each broadcast.
riceFactor Used for line of sight transmissions.
fade() Used to simulate fading of a broadcast.
Interference() Simulates interference between multiple broadcasts.

32
We use a deployment diagram in Figure 18 to represent the inner components within each module of the simulator to improve understanding of how the components are related.
Figure 18 MAC simulator deployment diagram.
The deployment diagram shows the relationship between the simulation control, transmission model, protocol simulation, mobility model, OFDM PHY simulation, and channel model. The simulation control performs the operations of scenario update which includes maintaining the time of the simulation by setting global timer, broadcast modeling (described in next section), maintaining a mobility view for determining success of each broadcast, as well as performing other statistics such as delay and throughput of the protocol. The mobility model has many parameters derived from the SUMO XML files such as lane number, and position and velocity of moving vehicles. As can be seen in Figure 18, the mobility model has multiple vehicles per lane and multiple lanes per road, but we need to process the communication as a whole and hence we combine all the data together in our simulator as the mobility model class.
The OFDM PHY simulator module shown in Figure 18 is the same as in [19], and is used to prevent and correct errors when broadcasting over the simulated DSRC channel environment. It is important to model each broadcast message properly with respect to each receiver because each node that is broadcast to has a different distance and relative velocity, meaning that the Doppler shift and SNR will be different as well. We achieve this by running multiple versions of the OFDM PHY in parallel for each broadcast with the parameters set based on the mobility model relative velocities and distances. The channel simulation used for the DSRC Simulator requires SNR, Doppler and fading. As mentioned earlier, similar to the CASS environment specified in [7] and our study done in [24] we use Friis free space model and two-ray model for calculating the SNR for short and long communication distances respectively.

33
Federating the mobility model simulation
The mobility model influencing the in range criteria used above in Figure 18 comes from the federated Simulation of Urban MObility (SUMO) vehicle traffic simulator. At the time of this writing, SUMO supports export of simulation trace data to simulators such as NS2, but has no built in support for MATLAB interactions, and hence we present a way to facilitate this interaction.
Figure 19 Mobility model conversion steps.
Figure 19 demonstrates the steps of this procedure. SUMO exports trace file information in XML format, which contains vehicle positions and velocity. We created a custom XML parser which can parse vehicle position and velocity data from a SUMO trace into MATLAB. The functionality of the XML parser is illustrated in
Figure 19. First the XML file is read into memory and converted into a Document Object Model (DOM) Class using MATLAB’s xmlread function. SUMO organizes its XML data with a main <sumo> element as the body element, subsequent <time> elements are stored within for each simulated time instance of the simulator. Inside each <time> element are the conditions of all vehicles and roads at that particular time. Hence when importing to MATLAB, each time element, roads, lanes, and vehicles are processed by reading their respective elements, and correspondingly the vehicle positions and velocities are stored in MATLAB structure format.
4.2.5. Channel simulation
A packet that receives at least 1 bit error after OFDM PHY processing is considered to have failed, and is passed to the MAC for checksum processing which drops the packet. Many simulators do not take into account the transmissions with the accuracy of having a full OFDM PHY such as NS2, and other simulators [25], [26], and [27]. Although NS2 has recently been
Convert data into Document
Object Model Class
Process main SUMO Node
Process each time data element
Store time into a time index
Process load Process lane
Process vehicle
XML file
Store position and velocity in
MATLAB format structure.
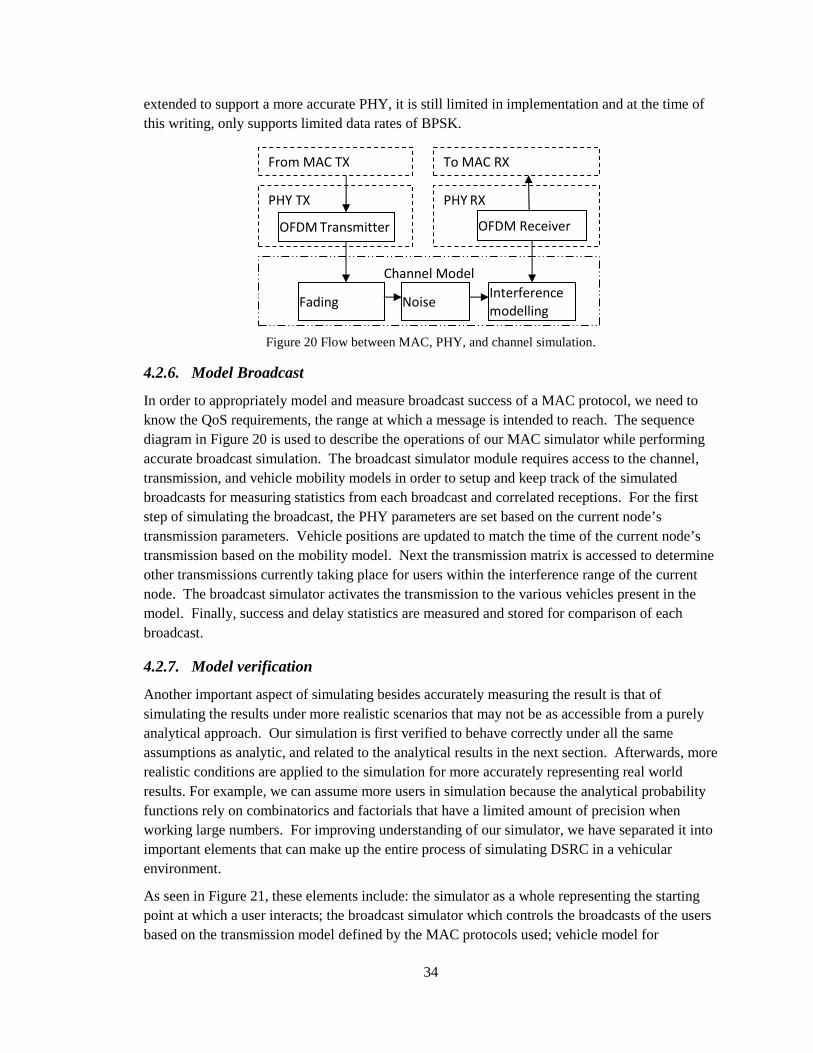
34
extended to support a more accurate PHY, it is still limited in implementation and at the time of this writing, only supports limited data rates of BPSK.
Figure 20 Flow between MAC, PHY, and channel simulation.
4.2.6. Model Broadcast
In order to appropriately model and measure broadcast success of a MAC protocol, we need to know the QoS requirements, the range at which a message is intended to reach. The sequence diagram in Figure 20 is used to describe the operations of our MAC simulator while performing accurate broadcast simulation. The broadcast simulator module requires access to the channel, transmission, and vehicle mobility models in order to setup and keep track of the simulated broadcasts for measuring statistics from each broadcast and correlated receptions. For the first step of simulating the broadcast, the PHY parameters are set based on the current node’s transmission parameters. Vehicle positions are updated to match the time of the current node’s transmission based on the mobility model. Next the transmission matrix is accessed to determine other transmissions currently taking place for users within the interference range of the current node. The broadcast simulator activates the transmission to the various vehicles present in the model. Finally, success and delay statistics are measured and stored for comparison of each broadcast.
4.2.7. Model verification
Another important aspect of simulating besides accurately measuring the result is that of simulating the results under more realistic scenarios that may not be as accessible from a purely analytical approach. Our simulation is first verified to behave correctly under all the same assumptions as analytic, and related to the analytical results in the next section. Afterwards, more realistic conditions are applied to the simulation for more accurately representing real world results. For example, we can assume more users in simulation because the analytical probability functions rely on combinatorics and factorials that have a limited amount of precision when working large numbers. For improving understanding of our simulator, we have separated it into important elements that can make up the entire process of simulating DSRC in a vehicular environment.
As seen in Figure 21, these elements include: the simulator as a whole representing the starting point at which a user interacts; the broadcast simulator which controls the broadcasts of the users based on the transmission model defined by the MAC protocols used; vehicle model for
To MAC RX
PHY RX
From MAC TX
PHY TX
Channel Model
OFDM Receiver OFDM Transmitter
Fading Noise Interference
modelling

35
representing the positions and velocities of all the vehicles; mobility model which define the movements and possible routes in which vehicles may travel; and the channel model which defines the BER and PER due to conditions present in the mobility model and transmission models together.
Figure 21 Broadcast simulation sequence diagram
Figure 22 Sequence diagram for computing success ratio for user broadcasts.
Also in Figure 22 we present an algorithm for calculating the ratio of success for each broadcast. We measure this success according to the transmission model, mobility model, and channel model. A node is eligible to be included as a potential receiver in this calculation if it is within the range of the broadcast message’s intended scope according to mobility and channel models, and the node is not attempting itself to transmit in that particular time. A node is designated as an eligible receiver if its PHY is in the state of reception, i.e. the node is not transmitting during the
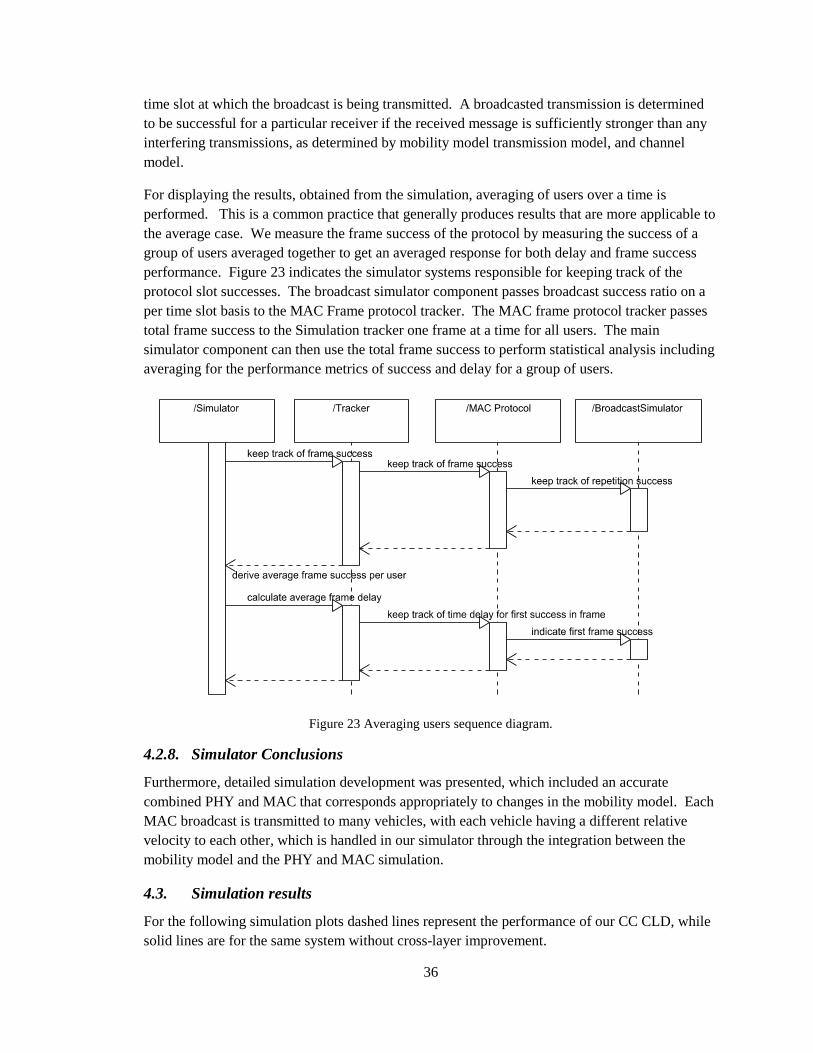
36
time slot at which the broadcast is being transmitted. A broadcasted transmission is determined to be successful for a particular receiver if the received message is sufficiently stronger than any interfering transmissions, as determined by mobility model transmission model, and channel model.
For displaying the results, obtained from the simulation, averaging of users over a time is performed. This is a common practice that generally produces results that are more applicable to the average case. We measure the frame success of the protocol by measuring the success of a group of users averaged together to get an averaged response for both delay and frame success performance. Figure 23 indicates the simulator systems responsible for keeping track of the protocol slot successes. The broadcast simulator component passes broadcast success ratio on a per time slot basis to the MAC Frame protocol tracker. The MAC frame protocol tracker passes total frame success to the Simulation tracker one frame at a time for all users. The main simulator component can then use the total frame success to perform statistical analysis including averaging for the performance metrics of success and delay for a group of users.
Figure 23 Averaging users sequence diagram.
4.2.8. Simulator Conclusions
Furthermore, detailed simulation development was presented, which included an accurate combined PHY and MAC that corresponds appropriately to changes in the mobility model. Each MAC broadcast is transmitted to many vehicles, with each vehicle having a different relative velocity to each other, which is handled in our simulator through the integration between the mobility model and the PHY and MAC simulation.
4.3. Simulation results
For the following simulation plots dashed lines represent the performance of our CC CLD, while solid lines are for the same system without cross-layer improvement.
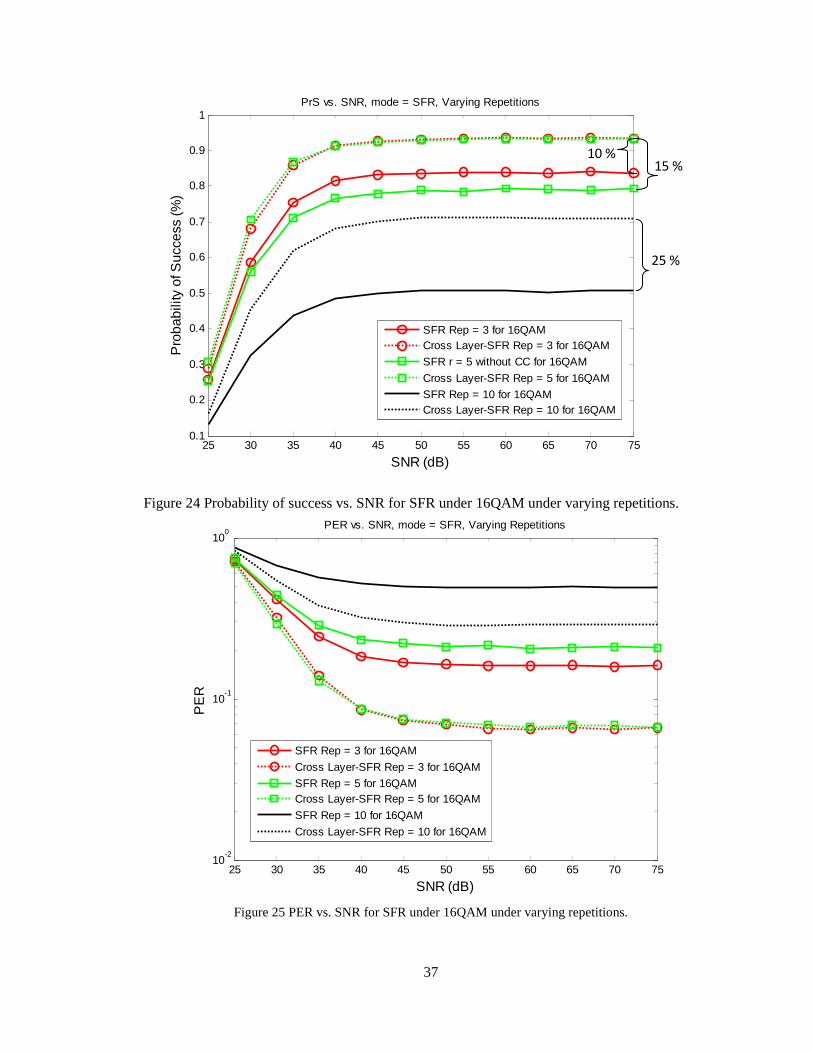
37
25 30 35 40 45 50 55 60 65 70 750.1
0.2
0.3
0.4
0.5
0.6
0.7
0.8
0.9
1PrS vs. SNR, mode = SFR, Varying Repetitions
SNR (dB)
Pro
babi
lity
of S
ucce
ss (%
)
SFR Rep = 3 for 16QAMCross Layer-SFR Rep = 3 for 16QAM
SFR r = 5 without CC for 16QAM
Cross Layer-SFR Rep = 5 for 16QAM
SFR Rep = 10 for 16QAMCross Layer-SFR Rep = 10 for 16QAM
10 % 15 %
25 %
Figure 24 Probability of success vs. SNR for SFR under 16QAM under varying repetitions.
Figure 25 PER vs. SNR for SFR under 16QAM under varying repetitions.
25 30 35 40 45 50 55 60 65 70 7510
-2
10-1
100
PER vs. SNR, mode = SFR, Varying Repetitions
SNR (dB)
PE
R
SFR Rep = 3 for 16QAM
Cross Layer-SFR Rep = 3 for 16QAM
SFR Rep = 5 for 16QAMCross Layer-SFR Rep = 5 for 16QAM
SFR Rep = 10 for 16QAM
Cross Layer-SFR Rep = 10 for 16QAM
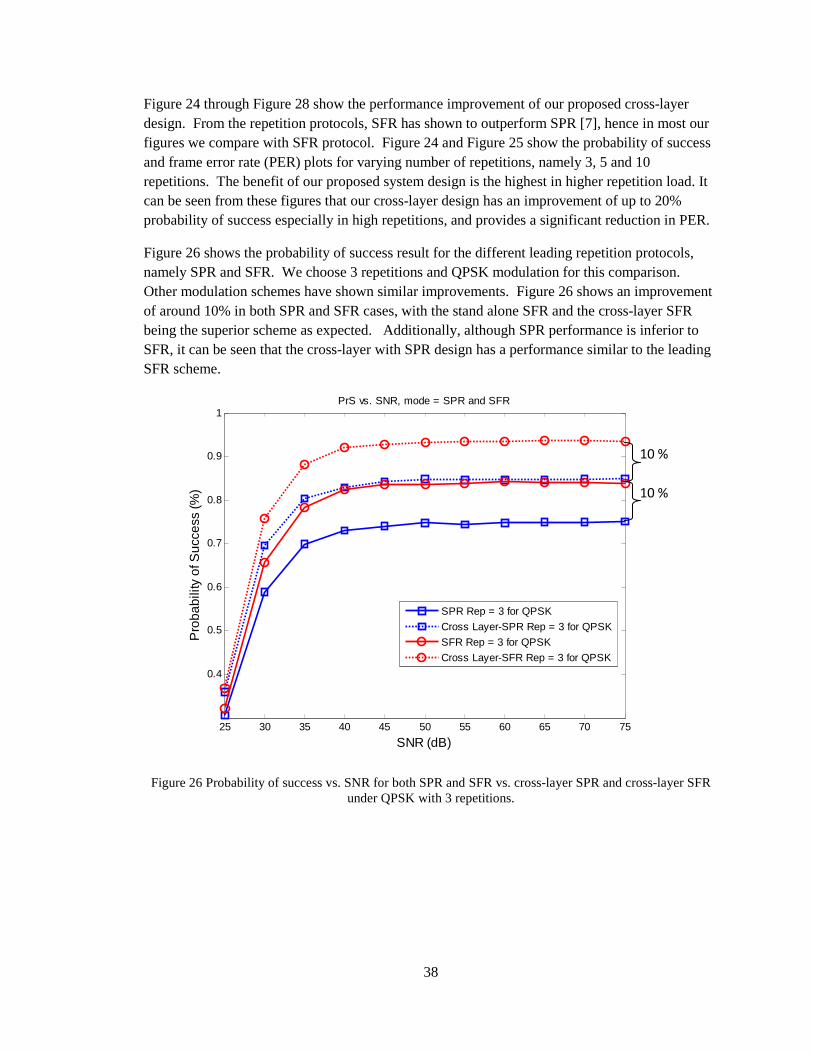
38
Figure 24 through Figure 28 show the performance improvement of our proposed cross-layer design. From the repetition protocols, SFR has shown to outperform SPR [7], hence in most our figures we compare with SFR protocol. Figure 24 and Figure 25 show the probability of success and frame error rate (PER) plots for varying number of repetitions, namely 3, 5 and 10 repetitions. The benefit of our proposed system design is the highest in higher repetition load. It can be seen from these figures that our cross-layer design has an improvement of up to 20% probability of success especially in high repetitions, and provides a significant reduction in PER.
Figure 26 shows the probability of success result for the different leading repetition protocols, namely SPR and SFR. We choose 3 repetitions and QPSK modulation for this comparison. Other modulation schemes have shown similar improvements. Figure 26 shows an improvement of around 10% in both SPR and SFR cases, with the stand alone SFR and the cross-layer SFR being the superior scheme as expected. Additionally, although SPR performance is inferior to SFR, it can be seen that the cross-layer with SPR design has a performance similar to the leading SFR scheme.
25 30 35 40 45 50 55 60 65 70 75
0.4
0.5
0.6
0.7
0.8
0.9
1PrS vs. SNR, mode = SPR and SFR
SNR (dB)
Pro
babi
lity
of S
ucce
ss (%
)
SPR Rep = 3 for QPSK
Cross Layer-SPR Rep = 3 for QPSK
SFR Rep = 3 for QPSK
Cross Layer-SFR Rep = 3 for QPSK
10 %
10 %
Figure 26 Probability of success vs. SNR for both SPR and SFR vs. cross-layer SPR and cross-layer SFR under QPSK with 3 repetitions.

39
25 30 35 40 45 500.2
0.3
0.4
0.5
0.6
0.7
0.8
PrS vs. SNR, mode = SFR, r = 7, Varying Modulation Schemes
SNR (dB)
Pro
babi
lity
of S
ucce
ss (
%)
SFR r = 7 without CC for BPSKSFR r = 7 with CC for BPSK
SFR r = 7 without CC for QPSK
SFR r = 7 with CC for QPSK
SFR r = 7 without CC for QAM16SFR r = 7 with CC for QAM16
20 %
Figure 27 Probability of success vs. SNR for SFR vs. cross-layer SFR under various modulations, 7 repetitions.
Figure 27 shows the probability of success under BPSK, QPSK and 16QAM under 7 repetitions, showing between 3 and 20% improvement at low SNRs, and consistently 20% improvement at higher SNRs.
Figure 28 and shows the probability of success for varying modulation schemes, namely BPSK, QPSK and 16QAM, and 10 repetitions.
Higher repetition counts showed similar results with up to a 10% improvement for CC corrected systems over non-CC corrected with 15 repetitions, indicating good performance even at very high load.
The benefit of our proposed system design is again evident in higher repetition scenarios with nominal 20% probability of success improvement. Additionally, a significant reduction in PER is observed. Noticeably, the improvement is also very high for BPSK modulation even at low SNR values; hence we can conclude that our proposed system not only improves performance at high repetition load scenarios, but also in noisy channels.

40
25 30 35 40 45 50 55 600.1
0.2
0.3
0.4
0.5
0.6
0.7
0.8PrS vs. SNR, mode = SFR, Varying Modulation Schemes
SNR (dB)
Pro
babi
lity
of S
ucce
ss (%
)
BPSK SFR Rep = 10BPSK Cross Layer-SFR Rep = 10
QPSK SFR Rep = 10
QPSK Cross Layer-SFR Rep = 10
16QAM SFR Rep = 1016QAM Cross Layer-SFR Rep = 10
20 %
Figure 28 Probability of success vs. SNR for SFR vs. cross-layer SFR with varying modulations, 10 repetitions.
4.4. Summary of CLD proposal and simulation
In this chapter I provided a description of the work that was done for designing a modification to the MAC and PHY layers for reducing the effect of collision through cross-layer collision correction. This included simulation design.

41
Chapter 5 CONCLUSION
This chapter provides a conclusion, summarizing what this thesis provided, basically to serve as an overview with specific details included.
5.1. Concluding statements
This thesis provided a literature review on aspects of DSRC that is related to the designs shown. A philosophy of approach was provided showing some of the steps that were important towards research and development of vehicular communication technologies. A description of work was provided describing the proposed communication system design, related simulator design, and subsequent simulation results. The simulation results were analysed to show in what scenarios the proposed vehicular communication design is beneficial. Future work is discussed briefly to illustrate some things that can be done to further this research.
5.1.1. Literature review conclusions
The literature review chapter provides a review of literature related to the 802.11p standard MAC and PHY layers. The message processing methods used by the conventional DSRC receiver for wireless access in vehicular environments is covered. Repetition protocols although increase probability of success and decrease average delay of message reception, but at the expense of increased network traffic.
5.1.2. Philosophy of approach conclusions
The philosophy of approach chapter demonstrated some of the methods that were used in conducting the research that lead up what is presented in this thesis. These included successfully researching about how DSRC and vehicular communication works at a fundamental level. Recognizing what is important for safety application in vehicular communications to be high probability of successful frame reception and low latency had a significant impact on the research. The choices of what problem to try solving, and how to solve it was not at first apparent, but through investigation of other works, CLD investigation, and understanding of research being done by peers, a logical path for investigation was chosen. It was found that although repetition broadcasting is proposed to improve probability of success and reduce latency for the general scenario, at times when there are a large number of users or high repetition count that this results in very high network traffic. This finding resulted in a scenario analysis for which the investigation of how collisions could be corrected was undertaken. Analytical analyses of scenarios were performed, followed by formal development of a method for correcting packet collisions. A simulator was developed to plot performance of proposed system vs. conventional DSRC.
5.1.3. Description of work conclusions
The conventional message processing methods are important because they are extended for the proposed design by using past stored versions of PHY frames and comparing them to incoming frames when appropriate. Using repetition protocols is an important part of the correction because previous information should be known in order to correct unknown frame information

42
from a collision. The proposed design takes this into account using a warning based MAC repetition protocol. It is beneficial if the order and slot position of transmission is also known, through packet headers because with this information the messages can be reconstructed easier. The reconstruction of two collisions was shown to be feasible using this system using a CRF in the PHY, using information from the MRH in the MAC.
5.1.4. Results conclusions
The proposed system design performance results in probability of success improvement normally around 10 to 20% when compared to conventional DSRC. This occurs when the number of vehicles of the number of repetitions relative to total time slots in the MAC frame is high.
Future work includes investigation of correcting more than two collisions, larger and accelerated simulation, FPGA implementation, prototyping, and possibly proposed amendment for consideration as part of the DSRC standard.
5.2. Final thoughts
Through this investigation, it is concluded that reliability of communication of safety messages can be improved by employing CLD collision correction. Additionally the designed simulation environment can assist with development of communication technologies that deal with mobile networks.
43
REFERENCES
[1] IEEE 802.11 Working Group of the IEEE 802 Committee. Draft Standard for Information Technology :Telecommunications and Information Exchange between Systems -- Local and Metropolitan Area Networks -- Specific Requirements 2010.
[2] N. Jaber, K. A. Rahman, E. Abdel-Raheem and K. E. Tepe. A quantitative analysis of improved DSRC system using repetition based broadcast safety messaging with hidden terminals. Presented at Wireless Communications and Mobile Computing Conference (IWCMC), 2011 7th International. 2011.
[3] D. Katabi and S. Gollakota. ZigZag decoding: Combating hidden terminals in wireless networks. ACM 38pp. 159-170. 2008.
[4] C. Qin, N. Santhapuri, S. Sen and S. Nelakuditi. Known interference cancellation: Resolving collisions due to repeated transmissions. Presented at Wireless Mesh Networks (WIMESH 2010), 2010 Fifth IEEE Workshop On. 2010.
[5] S. Zhang, S. Liew and H. Wang. Blind known interference cancellation. 2011.
[6] V. Srivastava and M. Motani. Cross-layer design: A survey and the road ahead. Communications Magazine, IEEE 43(12), pp. 112-119. 2005.
[7] Q. Xu, T. Mak, J. Ko and R. Sengupta. Medium access control protocol design for vehicle–vehicle safety messages. Vehicular Technology, IEEE Transactions On 56(2), pp. 499-518. 2007.
[8] F. Farnoud and S. Valaee. Reliable broadcast of safety messages in vehicular ad hoc networks. Presented at INFOCOM 2009, IEEE. 2009.
[9] Y. J. Li. "An overview of the DSRC/WAVE technology," in Quality, Reliability, Security and Robustness in Heterogeneous Networks, 2012.
[10] Q. Chen, D. Jiang and L. Delgrossi. IEEE 1609.4 DSRC multi-channel operations and its implications on vehicle safety communications. Presented at Vehicular Networking Conference (VNC), 2009 IEEE. 2009.
[11] Anonymous IEEE standard for information technology--telecommunications and information exchange between systems local and metropolitan area networks--specific requirements part 11: Wireless LAN medium access control (MAC) and physical layer (PHY) specifications. IEEE Std 802. 11-2012 (Revision of IEEE Std 802. 11-2007) pp. 1-2793. 2012.
44
[12] D. Jiang and L. Delgrossi. IEEE 802.11 p: Towards an international standard for wireless access in vehicular environments. Presented at Vehicular Technology Conference, 2008. VTC Spring 2008. IEEE. 2008.
[13] CAMP Vehicle Safety Communications Consortium. Vehicle safety communications project: Task 3 final report: Identify intelligent vehicle safety applications enabled by DSRC. National Highway Traffic Safety Administration, US Department of Transportation, Washington DC 2005.
[14] J. A. Stine. Cross-layer design of manets: The only option. Presented at Military Communications Conference, 2006. MILCOM 2006. IEEE. 2006.
[15] T. Kemal E. Cross-layer design in wireless AD HOC and sensor networks. Sigma 28pp. 66-73. 2010.
[16] M. Tarique and K. E. Tepe. New hierarchical approach to reactive routing protocols for wireless ad hoc networks with cross-layer design. International Journal of Ad Hoc and Ubiquitous Computing 2(1), pp. 12-20. 2007.
[17] IEEE 802.11 Working Group. IEEE standard for information technology-telecommunications and information exchange between systems-local and metropolitan area networks-specific requirements part 11: Wireless LAN medium access control (MAC) and physical layer (PHY) specifications. IEEE Std 802.11-2007 (Revision of IEEE Std 802.11-1999) pp. C1. 2009.
[18] D. W. Allan, N. Ashby and C. C. Hodge. The Science of Timekeeping 1997.
[19] N. Jaber, K. E. Tepe and E. Abdel-Raheem. Reconfigurable simulator using graphical user interface (GUI) and object-oriented design for OFDM systems. Simulation Modelling Practice and Theory 19(5), pp. 1294-1317. 2011.
[20] H. Abdulhamid, E. Abdel-Raheem and K. Tepe. Channel estimation for 5.9 GHz dedicated shortrange communications receiver in wireless access vehicular environments. Communications, IET 1(6), pp. 1274-1279. 2007.
[21] N. Jaber, K. E. Tepe and E. Abdel-Raheem. Performance enhancement of the DSRC system using frequency-domain equalization for 5.9 GHz DSRC applications. AEU-International Journal of Electronics and Communications 65(11), pp. 924-928. 2011.
[22] N. Jaber, Towards More Reliable MAC and PHY Layer Designs for high QoS Achievements of Safety Messaging in DSRC Systems, PhD Thesis, University of Windsor, 2012.
[23] J. Harri, F. Filali and C. Bonnet. Mobility models for vehicular ad hoc networks: A survey and taxonomy. Communications Surveys & Tutorials, IEEE 11(4), pp. 19-41. 2009.

45
[24] W. G. Cassidy, N. Jaber, S. A. Ruppert, J. Toimoor, K. E. Tepe and E. Abdel-Raheem. Interference modelling and SNR threshold study for use in vehicular safety messaging simulation. Presented at Communications (QBSC), 2012 26th Biennial Symposium On. 2012.
[25] G. Yeung, M. Takai, R. Bagrodia, A. Mehrnia and B. Daneshrad. Detailed OFDM modeling in network simulation of mobile ad hoc networks. Presented at Proceedings of the Eighteenth Workshop on Parallel and Distributed Simulation. 2004.
[26] G. Yeung, M. Takai and R. Bagrodia. Effects of detailed OFDM modeling in network simulation. Simulation 81(4), pp. 241-253. 2005.
[27] L. Zhang, Y. Cheng and X. Zhou. Rate avalanche: Effects on the performance of multi-rate 802.11 wireless networks. Simulation Modelling Practice and Theory 17(3), pp. 487-503. 2009.
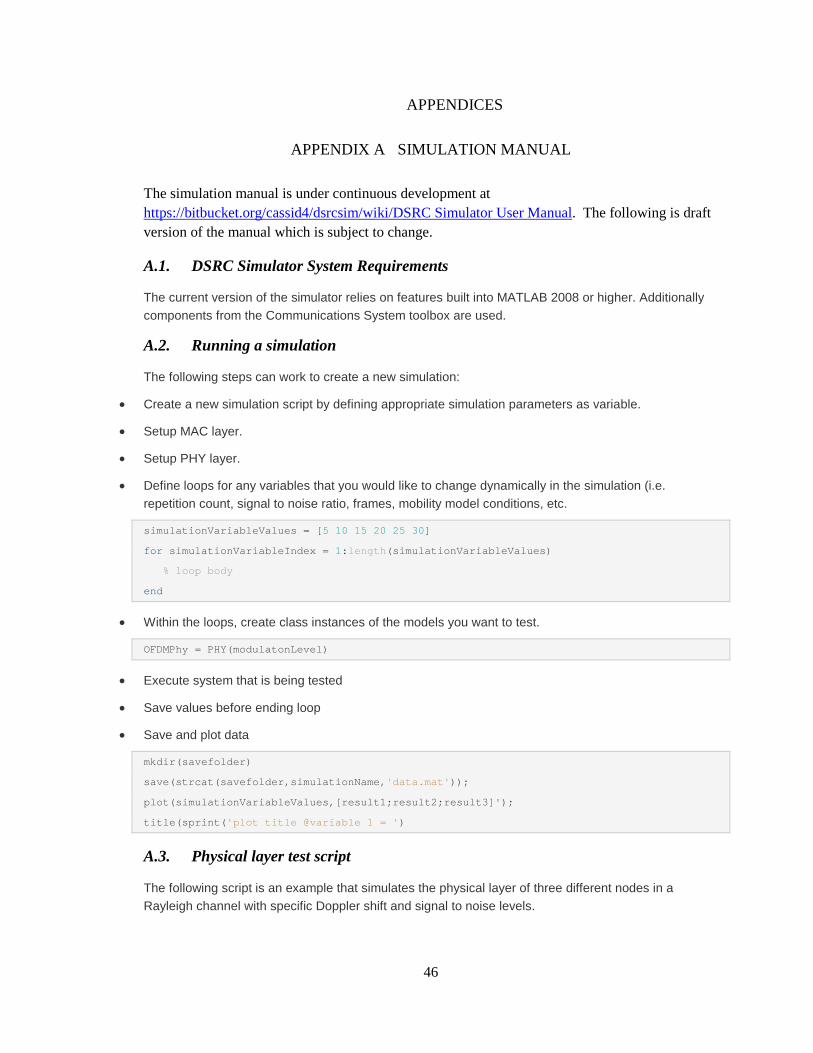
46
APPENDICES
APPENDIX A SIMULATION MANUAL
The simulation manual is under continuous development at https://bitbucket.org/cassid4/dsrcsim/wiki/DSRC Simulator User Manual. The following is draft version of the manual which is subject to change.
A.1. DSRC Simulator System Requirements
The current version of the simulator relies on features built into MATLAB 2008 or higher. Additionally components from the Communications System toolbox are used.
A.2. Running a simulation
The following steps can work to create a new simulation:
• Create a new simulation script by defining appropriate simulation parameters as variable.
• Setup MAC layer.
• Setup PHY layer.
• Define loops for any variables that you would like to change dynamically in the simulation (i.e. repetition count, signal to noise ratio, frames, mobility model conditions, etc.
simulationVariableValues = [ 5 10 15 20 25 30]
for simulationVariableIndex = 1: length (simulationVariableValues)
% loop body
end
• Within the loops, create class instances of the models you want to test.
OFDMPhy = PHY(modulatonLevel)
• Execute system that is being tested
• Save values before ending loop
• Save and plot data
mkdir(savefolder)
save(strcat(savefolder,simulationName, 'data.mat' ));
plot(simulationVariableValues,[result1;result2;resu lt3]');
title(sprint( 'plot title @variable 1 = ' )
A.3. Physical layer test script
The following script is an example that simulates the physical layer of three different nodes in a Rayleigh channel with specific Doppler shift and signal to noise levels.
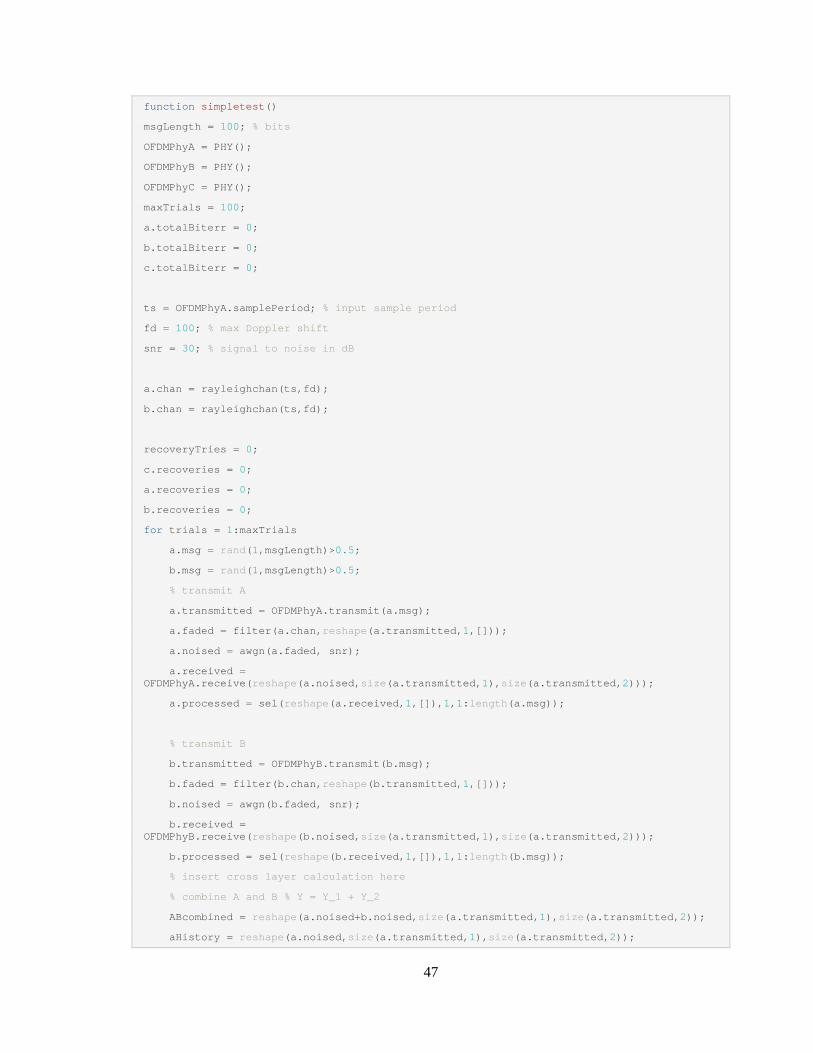
47
function simpletest ()
msgLength = 100 ; % bits
OFDMPhyA = PHY();
OFDMPhyB = PHY();
OFDMPhyC = PHY();
maxTrials = 100 ;
a.totalBiterr = 0;
b.totalBiterr = 0;
c.totalBiterr = 0;
ts = OFDMPhyA.samplePeriod; % input sample period
fd = 100 ; % max Doppler shift
snr = 30; % signal to noise in dB
a.chan = rayleighchan(ts,fd);
b.chan = rayleighchan(ts,fd);
recoveryTries = 0;
c.recoveries = 0;
a.recoveries = 0;
b.recoveries = 0;
for trials = 1:maxTrials
a.msg = rand ( 1,msgLength)> 0.5 ;
b.msg = rand ( 1,msgLength)> 0.5 ;
% transmit A
a.transmitted = OFDMPhyA.transmit(a.msg);
a.faded = filter(a.chan, reshape (a.transmitted, 1,[]));
a.noised = awgn(a.faded, snr);
a.received = OFDMPhyA.receive( reshape (a.noised, size (a.transmitted, 1), size (a.transmitted, 2)));
a.processed = sel( reshape (a.received, 1,[]), 1, 1: length (a.msg));
% transmit B
b.transmitted = OFDMPhyB.transmit(b.msg);
b.faded = filter(b.chan, reshape (b.transmitted, 1,[]));
b.noised = awgn(b.faded, snr);
b.received = OFDMPhyB.receive( reshape (b.noised, size (a.transmitted, 1), size (a.transmitted, 2)));
b.processed = sel( reshape (b.received, 1,[]), 1, 1: length (b.msg));
% insert cross layer calculation here
% combine A and B % Y = Y_1 + Y_2
ABcombined = reshape (a.noised+b.noised, size (a.transmitted, 1), size (a.transmitted, 2));
aHistory = reshape (a.noised, size (a.transmitted, 1), size (a.transmitted, 2));

48
c.received = OFDMPhyC.Xreceive(ABcombined,aHist ory);
c.processed = sel( reshape (c.received, 1,[]), 1, 1: length (b.msg));
a.biterr = biterr(a.msg+ 0,a.processed+ 0);
b.biterr = biterr(b.msg+ 0,b.processed+ 0);
if a.biterr == 0
a.recoveries = a.recoveries+ 1;
end
if b.biterr == 0
b.recoveries = b.recoveries+ 1;
end
% c.biterr = biterr(b.msg+0,c.processed+0);
c.biterr = 0; % initialize
if a.biterr == 0 % attempt to recover B from A+B
recoveryTries = recoveryTries+ 1;
c.biterr = biterr(b.msg+ 0,c.processed+ 0);
if c.biterr== 0
c.recoveries = c.recoveries + 1;
end
else
c.biterr = 0;
end
a.totalBiterr = a.totalBiterr+a.biterr;
b.totalBiterr = b.totalBiterr+b.biterr;
c.totalBiterr = c.totalBiterr+c.biterr;
end
a.averageBiterr = a.totalBiterr/maxTrials;
b.averageBiterr = b.totalBiterr/maxTrials;
c.averageBiterr = c.totalBiterr/recoveryTries;
%
display( '----------- ---------- ----------- ---------- ---- ------- ----------' );
display(sprintf( 'The average number of errors for vehicle A was %d, and the number of errors for B was %d' , round (a.averageBiterr), round (b.averageBiterr)))
display(sprintf( 'Successful A and B packets when not collided is %d and %d' , a.recoveries, b.recoveries));
display(sprintf( 'Node C attempted to correct node B''s transmission s from collided node A, with average number of errors of %d' , round (c.averageBiterr)));
display(sprintf( 'Successful full recoveries from collided packets i s %d' ,c.recoveries));
display( '----------- ---------- ----------- ---------- ---- ------- ----------' );
%
end
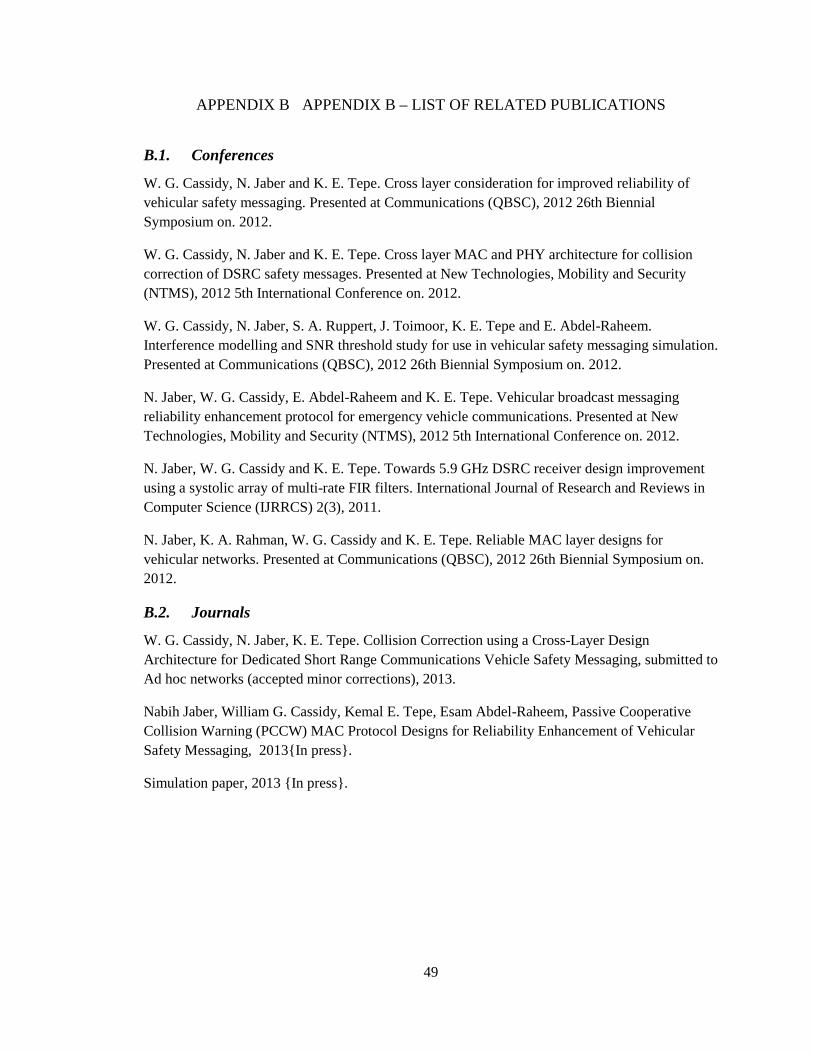
49
APPENDIX B APPENDIX B – LIST OF RELATED PUBLICATIONS
B.1. Conferences
W. G. Cassidy, N. Jaber and K. E. Tepe. Cross layer consideration for improved reliability of vehicular safety messaging. Presented at Communications (QBSC), 2012 26th Biennial Symposium on. 2012.
W. G. Cassidy, N. Jaber and K. E. Tepe. Cross layer MAC and PHY architecture for collision correction of DSRC safety messages. Presented at New Technologies, Mobility and Security (NTMS), 2012 5th International Conference on. 2012.
W. G. Cassidy, N. Jaber, S. A. Ruppert, J. Toimoor, K. E. Tepe and E. Abdel-Raheem. Interference modelling and SNR threshold study for use in vehicular safety messaging simulation. Presented at Communications (QBSC), 2012 26th Biennial Symposium on. 2012.
N. Jaber, W. G. Cassidy, E. Abdel-Raheem and K. E. Tepe. Vehicular broadcast messaging reliability enhancement protocol for emergency vehicle communications. Presented at New Technologies, Mobility and Security (NTMS), 2012 5th International Conference on. 2012.
N. Jaber, W. G. Cassidy and K. E. Tepe. Towards 5.9 GHz DSRC receiver design improvement using a systolic array of multi-rate FIR filters. International Journal of Research and Reviews in Computer Science (IJRRCS) 2(3), 2011.
N. Jaber, K. A. Rahman, W. G. Cassidy and K. E. Tepe. Reliable MAC layer designs for vehicular networks. Presented at Communications (QBSC), 2012 26th Biennial Symposium on. 2012.
B.2. Journals
W. G. Cassidy, N. Jaber, K. E. Tepe. Collision Correction using a Cross-Layer Design Architecture for Dedicated Short Range Communications Vehicle Safety Messaging, submitted to Ad hoc networks (accepted minor corrections), 2013.
Nabih Jaber, William G. Cassidy, Kemal E. Tepe, Esam Abdel-Raheem, Passive Cooperative Collision Warning (PCCW) MAC Protocol Designs for Reliability Enhancement of Vehicular Safety Messaging, 2013{In press}.
Simulation paper, 2013 {In press}.

50
VITA AUCTORIS
NAME: William G. Cassidy
PLACE OF BIRTH:
Oakville, ON
YEAR OF BIRTH:
1983
EDUCATION:
Owen Sound Collegiate and Vocational Institute, Owen Sound, ON, 1999-2001
Centre Wellington District High School, Fergus, ON, 2001-2002
University of Windsor, B.A.Sc., Windsor, ON, 2002-2007
University of Windsor, BCS, Windsor, ON, 2006-2008
University of Windsor, M.Eng., Windsor, ON, 2009-2010
University of Windsor, M.A.Sc., Windsor, ON, 2011-2013